Old Town, ME Map & Demographics
Old Town Map
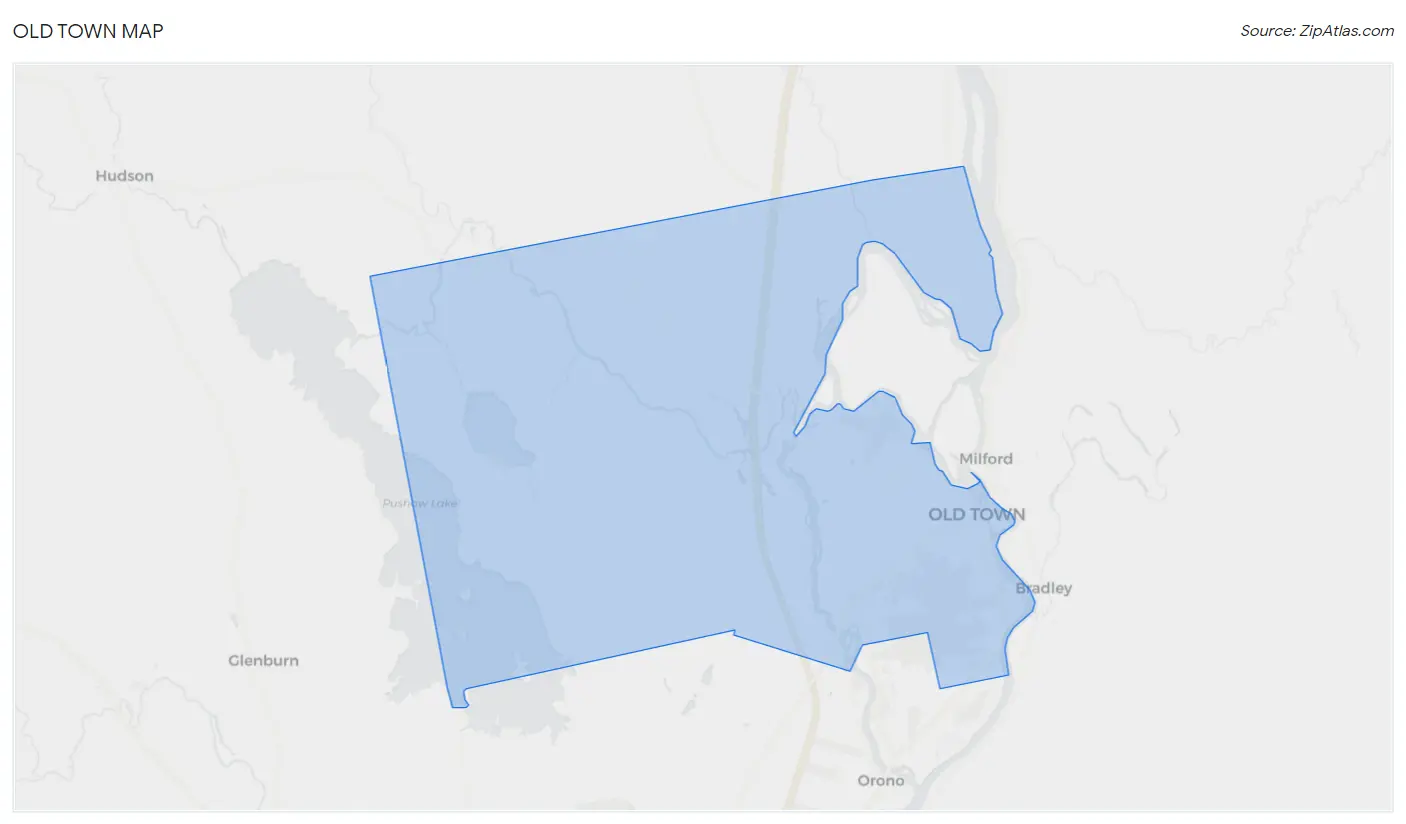
Old Town Overview
$30,584
PER CAPITA INCOME
$75,556
AVG FAMILY INCOME
$46,343
AVG HOUSEHOLD INCOME
16.5%
WAGE / INCOME GAP [ % ]
83.5¢/ $1
WAGE / INCOME GAP [ $ ]
$10,621
FAMILY INCOME DEFICIT
0.46
INEQUALITY / GINI INDEX
7,458
TOTAL POPULATION
3,670
MALE POPULATION
3,788
FEMALE POPULATION
96.88
MALES / 100 FEMALES
103.22
FEMALES / 100 MALES
37.0
MEDIAN AGE
2.9
AVG FAMILY SIZE
2.4
AVG HOUSEHOLD SIZE
3,922
LABOR FORCE [ PEOPLE ]
61.8%
PERCENT IN LABOR FORCE
2.4%
UNEMPLOYMENT RATE
Old Town Zip Codes
Old Town Area Codes
Income in Old Town
Income Overview in Old Town
Per Capita Income in Old Town is $30,584, while median incomes of families and households are $75,556 and $46,343 respectively.
| Characteristic | Number | Measure |
| Per Capita Income | 7,458 | $30,584 |
| Median Family Income | 1,638 | $75,556 |
| Mean Family Income | 1,638 | $93,737 |
| Median Household Income | 3,145 | $46,343 |
| Mean Household Income | 3,145 | $70,272 |
| Income Deficit | 1,638 | $10,621 |
| Wage / Income Gap (%) | 7,458 | 16.52% |
| Wage / Income Gap ($) | 7,458 | 83.48¢ per $1 |
| Gini / Inequality Index | 7,458 | 0.46 |
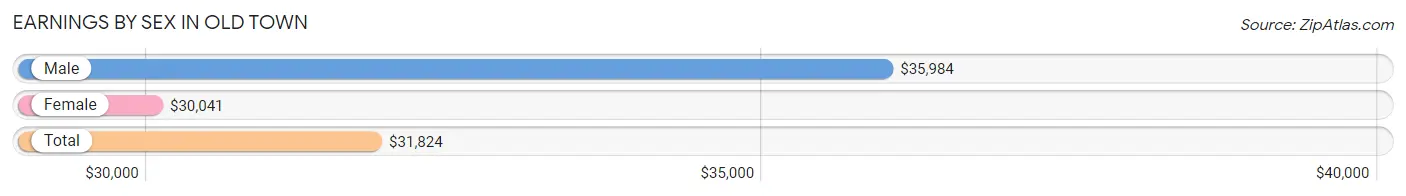
Earnings by Sex in Old Town
Average Earnings in Old Town are $31,824, $35,984 for men and $30,041 for women, a difference of 16.5%.
| Sex | Number | Average Earnings |
| Male | 2,092 (50.6%) | $35,984 |
| Female | 2,038 (49.3%) | $30,041 |
| Total | 4,130 (100.0%) | $31,824 |
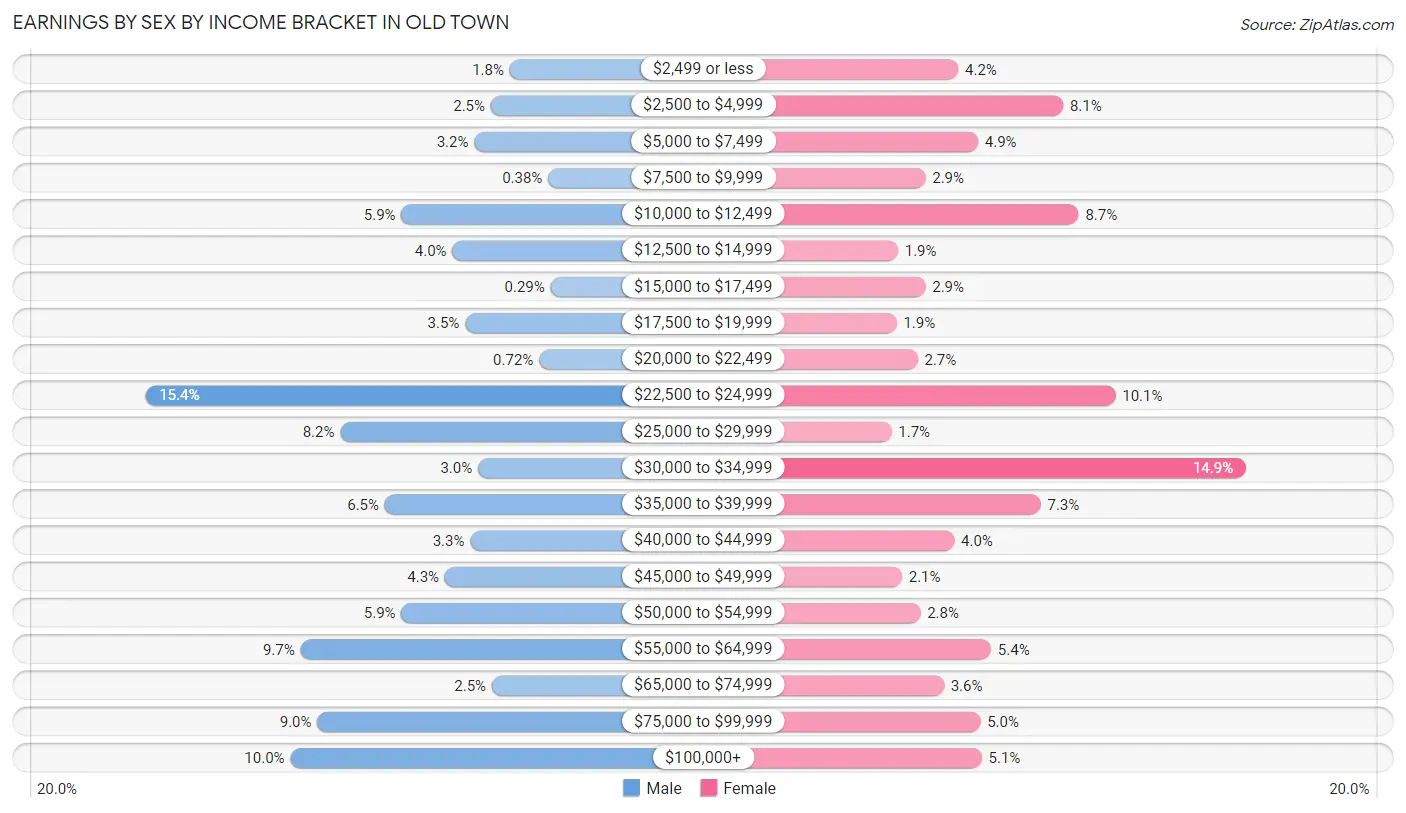
Earnings by Sex by Income Bracket in Old Town
The most common earnings brackets in Old Town are $22,500 to $24,999 for men (323 | 15.4%) and $30,000 to $34,999 for women (304 | 14.9%).
| Income | Male | Female |
| $2,499 or less | 38 (1.8%) | 85 (4.2%) |
| $2,500 to $4,999 | 53 (2.5%) | 165 (8.1%) |
| $5,000 to $7,499 | 66 (3.2%) | 100 (4.9%) |
| $7,500 to $9,999 | 8 (0.4%) | 60 (2.9%) |
| $10,000 to $12,499 | 123 (5.9%) | 177 (8.7%) |
| $12,500 to $14,999 | 83 (4.0%) | 39 (1.9%) |
| $15,000 to $17,499 | 6 (0.3%) | 60 (2.9%) |
| $17,500 to $19,999 | 73 (3.5%) | 38 (1.9%) |
| $20,000 to $22,499 | 15 (0.7%) | 54 (2.6%) |
| $22,500 to $24,999 | 323 (15.4%) | 205 (10.1%) |
| $25,000 to $29,999 | 171 (8.2%) | 34 (1.7%) |
| $30,000 to $34,999 | 63 (3.0%) | 304 (14.9%) |
| $35,000 to $39,999 | 136 (6.5%) | 148 (7.3%) |
| $40,000 to $44,999 | 69 (3.3%) | 82 (4.0%) |
| $45,000 to $49,999 | 89 (4.3%) | 42 (2.1%) |
| $50,000 to $54,999 | 123 (5.9%) | 56 (2.8%) |
| $55,000 to $64,999 | 202 (9.7%) | 110 (5.4%) |
| $65,000 to $74,999 | 52 (2.5%) | 74 (3.6%) |
| $75,000 to $99,999 | 189 (9.0%) | 102 (5.0%) |
| $100,000+ | 210 (10.0%) | 103 (5.1%) |
| Total | 2,092 (100.0%) | 2,038 (100.0%) |
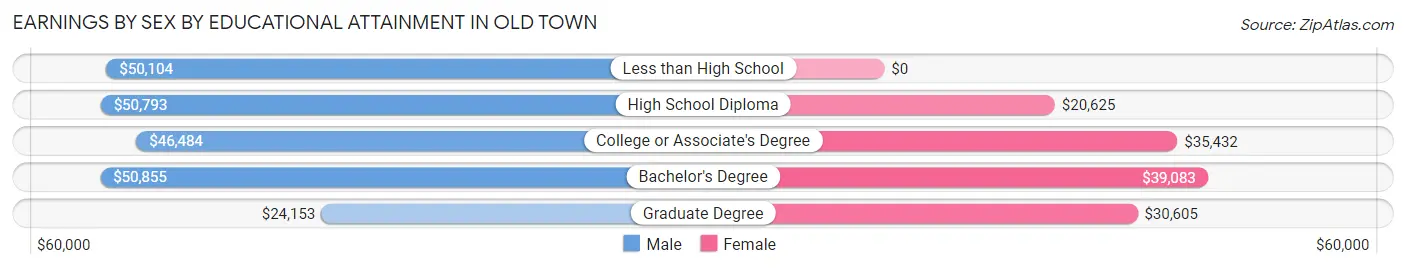
Earnings by Sex by Educational Attainment in Old Town
Average earnings in Old Town are $39,583 for men and $33,132 for women, a difference of 16.3%. Men with an educational attainment of bachelor's degree enjoy the highest average annual earnings of $50,855, while those with graduate degree education earn the least with $24,153. Women with an educational attainment of bachelor's degree earn the most with the average annual earnings of $39,083, while those with high school diploma education have the smallest earnings of $20,625.
| Educational Attainment | Male Income | Female Income |
| Less than High School | $50,104 | $0 |
| High School Diploma | $50,793 | $20,625 |
| College or Associate's Degree | $46,484 | $35,432 |
| Bachelor's Degree | $50,855 | $39,083 |
| Graduate Degree | $24,153 | $30,605 |
| Total | $39,583 | $33,132 |
Family Income in Old Town
Family Income Brackets in Old Town
According to the Old Town family income data, there are 311 families falling into the $75,000 to $99,999 income range, which is the most common income bracket and makes up 19.0% of all families. Conversely, the $10,000 to $14,999 income bracket is the least frequent group with only 38 families (2.3%) belonging to this category.
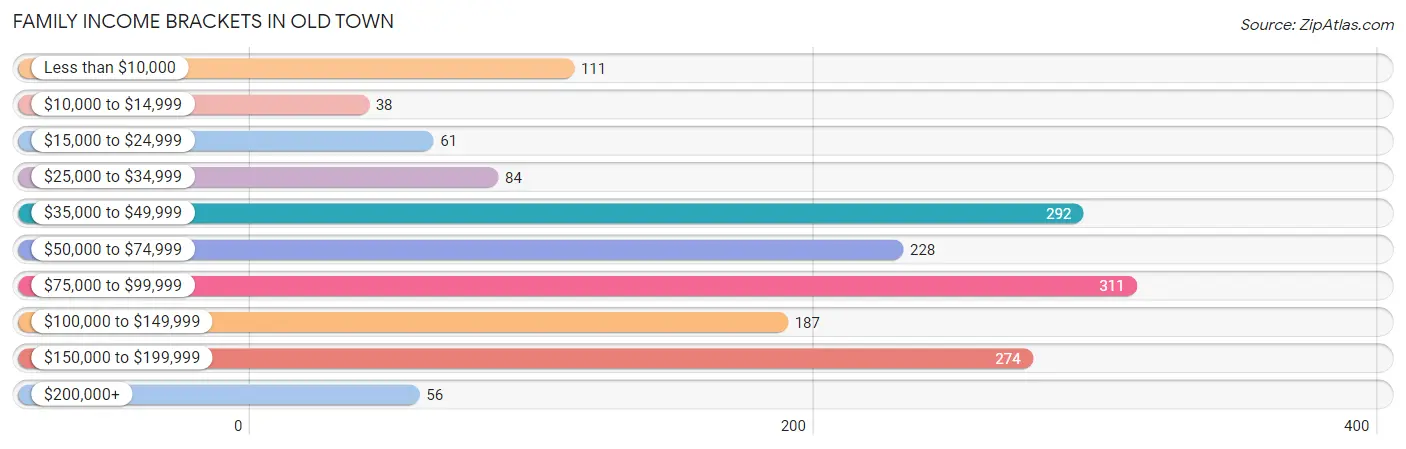
| Income Bracket | # Families | % Families |
| Less than $10,000 | 111 | 6.8% |
| $10,000 to $14,999 | 38 | 2.3% |
| $15,000 to $24,999 | 61 | 3.7% |
| $25,000 to $34,999 | 84 | 5.1% |
| $35,000 to $49,999 | 292 | 17.8% |
| $50,000 to $74,999 | 228 | 13.9% |
| $75,000 to $99,999 | 311 | 19.0% |
| $100,000 to $149,999 | 187 | 11.4% |
| $150,000 to $199,999 | 274 | 16.7% |
| $200,000+ | 56 | 3.4% |
Family Income by Famaliy Size in Old Town
4-person families (321 | 19.6%) account for the highest median family income in Old Town with $98,517 per family, while 2-person families (824 | 50.3%) have the highest median income of $33,466 per family member.
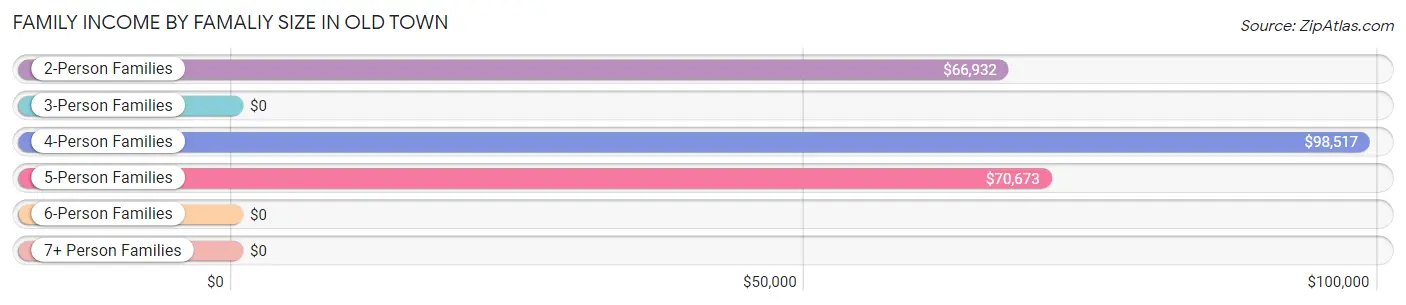
| Income Bracket | # Families | Median Income |
| 2-Person Families | 824 (50.3%) | $66,932 |
| 3-Person Families | 380 (23.2%) | $0 |
| 4-Person Families | 321 (19.6%) | $98,517 |
| 5-Person Families | 35 (2.1%) | $70,673 |
| 6-Person Families | 44 (2.7%) | $0 |
| 7+ Person Families | 34 (2.1%) | $0 |
| Total | 1,638 (100.0%) | $75,556 |
Family Income by Number of Earners in Old Town
The median family income in Old Town is $75,556, with families comprising 3+ earners (140) having the highest median family income of $195,500, while families with no earners (310) have the lowest median family income of $36,691, accounting for 8.6% and 18.9% of families, respectively.
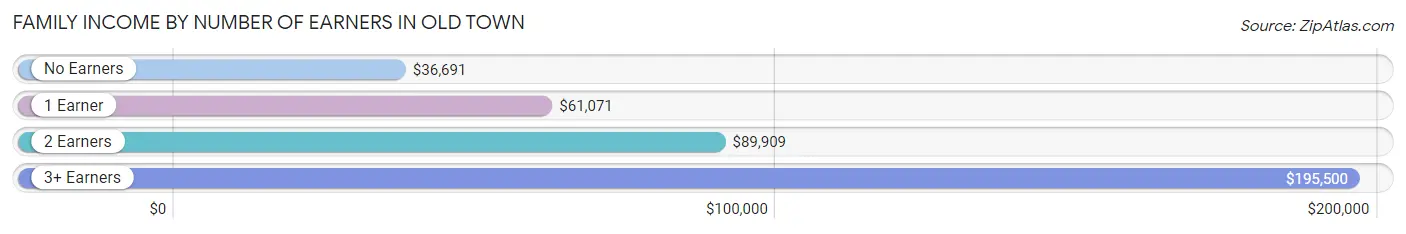
| Number of Earners | # Families | Median Income |
| No Earners | 310 (18.9%) | $36,691 |
| 1 Earner | 356 (21.7%) | $61,071 |
| 2 Earners | 832 (50.8%) | $89,909 |
| 3+ Earners | 140 (8.6%) | $195,500 |
| Total | 1,638 (100.0%) | $75,556 |
Household Income in Old Town
Household Income Brackets in Old Town
With 560 households falling in the category, the $35,000 to $49,999 income range is the most frequent in Old Town, accounting for 17.8% of all households. In contrast, only 57 households (1.8%) fall into the $200,000+ income bracket, making it the least populous group.
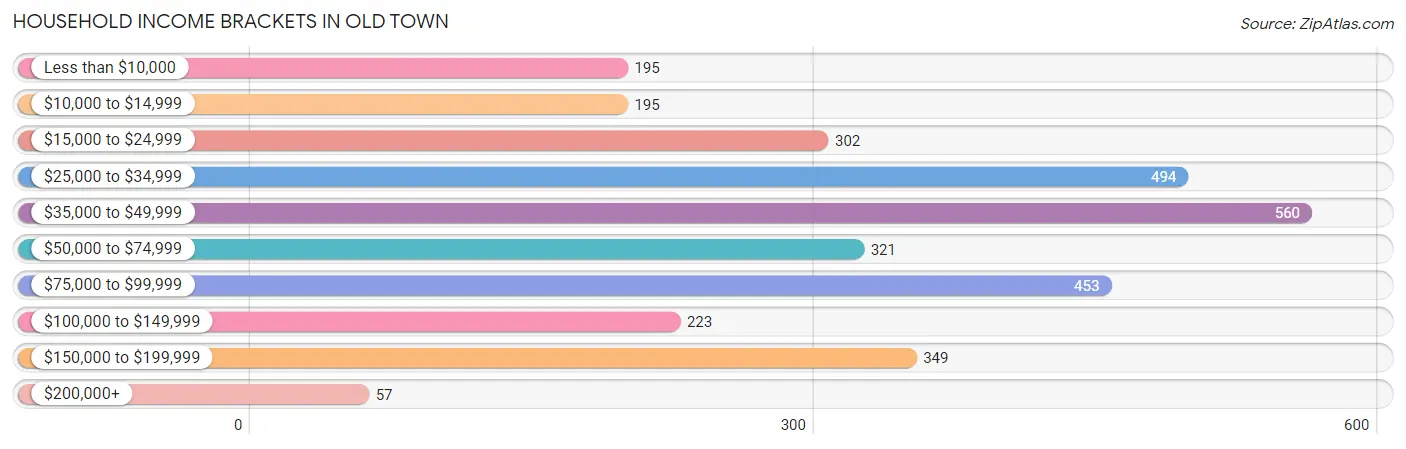
| Income Bracket | # Households | % Households |
| Less than $10,000 | 195 | 6.2% |
| $10,000 to $14,999 | 195 | 6.2% |
| $15,000 to $24,999 | 302 | 9.6% |
| $25,000 to $34,999 | 494 | 15.7% |
| $35,000 to $49,999 | 560 | 17.8% |
| $50,000 to $74,999 | 321 | 10.2% |
| $75,000 to $99,999 | 453 | 14.4% |
| $100,000 to $149,999 | 223 | 7.1% |
| $150,000 to $199,999 | 349 | 11.1% |
| $200,000+ | 57 | 1.8% |
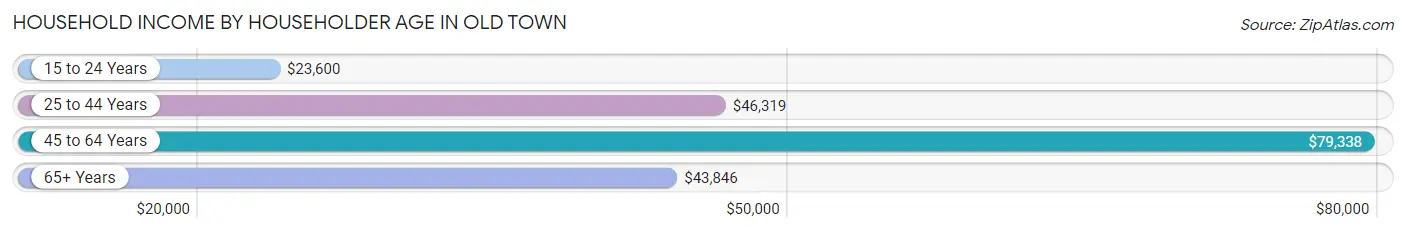
Household Income by Householder Age in Old Town
The median household income in Old Town is $46,343, with the highest median household income of $79,338 found in the 45 to 64 years age bracket for the primary householder. A total of 935 households (29.7%) fall into this category. Meanwhile, the 15 to 24 years age bracket for the primary householder has the lowest median household income of $23,600, with 204 households (6.5%) in this group.
| Income Bracket | # Households | Median Income |
| 15 to 24 Years | 204 (6.5%) | $23,600 |
| 25 to 44 Years | 1,228 (39.1%) | $46,319 |
| 45 to 64 Years | 935 (29.7%) | $79,338 |
| 65+ Years | 778 (24.7%) | $43,846 |
| Total | 3,145 (100.0%) | $46,343 |
Poverty in Old Town
Income Below Poverty by Sex and Age in Old Town
With 21.1% poverty level for males and 28.6% for females among the residents of Old Town, 18 to 24 year old males and 5 year old females are the most vulnerable to poverty, with 255 males (49.1%) and 30 females (73.2%) in their respective age groups living below the poverty level.
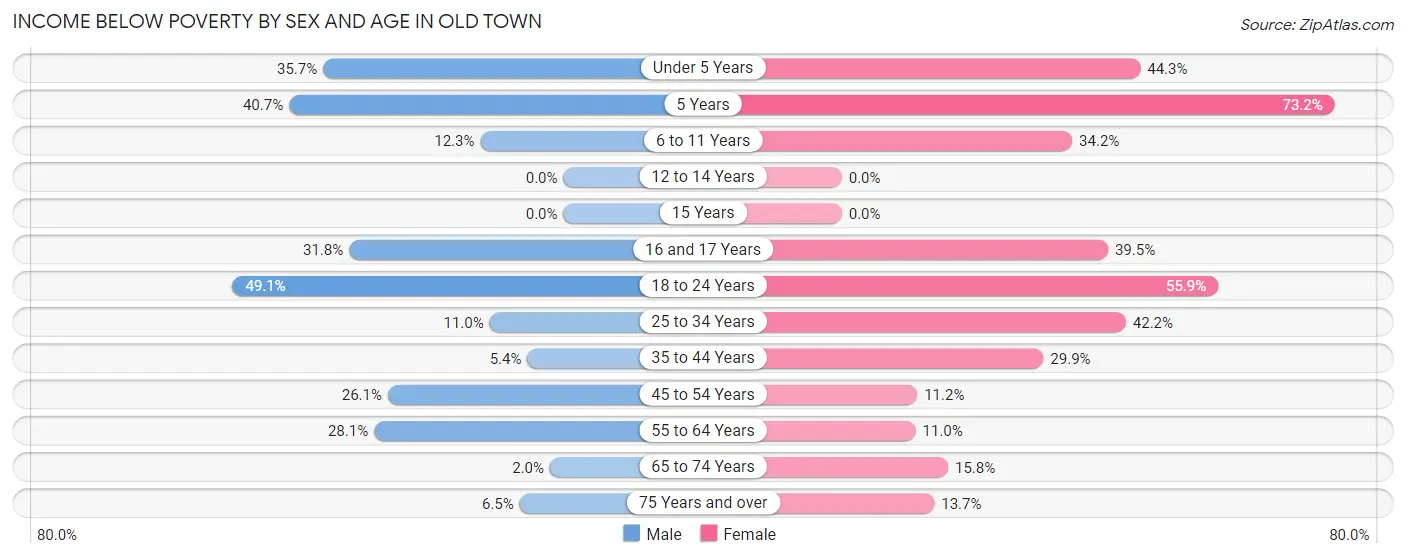
| Age Bracket | Male | Female |
| Under 5 Years | 76 (35.7%) | 86 (44.3%) |
| 5 Years | 11 (40.7%) | 30 (73.2%) |
| 6 to 11 Years | 18 (12.3%) | 78 (34.2%) |
| 12 to 14 Years | 0 (0.0%) | 0 (0.0%) |
| 15 Years | 0 (0.0%) | 0 (0.0%) |
| 16 and 17 Years | 42 (31.8%) | 34 (39.5%) |
| 18 to 24 Years | 255 (49.1%) | 205 (55.9%) |
| 25 to 34 Years | 56 (11.0%) | 221 (42.2%) |
| 35 to 44 Years | 29 (5.3%) | 215 (29.9%) |
| 45 to 54 Years | 104 (26.1%) | 41 (11.2%) |
| 55 to 64 Years | 162 (28.1%) | 39 (11.0%) |
| 65 to 74 Years | 8 (2.0%) | 65 (15.8%) |
| 75 Years and over | 8 (6.5%) | 43 (13.7%) |
| Total | 769 (21.1%) | 1,057 (28.6%) |
Income Above Poverty by Sex and Age in Old Town
According to the poverty statistics in Old Town, males aged 12 to 14 years and females aged 12 to 14 years are the age groups that are most secure financially, with 100.0% of males and 100.0% of females in these age groups living above the poverty line.
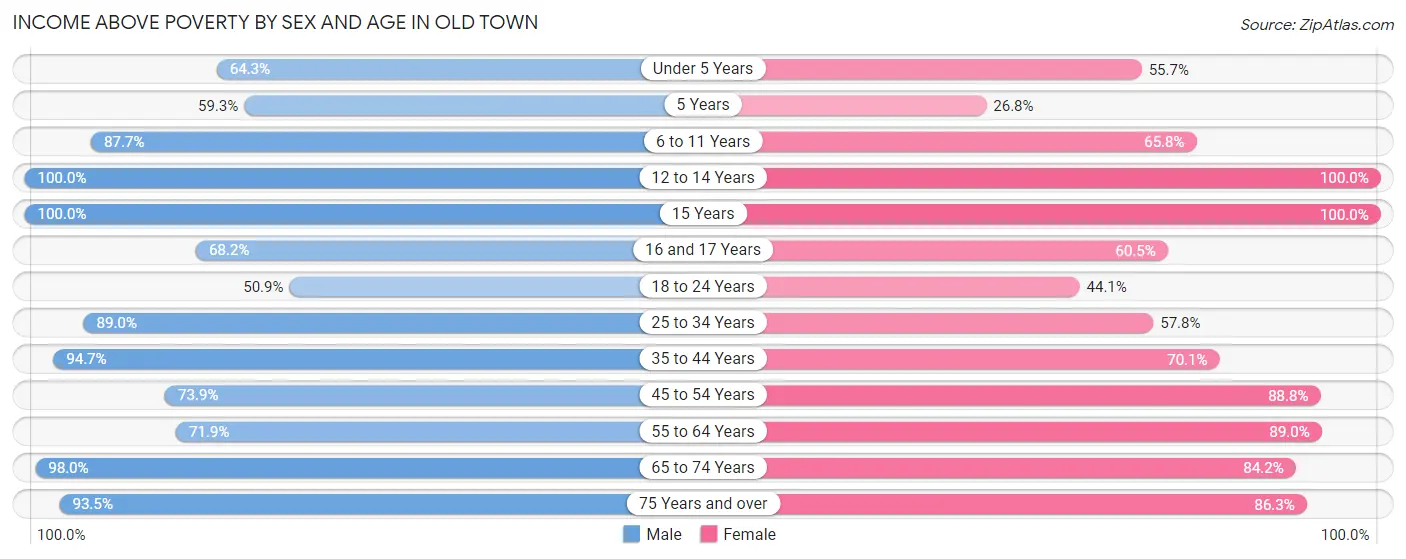
| Age Bracket | Male | Female |
| Under 5 Years | 137 (64.3%) | 108 (55.7%) |
| 5 Years | 16 (59.3%) | 11 (26.8%) |
| 6 to 11 Years | 128 (87.7%) | 150 (65.8%) |
| 12 to 14 Years | 26 (100.0%) | 87 (100.0%) |
| 15 Years | 34 (100.0%) | 8 (100.0%) |
| 16 and 17 Years | 90 (68.2%) | 52 (60.5%) |
| 18 to 24 Years | 264 (50.9%) | 162 (44.1%) |
| 25 to 34 Years | 455 (89.0%) | 303 (57.8%) |
| 35 to 44 Years | 513 (94.7%) | 503 (70.1%) |
| 45 to 54 Years | 295 (73.9%) | 325 (88.8%) |
| 55 to 64 Years | 414 (71.9%) | 317 (89.0%) |
| 65 to 74 Years | 393 (98.0%) | 347 (84.2%) |
| 75 Years and over | 115 (93.5%) | 270 (86.3%) |
| Total | 2,880 (78.9%) | 2,643 (71.4%) |
Income Below Poverty Among Married-Couple Families in Old Town
The poverty statistics for married-couple families in Old Town show that 4.5% or 55 of the total 1,219 families live below the poverty line. Families with 3 or 4 children have the highest poverty rate of 30.1%, comprising of 34 families. On the other hand, families with no children have the lowest poverty rate of 1.2%, which includes 8 families.
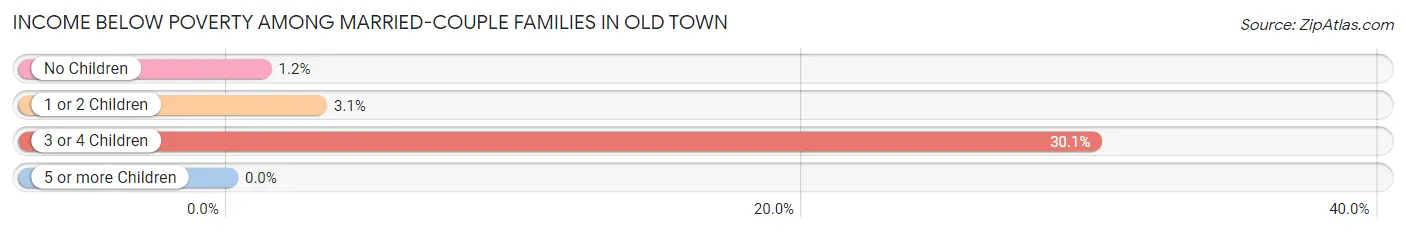
| Children | Above Poverty | Below Poverty |
| No Children | 678 (98.8%) | 8 (1.2%) |
| 1 or 2 Children | 407 (96.9%) | 13 (3.1%) |
| 3 or 4 Children | 79 (69.9%) | 34 (30.1%) |
| 5 or more Children | 0 (0.0%) | 0 (0.0%) |
| Total | 1,164 (95.5%) | 55 (4.5%) |
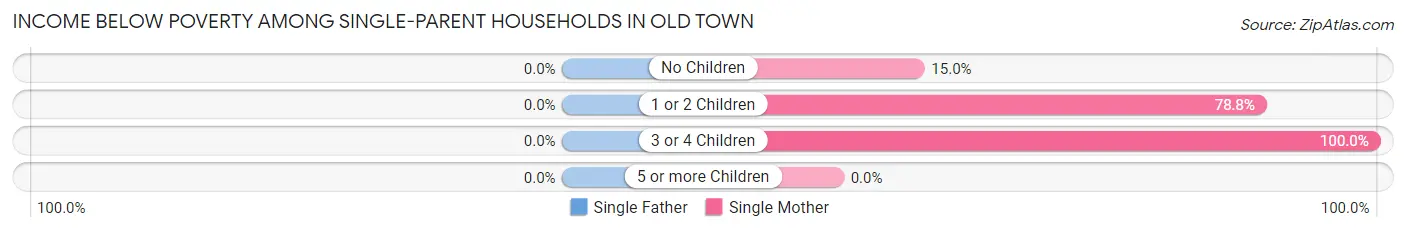
Income Below Poverty Among Single-Parent Households in Old Town
| Children | Single Father | Single Mother |
| No Children | 0 (0.0%) | 20 (15.0%) |
| 1 or 2 Children | 0 (0.0%) | 145 (78.8%) |
| 3 or 4 Children | 0 (0.0%) | 23 (100.0%) |
| 5 or more Children | 0 (0.0%) | 0 (0.0%) |
| Total | 0 (0.0%) | 188 (55.3%) |
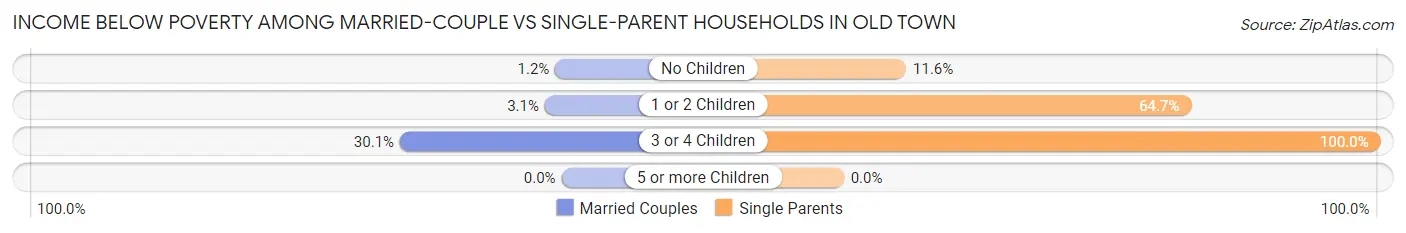
Income Below Poverty Among Married-Couple vs Single-Parent Households in Old Town
The poverty data for Old Town shows that 55 of the married-couple family households (4.5%) and 188 of the single-parent households (44.9%) are living below the poverty level. Within the married-couple family households, those with 3 or 4 children have the highest poverty rate, with 34 households (30.1%) falling below the poverty line. Among the single-parent households, those with 3 or 4 children have the highest poverty rate, with 23 household (100.0%) living below poverty.
| Children | Married-Couple Families | Single-Parent Households |
| No Children | 8 (1.2%) | 20 (11.6%) |
| 1 or 2 Children | 13 (3.1%) | 145 (64.7%) |
| 3 or 4 Children | 34 (30.1%) | 23 (100.0%) |
| 5 or more Children | 0 (0.0%) | 0 (0.0%) |
| Total | 55 (4.5%) | 188 (44.9%) |
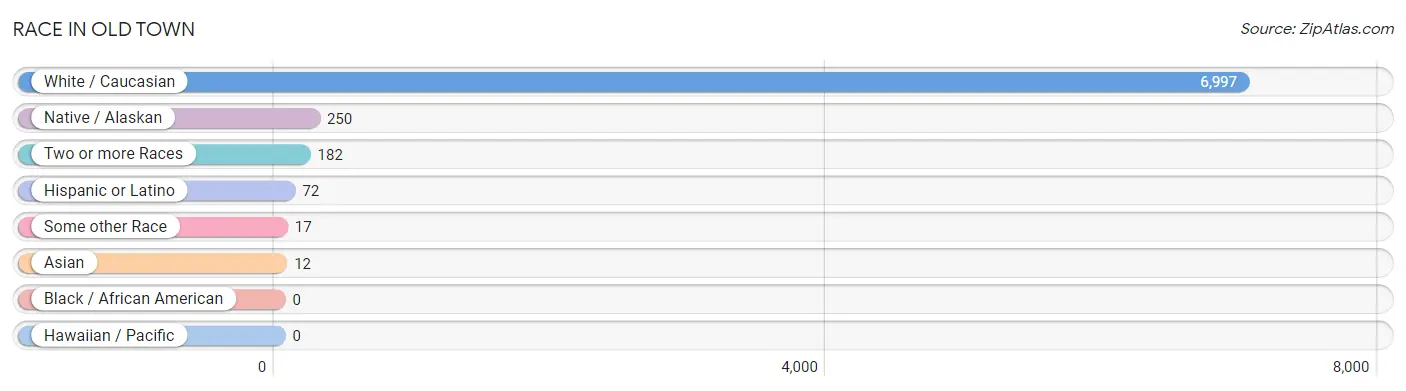
Race in Old Town
The most populous races in Old Town are White / Caucasian (6,997 | 93.8%), Native / Alaskan (250 | 3.4%), and Two or more Races (182 | 2.4%).
| Race | # Population | % Population |
| Asian | 12 | 0.2% |
| Black / African American | 0 | 0.0% |
| Hawaiian / Pacific | 0 | 0.0% |
| Hispanic or Latino | 72 | 1.0% |
| Native / Alaskan | 250 | 3.4% |
| White / Caucasian | 6,997 | 93.8% |
| Two or more Races | 182 | 2.4% |
| Some other Race | 17 | 0.2% |
| Total | 7,458 | 100.0% |
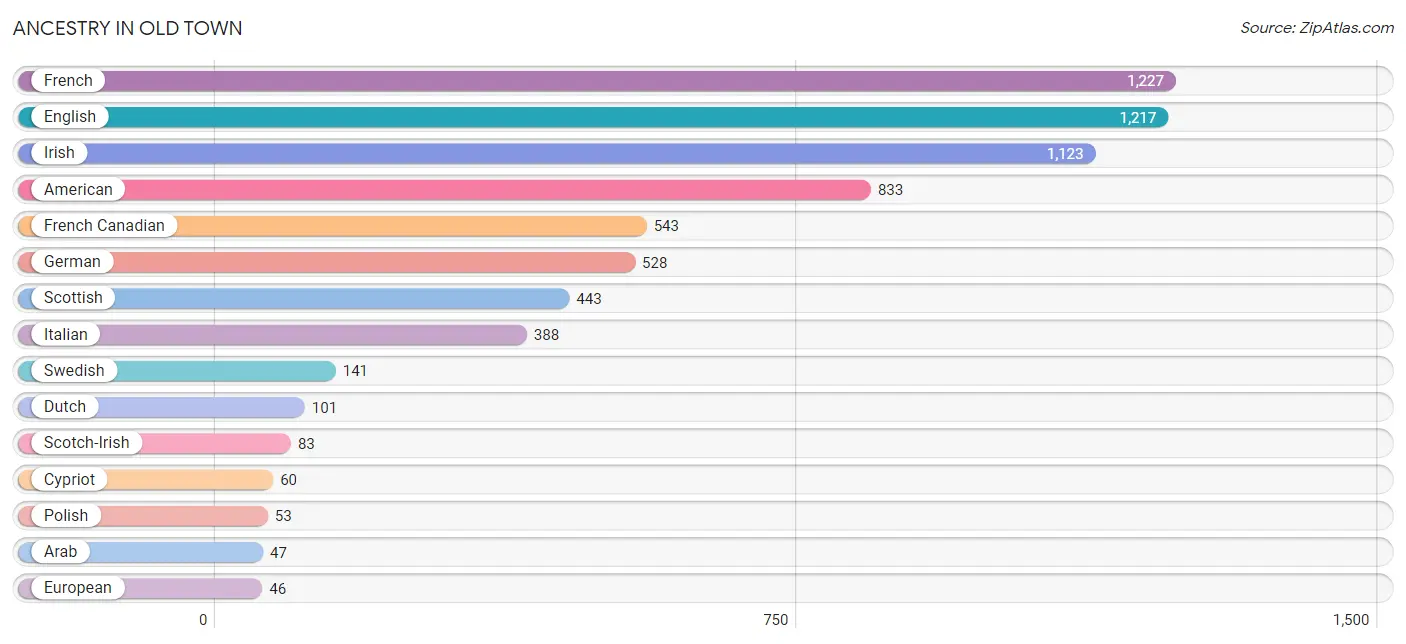
Ancestry in Old Town
The most populous ancestries reported in Old Town are French (1,227 | 16.5%), English (1,217 | 16.3%), Irish (1,123 | 15.1%), American (833 | 11.2%), and French Canadian (543 | 7.3%), together accounting for 66.3% of all Old Town residents.
| Ancestry | # Population | % Population |
| American | 833 | 11.2% |
| Arab | 47 | 0.6% |
| Armenian | 10 | 0.1% |
| British | 15 | 0.2% |
| Canadian | 9 | 0.1% |
| Celtic | 21 | 0.3% |
| Cherokee | 15 | 0.2% |
| Croatian | 35 | 0.5% |
| Cuban | 3 | 0.0% |
| Cypriot | 60 | 0.8% |
| Dutch | 101 | 1.3% |
| Eastern European | 35 | 0.5% |
| English | 1,217 | 16.3% |
| Estonian | 2 | 0.0% |
| European | 46 | 0.6% |
| French | 1,227 | 16.5% |
| French Canadian | 543 | 7.3% |
| German | 528 | 7.1% |
| Greek | 38 | 0.5% |
| Indian (Asian) | 6 | 0.1% |
| Iraqi | 23 | 0.3% |
| Irish | 1,123 | 15.1% |
| Italian | 388 | 5.2% |
| Korean | 6 | 0.1% |
| Lebanese | 14 | 0.2% |
| Mexican | 30 | 0.4% |
| Northern European | 1 | 0.0% |
| Norwegian | 27 | 0.4% |
| Polish | 53 | 0.7% |
| Puerto Rican | 39 | 0.5% |
| Scandinavian | 10 | 0.1% |
| Scotch-Irish | 83 | 1.1% |
| Scottish | 443 | 5.9% |
| Swedish | 141 | 1.9% | View All 34 Rows |
Immigrants in Old Town
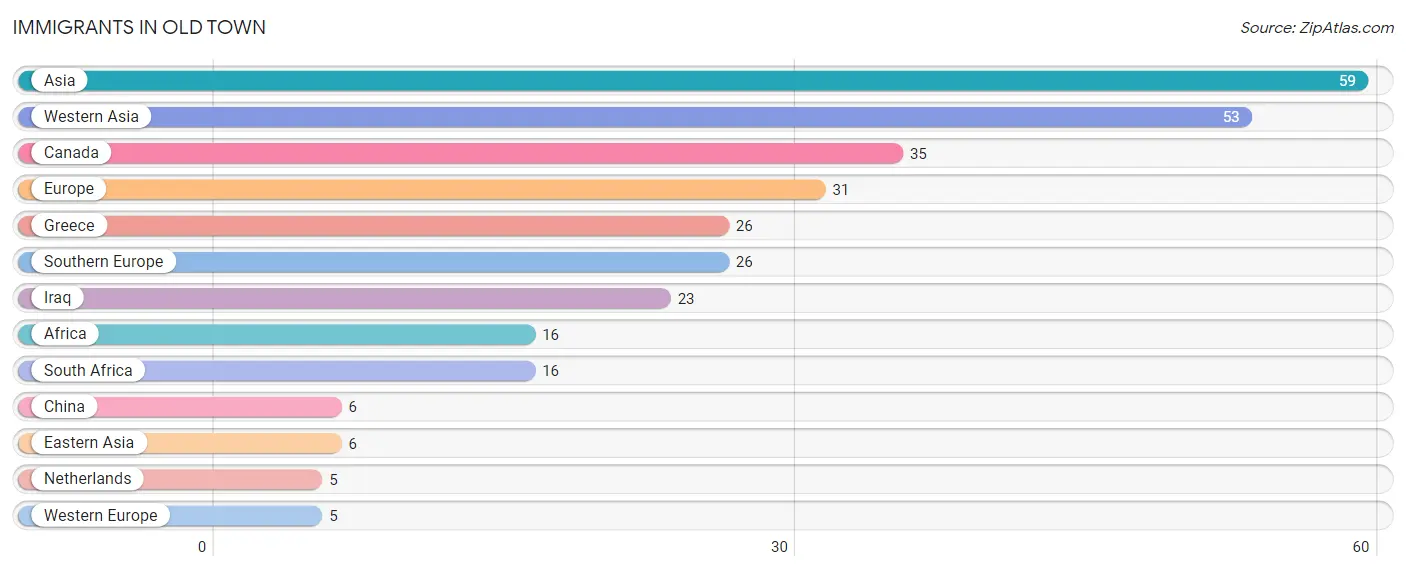
The most numerous immigrant groups reported in Old Town came from Asia (59 | 0.8%), Western Asia (53 | 0.7%), Canada (35 | 0.5%), Europe (31 | 0.4%), and Greece (26 | 0.4%), together accounting for 2.7% of all Old Town residents.
| Immigration Origin | # Population | % Population |
| Africa | 16 | 0.2% |
| Asia | 59 | 0.8% |
| Canada | 35 | 0.5% |
| China | 6 | 0.1% |
| Eastern Asia | 6 | 0.1% |
| Europe | 31 | 0.4% |
| Greece | 26 | 0.4% |
| Iraq | 23 | 0.3% |
| Netherlands | 5 | 0.1% |
| South Africa | 16 | 0.2% |
| Southern Europe | 26 | 0.4% |
| Western Asia | 53 | 0.7% |
| Western Europe | 5 | 0.1% | View All 13 Rows |
Sex and Age in Old Town
Sex and Age in Old Town
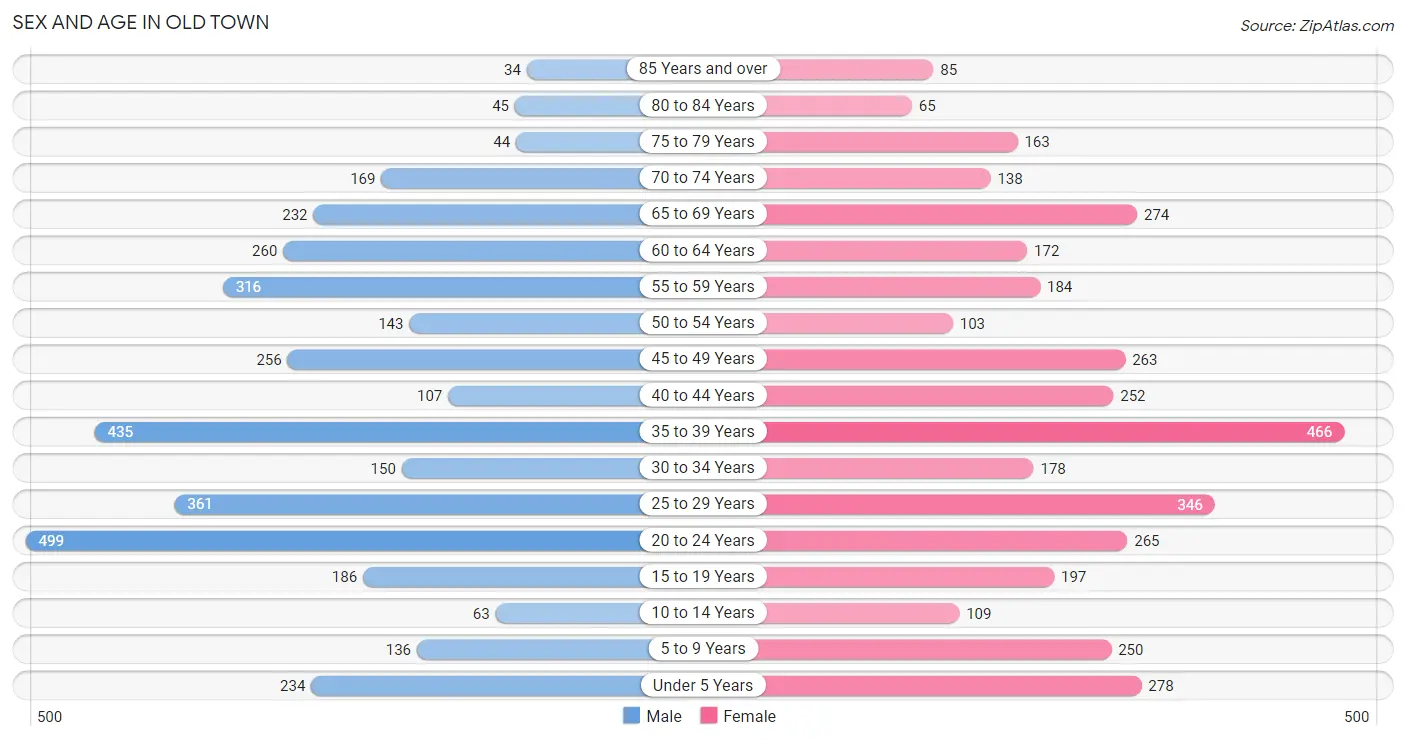
The most populous age groups in Old Town are 20 to 24 Years (499 | 13.6%) for men and 35 to 39 Years (466 | 12.3%) for women.
| Age Bracket | Male | Female |
| Under 5 Years | 234 (6.4%) | 278 (7.3%) |
| 5 to 9 Years | 136 (3.7%) | 250 (6.6%) |
| 10 to 14 Years | 63 (1.7%) | 109 (2.9%) |
| 15 to 19 Years | 186 (5.1%) | 197 (5.2%) |
| 20 to 24 Years | 499 (13.6%) | 265 (7.0%) |
| 25 to 29 Years | 361 (9.8%) | 346 (9.1%) |
| 30 to 34 Years | 150 (4.1%) | 178 (4.7%) |
| 35 to 39 Years | 435 (11.8%) | 466 (12.3%) |
| 40 to 44 Years | 107 (2.9%) | 252 (6.7%) |
| 45 to 49 Years | 256 (7.0%) | 263 (6.9%) |
| 50 to 54 Years | 143 (3.9%) | 103 (2.7%) |
| 55 to 59 Years | 316 (8.6%) | 184 (4.9%) |
| 60 to 64 Years | 260 (7.1%) | 172 (4.5%) |
| 65 to 69 Years | 232 (6.3%) | 274 (7.2%) |
| 70 to 74 Years | 169 (4.6%) | 138 (3.6%) |
| 75 to 79 Years | 44 (1.2%) | 163 (4.3%) |
| 80 to 84 Years | 45 (1.2%) | 65 (1.7%) |
| 85 Years and over | 34 (0.9%) | 85 (2.2%) |
| Total | 3,670 (100.0%) | 3,788 (100.0%) |
Families and Households in Old Town
Median Family Size in Old Town
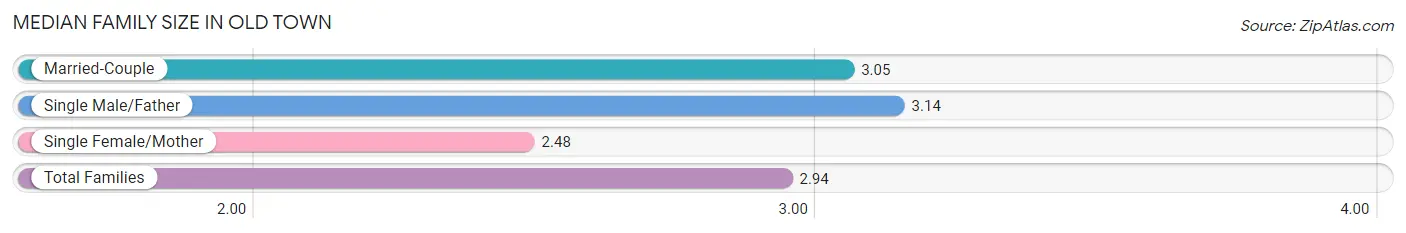
The median family size in Old Town is 2.94 persons per family, with single male/father families (79 | 4.8%) accounting for the largest median family size of 3.14 persons per family. On the other hand, single female/mother families (340 | 20.8%) represent the smallest median family size with 2.48 persons per family.
| Family Type | # Families | Family Size |
| Married-Couple | 1,219 (74.4%) | 3.05 |
| Single Male/Father | 79 (4.8%) | 3.14 |
| Single Female/Mother | 340 (20.8%) | 2.48 |
| Total Families | 1,638 (100.0%) | 2.94 |
Median Household Size in Old Town
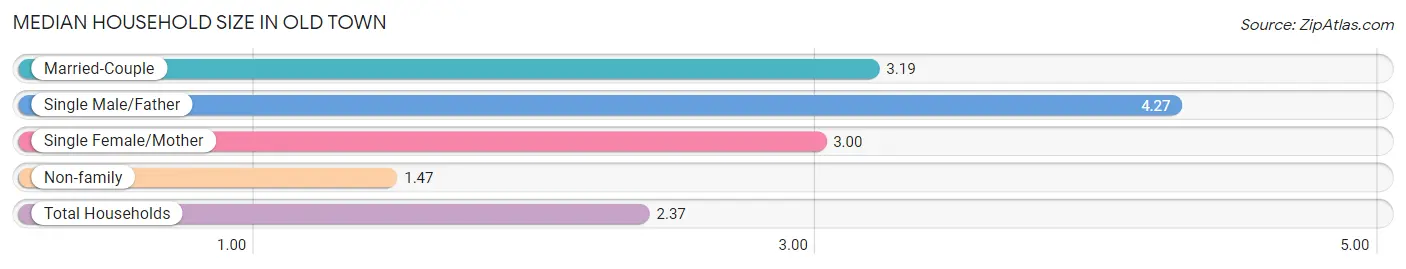
The median household size in Old Town is 2.37 persons per household, with single male/father households (79 | 2.5%) accounting for the largest median household size of 4.27 persons per household. non-family households (1,507 | 47.9%) represent the smallest median household size with 1.47 persons per household.
| Household Type | # Households | Household Size |
| Married-Couple | 1,219 (38.8%) | 3.19 |
| Single Male/Father | 79 (2.5%) | 4.27 |
| Single Female/Mother | 340 (10.8%) | 3.00 |
| Non-family | 1,507 (47.9%) | 1.47 |
| Total Households | 3,145 (100.0%) | 2.37 |
Household Size by Marriage Status in Old Town
Out of a total of 3,145 households in Old Town, 1,638 (52.1%) are family households, while 1,507 (47.9%) are nonfamily households. The most numerous type of family households are 2-person households, comprising 741, and the most common type of nonfamily households are 1-person households, comprising 941.
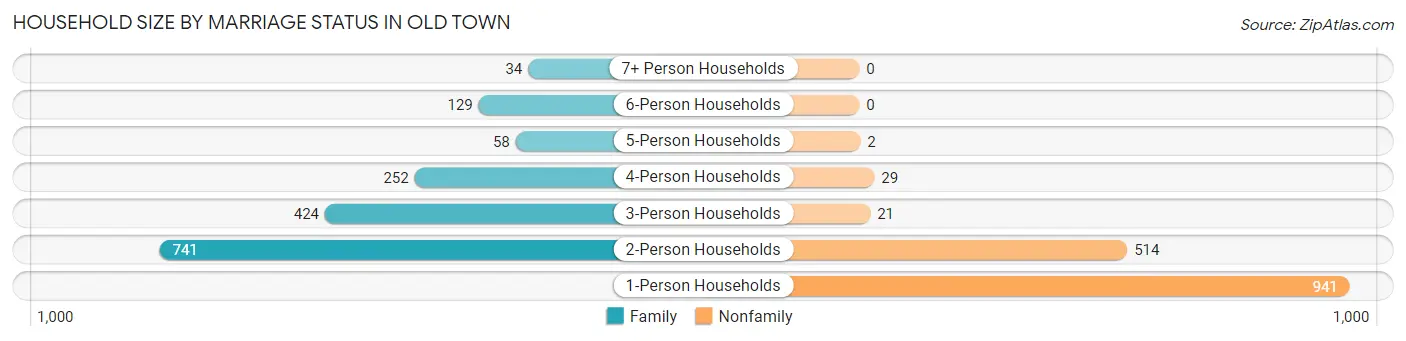
| Household Size | Family Households | Nonfamily Households |
| 1-Person Households | - | 941 (29.9%) |
| 2-Person Households | 741 (23.6%) | 514 (16.3%) |
| 3-Person Households | 424 (13.5%) | 21 (0.7%) |
| 4-Person Households | 252 (8.0%) | 29 (0.9%) |
| 5-Person Households | 58 (1.8%) | 2 (0.1%) |
| 6-Person Households | 129 (4.1%) | 0 (0.0%) |
| 7+ Person Households | 34 (1.1%) | 0 (0.0%) |
| Total | 1,638 (52.1%) | 1,507 (47.9%) |
Female Fertility in Old Town
Fertility by Age in Old Town
Average fertility rate in Old Town is 197.0 births per 1,000 women. Women in the age bracket of 20 to 34 years have the highest fertility rate with 257.0 births per 1,000 women. Women in the age bracket of 20 to 34 years acount for 50.9% of all women with births.
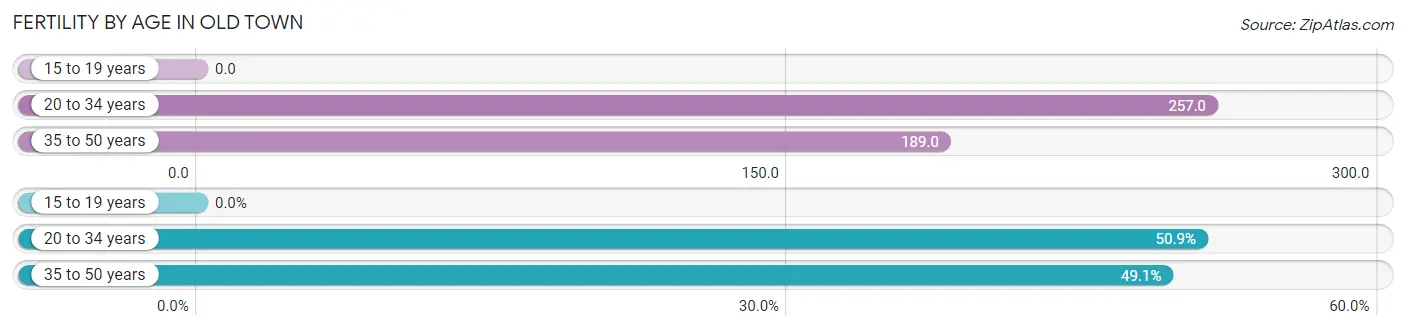
| Age Bracket | Women with Births | Births / 1,000 Women |
| 15 to 19 years | 0 (0.0%) | 0.0 |
| 20 to 34 years | 203 (50.9%) | 257.0 |
| 35 to 50 years | 196 (49.1%) | 189.0 |
| Total | 399 (100.0%) | 197.0 |
Fertility by Age by Marriage Status in Old Town
47.1% of women with births (399) in Old Town are married. The highest percentage of unmarried women with births falls into 20 to 34 years age bracket with 76.3% of them unmarried at the time of birth, while the lowest percentage of unmarried women with births belong to 35 to 50 years age bracket with 28.6% of them unmarried.
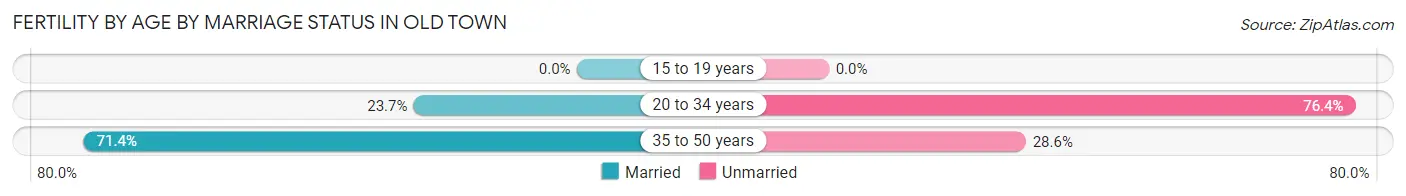
| Age Bracket | Married | Unmarried |
| 15 to 19 years | 0 (0.0%) | 0 (0.0%) |
| 20 to 34 years | 48 (23.6%) | 155 (76.3%) |
| 35 to 50 years | 140 (71.4%) | 56 (28.6%) |
| Total | 188 (47.1%) | 211 (52.9%) |
Fertility by Education in Old Town
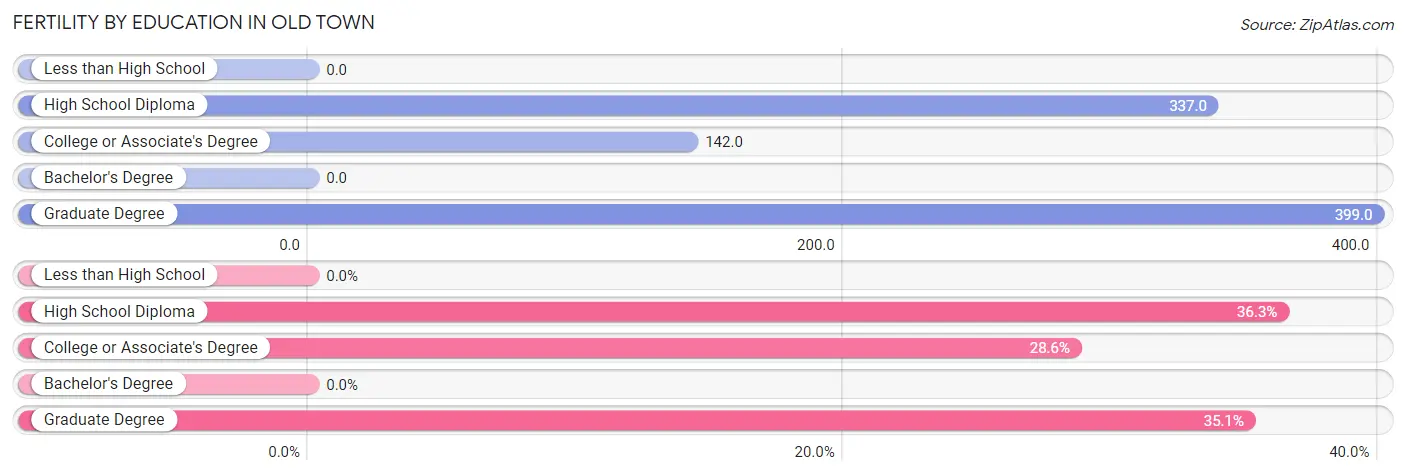
| Educational Attainment | Women with Births | Births / 1,000 Women |
| Less than High School | 0 (0.0%) | 0.0 |
| High School Diploma | 145 (36.3%) | 337.0 |
| College or Associate's Degree | 114 (28.6%) | 142.0 |
| Bachelor's Degree | 0 (0.0%) | 0.0 |
| Graduate Degree | 140 (35.1%) | 399.0 |
| Total | 399 (100.0%) | 197.0 |
Fertility by Education by Marriage Status in Old Town
52.9% of women with births in Old Town are unmarried. Women with the educational attainment of graduate degree are most likely to be married with 100.0% of them married at childbirth, while women with the educational attainment of high school diploma are least likely to be married with 91.0% of them unmarried at childbirth.
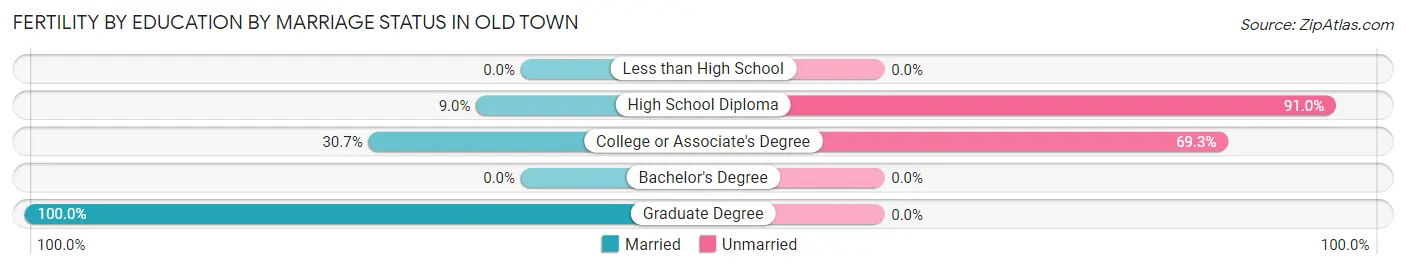
| Educational Attainment | Married | Unmarried |
| Less than High School | 0 (0.0%) | 0 (0.0%) |
| High School Diploma | 13 (9.0%) | 132 (91.0%) |
| College or Associate's Degree | 35 (30.7%) | 79 (69.3%) |
| Bachelor's Degree | 0 (0.0%) | 0 (0.0%) |
| Graduate Degree | 140 (100.0%) | 0 (0.0%) |
| Total | 188 (47.1%) | 211 (52.9%) |
Employment Characteristics in Old Town
Employment by Class of Employer in Old Town
Among the 3,742 employed individuals in Old Town, private company employees (2,154 | 57.6%), not-for-profit organizations (859 | 23.0%), and local government employees (245 | 6.6%) make up the most common classes of employment.
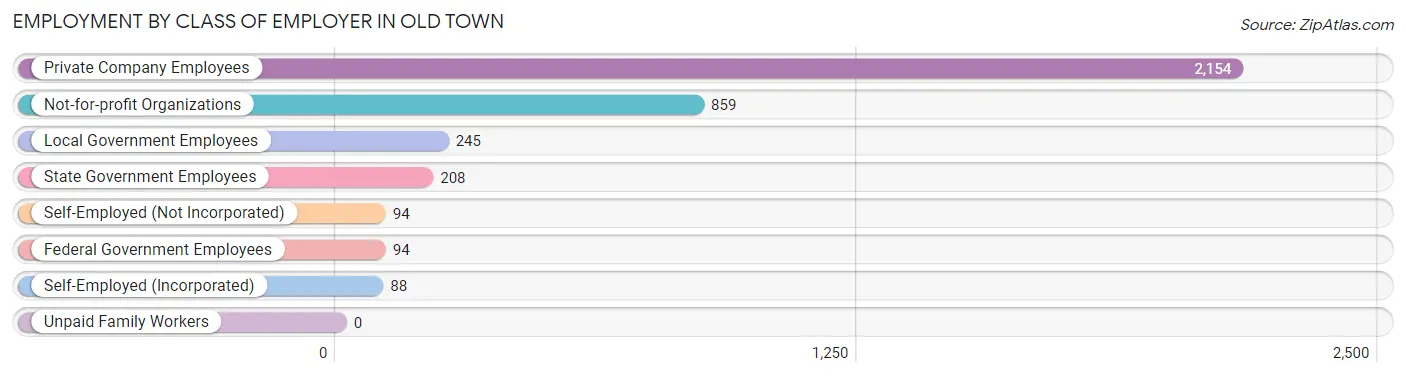
| Employer Class | # Employees | % Employees |
| Private Company Employees | 2,154 | 57.6% |
| Self-Employed (Incorporated) | 88 | 2.4% |
| Self-Employed (Not Incorporated) | 94 | 2.5% |
| Not-for-profit Organizations | 859 | 23.0% |
| Local Government Employees | 245 | 6.6% |
| State Government Employees | 208 | 5.6% |
| Federal Government Employees | 94 | 2.5% |
| Unpaid Family Workers | 0 | 0.0% |
| Total | 3,742 | 100.0% |
Employment Status by Age in Old Town
According to the labor force statistics for Old Town, out of the total population over 16 years of age (6,346), 61.8% or 3,922 individuals are in the labor force, with 2.4% or 94 of them unemployed. The age group with the highest labor force participation rate is 25 to 29 years, with 95.5% or 675 individuals in the labor force. Within the labor force, the 16 to 19 years age range has the highest percentage of unemployed individuals, with 26.7% or 27 of them being unemployed.
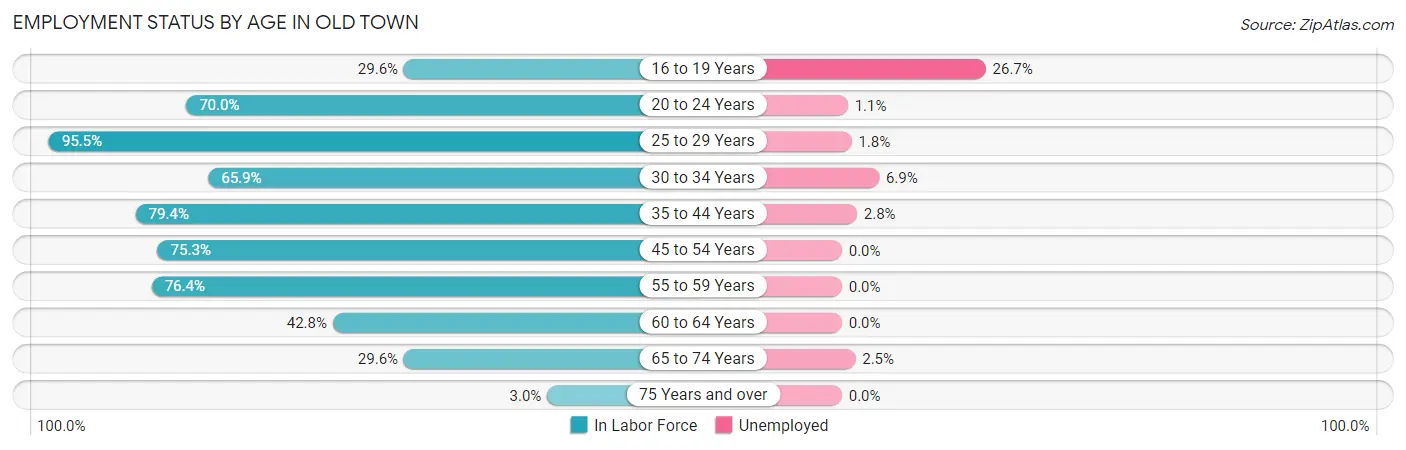
| Age Bracket | In Labor Force | Unemployed |
| 16 to 19 Years | 101 (29.6%) | 27 (26.7%) |
| 20 to 24 Years | 535 (70.0%) | 6 (1.1%) |
| 25 to 29 Years | 675 (95.5%) | 12 (1.8%) |
| 30 to 34 Years | 216 (65.9%) | 15 (6.9%) |
| 35 to 44 Years | 1,000 (79.4%) | 28 (2.8%) |
| 45 to 54 Years | 576 (75.3%) | 0 (0.0%) |
| 55 to 59 Years | 382 (76.4%) | 0 (0.0%) |
| 60 to 64 Years | 185 (42.8%) | 0 (0.0%) |
| 65 to 74 Years | 241 (29.6%) | 6 (2.5%) |
| 75 Years and over | 13 (3.0%) | 0 (0.0%) |
| Total | 3,922 (61.8%) | 94 (2.4%) |
Employment Status by Educational Attainment in Old Town
According to labor force statistics for Old Town, 76.0% of individuals (3,034) out of the total population between 25 and 64 years of age (3,992) are in the labor force, with 1.8% or 55 of them being unemployed. The group with the highest labor force participation rate are those with the educational attainment of bachelor's degree or higher, with 89.3% or 1,366 individuals in the labor force. Within the labor force, individuals with college / associate degree education have the highest percentage of unemployment, with 3.3% or 29 of them being unemployed.
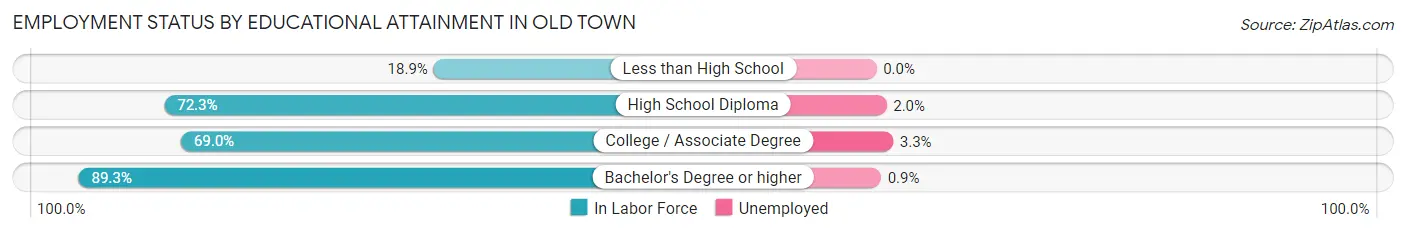
| Educational Attainment | In Labor Force | Unemployed |
| Less than High School | 25 (18.9%) | 0 (0.0%) |
| High School Diploma | 763 (72.3%) | 21 (2.0%) |
| College / Associate Degree | 879 (69.0%) | 42 (3.3%) |
| Bachelor's Degree or higher | 1,366 (89.3%) | 14 (0.9%) |
| Total | 3,034 (76.0%) | 72 (1.8%) |
Employment Occupations by Sex in Old Town
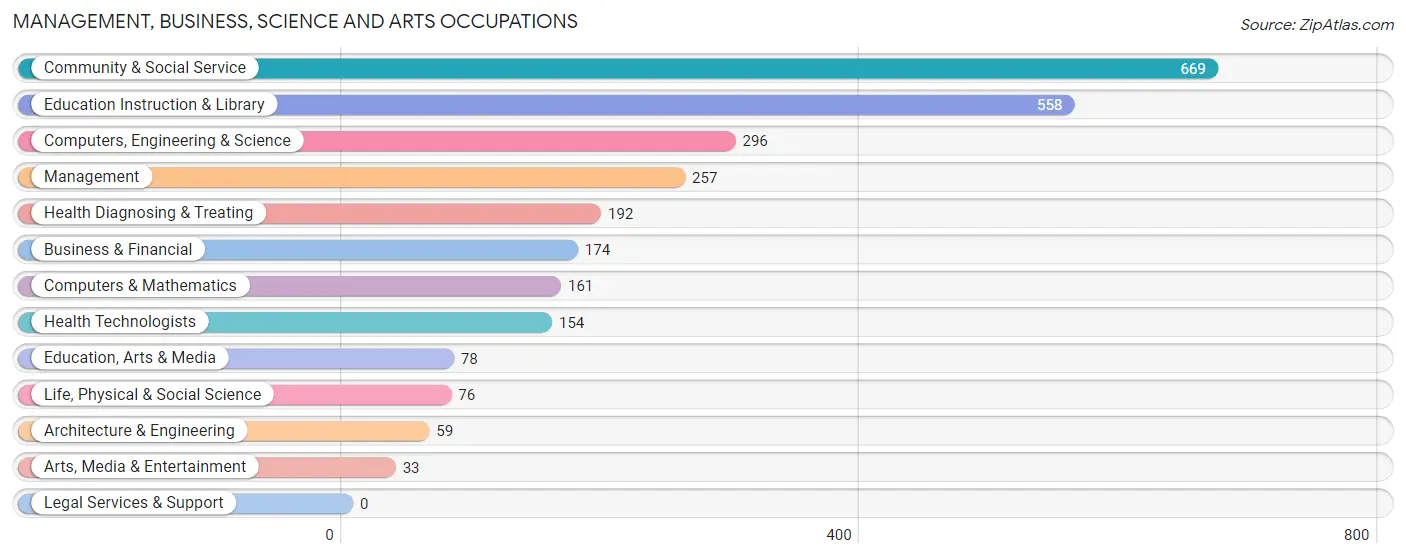
Management, Business, Science and Arts Occupations
The most common Management, Business, Science and Arts occupations in Old Town are Community & Social Service (669 | 17.5%), Education Instruction & Library (558 | 14.6%), Computers, Engineering & Science (296 | 7.8%), Management (257 | 6.7%), and Health Diagnosing & Treating (192 | 5.0%).
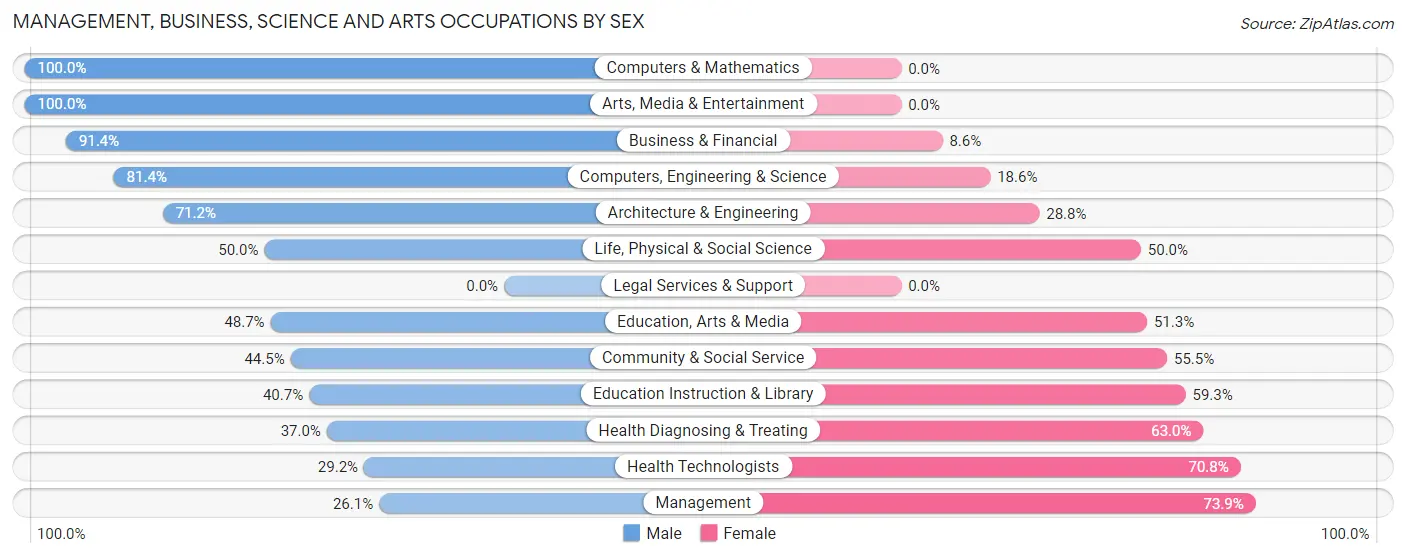
Management, Business, Science and Arts Occupations by Sex
Within the Management, Business, Science and Arts occupations in Old Town, the most male-oriented occupations are Computers & Mathematics (100.0%), Arts, Media & Entertainment (100.0%), and Business & Financial (91.4%), while the most female-oriented occupations are Management (73.9%), Health Technologists (70.8%), and Health Diagnosing & Treating (63.0%).
| Occupation | Male | Female |
| Management | 67 (26.1%) | 190 (73.9%) |
| Business & Financial | 159 (91.4%) | 15 (8.6%) |
| Computers, Engineering & Science | 241 (81.4%) | 55 (18.6%) |
| Computers & Mathematics | 161 (100.0%) | 0 (0.0%) |
| Architecture & Engineering | 42 (71.2%) | 17 (28.8%) |
| Life, Physical & Social Science | 38 (50.0%) | 38 (50.0%) |
| Community & Social Service | 298 (44.5%) | 371 (55.5%) |
| Education, Arts & Media | 38 (48.7%) | 40 (51.3%) |
| Legal Services & Support | 0 (0.0%) | 0 (0.0%) |
| Education Instruction & Library | 227 (40.7%) | 331 (59.3%) |
| Arts, Media & Entertainment | 33 (100.0%) | 0 (0.0%) |
| Health Diagnosing & Treating | 71 (37.0%) | 121 (63.0%) |
| Health Technologists | 45 (29.2%) | 109 (70.8%) |
| Total (Category) | 836 (52.6%) | 752 (47.4%) |
| Total (Overall) | 1,921 (50.4%) | 1,890 (49.6%) |
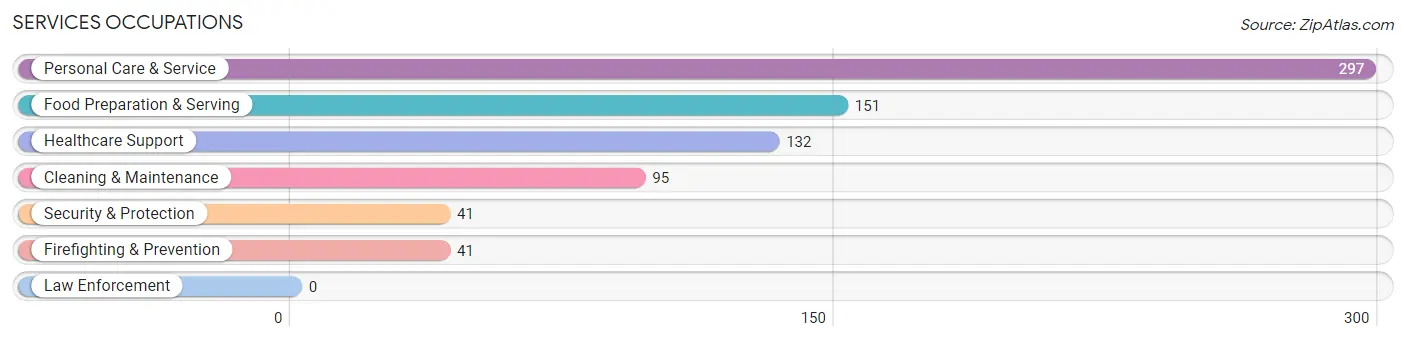
Services Occupations
The most common Services occupations in Old Town are Personal Care & Service (297 | 7.8%), Food Preparation & Serving (151 | 4.0%), Healthcare Support (132 | 3.5%), Cleaning & Maintenance (95 | 2.5%), and Security & Protection (41 | 1.1%).
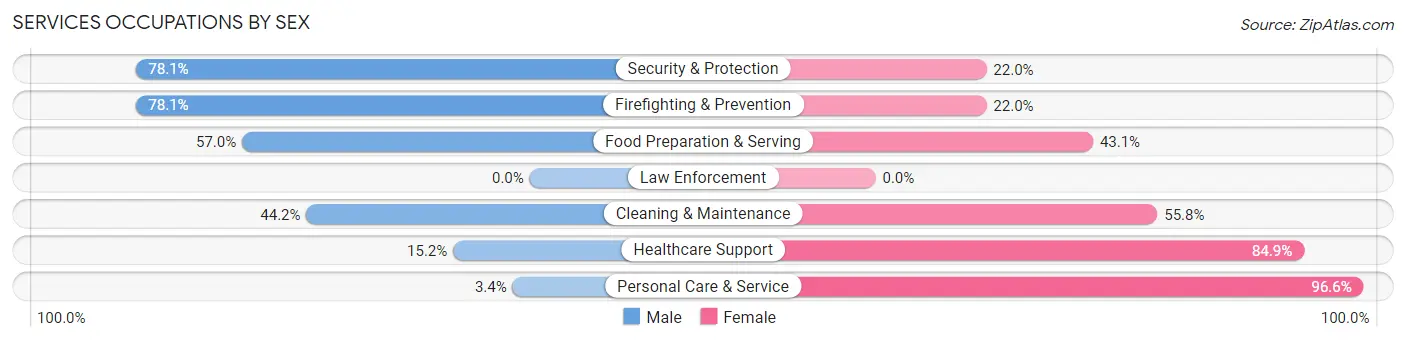
Services Occupations by Sex
Within the Services occupations in Old Town, the most male-oriented occupations are Security & Protection (78.0%), Firefighting & Prevention (78.0%), and Food Preparation & Serving (57.0%), while the most female-oriented occupations are Personal Care & Service (96.6%), Healthcare Support (84.9%), and Cleaning & Maintenance (55.8%).
| Occupation | Male | Female |
| Healthcare Support | 20 (15.1%) | 112 (84.9%) |
| Security & Protection | 32 (78.0%) | 9 (22.0%) |
| Firefighting & Prevention | 32 (78.0%) | 9 (22.0%) |
| Law Enforcement | 0 (0.0%) | 0 (0.0%) |
| Food Preparation & Serving | 86 (57.0%) | 65 (43.0%) |
| Cleaning & Maintenance | 42 (44.2%) | 53 (55.8%) |
| Personal Care & Service | 10 (3.4%) | 287 (96.6%) |
| Total (Category) | 190 (26.5%) | 526 (73.5%) |
| Total (Overall) | 1,921 (50.4%) | 1,890 (49.6%) |
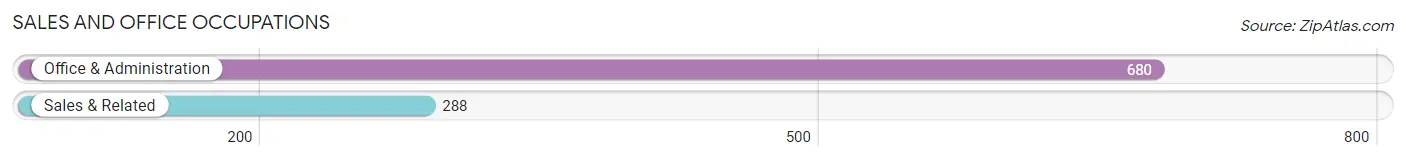
Sales and Office Occupations
The most common Sales and Office occupations in Old Town are Office & Administration (680 | 17.8%), and Sales & Related (288 | 7.6%).
Sales and Office Occupations by Sex
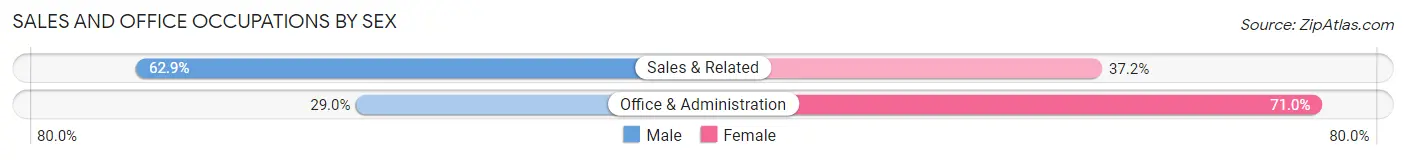
| Occupation | Male | Female |
| Sales & Related | 181 (62.8%) | 107 (37.1%) |
| Office & Administration | 197 (29.0%) | 483 (71.0%) |
| Total (Category) | 378 (39.1%) | 590 (61.0%) |
| Total (Overall) | 1,921 (50.4%) | 1,890 (49.6%) |
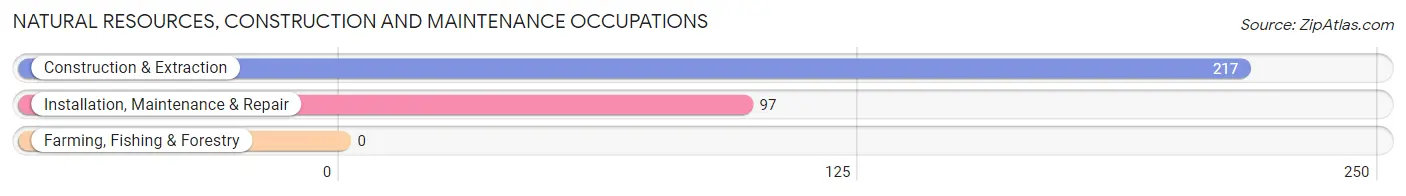
Natural Resources, Construction and Maintenance Occupations
The most common Natural Resources, Construction and Maintenance occupations in Old Town are Construction & Extraction (217 | 5.7%), and Installation, Maintenance & Repair (97 | 2.5%).
Natural Resources, Construction and Maintenance Occupations by Sex
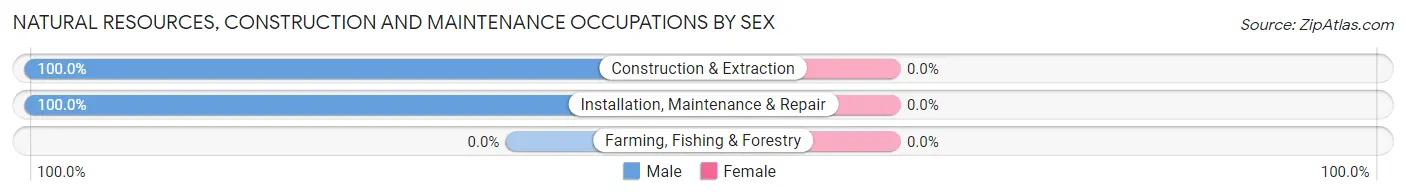
| Occupation | Male | Female |
| Farming, Fishing & Forestry | 0 (0.0%) | 0 (0.0%) |
| Construction & Extraction | 217 (100.0%) | 0 (0.0%) |
| Installation, Maintenance & Repair | 97 (100.0%) | 0 (0.0%) |
| Total (Category) | 314 (100.0%) | 0 (0.0%) |
| Total (Overall) | 1,921 (50.4%) | 1,890 (49.6%) |
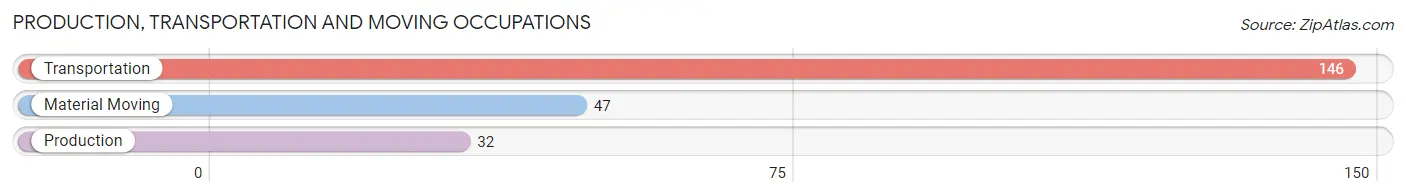
Production, Transportation and Moving Occupations
The most common Production, Transportation and Moving occupations in Old Town are Transportation (146 | 3.8%), Material Moving (47 | 1.2%), and Production (32 | 0.8%).
Production, Transportation and Moving Occupations by Sex
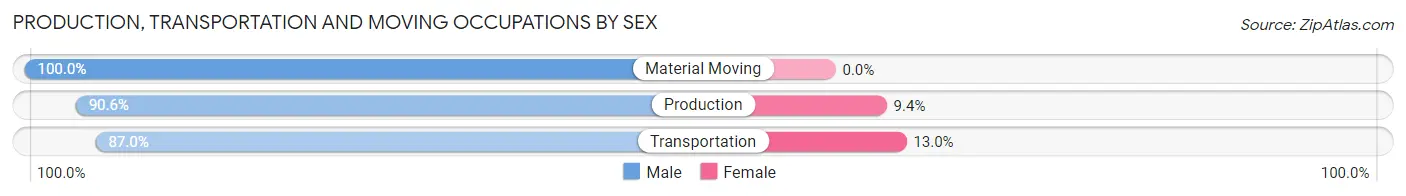
| Occupation | Male | Female |
| Production | 29 (90.6%) | 3 (9.4%) |
| Transportation | 127 (87.0%) | 19 (13.0%) |
| Material Moving | 47 (100.0%) | 0 (0.0%) |
| Total (Category) | 203 (90.2%) | 22 (9.8%) |
| Total (Overall) | 1,921 (50.4%) | 1,890 (49.6%) |
Employment Industries by Sex in Old Town
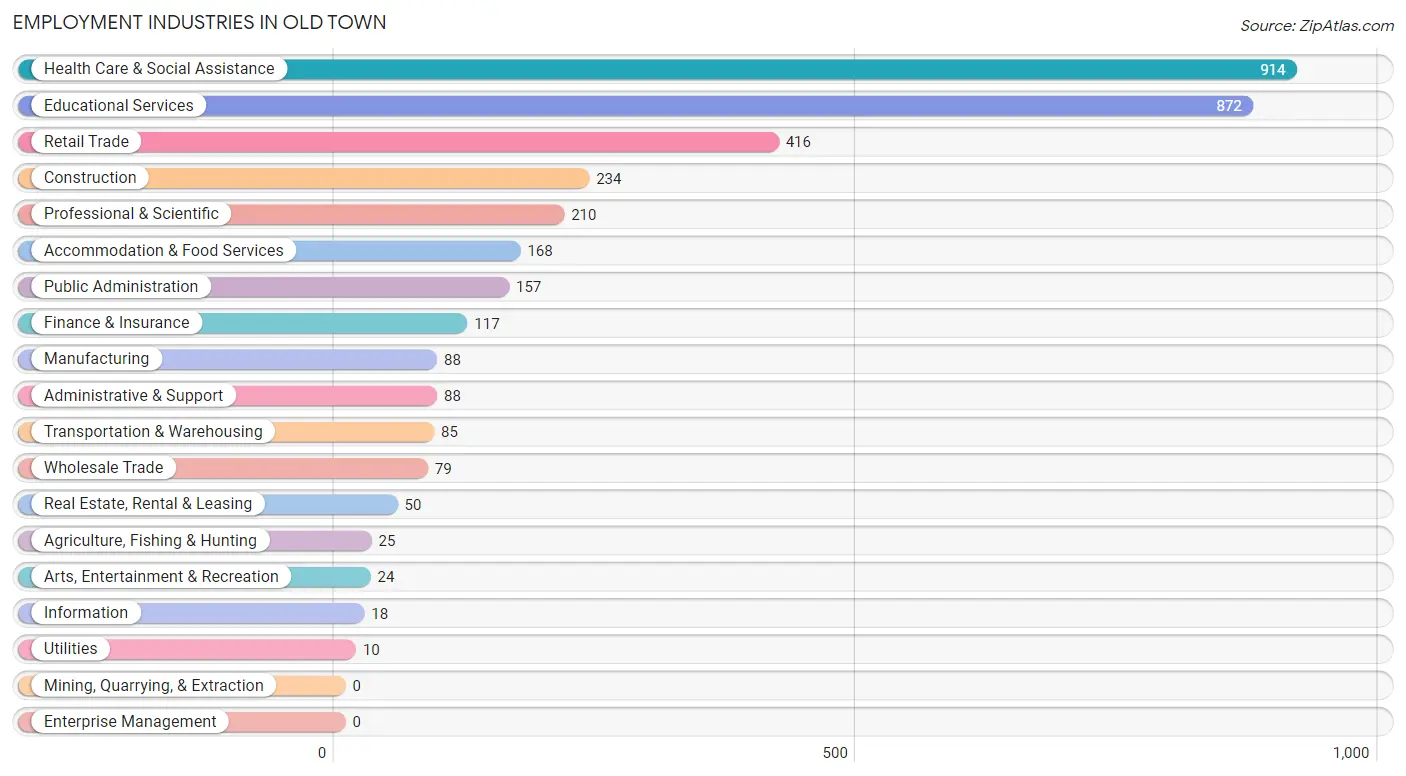
Employment Industries in Old Town
The major employment industries in Old Town include Health Care & Social Assistance (914 | 24.0%), Educational Services (872 | 22.9%), Retail Trade (416 | 10.9%), Construction (234 | 6.1%), and Professional & Scientific (210 | 5.5%).
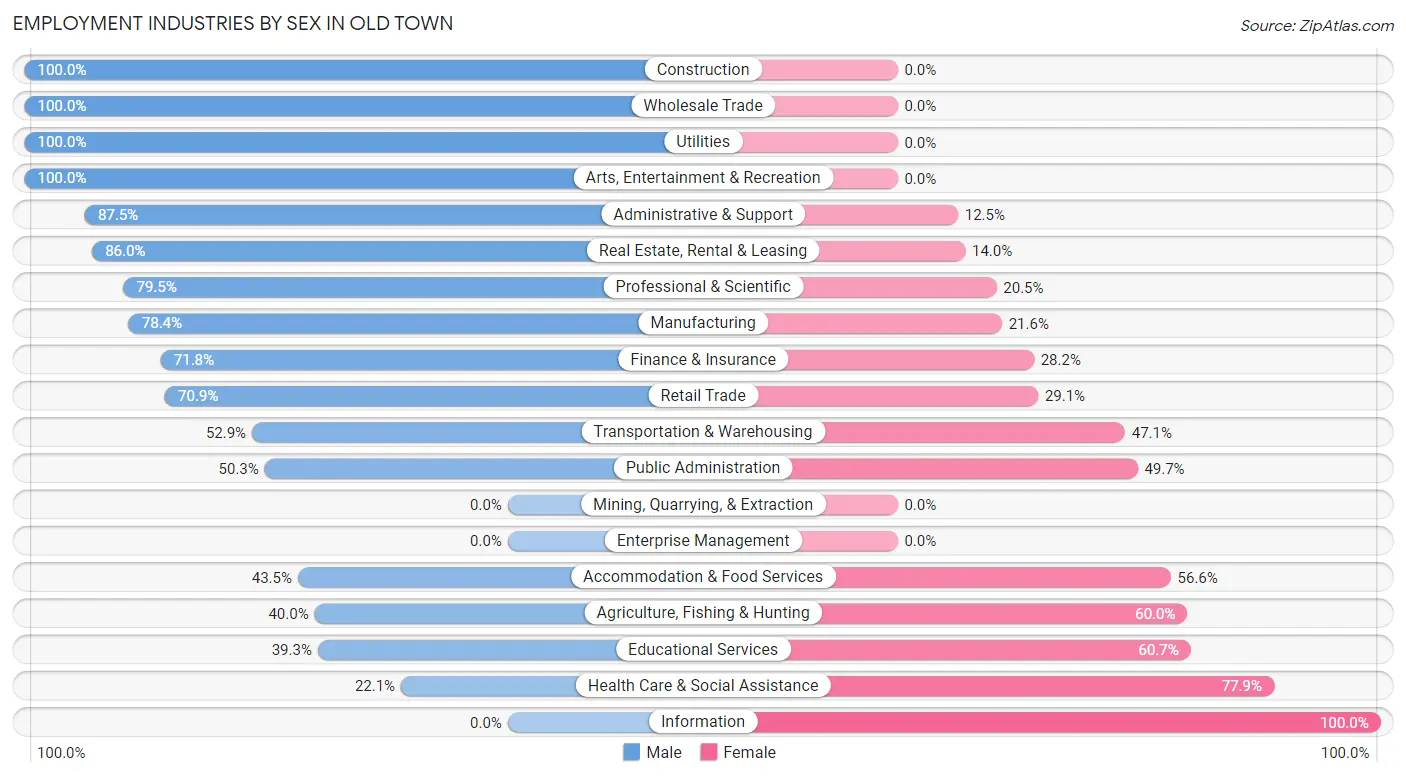
Employment Industries by Sex in Old Town
The Old Town industries that see more men than women are Construction (100.0%), Wholesale Trade (100.0%), and Utilities (100.0%), whereas the industries that tend to have a higher number of women are Information (100.0%), Health Care & Social Assistance (77.9%), and Educational Services (60.7%).
| Industry | Male | Female |
| Agriculture, Fishing & Hunting | 10 (40.0%) | 15 (60.0%) |
| Mining, Quarrying, & Extraction | 0 (0.0%) | 0 (0.0%) |
| Construction | 234 (100.0%) | 0 (0.0%) |
| Manufacturing | 69 (78.4%) | 19 (21.6%) |
| Wholesale Trade | 79 (100.0%) | 0 (0.0%) |
| Retail Trade | 295 (70.9%) | 121 (29.1%) |
| Transportation & Warehousing | 45 (52.9%) | 40 (47.1%) |
| Utilities | 10 (100.0%) | 0 (0.0%) |
| Information | 0 (0.0%) | 18 (100.0%) |
| Finance & Insurance | 84 (71.8%) | 33 (28.2%) |
| Real Estate, Rental & Leasing | 43 (86.0%) | 7 (14.0%) |
| Professional & Scientific | 167 (79.5%) | 43 (20.5%) |
| Enterprise Management | 0 (0.0%) | 0 (0.0%) |
| Administrative & Support | 77 (87.5%) | 11 (12.5%) |
| Educational Services | 343 (39.3%) | 529 (60.7%) |
| Health Care & Social Assistance | 202 (22.1%) | 712 (77.9%) |
| Arts, Entertainment & Recreation | 24 (100.0%) | 0 (0.0%) |
| Accommodation & Food Services | 73 (43.4%) | 95 (56.6%) |
| Public Administration | 79 (50.3%) | 78 (49.7%) |
| Total | 1,921 (50.4%) | 1,890 (49.6%) |
Education in Old Town
School Enrollment in Old Town
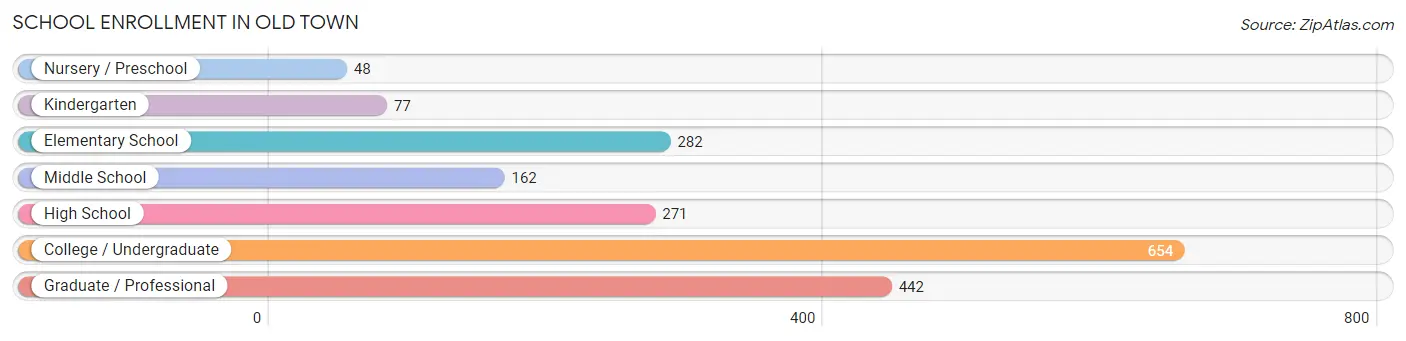
The most common levels of schooling among the 1,936 students in Old Town are college / undergraduate (654 | 33.8%), graduate / professional (442 | 22.8%), and elementary school (282 | 14.6%).
| School Level | # Students | % Students |
| Nursery / Preschool | 48 | 2.5% |
| Kindergarten | 77 | 4.0% |
| Elementary School | 282 | 14.6% |
| Middle School | 162 | 8.4% |
| High School | 271 | 14.0% |
| College / Undergraduate | 654 | 33.8% |
| Graduate / Professional | 442 | 22.8% |
| Total | 1,936 | 100.0% |
School Enrollment by Age by Funding Source in Old Town
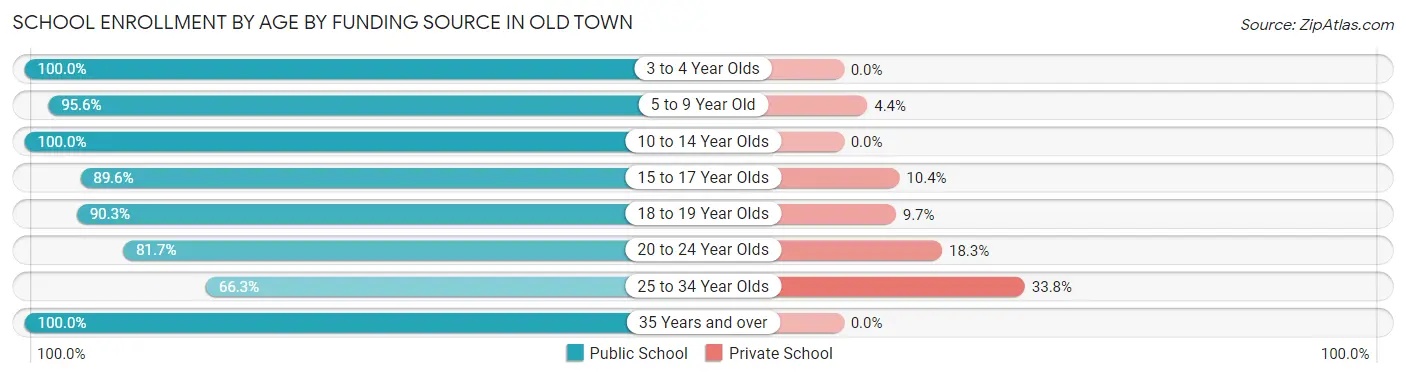
Out of a total of 1,936 students who are enrolled in schools in Old Town, 190 (9.8%) attend a private institution, while the remaining 1,746 (90.2%) are enrolled in public schools. The age group of 25 to 34 year olds has the highest likelihood of being enrolled in private schools, with 54 (33.8% in the age bracket) enrolled. Conversely, the age group of 3 to 4 year olds has the lowest likelihood of being enrolled in a private school, with 21 (100.0% in the age bracket) attending a public institution.
| Age Bracket | Public School | Private School |
| 3 to 4 Year Olds | 21 (100.0%) | 0 (0.0%) |
| 5 to 9 Year Old | 369 (95.6%) | 17 (4.4%) |
| 10 to 14 Year Olds | 172 (100.0%) | 0 (0.0%) |
| 15 to 17 Year Olds | 233 (89.6%) | 27 (10.4%) |
| 18 to 19 Year Olds | 93 (90.3%) | 10 (9.7%) |
| 20 to 24 Year Olds | 361 (81.7%) | 81 (18.3%) |
| 25 to 34 Year Olds | 106 (66.2%) | 54 (33.8%) |
| 35 Years and over | 392 (100.0%) | 0 (0.0%) |
| Total | 1,746 (90.2%) | 190 (9.8%) |
Educational Attainment by Field of Study in Old Town
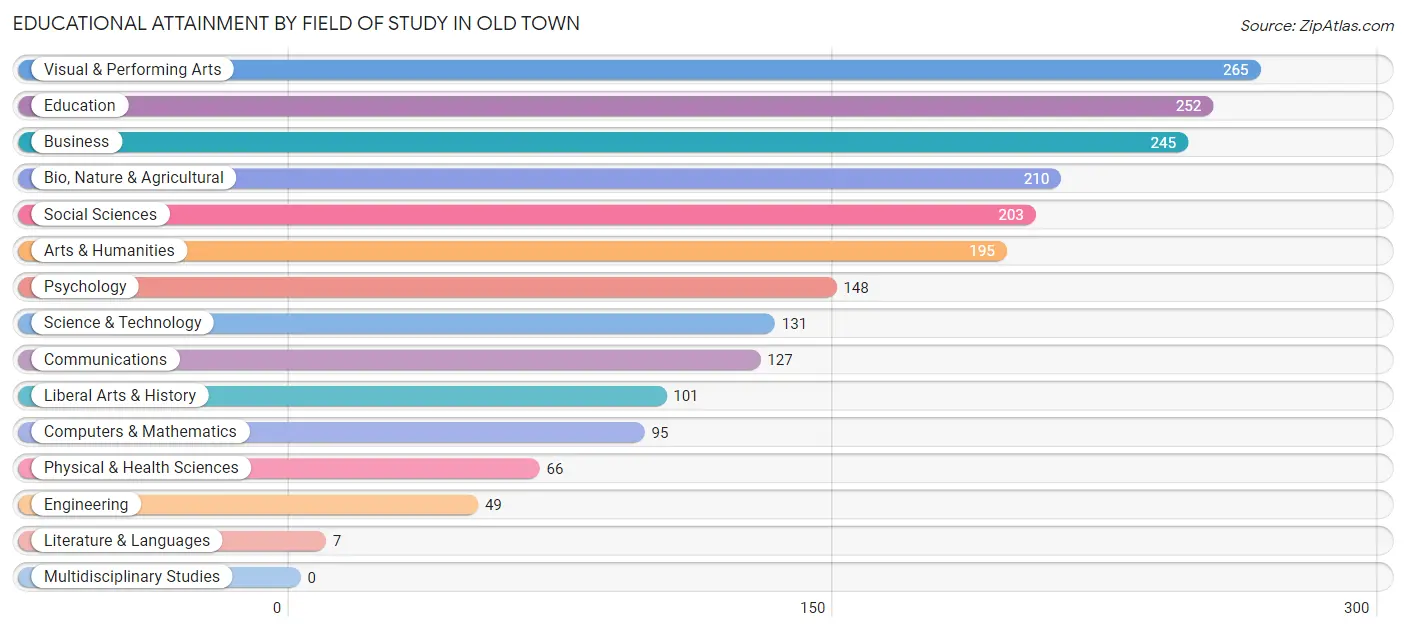
Visual & performing arts (265 | 12.7%), education (252 | 12.0%), business (245 | 11.7%), bio, nature & agricultural (210 | 10.0%), and social sciences (203 | 9.7%) are the most common fields of study among 2,094 individuals in Old Town who have obtained a bachelor's degree or higher.
| Field of Study | # Graduates | % Graduates |
| Computers & Mathematics | 95 | 4.5% |
| Bio, Nature & Agricultural | 210 | 10.0% |
| Physical & Health Sciences | 66 | 3.2% |
| Psychology | 148 | 7.1% |
| Social Sciences | 203 | 9.7% |
| Engineering | 49 | 2.3% |
| Multidisciplinary Studies | 0 | 0.0% |
| Science & Technology | 131 | 6.3% |
| Business | 245 | 11.7% |
| Education | 252 | 12.0% |
| Literature & Languages | 7 | 0.3% |
| Liberal Arts & History | 101 | 4.8% |
| Visual & Performing Arts | 265 | 12.7% |
| Communications | 127 | 6.1% |
| Arts & Humanities | 195 | 9.3% |
| Total | 2,094 | 100.0% |
Transportation & Commute in Old Town
Vehicle Availability by Sex in Old Town
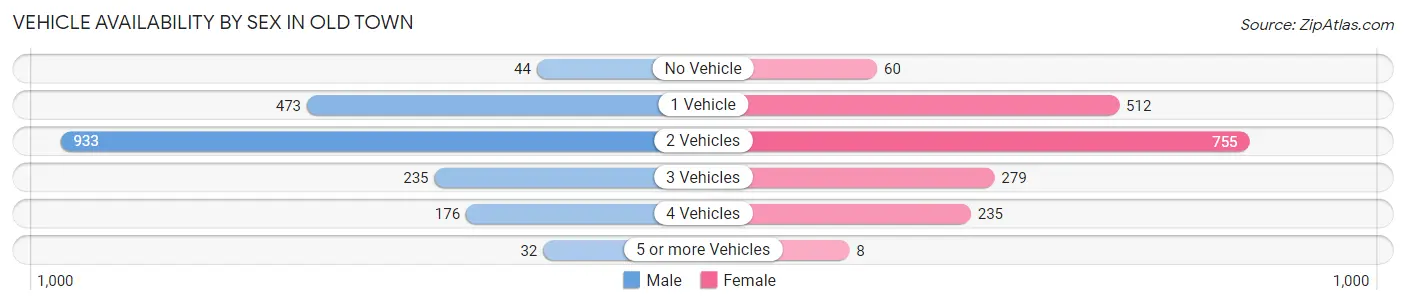
The most prevalent vehicle ownership categories in Old Town are males with 2 vehicles (933, accounting for 49.3%) and females with 2 vehicles (755, making up 50.5%).
| Vehicles Available | Male | Female |
| No Vehicle | 44 (2.3%) | 60 (3.2%) |
| 1 Vehicle | 473 (25.0%) | 512 (27.7%) |
| 2 Vehicles | 933 (49.3%) | 755 (40.8%) |
| 3 Vehicles | 235 (12.4%) | 279 (15.1%) |
| 4 Vehicles | 176 (9.3%) | 235 (12.7%) |
| 5 or more Vehicles | 32 (1.7%) | 8 (0.4%) |
| Total | 1,893 (100.0%) | 1,849 (100.0%) |
Commute Time in Old Town
The most frequently occuring commute durations in Old Town are 20 to 24 minutes (867 commuters, 27.8%), 10 to 14 minutes (582 commuters, 18.7%), and 5 to 9 minutes (406 commuters, 13.0%).
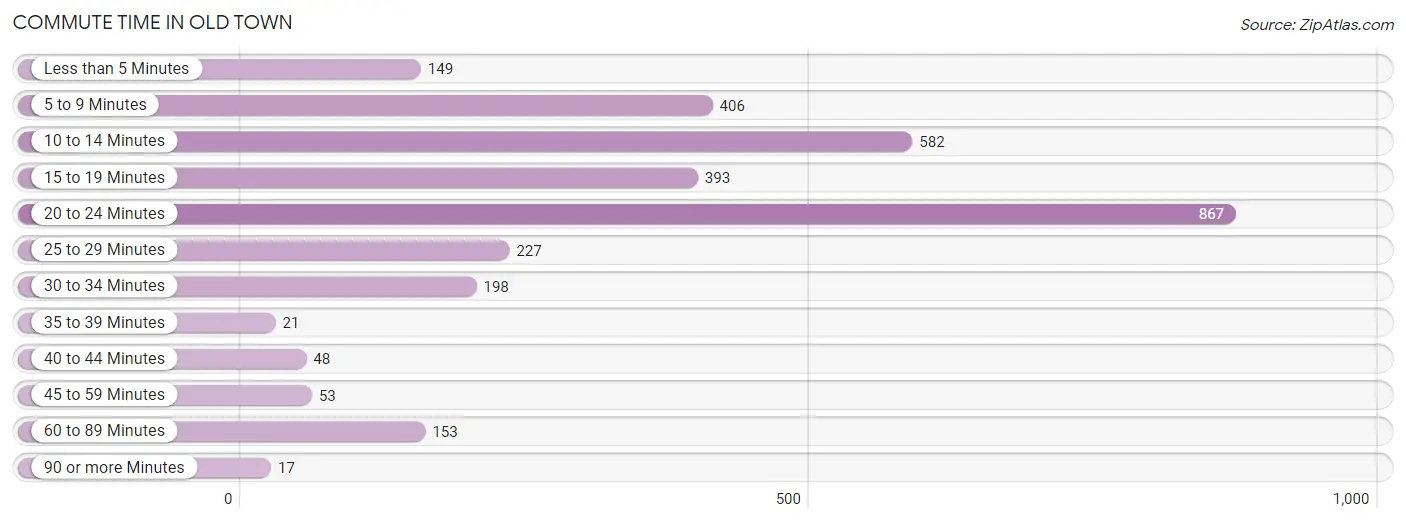
| Commute Time | # Commuters | % Commuters |
| Less than 5 Minutes | 149 | 4.8% |
| 5 to 9 Minutes | 406 | 13.0% |
| 10 to 14 Minutes | 582 | 18.7% |
| 15 to 19 Minutes | 393 | 12.6% |
| 20 to 24 Minutes | 867 | 27.8% |
| 25 to 29 Minutes | 227 | 7.3% |
| 30 to 34 Minutes | 198 | 6.4% |
| 35 to 39 Minutes | 21 | 0.7% |
| 40 to 44 Minutes | 48 | 1.5% |
| 45 to 59 Minutes | 53 | 1.7% |
| 60 to 89 Minutes | 153 | 4.9% |
| 90 or more Minutes | 17 | 0.5% |
Commute Time by Sex in Old Town
The most common commute times in Old Town are 20 to 24 minutes (462 commuters, 30.3%) for males and 20 to 24 minutes (405 commuters, 25.4%) for females.
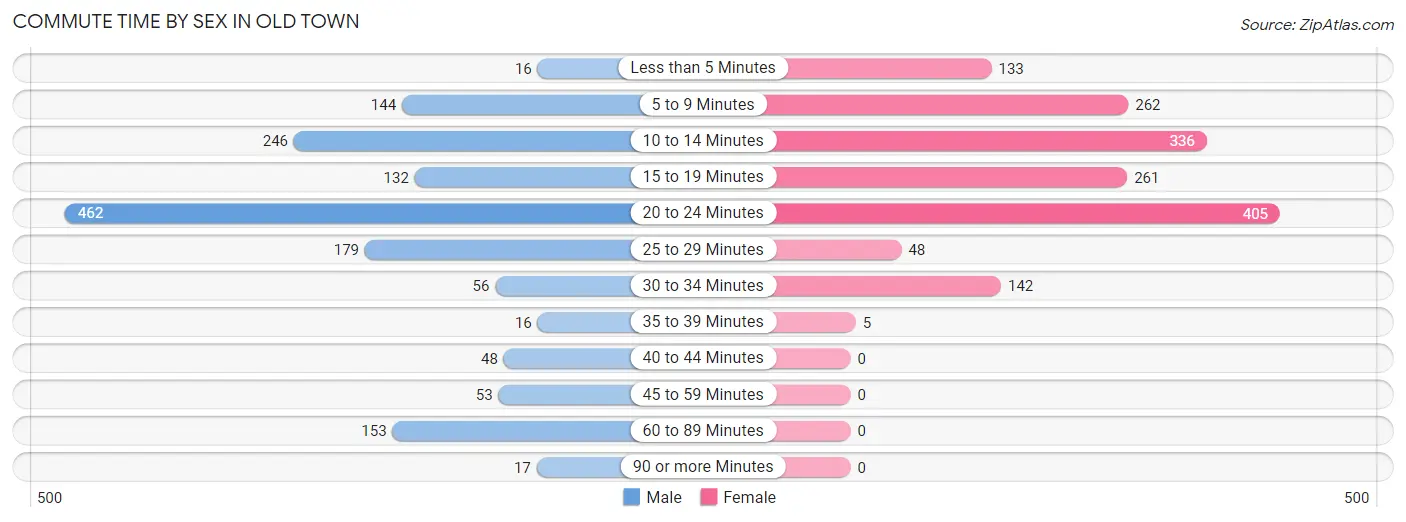
| Commute Time | Male | Female |
| Less than 5 Minutes | 16 (1.1%) | 133 (8.4%) |
| 5 to 9 Minutes | 144 (9.5%) | 262 (16.5%) |
| 10 to 14 Minutes | 246 (16.2%) | 336 (21.1%) |
| 15 to 19 Minutes | 132 (8.7%) | 261 (16.4%) |
| 20 to 24 Minutes | 462 (30.3%) | 405 (25.4%) |
| 25 to 29 Minutes | 179 (11.8%) | 48 (3.0%) |
| 30 to 34 Minutes | 56 (3.7%) | 142 (8.9%) |
| 35 to 39 Minutes | 16 (1.1%) | 5 (0.3%) |
| 40 to 44 Minutes | 48 (3.2%) | 0 (0.0%) |
| 45 to 59 Minutes | 53 (3.5%) | 0 (0.0%) |
| 60 to 89 Minutes | 153 (10.1%) | 0 (0.0%) |
| 90 or more Minutes | 17 (1.1%) | 0 (0.0%) |
Time of Departure to Work by Sex in Old Town
The most frequent times of departure to work in Old Town are 7:30 AM to 7:59 AM (270, 17.7%) for males and 7:30 AM to 7:59 AM (505, 31.7%) for females.
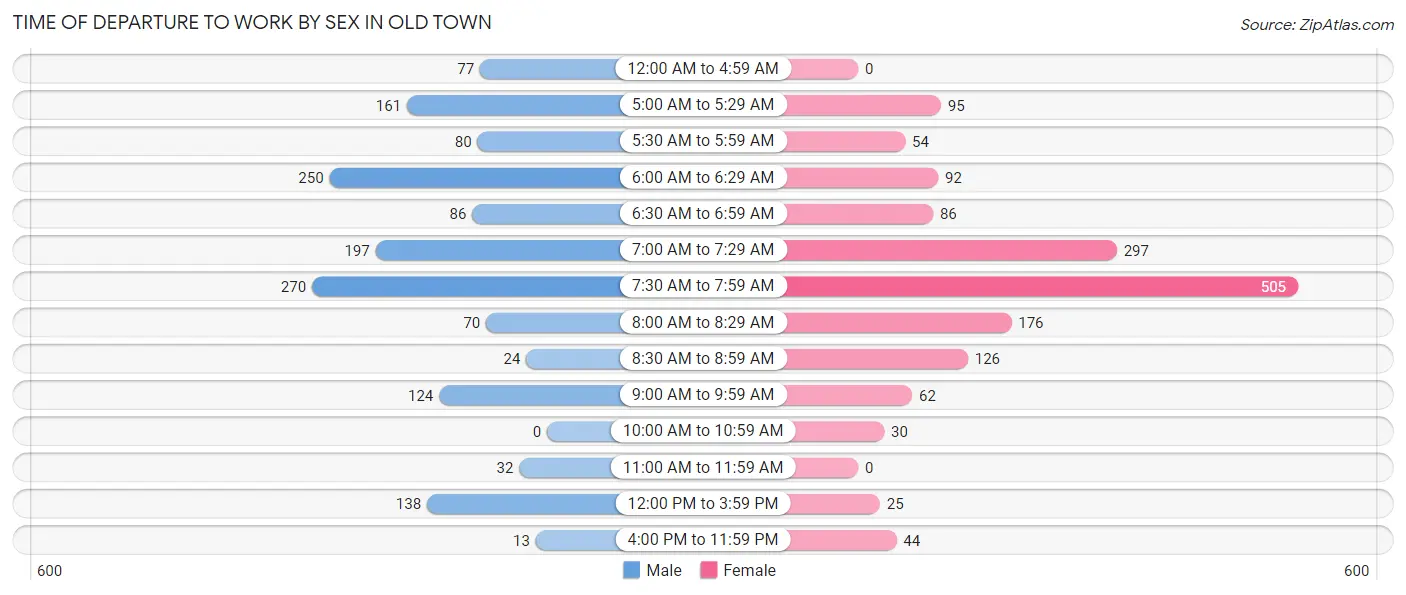
| Time of Departure | Male | Female |
| 12:00 AM to 4:59 AM | 77 (5.1%) | 0 (0.0%) |
| 5:00 AM to 5:29 AM | 161 (10.6%) | 95 (6.0%) |
| 5:30 AM to 5:59 AM | 80 (5.3%) | 54 (3.4%) |
| 6:00 AM to 6:29 AM | 250 (16.4%) | 92 (5.8%) |
| 6:30 AM to 6:59 AM | 86 (5.7%) | 86 (5.4%) |
| 7:00 AM to 7:29 AM | 197 (12.9%) | 297 (18.7%) |
| 7:30 AM to 7:59 AM | 270 (17.7%) | 505 (31.7%) |
| 8:00 AM to 8:29 AM | 70 (4.6%) | 176 (11.1%) |
| 8:30 AM to 8:59 AM | 24 (1.6%) | 126 (7.9%) |
| 9:00 AM to 9:59 AM | 124 (8.2%) | 62 (3.9%) |
| 10:00 AM to 10:59 AM | 0 (0.0%) | 30 (1.9%) |
| 11:00 AM to 11:59 AM | 32 (2.1%) | 0 (0.0%) |
| 12:00 PM to 3:59 PM | 138 (9.1%) | 25 (1.6%) |
| 4:00 PM to 11:59 PM | 13 (0.9%) | 44 (2.8%) |
| Total | 1,522 (100.0%) | 1,592 (100.0%) |
Housing Occupancy in Old Town
Occupancy by Ownership in Old Town
Of the total 3,145 dwellings in Old Town, owner-occupied units account for 1,702 (54.1%), while renter-occupied units make up 1,443 (45.9%).
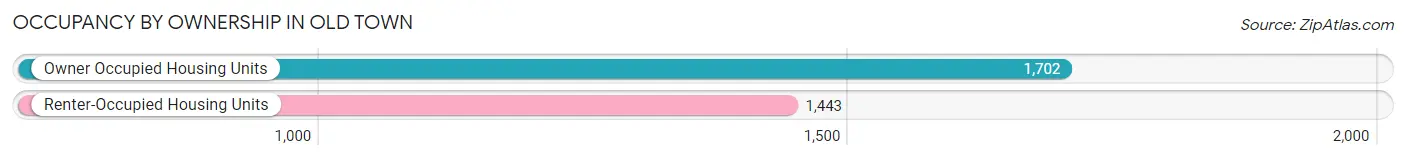
| Occupancy | # Housing Units | % Housing Units |
| Owner Occupied Housing Units | 1,702 | 54.1% |
| Renter-Occupied Housing Units | 1,443 | 45.9% |
| Total Occupied Housing Units | 3,145 | 100.0% |
Occupancy by Household Size in Old Town
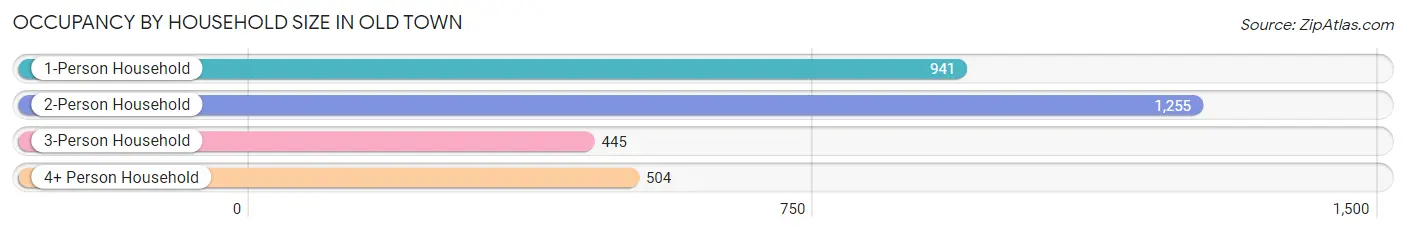
| Household Size | # Housing Units | % Housing Units |
| 1-Person Household | 941 | 29.9% |
| 2-Person Household | 1,255 | 39.9% |
| 3-Person Household | 445 | 14.1% |
| 4+ Person Household | 504 | 16.0% |
| Total Housing Units | 3,145 | 100.0% |
Occupancy by Ownership by Household Size in Old Town
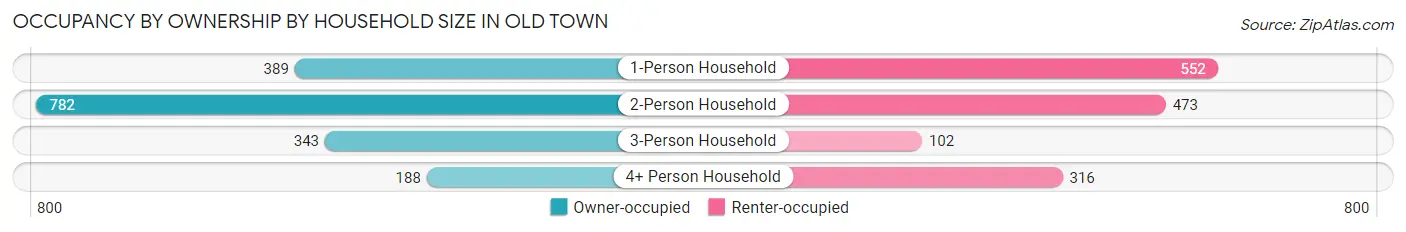
| Household Size | Owner-occupied | Renter-occupied |
| 1-Person Household | 389 (41.3%) | 552 (58.7%) |
| 2-Person Household | 782 (62.3%) | 473 (37.7%) |
| 3-Person Household | 343 (77.1%) | 102 (22.9%) |
| 4+ Person Household | 188 (37.3%) | 316 (62.7%) |
| Total Housing Units | 1,702 (54.1%) | 1,443 (45.9%) |
Occupancy by Educational Attainment in Old Town
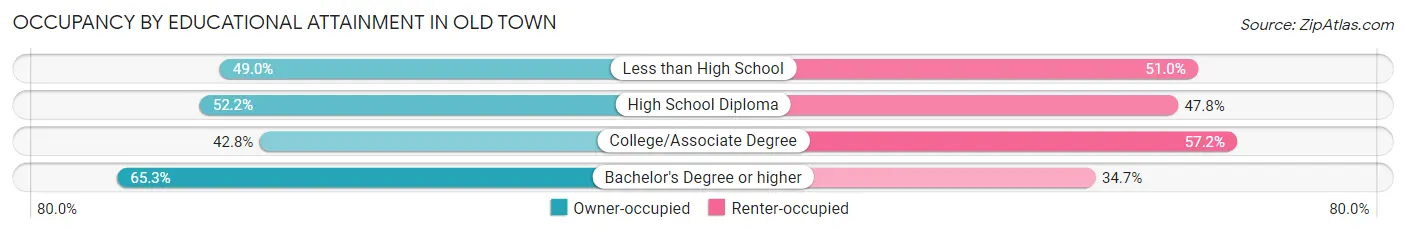
| Household Size | Owner-occupied | Renter-occupied |
| Less than High School | 25 (49.0%) | 26 (51.0%) |
| High School Diploma | 402 (52.2%) | 368 (47.8%) |
| College/Associate Degree | 461 (42.8%) | 616 (57.2%) |
| Bachelor's Degree or higher | 814 (65.3%) | 433 (34.7%) |
Occupancy by Age of Householder in Old Town
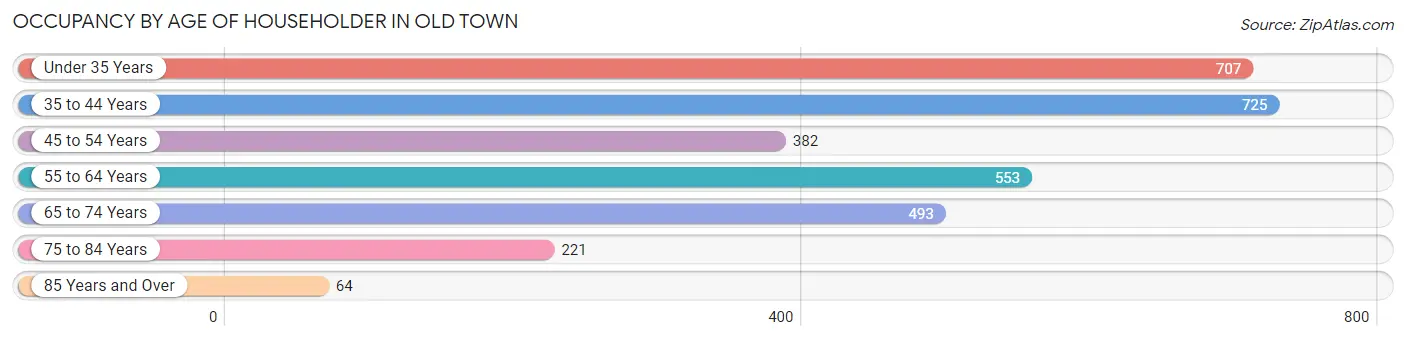
| Age Bracket | # Households | % Households |
| Under 35 Years | 707 | 22.5% |
| 35 to 44 Years | 725 | 23.1% |
| 45 to 54 Years | 382 | 12.1% |
| 55 to 64 Years | 553 | 17.6% |
| 65 to 74 Years | 493 | 15.7% |
| 75 to 84 Years | 221 | 7.0% |
| 85 Years and Over | 64 | 2.0% |
| Total | 3,145 | 100.0% |
Housing Finances in Old Town
Median Income by Occupancy in Old Town
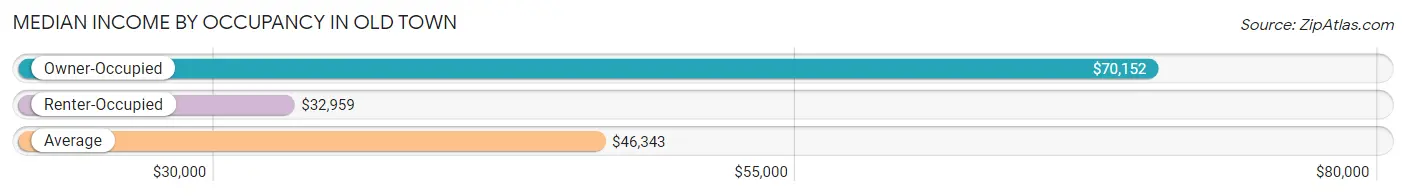
| Occupancy Type | # Households | Median Income |
| Owner-Occupied | 1,702 (54.1%) | $70,152 |
| Renter-Occupied | 1,443 (45.9%) | $32,959 |
| Average | 3,145 (100.0%) | $46,343 |
Occupancy by Householder Income Bracket in Old Town
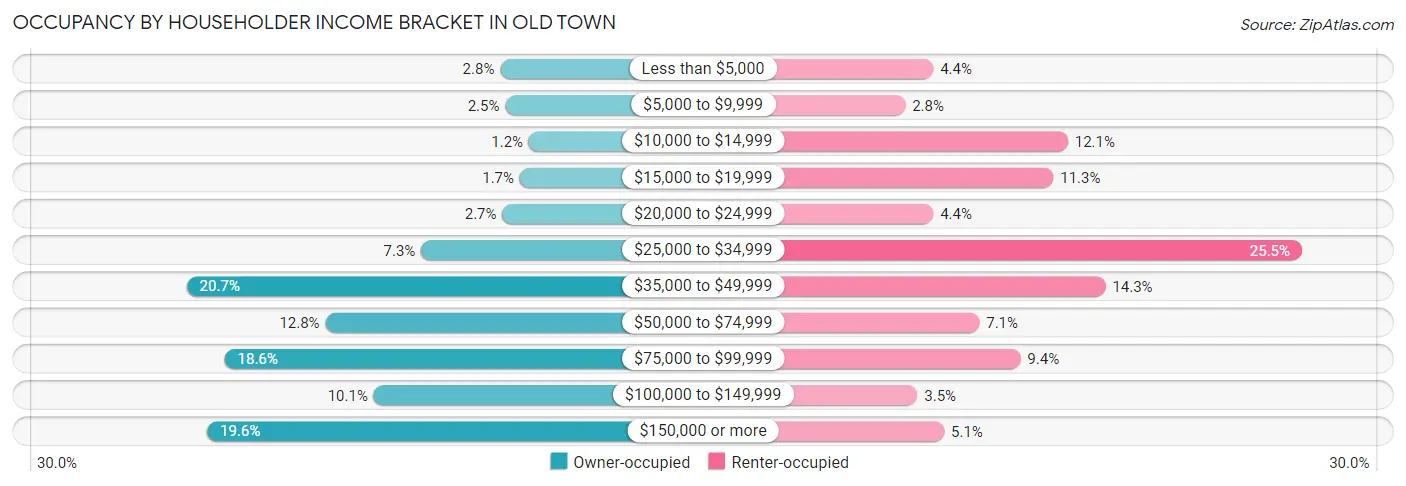
| Income Bracket | Owner-occupied | Renter-occupied |
| Less than $5,000 | 48 (2.8%) | 64 (4.4%) |
| $5,000 to $9,999 | 43 (2.5%) | 41 (2.8%) |
| $10,000 to $14,999 | 20 (1.2%) | 175 (12.1%) |
| $15,000 to $19,999 | 29 (1.7%) | 163 (11.3%) |
| $20,000 to $24,999 | 46 (2.7%) | 64 (4.4%) |
| $25,000 to $34,999 | 125 (7.3%) | 368 (25.5%) |
| $35,000 to $49,999 | 353 (20.7%) | 206 (14.3%) |
| $50,000 to $74,999 | 218 (12.8%) | 102 (7.1%) |
| $75,000 to $99,999 | 316 (18.6%) | 136 (9.4%) |
| $100,000 to $149,999 | 171 (10.1%) | 51 (3.5%) |
| $150,000 or more | 333 (19.6%) | 73 (5.1%) |
| Total | 1,702 (100.0%) | 1,443 (100.0%) |
Monthly Housing Cost Tiers in Old Town
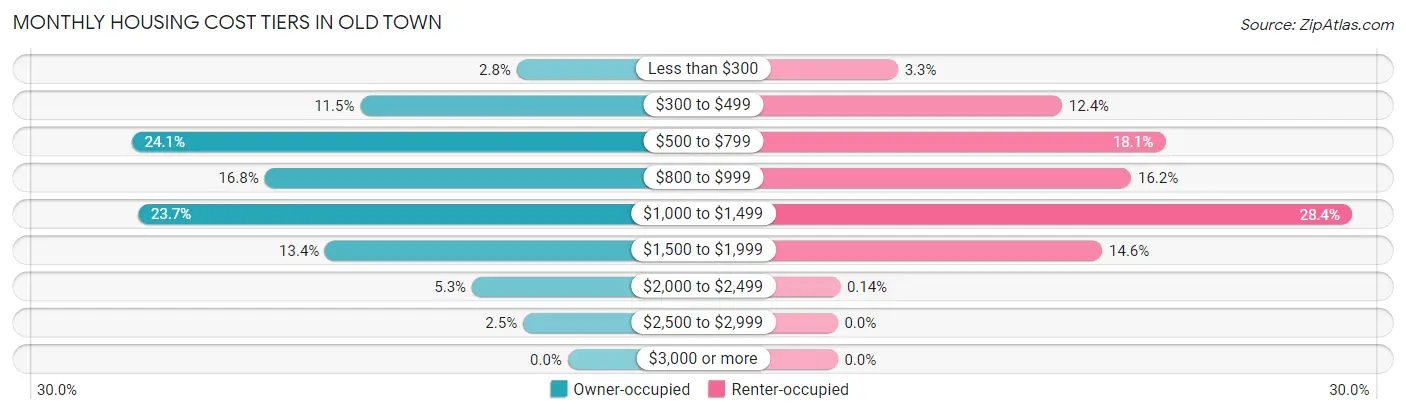
| Monthly Cost | Owner-occupied | Renter-occupied |
| Less than $300 | 48 (2.8%) | 48 (3.3%) |
| $300 to $499 | 195 (11.5%) | 179 (12.4%) |
| $500 to $799 | 410 (24.1%) | 261 (18.1%) |
| $800 to $999 | 285 (16.8%) | 234 (16.2%) |
| $1,000 to $1,499 | 404 (23.7%) | 410 (28.4%) |
| $1,500 to $1,999 | 228 (13.4%) | 211 (14.6%) |
| $2,000 to $2,499 | 90 (5.3%) | 2 (0.1%) |
| $2,500 to $2,999 | 42 (2.5%) | 0 (0.0%) |
| $3,000 or more | 0 (0.0%) | 0 (0.0%) |
| Total | 1,702 (100.0%) | 1,443 (100.0%) |
Physical Housing Characteristics in Old Town
Housing Structures in Old Town
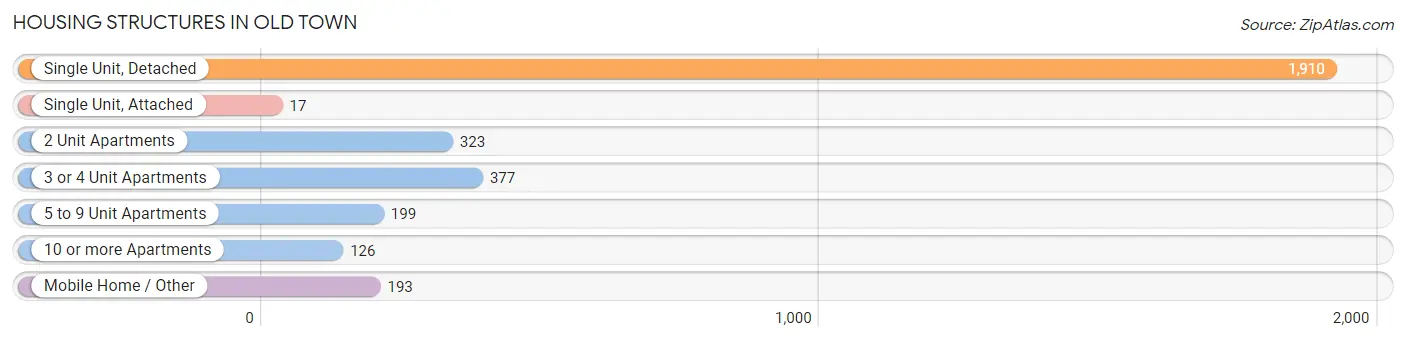
| Structure Type | # Housing Units | % Housing Units |
| Single Unit, Detached | 1,910 | 60.7% |
| Single Unit, Attached | 17 | 0.5% |
| 2 Unit Apartments | 323 | 10.3% |
| 3 or 4 Unit Apartments | 377 | 12.0% |
| 5 to 9 Unit Apartments | 199 | 6.3% |
| 10 or more Apartments | 126 | 4.0% |
| Mobile Home / Other | 193 | 6.1% |
| Total | 3,145 | 100.0% |
Housing Structures by Occupancy in Old Town
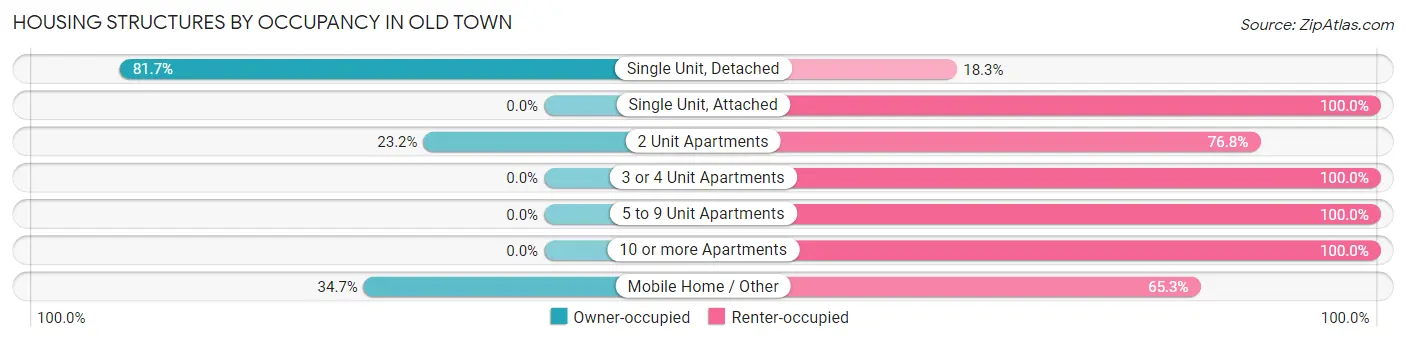
| Structure Type | Owner-occupied | Renter-occupied |
| Single Unit, Detached | 1,560 (81.7%) | 350 (18.3%) |
| Single Unit, Attached | 0 (0.0%) | 17 (100.0%) |
| 2 Unit Apartments | 75 (23.2%) | 248 (76.8%) |
| 3 or 4 Unit Apartments | 0 (0.0%) | 377 (100.0%) |
| 5 to 9 Unit Apartments | 0 (0.0%) | 199 (100.0%) |
| 10 or more Apartments | 0 (0.0%) | 126 (100.0%) |
| Mobile Home / Other | 67 (34.7%) | 126 (65.3%) |
| Total | 1,702 (54.1%) | 1,443 (45.9%) |
Housing Structures by Number of Rooms in Old Town
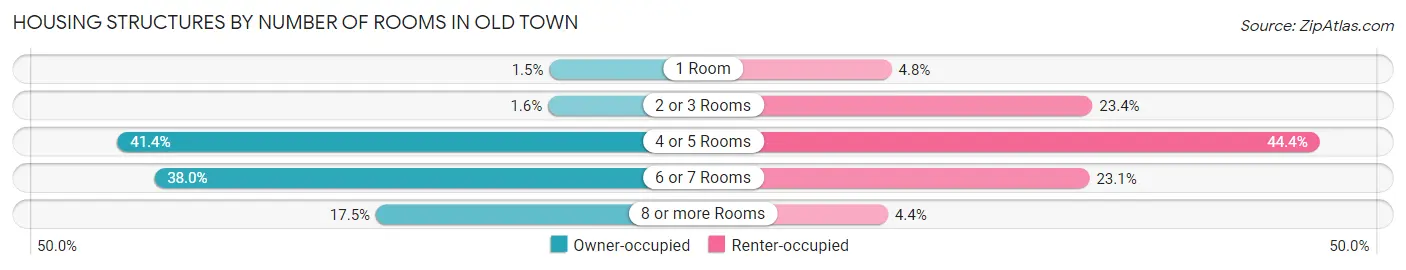
| Number of Rooms | Owner-occupied | Renter-occupied |
| 1 Room | 25 (1.5%) | 69 (4.8%) |
| 2 or 3 Rooms | 27 (1.6%) | 337 (23.4%) |
| 4 or 5 Rooms | 705 (41.4%) | 640 (44.4%) |
| 6 or 7 Rooms | 647 (38.0%) | 333 (23.1%) |
| 8 or more Rooms | 298 (17.5%) | 64 (4.4%) |
| Total | 1,702 (100.0%) | 1,443 (100.0%) |
Housing Structure by Heating Type in Old Town
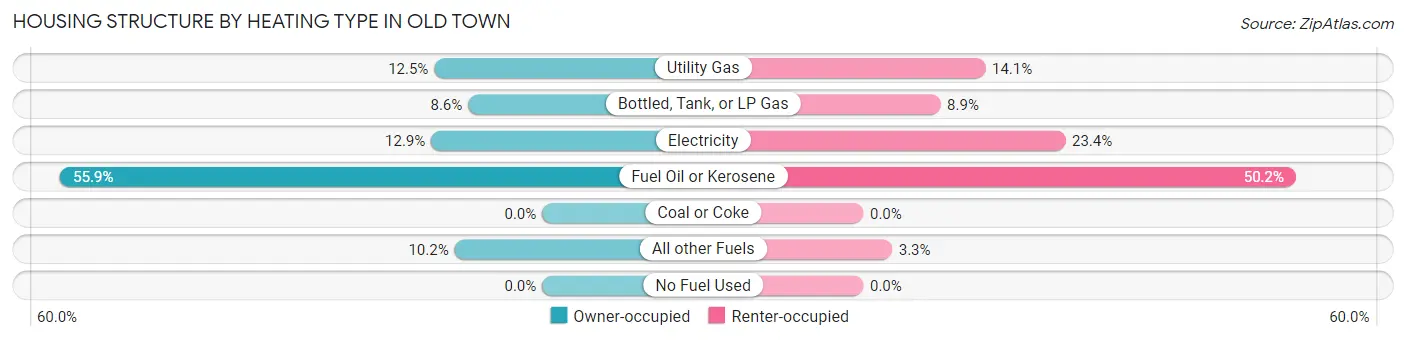
| Heating Type | Owner-occupied | Renter-occupied |
| Utility Gas | 213 (12.5%) | 204 (14.1%) |
| Bottled, Tank, or LP Gas | 146 (8.6%) | 129 (8.9%) |
| Electricity | 219 (12.9%) | 338 (23.4%) |
| Fuel Oil or Kerosene | 951 (55.9%) | 724 (50.2%) |
| Coal or Coke | 0 (0.0%) | 0 (0.0%) |
| All other Fuels | 173 (10.2%) | 48 (3.3%) |
| No Fuel Used | 0 (0.0%) | 0 (0.0%) |
| Total | 1,702 (100.0%) | 1,443 (100.0%) |
Household Vehicle Usage in Old Town
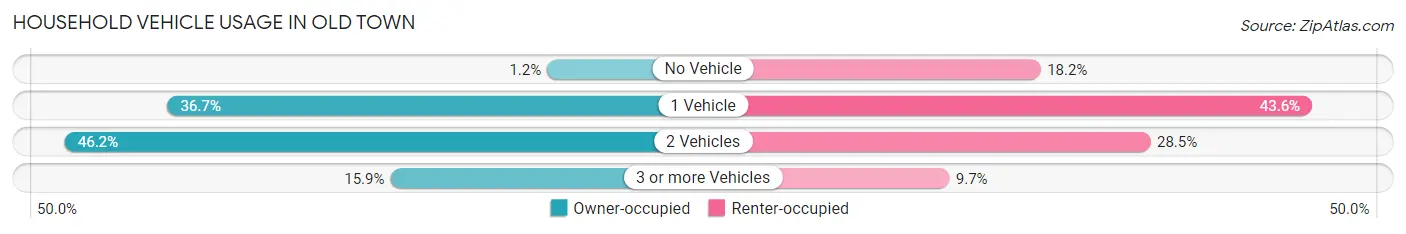
| Vehicles per Household | Owner-occupied | Renter-occupied |
| No Vehicle | 21 (1.2%) | 263 (18.2%) |
| 1 Vehicle | 624 (36.7%) | 629 (43.6%) |
| 2 Vehicles | 787 (46.2%) | 411 (28.5%) |
| 3 or more Vehicles | 270 (15.9%) | 140 (9.7%) |
| Total | 1,702 (100.0%) | 1,443 (100.0%) |
Real Estate & Mortgages in Old Town
Real Estate and Mortgage Overview in Old Town
| Characteristic | Without Mortgage | With Mortgage |
| Housing Units | 776 | 926 |
| Median Property Value | $182,100 | $157,800 |
| Median Household Income | $57,616 | $249 |
| Monthly Housing Costs | $651 | $0 |
| Real Estate Taxes | $3,191 | $0 |
Property Value by Mortgage Status in Old Town
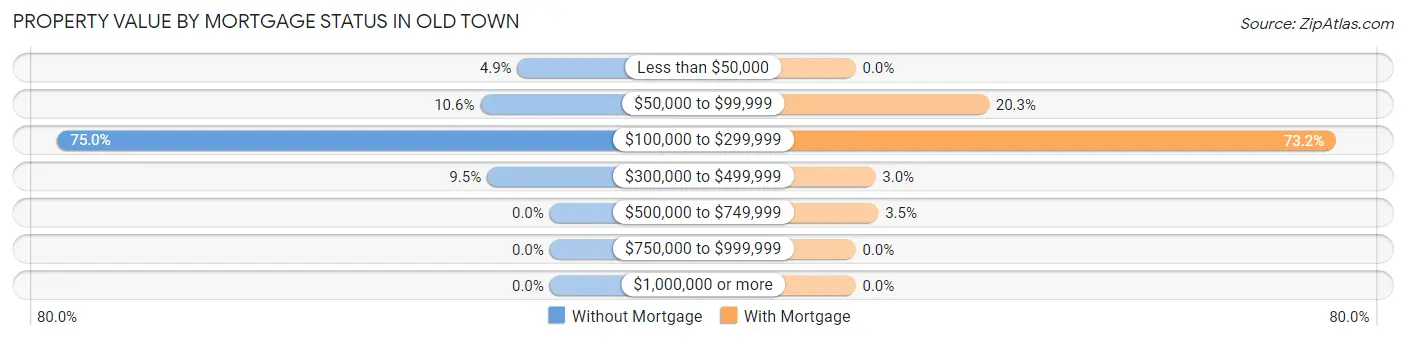
| Property Value | Without Mortgage | With Mortgage |
| Less than $50,000 | 38 (4.9%) | 0 (0.0%) |
| $50,000 to $99,999 | 82 (10.6%) | 188 (20.3%) |
| $100,000 to $299,999 | 582 (75.0%) | 678 (73.2%) |
| $300,000 to $499,999 | 74 (9.5%) | 28 (3.0%) |
| $500,000 to $749,999 | 0 (0.0%) | 32 (3.5%) |
| $750,000 to $999,999 | 0 (0.0%) | 0 (0.0%) |
| $1,000,000 or more | 0 (0.0%) | 0 (0.0%) |
| Total | 776 (100.0%) | 926 (100.0%) |
Household Income by Mortgage Status in Old Town
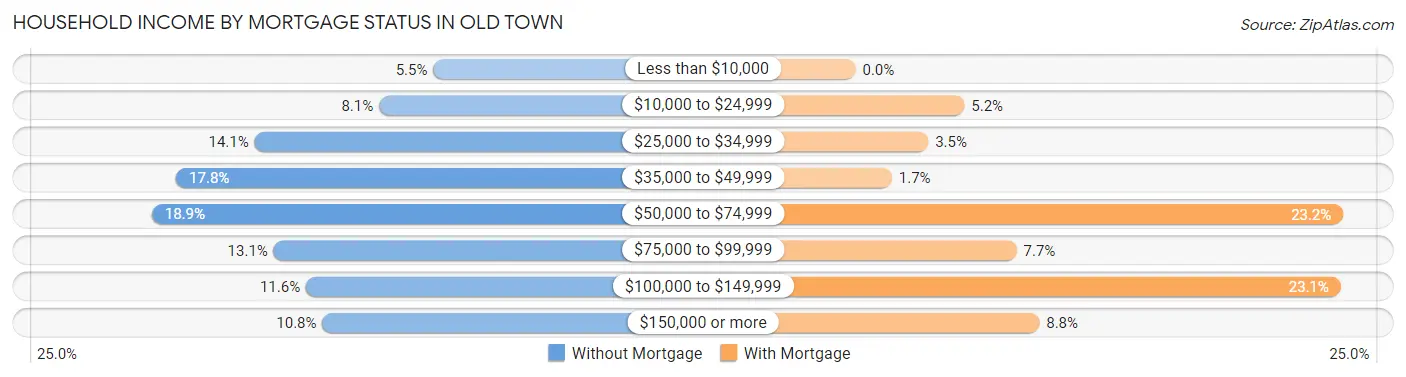
| Household Income | Without Mortgage | With Mortgage |
| Less than $10,000 | 43 (5.5%) | 0 (0.0%) |
| $10,000 to $24,999 | 63 (8.1%) | 48 (5.2%) |
| $25,000 to $34,999 | 109 (14.1%) | 32 (3.5%) |
| $35,000 to $49,999 | 138 (17.8%) | 16 (1.7%) |
| $50,000 to $74,999 | 147 (18.9%) | 215 (23.2%) |
| $75,000 to $99,999 | 102 (13.1%) | 71 (7.7%) |
| $100,000 to $149,999 | 90 (11.6%) | 214 (23.1%) |
| $150,000 or more | 84 (10.8%) | 81 (8.7%) |
| Total | 776 (100.0%) | 926 (100.0%) |
Property Value to Household Income Ratio in Old Town
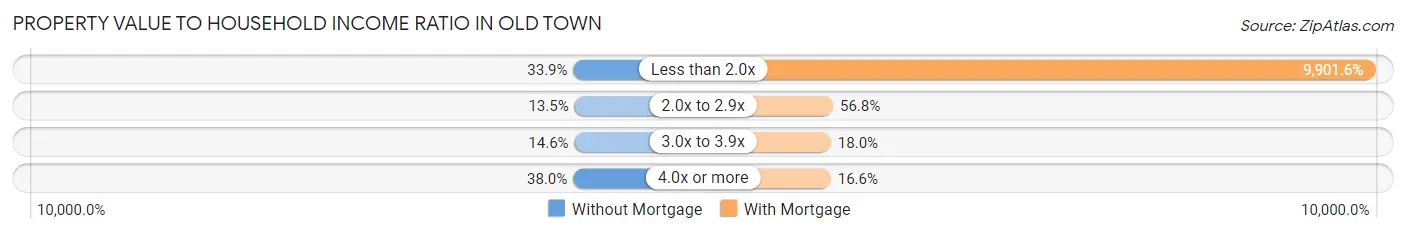
| Value-to-Income Ratio | Without Mortgage | With Mortgage |
| Less than 2.0x | 263 (33.9%) | 91,689 (9,901.6%) |
| 2.0x to 2.9x | 105 (13.5%) | 526 (56.8%) |
| 3.0x to 3.9x | 113 (14.6%) | 167 (18.0%) |
| 4.0x or more | 295 (38.0%) | 154 (16.6%) |
| Total | 776 (100.0%) | 926 (100.0%) |
Real Estate Taxes by Mortgage Status in Old Town
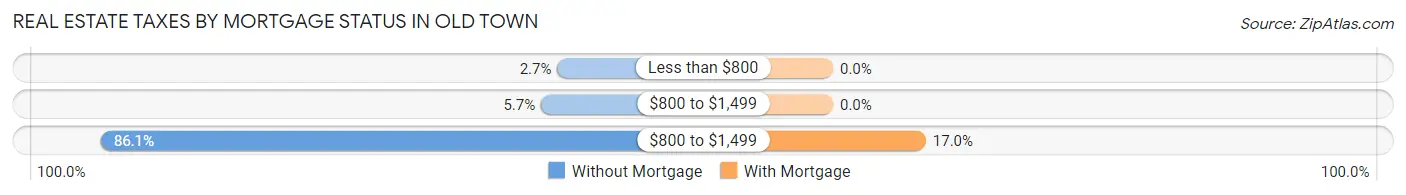
| Property Taxes | Without Mortgage | With Mortgage |
| Less than $800 | 21 (2.7%) | 0 (0.0%) |
| $800 to $1,499 | 44 (5.7%) | 0 (0.0%) |
| $800 to $1,499 | 668 (86.1%) | 157 (17.0%) |
| Total | 776 (100.0%) | 926 (100.0%) |
Health & Disability in Old Town
Health Insurance Coverage by Age in Old Town
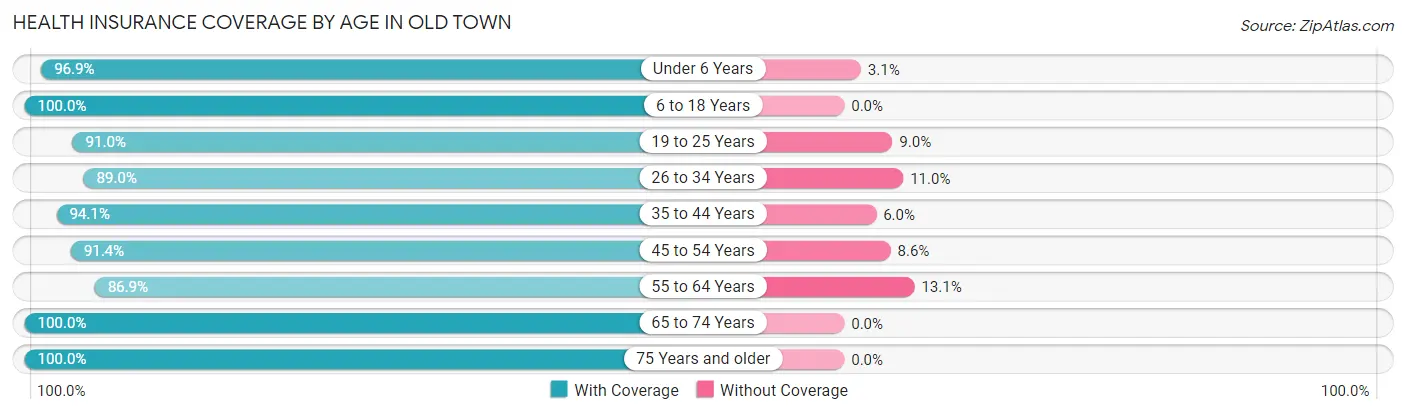
| Age Bracket | With Coverage | Without Coverage |
| Under 6 Years | 562 (96.9%) | 18 (3.1%) |
| 6 to 18 Years | 777 (100.0%) | 0 (0.0%) |
| 19 to 25 Years | 974 (91.0%) | 96 (9.0%) |
| 26 to 34 Years | 713 (89.0%) | 88 (11.0%) |
| 35 to 44 Years | 1,185 (94.1%) | 75 (5.9%) |
| 45 to 54 Years | 699 (91.4%) | 66 (8.6%) |
| 55 to 64 Years | 810 (86.9%) | 122 (13.1%) |
| 65 to 74 Years | 813 (100.0%) | 0 (0.0%) |
| 75 Years and older | 436 (100.0%) | 0 (0.0%) |
| Total | 6,969 (93.7%) | 465 (6.3%) |
Health Insurance Coverage by Citizenship Status in Old Town
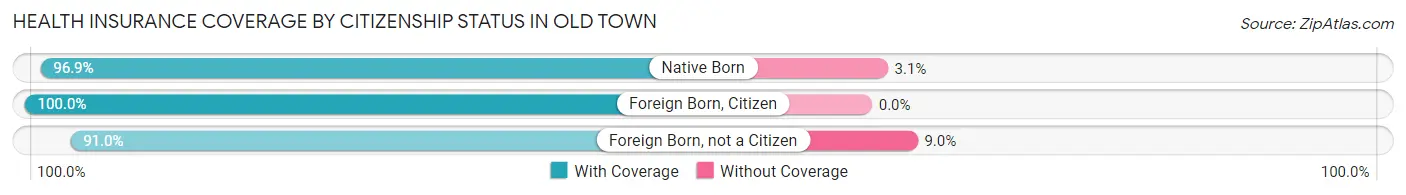
| Citizenship Status | With Coverage | Without Coverage |
| Native Born | 562 (96.9%) | 18 (3.1%) |
| Foreign Born, Citizen | 777 (100.0%) | 0 (0.0%) |
| Foreign Born, not a Citizen | 974 (91.0%) | 96 (9.0%) |
Health Insurance Coverage by Household Income in Old Town
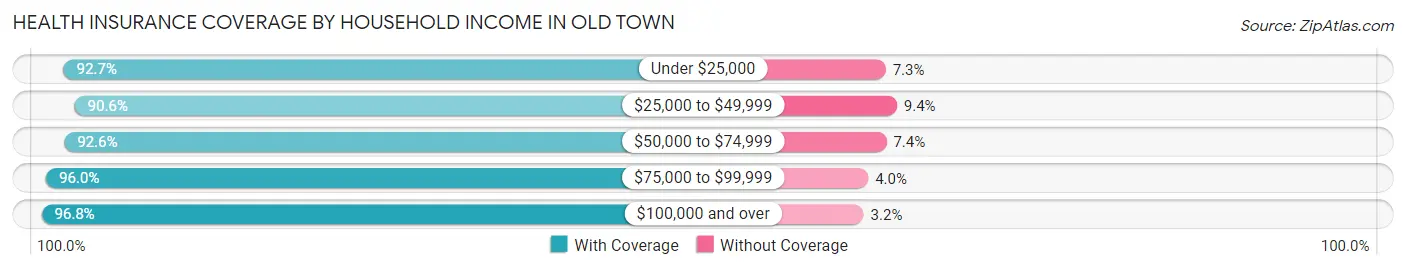
| Household Income | With Coverage | Without Coverage |
| Under $25,000 | 1,105 (92.7%) | 87 (7.3%) |
| $25,000 to $49,999 | 2,030 (90.6%) | 210 (9.4%) |
| $50,000 to $74,999 | 673 (92.6%) | 54 (7.4%) |
| $75,000 to $99,999 | 1,195 (96.0%) | 50 (4.0%) |
| $100,000 and over | 1,964 (96.8%) | 64 (3.2%) |
Public vs Private Health Insurance Coverage by Age in Old Town
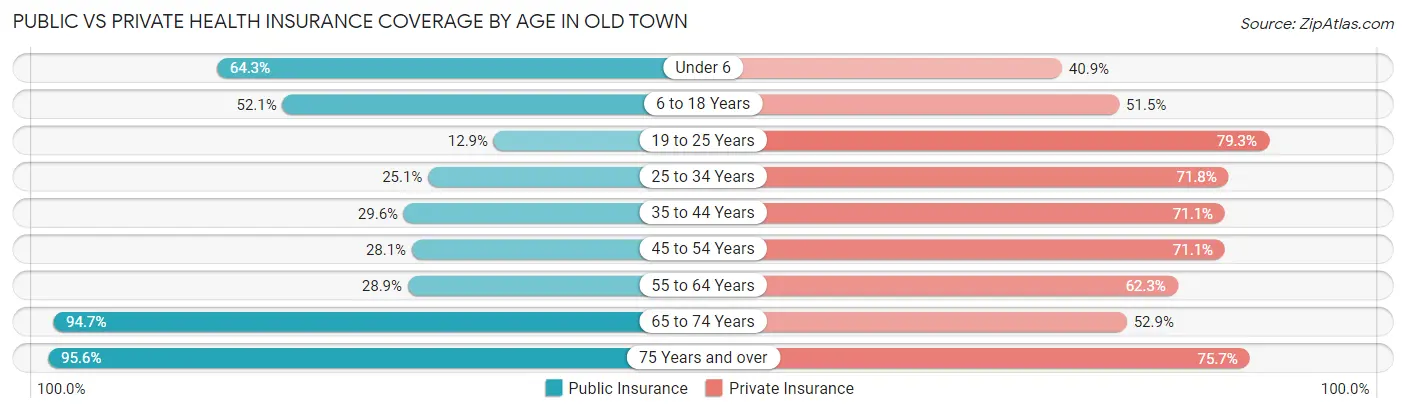
| Age Bracket | Public Insurance | Private Insurance |
| Under 6 | 373 (64.3%) | 237 (40.9%) |
| 6 to 18 Years | 405 (52.1%) | 400 (51.5%) |
| 19 to 25 Years | 138 (12.9%) | 848 (79.2%) |
| 25 to 34 Years | 201 (25.1%) | 575 (71.8%) |
| 35 to 44 Years | 373 (29.6%) | 896 (71.1%) |
| 45 to 54 Years | 215 (28.1%) | 544 (71.1%) |
| 55 to 64 Years | 269 (28.9%) | 581 (62.3%) |
| 65 to 74 Years | 770 (94.7%) | 430 (52.9%) |
| 75 Years and over | 417 (95.6%) | 330 (75.7%) |
| Total | 3,161 (42.5%) | 4,841 (65.1%) |
Disability Status by Sex by Age in Old Town
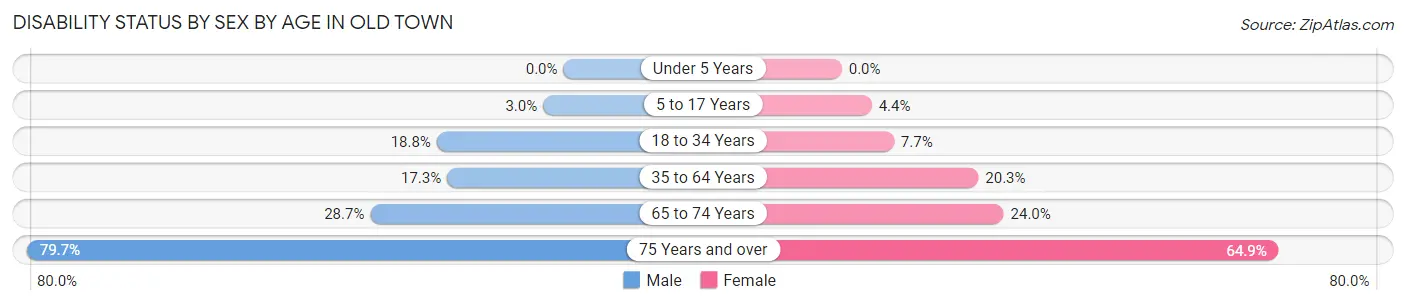
| Age Bracket | Male | Female |
| Under 5 Years | 0 (0.0%) | 0 (0.0%) |
| 5 to 17 Years | 11 (3.0%) | 20 (4.4%) |
| 18 to 34 Years | 190 (18.8%) | 69 (7.7%) |
| 35 to 64 Years | 262 (17.3%) | 292 (20.3%) |
| 65 to 74 Years | 115 (28.7%) | 99 (24.0%) |
| 75 Years and over | 98 (79.7%) | 203 (64.9%) |
Disability Class by Sex by Age in Old Town
Disability Class: Hearing Difficulty
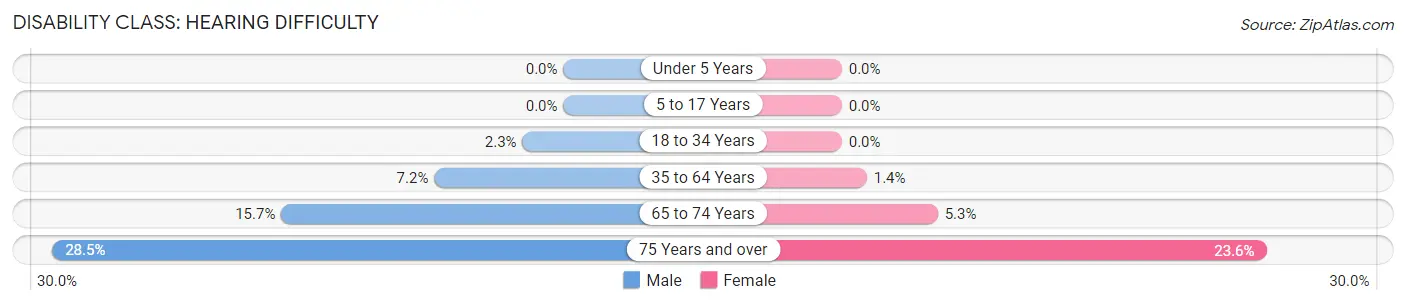
| Age Bracket | Male | Female |
| Under 5 Years | 0 (0.0%) | 0 (0.0%) |
| 5 to 17 Years | 0 (0.0%) | 0 (0.0%) |
| 18 to 34 Years | 23 (2.3%) | 0 (0.0%) |
| 35 to 64 Years | 109 (7.2%) | 20 (1.4%) |
| 65 to 74 Years | 63 (15.7%) | 22 (5.3%) |
| 75 Years and over | 35 (28.5%) | 74 (23.6%) |
Disability Class: Vision Difficulty
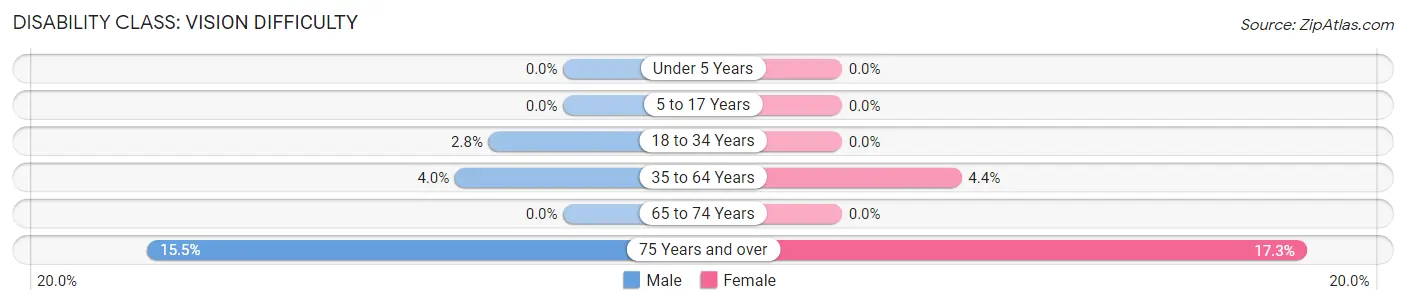
| Age Bracket | Male | Female |
| Under 5 Years | 0 (0.0%) | 0 (0.0%) |
| 5 to 17 Years | 0 (0.0%) | 0 (0.0%) |
| 18 to 34 Years | 28 (2.8%) | 0 (0.0%) |
| 35 to 64 Years | 61 (4.0%) | 64 (4.4%) |
| 65 to 74 Years | 0 (0.0%) | 0 (0.0%) |
| 75 Years and over | 19 (15.4%) | 54 (17.2%) |
Disability Class: Cognitive Difficulty
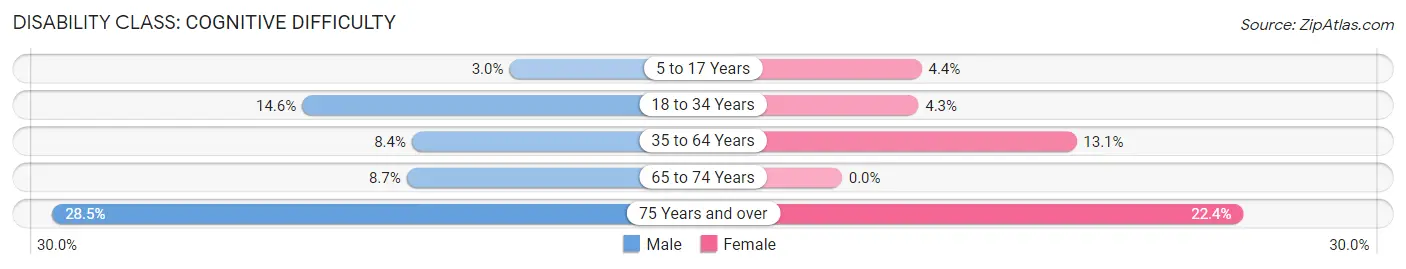
| Age Bracket | Male | Female |
| 5 to 17 Years | 11 (3.0%) | 20 (4.4%) |
| 18 to 34 Years | 147 (14.5%) | 38 (4.3%) |
| 35 to 64 Years | 128 (8.4%) | 188 (13.1%) |
| 65 to 74 Years | 35 (8.7%) | 0 (0.0%) |
| 75 Years and over | 35 (28.5%) | 70 (22.4%) |
Disability Class: Ambulatory Difficulty
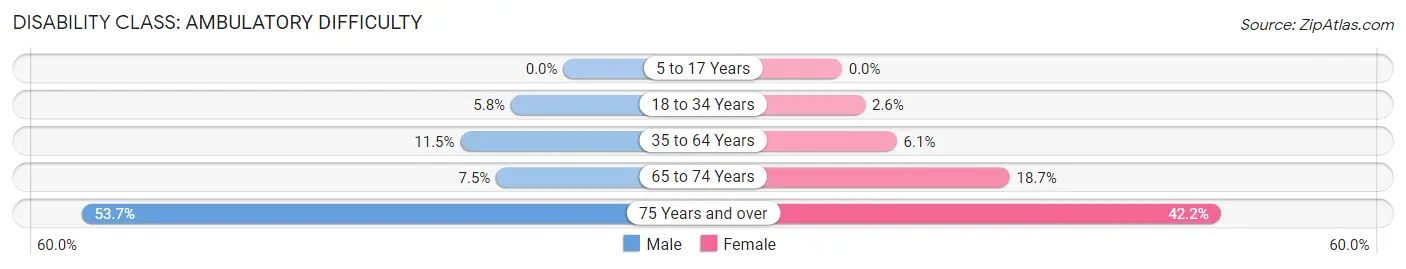
| Age Bracket | Male | Female |
| 5 to 17 Years | 0 (0.0%) | 0 (0.0%) |
| 18 to 34 Years | 59 (5.8%) | 23 (2.6%) |
| 35 to 64 Years | 174 (11.5%) | 88 (6.1%) |
| 65 to 74 Years | 30 (7.5%) | 77 (18.7%) |
| 75 Years and over | 66 (53.7%) | 132 (42.2%) |
Disability Class: Self-Care Difficulty
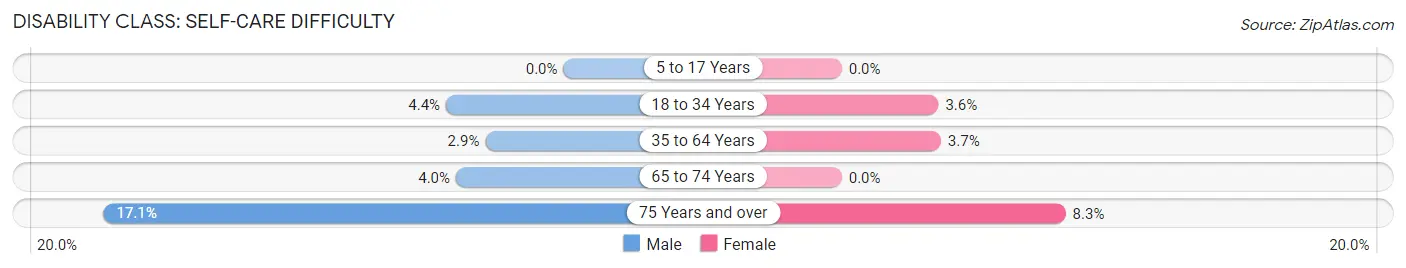
| Age Bracket | Male | Female |
| 5 to 17 Years | 0 (0.0%) | 0 (0.0%) |
| 18 to 34 Years | 44 (4.4%) | 32 (3.6%) |
| 35 to 64 Years | 44 (2.9%) | 53 (3.7%) |
| 65 to 74 Years | 16 (4.0%) | 0 (0.0%) |
| 75 Years and over | 21 (17.1%) | 26 (8.3%) |
Technology Access in Old Town
Computing Device Access in Old Town
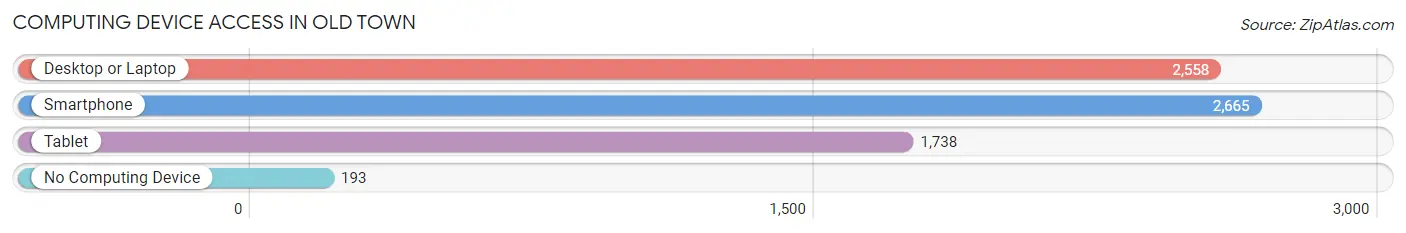
| Device Type | # Households | % Households |
| Desktop or Laptop | 2,558 | 81.3% |
| Smartphone | 2,665 | 84.7% |
| Tablet | 1,738 | 55.3% |
| No Computing Device | 193 | 6.1% |
| Total | 3,145 | 100.0% |
Internet Access in Old Town
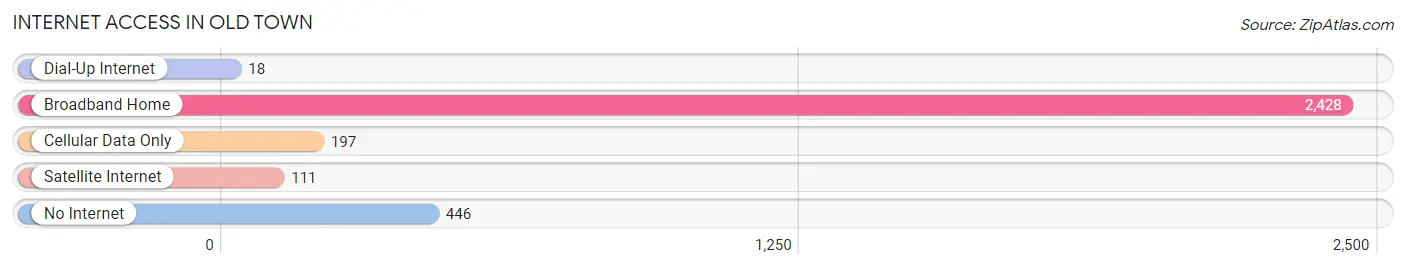
| Internet Type | # Households | % Households |
| Dial-Up Internet | 18 | 0.6% |
| Broadband Home | 2,428 | 77.2% |
| Cellular Data Only | 197 | 6.3% |
| Satellite Internet | 111 | 3.5% |
| No Internet | 446 | 14.2% |
| Total | 3,145 | 100.0% |
Old Town Summary
Old Town, Maine is a city located in Penobscot County, Maine, United States. It is situated on the Penobscot River, which is the largest river in Maine. The city is the county seat of Penobscot County and is the largest city in the county. As of the 2010 census, the city had a population of 8,277.
History
Old Town was first settled in 1774 by a group of settlers from Massachusetts. The settlers named the town after the old town of Plymouth, Massachusetts. The town was incorporated in 1796 and was the first town in Penobscot County.
In the early 19th century, Old Town was a major lumbering center. The lumber industry was the main source of income for the town and the surrounding area. The lumber industry was so important to the town that it was nicknamed “Lumbertown”.
In the late 19th century, Old Town began to diversify its economy. The city became a major center for the production of paper and paper products. The city also became a major center for the production of furniture and other wood products.
In the early 20th century, Old Town was a major center for the production of boats and canoes. The city was also a major center for the production of shoes and leather goods.
Geography
Old Town is located at 44°55′N 68°44′W (44.917, -68.737). The city is situated on the Penobscot River, which is the largest river in Maine. The city is located in the northern part of Penobscot County and is the county seat.
The city has a total area of 11.2 square miles, of which 10.9 square miles is land and 0.3 square miles is water. The city is located in a hilly area and is surrounded by forests.
Economy
Old Town’s economy is largely based on the lumber and paper industries. The city is home to several paper mills, including the Old Town Fuel & Fiber mill, which is the largest paper mill in the state. The city is also home to several furniture and wood product manufacturers.
The city is also home to several boat and canoe manufacturers, including Old Town Canoe and Kayak. The city is also home to several shoe and leather goods manufacturers.
Demographics
As of the 2010 census, the city had a population of 8,277. The racial makeup of the city was 94.2% White, 0.7% African American, 0.7% Native American, 0.7% Asian, 0.1% Pacific Islander, 0.7% from other races, and 2.7% from two or more races. Hispanic or Latino of any race were 1.7% of the population.
The median income for a household in the city was $35,945, and the median income for a family was $45,945. The per capita income for the city was $19,945. About 14.7% of families and 17.7% of the population were below the poverty line, including 25.7% of those under age 18 and 11.7% of those age 65 or over.
Common Questions
What is Per Capita Income in Old Town?
Per Capita income in Old Town is $30,584.
What is the Median Family Income in Old Town?
Median Family Income in Old Town is $75,556.
What is the Median Household income in Old Town?
Median Household Income in Old Town is $46,343.
What is Income or Wage Gap in Old Town?
Income or Wage Gap in Old Town is 16.5%.
Women in Old Town earn 83.5 cents for every dollar earned by a man.
What is Family Income Deficit in Old Town?
Family Income Deficit in Old Town is $10,621.
Families that are below poverty line in Old Town earn $10,621 less on average than the poverty threshold level.
What is Inequality or Gini Index in Old Town?
Inequality or Gini Index in Old Town is 0.46.
What is the Total Population of Old Town?
Total Population of Old Town is 7,458.
What is the Total Male Population of Old Town?
Total Male Population of Old Town is 3,670.
What is the Total Female Population of Old Town?
Total Female Population of Old Town is 3,788.
What is the Ratio of Males per 100 Females in Old Town?
There are 96.88 Males per 100 Females in Old Town.
What is the Ratio of Females per 100 Males in Old Town?
There are 103.22 Females per 100 Males in Old Town.
What is the Median Population Age in Old Town?
Median Population Age in Old Town is 37.0 Years.
What is the Average Family Size in Old Town
Average Family Size in Old Town is 2.9 People.
What is the Average Household Size in Old Town
Average Household Size in Old Town is 2.4 People.
How Large is the Labor Force in Old Town?
There are 3,922 People in the Labor Forcein in Old Town.
What is the Percentage of People in the Labor Force in Old Town?
61.8% of People are in the Labor Force in Old Town.
What is the Unemployment Rate in Old Town?
Unemployment Rate in Old Town is 2.4%.