Lincoln, ME Map & Demographics
Lincoln Map
Lincoln Overview
$23,920
PER CAPITA INCOME
$41,023
AVG FAMILY INCOME
$28,932
AVG HOUSEHOLD INCOME
63.9%
WAGE / INCOME GAP [ % ]
36.1¢/ $1
WAGE / INCOME GAP [ $ ]
0.49
INEQUALITY / GINI INDEX
2,521
TOTAL POPULATION
1,245
MALE POPULATION
1,276
FEMALE POPULATION
97.57
MALES / 100 FEMALES
102.49
FEMALES / 100 MALES
60.2
MEDIAN AGE
2.5
AVG FAMILY SIZE
1.8
AVG HOUSEHOLD SIZE
922
LABOR FORCE [ PEOPLE ]
41.5%
PERCENT IN LABOR FORCE
2.4%
UNEMPLOYMENT RATE
Lincoln Zip Codes
Lincoln Area Codes
Income in Lincoln
Income Overview in Lincoln
Per Capita Income in Lincoln is $23,920, while median incomes of families and households are $41,023 and $28,932 respectively.
| Characteristic | Number | Measure |
| Per Capita Income | 2,521 | $23,920 |
| Median Family Income | 544 | $41,023 |
| Mean Family Income | 544 | $55,574 |
| Median Household Income | 1,355 | $28,932 |
| Mean Household Income | 1,355 | $43,026 |
| Income Deficit | 544 | $0 |
| Wage / Income Gap (%) | 2,521 | 63.85% |
| Wage / Income Gap ($) | 2,521 | 36.15¢ per $1 |
| Gini / Inequality Index | 2,521 | 0.49 |
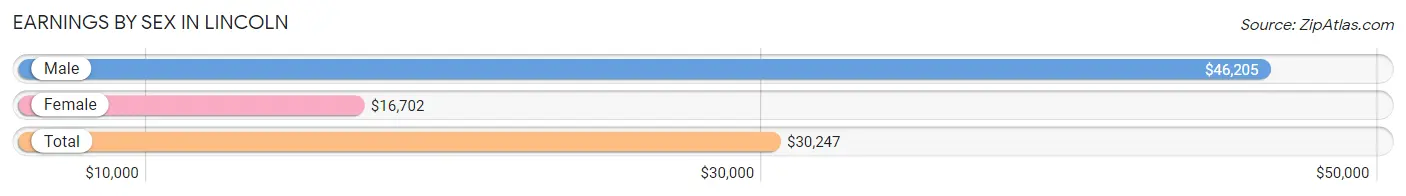
Earnings by Sex in Lincoln
Average Earnings in Lincoln are $30,247, $46,205 for men and $16,702 for women, a difference of 63.8%.
| Sex | Number | Average Earnings |
| Male | 417 (41.6%) | $46,205 |
| Female | 586 (58.4%) | $16,702 |
| Total | 1,003 (100.0%) | $30,247 |
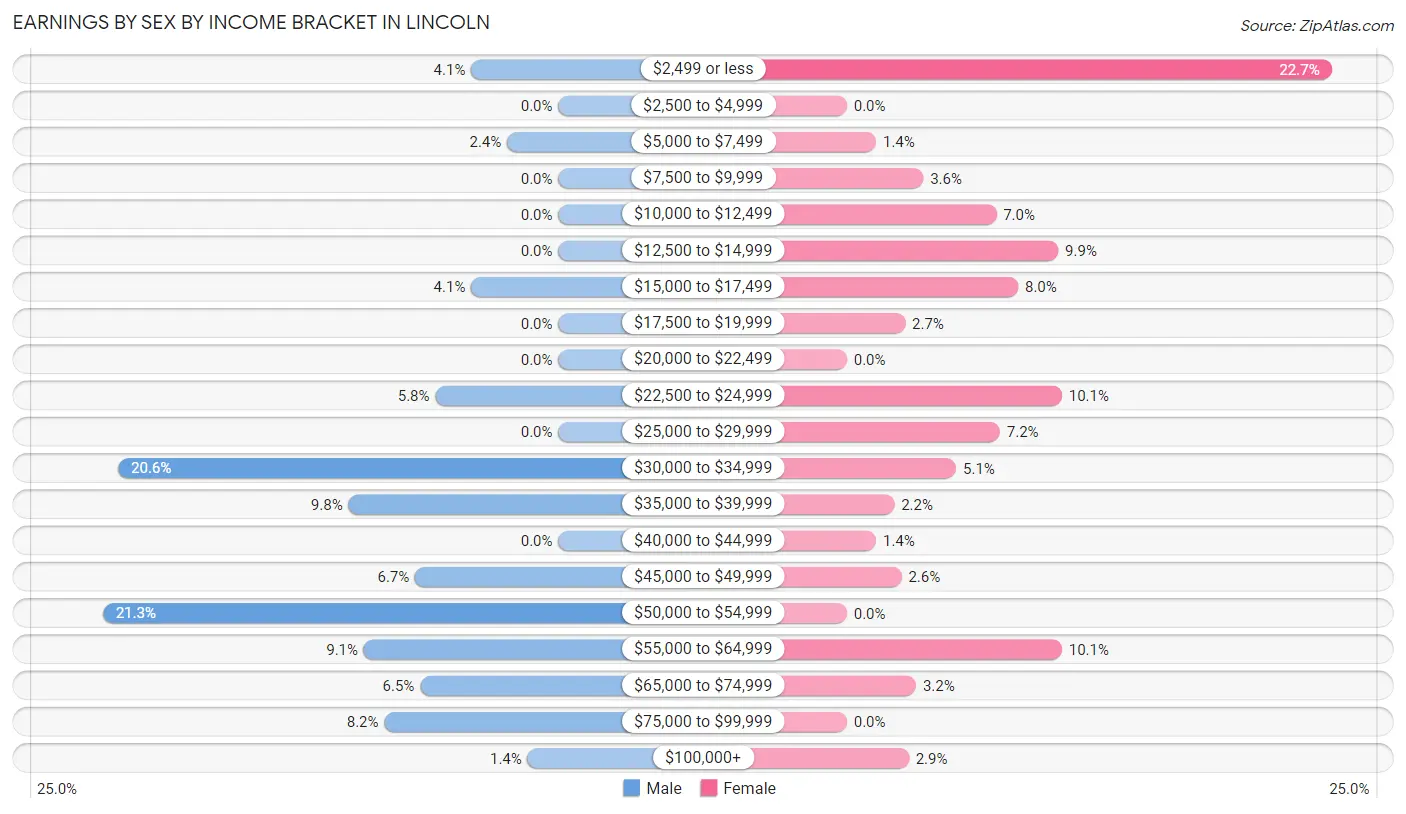
Earnings by Sex by Income Bracket in Lincoln
The most common earnings brackets in Lincoln are $50,000 to $54,999 for men (89 | 21.3%) and $2,499 or less for women (133 | 22.7%).
| Income | Male | Female |
| $2,499 or less | 17 (4.1%) | 133 (22.7%) |
| $2,500 to $4,999 | 0 (0.0%) | 0 (0.0%) |
| $5,000 to $7,499 | 10 (2.4%) | 8 (1.4%) |
| $7,500 to $9,999 | 0 (0.0%) | 21 (3.6%) |
| $10,000 to $12,499 | 0 (0.0%) | 41 (7.0%) |
| $12,500 to $14,999 | 0 (0.0%) | 58 (9.9%) |
| $15,000 to $17,499 | 17 (4.1%) | 47 (8.0%) |
| $17,500 to $19,999 | 0 (0.0%) | 16 (2.7%) |
| $20,000 to $22,499 | 0 (0.0%) | 0 (0.0%) |
| $22,500 to $24,999 | 24 (5.8%) | 59 (10.1%) |
| $25,000 to $29,999 | 0 (0.0%) | 42 (7.2%) |
| $30,000 to $34,999 | 86 (20.6%) | 30 (5.1%) |
| $35,000 to $39,999 | 41 (9.8%) | 13 (2.2%) |
| $40,000 to $44,999 | 0 (0.0%) | 8 (1.4%) |
| $45,000 to $49,999 | 28 (6.7%) | 15 (2.6%) |
| $50,000 to $54,999 | 89 (21.3%) | 0 (0.0%) |
| $55,000 to $64,999 | 38 (9.1%) | 59 (10.1%) |
| $65,000 to $74,999 | 27 (6.5%) | 19 (3.2%) |
| $75,000 to $99,999 | 34 (8.2%) | 0 (0.0%) |
| $100,000+ | 6 (1.4%) | 17 (2.9%) |
| Total | 417 (100.0%) | 586 (100.0%) |
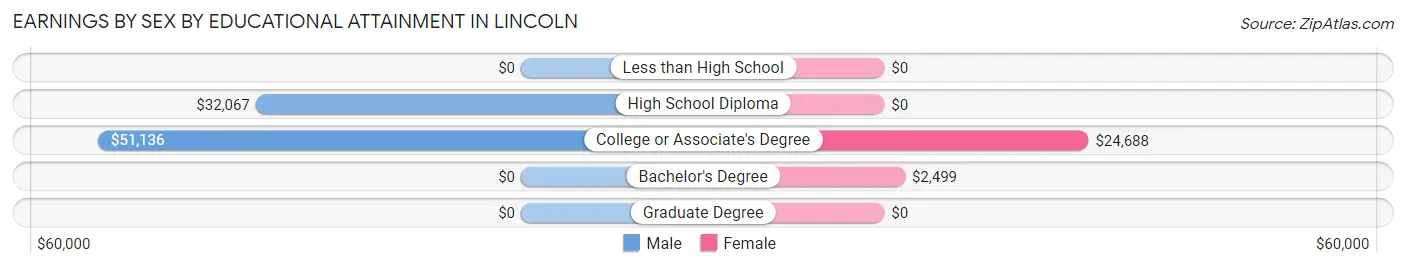
Earnings by Sex by Educational Attainment in Lincoln
Average earnings in Lincoln are $46,205 for men and $16,995 for women, a difference of 63.2%. Men with an educational attainment of college or associate's degree enjoy the highest average annual earnings of $51,136, while those with high school diploma education earn the least with $32,067. Women with an educational attainment of college or associate's degree earn the most with the average annual earnings of $24,688, while those with bachelor's degree education have the smallest earnings of $2,499.
| Educational Attainment | Male Income | Female Income |
| Less than High School | - | - |
| High School Diploma | $32,067 | $0 |
| College or Associate's Degree | $51,136 | $24,688 |
| Bachelor's Degree | - | - |
| Graduate Degree | - | - |
| Total | $46,205 | $16,995 |
Family Income in Lincoln
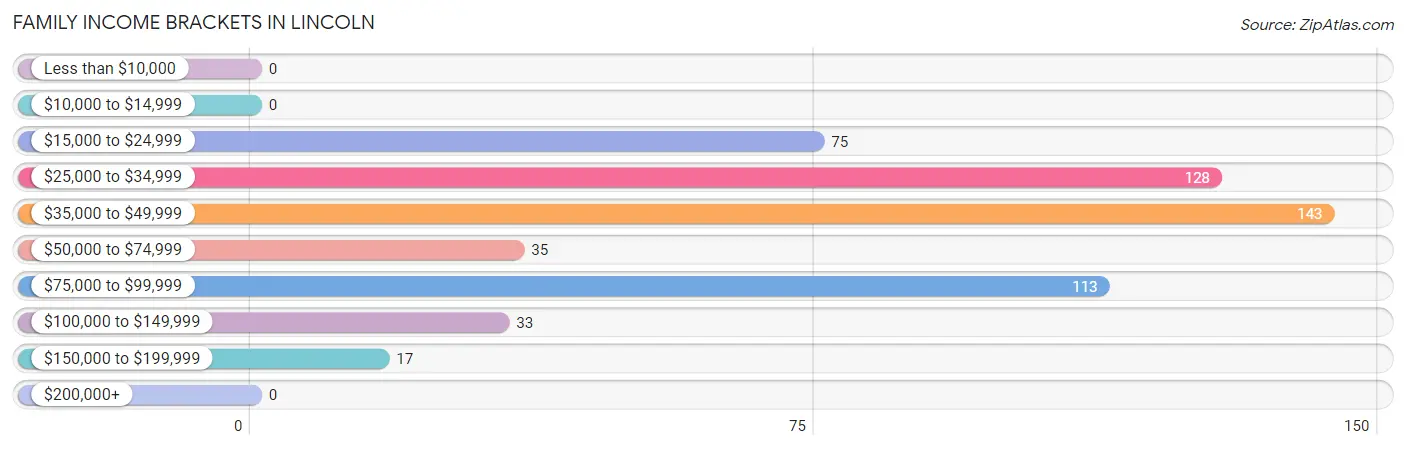
Family Income Brackets in Lincoln
According to the Lincoln family income data, there are 143 families falling into the $35,000 to $49,999 income range, which is the most common income bracket and makes up 26.3% of all families.
| Income Bracket | # Families | % Families |
| Less than $10,000 | 0 | 0.0% |
| $10,000 to $14,999 | 0 | 0.0% |
| $15,000 to $24,999 | 75 | 13.8% |
| $25,000 to $34,999 | 128 | 23.5% |
| $35,000 to $49,999 | 143 | 26.3% |
| $50,000 to $74,999 | 35 | 6.4% |
| $75,000 to $99,999 | 113 | 20.8% |
| $100,000 to $149,999 | 33 | 6.1% |
| $150,000 to $199,999 | 17 | 3.1% |
| $200,000+ | 0 | 0.0% |
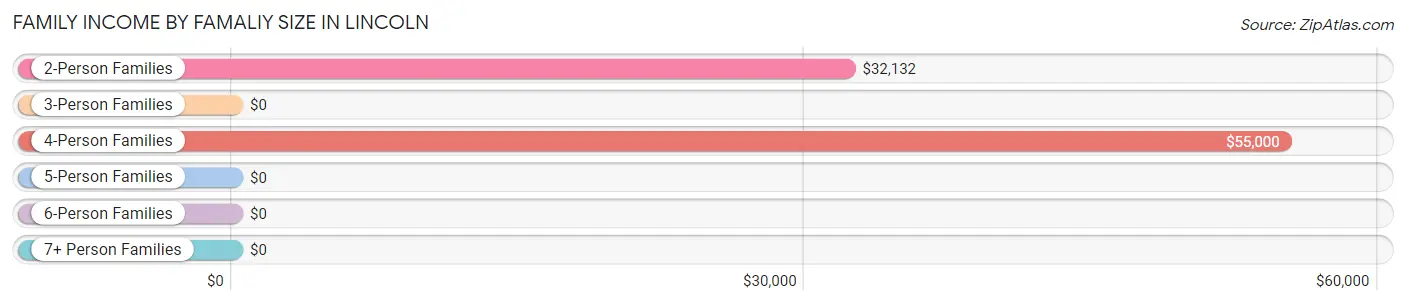
Family Income by Famaliy Size in Lincoln
4-person families (108 | 19.9%) account for the highest median family income in Lincoln with $55,000 per family, while 2-person families (401 | 73.7%) have the highest median income of $16,066 per family member.
| Income Bracket | # Families | Median Income |
| 2-Person Families | 401 (73.7%) | $32,132 |
| 3-Person Families | 17 (3.1%) | $0 |
| 4-Person Families | 108 (19.9%) | $55,000 |
| 5-Person Families | 18 (3.3%) | $0 |
| 6-Person Families | 0 (0.0%) | $0 |
| 7+ Person Families | 0 (0.0%) | $0 |
| Total | 544 (100.0%) | $41,023 |
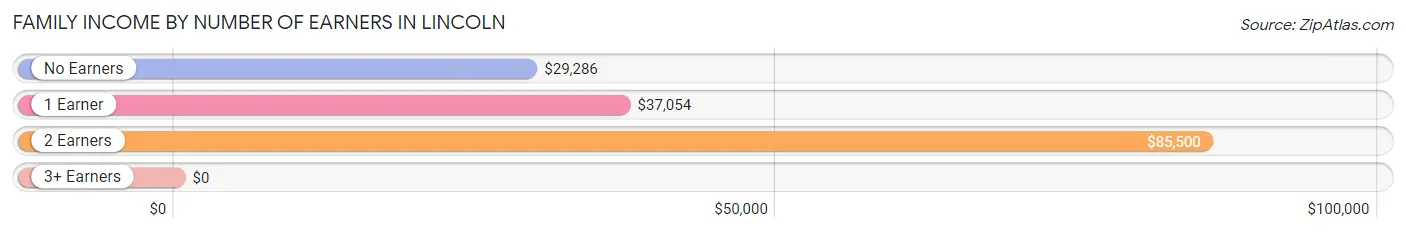
Family Income by Number of Earners in Lincoln
| Number of Earners | # Families | Median Income |
| No Earners | 140 (25.7%) | $29,286 |
| 1 Earner | 270 (49.6%) | $37,054 |
| 2 Earners | 110 (20.2%) | $85,500 |
| 3+ Earners | 24 (4.4%) | $0 |
| Total | 544 (100.0%) | $41,023 |
Household Income in Lincoln
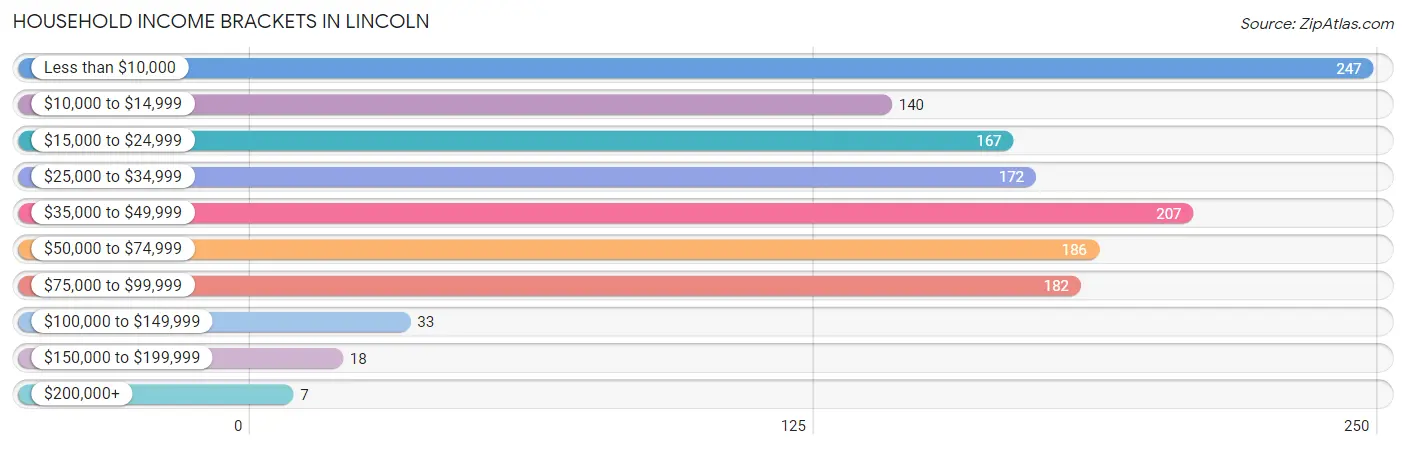
Household Income Brackets in Lincoln
With 247 households falling in the category, the less than $10,000 income range is the most frequent in Lincoln, accounting for 18.2% of all households. In contrast, only 7 households (0.5%) fall into the $200,000+ income bracket, making it the least populous group.
| Income Bracket | # Households | % Households |
| Less than $10,000 | 247 | 18.2% |
| $10,000 to $14,999 | 140 | 10.3% |
| $15,000 to $24,999 | 167 | 12.3% |
| $25,000 to $34,999 | 172 | 12.7% |
| $35,000 to $49,999 | 207 | 15.3% |
| $50,000 to $74,999 | 186 | 13.7% |
| $75,000 to $99,999 | 182 | 13.4% |
| $100,000 to $149,999 | 33 | 2.4% |
| $150,000 to $199,999 | 18 | 1.3% |
| $200,000+ | 7 | 0.5% |
Household Income by Householder Age in Lincoln
The median household income in Lincoln is $28,932, with the highest median household income of $45,865 found in the 25 to 44 years age bracket for the primary householder. A total of 252 households (18.6%) fall into this category. Meanwhile, the 15 to 24 years age bracket for the primary householder has the lowest median household income of $0, with 14 households (1.0%) in this group.
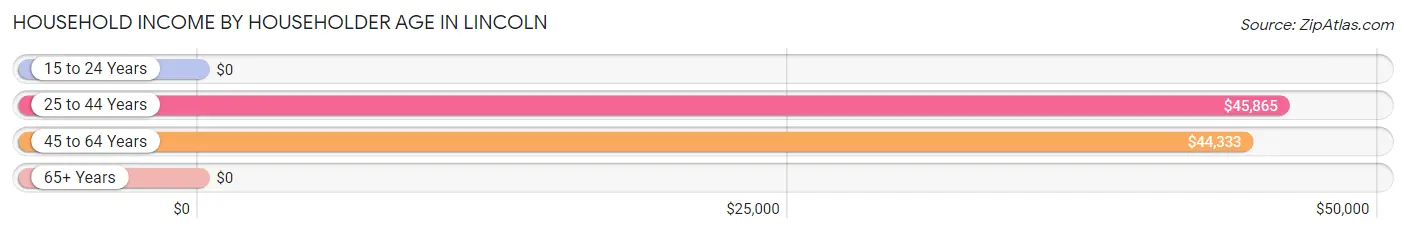
| Income Bracket | # Households | Median Income |
| 15 to 24 Years | 14 (1.0%) | $0 |
| 25 to 44 Years | 252 (18.6%) | $45,865 |
| 45 to 64 Years | 438 (32.3%) | $44,333 |
| 65+ Years | 651 (48.0%) | $0 |
| Total | 1,355 (100.0%) | $28,932 |
Poverty in Lincoln
Income Below Poverty by Sex and Age in Lincoln
With 15.6% poverty level for males and 21.5% for females among the residents of Lincoln, 65 to 74 year old males and 75 year old and over females are the most vulnerable to poverty, with 147 males (45.5%) and 111 females (56.4%) in their respective age groups living below the poverty level.
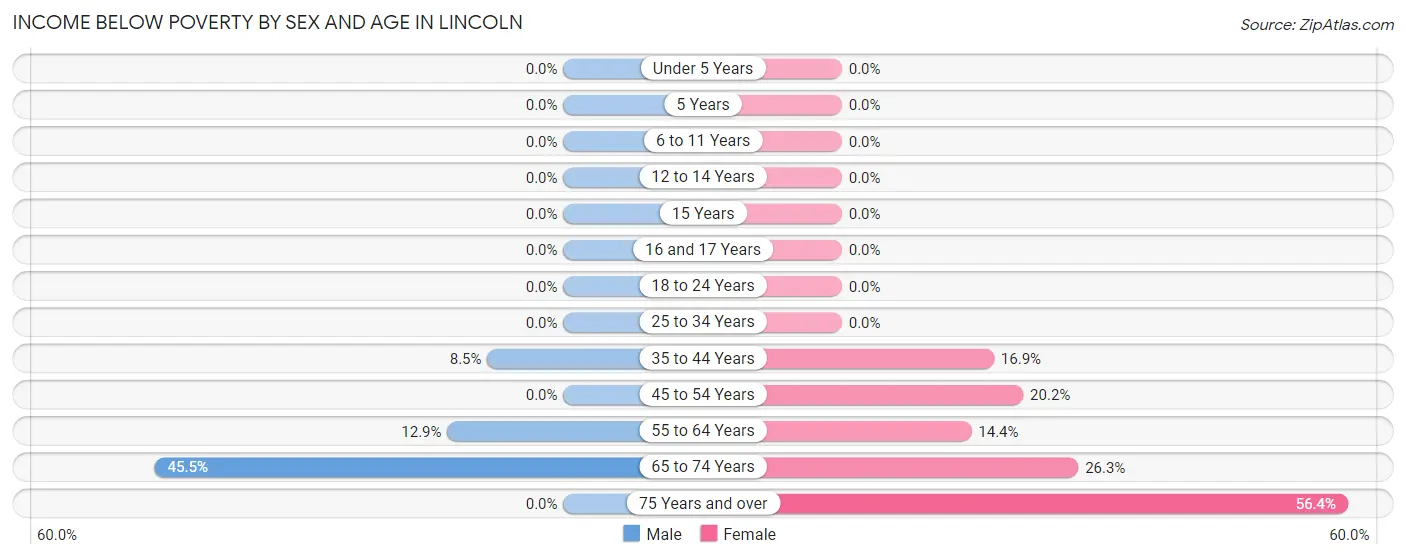
| Age Bracket | Male | Female |
| Under 5 Years | 0 (0.0%) | 0 (0.0%) |
| 5 Years | 0 (0.0%) | 0 (0.0%) |
| 6 to 11 Years | 0 (0.0%) | 0 (0.0%) |
| 12 to 14 Years | 0 (0.0%) | 0 (0.0%) |
| 15 Years | 0 (0.0%) | 0 (0.0%) |
| 16 and 17 Years | 0 (0.0%) | 0 (0.0%) |
| 18 to 24 Years | 0 (0.0%) | 0 (0.0%) |
| 25 to 34 Years | 0 (0.0%) | 0 (0.0%) |
| 35 to 44 Years | 11 (8.5%) | 21 (16.9%) |
| 45 to 54 Years | 0 (0.0%) | 20 (20.2%) |
| 55 to 64 Years | 31 (12.9%) | 29 (14.4%) |
| 65 to 74 Years | 147 (45.5%) | 79 (26.3%) |
| 75 Years and over | 0 (0.0%) | 111 (56.4%) |
| Total | 189 (15.6%) | 260 (21.5%) |
Income Above Poverty by Sex and Age in Lincoln
According to the poverty statistics in Lincoln, males aged under 5 years and females aged under 5 years are the age groups that are most secure financially, with 100.0% of males and 100.0% of females in these age groups living above the poverty line.
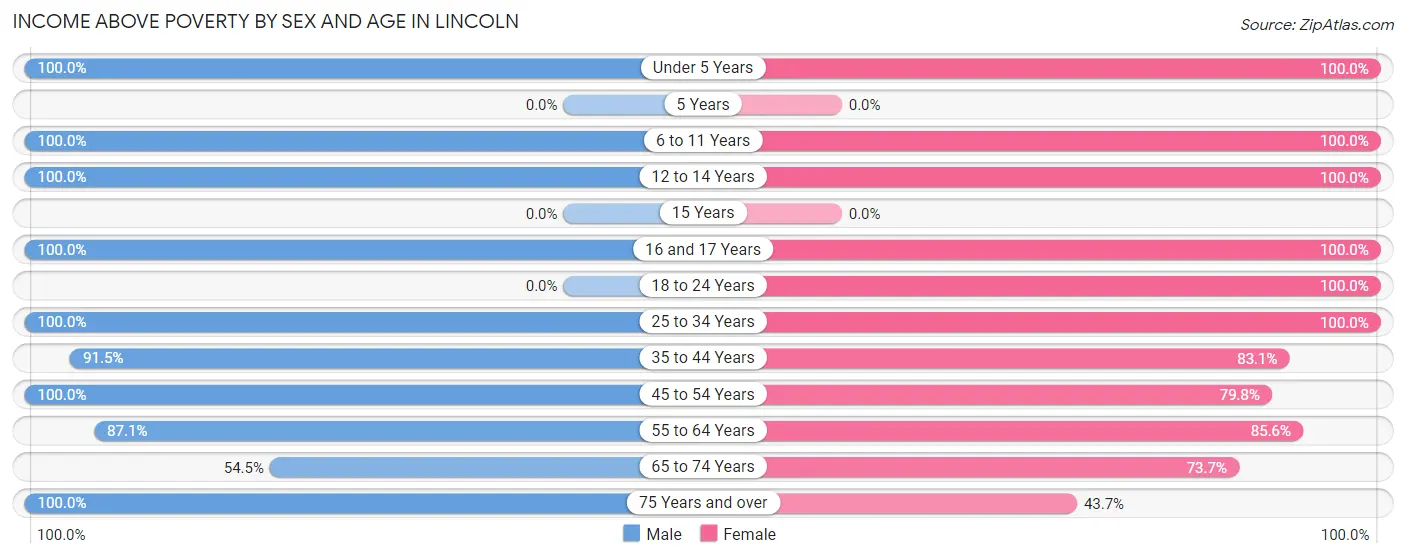
| Age Bracket | Male | Female |
| Under 5 Years | 41 (100.0%) | 37 (100.0%) |
| 5 Years | 0 (0.0%) | 0 (0.0%) |
| 6 to 11 Years | 80 (100.0%) | 45 (100.0%) |
| 12 to 14 Years | 61 (100.0%) | 15 (100.0%) |
| 15 Years | 0 (0.0%) | 0 (0.0%) |
| 16 and 17 Years | 21 (100.0%) | 15 (100.0%) |
| 18 to 24 Years | 0 (0.0%) | 56 (100.0%) |
| 25 to 34 Years | 177 (100.0%) | 119 (100.0%) |
| 35 to 44 Years | 119 (91.5%) | 103 (83.1%) |
| 45 to 54 Years | 71 (100.0%) | 79 (79.8%) |
| 55 to 64 Years | 209 (87.1%) | 172 (85.6%) |
| 65 to 74 Years | 176 (54.5%) | 221 (73.7%) |
| 75 Years and over | 69 (100.0%) | 86 (43.6%) |
| Total | 1,024 (84.4%) | 948 (78.5%) |
Income Below Poverty Among Married-Couple Families in Lincoln
| Children | Above Poverty | Below Poverty |
| No Children | 302 (100.0%) | 0 (0.0%) |
| 1 or 2 Children | 118 (100.0%) | 0 (0.0%) |
| 3 or 4 Children | 18 (100.0%) | 0 (0.0%) |
| 5 or more Children | 0 (0.0%) | 0 (0.0%) |
| Total | 438 (100.0%) | 0 (0.0%) |
Income Below Poverty Among Single-Parent Households in Lincoln
| Children | Single Father | Single Mother |
| No Children | 0 (0.0%) | 0 (0.0%) |
| 1 or 2 Children | 0 (0.0%) | 0 (0.0%) |
| 3 or 4 Children | 0 (0.0%) | 0 (0.0%) |
| 5 or more Children | 0 (0.0%) | 0 (0.0%) |
| Total | 0 (0.0%) | 0 (0.0%) |
Income Below Poverty Among Married-Couple vs Single-Parent Households in Lincoln
| Children | Married-Couple Families | Single-Parent Households |
| No Children | 0 (0.0%) | 0 (0.0%) |
| 1 or 2 Children | 0 (0.0%) | 0 (0.0%) |
| 3 or 4 Children | 0 (0.0%) | 0 (0.0%) |
| 5 or more Children | 0 (0.0%) | 0 (0.0%) |
| Total | 0 (0.0%) | 0 (0.0%) |
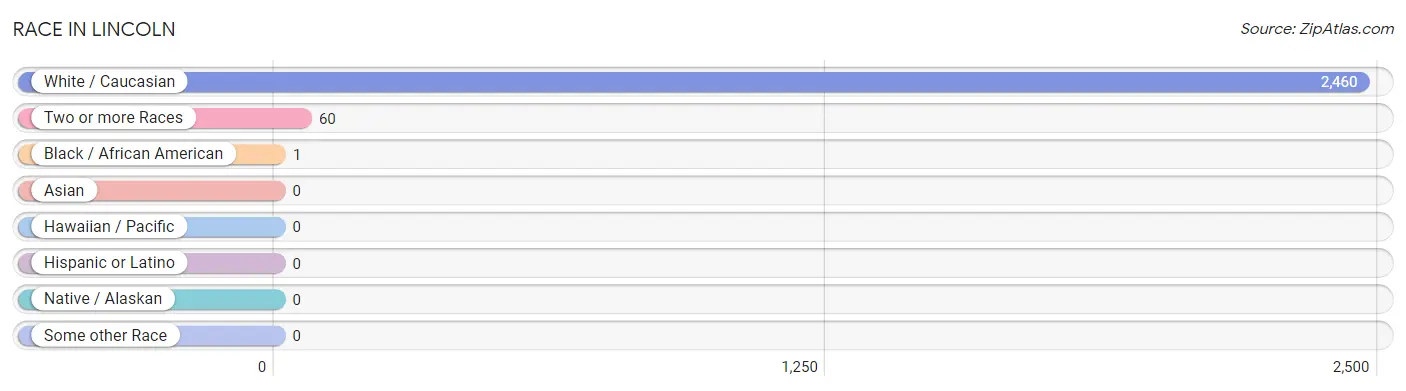
Race in Lincoln
The most populous races in Lincoln are White / Caucasian (2,460 | 97.6%), Two or more Races (60 | 2.4%), and Black / African American (1 | 0.0%).
| Race | # Population | % Population |
| Asian | 0 | 0.0% |
| Black / African American | 1 | 0.0% |
| Hawaiian / Pacific | 0 | 0.0% |
| Hispanic or Latino | 0 | 0.0% |
| Native / Alaskan | 0 | 0.0% |
| White / Caucasian | 2,460 | 97.6% |
| Two or more Races | 60 | 2.4% |
| Some other Race | 0 | 0.0% |
| Total | 2,521 | 100.0% |
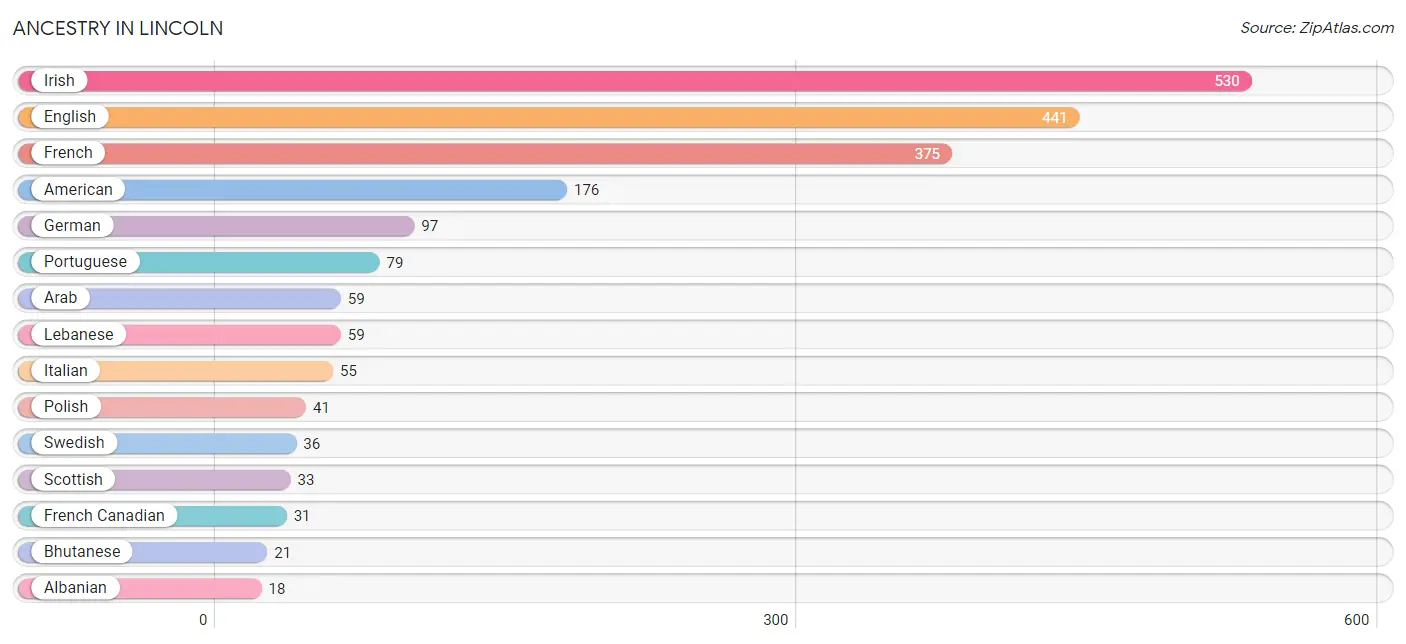
Ancestry in Lincoln
The most populous ancestries reported in Lincoln are Irish (530 | 21.0%), English (441 | 17.5%), French (375 | 14.9%), American (176 | 7.0%), and German (97 | 3.8%), together accounting for 64.2% of all Lincoln residents.
| Ancestry | # Population | % Population |
| Albanian | 18 | 0.7% |
| American | 176 | 7.0% |
| Arab | 59 | 2.3% |
| Bhutanese | 21 | 0.8% |
| Dutch | 2 | 0.1% |
| English | 441 | 17.5% |
| French | 375 | 14.9% |
| French Canadian | 31 | 1.2% |
| German | 97 | 3.8% |
| Irish | 530 | 21.0% |
| Italian | 55 | 2.2% |
| Korean | 17 | 0.7% |
| Lebanese | 59 | 2.3% |
| Polish | 41 | 1.6% |
| Portuguese | 79 | 3.1% |
| Russian | 15 | 0.6% |
| Scottish | 33 | 1.3% |
| Swedish | 36 | 1.4% | View All 18 Rows |
Immigrants in Lincoln
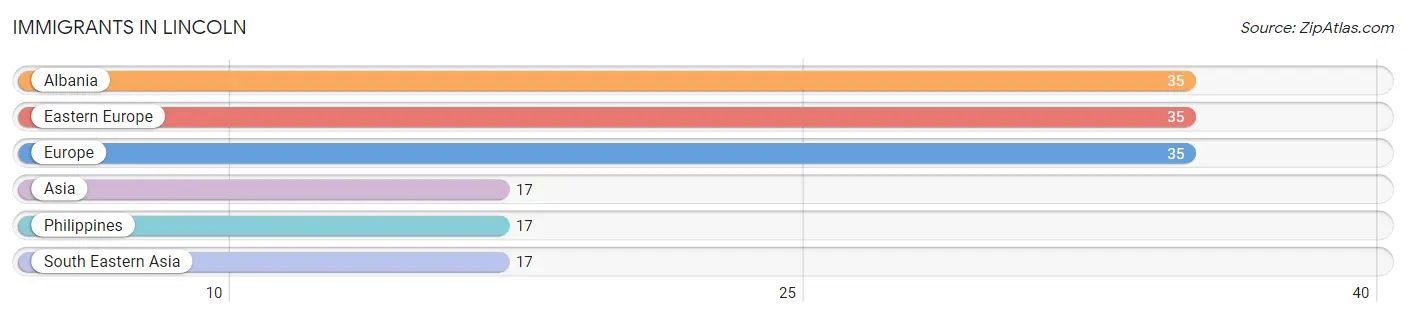
The most numerous immigrant groups reported in Lincoln came from Albania (35 | 1.4%), Eastern Europe (35 | 1.4%), Europe (35 | 1.4%), Asia (17 | 0.7%), and Philippines (17 | 0.7%), together accounting for 5.5% of all Lincoln residents.
| Immigration Origin | # Population | % Population |
| Albania | 35 | 1.4% |
| Asia | 17 | 0.7% |
| Eastern Europe | 35 | 1.4% |
| Europe | 35 | 1.4% |
| Philippines | 17 | 0.7% |
| South Eastern Asia | 17 | 0.7% | View All 6 Rows |
Sex and Age in Lincoln
Sex and Age in Lincoln
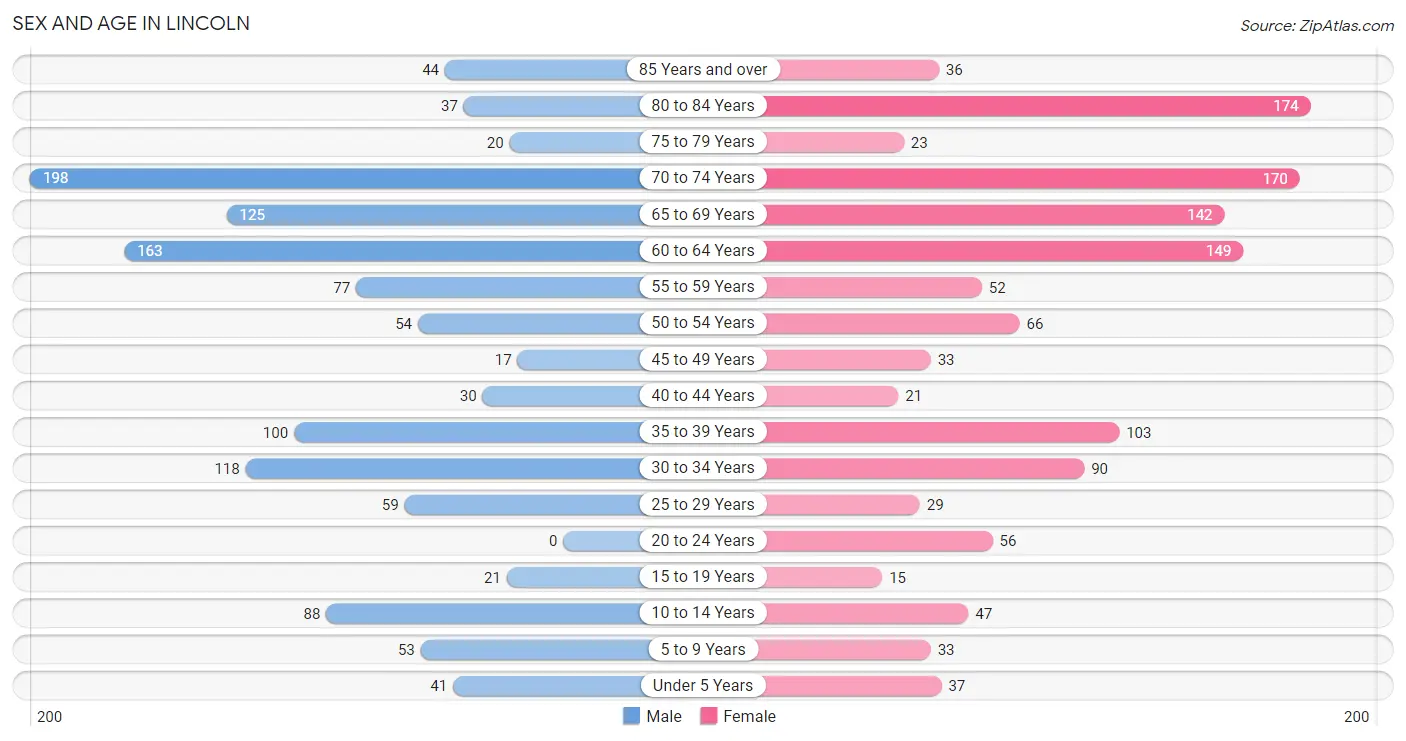
The most populous age groups in Lincoln are 70 to 74 Years (198 | 15.9%) for men and 80 to 84 Years (174 | 13.6%) for women.
| Age Bracket | Male | Female |
| Under 5 Years | 41 (3.3%) | 37 (2.9%) |
| 5 to 9 Years | 53 (4.3%) | 33 (2.6%) |
| 10 to 14 Years | 88 (7.1%) | 47 (3.7%) |
| 15 to 19 Years | 21 (1.7%) | 15 (1.2%) |
| 20 to 24 Years | 0 (0.0%) | 56 (4.4%) |
| 25 to 29 Years | 59 (4.7%) | 29 (2.3%) |
| 30 to 34 Years | 118 (9.5%) | 90 (7.0%) |
| 35 to 39 Years | 100 (8.0%) | 103 (8.1%) |
| 40 to 44 Years | 30 (2.4%) | 21 (1.7%) |
| 45 to 49 Years | 17 (1.4%) | 33 (2.6%) |
| 50 to 54 Years | 54 (4.3%) | 66 (5.2%) |
| 55 to 59 Years | 77 (6.2%) | 52 (4.1%) |
| 60 to 64 Years | 163 (13.1%) | 149 (11.7%) |
| 65 to 69 Years | 125 (10.0%) | 142 (11.1%) |
| 70 to 74 Years | 198 (15.9%) | 170 (13.3%) |
| 75 to 79 Years | 20 (1.6%) | 23 (1.8%) |
| 80 to 84 Years | 37 (3.0%) | 174 (13.6%) |
| 85 Years and over | 44 (3.5%) | 36 (2.8%) |
| Total | 1,245 (100.0%) | 1,276 (100.0%) |
Families and Households in Lincoln
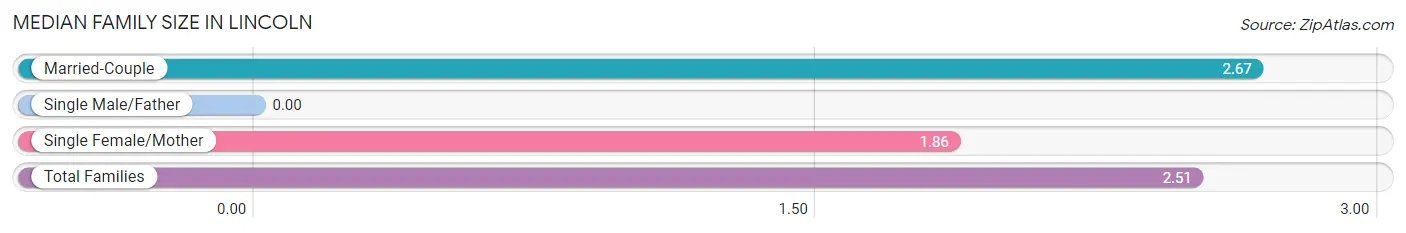
Median Family Size in Lincoln
| Family Type | # Families | Family Size |
| Married-Couple | 438 (80.5%) | 2.67 |
| Single Male/Father | 0 (0.0%) | - |
| Single Female/Mother | 106 (19.5%) | 1.86 |
| Total Families | 544 (100.0%) | 2.51 |
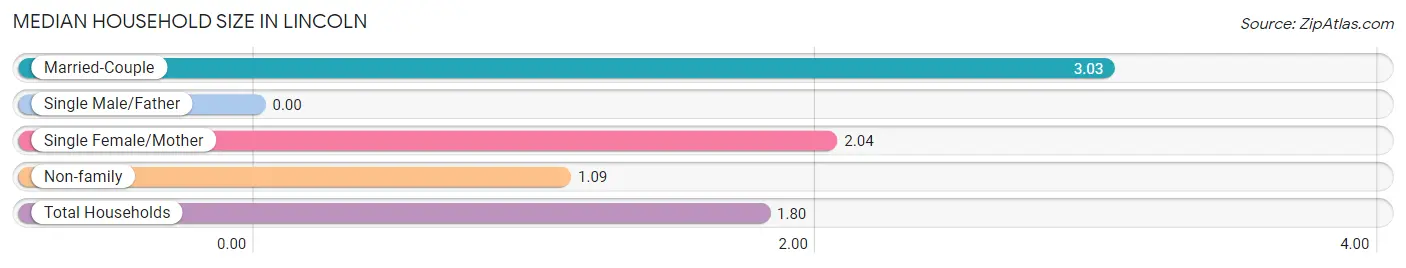
Median Household Size in Lincoln
| Household Type | # Households | Household Size |
| Married-Couple | 438 (32.3%) | 3.03 |
| Single Male/Father | 0 (0.0%) | - |
| Single Female/Mother | 106 (7.8%) | 2.04 |
| Non-family | 811 (59.9%) | 1.09 |
| Total Households | 1,355 (100.0%) | 1.80 |
Household Size by Marriage Status in Lincoln
Out of a total of 1,355 households in Lincoln, 544 (40.2%) are family households, while 811 (59.9%) are nonfamily households. The most numerous type of family households are 2-person households, comprising 373, and the most common type of nonfamily households are 1-person households, comprising 710.
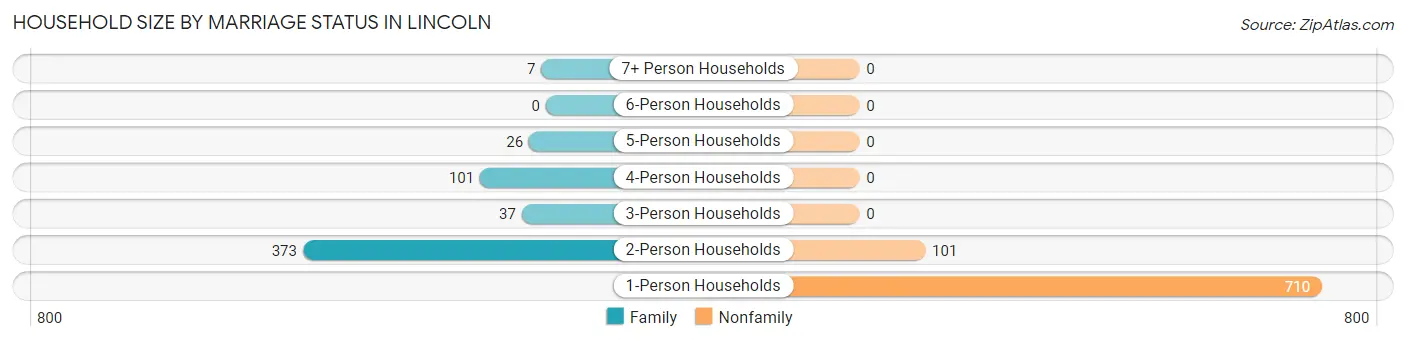
| Household Size | Family Households | Nonfamily Households |
| 1-Person Households | - | 710 (52.4%) |
| 2-Person Households | 373 (27.5%) | 101 (7.4%) |
| 3-Person Households | 37 (2.7%) | 0 (0.0%) |
| 4-Person Households | 101 (7.4%) | 0 (0.0%) |
| 5-Person Households | 26 (1.9%) | 0 (0.0%) |
| 6-Person Households | 0 (0.0%) | 0 (0.0%) |
| 7+ Person Households | 7 (0.5%) | 0 (0.0%) |
| Total | 544 (40.2%) | 811 (59.9%) |
Female Fertility in Lincoln
Fertility by Age in Lincoln
Average fertility rate in Lincoln is 71.0 births per 1,000 women. Women in the age bracket of 35 to 50 years have the highest fertility rate with 149.0 births per 1,000 women. Women in the age bracket of 35 to 50 years acount for 100.0% of all women with births.
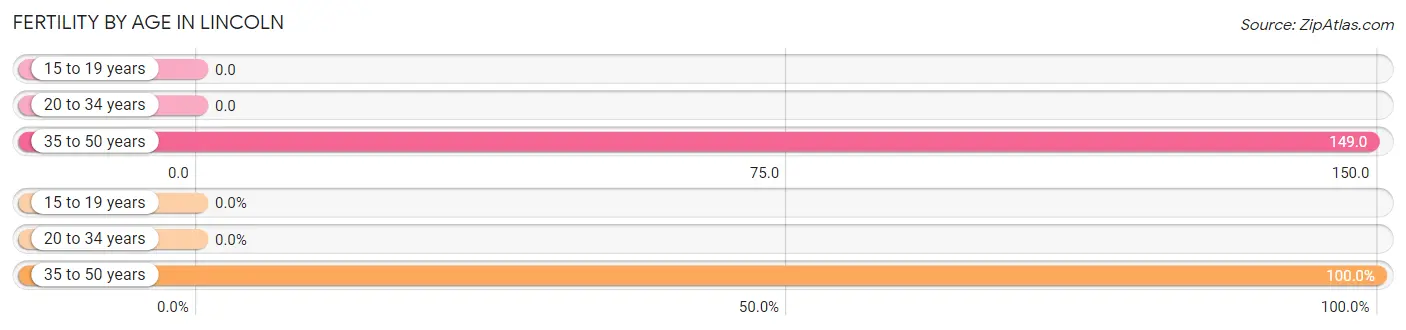
| Age Bracket | Women with Births | Births / 1,000 Women |
| 15 to 19 years | 0 (0.0%) | 0.0 |
| 20 to 34 years | 0 (0.0%) | 0.0 |
| 35 to 50 years | 26 (100.0%) | 149.0 |
| Total | 26 (100.0%) | 71.0 |
Fertility by Age by Marriage Status in Lincoln
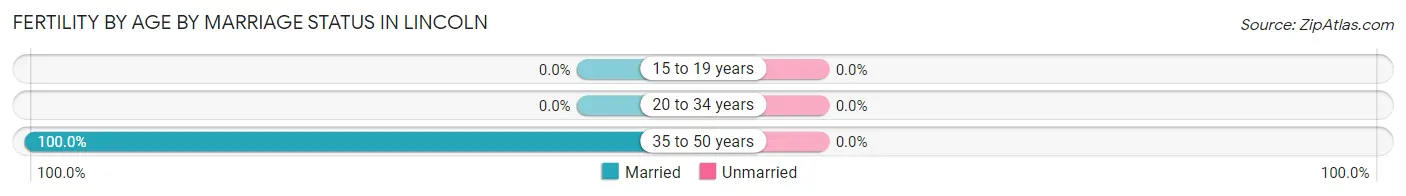
| Age Bracket | Married | Unmarried |
| 15 to 19 years | 0 (0.0%) | 0 (0.0%) |
| 20 to 34 years | 0 (0.0%) | 0 (0.0%) |
| 35 to 50 years | 26 (100.0%) | 0 (0.0%) |
| Total | 26 (100.0%) | 0 (0.0%) |
Fertility by Education in Lincoln
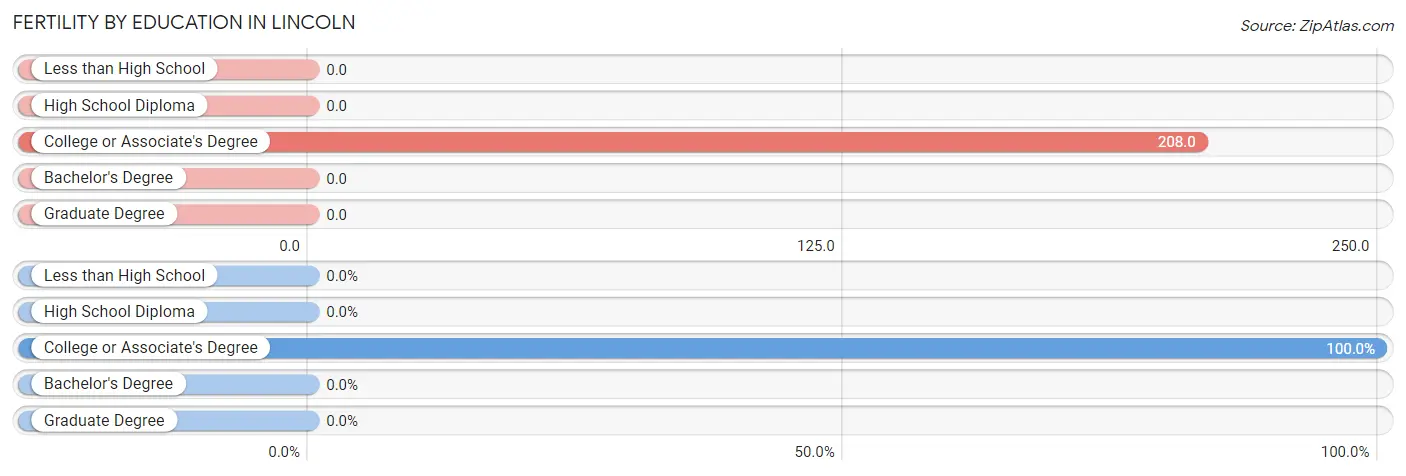
| Educational Attainment | Women with Births | Births / 1,000 Women |
| Less than High School | 0 (0.0%) | 0.0 |
| High School Diploma | 0 (0.0%) | 0.0 |
| College or Associate's Degree | 26 (100.0%) | 208.0 |
| Bachelor's Degree | 0 (0.0%) | 0.0 |
| Graduate Degree | 0 (0.0%) | 0.0 |
| Total | 26 (100.0%) | 71.0 |
Fertility by Education by Marriage Status in Lincoln
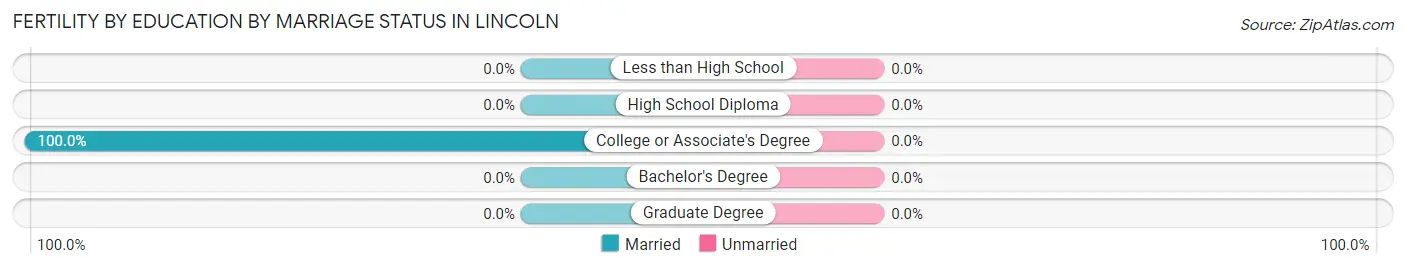
| Educational Attainment | Married | Unmarried |
| Less than High School | 0 (0.0%) | 0 (0.0%) |
| High School Diploma | 0 (0.0%) | 0 (0.0%) |
| College or Associate's Degree | 26 (100.0%) | 0 (0.0%) |
| Bachelor's Degree | 0 (0.0%) | 0 (0.0%) |
| Graduate Degree | 0 (0.0%) | 0 (0.0%) |
| Total | 26 (100.0%) | 0 (0.0%) |
Employment Characteristics in Lincoln
Employment by Class of Employer in Lincoln
Among the 902 employed individuals in Lincoln, private company employees (502 | 55.6%), state government employees (149 | 16.5%), and local government employees (79 | 8.8%) make up the most common classes of employment.
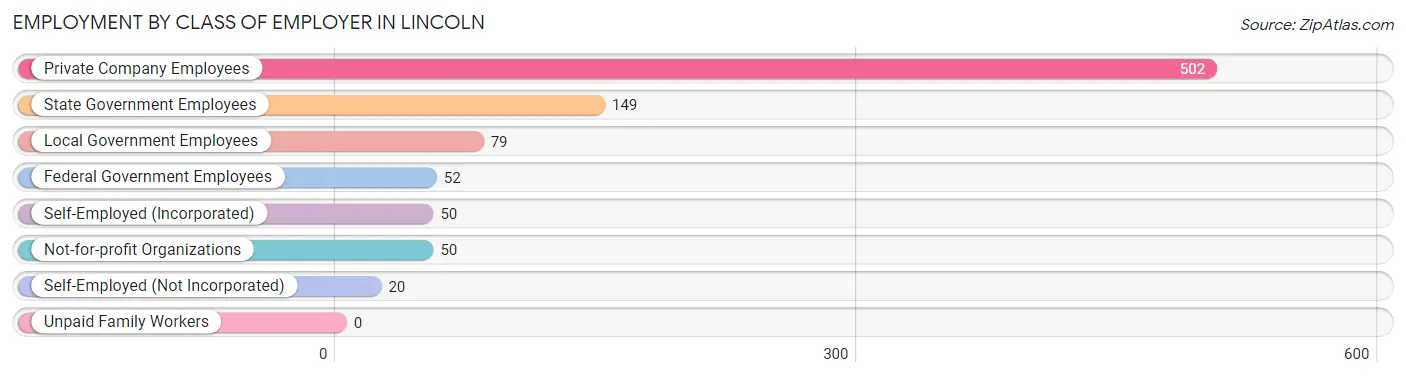
| Employer Class | # Employees | % Employees |
| Private Company Employees | 502 | 55.6% |
| Self-Employed (Incorporated) | 50 | 5.5% |
| Self-Employed (Not Incorporated) | 20 | 2.2% |
| Not-for-profit Organizations | 50 | 5.5% |
| Local Government Employees | 79 | 8.8% |
| State Government Employees | 149 | 16.5% |
| Federal Government Employees | 52 | 5.8% |
| Unpaid Family Workers | 0 | 0.0% |
| Total | 902 | 100.0% |
Employment Status by Age in Lincoln
According to the labor force statistics for Lincoln, out of the total population over 16 years of age (2,222), 41.5% or 922 individuals are in the labor force, with 2.4% or 22 of them unemployed. The age group with the highest labor force participation rate is 30 to 34 years, with 82.7% or 172 individuals in the labor force. Within the labor force, the 25 to 29 years age range has the highest percentage of unemployed individuals, with 25.6% or 16 of them being unemployed.
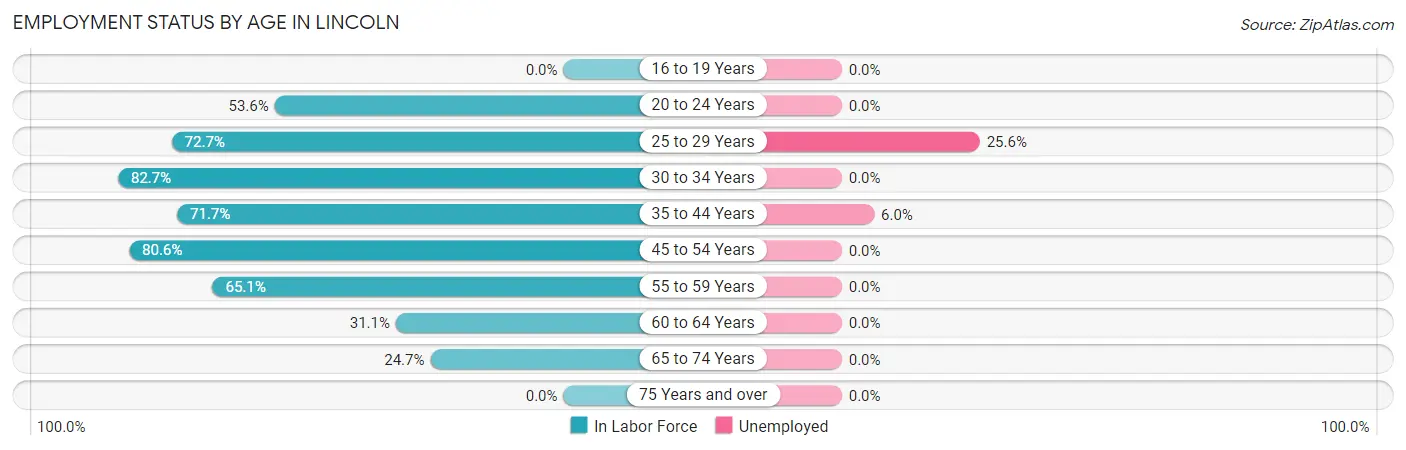
| Age Bracket | In Labor Force | Unemployed |
| 16 to 19 Years | 0 (0.0%) | 0 (0.0%) |
| 20 to 24 Years | 30 (53.6%) | 0 (0.0%) |
| 25 to 29 Years | 64 (72.7%) | 16 (25.6%) |
| 30 to 34 Years | 172 (82.7%) | 0 (0.0%) |
| 35 to 44 Years | 182 (71.7%) | 11 (6.0%) |
| 45 to 54 Years | 137 (80.6%) | 0 (0.0%) |
| 55 to 59 Years | 84 (65.1%) | 0 (0.0%) |
| 60 to 64 Years | 97 (31.1%) | 0 (0.0%) |
| 65 to 74 Years | 157 (24.7%) | 0 (0.0%) |
| 75 Years and over | 0 (0.0%) | 0 (0.0%) |
| Total | 922 (41.5%) | 22 (2.4%) |
Employment Status by Educational Attainment in Lincoln
According to labor force statistics for Lincoln, 63.4% of individuals (736) out of the total population between 25 and 64 years of age (1,161) are in the labor force, with 3.1% or 23 of them being unemployed. The group with the highest labor force participation rate are those with the educational attainment of less than high school, with 100.0% or 85 individuals in the labor force. Within the labor force, individuals with college / associate degree education have the highest percentage of unemployment, with 7.0% or 23 of them being unemployed.
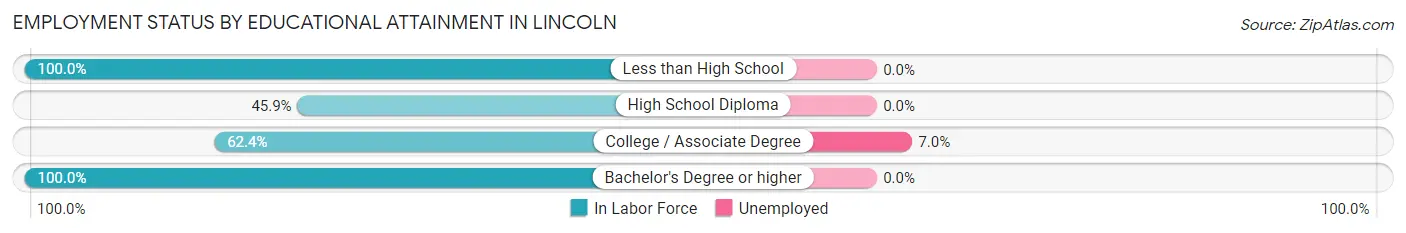
| Educational Attainment | In Labor Force | Unemployed |
| Less than High School | 85 (100.0%) | 0 (0.0%) |
| High School Diploma | 194 (45.9%) | 0 (0.0%) |
| College / Associate Degree | 325 (62.4%) | 36 (7.0%) |
| Bachelor's Degree or higher | 132 (100.0%) | 0 (0.0%) |
| Total | 736 (63.4%) | 36 (3.1%) |
Employment Occupations by Sex in Lincoln
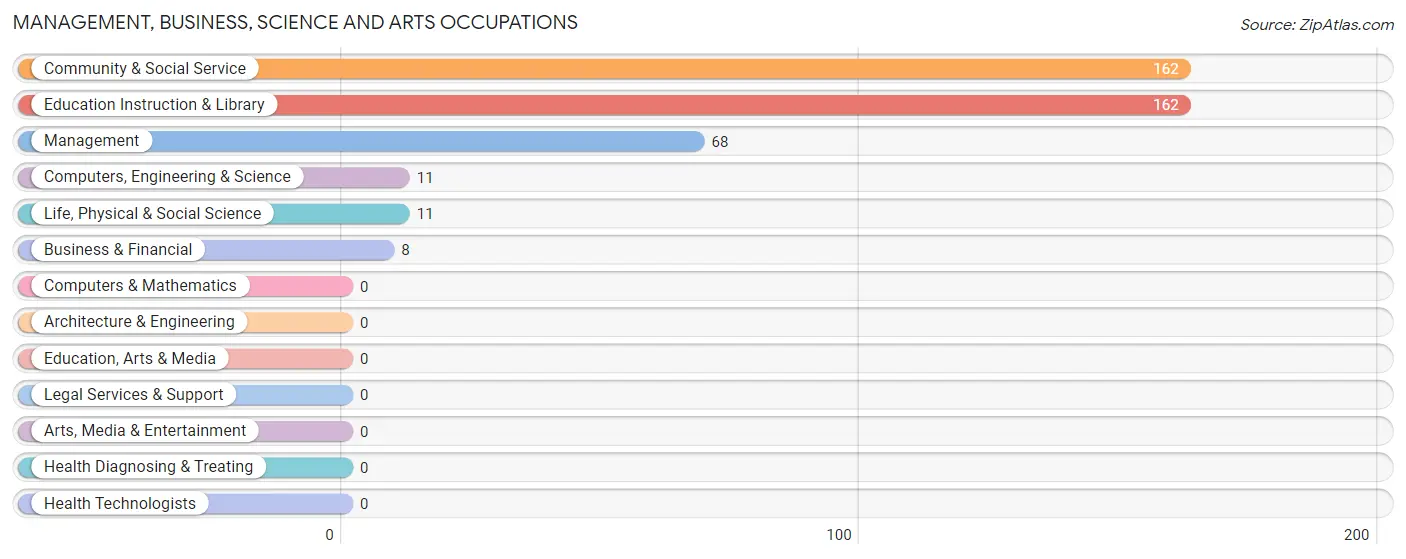
Management, Business, Science and Arts Occupations
The most common Management, Business, Science and Arts occupations in Lincoln are Community & Social Service (162 | 19.1%), Education Instruction & Library (162 | 19.1%), Management (68 | 8.0%), Computers, Engineering & Science (11 | 1.3%), and Life, Physical & Social Science (11 | 1.3%).
Management, Business, Science and Arts Occupations by Sex
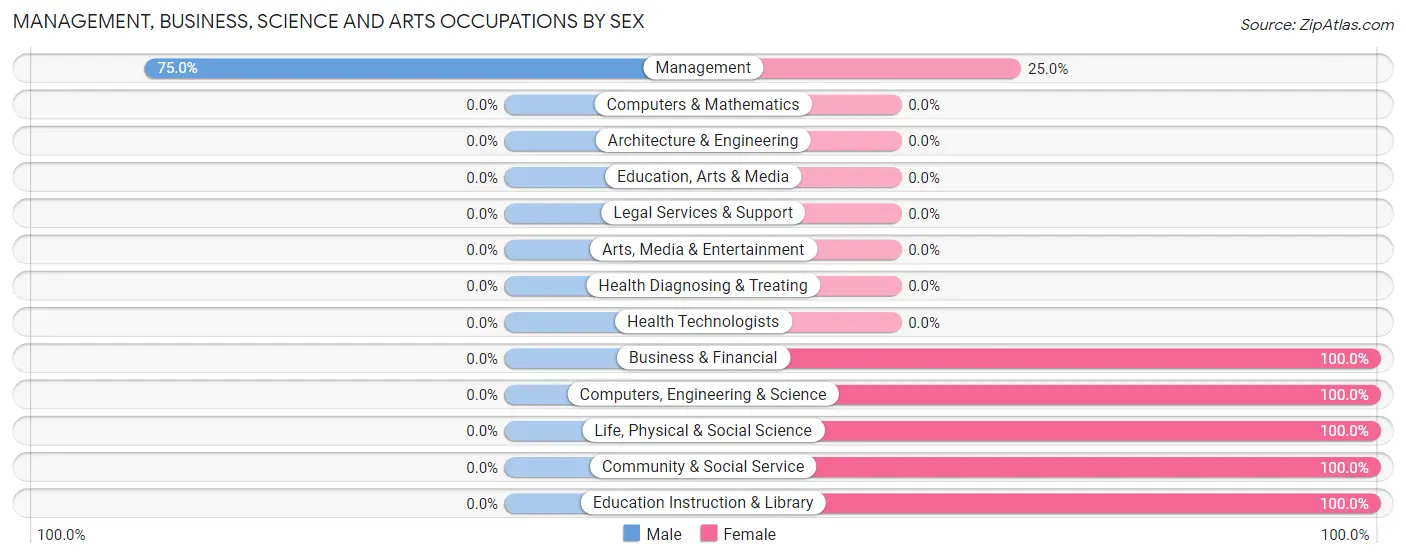
| Occupation | Male | Female |
| Management | 51 (75.0%) | 17 (25.0%) |
| Business & Financial | 0 (0.0%) | 8 (100.0%) |
| Computers, Engineering & Science | 0 (0.0%) | 11 (100.0%) |
| Computers & Mathematics | 0 (0.0%) | 0 (0.0%) |
| Architecture & Engineering | 0 (0.0%) | 0 (0.0%) |
| Life, Physical & Social Science | 0 (0.0%) | 11 (100.0%) |
| Community & Social Service | 0 (0.0%) | 162 (100.0%) |
| Education, Arts & Media | 0 (0.0%) | 0 (0.0%) |
| Legal Services & Support | 0 (0.0%) | 0 (0.0%) |
| Education Instruction & Library | 0 (0.0%) | 162 (100.0%) |
| Arts, Media & Entertainment | 0 (0.0%) | 0 (0.0%) |
| Health Diagnosing & Treating | 0 (0.0%) | 0 (0.0%) |
| Health Technologists | 0 (0.0%) | 0 (0.0%) |
| Total (Category) | 51 (20.5%) | 198 (79.5%) |
| Total (Overall) | 330 (38.8%) | 520 (61.2%) |
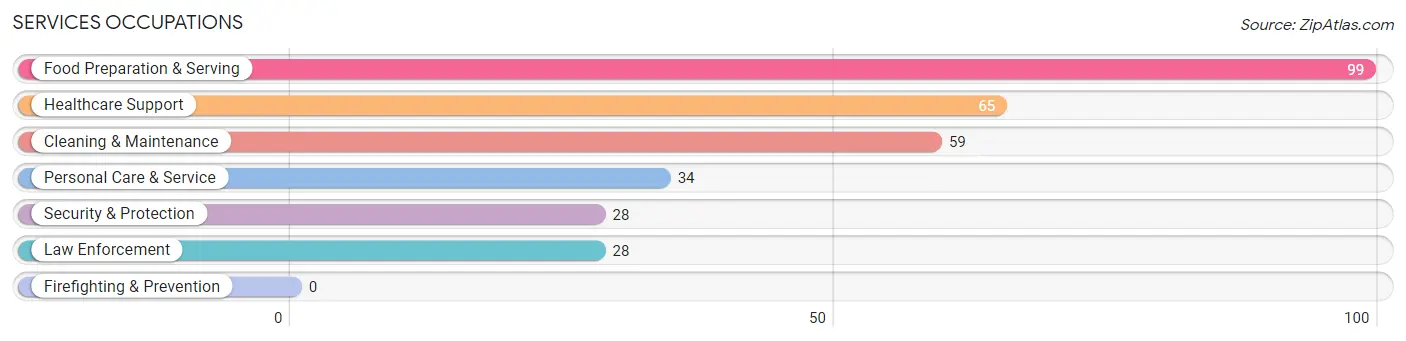
Services Occupations
The most common Services occupations in Lincoln are Food Preparation & Serving (99 | 11.7%), Healthcare Support (65 | 7.6%), Cleaning & Maintenance (59 | 6.9%), Personal Care & Service (34 | 4.0%), and Security & Protection (28 | 3.3%).
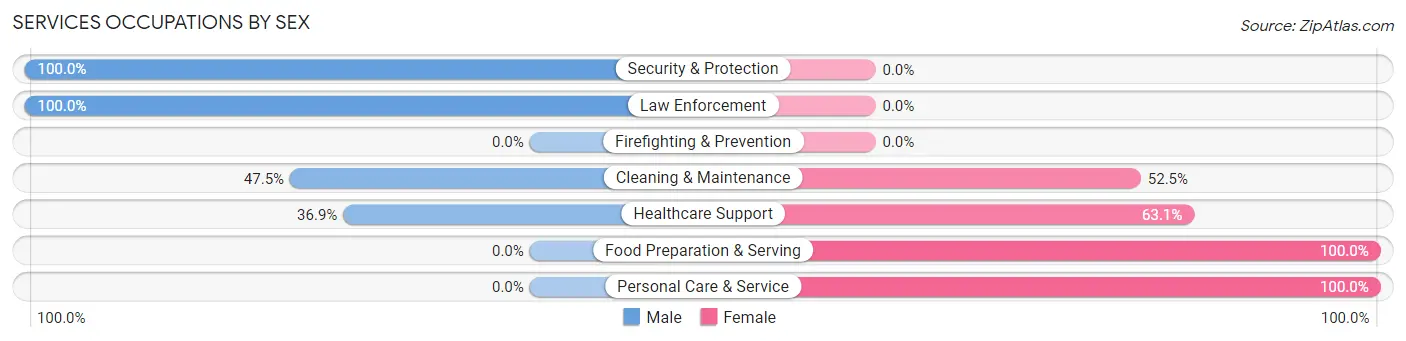
Services Occupations by Sex
Within the Services occupations in Lincoln, the most male-oriented occupations are Security & Protection (100.0%), Law Enforcement (100.0%), and Cleaning & Maintenance (47.5%), while the most female-oriented occupations are Food Preparation & Serving (100.0%), Personal Care & Service (100.0%), and Healthcare Support (63.1%).
| Occupation | Male | Female |
| Healthcare Support | 24 (36.9%) | 41 (63.1%) |
| Security & Protection | 28 (100.0%) | 0 (0.0%) |
| Firefighting & Prevention | 0 (0.0%) | 0 (0.0%) |
| Law Enforcement | 28 (100.0%) | 0 (0.0%) |
| Food Preparation & Serving | 0 (0.0%) | 99 (100.0%) |
| Cleaning & Maintenance | 28 (47.5%) | 31 (52.5%) |
| Personal Care & Service | 0 (0.0%) | 34 (100.0%) |
| Total (Category) | 80 (28.1%) | 205 (71.9%) |
| Total (Overall) | 330 (38.8%) | 520 (61.2%) |
Sales and Office Occupations
The most common Sales and Office occupations in Lincoln are Sales & Related (76 | 8.9%), and Office & Administration (50 | 5.9%).
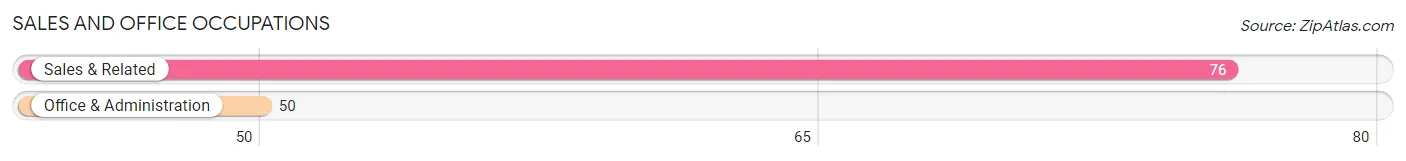
Sales and Office Occupations by Sex
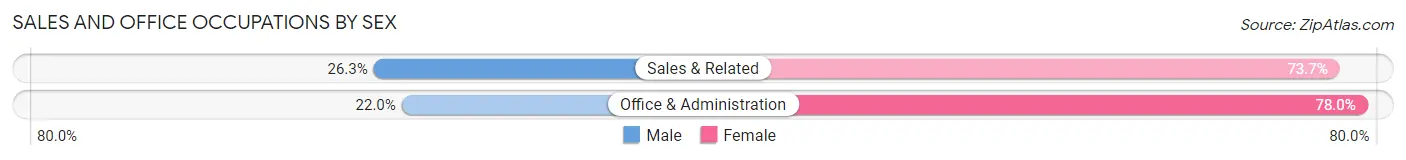
| Occupation | Male | Female |
| Sales & Related | 20 (26.3%) | 56 (73.7%) |
| Office & Administration | 11 (22.0%) | 39 (78.0%) |
| Total (Category) | 31 (24.6%) | 95 (75.4%) |
| Total (Overall) | 330 (38.8%) | 520 (61.2%) |
Natural Resources, Construction and Maintenance Occupations
The most common Natural Resources, Construction and Maintenance occupations in Lincoln are Farming, Fishing & Forestry (45 | 5.3%), and Installation, Maintenance & Repair (40 | 4.7%).
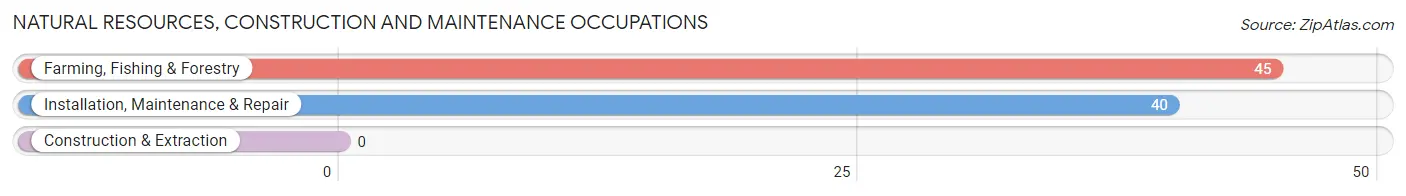
Natural Resources, Construction and Maintenance Occupations by Sex
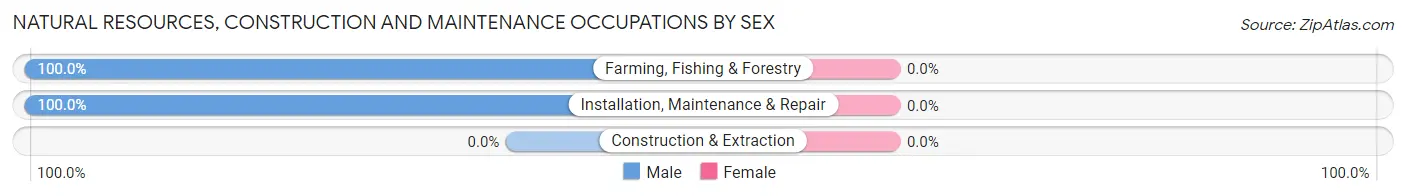
| Occupation | Male | Female |
| Farming, Fishing & Forestry | 45 (100.0%) | 0 (0.0%) |
| Construction & Extraction | 0 (0.0%) | 0 (0.0%) |
| Installation, Maintenance & Repair | 40 (100.0%) | 0 (0.0%) |
| Total (Category) | 85 (100.0%) | 0 (0.0%) |
| Total (Overall) | 330 (38.8%) | 520 (61.2%) |
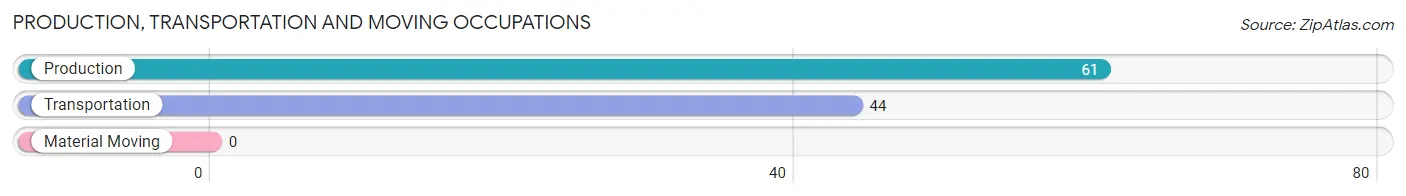
Production, Transportation and Moving Occupations
The most common Production, Transportation and Moving occupations in Lincoln are Production (61 | 7.2%), and Transportation (44 | 5.2%).
Production, Transportation and Moving Occupations by Sex
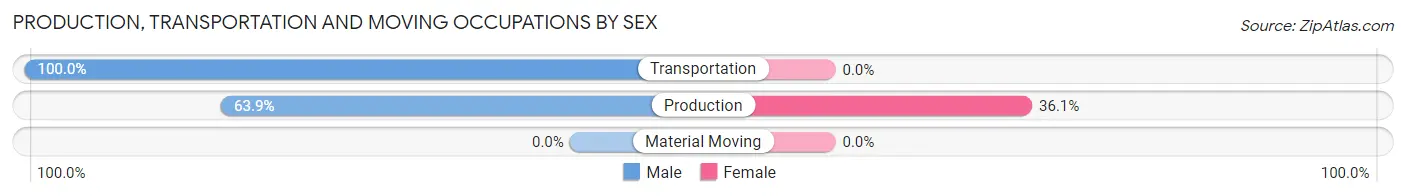
| Occupation | Male | Female |
| Production | 39 (63.9%) | 22 (36.1%) |
| Transportation | 44 (100.0%) | 0 (0.0%) |
| Material Moving | 0 (0.0%) | 0 (0.0%) |
| Total (Category) | 83 (79.0%) | 22 (20.9%) |
| Total (Overall) | 330 (38.8%) | 520 (61.2%) |
Employment Industries by Sex in Lincoln
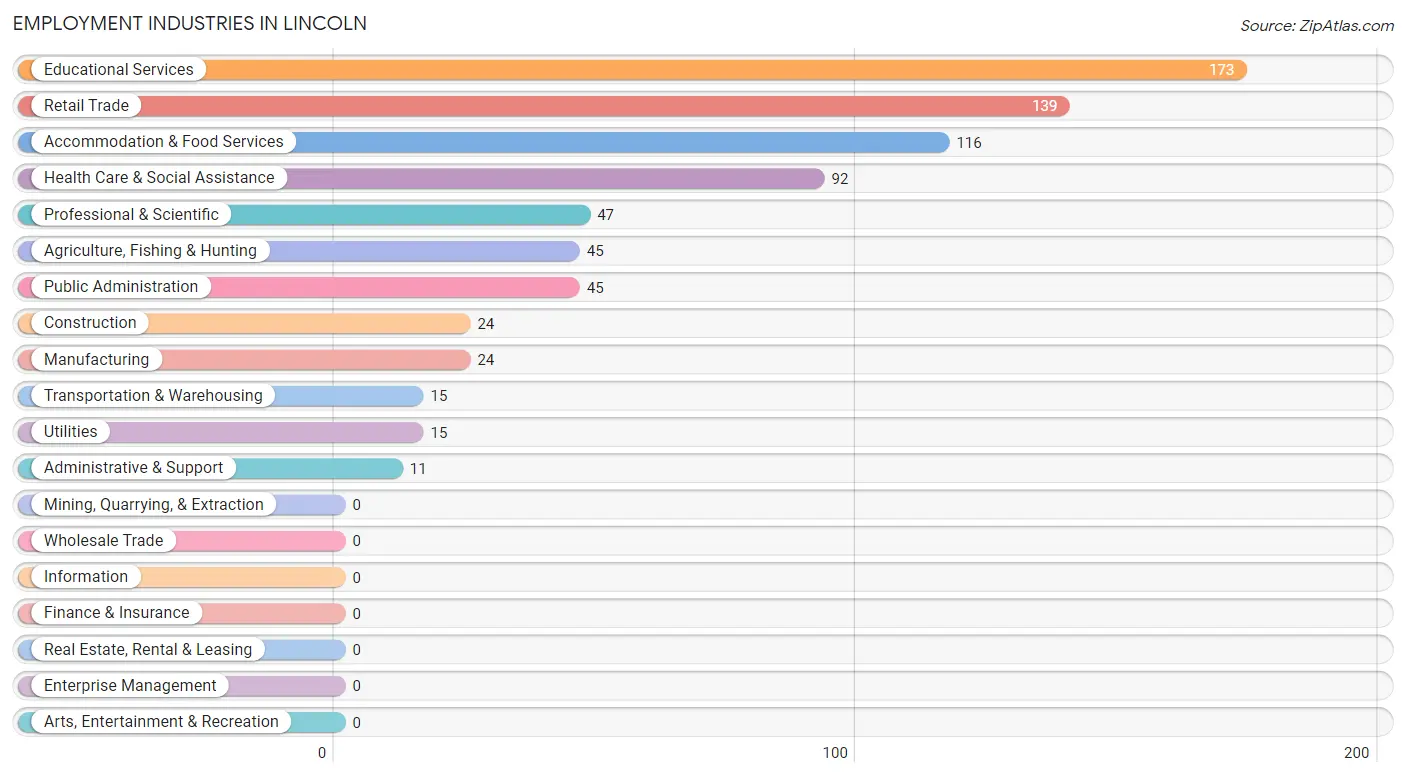
Employment Industries in Lincoln
The major employment industries in Lincoln include Educational Services (173 | 20.3%), Retail Trade (139 | 16.4%), Accommodation & Food Services (116 | 13.7%), Health Care & Social Assistance (92 | 10.8%), and Professional & Scientific (47 | 5.5%).
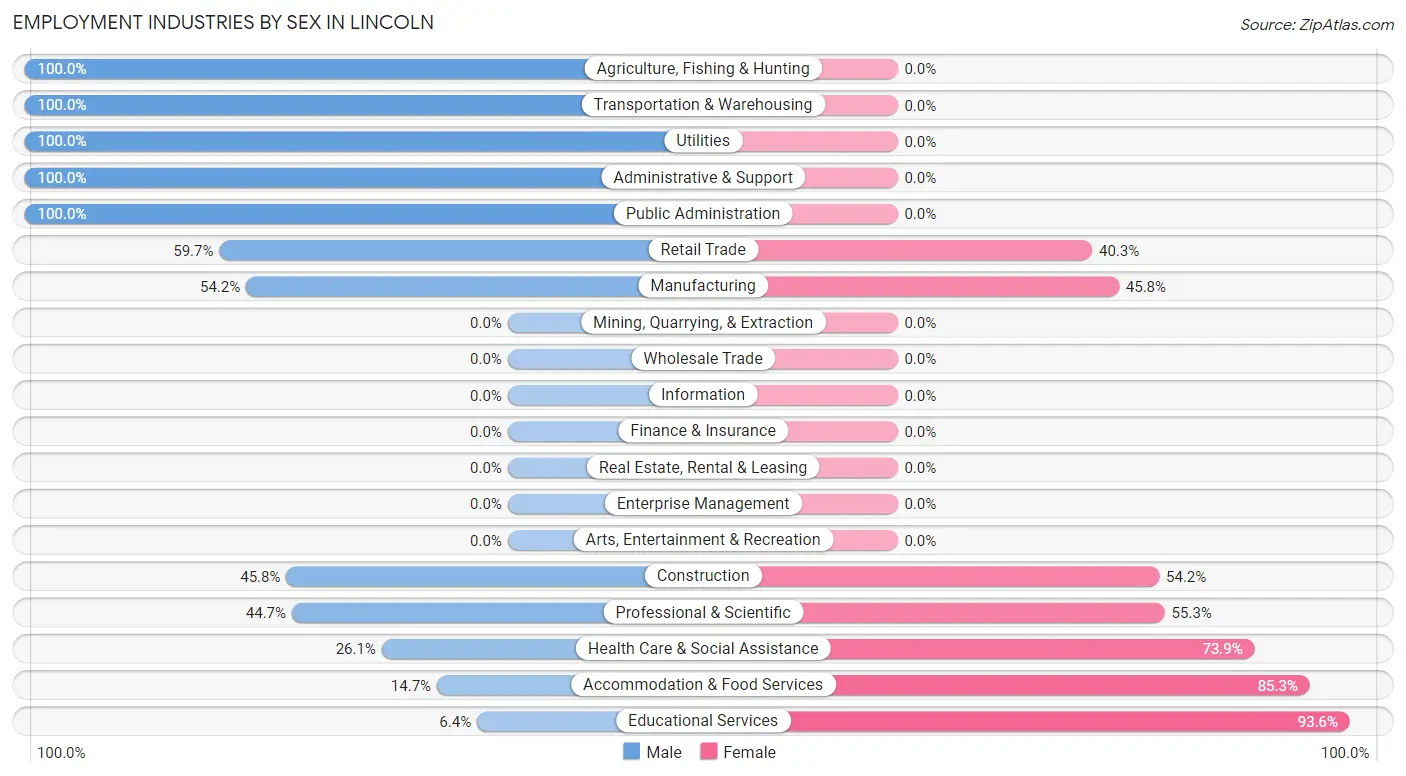
Employment Industries by Sex in Lincoln
The Lincoln industries that see more men than women are Agriculture, Fishing & Hunting (100.0%), Transportation & Warehousing (100.0%), and Utilities (100.0%), whereas the industries that tend to have a higher number of women are Educational Services (93.6%), Accommodation & Food Services (85.3%), and Health Care & Social Assistance (73.9%).
| Industry | Male | Female |
| Agriculture, Fishing & Hunting | 45 (100.0%) | 0 (0.0%) |
| Mining, Quarrying, & Extraction | 0 (0.0%) | 0 (0.0%) |
| Construction | 11 (45.8%) | 13 (54.2%) |
| Manufacturing | 13 (54.2%) | 11 (45.8%) |
| Wholesale Trade | 0 (0.0%) | 0 (0.0%) |
| Retail Trade | 83 (59.7%) | 56 (40.3%) |
| Transportation & Warehousing | 15 (100.0%) | 0 (0.0%) |
| Utilities | 15 (100.0%) | 0 (0.0%) |
| Information | 0 (0.0%) | 0 (0.0%) |
| Finance & Insurance | 0 (0.0%) | 0 (0.0%) |
| Real Estate, Rental & Leasing | 0 (0.0%) | 0 (0.0%) |
| Professional & Scientific | 21 (44.7%) | 26 (55.3%) |
| Enterprise Management | 0 (0.0%) | 0 (0.0%) |
| Administrative & Support | 11 (100.0%) | 0 (0.0%) |
| Educational Services | 11 (6.4%) | 162 (93.6%) |
| Health Care & Social Assistance | 24 (26.1%) | 68 (73.9%) |
| Arts, Entertainment & Recreation | 0 (0.0%) | 0 (0.0%) |
| Accommodation & Food Services | 17 (14.7%) | 99 (85.3%) |
| Public Administration | 45 (100.0%) | 0 (0.0%) |
| Total | 330 (38.8%) | 520 (61.2%) |
Education in Lincoln
School Enrollment in Lincoln
The most common levels of schooling among the 302 students in Lincoln are middle school (110 | 36.4%), high school (61 | 20.2%), and elementary school (48 | 15.9%).
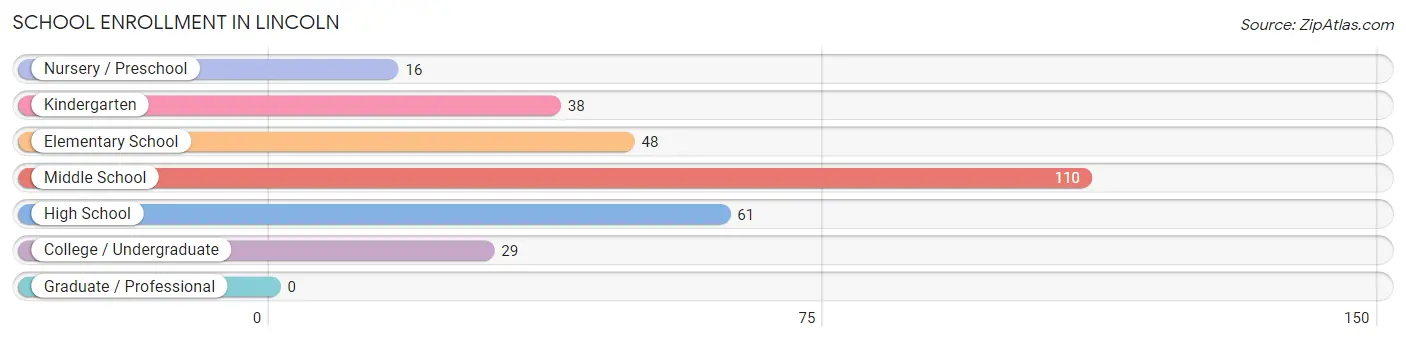
| School Level | # Students | % Students |
| Nursery / Preschool | 16 | 5.3% |
| Kindergarten | 38 | 12.6% |
| Elementary School | 48 | 15.9% |
| Middle School | 110 | 36.4% |
| High School | 61 | 20.2% |
| College / Undergraduate | 29 | 9.6% |
| Graduate / Professional | 0 | 0.0% |
| Total | 302 | 100.0% |
School Enrollment by Age by Funding Source in Lincoln
Out of a total of 302 students who are enrolled in schools in Lincoln, 48 (15.9%) attend a private institution, while the remaining 254 (84.1%) are enrolled in public schools. The age group of 3 to 4 year olds has the highest likelihood of being enrolled in private schools, with 16 (100.0% in the age bracket) enrolled. Conversely, the age group of 5 to 9 year old has the lowest likelihood of being enrolled in a private school, with 86 (100.0% in the age bracket) attending a public institution.
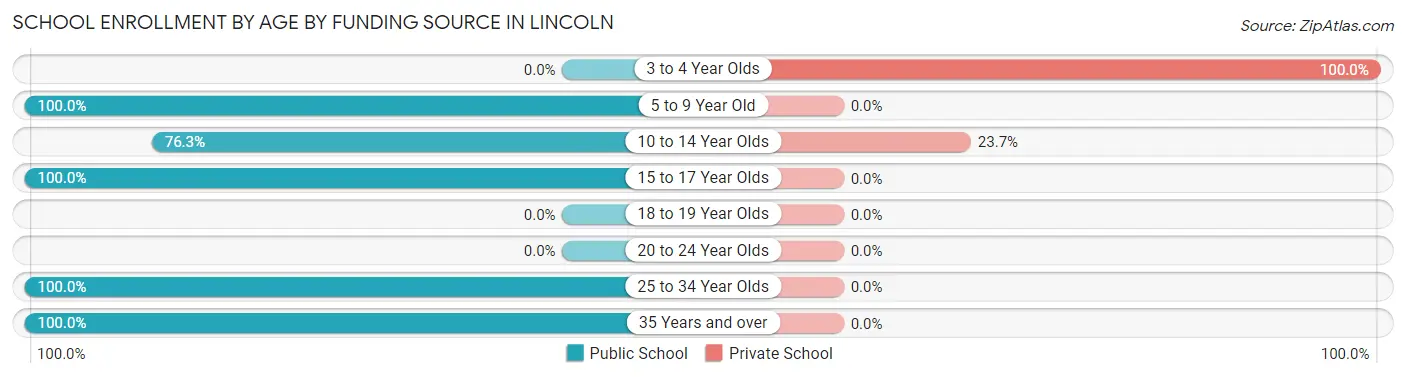
| Age Bracket | Public School | Private School |
| 3 to 4 Year Olds | 0 (0.0%) | 16 (100.0%) |
| 5 to 9 Year Old | 86 (100.0%) | 0 (0.0%) |
| 10 to 14 Year Olds | 103 (76.3%) | 32 (23.7%) |
| 15 to 17 Year Olds | 36 (100.0%) | 0 (0.0%) |
| 18 to 19 Year Olds | 0 (0.0%) | 0 (0.0%) |
| 20 to 24 Year Olds | 0 (0.0%) | 0 (0.0%) |
| 25 to 34 Year Olds | 12 (100.0%) | 0 (0.0%) |
| 35 Years and over | 17 (100.0%) | 0 (0.0%) |
| Total | 254 (84.1%) | 48 (15.9%) |
Educational Attainment by Field of Study in Lincoln
Arts & humanities (130 | 35.2%), bio, nature & agricultural (76 | 20.6%), education (53 | 14.4%), engineering (37 | 10.0%), and computers & mathematics (21 | 5.7%) are the most common fields of study among 369 individuals in Lincoln who have obtained a bachelor's degree or higher.
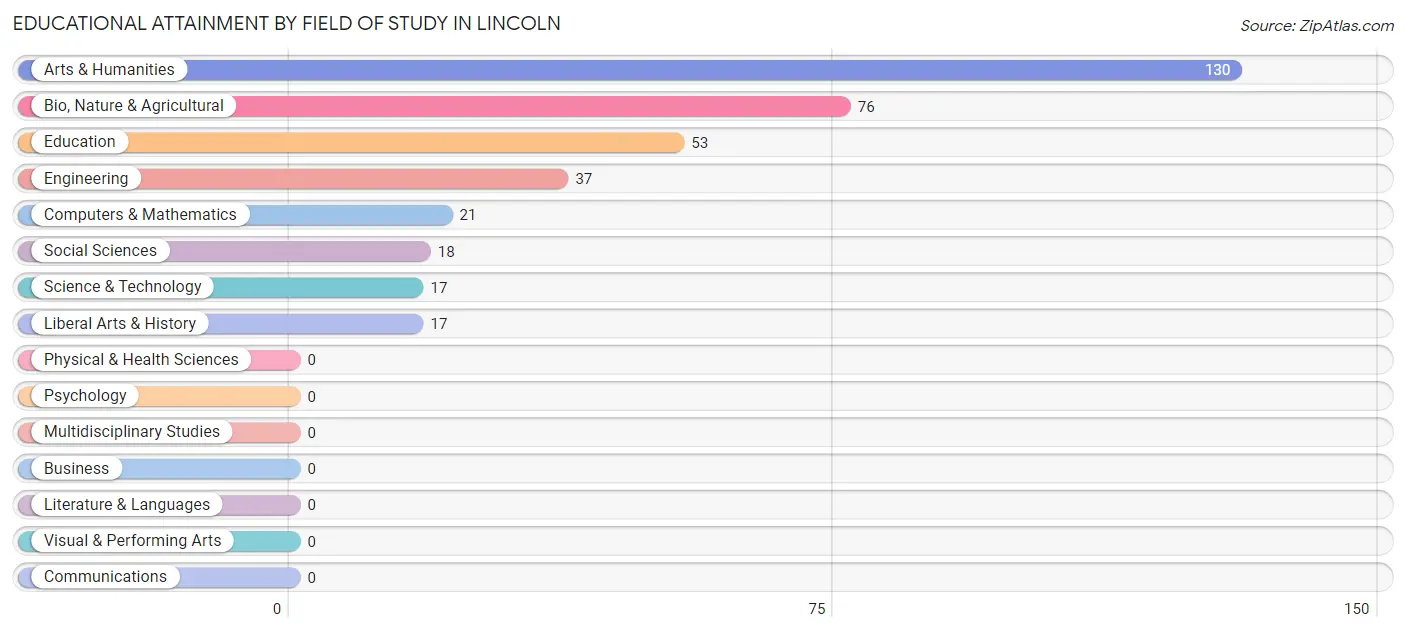
| Field of Study | # Graduates | % Graduates |
| Computers & Mathematics | 21 | 5.7% |
| Bio, Nature & Agricultural | 76 | 20.6% |
| Physical & Health Sciences | 0 | 0.0% |
| Psychology | 0 | 0.0% |
| Social Sciences | 18 | 4.9% |
| Engineering | 37 | 10.0% |
| Multidisciplinary Studies | 0 | 0.0% |
| Science & Technology | 17 | 4.6% |
| Business | 0 | 0.0% |
| Education | 53 | 14.4% |
| Literature & Languages | 0 | 0.0% |
| Liberal Arts & History | 17 | 4.6% |
| Visual & Performing Arts | 0 | 0.0% |
| Communications | 0 | 0.0% |
| Arts & Humanities | 130 | 35.2% |
| Total | 369 | 100.0% |
Transportation & Commute in Lincoln
Vehicle Availability by Sex in Lincoln
The most prevalent vehicle ownership categories in Lincoln are males with 2 vehicles (155, accounting for 40.6%) and females with 2 vehicles (150, making up 29.8%).
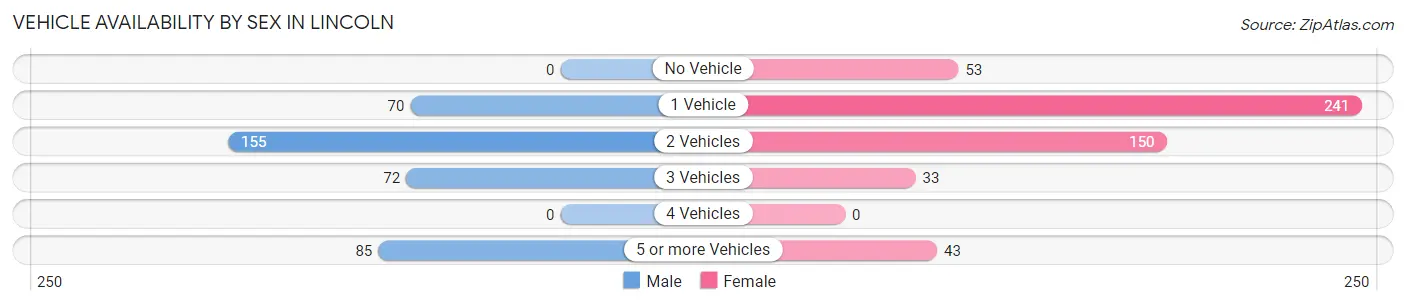
| Vehicles Available | Male | Female |
| No Vehicle | 0 (0.0%) | 53 (10.2%) |
| 1 Vehicle | 70 (18.3%) | 241 (46.4%) |
| 2 Vehicles | 155 (40.6%) | 150 (28.8%) |
| 3 Vehicles | 72 (18.9%) | 33 (6.4%) |
| 4 Vehicles | 0 (0.0%) | 0 (0.0%) |
| 5 or more Vehicles | 85 (22.3%) | 43 (8.3%) |
| Total | 382 (100.0%) | 520 (100.0%) |
Commute Time in Lincoln
The most frequently occuring commute durations in Lincoln are 10 to 14 minutes (224 commuters, 25.1%), 5 to 9 minutes (208 commuters, 23.3%), and less than 5 minutes (90 commuters, 10.1%).
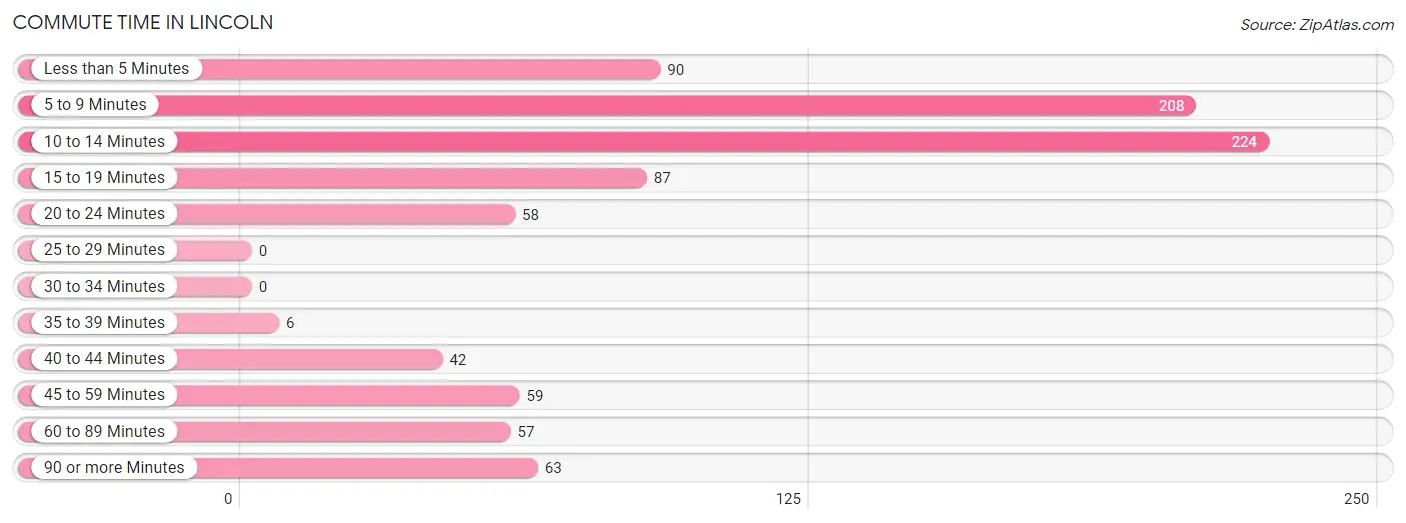
| Commute Time | # Commuters | % Commuters |
| Less than 5 Minutes | 90 | 10.1% |
| 5 to 9 Minutes | 208 | 23.3% |
| 10 to 14 Minutes | 224 | 25.1% |
| 15 to 19 Minutes | 87 | 9.7% |
| 20 to 24 Minutes | 58 | 6.5% |
| 25 to 29 Minutes | 0 | 0.0% |
| 30 to 34 Minutes | 0 | 0.0% |
| 35 to 39 Minutes | 6 | 0.7% |
| 40 to 44 Minutes | 42 | 4.7% |
| 45 to 59 Minutes | 59 | 6.6% |
| 60 to 89 Minutes | 57 | 6.4% |
| 90 or more Minutes | 63 | 7.0% |
Commute Time by Sex in Lincoln
The most common commute times in Lincoln are 15 to 19 minutes (72 commuters, 18.9%) for males and 5 to 9 minutes (167 commuters, 32.6%) for females.
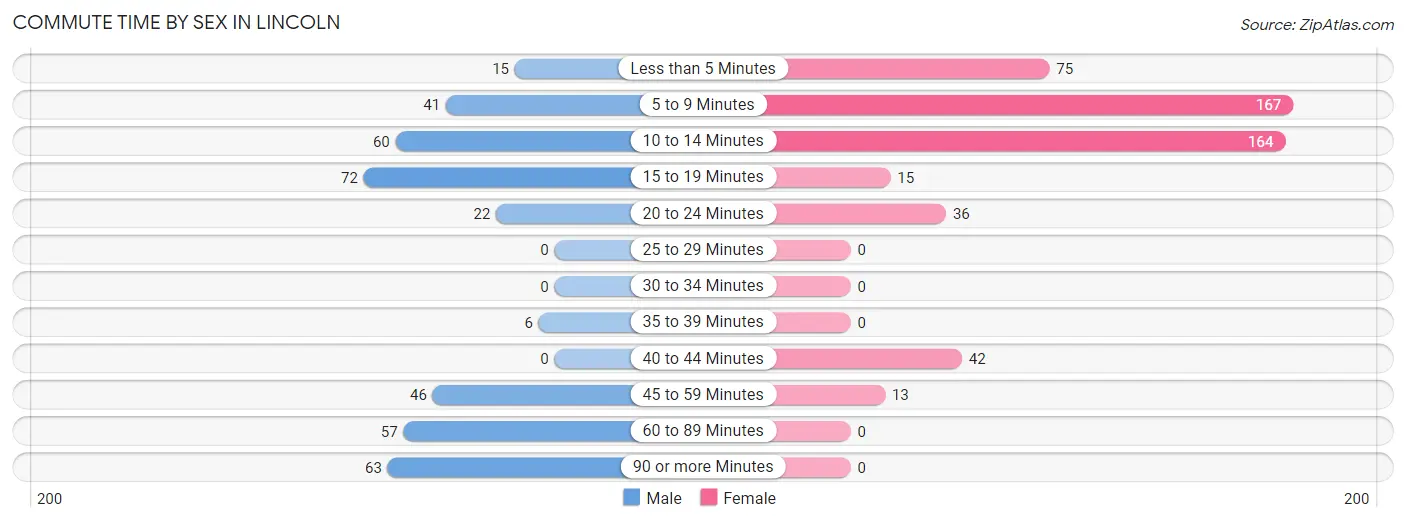
| Commute Time | Male | Female |
| Less than 5 Minutes | 15 (3.9%) | 75 (14.6%) |
| 5 to 9 Minutes | 41 (10.7%) | 167 (32.6%) |
| 10 to 14 Minutes | 60 (15.7%) | 164 (32.0%) |
| 15 to 19 Minutes | 72 (18.9%) | 15 (2.9%) |
| 20 to 24 Minutes | 22 (5.8%) | 36 (7.0%) |
| 25 to 29 Minutes | 0 (0.0%) | 0 (0.0%) |
| 30 to 34 Minutes | 0 (0.0%) | 0 (0.0%) |
| 35 to 39 Minutes | 6 (1.6%) | 0 (0.0%) |
| 40 to 44 Minutes | 0 (0.0%) | 42 (8.2%) |
| 45 to 59 Minutes | 46 (12.0%) | 13 (2.5%) |
| 60 to 89 Minutes | 57 (14.9%) | 0 (0.0%) |
| 90 or more Minutes | 63 (16.5%) | 0 (0.0%) |
Time of Departure to Work by Sex in Lincoln
The most frequent times of departure to work in Lincoln are 5:30 AM to 5:59 AM (55, 14.4%) for males and 4:00 PM to 11:59 PM (149, 29.1%) for females.
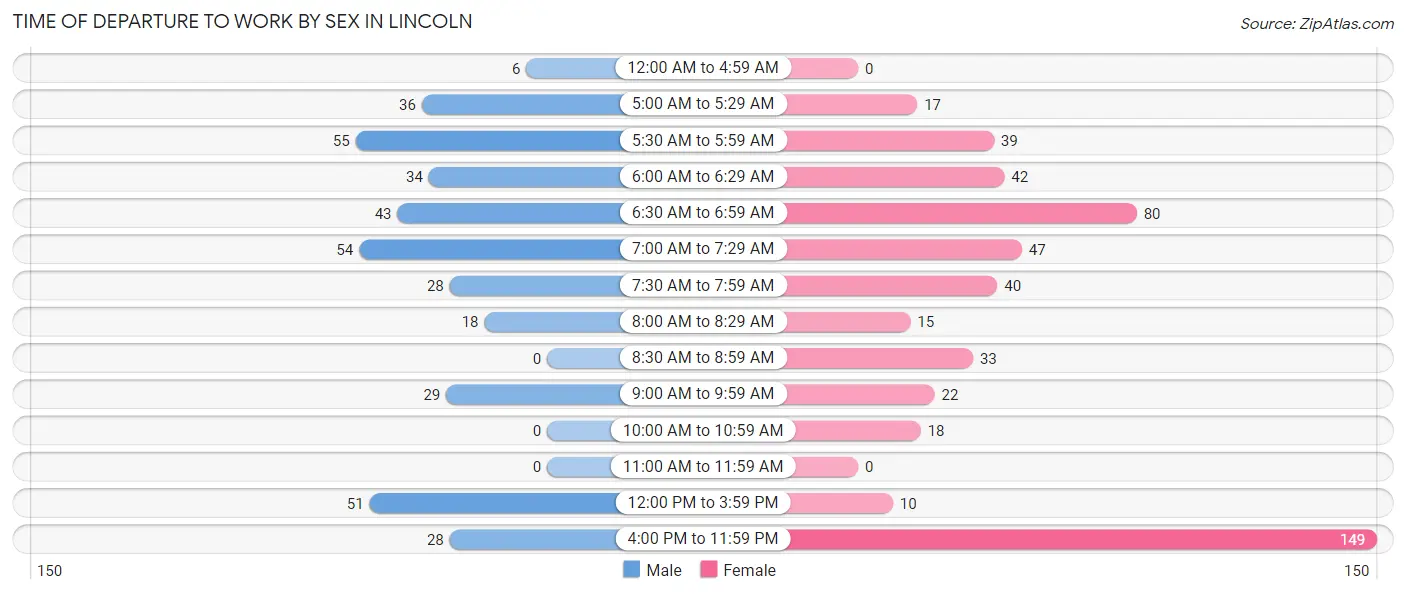
| Time of Departure | Male | Female |
| 12:00 AM to 4:59 AM | 6 (1.6%) | 0 (0.0%) |
| 5:00 AM to 5:29 AM | 36 (9.4%) | 17 (3.3%) |
| 5:30 AM to 5:59 AM | 55 (14.4%) | 39 (7.6%) |
| 6:00 AM to 6:29 AM | 34 (8.9%) | 42 (8.2%) |
| 6:30 AM to 6:59 AM | 43 (11.3%) | 80 (15.6%) |
| 7:00 AM to 7:29 AM | 54 (14.1%) | 47 (9.2%) |
| 7:30 AM to 7:59 AM | 28 (7.3%) | 40 (7.8%) |
| 8:00 AM to 8:29 AM | 18 (4.7%) | 15 (2.9%) |
| 8:30 AM to 8:59 AM | 0 (0.0%) | 33 (6.5%) |
| 9:00 AM to 9:59 AM | 29 (7.6%) | 22 (4.3%) |
| 10:00 AM to 10:59 AM | 0 (0.0%) | 18 (3.5%) |
| 11:00 AM to 11:59 AM | 0 (0.0%) | 0 (0.0%) |
| 12:00 PM to 3:59 PM | 51 (13.4%) | 10 (1.9%) |
| 4:00 PM to 11:59 PM | 28 (7.3%) | 149 (29.1%) |
| Total | 382 (100.0%) | 512 (100.0%) |
Housing Occupancy in Lincoln
Occupancy by Ownership in Lincoln
Of the total 1,355 dwellings in Lincoln, owner-occupied units account for 816 (60.2%), while renter-occupied units make up 539 (39.8%).
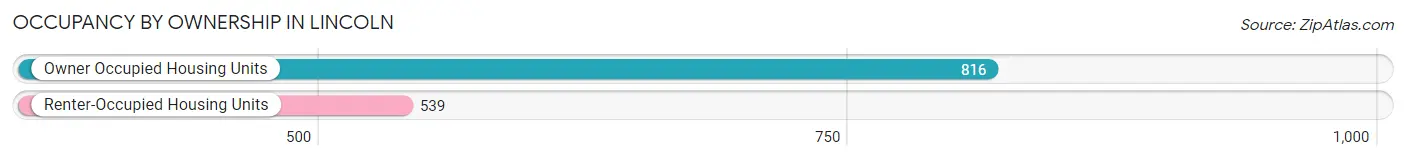
| Occupancy | # Housing Units | % Housing Units |
| Owner Occupied Housing Units | 816 | 60.2% |
| Renter-Occupied Housing Units | 539 | 39.8% |
| Total Occupied Housing Units | 1,355 | 100.0% |
Occupancy by Household Size in Lincoln
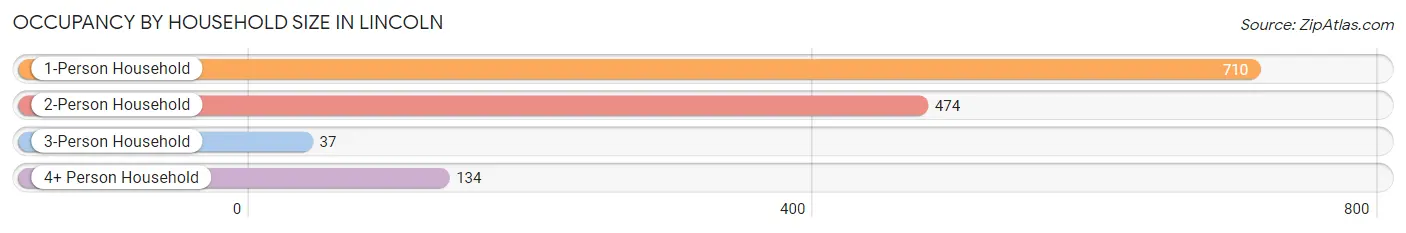
| Household Size | # Housing Units | % Housing Units |
| 1-Person Household | 710 | 52.4% |
| 2-Person Household | 474 | 35.0% |
| 3-Person Household | 37 | 2.7% |
| 4+ Person Household | 134 | 9.9% |
| Total Housing Units | 1,355 | 100.0% |
Occupancy by Ownership by Household Size in Lincoln
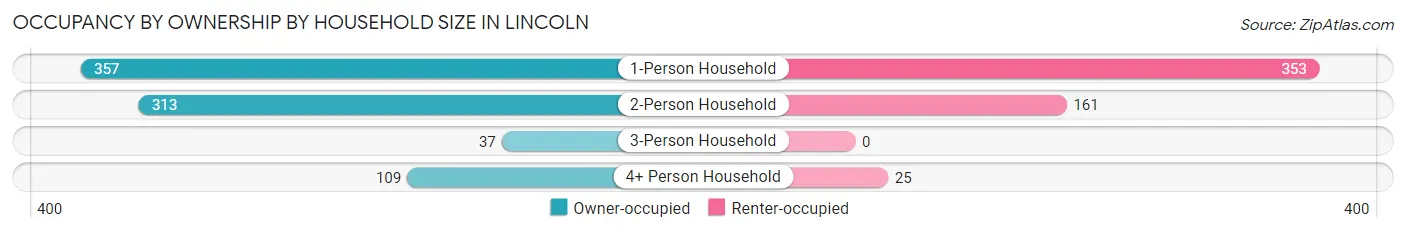
| Household Size | Owner-occupied | Renter-occupied |
| 1-Person Household | 357 (50.3%) | 353 (49.7%) |
| 2-Person Household | 313 (66.0%) | 161 (34.0%) |
| 3-Person Household | 37 (100.0%) | 0 (0.0%) |
| 4+ Person Household | 109 (81.3%) | 25 (18.7%) |
| Total Housing Units | 816 (60.2%) | 539 (39.8%) |
Occupancy by Educational Attainment in Lincoln
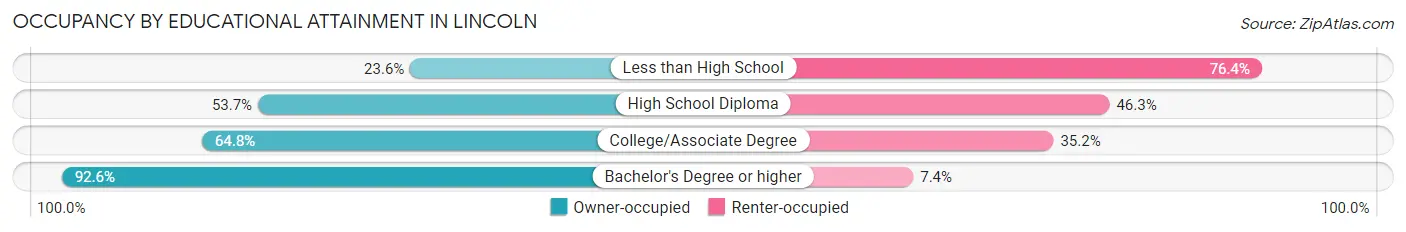
| Household Size | Owner-occupied | Renter-occupied |
| Less than High School | 41 (23.6%) | 133 (76.4%) |
| High School Diploma | 266 (53.7%) | 229 (46.3%) |
| College/Associate Degree | 295 (64.8%) | 160 (35.2%) |
| Bachelor's Degree or higher | 214 (92.6%) | 17 (7.4%) |
Occupancy by Age of Householder in Lincoln
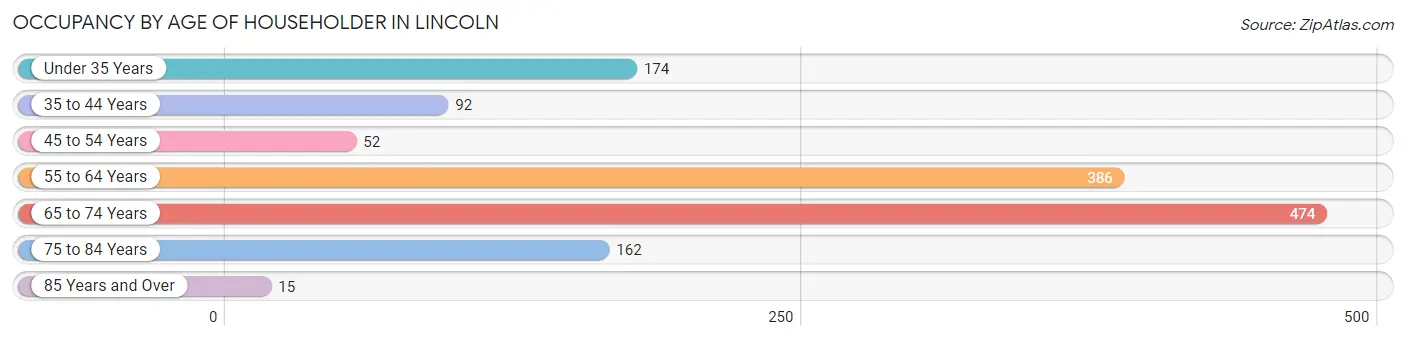
| Age Bracket | # Households | % Households |
| Under 35 Years | 174 | 12.8% |
| 35 to 44 Years | 92 | 6.8% |
| 45 to 54 Years | 52 | 3.8% |
| 55 to 64 Years | 386 | 28.5% |
| 65 to 74 Years | 474 | 35.0% |
| 75 to 84 Years | 162 | 12.0% |
| 85 Years and Over | 15 | 1.1% |
| Total | 1,355 | 100.0% |
Housing Finances in Lincoln
Median Income by Occupancy in Lincoln
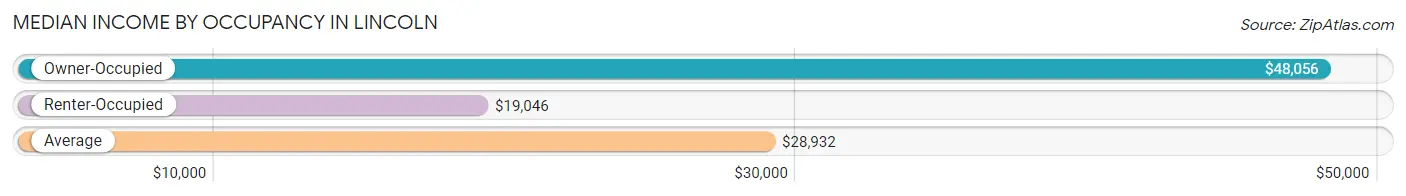
| Occupancy Type | # Households | Median Income |
| Owner-Occupied | 816 (60.2%) | $48,056 |
| Renter-Occupied | 539 (39.8%) | $19,046 |
| Average | 1,355 (100.0%) | $28,932 |
Occupancy by Householder Income Bracket in Lincoln
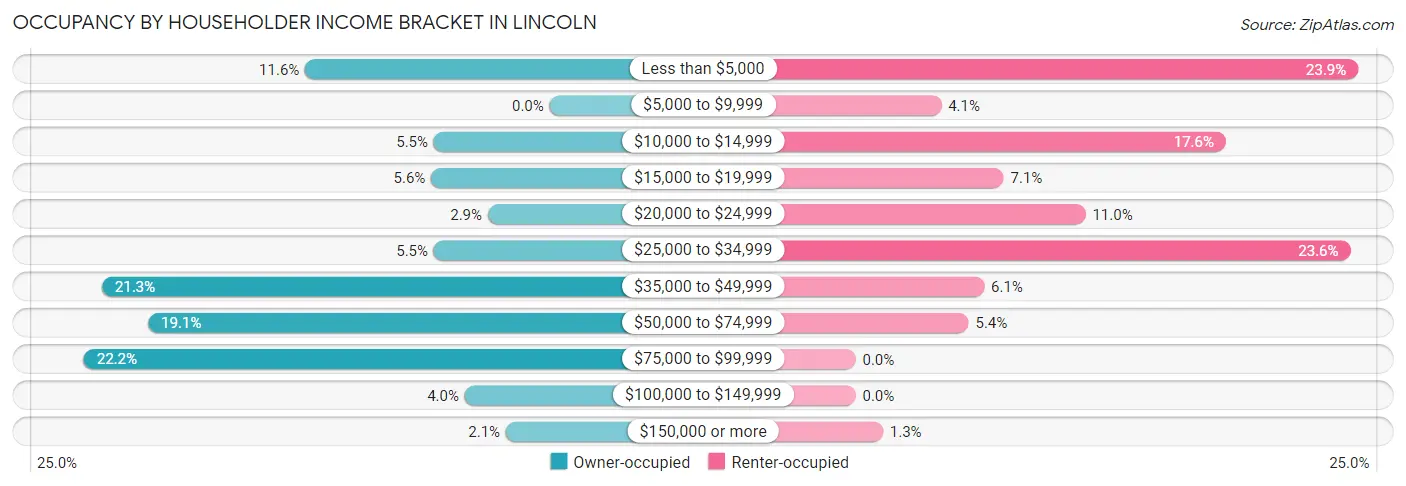
| Income Bracket | Owner-occupied | Renter-occupied |
| Less than $5,000 | 95 (11.6%) | 129 (23.9%) |
| $5,000 to $9,999 | 0 (0.0%) | 22 (4.1%) |
| $10,000 to $14,999 | 45 (5.5%) | 95 (17.6%) |
| $15,000 to $19,999 | 46 (5.6%) | 38 (7.0%) |
| $20,000 to $24,999 | 24 (2.9%) | 59 (11.0%) |
| $25,000 to $34,999 | 45 (5.5%) | 127 (23.6%) |
| $35,000 to $49,999 | 174 (21.3%) | 33 (6.1%) |
| $50,000 to $74,999 | 156 (19.1%) | 29 (5.4%) |
| $75,000 to $99,999 | 181 (22.2%) | 0 (0.0%) |
| $100,000 to $149,999 | 33 (4.0%) | 0 (0.0%) |
| $150,000 or more | 17 (2.1%) | 7 (1.3%) |
| Total | 816 (100.0%) | 539 (100.0%) |
Monthly Housing Cost Tiers in Lincoln
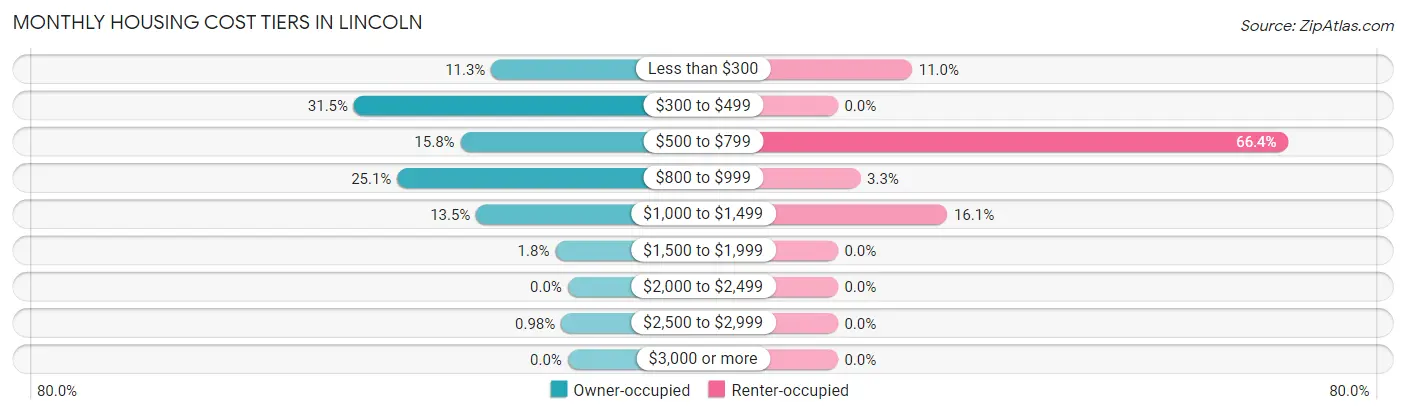
| Monthly Cost | Owner-occupied | Renter-occupied |
| Less than $300 | 92 (11.3%) | 59 (11.0%) |
| $300 to $499 | 257 (31.5%) | 0 (0.0%) |
| $500 to $799 | 129 (15.8%) | 358 (66.4%) |
| $800 to $999 | 205 (25.1%) | 18 (3.3%) |
| $1,000 to $1,499 | 110 (13.5%) | 87 (16.1%) |
| $1,500 to $1,999 | 15 (1.8%) | 0 (0.0%) |
| $2,000 to $2,499 | 0 (0.0%) | 0 (0.0%) |
| $2,500 to $2,999 | 8 (1.0%) | 0 (0.0%) |
| $3,000 or more | 0 (0.0%) | 0 (0.0%) |
| Total | 816 (100.0%) | 539 (100.0%) |
Physical Housing Characteristics in Lincoln
Housing Structures in Lincoln
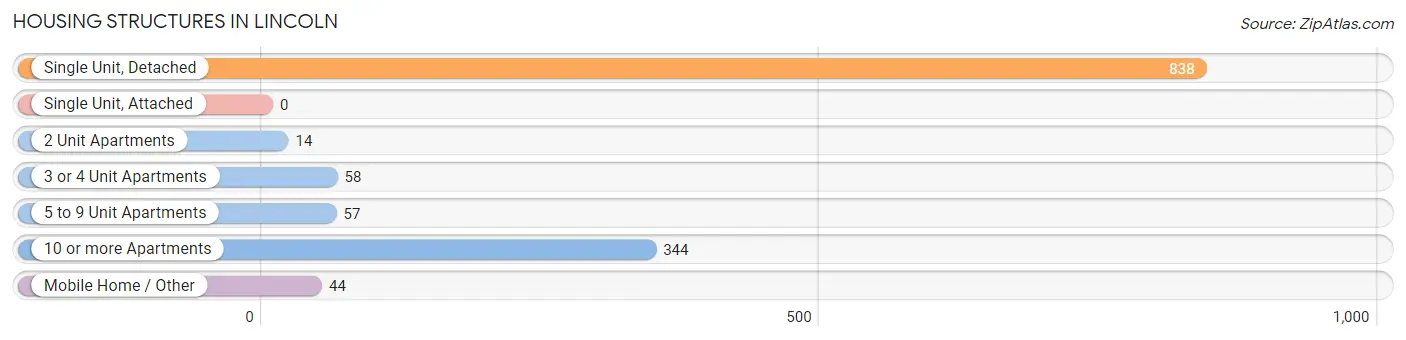
| Structure Type | # Housing Units | % Housing Units |
| Single Unit, Detached | 838 | 61.9% |
| Single Unit, Attached | 0 | 0.0% |
| 2 Unit Apartments | 14 | 1.0% |
| 3 or 4 Unit Apartments | 58 | 4.3% |
| 5 to 9 Unit Apartments | 57 | 4.2% |
| 10 or more Apartments | 344 | 25.4% |
| Mobile Home / Other | 44 | 3.3% |
| Total | 1,355 | 100.0% |
Housing Structures by Occupancy in Lincoln
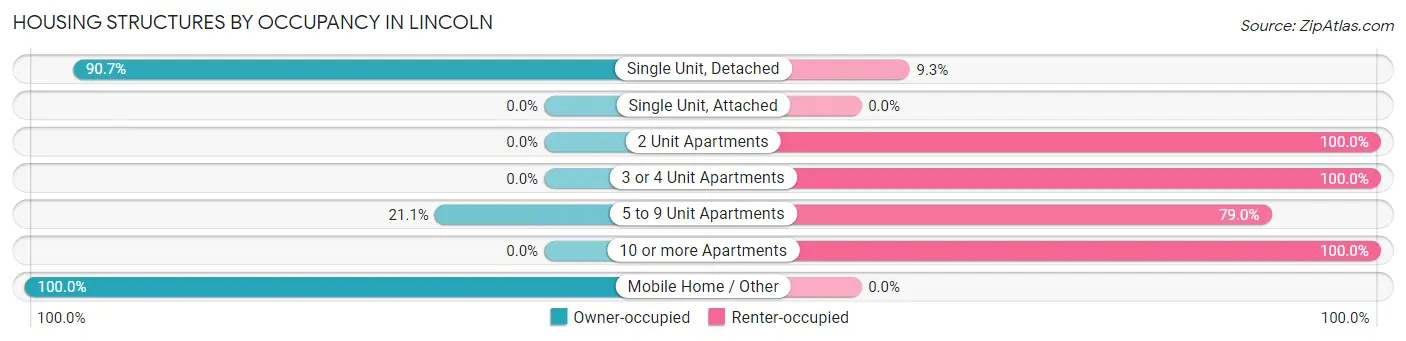
| Structure Type | Owner-occupied | Renter-occupied |
| Single Unit, Detached | 760 (90.7%) | 78 (9.3%) |
| Single Unit, Attached | 0 (0.0%) | 0 (0.0%) |
| 2 Unit Apartments | 0 (0.0%) | 14 (100.0%) |
| 3 or 4 Unit Apartments | 0 (0.0%) | 58 (100.0%) |
| 5 to 9 Unit Apartments | 12 (21.0%) | 45 (78.9%) |
| 10 or more Apartments | 0 (0.0%) | 344 (100.0%) |
| Mobile Home / Other | 44 (100.0%) | 0 (0.0%) |
| Total | 816 (60.2%) | 539 (39.8%) |
Housing Structures by Number of Rooms in Lincoln
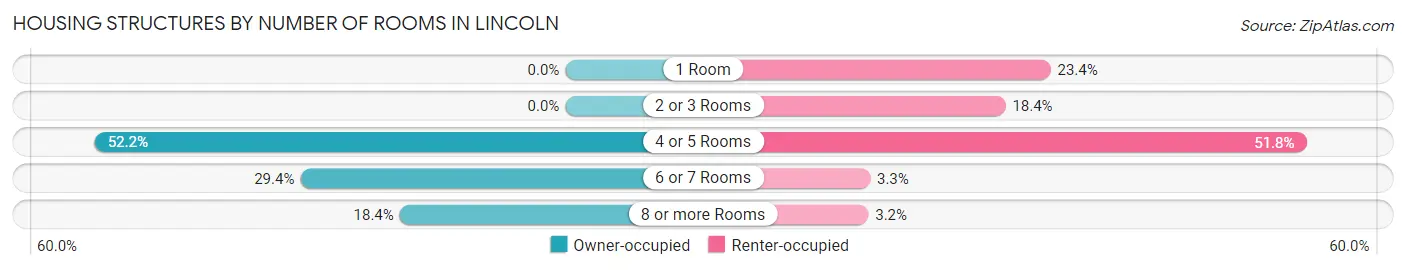
| Number of Rooms | Owner-occupied | Renter-occupied |
| 1 Room | 0 (0.0%) | 126 (23.4%) |
| 2 or 3 Rooms | 0 (0.0%) | 99 (18.4%) |
| 4 or 5 Rooms | 426 (52.2%) | 279 (51.8%) |
| 6 or 7 Rooms | 240 (29.4%) | 18 (3.3%) |
| 8 or more Rooms | 150 (18.4%) | 17 (3.2%) |
| Total | 816 (100.0%) | 539 (100.0%) |
Housing Structure by Heating Type in Lincoln
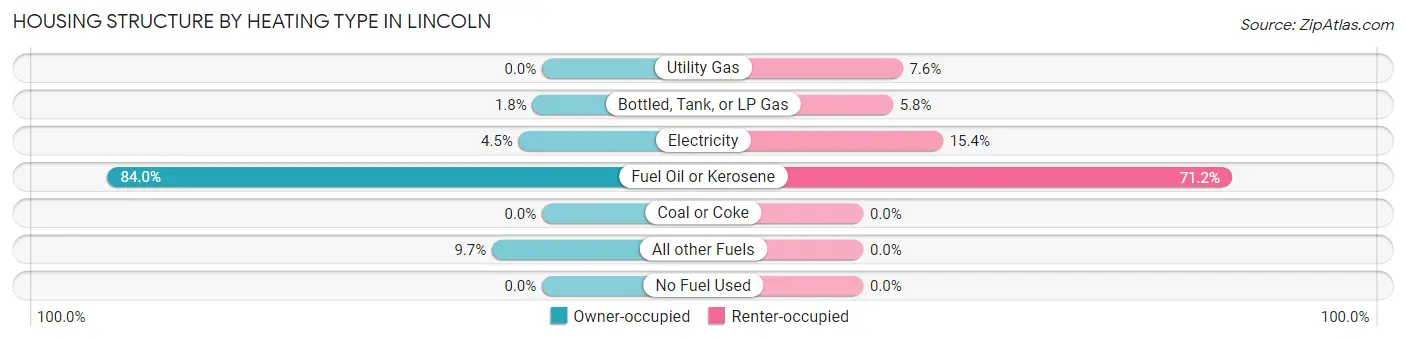
| Heating Type | Owner-occupied | Renter-occupied |
| Utility Gas | 0 (0.0%) | 41 (7.6%) |
| Bottled, Tank, or LP Gas | 15 (1.8%) | 31 (5.8%) |
| Electricity | 37 (4.5%) | 83 (15.4%) |
| Fuel Oil or Kerosene | 685 (84.0%) | 384 (71.2%) |
| Coal or Coke | 0 (0.0%) | 0 (0.0%) |
| All other Fuels | 79 (9.7%) | 0 (0.0%) |
| No Fuel Used | 0 (0.0%) | 0 (0.0%) |
| Total | 816 (100.0%) | 539 (100.0%) |
Household Vehicle Usage in Lincoln
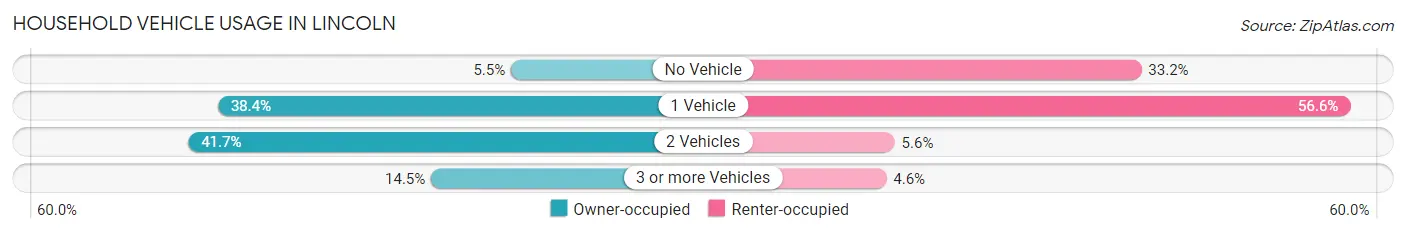
| Vehicles per Household | Owner-occupied | Renter-occupied |
| No Vehicle | 45 (5.5%) | 179 (33.2%) |
| 1 Vehicle | 313 (38.4%) | 305 (56.6%) |
| 2 Vehicles | 340 (41.7%) | 30 (5.6%) |
| 3 or more Vehicles | 118 (14.5%) | 25 (4.6%) |
| Total | 816 (100.0%) | 539 (100.0%) |
Real Estate & Mortgages in Lincoln
Real Estate and Mortgage Overview in Lincoln
| Characteristic | Without Mortgage | With Mortgage |
| Housing Units | 482 | 334 |
| Median Property Value | $112,100 | $136,800 |
| Median Household Income | $43,833 | $17 |
| Monthly Housing Costs | $443 | $0 |
| Real Estate Taxes | $1,629 | $0 |
Property Value by Mortgage Status in Lincoln
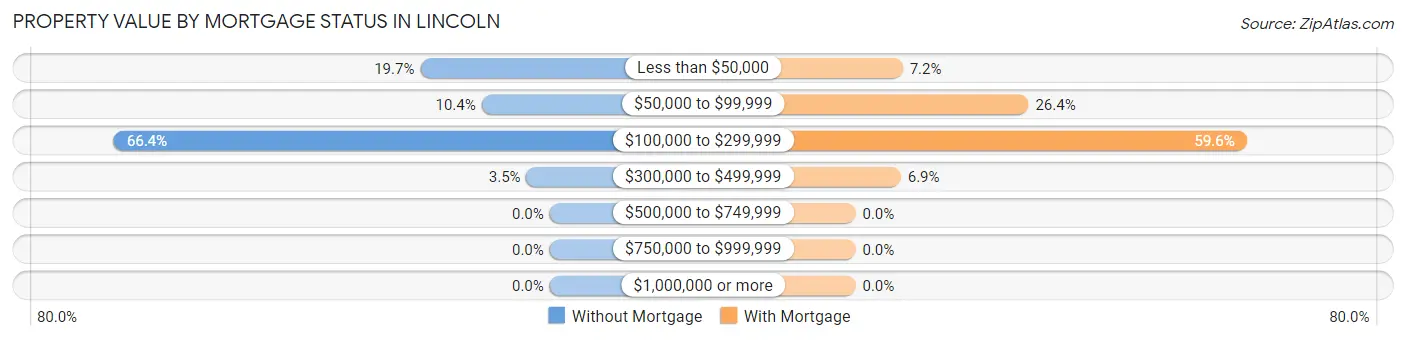
| Property Value | Without Mortgage | With Mortgage |
| Less than $50,000 | 95 (19.7%) | 24 (7.2%) |
| $50,000 to $99,999 | 50 (10.4%) | 88 (26.4%) |
| $100,000 to $299,999 | 320 (66.4%) | 199 (59.6%) |
| $300,000 to $499,999 | 17 (3.5%) | 23 (6.9%) |
| $500,000 to $749,999 | 0 (0.0%) | 0 (0.0%) |
| $750,000 to $999,999 | 0 (0.0%) | 0 (0.0%) |
| $1,000,000 or more | 0 (0.0%) | 0 (0.0%) |
| Total | 482 (100.0%) | 334 (100.0%) |
Household Income by Mortgage Status in Lincoln
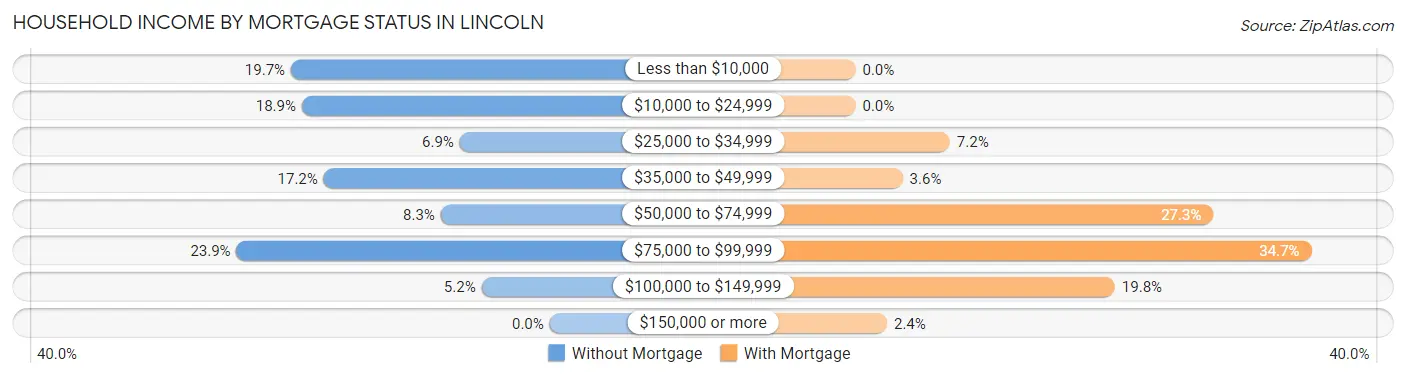
| Household Income | Without Mortgage | With Mortgage |
| Less than $10,000 | 95 (19.7%) | 0 (0.0%) |
| $10,000 to $24,999 | 91 (18.9%) | 0 (0.0%) |
| $25,000 to $34,999 | 33 (6.9%) | 24 (7.2%) |
| $35,000 to $49,999 | 83 (17.2%) | 12 (3.6%) |
| $50,000 to $74,999 | 40 (8.3%) | 91 (27.3%) |
| $75,000 to $99,999 | 115 (23.9%) | 116 (34.7%) |
| $100,000 to $149,999 | 25 (5.2%) | 66 (19.8%) |
| $150,000 or more | 0 (0.0%) | 8 (2.4%) |
| Total | 482 (100.0%) | 334 (100.0%) |
Property Value to Household Income Ratio in Lincoln
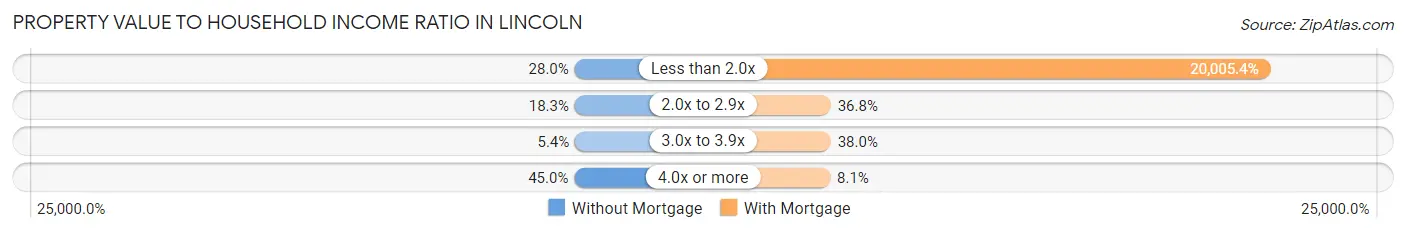
| Value-to-Income Ratio | Without Mortgage | With Mortgage |
| Less than 2.0x | 135 (28.0%) | 66,818 (20,005.4%) |
| 2.0x to 2.9x | 88 (18.3%) | 123 (36.8%) |
| 3.0x to 3.9x | 26 (5.4%) | 127 (38.0%) |
| 4.0x or more | 217 (45.0%) | 27 (8.1%) |
| Total | 482 (100.0%) | 334 (100.0%) |
Real Estate Taxes by Mortgage Status in Lincoln
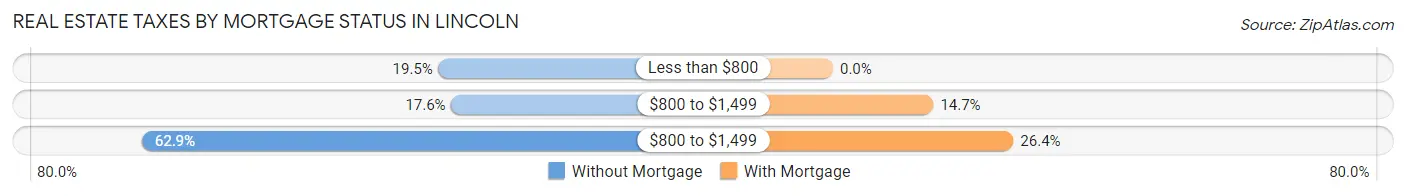
| Property Taxes | Without Mortgage | With Mortgage |
| Less than $800 | 94 (19.5%) | 0 (0.0%) |
| $800 to $1,499 | 85 (17.6%) | 49 (14.7%) |
| $800 to $1,499 | 303 (62.9%) | 88 (26.4%) |
| Total | 482 (100.0%) | 334 (100.0%) |
Health & Disability in Lincoln
Health Insurance Coverage by Age in Lincoln
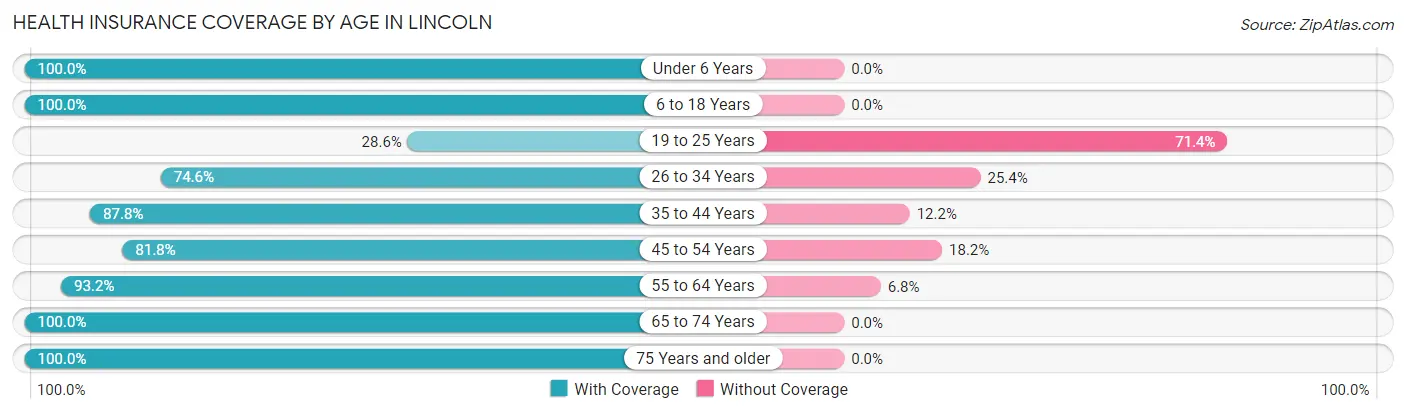
| Age Bracket | With Coverage | Without Coverage |
| Under 6 Years | 90 (100.0%) | 0 (0.0%) |
| 6 to 18 Years | 245 (100.0%) | 0 (0.0%) |
| 19 to 25 Years | 16 (28.6%) | 40 (71.4%) |
| 26 to 34 Years | 182 (74.6%) | 62 (25.4%) |
| 35 to 44 Years | 223 (87.8%) | 31 (12.2%) |
| 45 to 54 Years | 139 (81.8%) | 31 (18.2%) |
| 55 to 64 Years | 411 (93.2%) | 30 (6.8%) |
| 65 to 74 Years | 623 (100.0%) | 0 (0.0%) |
| 75 Years and older | 266 (100.0%) | 0 (0.0%) |
| Total | 2,195 (91.9%) | 194 (8.1%) |
Health Insurance Coverage by Citizenship Status in Lincoln
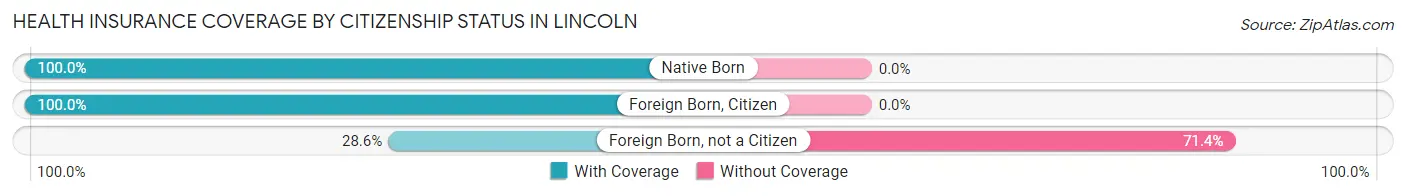
| Citizenship Status | With Coverage | Without Coverage |
| Native Born | 90 (100.0%) | 0 (0.0%) |
| Foreign Born, Citizen | 245 (100.0%) | 0 (0.0%) |
| Foreign Born, not a Citizen | 16 (28.6%) | 40 (71.4%) |
Health Insurance Coverage by Household Income in Lincoln
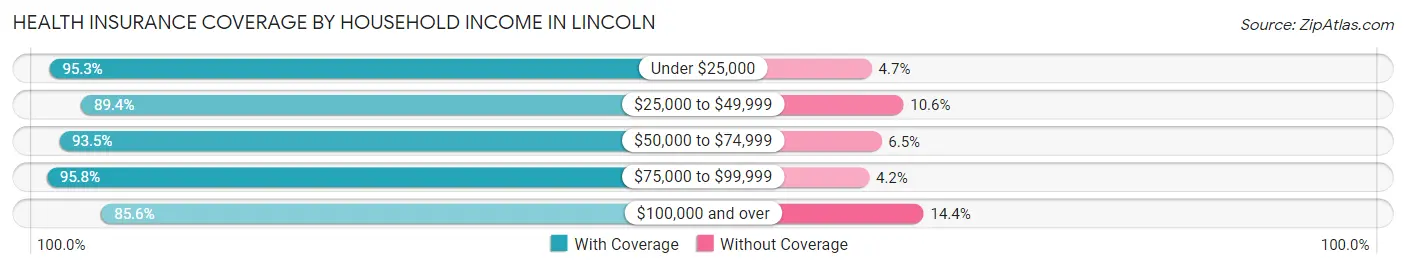
| Household Income | With Coverage | Without Coverage |
| Under $25,000 | 593 (95.3%) | 29 (4.7%) |
| $25,000 to $49,999 | 744 (89.4%) | 88 (10.6%) |
| $50,000 to $74,999 | 289 (93.5%) | 20 (6.5%) |
| $75,000 to $99,999 | 299 (95.8%) | 13 (4.2%) |
| $100,000 and over | 262 (85.6%) | 44 (14.4%) |
Public vs Private Health Insurance Coverage by Age in Lincoln
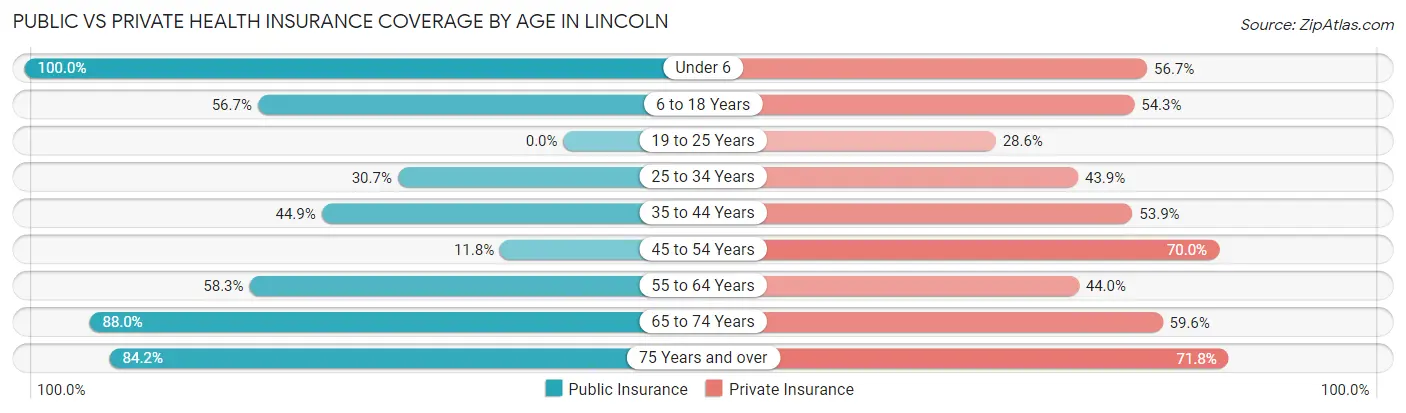
| Age Bracket | Public Insurance | Private Insurance |
| Under 6 | 90 (100.0%) | 51 (56.7%) |
| 6 to 18 Years | 139 (56.7%) | 133 (54.3%) |
| 19 to 25 Years | 0 (0.0%) | 16 (28.6%) |
| 25 to 34 Years | 75 (30.7%) | 107 (43.9%) |
| 35 to 44 Years | 114 (44.9%) | 137 (53.9%) |
| 45 to 54 Years | 20 (11.8%) | 119 (70.0%) |
| 55 to 64 Years | 257 (58.3%) | 194 (44.0%) |
| 65 to 74 Years | 548 (88.0%) | 371 (59.6%) |
| 75 Years and over | 224 (84.2%) | 191 (71.8%) |
| Total | 1,467 (61.4%) | 1,319 (55.2%) |
Disability Status by Sex by Age in Lincoln
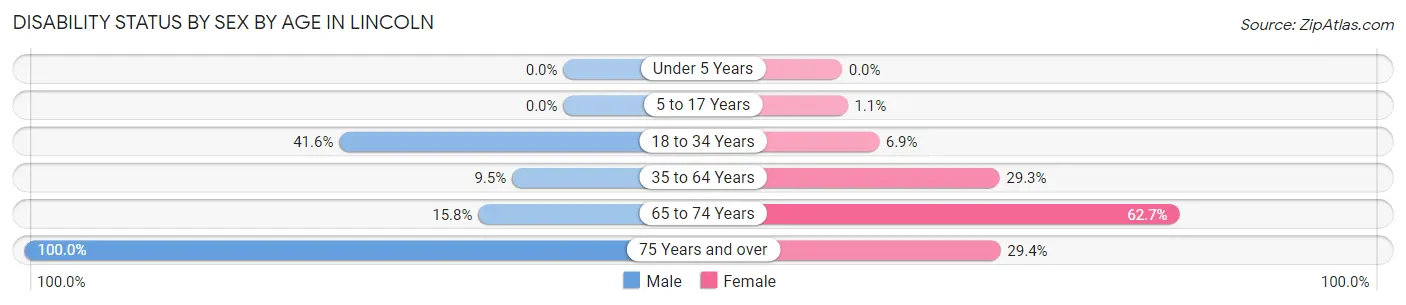
| Age Bracket | Male | Female |
| Under 5 Years | 0 (0.0%) | 0 (0.0%) |
| 5 to 17 Years | 0 (0.0%) | 1 (1.1%) |
| 18 to 34 Years | 52 (41.6%) | 12 (6.9%) |
| 35 to 64 Years | 42 (9.5%) | 124 (29.2%) |
| 65 to 74 Years | 51 (15.8%) | 188 (62.7%) |
| 75 Years and over | 69 (100.0%) | 58 (29.4%) |
Disability Class by Sex by Age in Lincoln
Disability Class: Hearing Difficulty
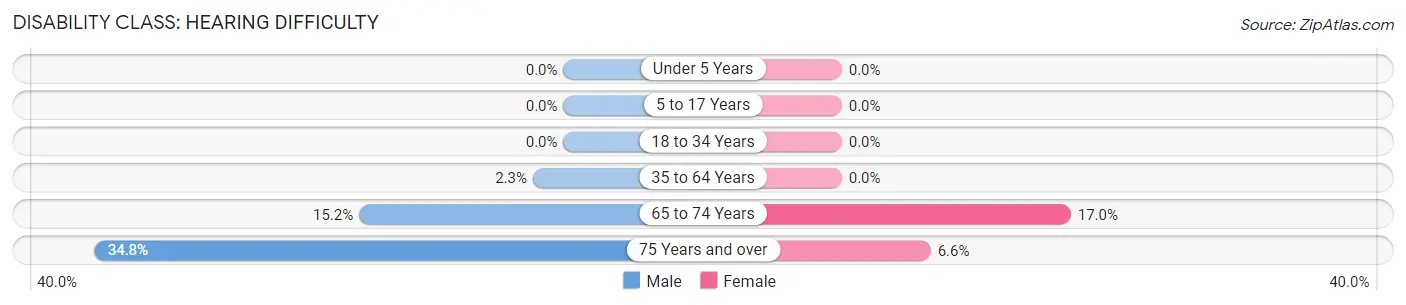
| Age Bracket | Male | Female |
| Under 5 Years | 0 (0.0%) | 0 (0.0%) |
| 5 to 17 Years | 0 (0.0%) | 0 (0.0%) |
| 18 to 34 Years | 0 (0.0%) | 0 (0.0%) |
| 35 to 64 Years | 10 (2.3%) | 0 (0.0%) |
| 65 to 74 Years | 49 (15.2%) | 51 (17.0%) |
| 75 Years and over | 24 (34.8%) | 13 (6.6%) |
Disability Class: Vision Difficulty
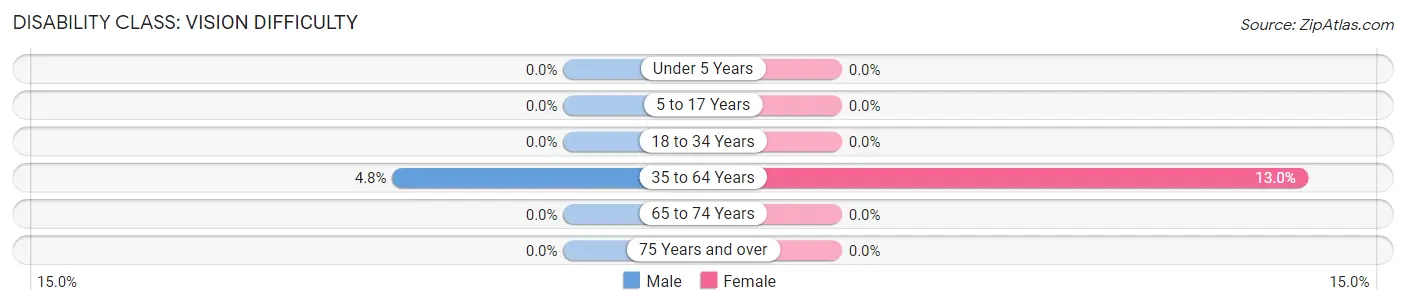
| Age Bracket | Male | Female |
| Under 5 Years | 0 (0.0%) | 0 (0.0%) |
| 5 to 17 Years | 0 (0.0%) | 0 (0.0%) |
| 18 to 34 Years | 0 (0.0%) | 0 (0.0%) |
| 35 to 64 Years | 21 (4.8%) | 55 (13.0%) |
| 65 to 74 Years | 0 (0.0%) | 0 (0.0%) |
| 75 Years and over | 0 (0.0%) | 0 (0.0%) |
Disability Class: Cognitive Difficulty
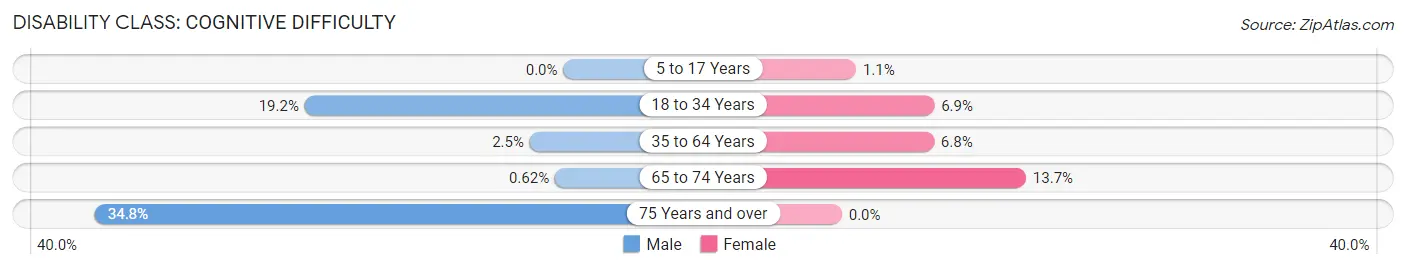
| Age Bracket | Male | Female |
| 5 to 17 Years | 0 (0.0%) | 1 (1.1%) |
| 18 to 34 Years | 24 (19.2%) | 12 (6.9%) |
| 35 to 64 Years | 11 (2.5%) | 29 (6.8%) |
| 65 to 74 Years | 2 (0.6%) | 41 (13.7%) |
| 75 Years and over | 24 (34.8%) | 0 (0.0%) |
Disability Class: Ambulatory Difficulty
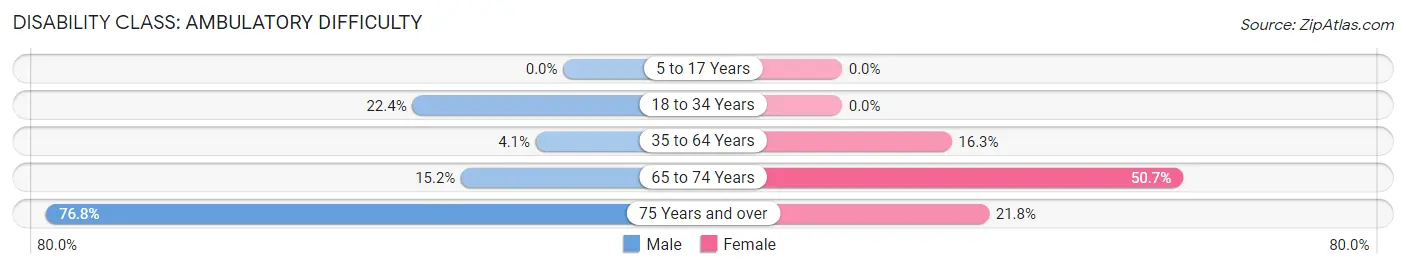
| Age Bracket | Male | Female |
| 5 to 17 Years | 0 (0.0%) | 0 (0.0%) |
| 18 to 34 Years | 28 (22.4%) | 0 (0.0%) |
| 35 to 64 Years | 18 (4.1%) | 69 (16.3%) |
| 65 to 74 Years | 49 (15.2%) | 152 (50.7%) |
| 75 Years and over | 53 (76.8%) | 43 (21.8%) |
Disability Class: Self-Care Difficulty
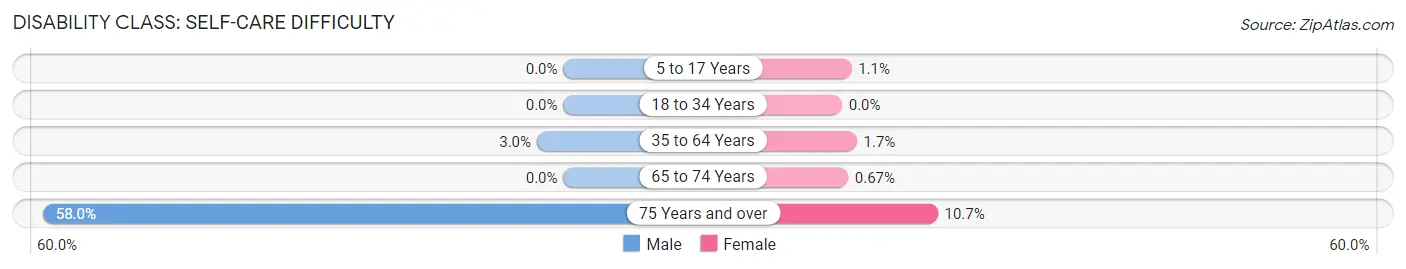
| Age Bracket | Male | Female |
| 5 to 17 Years | 0 (0.0%) | 1 (1.1%) |
| 18 to 34 Years | 0 (0.0%) | 0 (0.0%) |
| 35 to 64 Years | 13 (2.9%) | 7 (1.7%) |
| 65 to 74 Years | 0 (0.0%) | 2 (0.7%) |
| 75 Years and over | 40 (58.0%) | 21 (10.7%) |
Technology Access in Lincoln
Computing Device Access in Lincoln
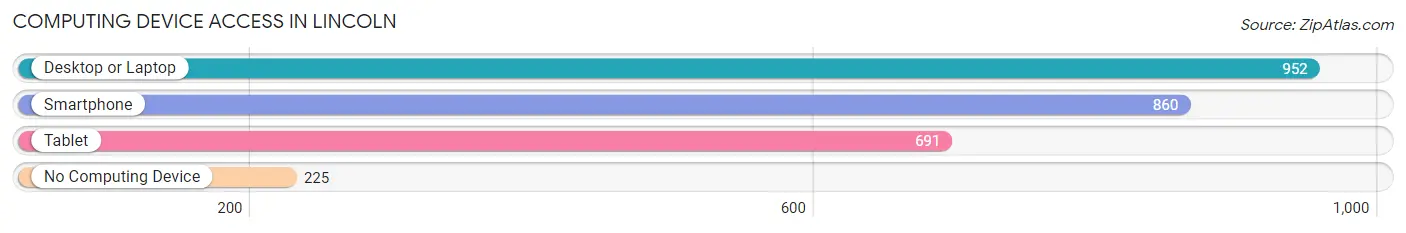
| Device Type | # Households | % Households |
| Desktop or Laptop | 952 | 70.3% |
| Smartphone | 860 | 63.5% |
| Tablet | 691 | 51.0% |
| No Computing Device | 225 | 16.6% |
| Total | 1,355 | 100.0% |
Internet Access in Lincoln
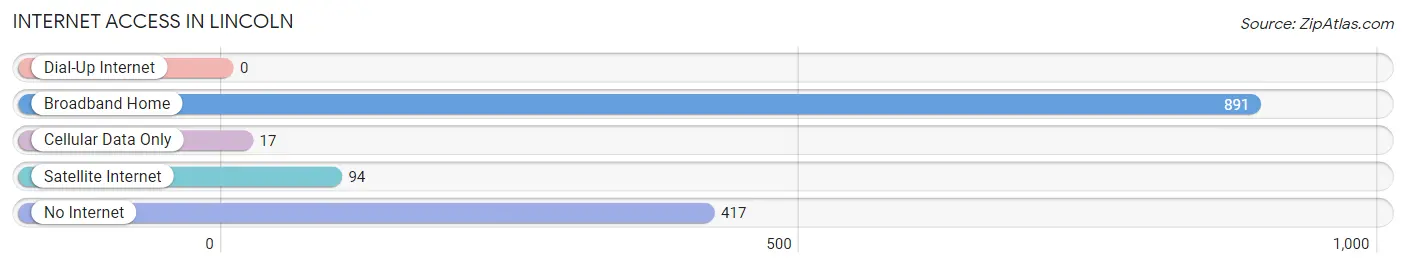
| Internet Type | # Households | % Households |
| Dial-Up Internet | 0 | 0.0% |
| Broadband Home | 891 | 65.8% |
| Cellular Data Only | 17 | 1.3% |
| Satellite Internet | 94 | 6.9% |
| No Internet | 417 | 30.8% |
| Total | 1,355 | 100.0% |
Lincoln Summary
Lincoln, Maine is a small town located in Penobscot County, in the state of Maine. It is situated on the Penobscot River, about 25 miles north of Bangor. The town was incorporated in 1820 and has a population of about 2,000 people.
History
Lincoln was first settled in 1794 by a group of settlers from Massachusetts. The town was named after the Revolutionary War hero, General Benjamin Lincoln. The town was originally part of the town of Mattawamkeag, which was incorporated in 1820. The town was then divided into two parts, with the northern part becoming Lincoln.
The town was primarily an agricultural community, with the main crops being potatoes, hay, and oats. The town also had a sawmill, gristmill, and a tannery. In the late 19th century, the town began to develop a small manufacturing industry, with the main products being furniture, shoes, and clothing.
Geography
Lincoln is located in the northern part of Penobscot County, in the state of Maine. It is situated on the Penobscot River, about 25 miles north of Bangor. The town is bordered by Mattawamkeag to the north, Winn to the east, and Howland to the south. The town has a total area of 24.2 square miles, of which 23.9 square miles is land and 0.3 square miles is water.
The town is located in a rural area, with the main industries being agriculture and forestry. The town is home to several lakes, including Mattawamkeag Lake, Lincoln Lake, and Big Lake. The town is also home to several parks, including the Lincoln Town Park, which features a playground, picnic area, and a walking trail.
Economy
The economy of Lincoln is primarily based on agriculture and forestry. The town is home to several farms, which produce potatoes, hay, and oats. The town also has a small manufacturing industry, with the main products being furniture, shoes, and clothing.
The town is also home to several businesses, including a grocery store, a hardware store, and a restaurant. The town is also home to several small businesses, such as a bakery, a florist, and a gift shop.
Demographics
As of the 2010 census, the population of Lincoln was 2,037. The racial makeup of the town was 97.2% White, 0.7% African American, 0.3% Native American, 0.3% Asian, 0.1% Pacific Islander, 0.2% from other races, and 1.3% from two or more races. Hispanic or Latino of any race were 0.7% of the population.
The median income for a household in the town was $37,500, and the median income for a family was $45,000. The per capita income for the town was $19,845. About 11.2% of families and 14.2% of the population were below the poverty line, including 18.2% of those under age 18 and 8.3% of those age 65 or over.
Common Questions
What is Per Capita Income in Lincoln?
Per Capita income in Lincoln is $23,920.
What is the Median Family Income in Lincoln?
Median Family Income in Lincoln is $41,023.
What is the Median Household income in Lincoln?
Median Household Income in Lincoln is $28,932.
What is Income or Wage Gap in Lincoln?
Income or Wage Gap in Lincoln is 63.9%.
Women in Lincoln earn 36.1 cents for every dollar earned by a man.
What is Inequality or Gini Index in Lincoln?
Inequality or Gini Index in Lincoln is 0.49.
What is the Total Population of Lincoln?
Total Population of Lincoln is 2,521.
What is the Total Male Population of Lincoln?
Total Male Population of Lincoln is 1,245.
What is the Total Female Population of Lincoln?
Total Female Population of Lincoln is 1,276.
What is the Ratio of Males per 100 Females in Lincoln?
There are 97.57 Males per 100 Females in Lincoln.
What is the Ratio of Females per 100 Males in Lincoln?
There are 102.49 Females per 100 Males in Lincoln.
What is the Median Population Age in Lincoln?
Median Population Age in Lincoln is 60.2 Years.
What is the Average Family Size in Lincoln
Average Family Size in Lincoln is 2.5 People.
What is the Average Household Size in Lincoln
Average Household Size in Lincoln is 1.8 People.
How Large is the Labor Force in Lincoln?
There are 922 People in the Labor Forcein in Lincoln.
What is the Percentage of People in the Labor Force in Lincoln?
41.5% of People are in the Labor Force in Lincoln.
What is the Unemployment Rate in Lincoln?
Unemployment Rate in Lincoln is 2.4%.