Blue Hill, ME Map & Demographics
Blue Hill Map
Blue Hill Overview
$31,732
PER CAPITA INCOME
59.2%
WAGE / INCOME GAP [ % ]
40.8¢/ $1
WAGE / INCOME GAP [ $ ]
0.45
INEQUALITY / GINI INDEX
950
TOTAL POPULATION
288
MALE POPULATION
662
FEMALE POPULATION
43.50
MALES / 100 FEMALES
229.86
FEMALES / 100 MALES
52.3
MEDIAN AGE
2.4
AVG FAMILY SIZE
1.9
AVG HOUSEHOLD SIZE
510
LABOR FORCE [ PEOPLE ]
62.3%
PERCENT IN LABOR FORCE
Blue Hill Zip Codes
Blue Hill Area Codes
Income in Blue Hill
Income Overview in Blue Hill
| Characteristic | Number | Measure |
| Per Capita Income | 950 | $31,732 |
| Median Family Income | 237 | $0 |
| Mean Family Income | 237 | $60,167 |
| Median Household Income | 493 | $0 |
| Mean Household Income | 493 | $54,377 |
| Income Deficit | 237 | $0 |
| Wage / Income Gap (%) | 950 | 59.24% |
| Wage / Income Gap ($) | 950 | 40.76¢ per $1 |
| Gini / Inequality Index | 950 | 0.45 |
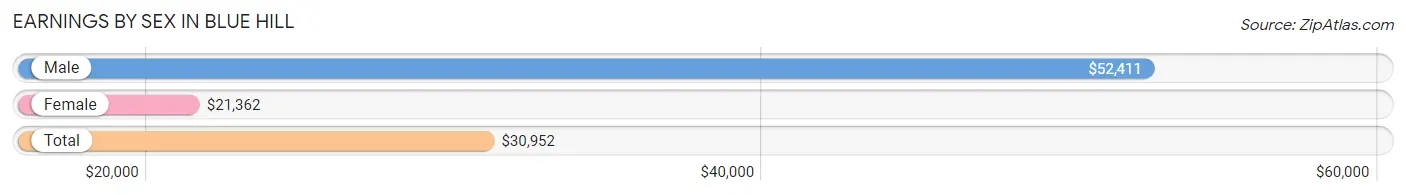
Earnings by Sex in Blue Hill
Average Earnings in Blue Hill are $30,952, $52,411 for men and $21,362 for women, a difference of 59.2%.
| Sex | Number | Average Earnings |
| Male | 177 (32.9%) | $52,411 |
| Female | 361 (67.1%) | $21,362 |
| Total | 538 (100.0%) | $30,952 |
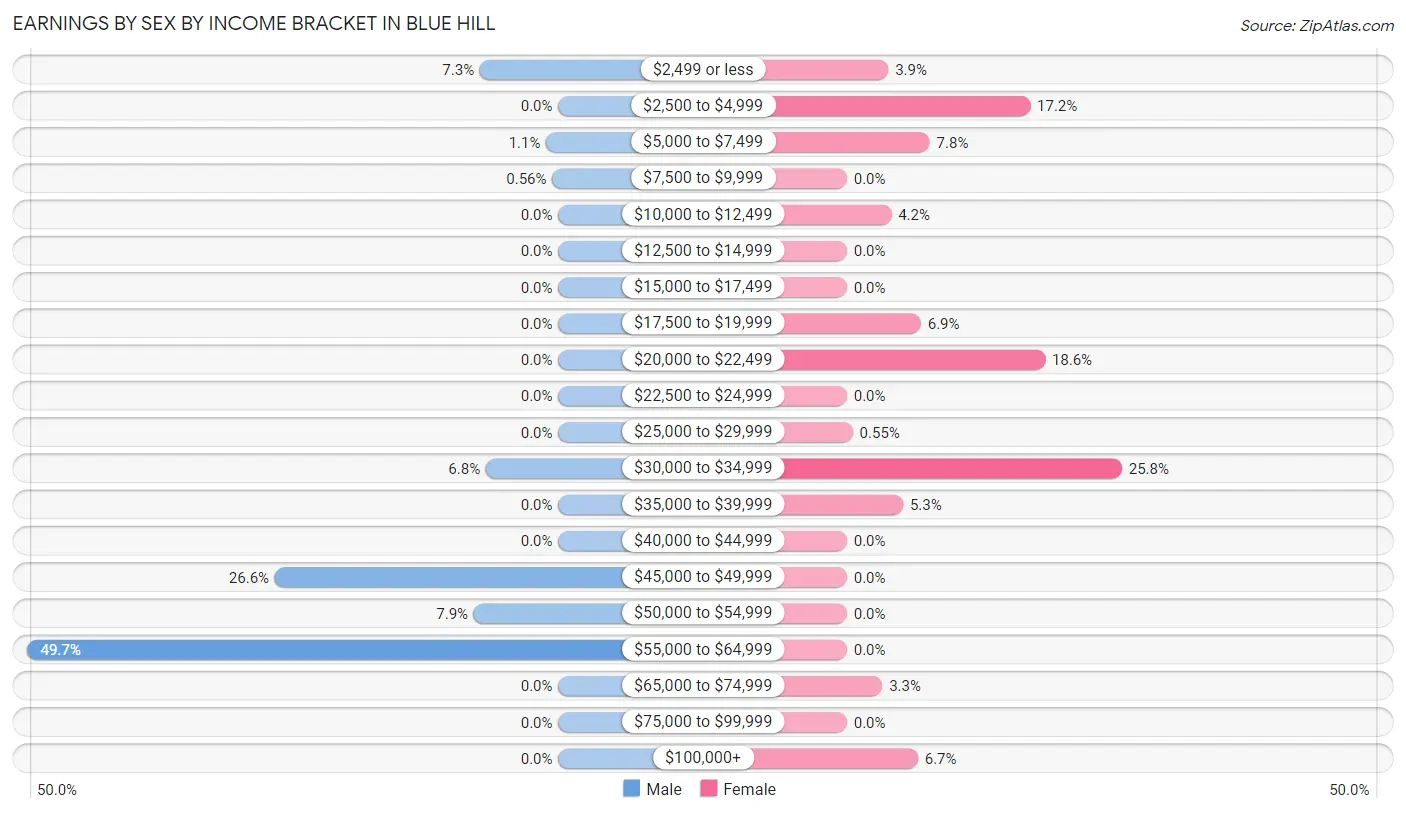
Earnings by Sex by Income Bracket in Blue Hill
The most common earnings brackets in Blue Hill are $55,000 to $64,999 for men (88 | 49.7%) and $30,000 to $34,999 for women (93 | 25.8%).
| Income | Male | Female |
| $2,499 or less | 13 (7.3%) | 14 (3.9%) |
| $2,500 to $4,999 | 0 (0.0%) | 62 (17.2%) |
| $5,000 to $7,499 | 2 (1.1%) | 28 (7.8%) |
| $7,500 to $9,999 | 1 (0.6%) | 0 (0.0%) |
| $10,000 to $12,499 | 0 (0.0%) | 15 (4.2%) |
| $12,500 to $14,999 | 0 (0.0%) | 0 (0.0%) |
| $15,000 to $17,499 | 0 (0.0%) | 0 (0.0%) |
| $17,500 to $19,999 | 0 (0.0%) | 25 (6.9%) |
| $20,000 to $22,499 | 0 (0.0%) | 67 (18.6%) |
| $22,500 to $24,999 | 0 (0.0%) | 0 (0.0%) |
| $25,000 to $29,999 | 0 (0.0%) | 2 (0.5%) |
| $30,000 to $34,999 | 12 (6.8%) | 93 (25.8%) |
| $35,000 to $39,999 | 0 (0.0%) | 19 (5.3%) |
| $40,000 to $44,999 | 0 (0.0%) | 0 (0.0%) |
| $45,000 to $49,999 | 47 (26.6%) | 0 (0.0%) |
| $50,000 to $54,999 | 14 (7.9%) | 0 (0.0%) |
| $55,000 to $64,999 | 88 (49.7%) | 0 (0.0%) |
| $65,000 to $74,999 | 0 (0.0%) | 12 (3.3%) |
| $75,000 to $99,999 | 0 (0.0%) | 0 (0.0%) |
| $100,000+ | 0 (0.0%) | 24 (6.7%) |
| Total | 177 (100.0%) | 361 (100.0%) |
Earnings by Sex by Educational Attainment in Blue Hill
| Educational Attainment | Male Income | Female Income |
| Less than High School | - | - |
| High School Diploma | - | - |
| College or Associate's Degree | - | - |
| Bachelor's Degree | - | - |
| Graduate Degree | - | - |
| Total | $55,710 | $21,791 |
Family Income in Blue Hill
Family Income Brackets in Blue Hill
According to the Blue Hill family income data, there are 93 families falling into the $25,000 to $34,999 income range, which is the most common income bracket and makes up 39.2% of all families.
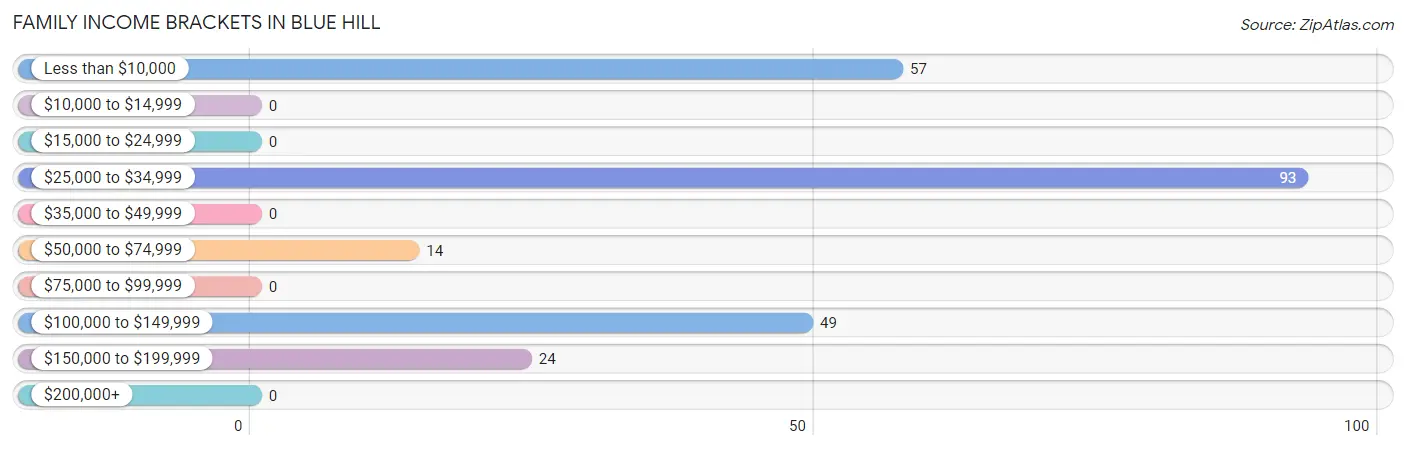
| Income Bracket | # Families | % Families |
| Less than $10,000 | 57 | 24.1% |
| $10,000 to $14,999 | 0 | 0.0% |
| $15,000 to $24,999 | 0 | 0.0% |
| $25,000 to $34,999 | 93 | 39.2% |
| $35,000 to $49,999 | 0 | 0.0% |
| $50,000 to $74,999 | 14 | 5.9% |
| $75,000 to $99,999 | 0 | 0.0% |
| $100,000 to $149,999 | 49 | 20.7% |
| $150,000 to $199,999 | 24 | 10.1% |
| $200,000+ | 0 | 0.0% |
Family Income by Famaliy Size in Blue Hill
2-person families (170 | 71.7%) account for the highest median family income in Blue Hill with $31,532 per family, while 2-person families (170 | 71.7%) have the highest median income of $15,766 per family member.
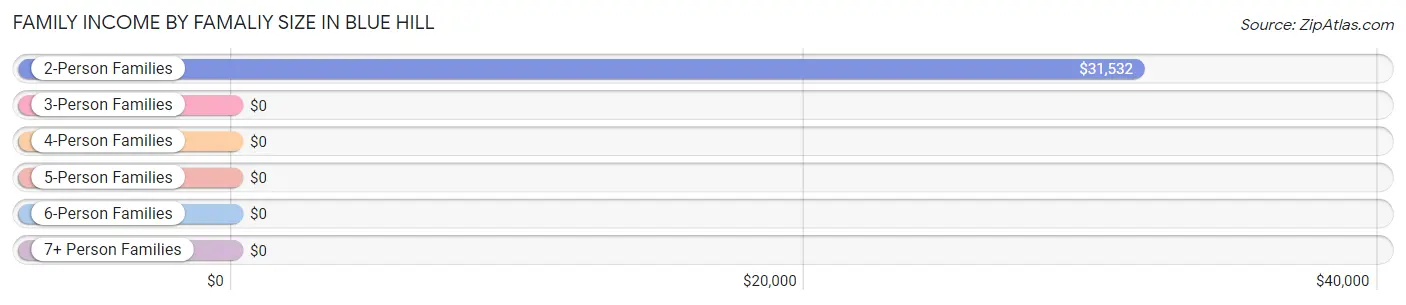
| Income Bracket | # Families | Median Income |
| 2-Person Families | 170 (71.7%) | $31,532 |
| 3-Person Families | 24 (10.1%) | $0 |
| 4-Person Families | 29 (12.2%) | $0 |
| 5-Person Families | 0 (0.0%) | $0 |
| 6-Person Families | 14 (5.9%) | $0 |
| 7+ Person Families | 0 (0.0%) | $0 |
| Total | 237 (100.0%) | $0 |
Family Income by Number of Earners in Blue Hill
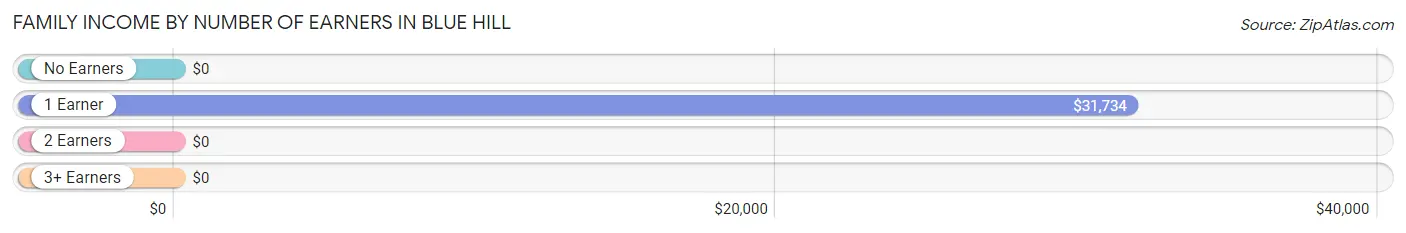
| Number of Earners | # Families | Median Income |
| No Earners | 42 (17.7%) | $0 |
| 1 Earner | 129 (54.4%) | $31,734 |
| 2 Earners | 28 (11.8%) | $0 |
| 3+ Earners | 38 (16.0%) | $0 |
| Total | 237 (100.0%) | $0 |
Household Income in Blue Hill
Household Income Brackets in Blue Hill
With 93 households falling in the category, the $25,000 to $34,999 income range is the most frequent in Blue Hill, accounting for 18.9% of all households.
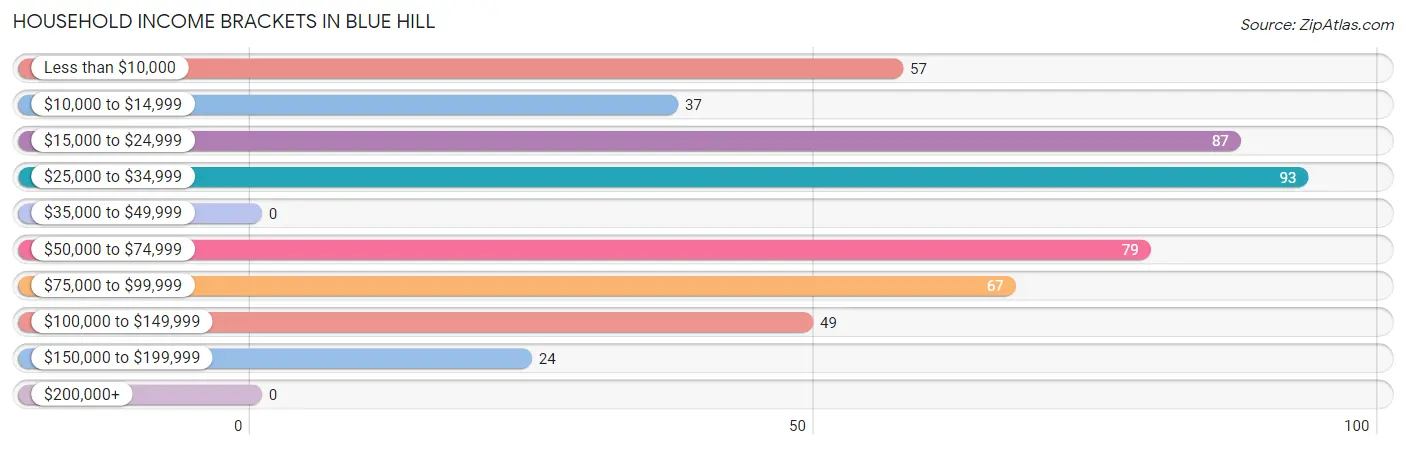
| Income Bracket | # Households | % Households |
| Less than $10,000 | 57 | 11.6% |
| $10,000 to $14,999 | 37 | 7.5% |
| $15,000 to $24,999 | 87 | 17.6% |
| $25,000 to $34,999 | 93 | 18.9% |
| $35,000 to $49,999 | 0 | 0.0% |
| $50,000 to $74,999 | 79 | 16.0% |
| $75,000 to $99,999 | 67 | 13.6% |
| $100,000 to $149,999 | 49 | 9.9% |
| $150,000 to $199,999 | 24 | 4.9% |
| $200,000+ | 0 | 0.0% |
Household Income by Householder Age in Blue Hill
| Income Bracket | # Households | Median Income |
| 15 to 24 Years | 0 (0.0%) | $0 |
| 25 to 44 Years | 57 (11.6%) | $0 |
| 45 to 64 Years | 212 (43.0%) | $0 |
| 65+ Years | 224 (45.4%) | $0 |
| Total | 493 (100.0%) | $0 |
Poverty in Blue Hill
Income Below Poverty by Sex and Age in Blue Hill
With 17.1% poverty level for males and 23.4% for females among the residents of Blue Hill, under 5 year old males and 5 year old females are the most vulnerable to poverty, with 26 males (100.0%) and 27 females (100.0%) in their respective age groups living below the poverty level.
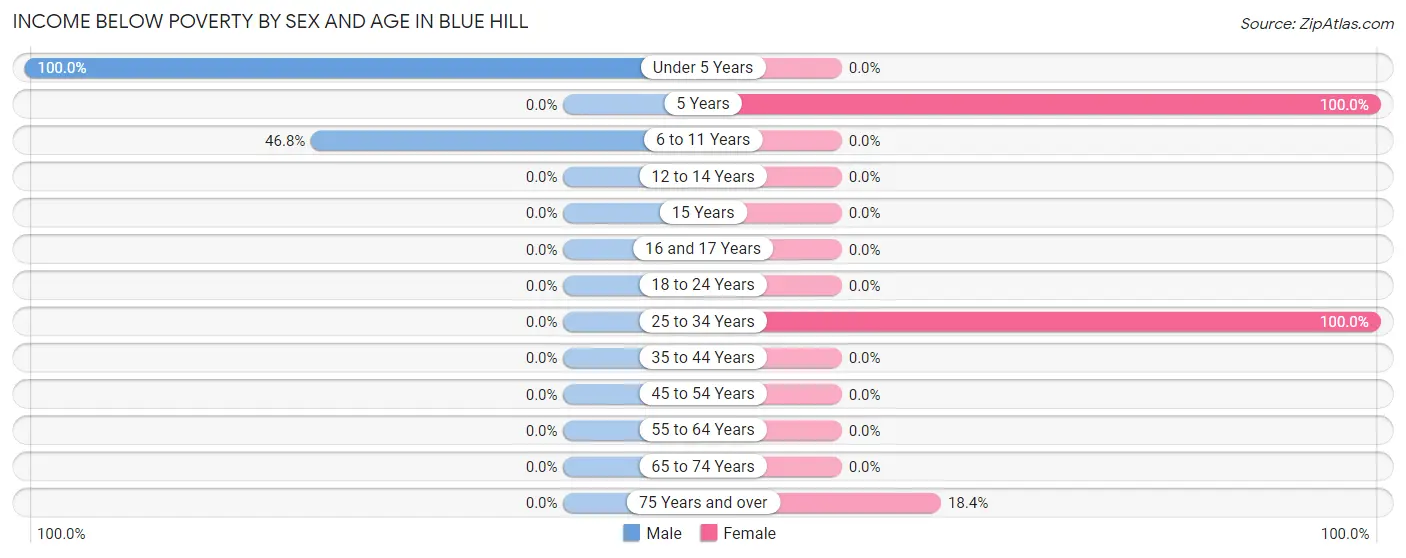
| Age Bracket | Male | Female |
| Under 5 Years | 26 (100.0%) | 0 (0.0%) |
| 5 Years | 0 (0.0%) | 27 (100.0%) |
| 6 to 11 Years | 22 (46.8%) | 0 (0.0%) |
| 12 to 14 Years | 0 (0.0%) | 0 (0.0%) |
| 15 Years | 0 (0.0%) | 0 (0.0%) |
| 16 and 17 Years | 0 (0.0%) | 0 (0.0%) |
| 18 to 24 Years | 0 (0.0%) | 0 (0.0%) |
| 25 to 34 Years | 0 (0.0%) | 91 (100.0%) |
| 35 to 44 Years | 0 (0.0%) | 0 (0.0%) |
| 45 to 54 Years | 0 (0.0%) | 0 (0.0%) |
| 55 to 64 Years | 0 (0.0%) | 0 (0.0%) |
| 65 to 74 Years | 0 (0.0%) | 0 (0.0%) |
| 75 Years and over | 0 (0.0%) | 37 (18.4%) |
| Total | 48 (17.1%) | 155 (23.4%) |
Income Above Poverty by Sex and Age in Blue Hill
According to the poverty statistics in Blue Hill, males aged 18 to 24 years and females aged 12 to 14 years are the age groups that are most secure financially, with 100.0% of males and 100.0% of females in these age groups living above the poverty line.
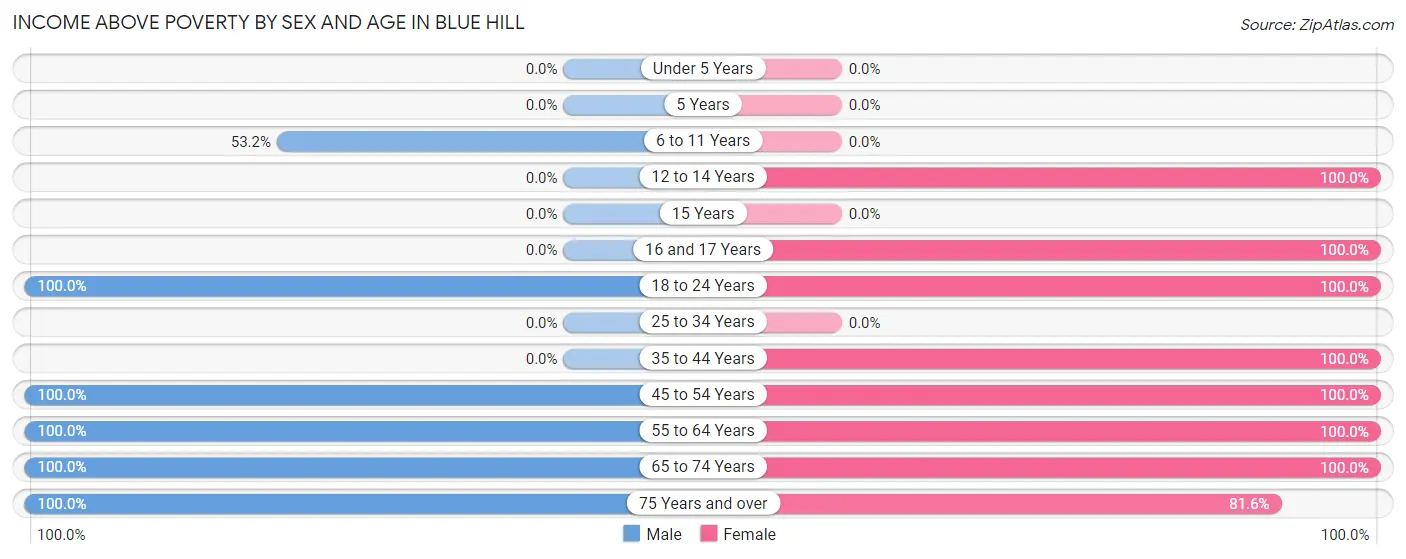
| Age Bracket | Male | Female |
| Under 5 Years | 0 (0.0%) | 0 (0.0%) |
| 5 Years | 0 (0.0%) | 0 (0.0%) |
| 6 to 11 Years | 25 (53.2%) | 0 (0.0%) |
| 12 to 14 Years | 0 (0.0%) | 30 (100.0%) |
| 15 Years | 0 (0.0%) | 0 (0.0%) |
| 16 and 17 Years | 0 (0.0%) | 42 (100.0%) |
| 18 to 24 Years | 47 (100.0%) | 19 (100.0%) |
| 25 to 34 Years | 0 (0.0%) | 0 (0.0%) |
| 35 to 44 Years | 0 (0.0%) | 2 (100.0%) |
| 45 to 54 Years | 14 (100.0%) | 196 (100.0%) |
| 55 to 64 Years | 88 (100.0%) | 39 (100.0%) |
| 65 to 74 Years | 46 (100.0%) | 15 (100.0%) |
| 75 Years and over | 13 (100.0%) | 164 (81.6%) |
| Total | 233 (82.9%) | 507 (76.6%) |
Income Below Poverty Among Married-Couple Families in Blue Hill
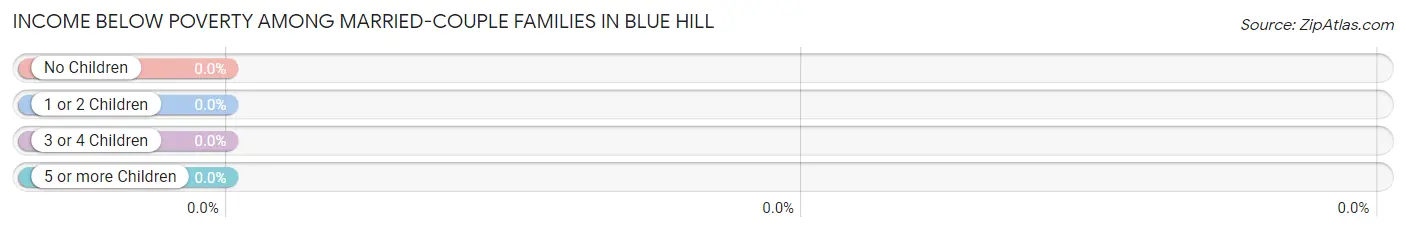
| Children | Above Poverty | Below Poverty |
| No Children | 49 (100.0%) | 0 (0.0%) |
| 1 or 2 Children | 0 (0.0%) | 0 (0.0%) |
| 3 or 4 Children | 14 (100.0%) | 0 (0.0%) |
| 5 or more Children | 0 (0.0%) | 0 (0.0%) |
| Total | 63 (100.0%) | 0 (0.0%) |
Income Below Poverty Among Single-Parent Households in Blue Hill
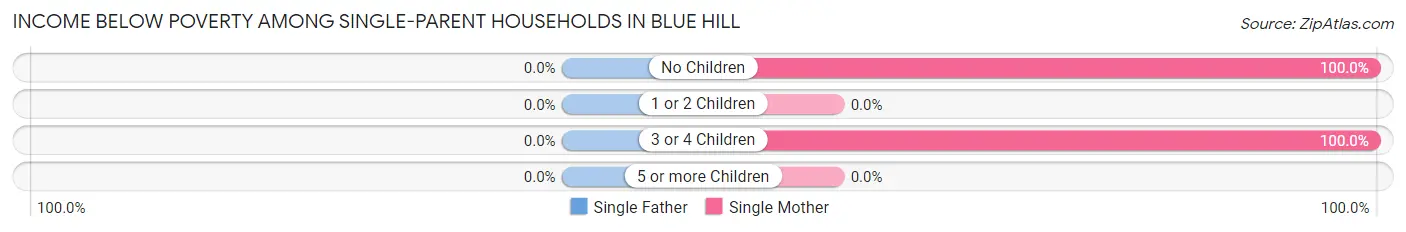
| Children | Single Father | Single Mother |
| No Children | 0 (0.0%) | 28 (100.0%) |
| 1 or 2 Children | 0 (0.0%) | 0 (0.0%) |
| 3 or 4 Children | 0 (0.0%) | 29 (100.0%) |
| 5 or more Children | 0 (0.0%) | 0 (0.0%) |
| Total | 0 (0.0%) | 57 (32.8%) |
Income Below Poverty Among Married-Couple vs Single-Parent Households in Blue Hill
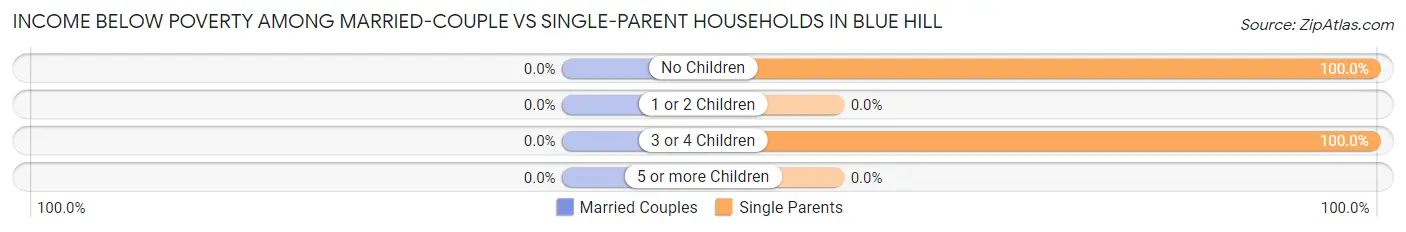
| Children | Married-Couple Families | Single-Parent Households |
| No Children | 0 (0.0%) | 28 (100.0%) |
| 1 or 2 Children | 0 (0.0%) | 0 (0.0%) |
| 3 or 4 Children | 0 (0.0%) | 29 (100.0%) |
| 5 or more Children | 0 (0.0%) | 0 (0.0%) |
| Total | 0 (0.0%) | 57 (32.8%) |
Race in Blue Hill
The most populous races in Blue Hill are White / Caucasian (929 | 97.8%), Hispanic or Latino (21 | 2.2%), and Some other Race (19 | 2.0%).
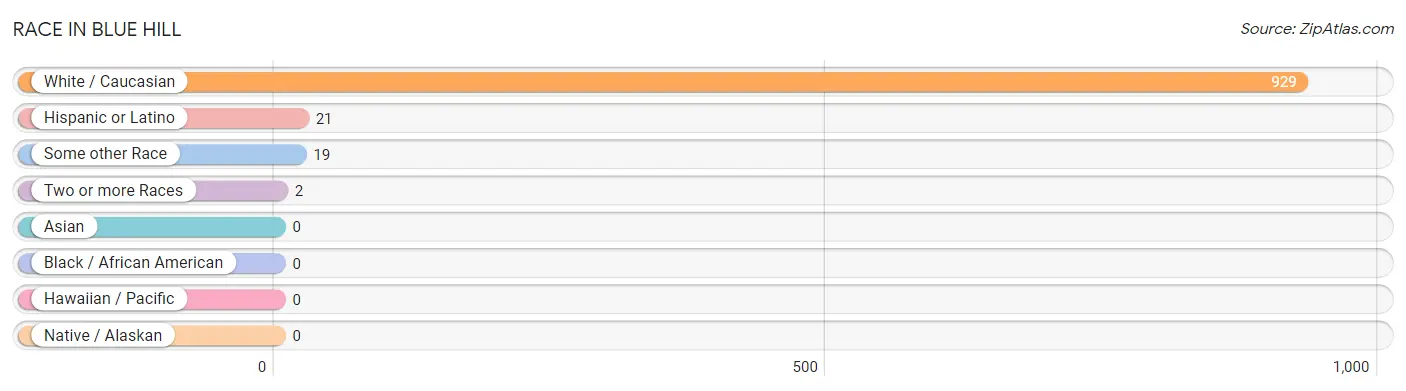
| Race | # Population | % Population |
| Asian | 0 | 0.0% |
| Black / African American | 0 | 0.0% |
| Hawaiian / Pacific | 0 | 0.0% |
| Hispanic or Latino | 21 | 2.2% |
| Native / Alaskan | 0 | 0.0% |
| White / Caucasian | 929 | 97.8% |
| Two or more Races | 2 | 0.2% |
| Some other Race | 19 | 2.0% |
| Total | 950 | 100.0% |
Ancestry in Blue Hill
The most populous ancestries reported in Blue Hill are English (176 | 18.5%), German (158 | 16.6%), Canadian (118 | 12.4%), Irish (106 | 11.2%), and American (103 | 10.8%), together accounting for 69.6% of all Blue Hill residents.
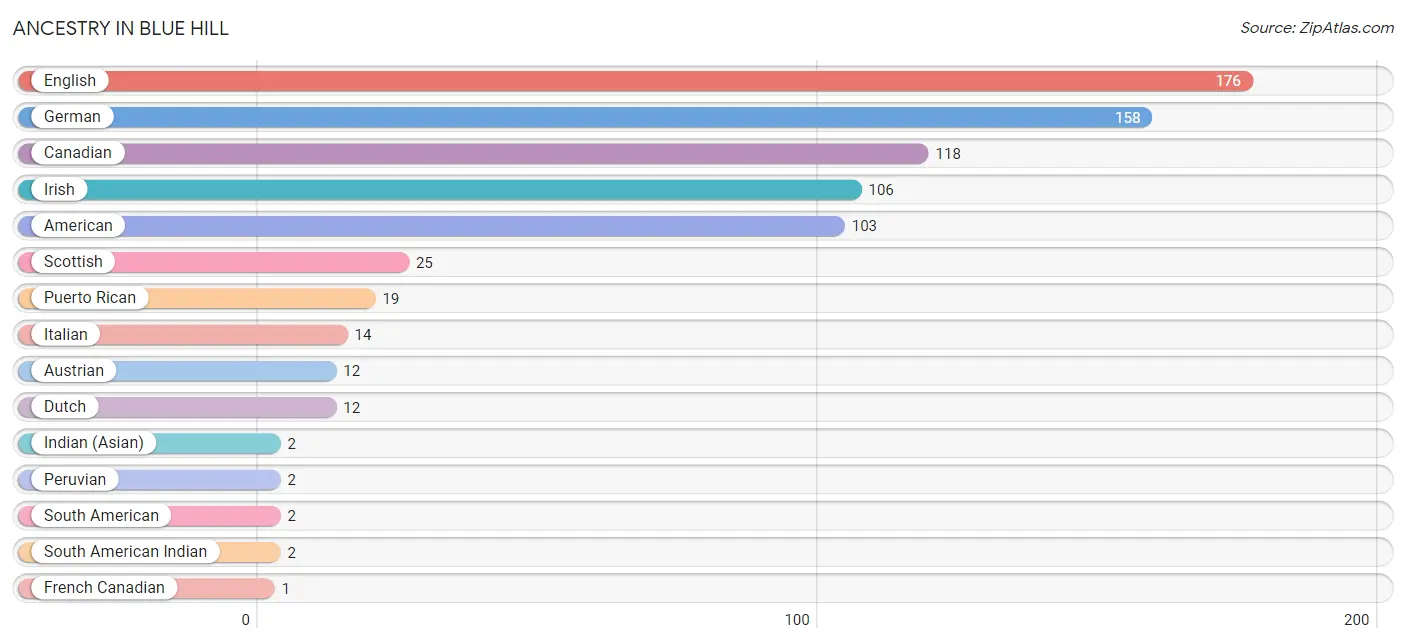
| Ancestry | # Population | % Population |
| American | 103 | 10.8% |
| Austrian | 12 | 1.3% |
| Canadian | 118 | 12.4% |
| Dutch | 12 | 1.3% |
| English | 176 | 18.5% |
| French Canadian | 1 | 0.1% |
| German | 158 | 16.6% |
| Indian (Asian) | 2 | 0.2% |
| Irish | 106 | 11.2% |
| Italian | 14 | 1.5% |
| Peruvian | 2 | 0.2% |
| Puerto Rican | 19 | 2.0% |
| Scottish | 25 | 2.6% |
| South American | 2 | 0.2% |
| South American Indian | 2 | 0.2% | View All 15 Rows |
Immigrants in Blue Hill
The most numerous immigrant groups reported in Blue Hill came from Latin America (2 | 0.2%), Peru (2 | 0.2%), and South America (2 | 0.2%), together accounting for 0.6% of all Blue Hill residents.
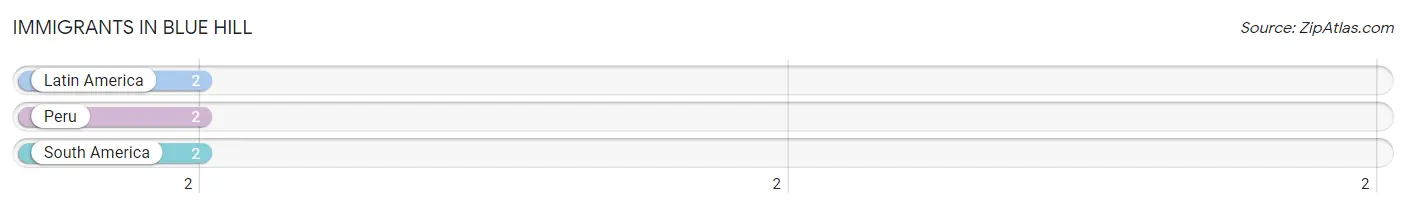
| Immigration Origin | # Population | % Population |
| Latin America | 2 | 0.2% |
| Peru | 2 | 0.2% |
| South America | 2 | 0.2% | View All 3 Rows |
Sex and Age in Blue Hill
Sex and Age in Blue Hill
The most populous age groups in Blue Hill are 55 to 59 Years (88 | 30.6%) for men and 50 to 54 Years (196 | 29.6%) for women.
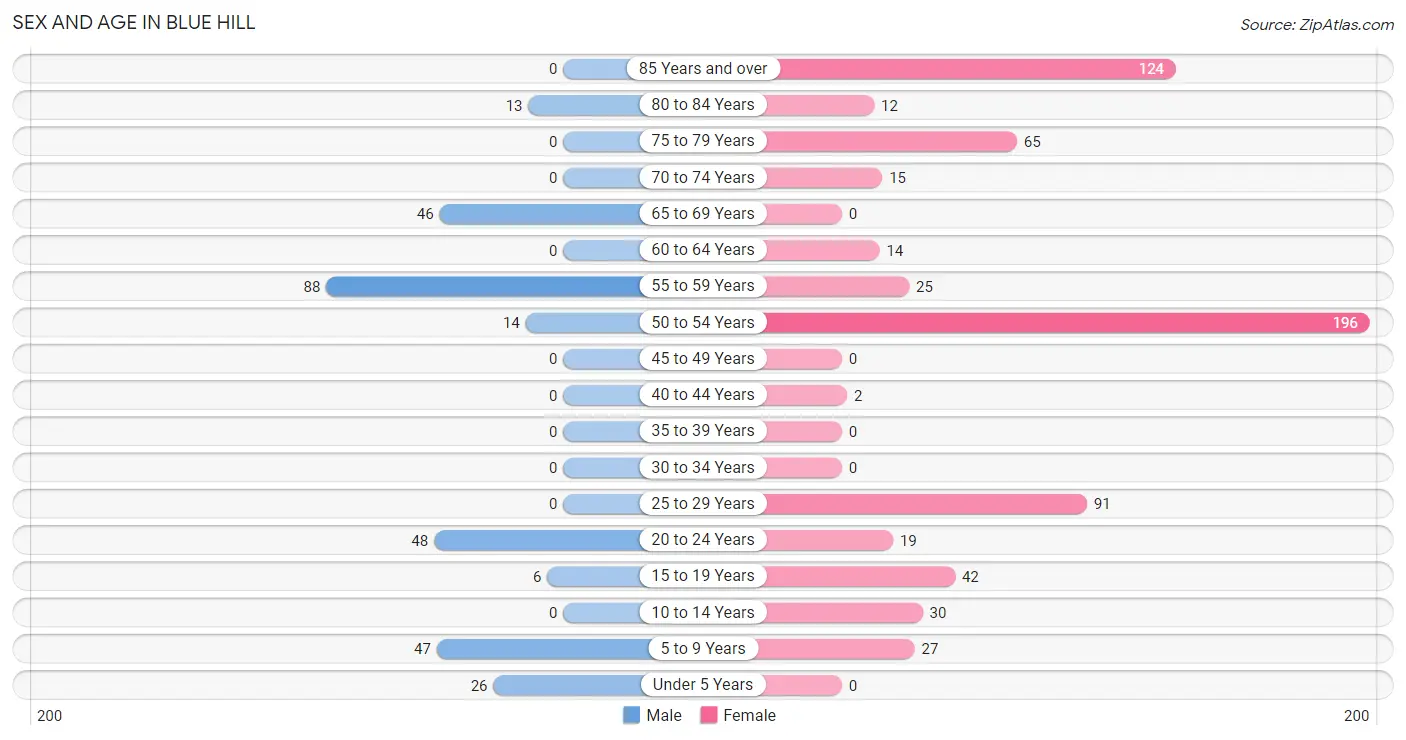
| Age Bracket | Male | Female |
| Under 5 Years | 26 (9.0%) | 0 (0.0%) |
| 5 to 9 Years | 47 (16.3%) | 27 (4.1%) |
| 10 to 14 Years | 0 (0.0%) | 30 (4.5%) |
| 15 to 19 Years | 6 (2.1%) | 42 (6.3%) |
| 20 to 24 Years | 48 (16.7%) | 19 (2.9%) |
| 25 to 29 Years | 0 (0.0%) | 91 (13.8%) |
| 30 to 34 Years | 0 (0.0%) | 0 (0.0%) |
| 35 to 39 Years | 0 (0.0%) | 0 (0.0%) |
| 40 to 44 Years | 0 (0.0%) | 2 (0.3%) |
| 45 to 49 Years | 0 (0.0%) | 0 (0.0%) |
| 50 to 54 Years | 14 (4.9%) | 196 (29.6%) |
| 55 to 59 Years | 88 (30.6%) | 25 (3.8%) |
| 60 to 64 Years | 0 (0.0%) | 14 (2.1%) |
| 65 to 69 Years | 46 (16.0%) | 0 (0.0%) |
| 70 to 74 Years | 0 (0.0%) | 15 (2.3%) |
| 75 to 79 Years | 0 (0.0%) | 65 (9.8%) |
| 80 to 84 Years | 13 (4.5%) | 12 (1.8%) |
| 85 Years and over | 0 (0.0%) | 124 (18.7%) |
| Total | 288 (100.0%) | 662 (100.0%) |
Families and Households in Blue Hill
Median Family Size in Blue Hill
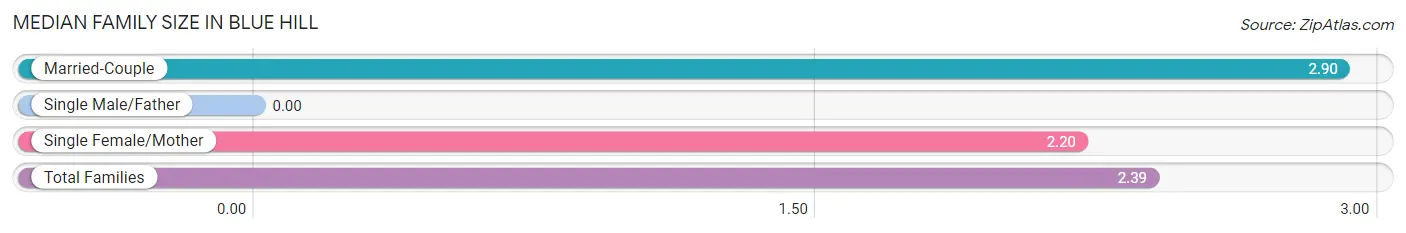
| Family Type | # Families | Family Size |
| Married-Couple | 63 (26.6%) | 2.90 |
| Single Male/Father | 0 (0.0%) | - |
| Single Female/Mother | 174 (73.4%) | 2.20 |
| Total Families | 237 (100.0%) | 2.39 |
Median Household Size in Blue Hill
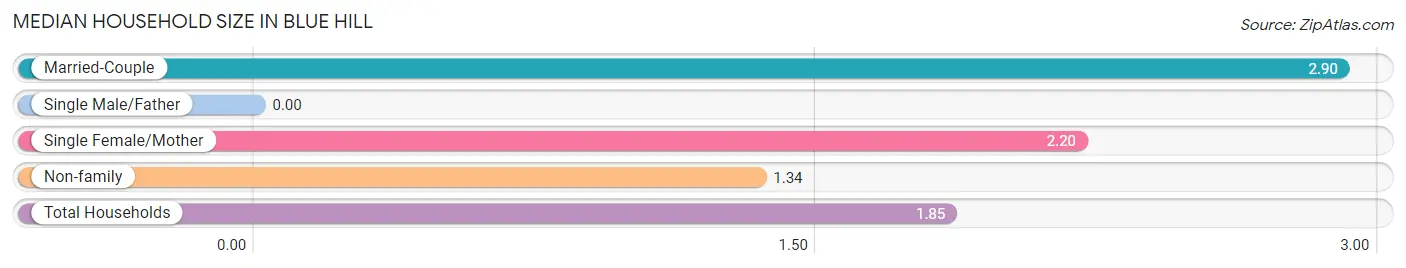
| Household Type | # Households | Household Size |
| Married-Couple | 63 (12.8%) | 2.90 |
| Single Male/Father | 0 (0.0%) | - |
| Single Female/Mother | 174 (35.3%) | 2.20 |
| Non-family | 256 (51.9%) | 1.34 |
| Total Households | 493 (100.0%) | 1.85 |
Household Size by Marriage Status in Blue Hill
Out of a total of 493 households in Blue Hill, 237 (48.1%) are family households, while 256 (51.9%) are nonfamily households. The most numerous type of family households are 2-person households, comprising 170, and the most common type of nonfamily households are 1-person households, comprising 189.
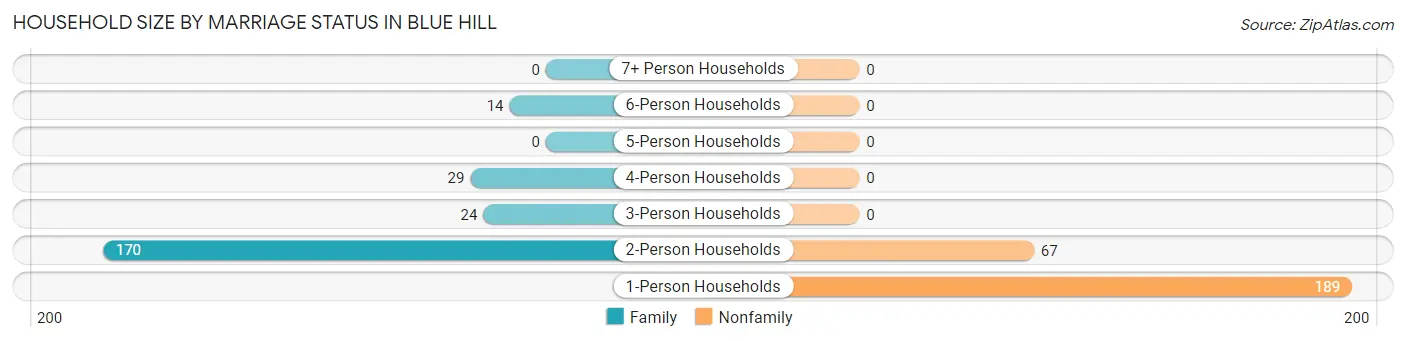
| Household Size | Family Households | Nonfamily Households |
| 1-Person Households | - | 189 (38.3%) |
| 2-Person Households | 170 (34.5%) | 67 (13.6%) |
| 3-Person Households | 24 (4.9%) | 0 (0.0%) |
| 4-Person Households | 29 (5.9%) | 0 (0.0%) |
| 5-Person Households | 0 (0.0%) | 0 (0.0%) |
| 6-Person Households | 14 (2.8%) | 0 (0.0%) |
| 7+ Person Households | 0 (0.0%) | 0 (0.0%) |
| Total | 237 (48.1%) | 256 (51.9%) |
Female Fertility in Blue Hill
Fertility by Age in Blue Hill
Average fertility rate in Blue Hill is 312.0 births per 1,000 women. Women in the age bracket of 20 to 34 years have the highest fertility rate with 436.0 births per 1,000 women. Women in the age bracket of 20 to 34 years acount for 100.0% of all women with births.
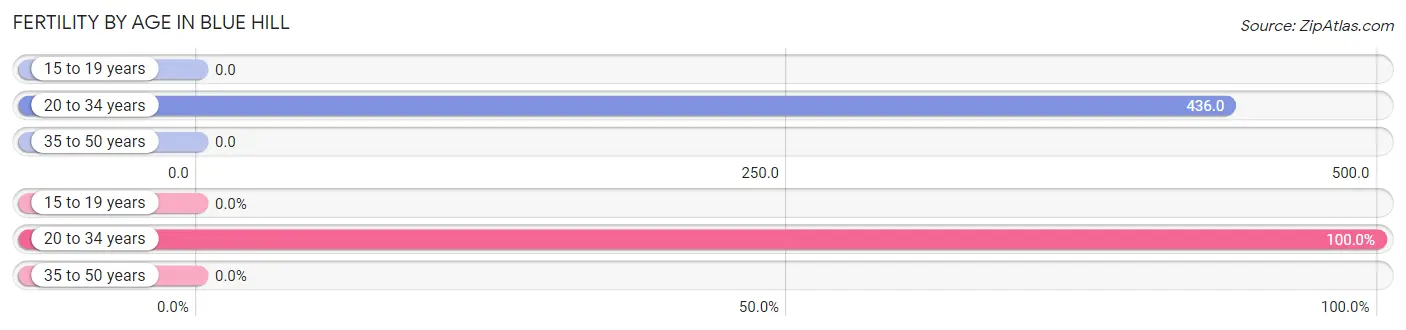
| Age Bracket | Women with Births | Births / 1,000 Women |
| 15 to 19 years | 0 (0.0%) | 0.0 |
| 20 to 34 years | 48 (100.0%) | 436.0 |
| 35 to 50 years | 0 (0.0%) | 0.0 |
| Total | 48 (100.0%) | 312.0 |
Fertility by Age by Marriage Status in Blue Hill
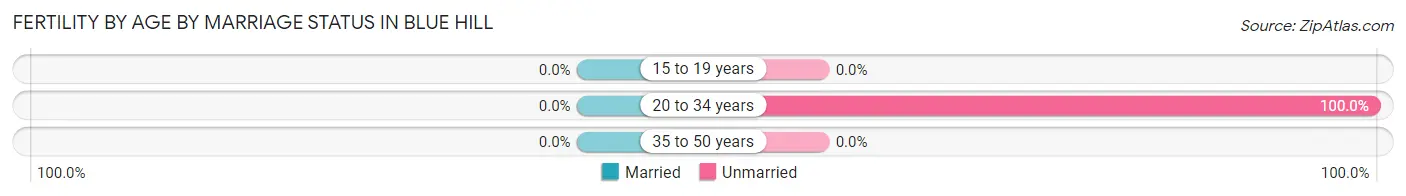
| Age Bracket | Married | Unmarried |
| 15 to 19 years | 0 (0.0%) | 0 (0.0%) |
| 20 to 34 years | 0 (0.0%) | 48 (100.0%) |
| 35 to 50 years | 0 (0.0%) | 0 (0.0%) |
| Total | 0 (0.0%) | 48 (100.0%) |
Fertility by Education in Blue Hill
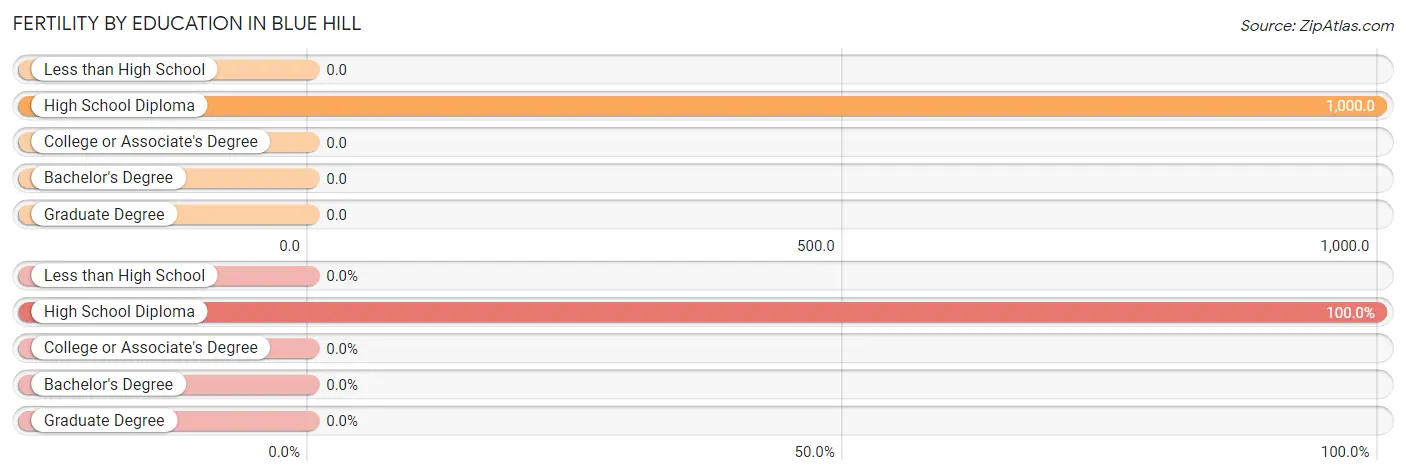
| Educational Attainment | Women with Births | Births / 1,000 Women |
| Less than High School | 0 (0.0%) | 0.0 |
| High School Diploma | 48 (100.0%) | 1,000.0 |
| College or Associate's Degree | 0 (0.0%) | 0.0 |
| Bachelor's Degree | 0 (0.0%) | 0.0 |
| Graduate Degree | 0 (0.0%) | 0.0 |
| Total | 48 (100.0%) | 312.0 |
Fertility by Education by Marriage Status in Blue Hill
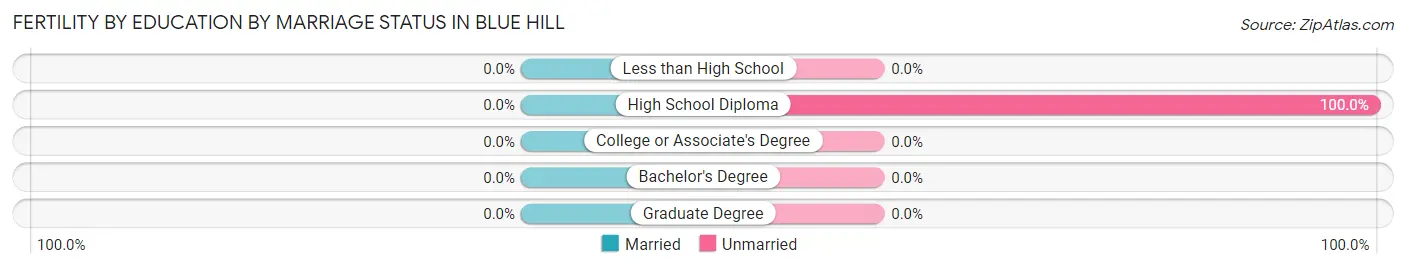
| Educational Attainment | Married | Unmarried |
| Less than High School | 0 (0.0%) | 0 (0.0%) |
| High School Diploma | 0 (0.0%) | 48 (100.0%) |
| College or Associate's Degree | 0 (0.0%) | 0 (0.0%) |
| Bachelor's Degree | 0 (0.0%) | 0 (0.0%) |
| Graduate Degree | 0 (0.0%) | 0 (0.0%) |
| Total | 0 (0.0%) | 48 (100.0%) |
Employment Characteristics in Blue Hill
Employment by Class of Employer in Blue Hill
Among the 443 employed individuals in Blue Hill, private company employees (388 | 87.6%), not-for-profit organizations (41 | 9.3%), and local government employees (14 | 3.2%) make up the most common classes of employment.
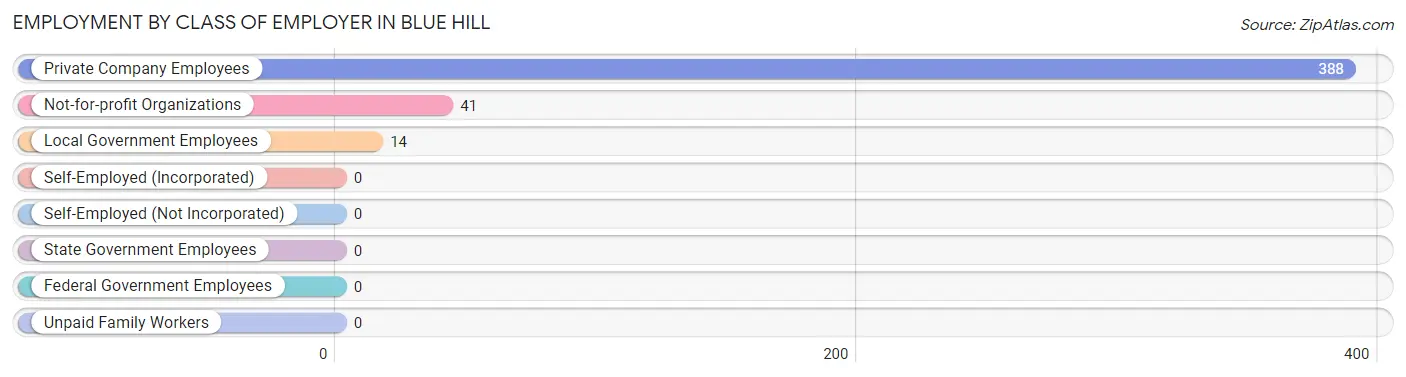
| Employer Class | # Employees | % Employees |
| Private Company Employees | 388 | 87.6% |
| Self-Employed (Incorporated) | 0 | 0.0% |
| Self-Employed (Not Incorporated) | 0 | 0.0% |
| Not-for-profit Organizations | 41 | 9.3% |
| Local Government Employees | 14 | 3.2% |
| State Government Employees | 0 | 0.0% |
| Federal Government Employees | 0 | 0.0% |
| Unpaid Family Workers | 0 | 0.0% |
| Total | 443 | 100.0% |
Employment Status by Age in Blue Hill
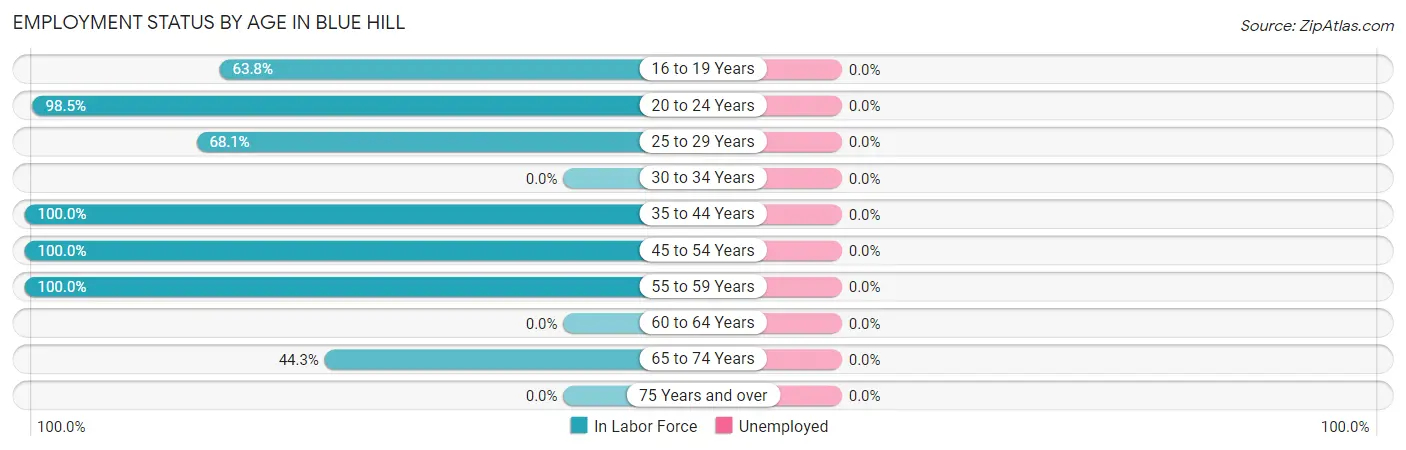
| Age Bracket | In Labor Force | Unemployed |
| 16 to 19 Years | 30 (63.8%) | 0 (0.0%) |
| 20 to 24 Years | 66 (98.5%) | 0 (0.0%) |
| 25 to 29 Years | 62 (68.1%) | 0 (0.0%) |
| 30 to 34 Years | 0 (0.0%) | 0 (0.0%) |
| 35 to 44 Years | 2 (100.0%) | 0 (0.0%) |
| 45 to 54 Years | 210 (100.0%) | 0 (0.0%) |
| 55 to 59 Years | 113 (100.0%) | 0 (0.0%) |
| 60 to 64 Years | 0 (0.0%) | 0 (0.0%) |
| 65 to 74 Years | 27 (44.3%) | 0 (0.0%) |
| 75 Years and over | 0 (0.0%) | 0 (0.0%) |
| Total | 510 (62.3%) | 0 (0.0%) |
Employment Status by Educational Attainment in Blue Hill
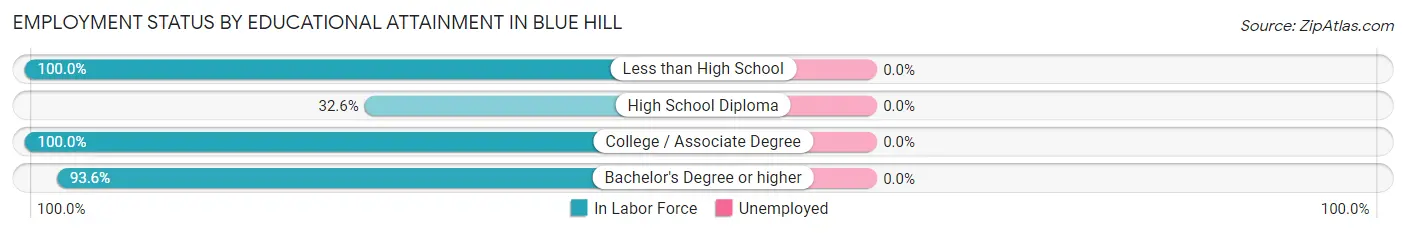
| Educational Attainment | In Labor Force | Unemployed |
| Less than High School | 155 (100.0%) | 0 (0.0%) |
| High School Diploma | 14 (32.6%) | 0 (0.0%) |
| College / Associate Degree | 12 (100.0%) | 0 (0.0%) |
| Bachelor's Degree or higher | 206 (93.6%) | 0 (0.0%) |
| Total | 387 (90.0%) | 0 (0.0%) |
Employment Occupations by Sex in Blue Hill
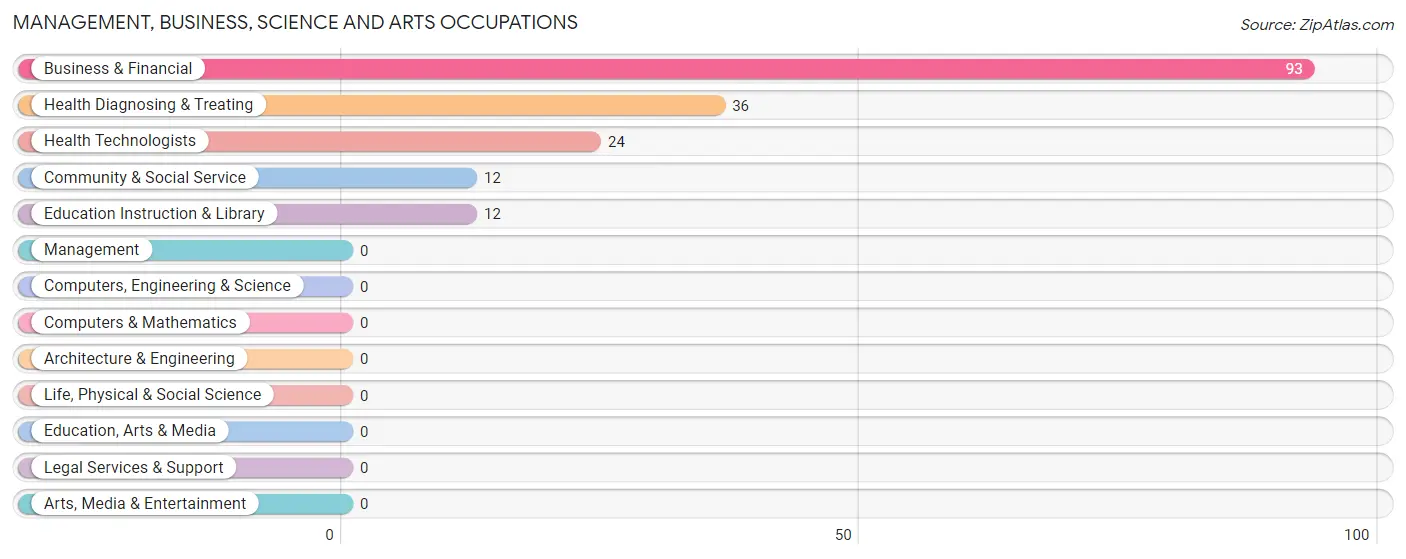
Management, Business, Science and Arts Occupations
The most common Management, Business, Science and Arts occupations in Blue Hill are Business & Financial (93 | 18.2%), Health Diagnosing & Treating (36 | 7.1%), Health Technologists (24 | 4.7%), Community & Social Service (12 | 2.4%), and Education Instruction & Library (12 | 2.4%).
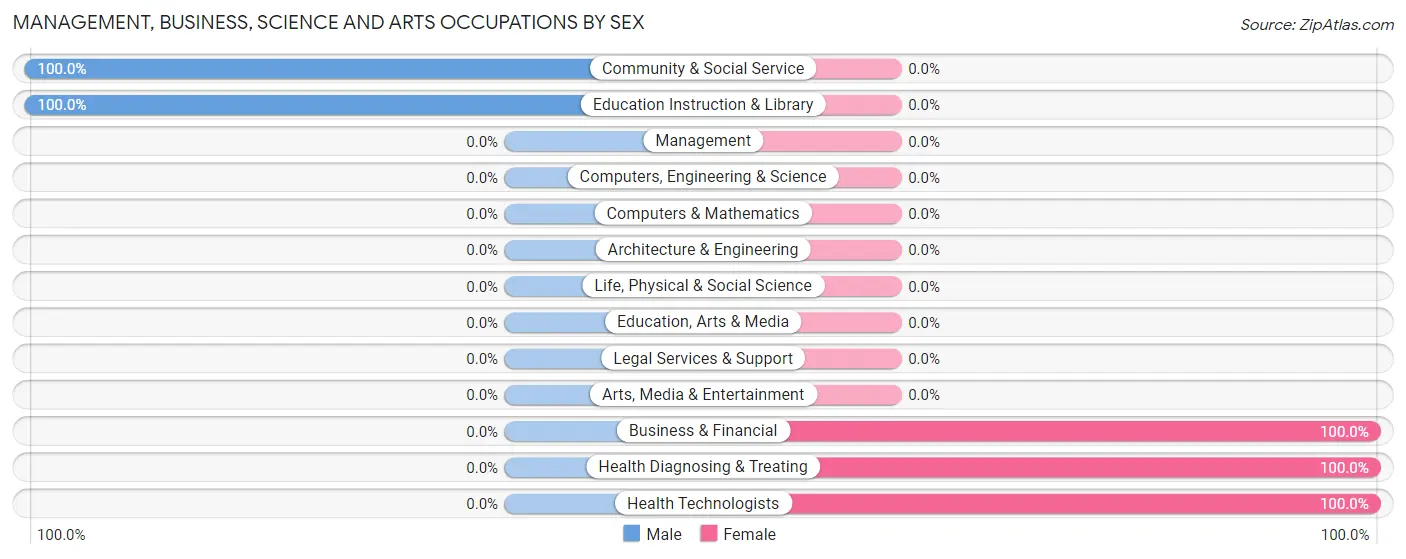
Management, Business, Science and Arts Occupations by Sex
Within the Management, Business, Science and Arts occupations in Blue Hill, the most male-oriented occupations are Community & Social Service (100.0%), and Education Instruction & Library (100.0%), while the most female-oriented occupations are Business & Financial (100.0%), Health Diagnosing & Treating (100.0%), and Health Technologists (100.0%).
| Occupation | Male | Female |
| Management | 0 (0.0%) | 0 (0.0%) |
| Business & Financial | 0 (0.0%) | 93 (100.0%) |
| Computers, Engineering & Science | 0 (0.0%) | 0 (0.0%) |
| Computers & Mathematics | 0 (0.0%) | 0 (0.0%) |
| Architecture & Engineering | 0 (0.0%) | 0 (0.0%) |
| Life, Physical & Social Science | 0 (0.0%) | 0 (0.0%) |
| Community & Social Service | 12 (100.0%) | 0 (0.0%) |
| Education, Arts & Media | 0 (0.0%) | 0 (0.0%) |
| Legal Services & Support | 0 (0.0%) | 0 (0.0%) |
| Education Instruction & Library | 12 (100.0%) | 0 (0.0%) |
| Arts, Media & Entertainment | 0 (0.0%) | 0 (0.0%) |
| Health Diagnosing & Treating | 0 (0.0%) | 36 (100.0%) |
| Health Technologists | 0 (0.0%) | 24 (100.0%) |
| Total (Category) | 12 (8.5%) | 129 (91.5%) |
| Total (Overall) | 163 (32.0%) | 347 (68.0%) |
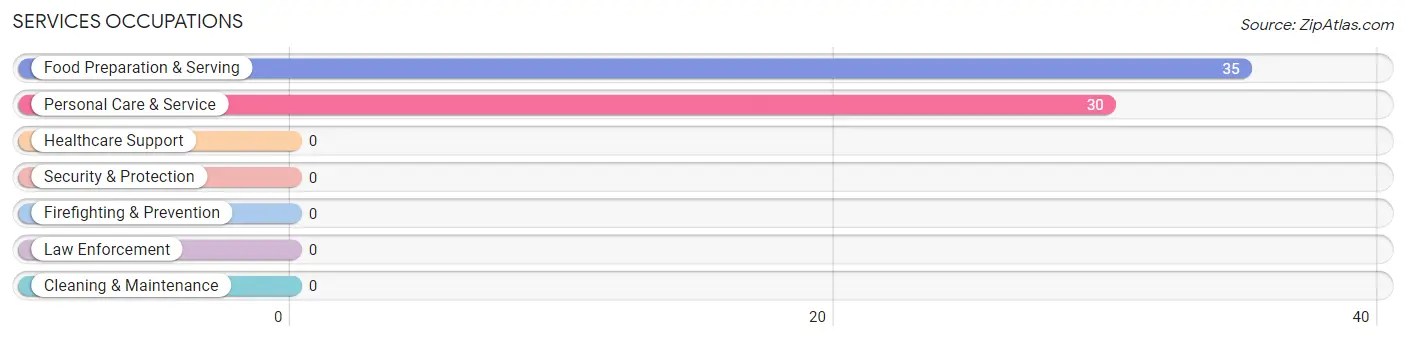
Services Occupations
The most common Services occupations in Blue Hill are Food Preparation & Serving (35 | 6.9%), and Personal Care & Service (30 | 5.9%).
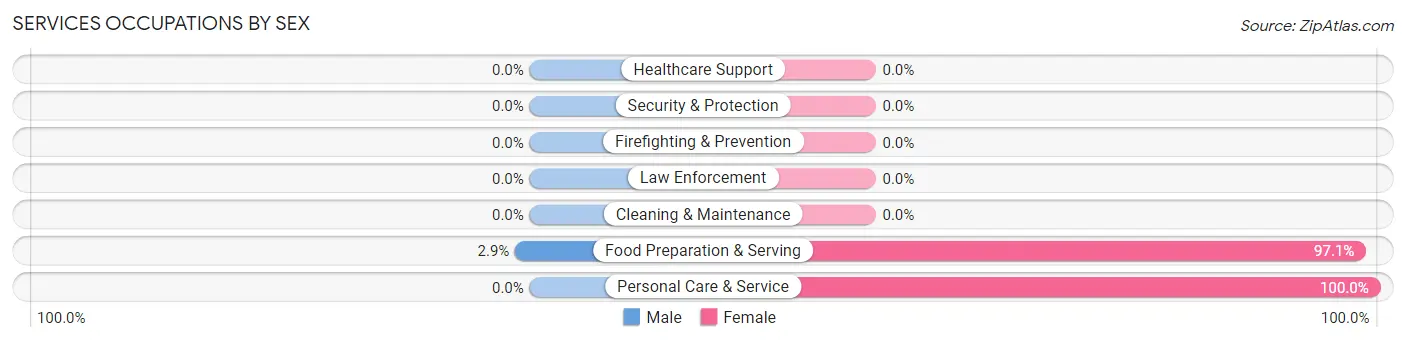
Services Occupations by Sex
| Occupation | Male | Female |
| Healthcare Support | 0 (0.0%) | 0 (0.0%) |
| Security & Protection | 0 (0.0%) | 0 (0.0%) |
| Firefighting & Prevention | 0 (0.0%) | 0 (0.0%) |
| Law Enforcement | 0 (0.0%) | 0 (0.0%) |
| Food Preparation & Serving | 1 (2.9%) | 34 (97.1%) |
| Cleaning & Maintenance | 0 (0.0%) | 0 (0.0%) |
| Personal Care & Service | 0 (0.0%) | 30 (100.0%) |
| Total (Category) | 1 (1.5%) | 64 (98.5%) |
| Total (Overall) | 163 (32.0%) | 347 (68.0%) |
Sales and Office Occupations
The most common Sales and Office occupations in Blue Hill are Office & Administration (54 | 10.6%), and Sales & Related (15 | 2.9%).

Sales and Office Occupations by Sex
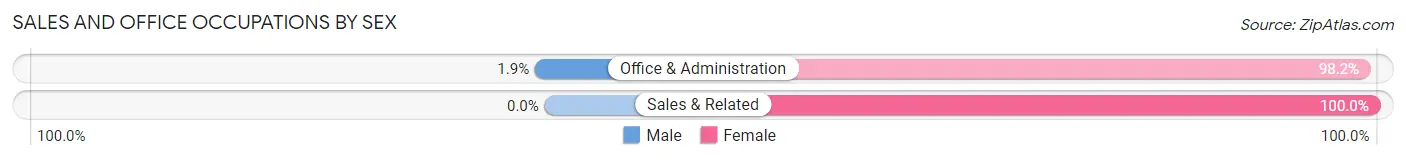
| Occupation | Male | Female |
| Sales & Related | 0 (0.0%) | 15 (100.0%) |
| Office & Administration | 1 (1.8%) | 53 (98.2%) |
| Total (Category) | 1 (1.5%) | 68 (98.6%) |
| Total (Overall) | 163 (32.0%) | 347 (68.0%) |
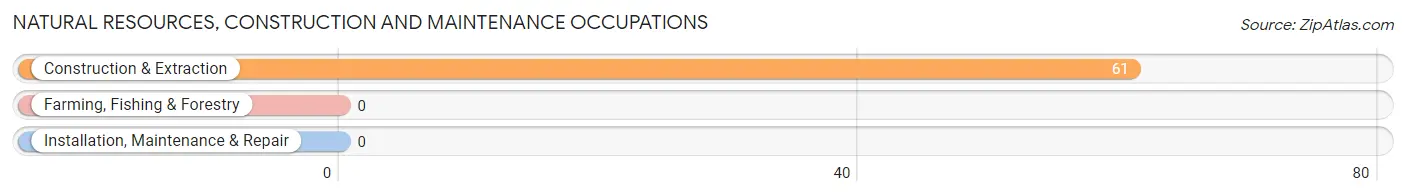
Natural Resources, Construction and Maintenance Occupations
The most common Natural Resources, Construction and Maintenance occupations in Blue Hill are , and Construction & Extraction (61 | 12.0%).
Natural Resources, Construction and Maintenance Occupations by Sex
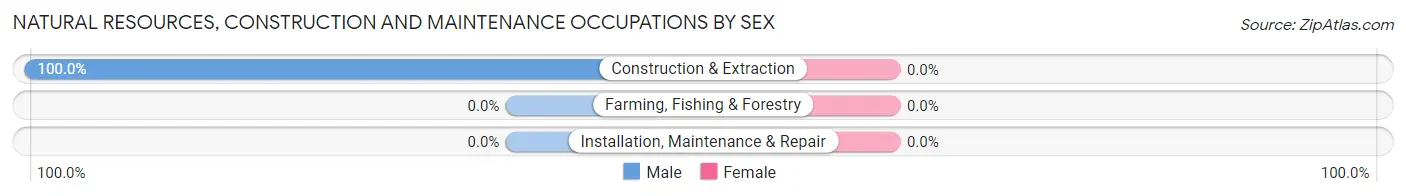
| Occupation | Male | Female |
| Farming, Fishing & Forestry | 0 (0.0%) | 0 (0.0%) |
| Construction & Extraction | 61 (100.0%) | 0 (0.0%) |
| Installation, Maintenance & Repair | 0 (0.0%) | 0 (0.0%) |
| Total (Category) | 61 (100.0%) | 0 (0.0%) |
| Total (Overall) | 163 (32.0%) | 347 (68.0%) |
Production, Transportation and Moving Occupations
The most common Production, Transportation and Moving occupations in Blue Hill are Transportation (88 | 17.2%), and Material Moving (86 | 16.9%).
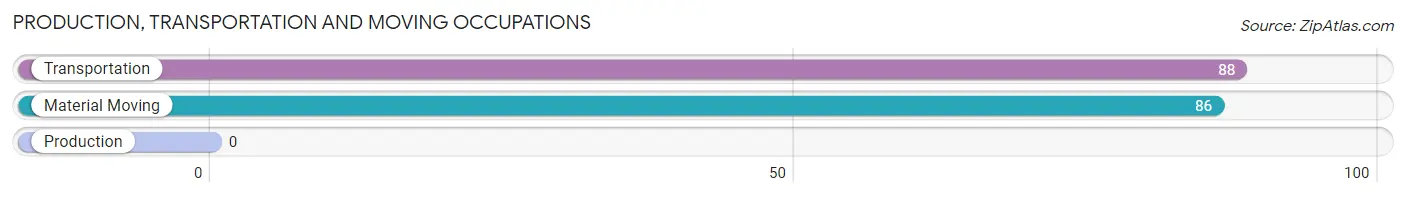
Production, Transportation and Moving Occupations by Sex
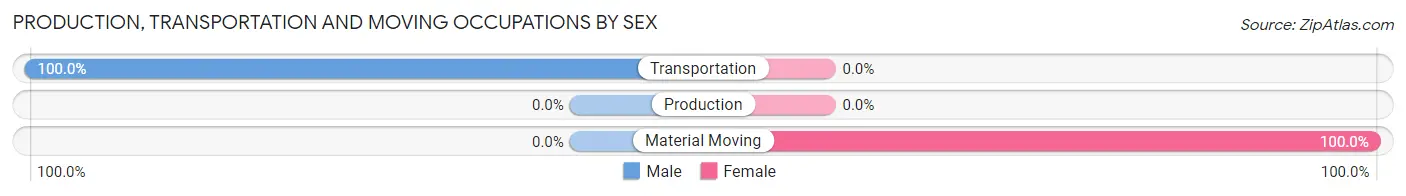
| Occupation | Male | Female |
| Production | 0 (0.0%) | 0 (0.0%) |
| Transportation | 88 (100.0%) | 0 (0.0%) |
| Material Moving | 0 (0.0%) | 86 (100.0%) |
| Total (Category) | 88 (50.6%) | 86 (49.4%) |
| Total (Overall) | 163 (32.0%) | 347 (68.0%) |
Employment Industries by Sex in Blue Hill
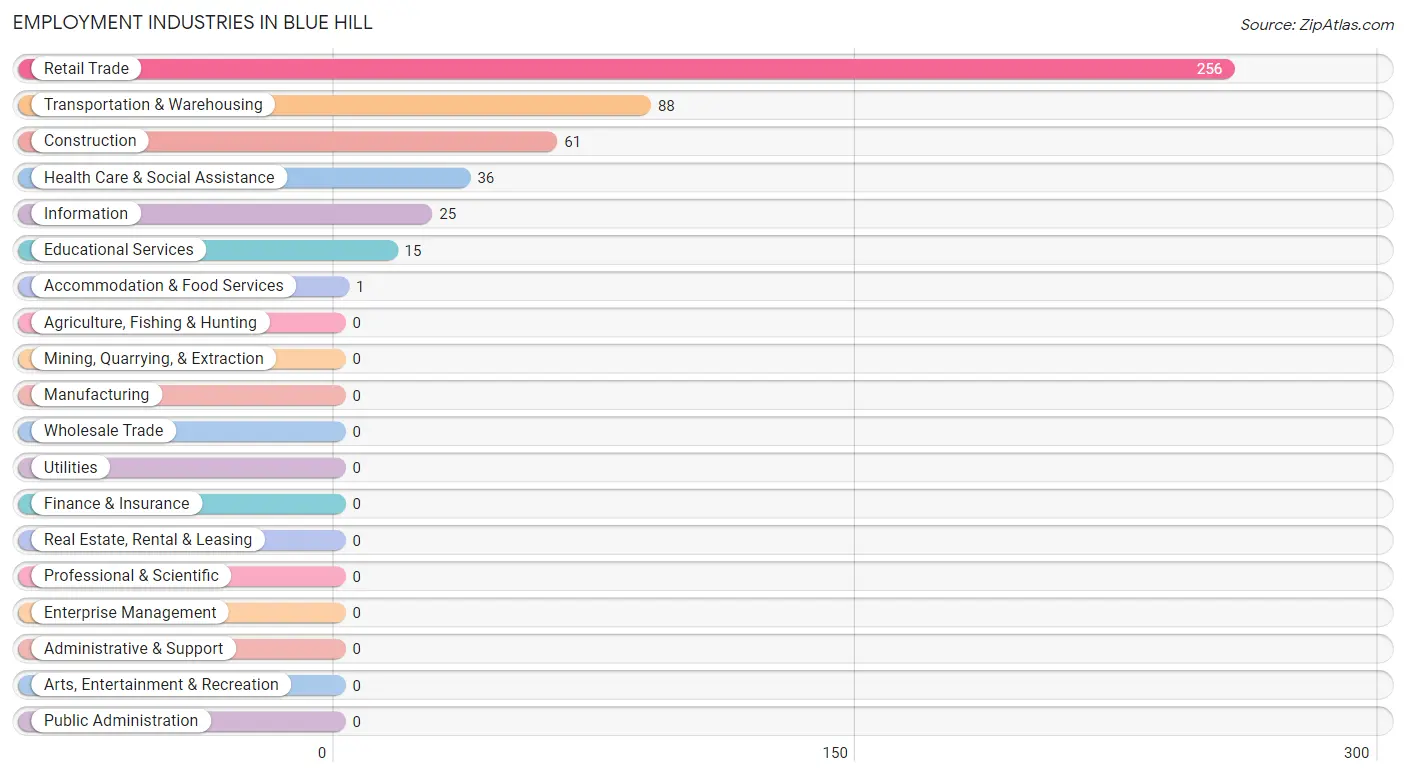
Employment Industries in Blue Hill
The major employment industries in Blue Hill include Retail Trade (256 | 50.2%), Transportation & Warehousing (88 | 17.2%), Construction (61 | 12.0%), Health Care & Social Assistance (36 | 7.1%), and Information (25 | 4.9%).
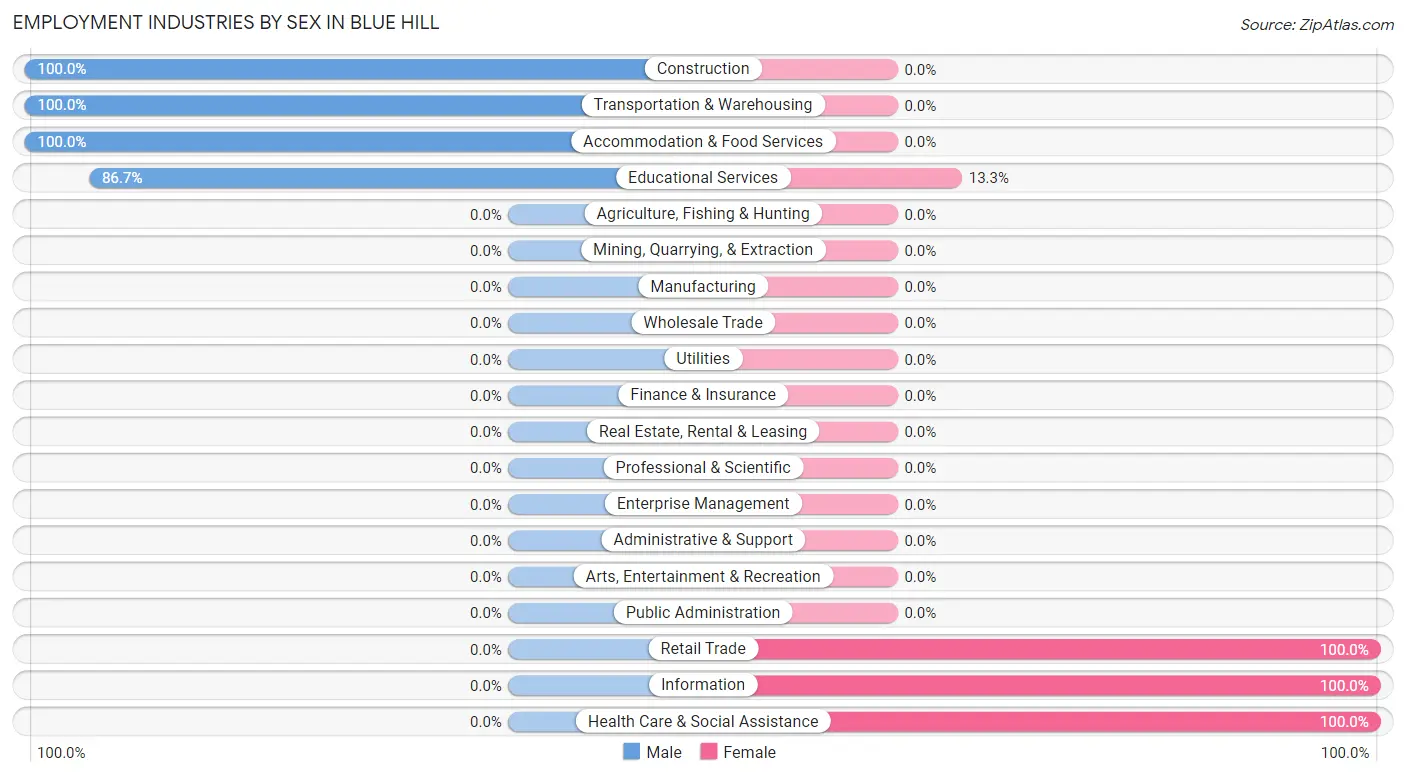
Employment Industries by Sex in Blue Hill
The Blue Hill industries that see more men than women are Construction (100.0%), Transportation & Warehousing (100.0%), and Accommodation & Food Services (100.0%), whereas the industries that tend to have a higher number of women are Retail Trade (100.0%), Information (100.0%), and Health Care & Social Assistance (100.0%).
| Industry | Male | Female |
| Agriculture, Fishing & Hunting | 0 (0.0%) | 0 (0.0%) |
| Mining, Quarrying, & Extraction | 0 (0.0%) | 0 (0.0%) |
| Construction | 61 (100.0%) | 0 (0.0%) |
| Manufacturing | 0 (0.0%) | 0 (0.0%) |
| Wholesale Trade | 0 (0.0%) | 0 (0.0%) |
| Retail Trade | 0 (0.0%) | 256 (100.0%) |
| Transportation & Warehousing | 88 (100.0%) | 0 (0.0%) |
| Utilities | 0 (0.0%) | 0 (0.0%) |
| Information | 0 (0.0%) | 25 (100.0%) |
| Finance & Insurance | 0 (0.0%) | 0 (0.0%) |
| Real Estate, Rental & Leasing | 0 (0.0%) | 0 (0.0%) |
| Professional & Scientific | 0 (0.0%) | 0 (0.0%) |
| Enterprise Management | 0 (0.0%) | 0 (0.0%) |
| Administrative & Support | 0 (0.0%) | 0 (0.0%) |
| Educational Services | 13 (86.7%) | 2 (13.3%) |
| Health Care & Social Assistance | 0 (0.0%) | 36 (100.0%) |
| Arts, Entertainment & Recreation | 0 (0.0%) | 0 (0.0%) |
| Accommodation & Food Services | 1 (100.0%) | 0 (0.0%) |
| Public Administration | 0 (0.0%) | 0 (0.0%) |
| Total | 163 (32.0%) | 347 (68.0%) |
Education in Blue Hill
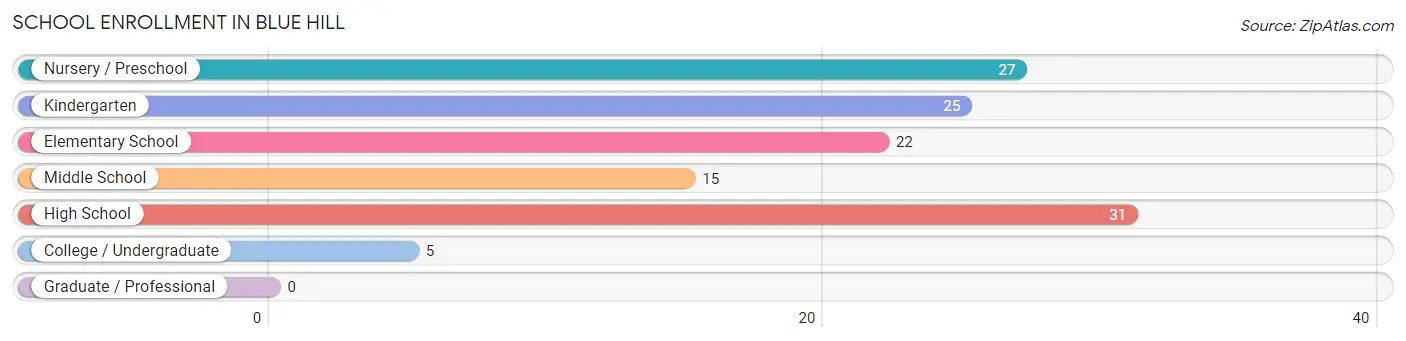
School Enrollment in Blue Hill
The most common levels of schooling among the 125 students in Blue Hill are high school (31 | 24.8%), nursery / preschool (27 | 21.6%), and kindergarten (25 | 20.0%).
| School Level | # Students | % Students |
| Nursery / Preschool | 27 | 21.6% |
| Kindergarten | 25 | 20.0% |
| Elementary School | 22 | 17.6% |
| Middle School | 15 | 12.0% |
| High School | 31 | 24.8% |
| College / Undergraduate | 5 | 4.0% |
| Graduate / Professional | 0 | 0.0% |
| Total | 125 | 100.0% |
School Enrollment by Age by Funding Source in Blue Hill
Out of a total of 125 students who are enrolled in schools in Blue Hill, 40 (32.0%) attend a private institution, while the remaining 85 (68.0%) are enrolled in public schools. The age group of 15 to 17 year olds has the highest likelihood of being enrolled in private schools, with 14 (93.3% in the age bracket) enrolled. Conversely, the age group of 10 to 14 year olds has the lowest likelihood of being enrolled in a private school, with 30 (100.0% in the age bracket) attending a public institution.
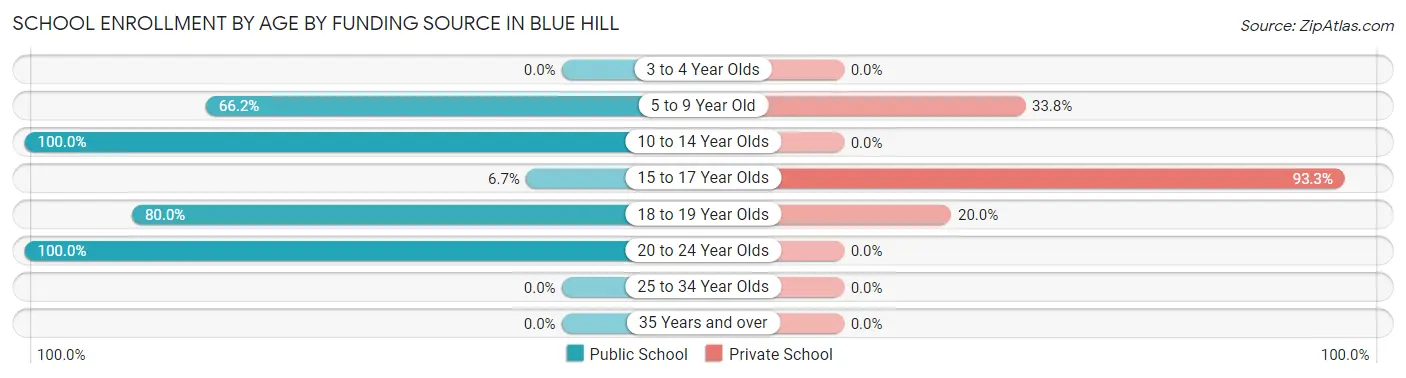
| Age Bracket | Public School | Private School |
| 3 to 4 Year Olds | 0 (0.0%) | 0 (0.0%) |
| 5 to 9 Year Old | 49 (66.2%) | 25 (33.8%) |
| 10 to 14 Year Olds | 30 (100.0%) | 0 (0.0%) |
| 15 to 17 Year Olds | 1 (6.7%) | 14 (93.3%) |
| 18 to 19 Year Olds | 4 (80.0%) | 1 (20.0%) |
| 20 to 24 Year Olds | 1 (100.0%) | 0 (0.0%) |
| 25 to 34 Year Olds | 0 (0.0%) | 0 (0.0%) |
| 35 Years and over | 0 (0.0%) | 0 (0.0%) |
| Total | 85 (68.0%) | 40 (32.0%) |
Educational Attainment by Field of Study in Blue Hill
Liberal arts & history (118 | 28.2%), visual & performing arts (65 | 15.5%), education (62 | 14.8%), bio, nature & agricultural (54 | 12.9%), and psychology (37 | 8.8%) are the most common fields of study among 418 individuals in Blue Hill who have obtained a bachelor's degree or higher.
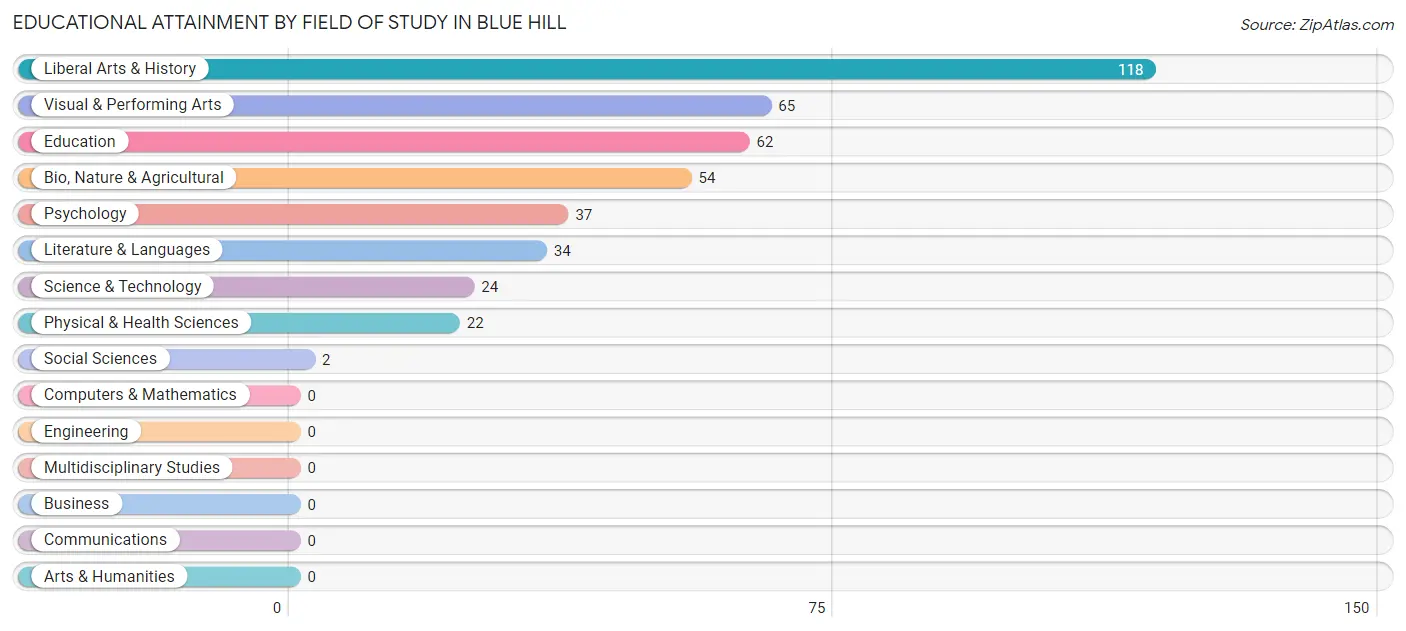
| Field of Study | # Graduates | % Graduates |
| Computers & Mathematics | 0 | 0.0% |
| Bio, Nature & Agricultural | 54 | 12.9% |
| Physical & Health Sciences | 22 | 5.3% |
| Psychology | 37 | 8.8% |
| Social Sciences | 2 | 0.5% |
| Engineering | 0 | 0.0% |
| Multidisciplinary Studies | 0 | 0.0% |
| Science & Technology | 24 | 5.7% |
| Business | 0 | 0.0% |
| Education | 62 | 14.8% |
| Literature & Languages | 34 | 8.1% |
| Liberal Arts & History | 118 | 28.2% |
| Visual & Performing Arts | 65 | 15.5% |
| Communications | 0 | 0.0% |
| Arts & Humanities | 0 | 0.0% |
| Total | 418 | 100.0% |
Transportation & Commute in Blue Hill
Vehicle Availability by Sex in Blue Hill
The most prevalent vehicle ownership categories in Blue Hill are males with 5 or more vehicles (88, accounting for 54.7%) and females with 5 or more vehicles (0, making up 34.0%).
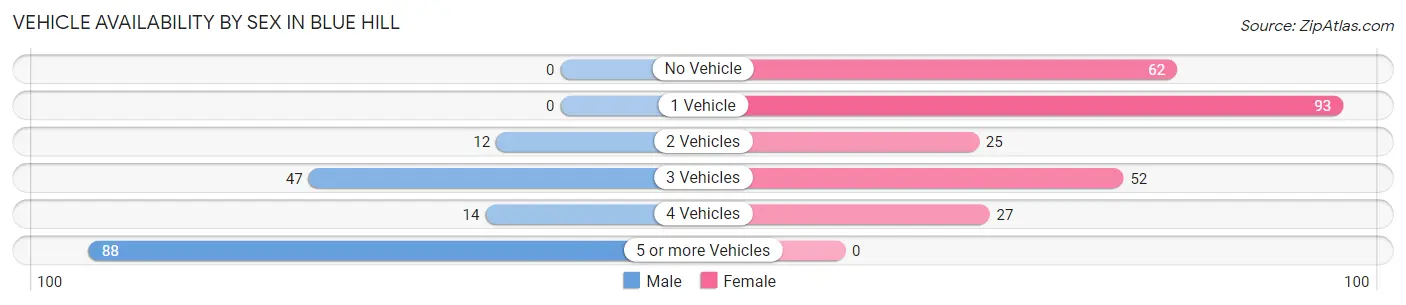
| Vehicles Available | Male | Female |
| No Vehicle | 0 (0.0%) | 62 (23.9%) |
| 1 Vehicle | 0 (0.0%) | 93 (35.9%) |
| 2 Vehicles | 12 (7.4%) | 25 (9.7%) |
| 3 Vehicles | 47 (29.2%) | 52 (20.1%) |
| 4 Vehicles | 14 (8.7%) | 27 (10.4%) |
| 5 or more Vehicles | 88 (54.7%) | 0 (0.0%) |
| Total | 161 (100.0%) | 259 (100.0%) |
Commute Time in Blue Hill
The most frequently occuring commute durations in Blue Hill are 30 to 34 minutes (156 commuters, 35.2%), less than 5 minutes (137 commuters, 30.9%), and 45 to 59 minutes (55 commuters, 12.4%).
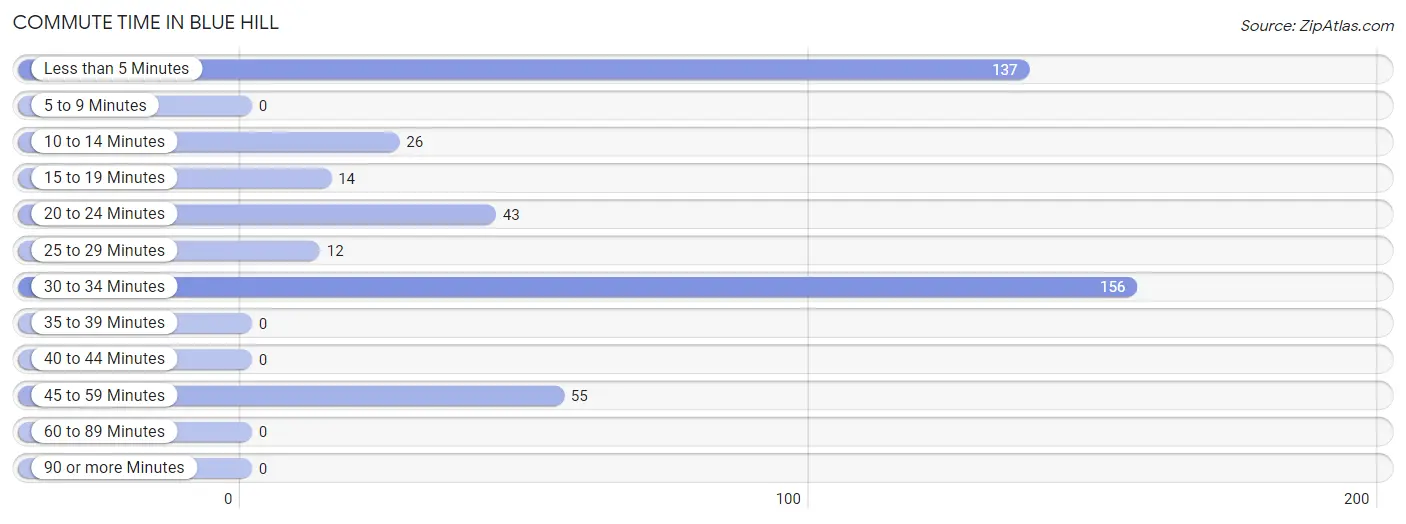
| Commute Time | # Commuters | % Commuters |
| Less than 5 Minutes | 137 | 30.9% |
| 5 to 9 Minutes | 0 | 0.0% |
| 10 to 14 Minutes | 26 | 5.9% |
| 15 to 19 Minutes | 14 | 3.2% |
| 20 to 24 Minutes | 43 | 9.7% |
| 25 to 29 Minutes | 12 | 2.7% |
| 30 to 34 Minutes | 156 | 35.2% |
| 35 to 39 Minutes | 0 | 0.0% |
| 40 to 44 Minutes | 0 | 0.0% |
| 45 to 59 Minutes | 55 | 12.4% |
| 60 to 89 Minutes | 0 | 0.0% |
| 90 or more Minutes | 0 | 0.0% |
Commute Time by Sex in Blue Hill
The most common commute times in Blue Hill are less than 5 minutes (135 commuters, 82.8%) for males and 30 to 34 minutes (155 commuters, 55.4%) for females.
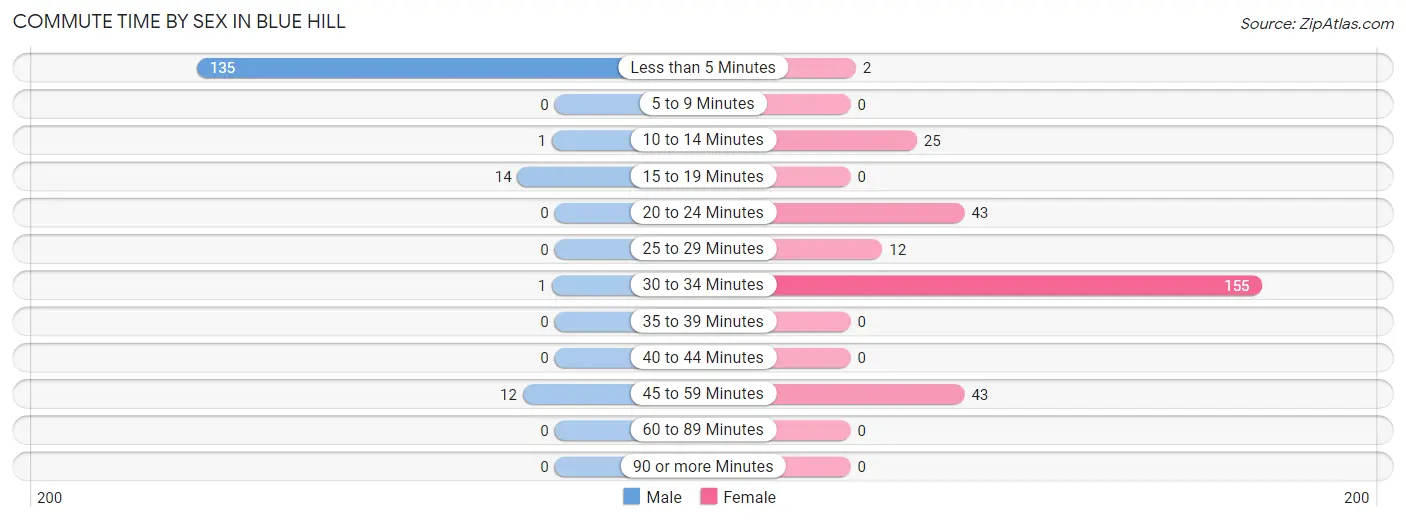
| Commute Time | Male | Female |
| Less than 5 Minutes | 135 (82.8%) | 2 (0.7%) |
| 5 to 9 Minutes | 0 (0.0%) | 0 (0.0%) |
| 10 to 14 Minutes | 1 (0.6%) | 25 (8.9%) |
| 15 to 19 Minutes | 14 (8.6%) | 0 (0.0%) |
| 20 to 24 Minutes | 0 (0.0%) | 43 (15.4%) |
| 25 to 29 Minutes | 0 (0.0%) | 12 (4.3%) |
| 30 to 34 Minutes | 1 (0.6%) | 155 (55.4%) |
| 35 to 39 Minutes | 0 (0.0%) | 0 (0.0%) |
| 40 to 44 Minutes | 0 (0.0%) | 0 (0.0%) |
| 45 to 59 Minutes | 12 (7.4%) | 43 (15.4%) |
| 60 to 89 Minutes | 0 (0.0%) | 0 (0.0%) |
| 90 or more Minutes | 0 (0.0%) | 0 (0.0%) |
Time of Departure to Work by Sex in Blue Hill
The most frequent times of departure to work in Blue Hill are 7:00 AM to 7:29 AM (88, 54.0%) for males and 6:00 AM to 6:29 AM (93, 33.2%) for females.
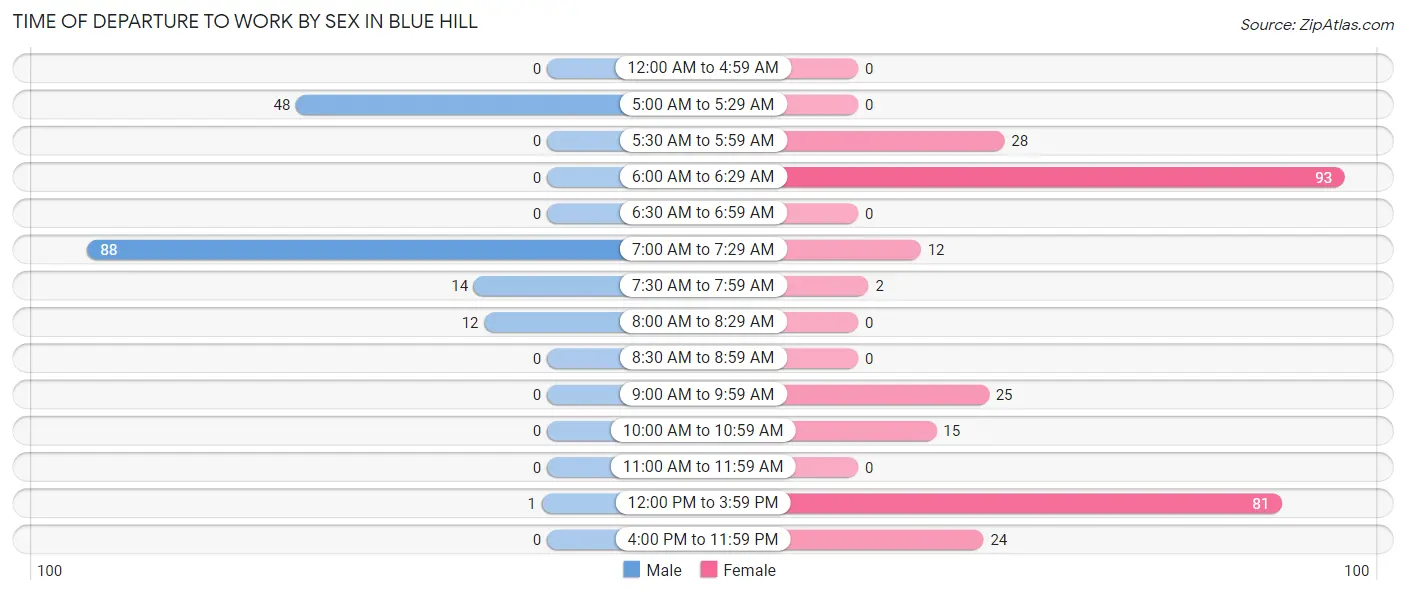
| Time of Departure | Male | Female |
| 12:00 AM to 4:59 AM | 0 (0.0%) | 0 (0.0%) |
| 5:00 AM to 5:29 AM | 48 (29.4%) | 0 (0.0%) |
| 5:30 AM to 5:59 AM | 0 (0.0%) | 28 (10.0%) |
| 6:00 AM to 6:29 AM | 0 (0.0%) | 93 (33.2%) |
| 6:30 AM to 6:59 AM | 0 (0.0%) | 0 (0.0%) |
| 7:00 AM to 7:29 AM | 88 (54.0%) | 12 (4.3%) |
| 7:30 AM to 7:59 AM | 14 (8.6%) | 2 (0.7%) |
| 8:00 AM to 8:29 AM | 12 (7.4%) | 0 (0.0%) |
| 8:30 AM to 8:59 AM | 0 (0.0%) | 0 (0.0%) |
| 9:00 AM to 9:59 AM | 0 (0.0%) | 25 (8.9%) |
| 10:00 AM to 10:59 AM | 0 (0.0%) | 15 (5.4%) |
| 11:00 AM to 11:59 AM | 0 (0.0%) | 0 (0.0%) |
| 12:00 PM to 3:59 PM | 1 (0.6%) | 81 (28.9%) |
| 4:00 PM to 11:59 PM | 0 (0.0%) | 24 (8.6%) |
| Total | 163 (100.0%) | 280 (100.0%) |
Housing Occupancy in Blue Hill
Occupancy by Ownership in Blue Hill
Of the total 493 dwellings in Blue Hill, owner-occupied units account for 206 (41.8%), while renter-occupied units make up 287 (58.2%).
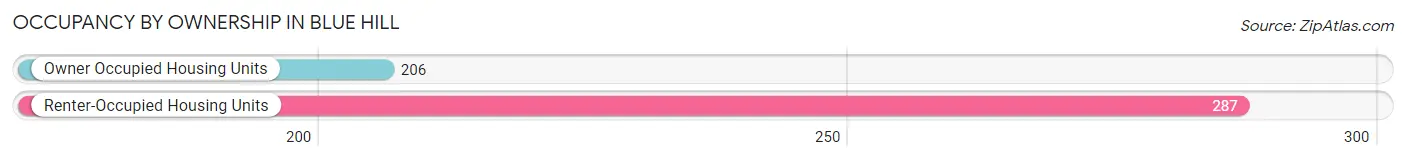
| Occupancy | # Housing Units | % Housing Units |
| Owner Occupied Housing Units | 206 | 41.8% |
| Renter-Occupied Housing Units | 287 | 58.2% |
| Total Occupied Housing Units | 493 | 100.0% |
Occupancy by Household Size in Blue Hill
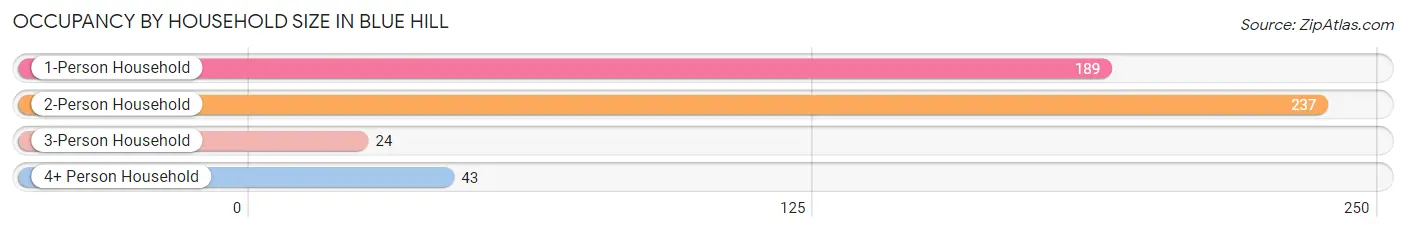
| Household Size | # Housing Units | % Housing Units |
| 1-Person Household | 189 | 38.3% |
| 2-Person Household | 237 | 48.1% |
| 3-Person Household | 24 | 4.9% |
| 4+ Person Household | 43 | 8.7% |
| Total Housing Units | 493 | 100.0% |
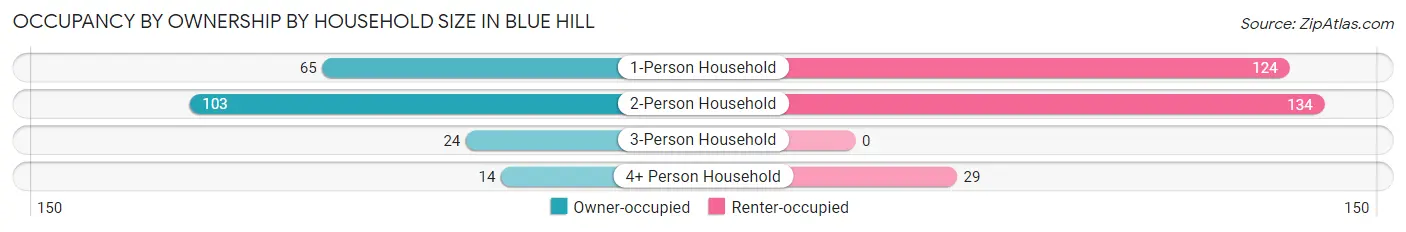
Occupancy by Ownership by Household Size in Blue Hill
| Household Size | Owner-occupied | Renter-occupied |
| 1-Person Household | 65 (34.4%) | 124 (65.6%) |
| 2-Person Household | 103 (43.5%) | 134 (56.5%) |
| 3-Person Household | 24 (100.0%) | 0 (0.0%) |
| 4+ Person Household | 14 (32.6%) | 29 (67.4%) |
| Total Housing Units | 206 (41.8%) | 287 (58.2%) |
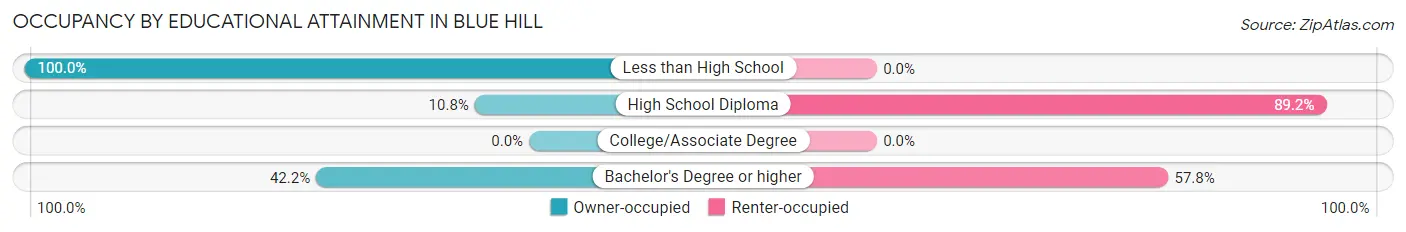
Occupancy by Educational Attainment in Blue Hill
| Household Size | Owner-occupied | Renter-occupied |
| Less than High School | 67 (100.0%) | 0 (0.0%) |
| High School Diploma | 14 (10.8%) | 116 (89.2%) |
| College/Associate Degree | 0 (0.0%) | 0 (0.0%) |
| Bachelor's Degree or higher | 125 (42.2%) | 171 (57.8%) |
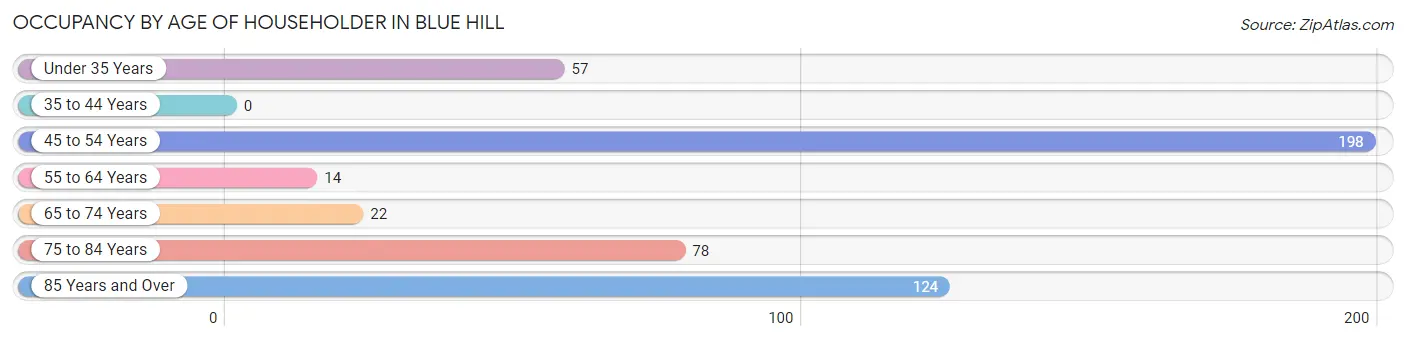
Occupancy by Age of Householder in Blue Hill
| Age Bracket | # Households | % Households |
| Under 35 Years | 57 | 11.6% |
| 35 to 44 Years | 0 | 0.0% |
| 45 to 54 Years | 198 | 40.2% |
| 55 to 64 Years | 14 | 2.8% |
| 65 to 74 Years | 22 | 4.5% |
| 75 to 84 Years | 78 | 15.8% |
| 85 Years and Over | 124 | 25.2% |
| Total | 493 | 100.0% |
Housing Finances in Blue Hill
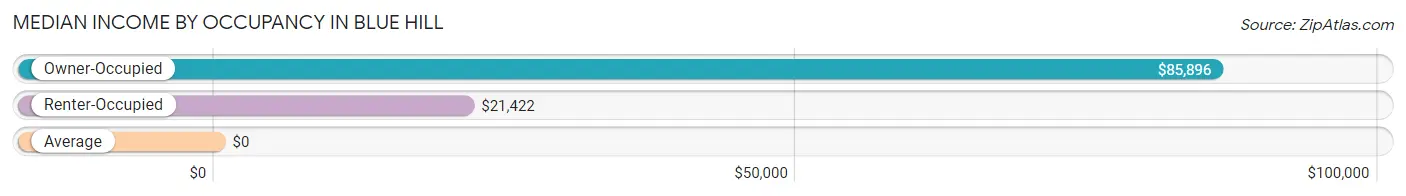
Median Income by Occupancy in Blue Hill
| Occupancy Type | # Households | Median Income |
| Owner-Occupied | 206 (41.8%) | $85,896 |
| Renter-Occupied | 287 (58.2%) | $21,422 |
| Average | 493 (100.0%) | $0 |
Occupancy by Householder Income Bracket in Blue Hill
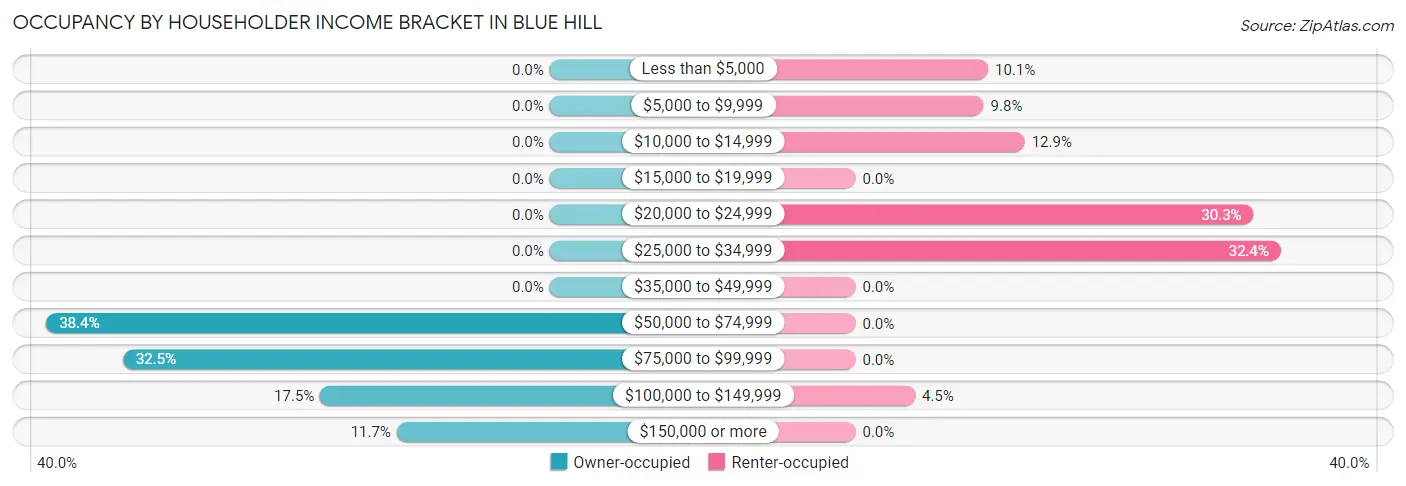
| Income Bracket | Owner-occupied | Renter-occupied |
| Less than $5,000 | 0 (0.0%) | 29 (10.1%) |
| $5,000 to $9,999 | 0 (0.0%) | 28 (9.8%) |
| $10,000 to $14,999 | 0 (0.0%) | 37 (12.9%) |
| $15,000 to $19,999 | 0 (0.0%) | 0 (0.0%) |
| $20,000 to $24,999 | 0 (0.0%) | 87 (30.3%) |
| $25,000 to $34,999 | 0 (0.0%) | 93 (32.4%) |
| $35,000 to $49,999 | 0 (0.0%) | 0 (0.0%) |
| $50,000 to $74,999 | 79 (38.4%) | 0 (0.0%) |
| $75,000 to $99,999 | 67 (32.5%) | 0 (0.0%) |
| $100,000 to $149,999 | 36 (17.5%) | 13 (4.5%) |
| $150,000 or more | 24 (11.7%) | 0 (0.0%) |
| Total | 206 (100.0%) | 287 (100.0%) |
Monthly Housing Cost Tiers in Blue Hill
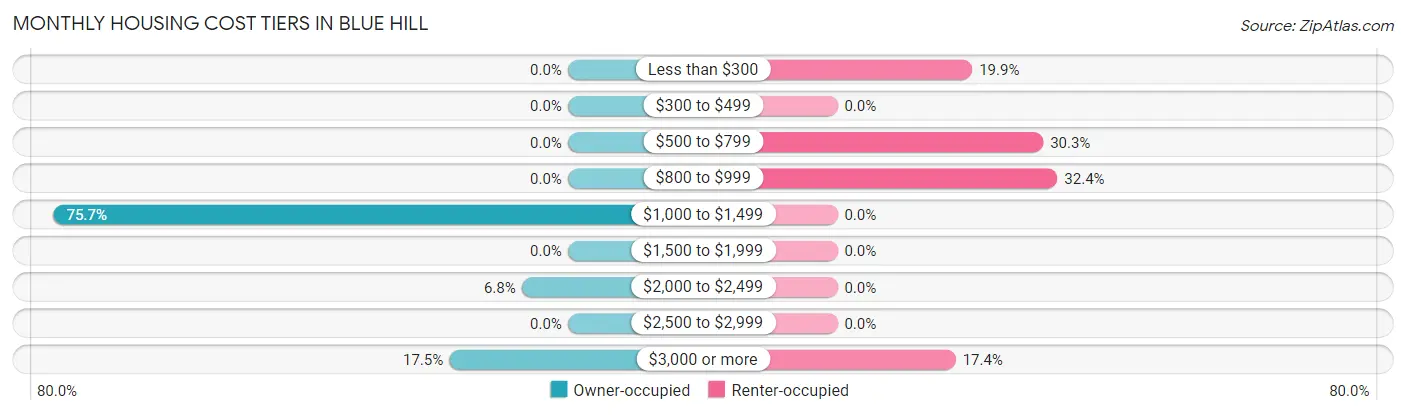
| Monthly Cost | Owner-occupied | Renter-occupied |
| Less than $300 | 0 (0.0%) | 57 (19.9%) |
| $300 to $499 | 0 (0.0%) | 0 (0.0%) |
| $500 to $799 | 0 (0.0%) | 87 (30.3%) |
| $800 to $999 | 0 (0.0%) | 93 (32.4%) |
| $1,000 to $1,499 | 156 (75.7%) | 0 (0.0%) |
| $1,500 to $1,999 | 0 (0.0%) | 0 (0.0%) |
| $2,000 to $2,499 | 14 (6.8%) | 0 (0.0%) |
| $2,500 to $2,999 | 0 (0.0%) | 0 (0.0%) |
| $3,000 or more | 36 (17.5%) | 50 (17.4%) |
| Total | 206 (100.0%) | 287 (100.0%) |
Physical Housing Characteristics in Blue Hill
Housing Structures in Blue Hill
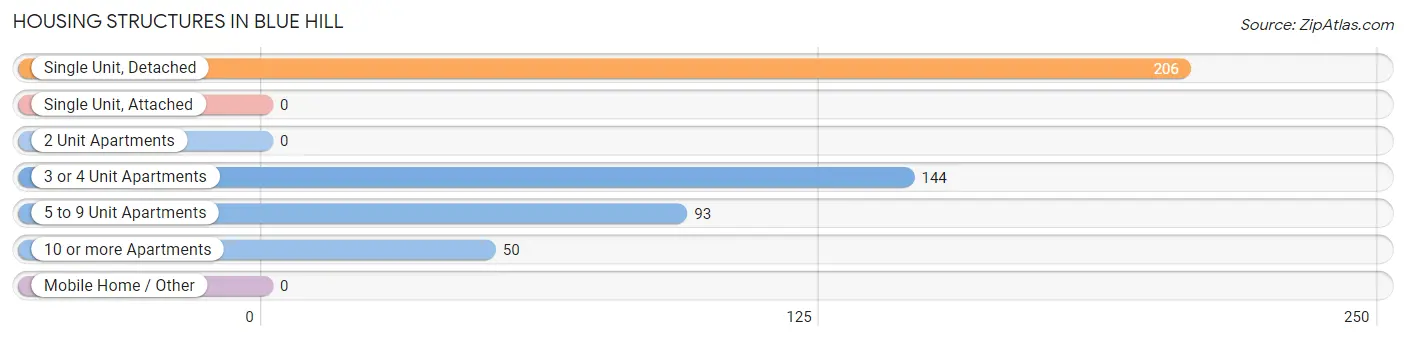
| Structure Type | # Housing Units | % Housing Units |
| Single Unit, Detached | 206 | 41.8% |
| Single Unit, Attached | 0 | 0.0% |
| 2 Unit Apartments | 0 | 0.0% |
| 3 or 4 Unit Apartments | 144 | 29.2% |
| 5 to 9 Unit Apartments | 93 | 18.9% |
| 10 or more Apartments | 50 | 10.1% |
| Mobile Home / Other | 0 | 0.0% |
| Total | 493 | 100.0% |
Housing Structures by Occupancy in Blue Hill
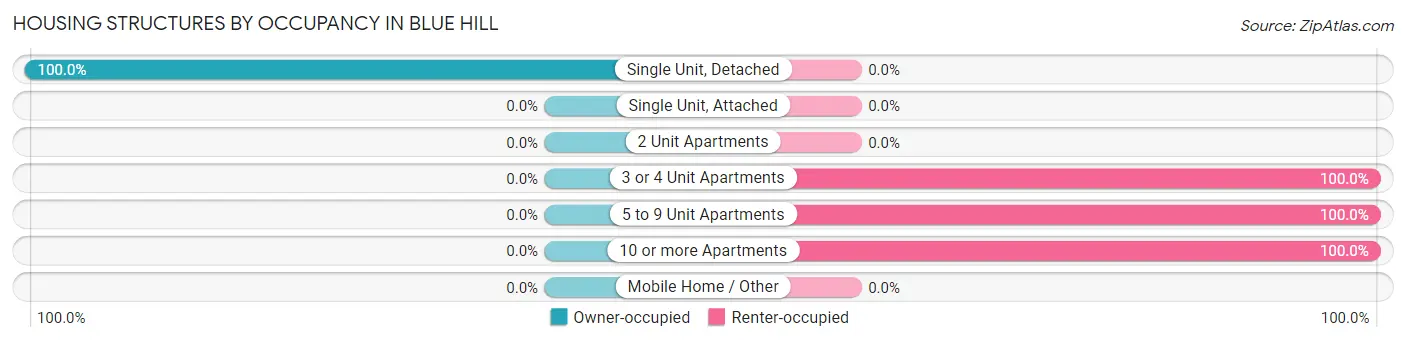
| Structure Type | Owner-occupied | Renter-occupied |
| Single Unit, Detached | 206 (100.0%) | 0 (0.0%) |
| Single Unit, Attached | 0 (0.0%) | 0 (0.0%) |
| 2 Unit Apartments | 0 (0.0%) | 0 (0.0%) |
| 3 or 4 Unit Apartments | 0 (0.0%) | 144 (100.0%) |
| 5 to 9 Unit Apartments | 0 (0.0%) | 93 (100.0%) |
| 10 or more Apartments | 0 (0.0%) | 50 (100.0%) |
| Mobile Home / Other | 0 (0.0%) | 0 (0.0%) |
| Total | 206 (41.8%) | 287 (58.2%) |
Housing Structures by Number of Rooms in Blue Hill
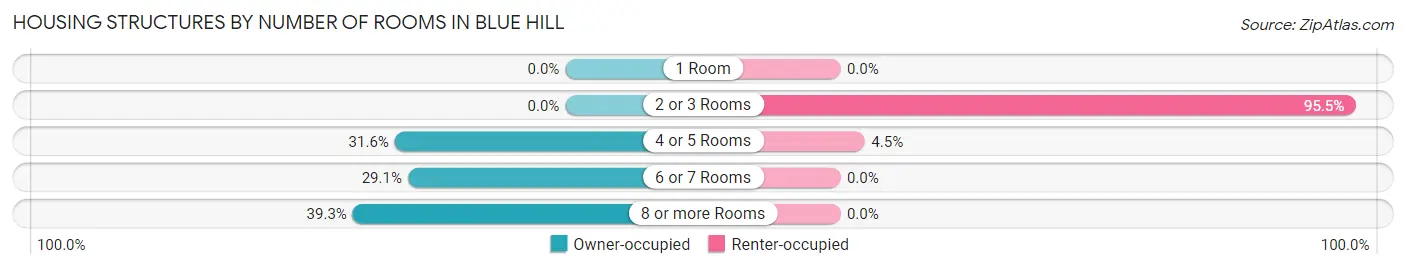
| Number of Rooms | Owner-occupied | Renter-occupied |
| 1 Room | 0 (0.0%) | 0 (0.0%) |
| 2 or 3 Rooms | 0 (0.0%) | 274 (95.5%) |
| 4 or 5 Rooms | 65 (31.6%) | 13 (4.5%) |
| 6 or 7 Rooms | 60 (29.1%) | 0 (0.0%) |
| 8 or more Rooms | 81 (39.3%) | 0 (0.0%) |
| Total | 206 (100.0%) | 287 (100.0%) |
Housing Structure by Heating Type in Blue Hill
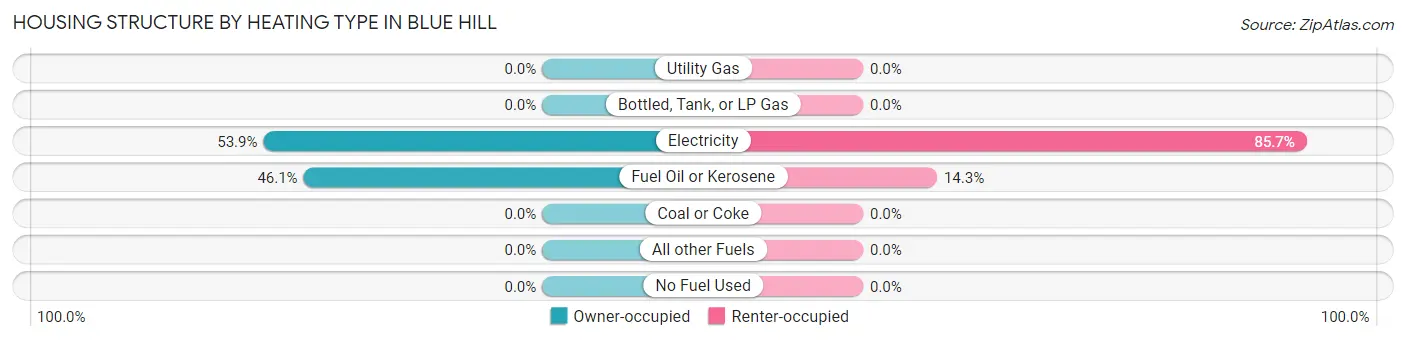
| Heating Type | Owner-occupied | Renter-occupied |
| Utility Gas | 0 (0.0%) | 0 (0.0%) |
| Bottled, Tank, or LP Gas | 0 (0.0%) | 0 (0.0%) |
| Electricity | 111 (53.9%) | 246 (85.7%) |
| Fuel Oil or Kerosene | 95 (46.1%) | 41 (14.3%) |
| Coal or Coke | 0 (0.0%) | 0 (0.0%) |
| All other Fuels | 0 (0.0%) | 0 (0.0%) |
| No Fuel Used | 0 (0.0%) | 0 (0.0%) |
| Total | 206 (100.0%) | 287 (100.0%) |
Household Vehicle Usage in Blue Hill
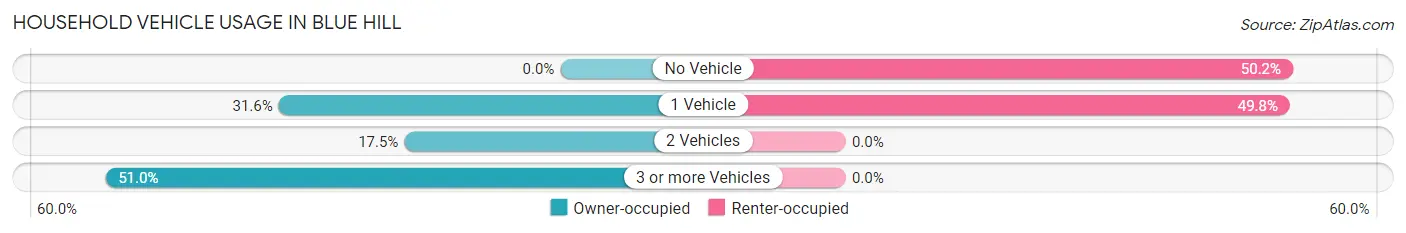
| Vehicles per Household | Owner-occupied | Renter-occupied |
| No Vehicle | 0 (0.0%) | 144 (50.2%) |
| 1 Vehicle | 65 (31.6%) | 143 (49.8%) |
| 2 Vehicles | 36 (17.5%) | 0 (0.0%) |
| 3 or more Vehicles | 105 (51.0%) | 0 (0.0%) |
| Total | 206 (100.0%) | 287 (100.0%) |
Real Estate & Mortgages in Blue Hill
Real Estate and Mortgage Overview in Blue Hill
| Characteristic | Without Mortgage | With Mortgage |
| Housing Units | 67 | 139 |
| Median Property Value | - | - |
| Median Household Income | - | - |
| Monthly Housing Costs | - | - |
| Real Estate Taxes | - | - |
Property Value by Mortgage Status in Blue Hill
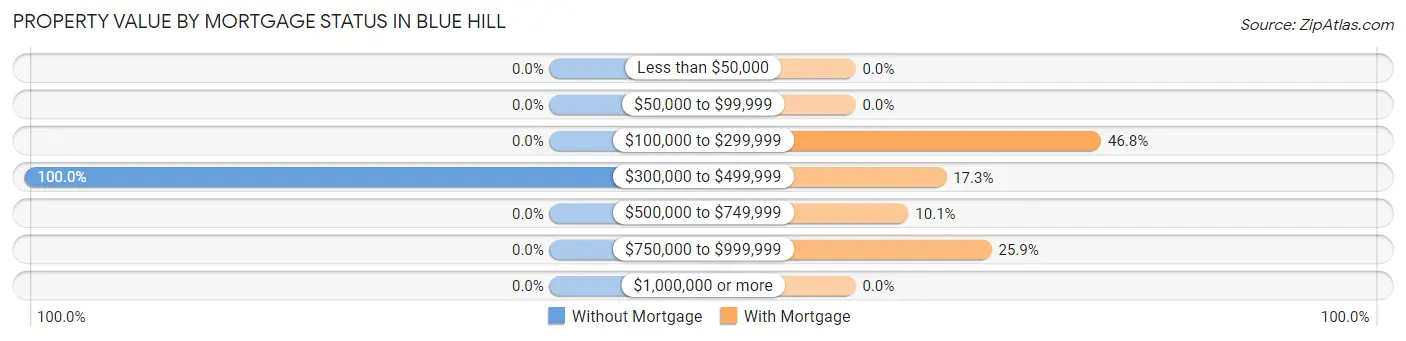
| Property Value | Without Mortgage | With Mortgage |
| Less than $50,000 | 0 (0.0%) | 0 (0.0%) |
| $50,000 to $99,999 | 0 (0.0%) | 0 (0.0%) |
| $100,000 to $299,999 | 0 (0.0%) | 65 (46.8%) |
| $300,000 to $499,999 | 67 (100.0%) | 24 (17.3%) |
| $500,000 to $749,999 | 0 (0.0%) | 14 (10.1%) |
| $750,000 to $999,999 | 0 (0.0%) | 36 (25.9%) |
| $1,000,000 or more | 0 (0.0%) | 0 (0.0%) |
| Total | 67 (100.0%) | 139 (100.0%) |
Household Income by Mortgage Status in Blue Hill
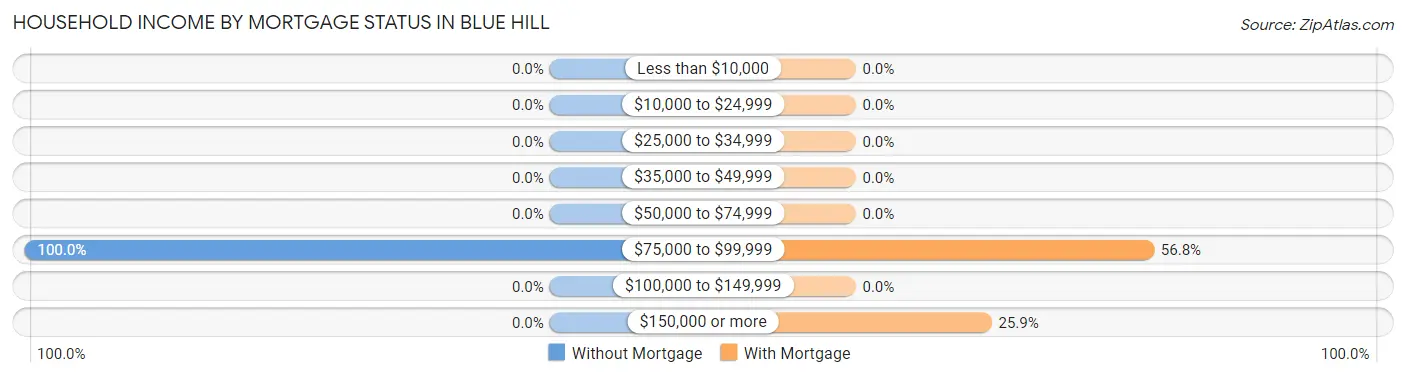
| Household Income | Without Mortgage | With Mortgage |
| Less than $10,000 | 0 (0.0%) | 0 (0.0%) |
| $10,000 to $24,999 | 0 (0.0%) | 0 (0.0%) |
| $25,000 to $34,999 | 0 (0.0%) | 0 (0.0%) |
| $35,000 to $49,999 | 0 (0.0%) | 0 (0.0%) |
| $50,000 to $74,999 | 0 (0.0%) | 0 (0.0%) |
| $75,000 to $99,999 | 67 (100.0%) | 79 (56.8%) |
| $100,000 to $149,999 | 0 (0.0%) | 0 (0.0%) |
| $150,000 or more | 0 (0.0%) | 36 (25.9%) |
| Total | 67 (100.0%) | 139 (100.0%) |
Property Value to Household Income Ratio in Blue Hill
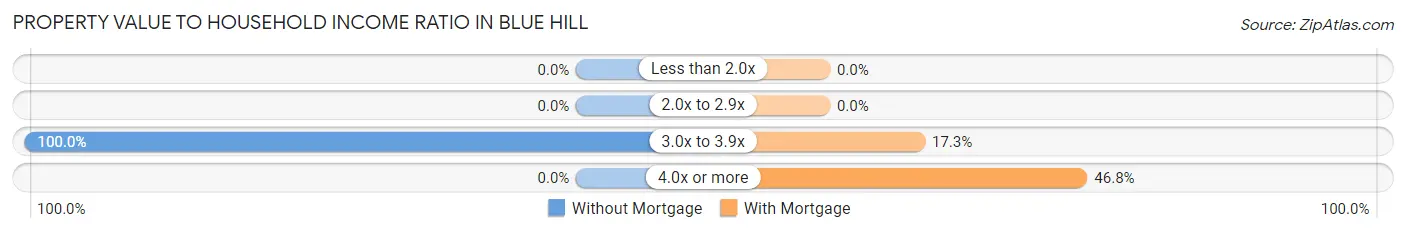
| Value-to-Income Ratio | Without Mortgage | With Mortgage |
| Less than 2.0x | 0 (0.0%) | 0 (0.0%) |
| 2.0x to 2.9x | 0 (0.0%) | 0 (0.0%) |
| 3.0x to 3.9x | 67 (100.0%) | 24 (17.3%) |
| 4.0x or more | 0 (0.0%) | 65 (46.8%) |
| Total | 67 (100.0%) | 139 (100.0%) |
Real Estate Taxes by Mortgage Status in Blue Hill
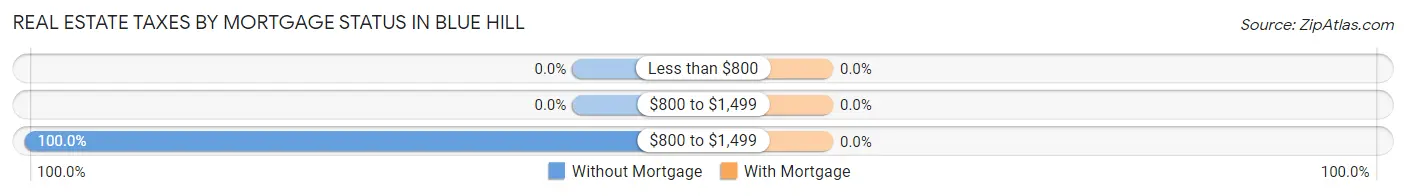
| Property Taxes | Without Mortgage | With Mortgage |
| Less than $800 | 0 (0.0%) | 0 (0.0%) |
| $800 to $1,499 | 0 (0.0%) | 0 (0.0%) |
| $800 to $1,499 | 67 (100.0%) | 0 (0.0%) |
| Total | 67 (100.0%) | 139 (100.0%) |
Health & Disability in Blue Hill
Health Insurance Coverage by Age in Blue Hill
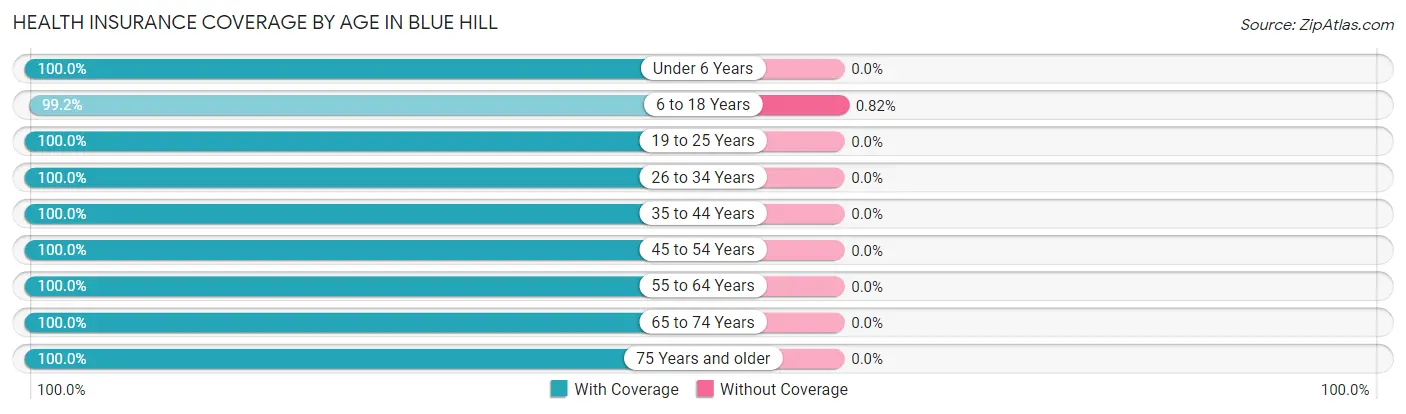
| Age Bracket | With Coverage | Without Coverage |
| Under 6 Years | 53 (100.0%) | 0 (0.0%) |
| 6 to 18 Years | 121 (99.2%) | 1 (0.8%) |
| 19 to 25 Years | 68 (100.0%) | 0 (0.0%) |
| 26 to 34 Years | 91 (100.0%) | 0 (0.0%) |
| 35 to 44 Years | 2 (100.0%) | 0 (0.0%) |
| 45 to 54 Years | 210 (100.0%) | 0 (0.0%) |
| 55 to 64 Years | 127 (100.0%) | 0 (0.0%) |
| 65 to 74 Years | 61 (100.0%) | 0 (0.0%) |
| 75 Years and older | 214 (100.0%) | 0 (0.0%) |
| Total | 947 (99.9%) | 1 (0.1%) |
Health Insurance Coverage by Citizenship Status in Blue Hill
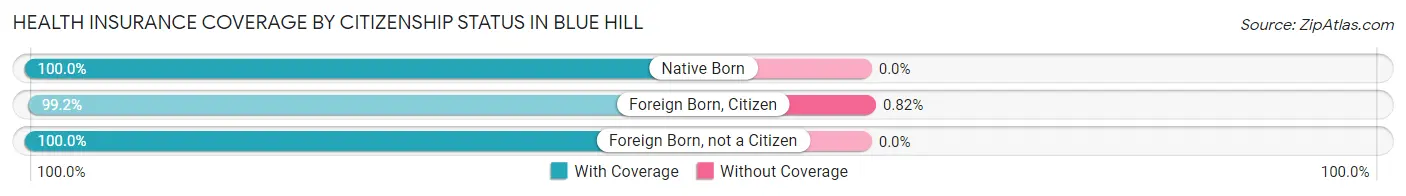
| Citizenship Status | With Coverage | Without Coverage |
| Native Born | 53 (100.0%) | 0 (0.0%) |
| Foreign Born, Citizen | 121 (99.2%) | 1 (0.8%) |
| Foreign Born, not a Citizen | 68 (100.0%) | 0 (0.0%) |
Health Insurance Coverage by Household Income in Blue Hill
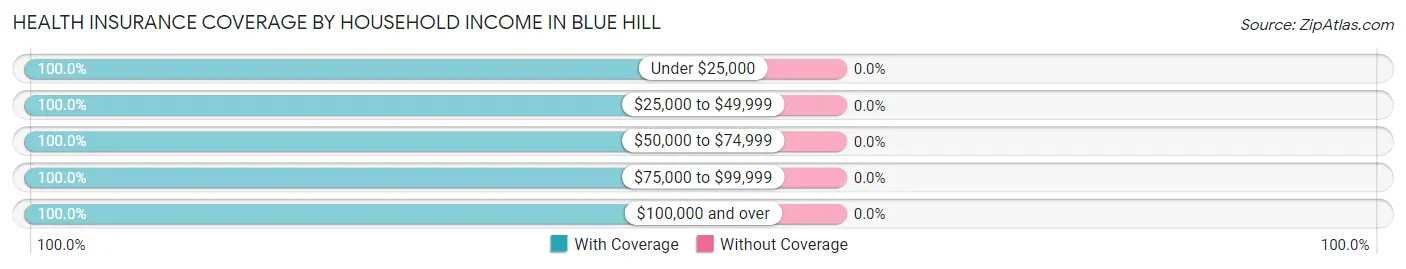
| Household Income | With Coverage | Without Coverage |
| Under $25,000 | 290 (100.0%) | 0 (0.0%) |
| $25,000 to $49,999 | 118 (100.0%) | 0 (0.0%) |
| $50,000 to $74,999 | 91 (100.0%) | 0 (0.0%) |
| $75,000 to $99,999 | 155 (100.0%) | 0 (0.0%) |
| $100,000 and over | 256 (100.0%) | 0 (0.0%) |
Public vs Private Health Insurance Coverage by Age in Blue Hill
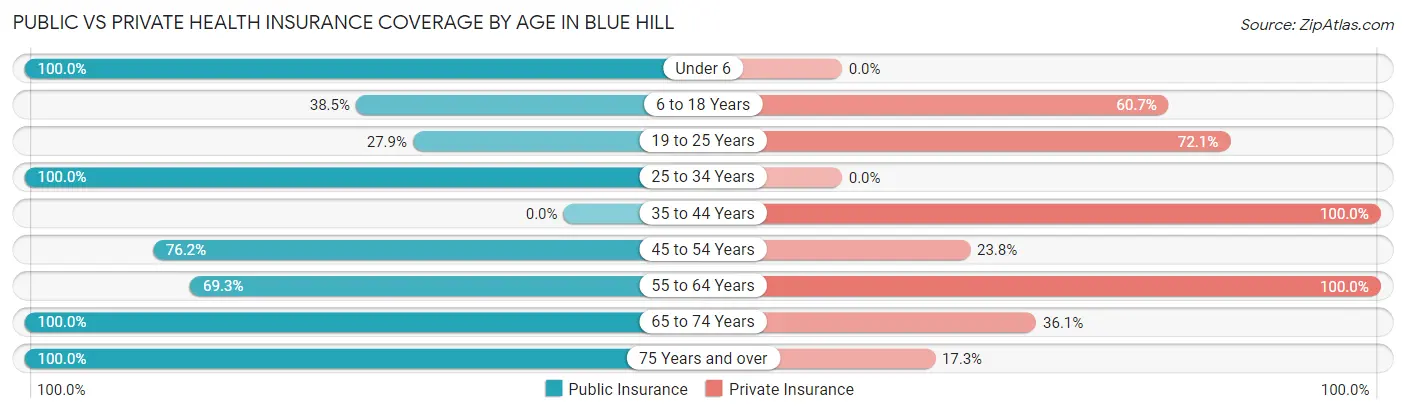
| Age Bracket | Public Insurance | Private Insurance |
| Under 6 | 53 (100.0%) | 0 (0.0%) |
| 6 to 18 Years | 47 (38.5%) | 74 (60.7%) |
| 19 to 25 Years | 19 (27.9%) | 49 (72.1%) |
| 25 to 34 Years | 91 (100.0%) | 0 (0.0%) |
| 35 to 44 Years | 0 (0.0%) | 2 (100.0%) |
| 45 to 54 Years | 160 (76.2%) | 50 (23.8%) |
| 55 to 64 Years | 88 (69.3%) | 127 (100.0%) |
| 65 to 74 Years | 61 (100.0%) | 22 (36.1%) |
| 75 Years and over | 214 (100.0%) | 37 (17.3%) |
| Total | 733 (77.3%) | 361 (38.1%) |
Disability Status by Sex by Age in Blue Hill
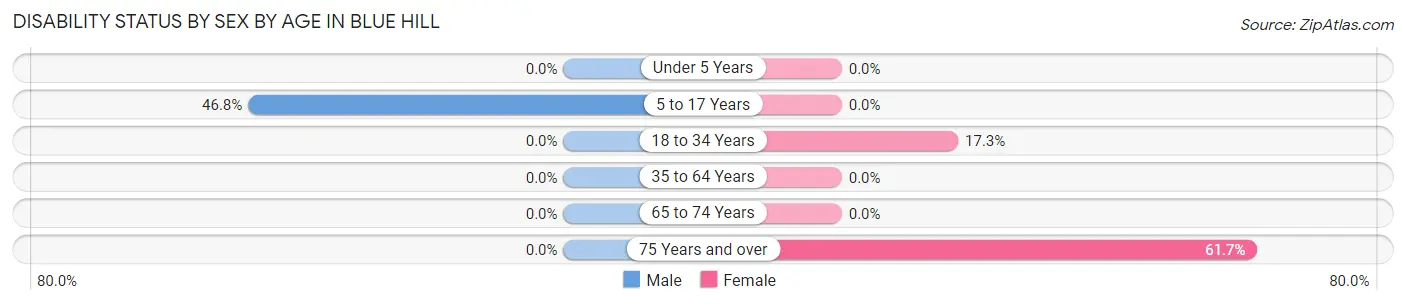
| Age Bracket | Male | Female |
| Under 5 Years | 0 (0.0%) | 0 (0.0%) |
| 5 to 17 Years | 22 (46.8%) | 0 (0.0%) |
| 18 to 34 Years | 0 (0.0%) | 19 (17.3%) |
| 35 to 64 Years | 0 (0.0%) | 0 (0.0%) |
| 65 to 74 Years | 0 (0.0%) | 0 (0.0%) |
| 75 Years and over | 0 (0.0%) | 124 (61.7%) |
Disability Class by Sex by Age in Blue Hill
Disability Class: Hearing Difficulty
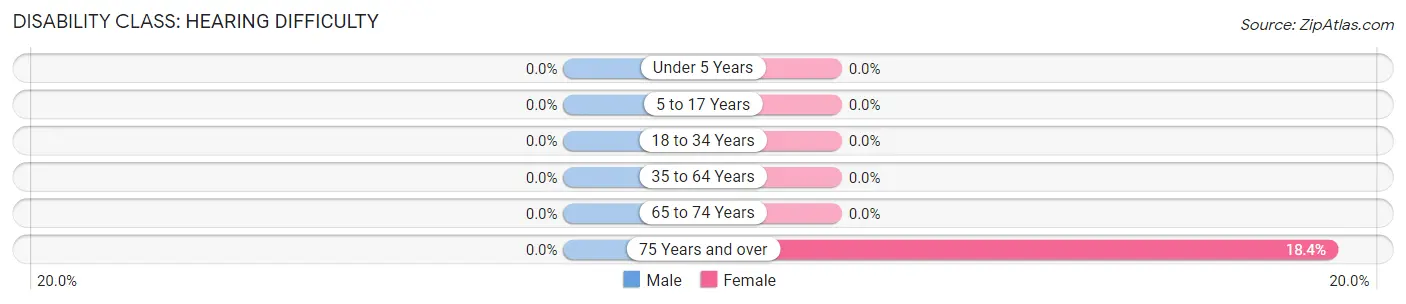
| Age Bracket | Male | Female |
| Under 5 Years | 0 (0.0%) | 0 (0.0%) |
| 5 to 17 Years | 0 (0.0%) | 0 (0.0%) |
| 18 to 34 Years | 0 (0.0%) | 0 (0.0%) |
| 35 to 64 Years | 0 (0.0%) | 0 (0.0%) |
| 65 to 74 Years | 0 (0.0%) | 0 (0.0%) |
| 75 Years and over | 0 (0.0%) | 37 (18.4%) |
Disability Class: Vision Difficulty
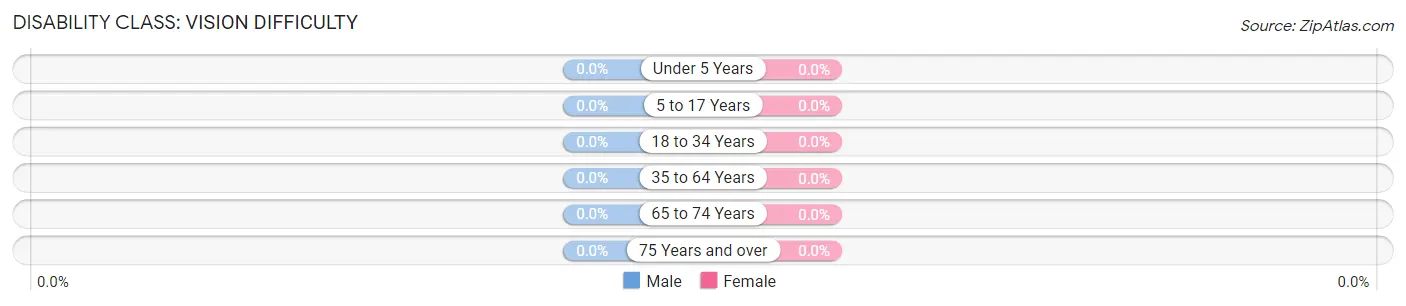
| Age Bracket | Male | Female |
| Under 5 Years | 0 (0.0%) | 0 (0.0%) |
| 5 to 17 Years | 0 (0.0%) | 0 (0.0%) |
| 18 to 34 Years | 0 (0.0%) | 0 (0.0%) |
| 35 to 64 Years | 0 (0.0%) | 0 (0.0%) |
| 65 to 74 Years | 0 (0.0%) | 0 (0.0%) |
| 75 Years and over | 0 (0.0%) | 0 (0.0%) |
Disability Class: Cognitive Difficulty
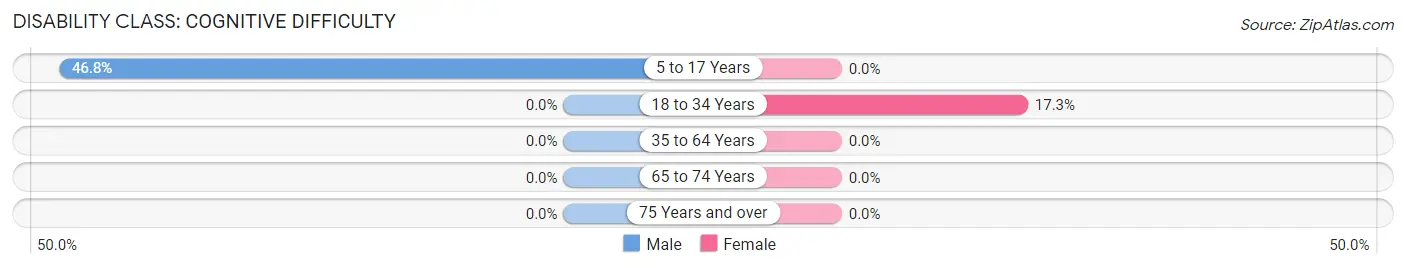
| Age Bracket | Male | Female |
| 5 to 17 Years | 22 (46.8%) | 0 (0.0%) |
| 18 to 34 Years | 0 (0.0%) | 19 (17.3%) |
| 35 to 64 Years | 0 (0.0%) | 0 (0.0%) |
| 65 to 74 Years | 0 (0.0%) | 0 (0.0%) |
| 75 Years and over | 0 (0.0%) | 0 (0.0%) |
Disability Class: Ambulatory Difficulty
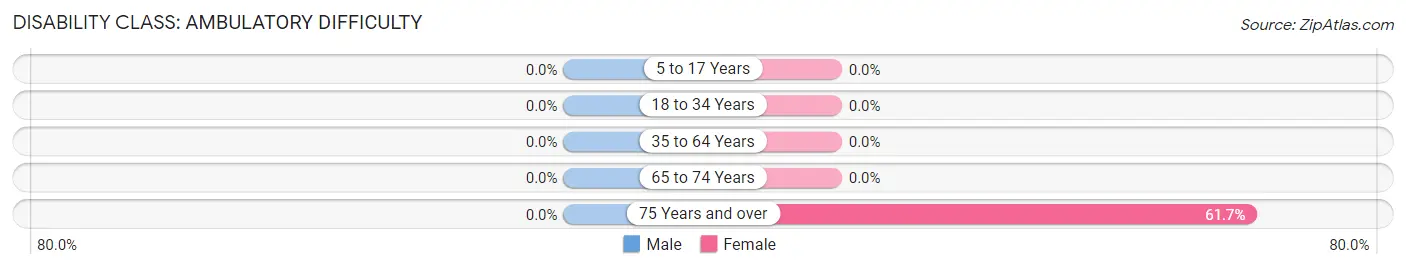
| Age Bracket | Male | Female |
| 5 to 17 Years | 0 (0.0%) | 0 (0.0%) |
| 18 to 34 Years | 0 (0.0%) | 0 (0.0%) |
| 35 to 64 Years | 0 (0.0%) | 0 (0.0%) |
| 65 to 74 Years | 0 (0.0%) | 0 (0.0%) |
| 75 Years and over | 0 (0.0%) | 124 (61.7%) |
Disability Class: Self-Care Difficulty
| Age Bracket | Male | Female |
| 5 to 17 Years | 0 (0.0%) | 0 (0.0%) |
| 18 to 34 Years | 0 (0.0%) | 0 (0.0%) |
| 35 to 64 Years | 0 (0.0%) | 0 (0.0%) |
| 65 to 74 Years | 0 (0.0%) | 0 (0.0%) |
| 75 Years and over | 0 (0.0%) | 0 (0.0%) |
Technology Access in Blue Hill
Computing Device Access in Blue Hill
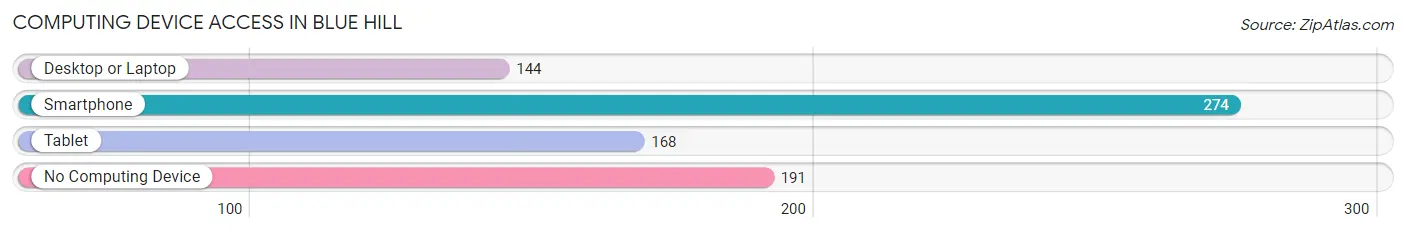
| Device Type | # Households | % Households |
| Desktop or Laptop | 144 | 29.2% |
| Smartphone | 274 | 55.6% |
| Tablet | 168 | 34.1% |
| No Computing Device | 191 | 38.7% |
| Total | 493 | 100.0% |
Internet Access in Blue Hill
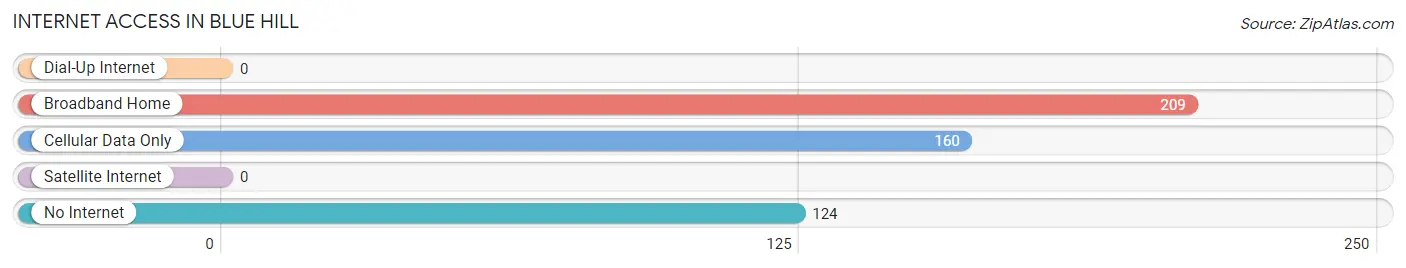
| Internet Type | # Households | % Households |
| Dial-Up Internet | 0 | 0.0% |
| Broadband Home | 209 | 42.4% |
| Cellular Data Only | 160 | 32.5% |
| Satellite Internet | 0 | 0.0% |
| No Internet | 124 | 25.2% |
| Total | 493 | 100.0% |
Blue Hill Summary
Introduction
Blue Hill is a town located in Hancock County, Maine, United States. It is situated on the western side of the Penobscot Bay, about 15 miles east of Ellsworth. The town has a population of 2,686 as of the 2010 census. Blue Hill is a popular tourist destination due to its picturesque harbor, historic buildings, and numerous outdoor activities.
History
Blue Hill was first settled in 1762 by a group of settlers from Massachusetts. The town was originally called Plantation Number 5 and was part of the Waldo Patent. The town was incorporated in 1789 and was named after the blueberry-covered hills that surrounded the area.
In the 19th century, Blue Hill was a thriving port town. It was home to several shipbuilding yards, a granite quarry, and a brickyard. The town was also home to several whaling ships and was a major supplier of lumber to the rest of the country.
In the 20th century, Blue Hill began to decline as a port town. The shipbuilding yards and whaling ships moved elsewhere and the lumber industry declined. The town began to focus on tourism and the arts. Today, Blue Hill is a popular tourist destination and is home to several art galleries, restaurants, and shops.
Geography
Blue Hill is located at 44°25'N 68°59'W. It is situated on the western side of the Penobscot Bay, about 15 miles east of Ellsworth. The town has a total area of 28.2 square miles, of which, 27.7 square miles is land and 0.5 square miles is water.
The town is bordered by the towns of Brooklin to the north, Sedgwick to the east, Surry to the south, and Penobscot to the west. The town is home to several small islands, including Blue Hill Bay, Long Island, and Eggemoggin Reach.
Economy
Blue Hill’s economy is largely based on tourism and the arts. The town is home to several art galleries, restaurants, and shops. The town is also home to several marinas and boatyards, which attract tourists from all over the world.
The town is also home to several small businesses, including a brewery, a winery, and a distillery. The town is also home to several farms, which produce a variety of fruits and vegetables.
Demographics
As of the 2010 census, there were 2,686 people, 1,093 households, and 709 families residing in the town. The population density was 96.7 people per square mile. The racial makeup of the town was 97.2% White, 0.4% African American, 0.3% Native American, 0.4% Asian, 0.1% Pacific Islander, 0.3% from other races, and 1.3% from two or more races.
The median income for a household in the town was $41,944, and the median income for a family was $50,000. The per capita income for the town was $22,845. About 11.2% of families and 15.2% of the population were below the poverty line, including 22.2% of those under age 18 and 8.2% of those age 65 or over.
Conclusion
Blue Hill is a small town located in Hancock County, Maine. It is situated on the western side of the Penobscot Bay and is a popular tourist destination due to its picturesque harbor, historic buildings, and numerous outdoor activities. The town has a population of 2,686 as of the 2010 census and has an economy based on tourism and the arts. The town is also home to several small businesses, farms, and marinas.
Common Questions
What is Per Capita Income in Blue Hill?
Per Capita income in Blue Hill is $31,732.
What is Income or Wage Gap in Blue Hill?
Income or Wage Gap in Blue Hill is 59.2%.
Women in Blue Hill earn 40.8 cents for every dollar earned by a man.
What is Inequality or Gini Index in Blue Hill?
Inequality or Gini Index in Blue Hill is 0.45.
What is the Total Population of Blue Hill?
Total Population of Blue Hill is 950.
What is the Total Male Population of Blue Hill?
Total Male Population of Blue Hill is 288.
What is the Total Female Population of Blue Hill?
Total Female Population of Blue Hill is 662.
What is the Ratio of Males per 100 Females in Blue Hill?
There are 43.50 Males per 100 Females in Blue Hill.
What is the Ratio of Females per 100 Males in Blue Hill?
There are 229.86 Females per 100 Males in Blue Hill.
What is the Median Population Age in Blue Hill?
Median Population Age in Blue Hill is 52.3 Years.
What is the Average Family Size in Blue Hill
Average Family Size in Blue Hill is 2.4 People.
What is the Average Household Size in Blue Hill
Average Household Size in Blue Hill is 1.9 People.
How Large is the Labor Force in Blue Hill?
There are 510 People in the Labor Forcein in Blue Hill.
What is the Percentage of People in the Labor Force in Blue Hill?
62.3% of People are in the Labor Force in Blue Hill.