Bar Harbor, ME Map & Demographics
Bar Harbor Map
Bar Harbor Overview
$33,268
PER CAPITA INCOME
$77,443
AVG FAMILY INCOME
$46,917
AVG HOUSEHOLD INCOME
26.7%
WAGE / INCOME GAP [ % ]
73.3¢/ $1
WAGE / INCOME GAP [ $ ]
0.52
INEQUALITY / GINI INDEX
2,154
TOTAL POPULATION
1,158
MALE POPULATION
996
FEMALE POPULATION
116.27
MALES / 100 FEMALES
86.01
FEMALES / 100 MALES
39.2
MEDIAN AGE
2.8
AVG FAMILY SIZE
2.1
AVG HOUSEHOLD SIZE
1,177
LABOR FORCE [ PEOPLE ]
62.9%
PERCENT IN LABOR FORCE
10.6%
UNEMPLOYMENT RATE
Bar Harbor Zip Codes
Bar Harbor Area Codes
Income in Bar Harbor
Income Overview in Bar Harbor
Per Capita Income in Bar Harbor is $33,268, while median incomes of families and households are $77,443 and $46,917 respectively.
| Characteristic | Number | Measure |
| Per Capita Income | 2,154 | $33,268 |
| Median Family Income | 391 | $77,443 |
| Mean Family Income | 391 | $114,155 |
| Median Household Income | 874 | $46,917 |
| Mean Household Income | 874 | $78,284 |
| Income Deficit | 391 | $0 |
| Wage / Income Gap (%) | 2,154 | 26.69% |
| Wage / Income Gap ($) | 2,154 | 73.31¢ per $1 |
| Gini / Inequality Index | 2,154 | 0.52 |
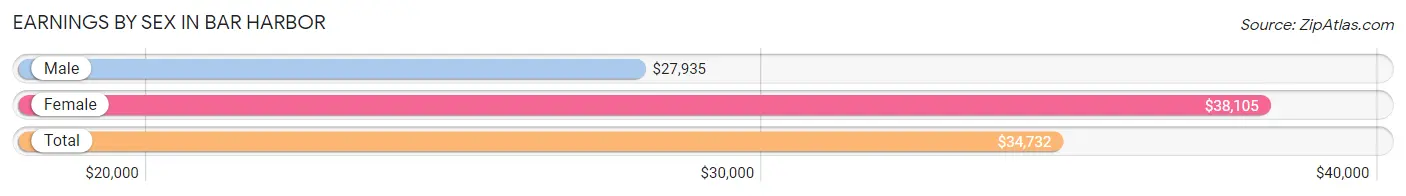
Earnings by Sex in Bar Harbor
Average Earnings in Bar Harbor are $34,732, $27,935 for men and $38,105 for women, a difference of 26.7%.
| Sex | Number | Average Earnings |
| Male | 740 (58.7%) | $27,935 |
| Female | 520 (41.3%) | $38,105 |
| Total | 1,260 (100.0%) | $34,732 |
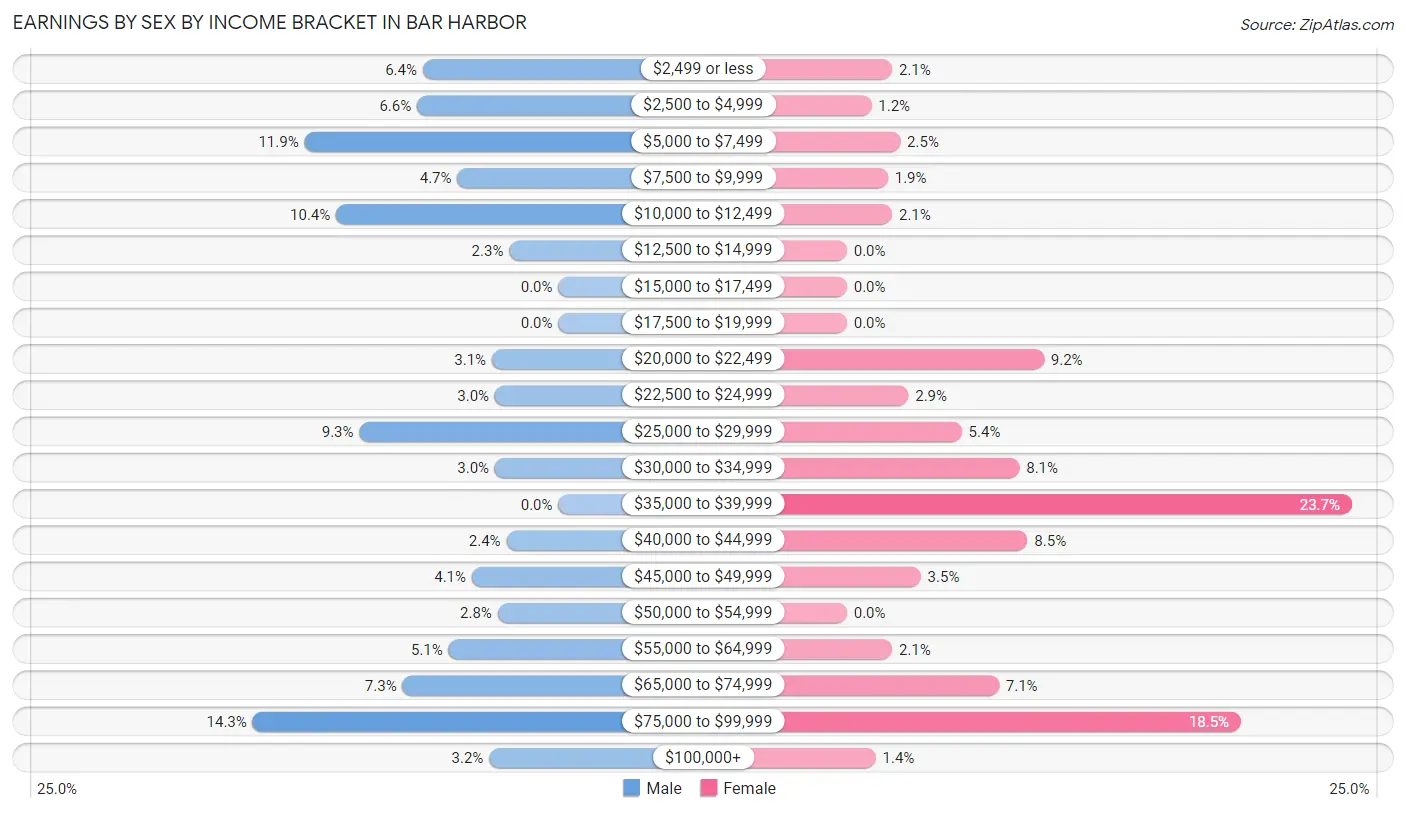
Earnings by Sex by Income Bracket in Bar Harbor
The most common earnings brackets in Bar Harbor are $75,000 to $99,999 for men (106 | 14.3%) and $35,000 to $39,999 for women (123 | 23.6%).
| Income | Male | Female |
| $2,499 or less | 47 (6.4%) | 11 (2.1%) |
| $2,500 to $4,999 | 49 (6.6%) | 6 (1.1%) |
| $5,000 to $7,499 | 88 (11.9%) | 13 (2.5%) |
| $7,500 to $9,999 | 35 (4.7%) | 10 (1.9%) |
| $10,000 to $12,499 | 77 (10.4%) | 11 (2.1%) |
| $12,500 to $14,999 | 17 (2.3%) | 0 (0.0%) |
| $15,000 to $17,499 | 0 (0.0%) | 0 (0.0%) |
| $17,500 to $19,999 | 0 (0.0%) | 0 (0.0%) |
| $20,000 to $22,499 | 23 (3.1%) | 48 (9.2%) |
| $22,500 to $24,999 | 22 (3.0%) | 15 (2.9%) |
| $25,000 to $29,999 | 69 (9.3%) | 28 (5.4%) |
| $30,000 to $34,999 | 22 (3.0%) | 42 (8.1%) |
| $35,000 to $39,999 | 0 (0.0%) | 123 (23.6%) |
| $40,000 to $44,999 | 18 (2.4%) | 44 (8.5%) |
| $45,000 to $49,999 | 30 (4.1%) | 18 (3.5%) |
| $50,000 to $54,999 | 21 (2.8%) | 0 (0.0%) |
| $55,000 to $64,999 | 38 (5.1%) | 11 (2.1%) |
| $65,000 to $74,999 | 54 (7.3%) | 37 (7.1%) |
| $75,000 to $99,999 | 106 (14.3%) | 96 (18.5%) |
| $100,000+ | 24 (3.2%) | 7 (1.3%) |
| Total | 740 (100.0%) | 520 (100.0%) |
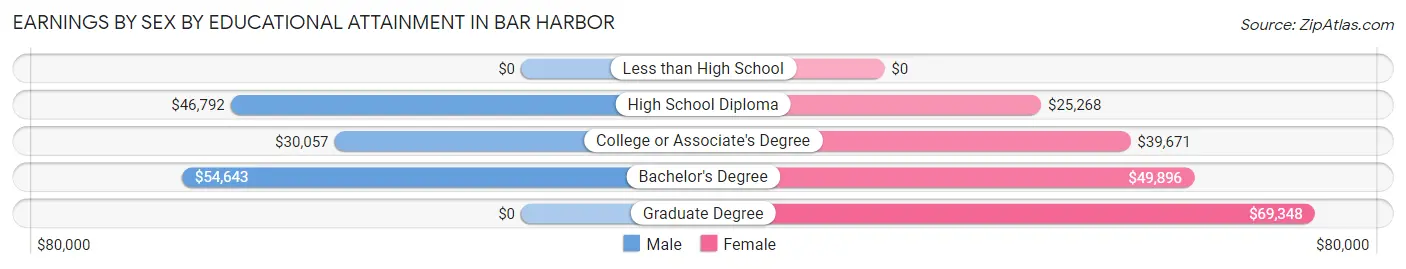
Earnings by Sex by Educational Attainment in Bar Harbor
Average earnings in Bar Harbor are $45,417 for men and $39,718 for women, a difference of 12.6%. Men with an educational attainment of bachelor's degree enjoy the highest average annual earnings of $54,643, while those with college or associate's degree education earn the least with $30,057. Women with an educational attainment of graduate degree earn the most with the average annual earnings of $69,348, while those with high school diploma education have the smallest earnings of $25,268.
| Educational Attainment | Male Income | Female Income |
| Less than High School | - | - |
| High School Diploma | $46,792 | $25,268 |
| College or Associate's Degree | $30,057 | $39,671 |
| Bachelor's Degree | $54,643 | $49,896 |
| Graduate Degree | - | - |
| Total | $45,417 | $39,718 |
Family Income in Bar Harbor
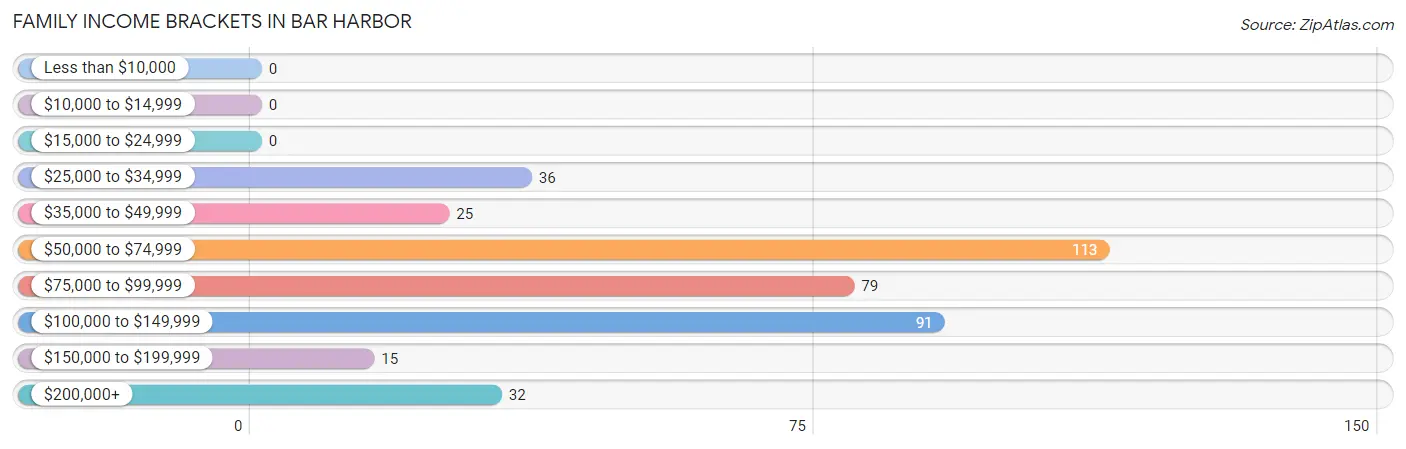
Family Income Brackets in Bar Harbor
According to the Bar Harbor family income data, there are 113 families falling into the $50,000 to $74,999 income range, which is the most common income bracket and makes up 28.9% of all families.
| Income Bracket | # Families | % Families |
| Less than $10,000 | 0 | 0.0% |
| $10,000 to $14,999 | 0 | 0.0% |
| $15,000 to $24,999 | 0 | 0.0% |
| $25,000 to $34,999 | 36 | 9.2% |
| $35,000 to $49,999 | 25 | 6.4% |
| $50,000 to $74,999 | 113 | 28.9% |
| $75,000 to $99,999 | 79 | 20.2% |
| $100,000 to $149,999 | 91 | 23.3% |
| $150,000 to $199,999 | 15 | 3.8% |
| $200,000+ | 32 | 8.2% |
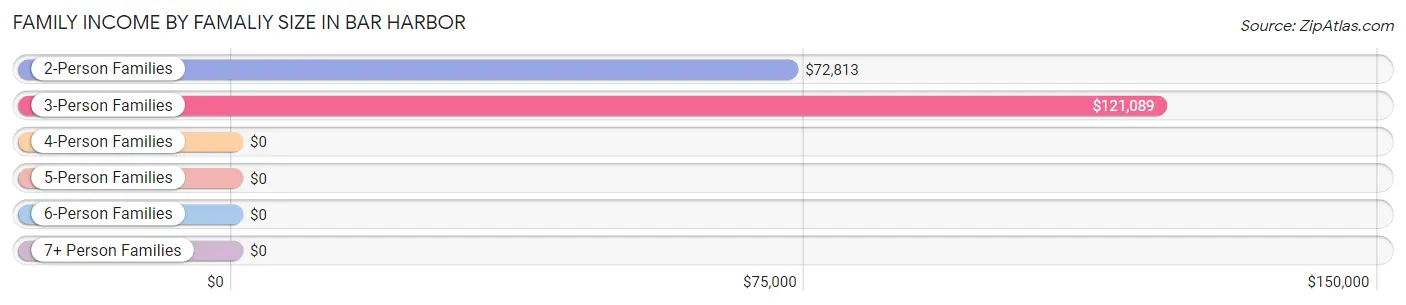
Family Income by Famaliy Size in Bar Harbor
3-person families (65 | 16.6%) account for the highest median family income in Bar Harbor with $121,089 per family, while 3-person families (65 | 16.6%) have the highest median income of $40,363 per family member.
| Income Bracket | # Families | Median Income |
| 2-Person Families | 241 (61.6%) | $72,813 |
| 3-Person Families | 65 (16.6%) | $121,089 |
| 4-Person Families | 77 (19.7%) | $0 |
| 5-Person Families | 8 (2.1%) | $0 |
| 6-Person Families | 0 (0.0%) | $0 |
| 7+ Person Families | 0 (0.0%) | $0 |
| Total | 391 (100.0%) | $77,443 |
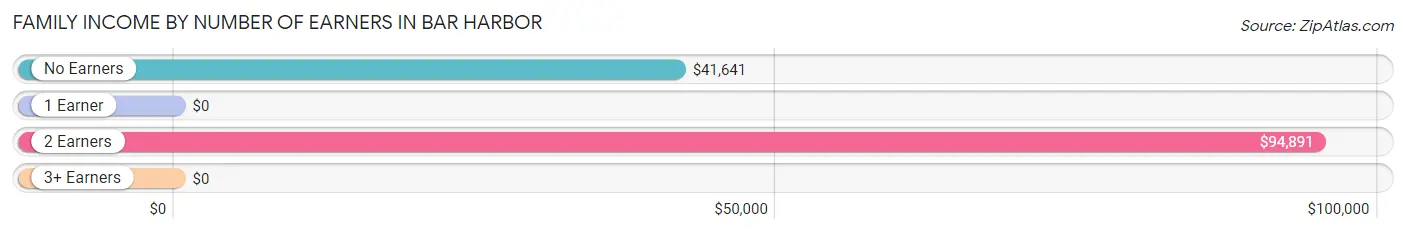
Family Income by Number of Earners in Bar Harbor
| Number of Earners | # Families | Median Income |
| No Earners | 93 (23.8%) | $41,641 |
| 1 Earner | 68 (17.4%) | $0 |
| 2 Earners | 230 (58.8%) | $94,891 |
| 3+ Earners | 0 (0.0%) | $0 |
| Total | 391 (100.0%) | $77,443 |
Household Income in Bar Harbor
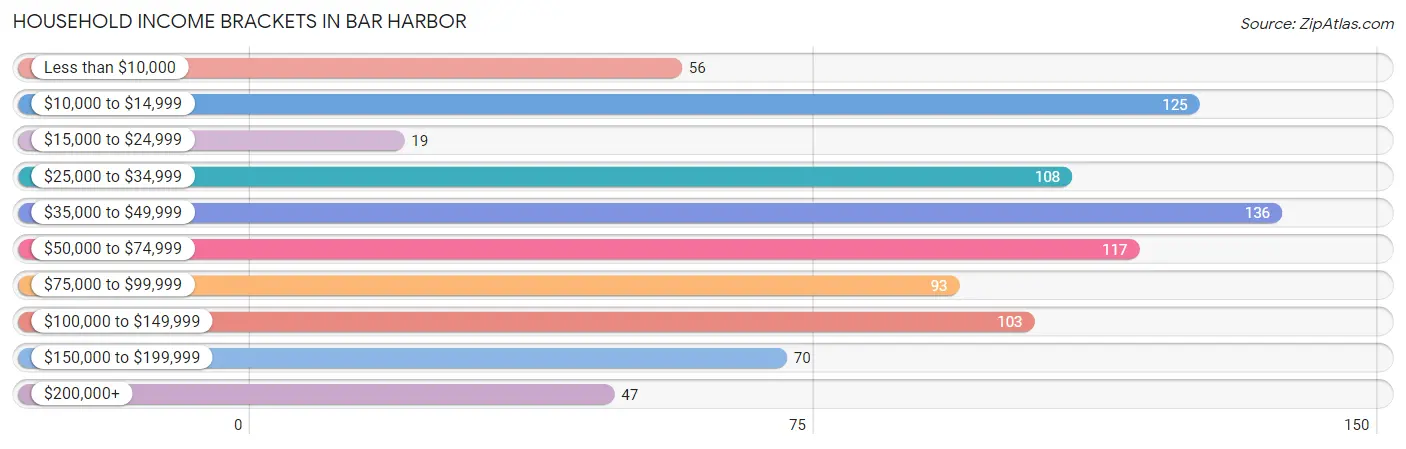
Household Income Brackets in Bar Harbor
With 136 households falling in the category, the $35,000 to $49,999 income range is the most frequent in Bar Harbor, accounting for 15.6% of all households. In contrast, only 19 households (2.2%) fall into the $15,000 to $24,999 income bracket, making it the least populous group.
| Income Bracket | # Households | % Households |
| Less than $10,000 | 56 | 6.4% |
| $10,000 to $14,999 | 125 | 14.3% |
| $15,000 to $24,999 | 19 | 2.2% |
| $25,000 to $34,999 | 108 | 12.4% |
| $35,000 to $49,999 | 136 | 15.6% |
| $50,000 to $74,999 | 117 | 13.4% |
| $75,000 to $99,999 | 93 | 10.6% |
| $100,000 to $149,999 | 103 | 11.8% |
| $150,000 to $199,999 | 70 | 8.0% |
| $200,000+ | 47 | 5.4% |
Household Income by Householder Age in Bar Harbor
The median household income in Bar Harbor is $46,917, with the highest median household income of $90,167 found in the 45 to 64 years age bracket for the primary householder. A total of 354 households (40.5%) fall into this category. Meanwhile, the 15 to 24 years age bracket for the primary householder has the lowest median household income of $0, with 56 households (6.4%) in this group.
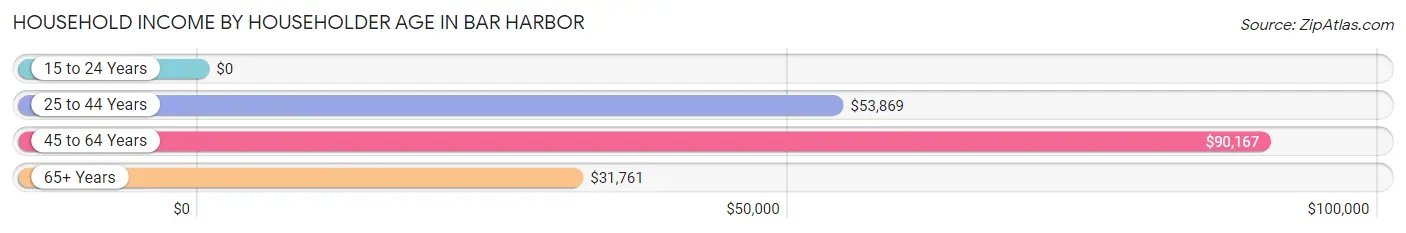
| Income Bracket | # Households | Median Income |
| 15 to 24 Years | 56 (6.4%) | $0 |
| 25 to 44 Years | 197 (22.5%) | $53,869 |
| 45 to 64 Years | 354 (40.5%) | $90,167 |
| 65+ Years | 267 (30.5%) | $31,761 |
| Total | 874 (100.0%) | $46,917 |
Poverty in Bar Harbor
Income Below Poverty by Sex and Age in Bar Harbor
With 18.2% poverty level for males and 20.0% for females among the residents of Bar Harbor, 25 to 34 year old males and 18 to 24 year old females are the most vulnerable to poverty, with 113 males (51.8%) and 110 females (72.4%) in their respective age groups living below the poverty level.
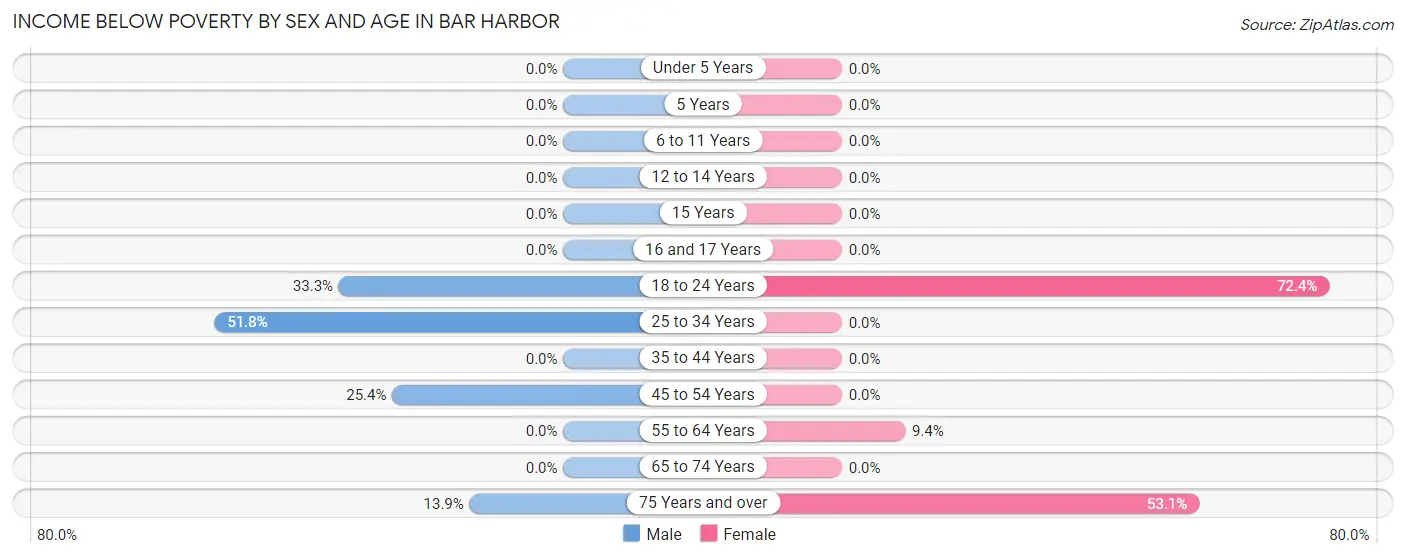
| Age Bracket | Male | Female |
| Under 5 Years | 0 (0.0%) | 0 (0.0%) |
| 5 Years | 0 (0.0%) | 0 (0.0%) |
| 6 to 11 Years | 0 (0.0%) | 0 (0.0%) |
| 12 to 14 Years | 0 (0.0%) | 0 (0.0%) |
| 15 Years | 0 (0.0%) | 0 (0.0%) |
| 16 and 17 Years | 0 (0.0%) | 0 (0.0%) |
| 18 to 24 Years | 21 (33.3%) | 110 (72.4%) |
| 25 to 34 Years | 113 (51.8%) | 0 (0.0%) |
| 35 to 44 Years | 0 (0.0%) | 0 (0.0%) |
| 45 to 54 Years | 32 (25.4%) | 0 (0.0%) |
| 55 to 64 Years | 0 (0.0%) | 21 (9.4%) |
| 65 to 74 Years | 0 (0.0%) | 0 (0.0%) |
| 75 Years and over | 11 (13.9%) | 52 (53.1%) |
| Total | 177 (18.2%) | 183 (20.0%) |
Income Above Poverty by Sex and Age in Bar Harbor
According to the poverty statistics in Bar Harbor, males aged under 5 years and females aged 6 to 11 years are the age groups that are most secure financially, with 100.0% of males and 100.0% of females in these age groups living above the poverty line.
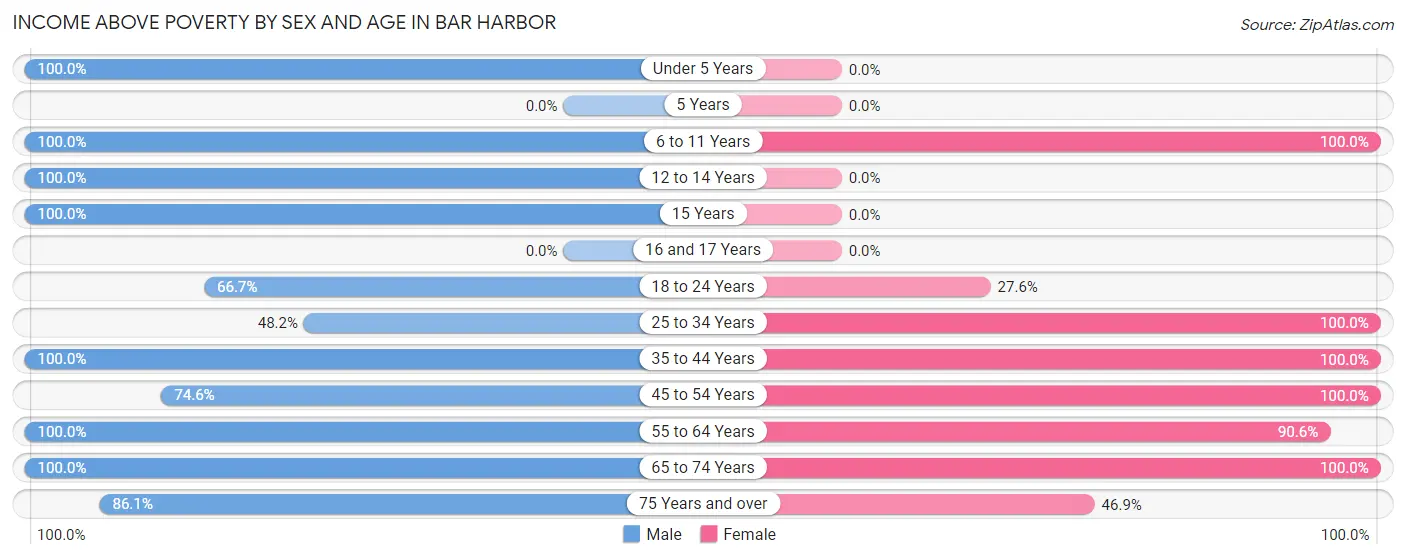
| Age Bracket | Male | Female |
| Under 5 Years | 44 (100.0%) | 0 (0.0%) |
| 5 Years | 0 (0.0%) | 0 (0.0%) |
| 6 to 11 Years | 68 (100.0%) | 108 (100.0%) |
| 12 to 14 Years | 9 (100.0%) | 0 (0.0%) |
| 15 Years | 54 (100.0%) | 0 (0.0%) |
| 16 and 17 Years | 0 (0.0%) | 0 (0.0%) |
| 18 to 24 Years | 42 (66.7%) | 42 (27.6%) |
| 25 to 34 Years | 105 (48.2%) | 86 (100.0%) |
| 35 to 44 Years | 51 (100.0%) | 23 (100.0%) |
| 45 to 54 Years | 94 (74.6%) | 113 (100.0%) |
| 55 to 64 Years | 163 (100.0%) | 203 (90.6%) |
| 65 to 74 Years | 96 (100.0%) | 109 (100.0%) |
| 75 Years and over | 68 (86.1%) | 46 (46.9%) |
| Total | 794 (81.8%) | 730 (80.0%) |
Income Below Poverty Among Married-Couple Families in Bar Harbor
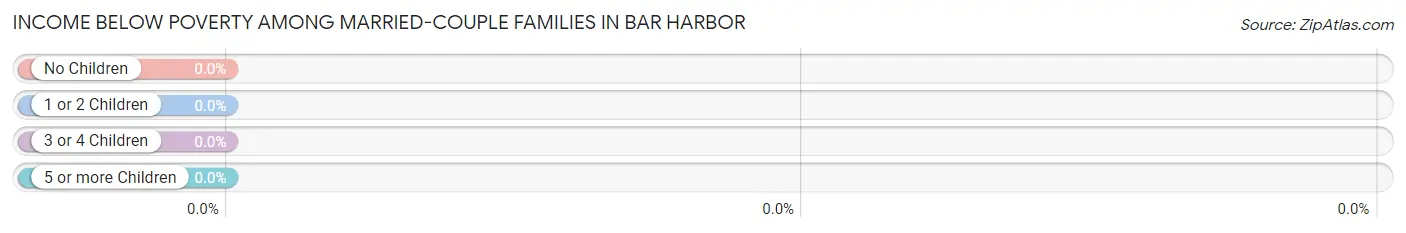
| Children | Above Poverty | Below Poverty |
| No Children | 243 (100.0%) | 0 (0.0%) |
| 1 or 2 Children | 65 (100.0%) | 0 (0.0%) |
| 3 or 4 Children | 8 (100.0%) | 0 (0.0%) |
| 5 or more Children | 0 (0.0%) | 0 (0.0%) |
| Total | 316 (100.0%) | 0 (0.0%) |
Income Below Poverty Among Single-Parent Households in Bar Harbor
| Children | Single Father | Single Mother |
| No Children | 0 (0.0%) | 0 (0.0%) |
| 1 or 2 Children | 0 (0.0%) | 0 (0.0%) |
| 3 or 4 Children | 0 (0.0%) | 0 (0.0%) |
| 5 or more Children | 0 (0.0%) | 0 (0.0%) |
| Total | 0 (0.0%) | 0 (0.0%) |
Income Below Poverty Among Married-Couple vs Single-Parent Households in Bar Harbor
| Children | Married-Couple Families | Single-Parent Households |
| No Children | 0 (0.0%) | 0 (0.0%) |
| 1 or 2 Children | 0 (0.0%) | 0 (0.0%) |
| 3 or 4 Children | 0 (0.0%) | 0 (0.0%) |
| 5 or more Children | 0 (0.0%) | 0 (0.0%) |
| Total | 0 (0.0%) | 0 (0.0%) |
Race in Bar Harbor
The most populous races in Bar Harbor are White / Caucasian (1,849 | 85.8%), Black / African American (181 | 8.4%), and Asian (46 | 2.1%).
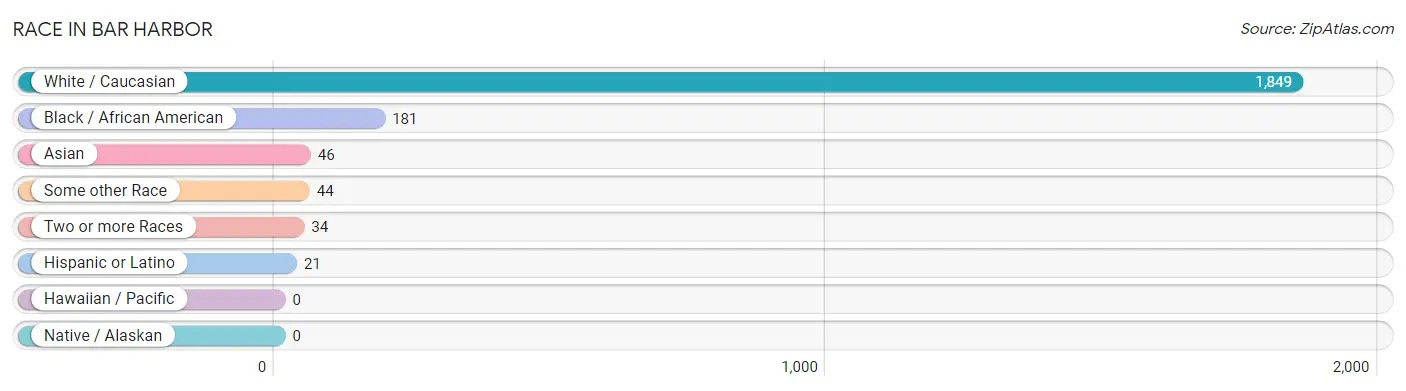
| Race | # Population | % Population |
| Asian | 46 | 2.1% |
| Black / African American | 181 | 8.4% |
| Hawaiian / Pacific | 0 | 0.0% |
| Hispanic or Latino | 21 | 1.0% |
| Native / Alaskan | 0 | 0.0% |
| White / Caucasian | 1,849 | 85.8% |
| Two or more Races | 34 | 1.6% |
| Some other Race | 44 | 2.0% |
| Total | 2,154 | 100.0% |
Ancestry in Bar Harbor
The most populous ancestries reported in Bar Harbor are English (358 | 16.6%), Italian (269 | 12.5%), Irish (240 | 11.1%), German (174 | 8.1%), and French (111 | 5.1%), together accounting for 53.5% of all Bar Harbor residents.
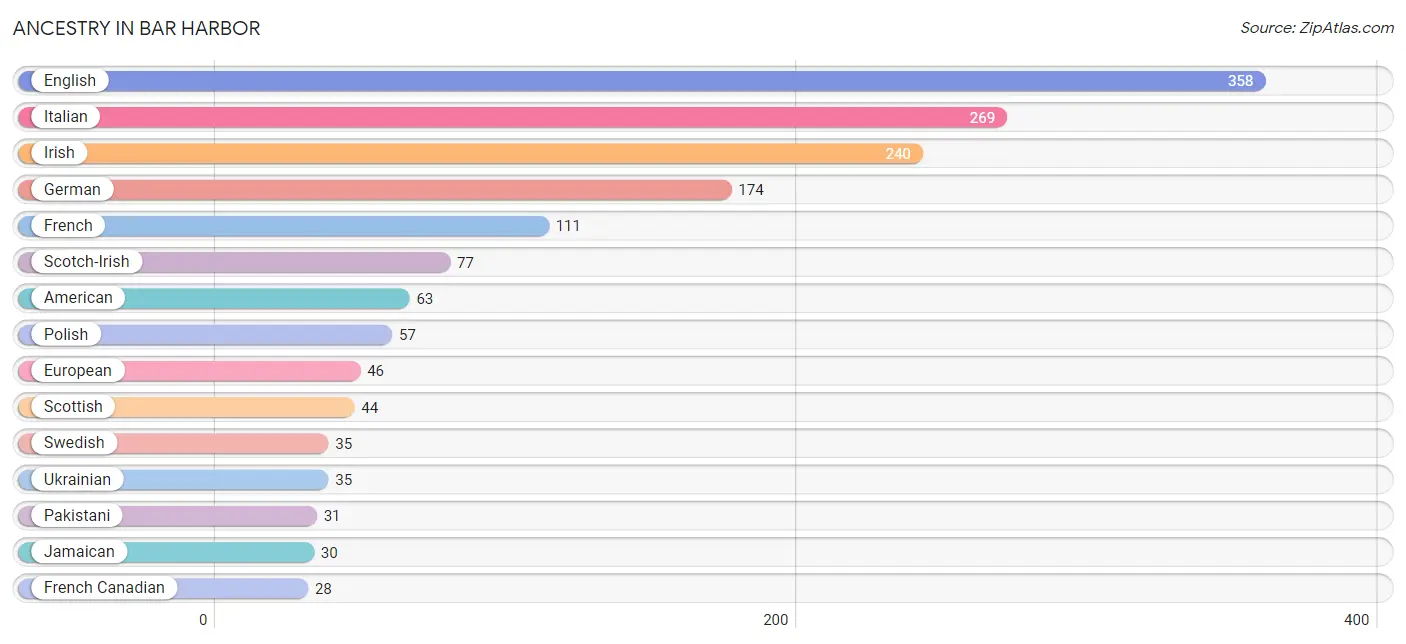
| Ancestry | # Population | % Population |
| African | 21 | 1.0% |
| American | 63 | 2.9% |
| Arab | 13 | 0.6% |
| Bhutanese | 15 | 0.7% |
| Canadian | 17 | 0.8% |
| Czechoslovakian | 11 | 0.5% |
| Dominican | 3 | 0.1% |
| English | 358 | 16.6% |
| European | 46 | 2.1% |
| French | 111 | 5.1% |
| French Canadian | 28 | 1.3% |
| German | 174 | 8.1% |
| Hungarian | 12 | 0.6% |
| Iranian | 13 | 0.6% |
| Irish | 240 | 11.1% |
| Italian | 269 | 12.5% |
| Jamaican | 30 | 1.4% |
| Mexican | 18 | 0.8% |
| Norwegian | 18 | 0.8% |
| Pakistani | 31 | 1.4% |
| Polish | 57 | 2.6% |
| Russian | 23 | 1.1% |
| Scotch-Irish | 77 | 3.6% |
| Scottish | 44 | 2.0% |
| Subsaharan African | 21 | 1.0% |
| Swedish | 35 | 1.6% |
| Ukrainian | 35 | 1.6% | View All 27 Rows |
Immigrants in Bar Harbor
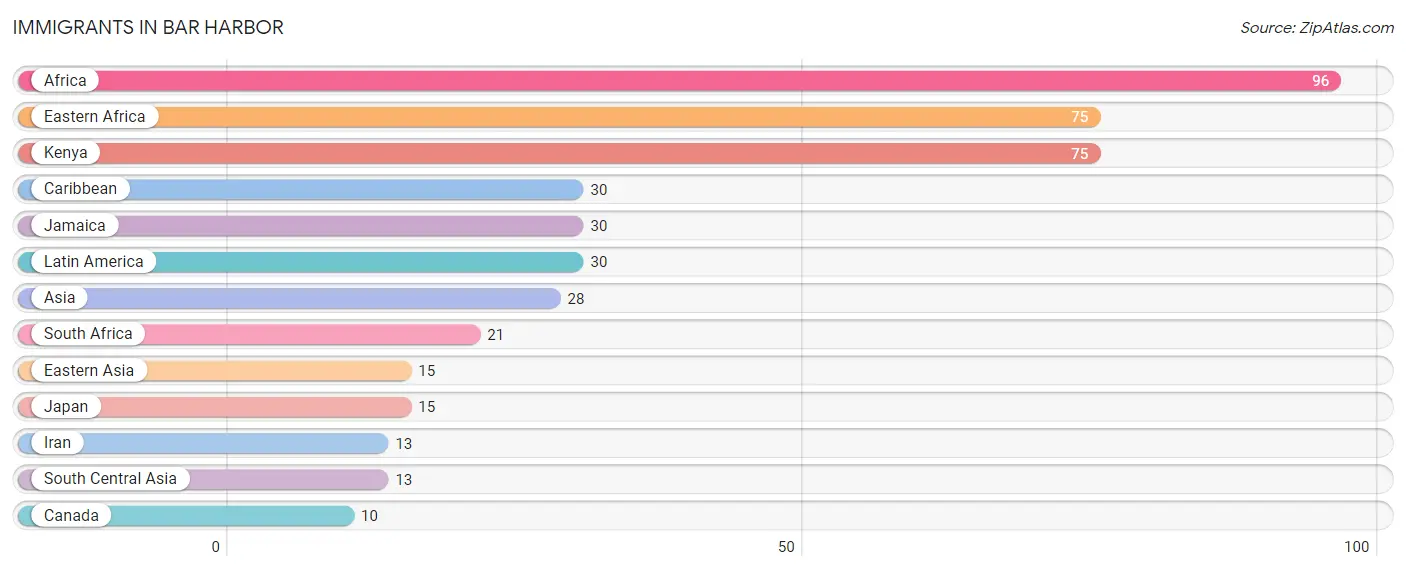
The most numerous immigrant groups reported in Bar Harbor came from Africa (96 | 4.5%), Eastern Africa (75 | 3.5%), Kenya (75 | 3.5%), Caribbean (30 | 1.4%), and Jamaica (30 | 1.4%), together accounting for 14.2% of all Bar Harbor residents.
| Immigration Origin | # Population | % Population |
| Africa | 96 | 4.5% |
| Asia | 28 | 1.3% |
| Canada | 10 | 0.5% |
| Caribbean | 30 | 1.4% |
| Eastern Africa | 75 | 3.5% |
| Eastern Asia | 15 | 0.7% |
| Iran | 13 | 0.6% |
| Jamaica | 30 | 1.4% |
| Japan | 15 | 0.7% |
| Kenya | 75 | 3.5% |
| Latin America | 30 | 1.4% |
| South Africa | 21 | 1.0% |
| South Central Asia | 13 | 0.6% | View All 13 Rows |
Sex and Age in Bar Harbor
Sex and Age in Bar Harbor
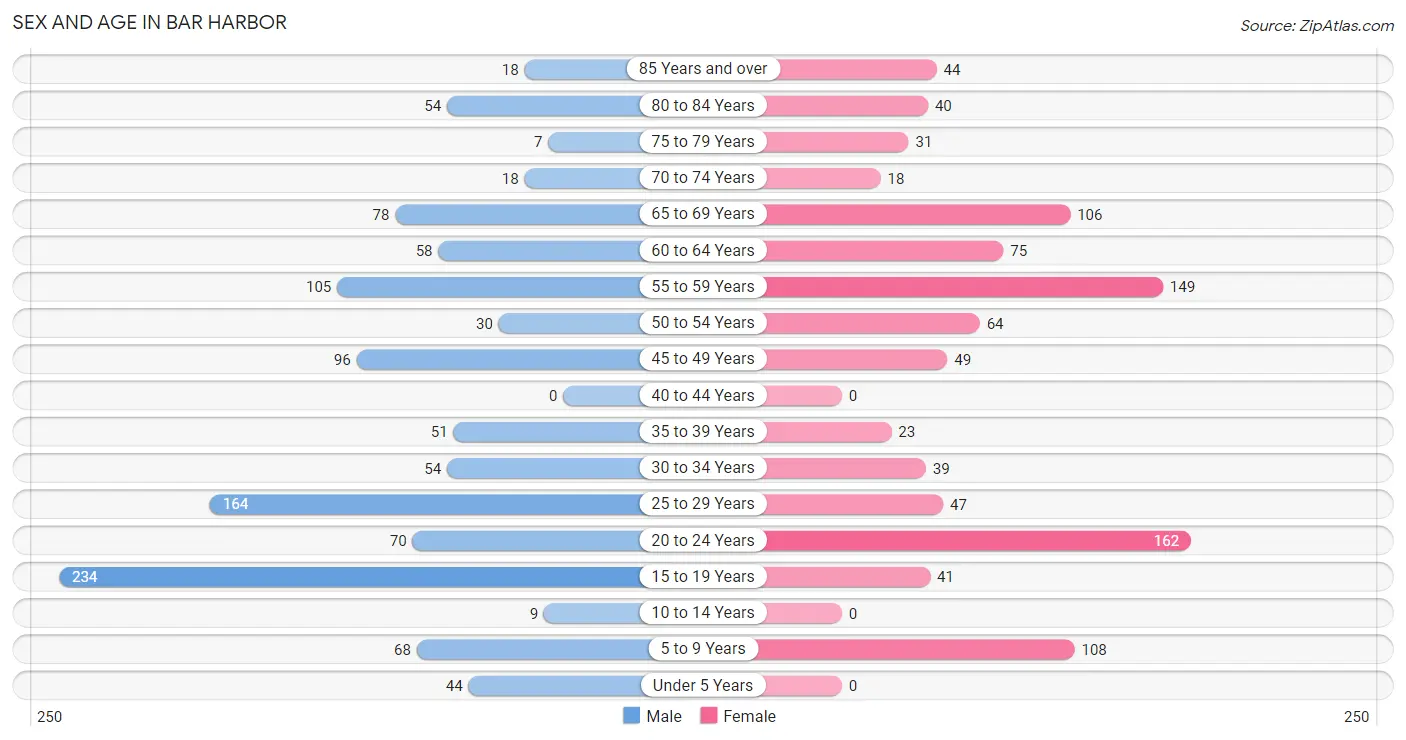
The most populous age groups in Bar Harbor are 15 to 19 Years (234 | 20.2%) for men and 20 to 24 Years (162 | 16.3%) for women.
| Age Bracket | Male | Female |
| Under 5 Years | 44 (3.8%) | 0 (0.0%) |
| 5 to 9 Years | 68 (5.9%) | 108 (10.8%) |
| 10 to 14 Years | 9 (0.8%) | 0 (0.0%) |
| 15 to 19 Years | 234 (20.2%) | 41 (4.1%) |
| 20 to 24 Years | 70 (6.0%) | 162 (16.3%) |
| 25 to 29 Years | 164 (14.2%) | 47 (4.7%) |
| 30 to 34 Years | 54 (4.7%) | 39 (3.9%) |
| 35 to 39 Years | 51 (4.4%) | 23 (2.3%) |
| 40 to 44 Years | 0 (0.0%) | 0 (0.0%) |
| 45 to 49 Years | 96 (8.3%) | 49 (4.9%) |
| 50 to 54 Years | 30 (2.6%) | 64 (6.4%) |
| 55 to 59 Years | 105 (9.1%) | 149 (15.0%) |
| 60 to 64 Years | 58 (5.0%) | 75 (7.5%) |
| 65 to 69 Years | 78 (6.7%) | 106 (10.6%) |
| 70 to 74 Years | 18 (1.5%) | 18 (1.8%) |
| 75 to 79 Years | 7 (0.6%) | 31 (3.1%) |
| 80 to 84 Years | 54 (4.7%) | 40 (4.0%) |
| 85 Years and over | 18 (1.5%) | 44 (4.4%) |
| Total | 1,158 (100.0%) | 996 (100.0%) |
Families and Households in Bar Harbor
Median Family Size in Bar Harbor
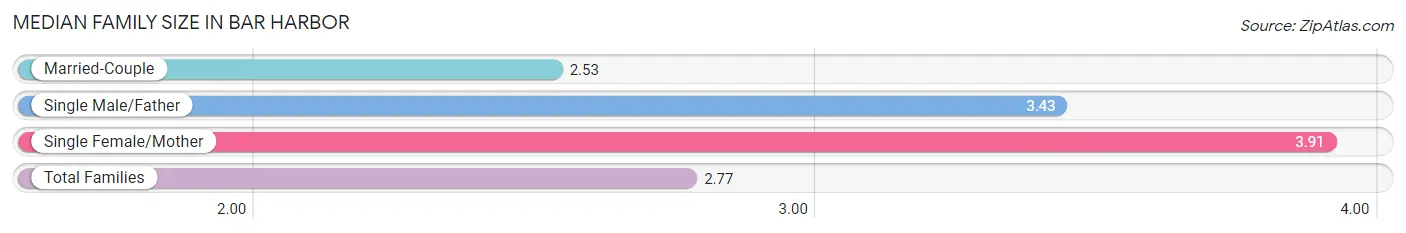
The median family size in Bar Harbor is 2.77 persons per family, with single female/mother families (54 | 13.8%) accounting for the largest median family size of 3.91 persons per family. On the other hand, married-couple families (316 | 80.8%) represent the smallest median family size with 2.53 persons per family.
| Family Type | # Families | Family Size |
| Married-Couple | 316 (80.8%) | 2.53 |
| Single Male/Father | 21 (5.4%) | 3.43 |
| Single Female/Mother | 54 (13.8%) | 3.91 |
| Total Families | 391 (100.0%) | 2.77 |
Median Household Size in Bar Harbor
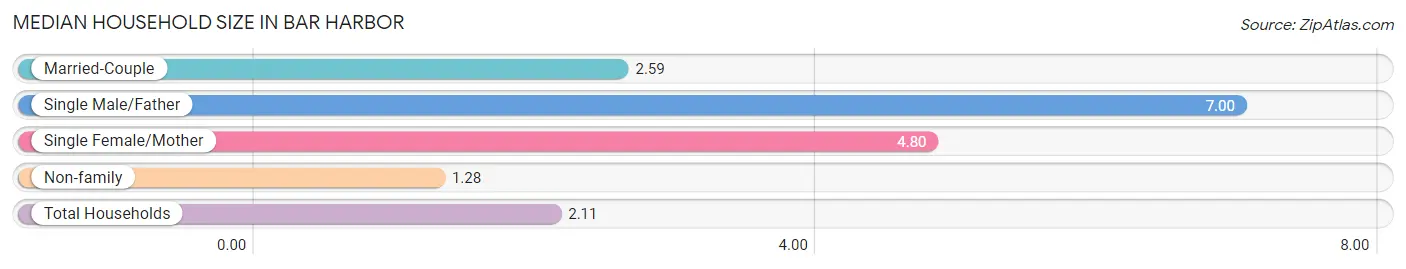
The median household size in Bar Harbor is 2.11 persons per household, with single male/father households (21 | 2.4%) accounting for the largest median household size of 7 persons per household. non-family households (483 | 55.3%) represent the smallest median household size with 1.28 persons per household.
| Household Type | # Households | Household Size |
| Married-Couple | 316 (36.2%) | 2.59 |
| Single Male/Father | 21 (2.4%) | 7.00 |
| Single Female/Mother | 54 (6.2%) | 4.80 |
| Non-family | 483 (55.3%) | 1.28 |
| Total Households | 874 (100.0%) | 2.11 |
Household Size by Marriage Status in Bar Harbor
Out of a total of 874 households in Bar Harbor, 391 (44.7%) are family households, while 483 (55.3%) are nonfamily households. The most numerous type of family households are 2-person households, comprising 220, and the most common type of nonfamily households are 1-person households, comprising 361.
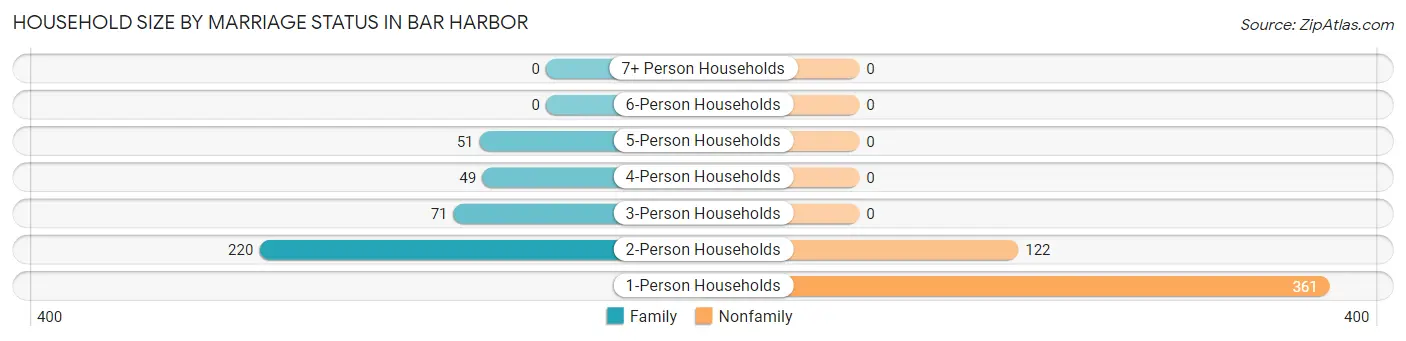
| Household Size | Family Households | Nonfamily Households |
| 1-Person Households | - | 361 (41.3%) |
| 2-Person Households | 220 (25.2%) | 122 (14.0%) |
| 3-Person Households | 71 (8.1%) | 0 (0.0%) |
| 4-Person Households | 49 (5.6%) | 0 (0.0%) |
| 5-Person Households | 51 (5.8%) | 0 (0.0%) |
| 6-Person Households | 0 (0.0%) | 0 (0.0%) |
| 7+ Person Households | 0 (0.0%) | 0 (0.0%) |
| Total | 391 (44.7%) | 483 (55.3%) |
Female Fertility in Bar Harbor
Fertility by Age in Bar Harbor
| Age Bracket | Women with Births | Births / 1,000 Women |
| 15 to 19 years | 0 (0.0%) | 0.0 |
| 20 to 34 years | 0 (0.0%) | 0.0 |
| 35 to 50 years | 0 (0.0%) | 0.0 |
| Total | 0 (0.0%) | 0.0 |
Fertility by Age by Marriage Status in Bar Harbor
| Age Bracket | Married | Unmarried |
| 15 to 19 years | 0 (0.0%) | 0 (0.0%) |
| 20 to 34 years | 0 (0.0%) | 0 (0.0%) |
| 35 to 50 years | 0 (0.0%) | 0 (0.0%) |
| Total | 0 (0.0%) | 0 (0.0%) |
Fertility by Education in Bar Harbor
| Educational Attainment | Women with Births | Births / 1,000 Women |
| Less than High School | 0 (0.0%) | 0.0 |
| High School Diploma | 0 (0.0%) | 0.0 |
| College or Associate's Degree | 0 (0.0%) | 0.0 |
| Bachelor's Degree | 0 (0.0%) | 0.0 |
| Graduate Degree | 0 (0.0%) | 0.0 |
| Total | 0 (0.0%) | 0.0 |
Fertility by Education by Marriage Status in Bar Harbor
| Educational Attainment | Married | Unmarried |
| Less than High School | 0 (0.0%) | 0 (0.0%) |
| High School Diploma | 0 (0.0%) | 0 (0.0%) |
| College or Associate's Degree | 0 (0.0%) | 0 (0.0%) |
| Bachelor's Degree | 0 (0.0%) | 0 (0.0%) |
| Graduate Degree | 0 (0.0%) | 0 (0.0%) |
| Total | 0 (0.0%) | 0 (0.0%) |
Employment Characteristics in Bar Harbor
Employment by Class of Employer in Bar Harbor
Among the 1,031 employed individuals in Bar Harbor, private company employees (481 | 46.7%), not-for-profit organizations (299 | 29.0%), and self-employed (not incorporated) (102 | 9.9%) make up the most common classes of employment.
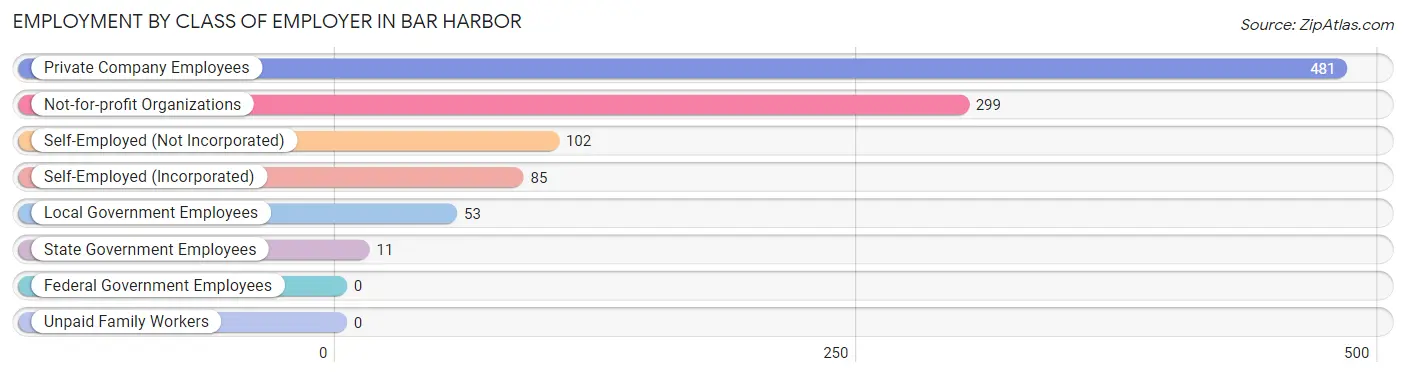
| Employer Class | # Employees | % Employees |
| Private Company Employees | 481 | 46.7% |
| Self-Employed (Incorporated) | 85 | 8.2% |
| Self-Employed (Not Incorporated) | 102 | 9.9% |
| Not-for-profit Organizations | 299 | 29.0% |
| Local Government Employees | 53 | 5.1% |
| State Government Employees | 11 | 1.1% |
| Federal Government Employees | 0 | 0.0% |
| Unpaid Family Workers | 0 | 0.0% |
| Total | 1,031 | 100.0% |
Employment Status by Age in Bar Harbor
According to the labor force statistics for Bar Harbor, out of the total population over 16 years of age (1,871), 62.9% or 1,177 individuals are in the labor force, with 10.6% or 125 of them unemployed. The age group with the highest labor force participation rate is 35 to 44 years, with 100.0% or 74 individuals in the labor force. Within the labor force, the 65 to 74 years age range has the highest percentage of unemployed individuals, with 68.5% or 74 of them being unemployed.
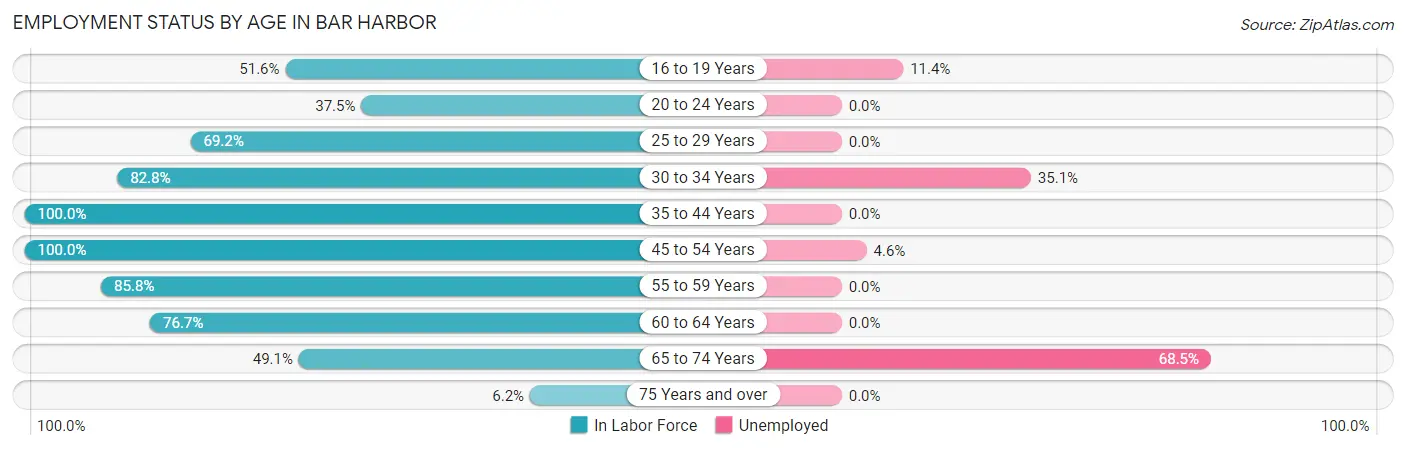
| Age Bracket | In Labor Force | Unemployed |
| 16 to 19 Years | 114 (51.6%) | 13 (11.4%) |
| 20 to 24 Years | 87 (37.5%) | 0 (0.0%) |
| 25 to 29 Years | 146 (69.2%) | 0 (0.0%) |
| 30 to 34 Years | 77 (82.8%) | 27 (35.1%) |
| 35 to 44 Years | 74 (100.0%) | 0 (0.0%) |
| 45 to 54 Years | 239 (100.0%) | 11 (4.6%) |
| 55 to 59 Years | 218 (85.8%) | 0 (0.0%) |
| 60 to 64 Years | 102 (76.7%) | 0 (0.0%) |
| 65 to 74 Years | 108 (49.1%) | 74 (68.5%) |
| 75 Years and over | 12 (6.2%) | 0 (0.0%) |
| Total | 1,177 (62.9%) | 125 (10.6%) |
Employment Status by Educational Attainment in Bar Harbor
According to labor force statistics for Bar Harbor, 85.3% of individuals (856) out of the total population between 25 and 64 years of age (1,004) are in the labor force, with 4.4% or 38 of them being unemployed. The group with the highest labor force participation rate are those with the educational attainment of less than high school, with 100.0% or 21 individuals in the labor force. Within the labor force, individuals with bachelor's degree or higher education have the highest percentage of unemployment, with 7.5% or 38 of them being unemployed.
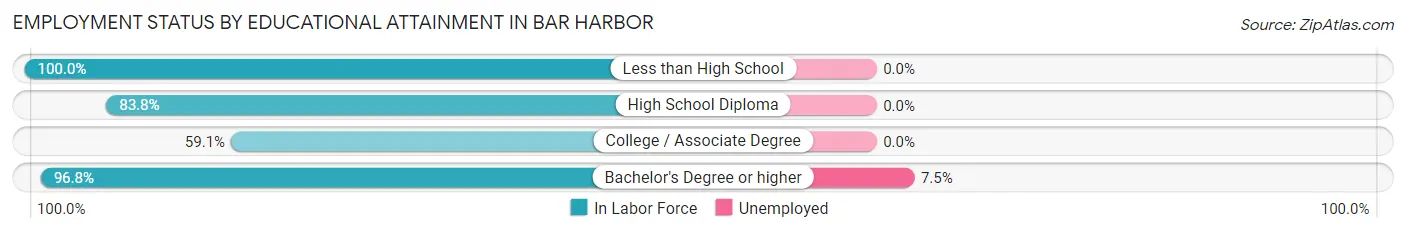
| Educational Attainment | In Labor Force | Unemployed |
| Less than High School | 21 (100.0%) | 0 (0.0%) |
| High School Diploma | 192 (83.8%) | 0 (0.0%) |
| College / Associate Degree | 136 (59.1%) | 0 (0.0%) |
| Bachelor's Degree or higher | 507 (96.8%) | 39 (7.5%) |
| Total | 856 (85.3%) | 44 (4.4%) |
Employment Occupations by Sex in Bar Harbor
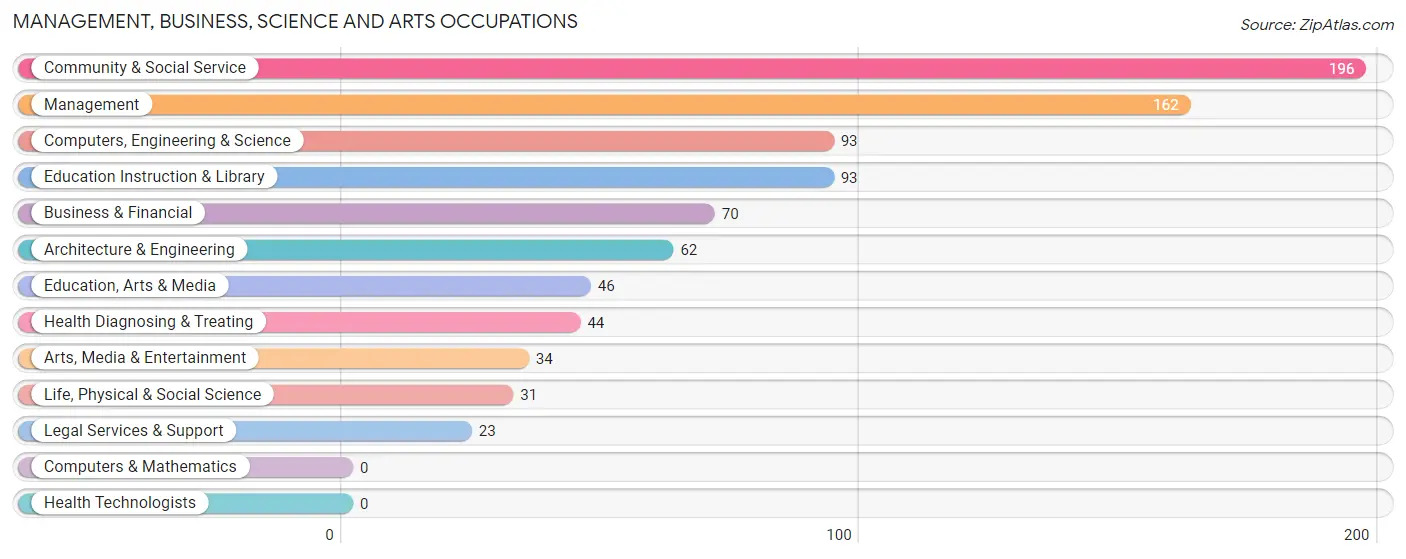
Management, Business, Science and Arts Occupations
The most common Management, Business, Science and Arts occupations in Bar Harbor are Community & Social Service (196 | 18.6%), Management (162 | 15.4%), Computers, Engineering & Science (93 | 8.8%), Education Instruction & Library (93 | 8.8%), and Business & Financial (70 | 6.7%).
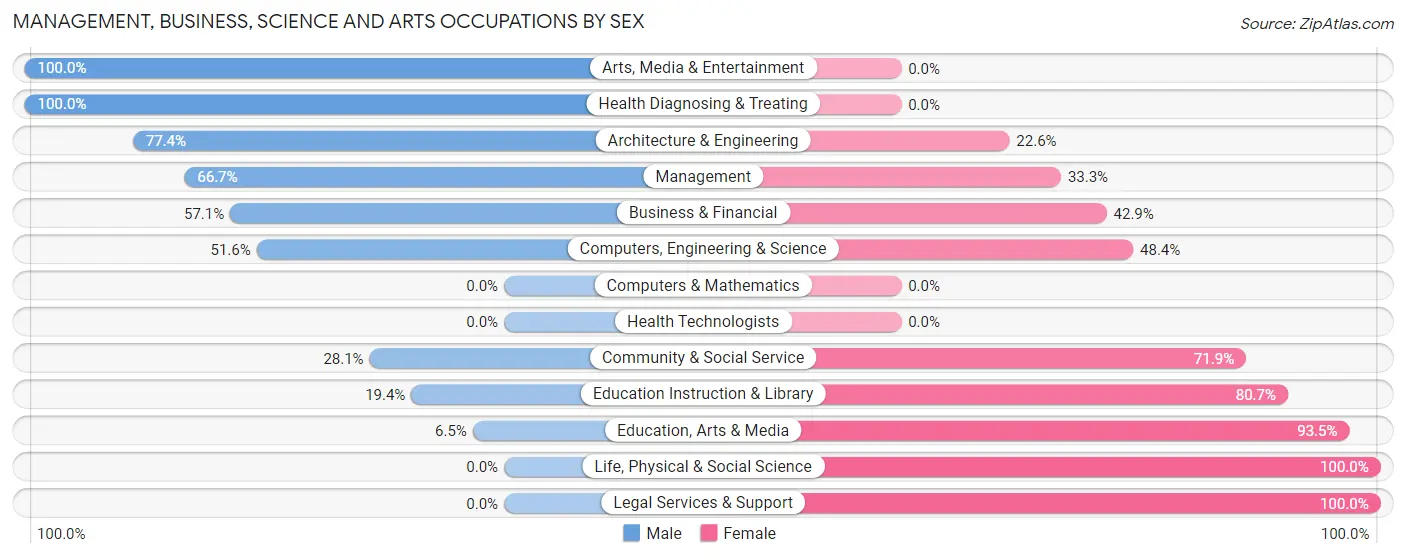
Management, Business, Science and Arts Occupations by Sex
Within the Management, Business, Science and Arts occupations in Bar Harbor, the most male-oriented occupations are Arts, Media & Entertainment (100.0%), Health Diagnosing & Treating (100.0%), and Architecture & Engineering (77.4%), while the most female-oriented occupations are Life, Physical & Social Science (100.0%), Legal Services & Support (100.0%), and Education, Arts & Media (93.5%).
| Occupation | Male | Female |
| Management | 108 (66.7%) | 54 (33.3%) |
| Business & Financial | 40 (57.1%) | 30 (42.9%) |
| Computers, Engineering & Science | 48 (51.6%) | 45 (48.4%) |
| Computers & Mathematics | 0 (0.0%) | 0 (0.0%) |
| Architecture & Engineering | 48 (77.4%) | 14 (22.6%) |
| Life, Physical & Social Science | 0 (0.0%) | 31 (100.0%) |
| Community & Social Service | 55 (28.1%) | 141 (71.9%) |
| Education, Arts & Media | 3 (6.5%) | 43 (93.5%) |
| Legal Services & Support | 0 (0.0%) | 23 (100.0%) |
| Education Instruction & Library | 18 (19.4%) | 75 (80.6%) |
| Arts, Media & Entertainment | 34 (100.0%) | 0 (0.0%) |
| Health Diagnosing & Treating | 44 (100.0%) | 0 (0.0%) |
| Health Technologists | 0 (0.0%) | 0 (0.0%) |
| Total (Category) | 295 (52.2%) | 270 (47.8%) |
| Total (Overall) | 631 (60.0%) | 421 (40.0%) |
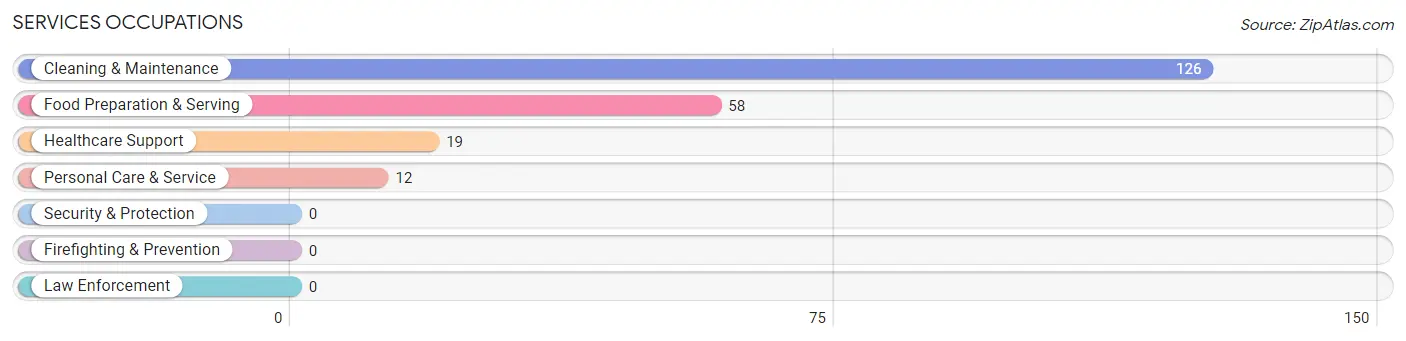
Services Occupations
The most common Services occupations in Bar Harbor are Cleaning & Maintenance (126 | 12.0%), Food Preparation & Serving (58 | 5.5%), Healthcare Support (19 | 1.8%), and Personal Care & Service (12 | 1.1%).
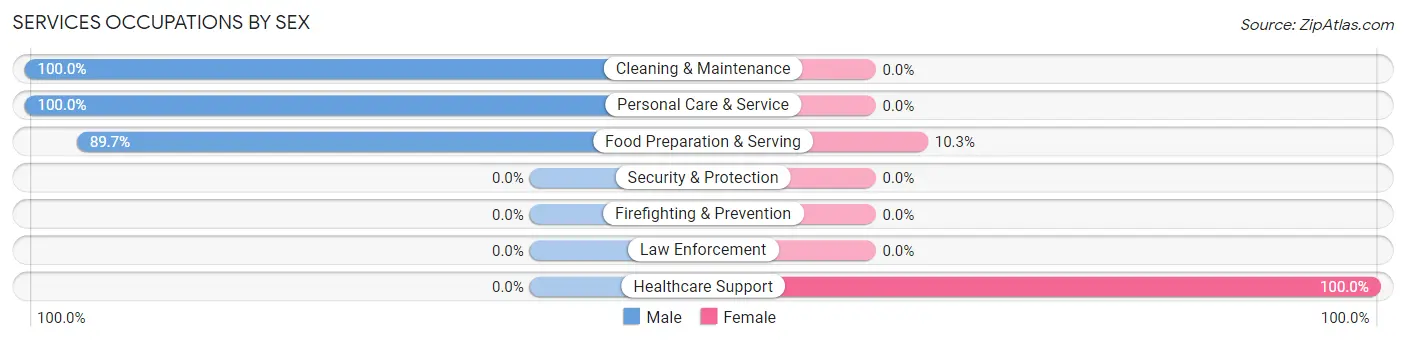
Services Occupations by Sex
Within the Services occupations in Bar Harbor, the most male-oriented occupations are Cleaning & Maintenance (100.0%), Personal Care & Service (100.0%), and Food Preparation & Serving (89.7%), while the most female-oriented occupations are Healthcare Support (100.0%), and Food Preparation & Serving (10.3%).
| Occupation | Male | Female |
| Healthcare Support | 0 (0.0%) | 19 (100.0%) |
| Security & Protection | 0 (0.0%) | 0 (0.0%) |
| Firefighting & Prevention | 0 (0.0%) | 0 (0.0%) |
| Law Enforcement | 0 (0.0%) | 0 (0.0%) |
| Food Preparation & Serving | 52 (89.7%) | 6 (10.3%) |
| Cleaning & Maintenance | 126 (100.0%) | 0 (0.0%) |
| Personal Care & Service | 12 (100.0%) | 0 (0.0%) |
| Total (Category) | 190 (88.4%) | 25 (11.6%) |
| Total (Overall) | 631 (60.0%) | 421 (40.0%) |
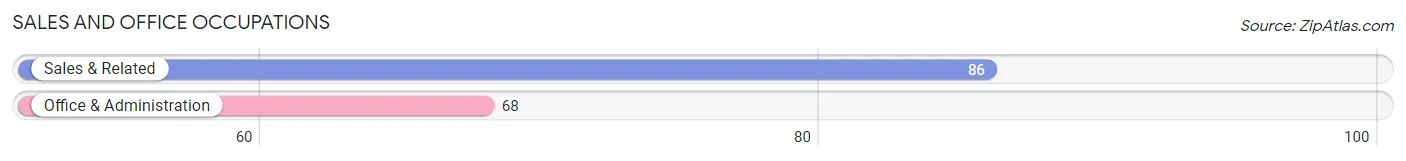
Sales and Office Occupations
The most common Sales and Office occupations in Bar Harbor are Sales & Related (86 | 8.2%), and Office & Administration (68 | 6.5%).
Sales and Office Occupations by Sex
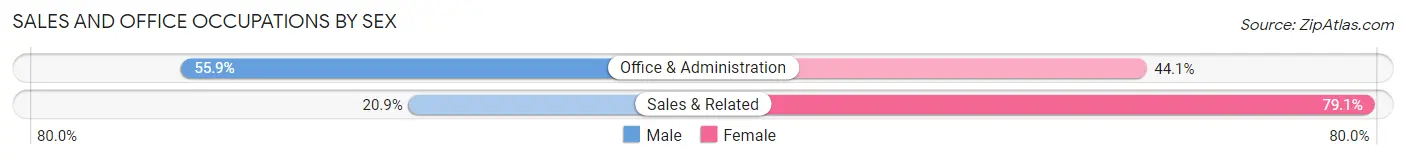
| Occupation | Male | Female |
| Sales & Related | 18 (20.9%) | 68 (79.1%) |
| Office & Administration | 38 (55.9%) | 30 (44.1%) |
| Total (Category) | 56 (36.4%) | 98 (63.6%) |
| Total (Overall) | 631 (60.0%) | 421 (40.0%) |
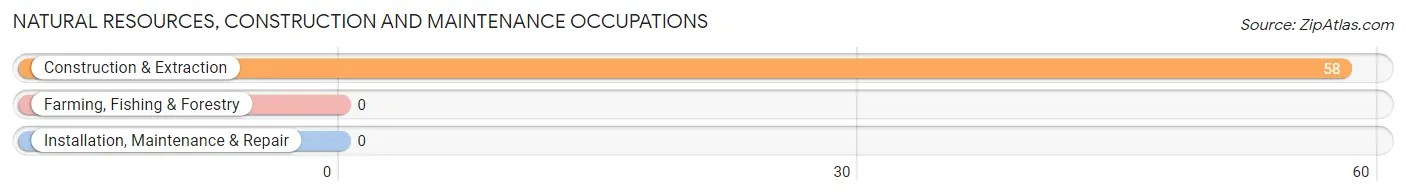
Natural Resources, Construction and Maintenance Occupations
The most common Natural Resources, Construction and Maintenance occupations in Bar Harbor are , and Construction & Extraction (58 | 5.5%).
Natural Resources, Construction and Maintenance Occupations by Sex
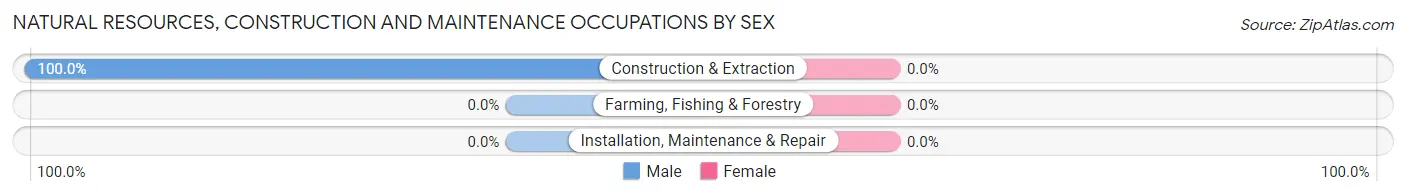
| Occupation | Male | Female |
| Farming, Fishing & Forestry | 0 (0.0%) | 0 (0.0%) |
| Construction & Extraction | 58 (100.0%) | 0 (0.0%) |
| Installation, Maintenance & Repair | 0 (0.0%) | 0 (0.0%) |
| Total (Category) | 58 (100.0%) | 0 (0.0%) |
| Total (Overall) | 631 (60.0%) | 421 (40.0%) |
Production, Transportation and Moving Occupations
The most common Production, Transportation and Moving occupations in Bar Harbor are , and Production (60 | 5.7%).
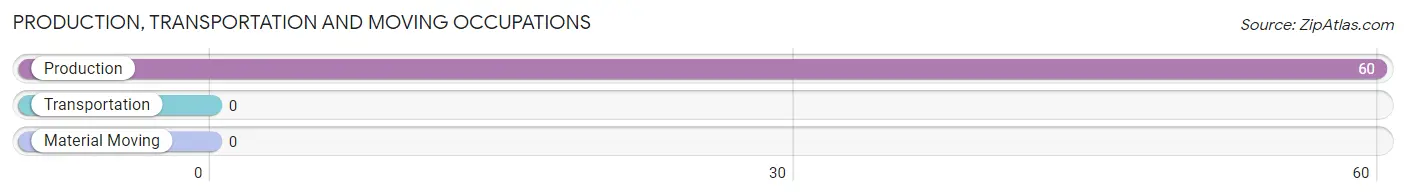
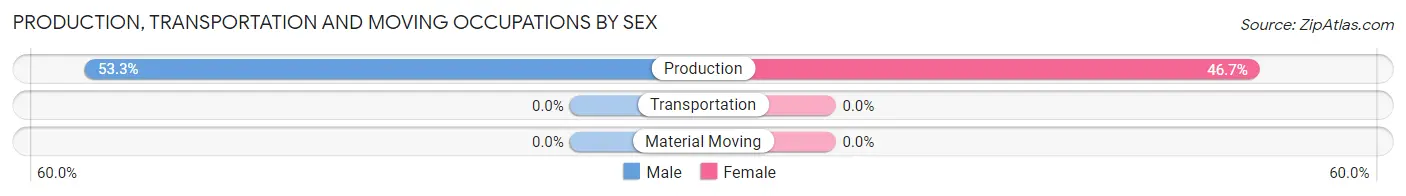
Production, Transportation and Moving Occupations by Sex
| Occupation | Male | Female |
| Production | 32 (53.3%) | 28 (46.7%) |
| Transportation | 0 (0.0%) | 0 (0.0%) |
| Material Moving | 0 (0.0%) | 0 (0.0%) |
| Total (Category) | 32 (53.3%) | 28 (46.7%) |
| Total (Overall) | 631 (60.0%) | 421 (40.0%) |
Employment Industries by Sex in Bar Harbor
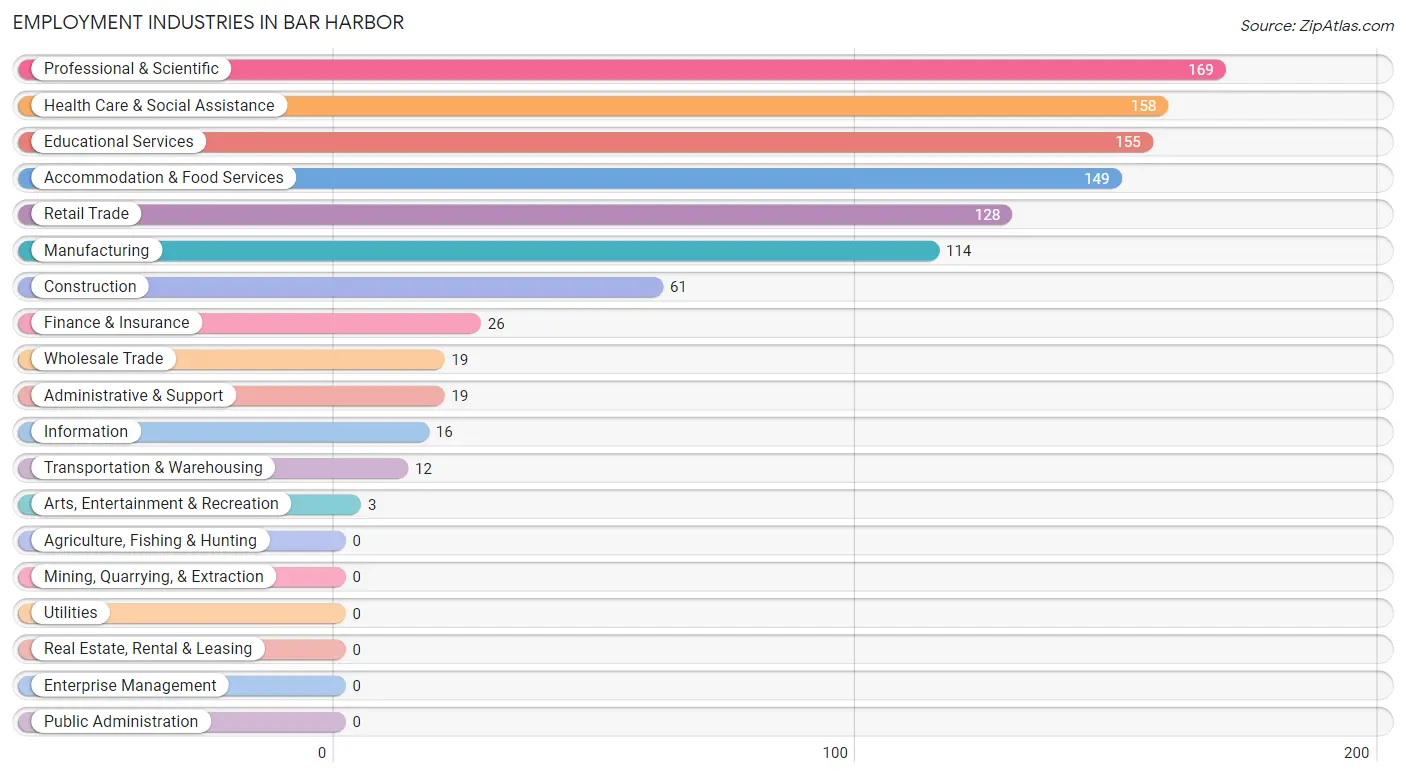
Employment Industries in Bar Harbor
The major employment industries in Bar Harbor include Professional & Scientific (169 | 16.1%), Health Care & Social Assistance (158 | 15.0%), Educational Services (155 | 14.7%), Accommodation & Food Services (149 | 14.2%), and Retail Trade (128 | 12.2%).
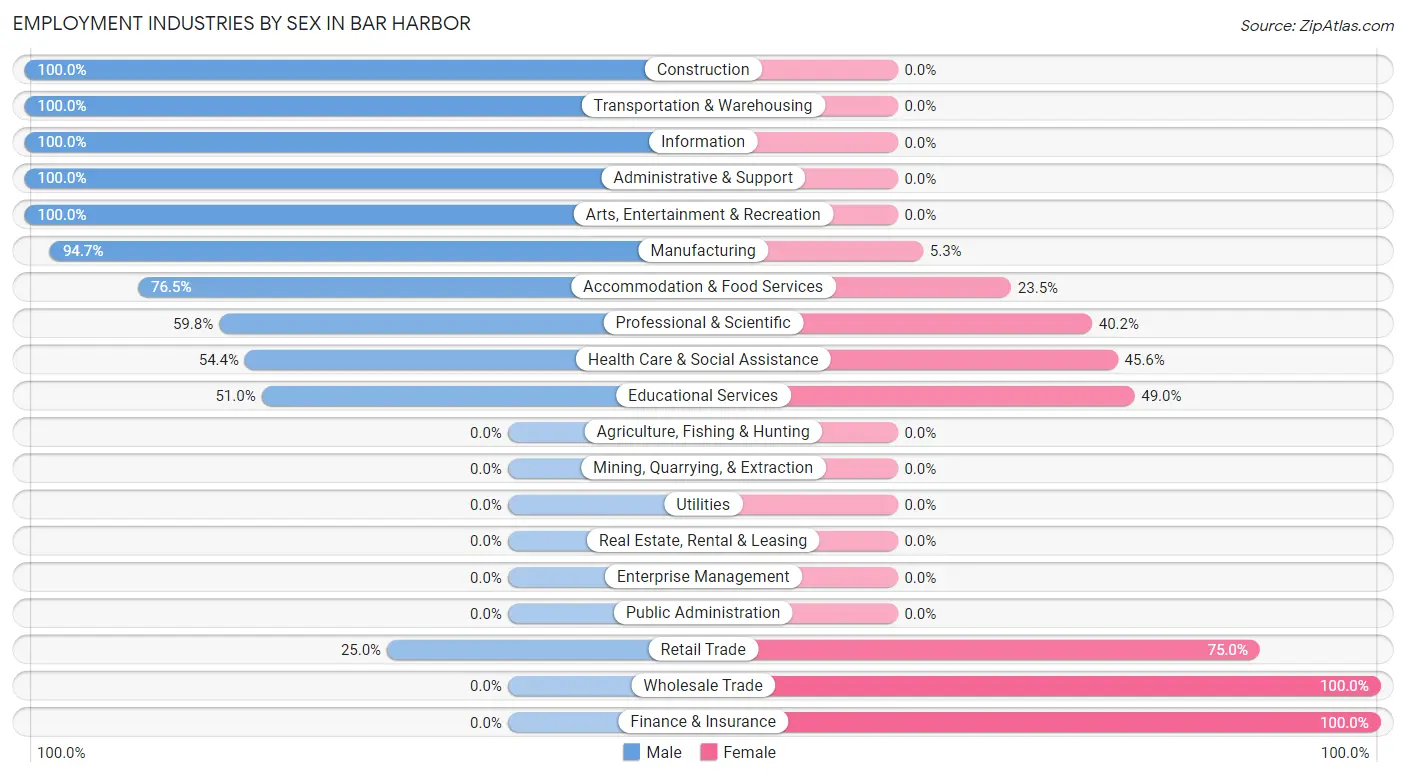
Employment Industries by Sex in Bar Harbor
The Bar Harbor industries that see more men than women are Construction (100.0%), Transportation & Warehousing (100.0%), and Information (100.0%), whereas the industries that tend to have a higher number of women are Wholesale Trade (100.0%), Finance & Insurance (100.0%), and Retail Trade (75.0%).
| Industry | Male | Female |
| Agriculture, Fishing & Hunting | 0 (0.0%) | 0 (0.0%) |
| Mining, Quarrying, & Extraction | 0 (0.0%) | 0 (0.0%) |
| Construction | 61 (100.0%) | 0 (0.0%) |
| Manufacturing | 108 (94.7%) | 6 (5.3%) |
| Wholesale Trade | 0 (0.0%) | 19 (100.0%) |
| Retail Trade | 32 (25.0%) | 96 (75.0%) |
| Transportation & Warehousing | 12 (100.0%) | 0 (0.0%) |
| Utilities | 0 (0.0%) | 0 (0.0%) |
| Information | 16 (100.0%) | 0 (0.0%) |
| Finance & Insurance | 0 (0.0%) | 26 (100.0%) |
| Real Estate, Rental & Leasing | 0 (0.0%) | 0 (0.0%) |
| Professional & Scientific | 101 (59.8%) | 68 (40.2%) |
| Enterprise Management | 0 (0.0%) | 0 (0.0%) |
| Administrative & Support | 19 (100.0%) | 0 (0.0%) |
| Educational Services | 79 (51.0%) | 76 (49.0%) |
| Health Care & Social Assistance | 86 (54.4%) | 72 (45.6%) |
| Arts, Entertainment & Recreation | 3 (100.0%) | 0 (0.0%) |
| Accommodation & Food Services | 114 (76.5%) | 35 (23.5%) |
| Public Administration | 0 (0.0%) | 0 (0.0%) |
| Total | 631 (60.0%) | 421 (40.0%) |
Education in Bar Harbor
School Enrollment in Bar Harbor
The most common levels of schooling among the 660 students in Bar Harbor are college / undergraduate (364 | 55.1%), elementary school (170 | 25.8%), and high school (54 | 8.2%).
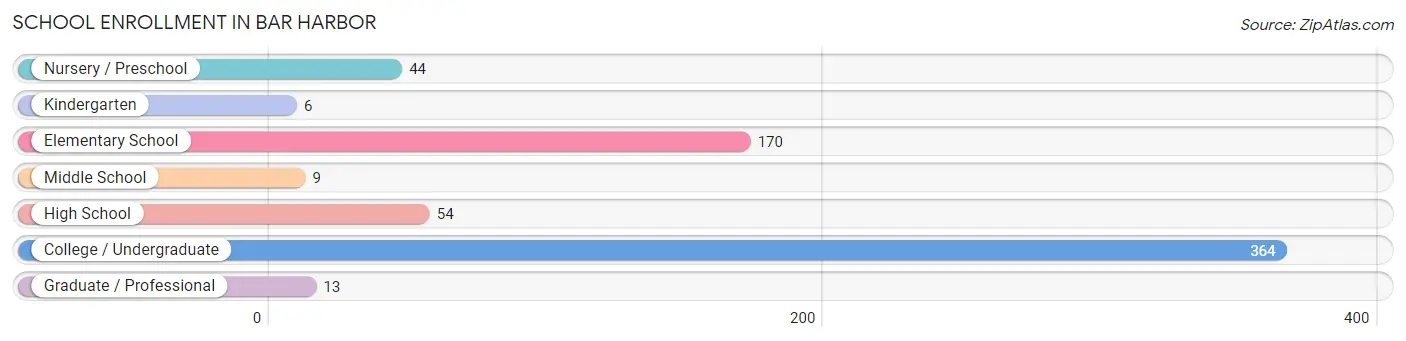
| School Level | # Students | % Students |
| Nursery / Preschool | 44 | 6.7% |
| Kindergarten | 6 | 0.9% |
| Elementary School | 170 | 25.8% |
| Middle School | 9 | 1.4% |
| High School | 54 | 8.2% |
| College / Undergraduate | 364 | 55.1% |
| Graduate / Professional | 13 | 2.0% |
| Total | 660 | 100.0% |
School Enrollment by Age by Funding Source in Bar Harbor
Out of a total of 660 students who are enrolled in schools in Bar Harbor, 181 (27.4%) attend a private institution, while the remaining 479 (72.6%) are enrolled in public schools. The age group of 3 to 4 year olds has the highest likelihood of being enrolled in private schools, with 44 (100.0% in the age bracket) enrolled. Conversely, the age group of 10 to 14 year olds has the lowest likelihood of being enrolled in a private school, with 9 (100.0% in the age bracket) attending a public institution.
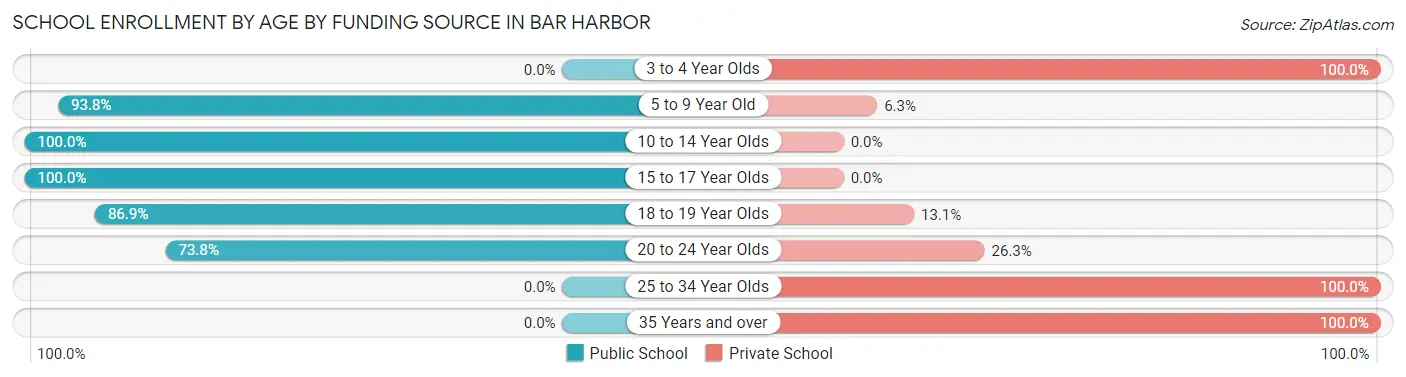
| Age Bracket | Public School | Private School |
| 3 to 4 Year Olds | 0 (0.0%) | 44 (100.0%) |
| 5 to 9 Year Old | 165 (93.8%) | 11 (6.2%) |
| 10 to 14 Year Olds | 9 (100.0%) | 0 (0.0%) |
| 15 to 17 Year Olds | 54 (100.0%) | 0 (0.0%) |
| 18 to 19 Year Olds | 192 (86.9%) | 29 (13.1%) |
| 20 to 24 Year Olds | 59 (73.8%) | 21 (26.3%) |
| 25 to 34 Year Olds | 0 (0.0%) | 55 (100.0%) |
| 35 Years and over | 0 (0.0%) | 21 (100.0%) |
| Total | 479 (72.6%) | 181 (27.4%) |
Educational Attainment by Field of Study in Bar Harbor
Bio, nature & agricultural (136 | 20.0%), social sciences (112 | 16.5%), education (75 | 11.0%), business (72 | 10.6%), and visual & performing arts (52 | 7.6%) are the most common fields of study among 680 individuals in Bar Harbor who have obtained a bachelor's degree or higher.
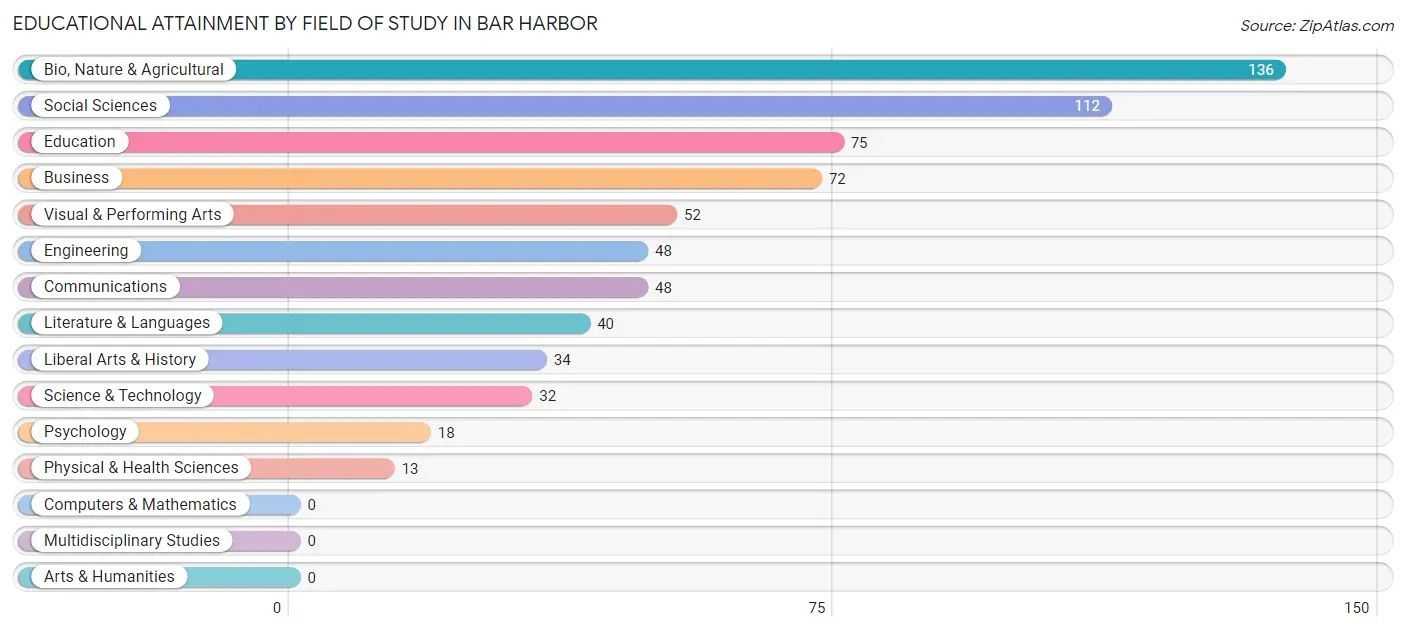
| Field of Study | # Graduates | % Graduates |
| Computers & Mathematics | 0 | 0.0% |
| Bio, Nature & Agricultural | 136 | 20.0% |
| Physical & Health Sciences | 13 | 1.9% |
| Psychology | 18 | 2.6% |
| Social Sciences | 112 | 16.5% |
| Engineering | 48 | 7.1% |
| Multidisciplinary Studies | 0 | 0.0% |
| Science & Technology | 32 | 4.7% |
| Business | 72 | 10.6% |
| Education | 75 | 11.0% |
| Literature & Languages | 40 | 5.9% |
| Liberal Arts & History | 34 | 5.0% |
| Visual & Performing Arts | 52 | 7.6% |
| Communications | 48 | 7.1% |
| Arts & Humanities | 0 | 0.0% |
| Total | 680 | 100.0% |
Transportation & Commute in Bar Harbor
Vehicle Availability by Sex in Bar Harbor
The most prevalent vehicle ownership categories in Bar Harbor are males with 2 vehicles (238, accounting for 43.0%) and females with 2 vehicles (204, making up 60.4%).
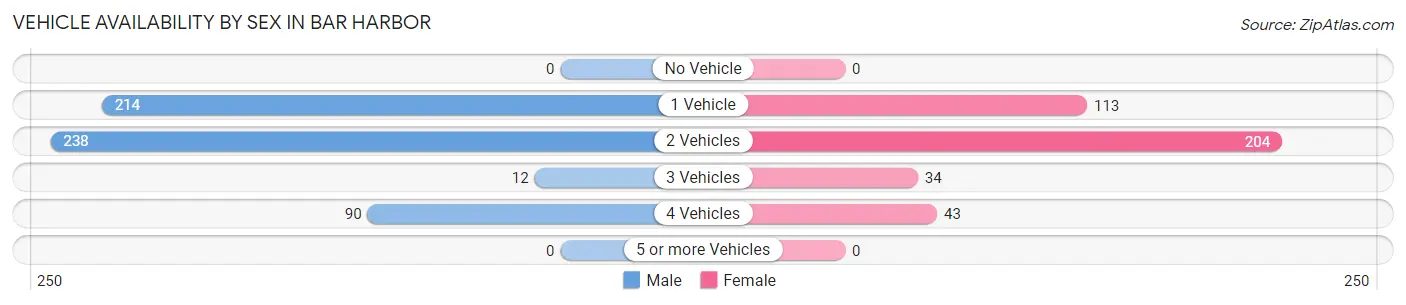
| Vehicles Available | Male | Female |
| No Vehicle | 0 (0.0%) | 0 (0.0%) |
| 1 Vehicle | 214 (38.6%) | 113 (28.7%) |
| 2 Vehicles | 238 (43.0%) | 204 (51.8%) |
| 3 Vehicles | 12 (2.2%) | 34 (8.6%) |
| 4 Vehicles | 90 (16.3%) | 43 (10.9%) |
| 5 or more Vehicles | 0 (0.0%) | 0 (0.0%) |
| Total | 554 (100.0%) | 394 (100.0%) |
Commute Time in Bar Harbor
The most frequently occuring commute durations in Bar Harbor are 5 to 9 minutes (351 commuters, 36.4%), less than 5 minutes (162 commuters, 16.8%), and 10 to 14 minutes (146 commuters, 15.1%).
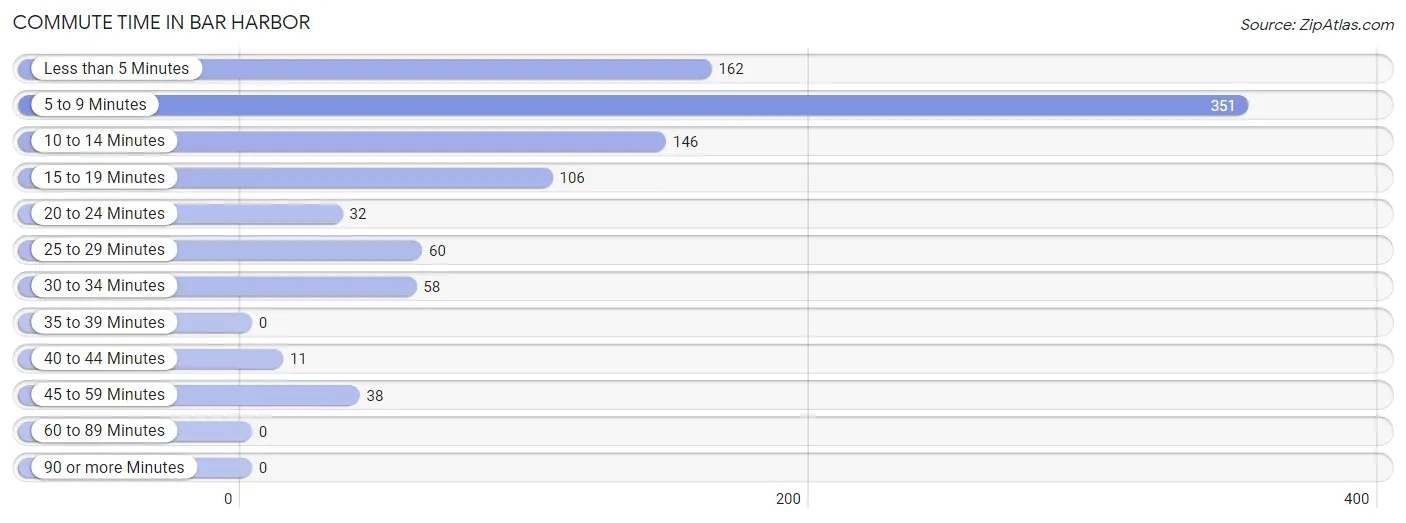
| Commute Time | # Commuters | % Commuters |
| Less than 5 Minutes | 162 | 16.8% |
| 5 to 9 Minutes | 351 | 36.4% |
| 10 to 14 Minutes | 146 | 15.1% |
| 15 to 19 Minutes | 106 | 11.0% |
| 20 to 24 Minutes | 32 | 3.3% |
| 25 to 29 Minutes | 60 | 6.2% |
| 30 to 34 Minutes | 58 | 6.0% |
| 35 to 39 Minutes | 0 | 0.0% |
| 40 to 44 Minutes | 11 | 1.1% |
| 45 to 59 Minutes | 38 | 3.9% |
| 60 to 89 Minutes | 0 | 0.0% |
| 90 or more Minutes | 0 | 0.0% |
Commute Time by Sex in Bar Harbor
The most common commute times in Bar Harbor are 5 to 9 minutes (212 commuters, 37.9%) for males and 5 to 9 minutes (139 commuters, 34.4%) for females.
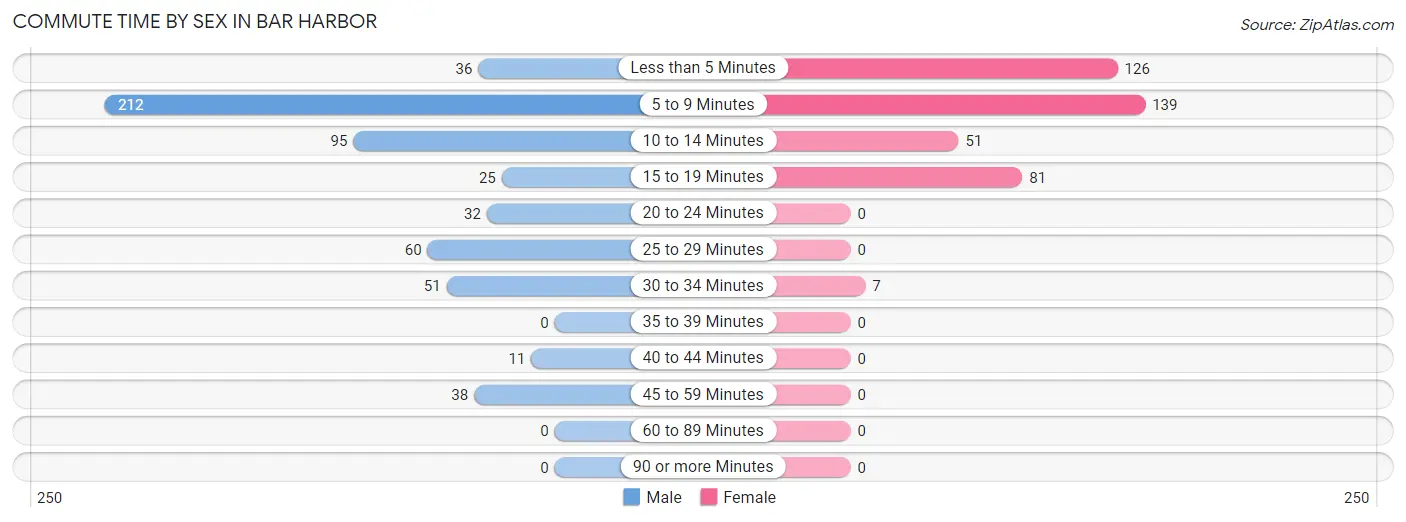
| Commute Time | Male | Female |
| Less than 5 Minutes | 36 (6.4%) | 126 (31.2%) |
| 5 to 9 Minutes | 212 (37.9%) | 139 (34.4%) |
| 10 to 14 Minutes | 95 (17.0%) | 51 (12.6%) |
| 15 to 19 Minutes | 25 (4.5%) | 81 (20.1%) |
| 20 to 24 Minutes | 32 (5.7%) | 0 (0.0%) |
| 25 to 29 Minutes | 60 (10.7%) | 0 (0.0%) |
| 30 to 34 Minutes | 51 (9.1%) | 7 (1.7%) |
| 35 to 39 Minutes | 0 (0.0%) | 0 (0.0%) |
| 40 to 44 Minutes | 11 (2.0%) | 0 (0.0%) |
| 45 to 59 Minutes | 38 (6.8%) | 0 (0.0%) |
| 60 to 89 Minutes | 0 (0.0%) | 0 (0.0%) |
| 90 or more Minutes | 0 (0.0%) | 0 (0.0%) |
Time of Departure to Work by Sex in Bar Harbor
The most frequent times of departure to work in Bar Harbor are 8:00 AM to 8:29 AM (127, 22.7%) for males and 7:00 AM to 7:29 AM (79, 19.6%) for females.
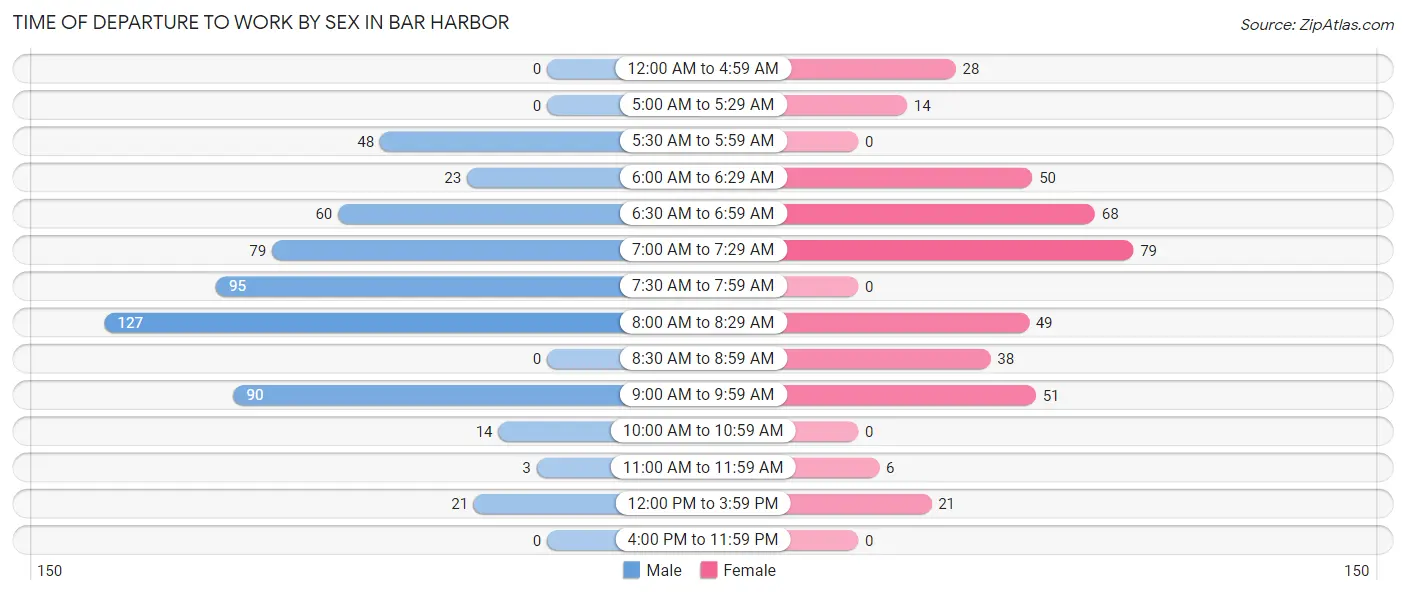
| Time of Departure | Male | Female |
| 12:00 AM to 4:59 AM | 0 (0.0%) | 28 (6.9%) |
| 5:00 AM to 5:29 AM | 0 (0.0%) | 14 (3.5%) |
| 5:30 AM to 5:59 AM | 48 (8.6%) | 0 (0.0%) |
| 6:00 AM to 6:29 AM | 23 (4.1%) | 50 (12.4%) |
| 6:30 AM to 6:59 AM | 60 (10.7%) | 68 (16.8%) |
| 7:00 AM to 7:29 AM | 79 (14.1%) | 79 (19.6%) |
| 7:30 AM to 7:59 AM | 95 (17.0%) | 0 (0.0%) |
| 8:00 AM to 8:29 AM | 127 (22.7%) | 49 (12.1%) |
| 8:30 AM to 8:59 AM | 0 (0.0%) | 38 (9.4%) |
| 9:00 AM to 9:59 AM | 90 (16.1%) | 51 (12.6%) |
| 10:00 AM to 10:59 AM | 14 (2.5%) | 0 (0.0%) |
| 11:00 AM to 11:59 AM | 3 (0.5%) | 6 (1.5%) |
| 12:00 PM to 3:59 PM | 21 (3.7%) | 21 (5.2%) |
| 4:00 PM to 11:59 PM | 0 (0.0%) | 0 (0.0%) |
| Total | 560 (100.0%) | 404 (100.0%) |
Housing Occupancy in Bar Harbor
Occupancy by Ownership in Bar Harbor
Of the total 874 dwellings in Bar Harbor, owner-occupied units account for 383 (43.8%), while renter-occupied units make up 491 (56.2%).
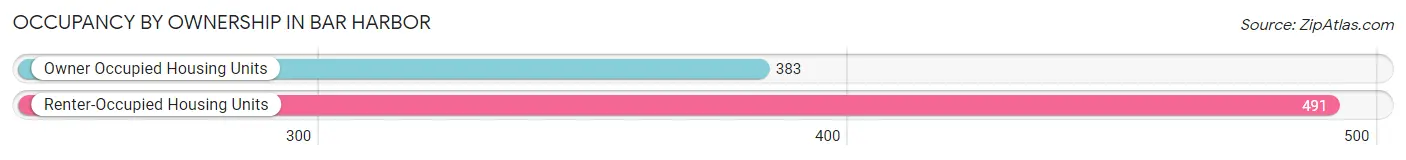
| Occupancy | # Housing Units | % Housing Units |
| Owner Occupied Housing Units | 383 | 43.8% |
| Renter-Occupied Housing Units | 491 | 56.2% |
| Total Occupied Housing Units | 874 | 100.0% |
Occupancy by Household Size in Bar Harbor
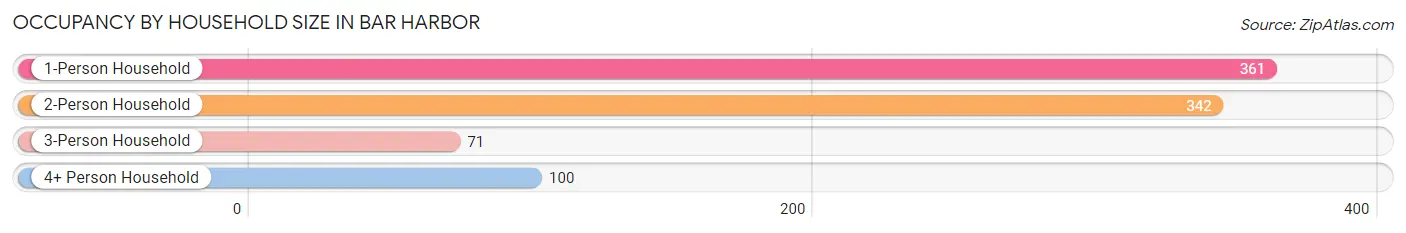
| Household Size | # Housing Units | % Housing Units |
| 1-Person Household | 361 | 41.3% |
| 2-Person Household | 342 | 39.1% |
| 3-Person Household | 71 | 8.1% |
| 4+ Person Household | 100 | 11.4% |
| Total Housing Units | 874 | 100.0% |
Occupancy by Ownership by Household Size in Bar Harbor
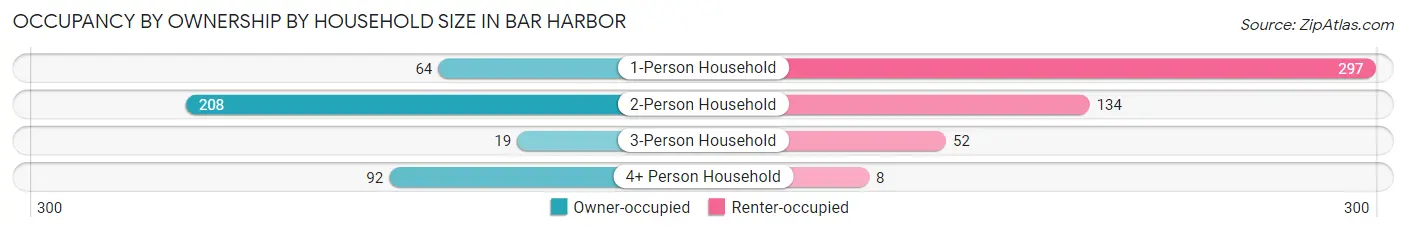
| Household Size | Owner-occupied | Renter-occupied |
| 1-Person Household | 64 (17.7%) | 297 (82.3%) |
| 2-Person Household | 208 (60.8%) | 134 (39.2%) |
| 3-Person Household | 19 (26.8%) | 52 (73.2%) |
| 4+ Person Household | 92 (92.0%) | 8 (8.0%) |
| Total Housing Units | 383 (43.8%) | 491 (56.2%) |
Occupancy by Educational Attainment in Bar Harbor
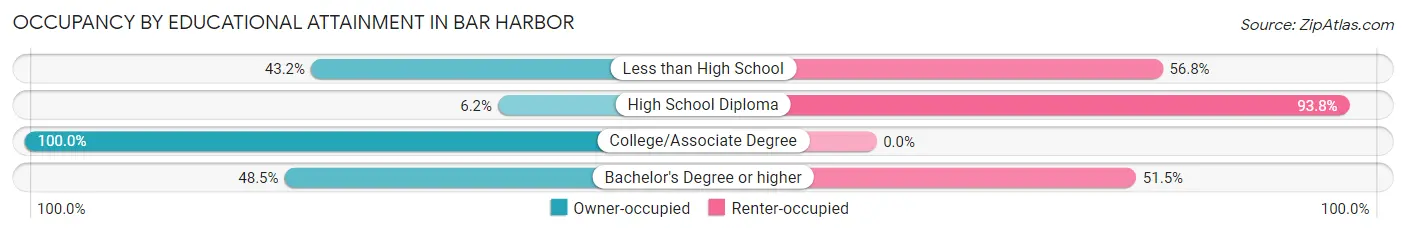
| Household Size | Owner-occupied | Renter-occupied |
| Less than High School | 16 (43.2%) | 21 (56.8%) |
| High School Diploma | 14 (6.2%) | 213 (93.8%) |
| College/Associate Degree | 111 (100.0%) | 0 (0.0%) |
| Bachelor's Degree or higher | 242 (48.5%) | 257 (51.5%) |
Occupancy by Age of Householder in Bar Harbor
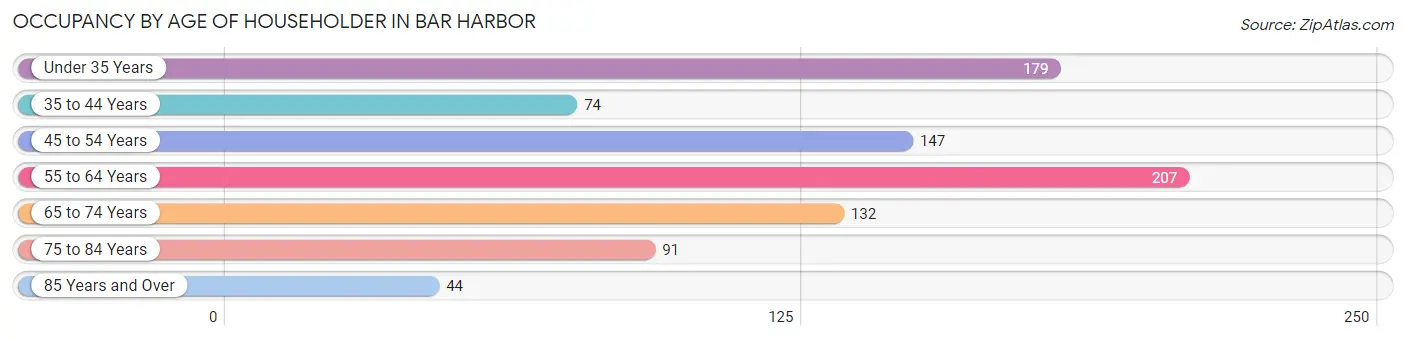
| Age Bracket | # Households | % Households |
| Under 35 Years | 179 | 20.5% |
| 35 to 44 Years | 74 | 8.5% |
| 45 to 54 Years | 147 | 16.8% |
| 55 to 64 Years | 207 | 23.7% |
| 65 to 74 Years | 132 | 15.1% |
| 75 to 84 Years | 91 | 10.4% |
| 85 Years and Over | 44 | 5.0% |
| Total | 874 | 100.0% |
Housing Finances in Bar Harbor
Median Income by Occupancy in Bar Harbor
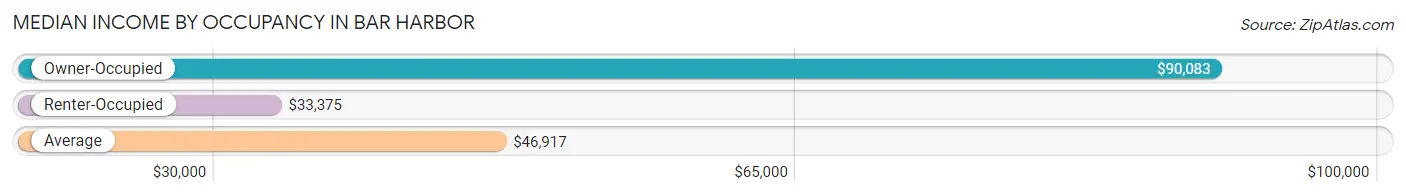
| Occupancy Type | # Households | Median Income |
| Owner-Occupied | 383 (43.8%) | $90,083 |
| Renter-Occupied | 491 (56.2%) | $33,375 |
| Average | 874 (100.0%) | $46,917 |
Occupancy by Householder Income Bracket in Bar Harbor
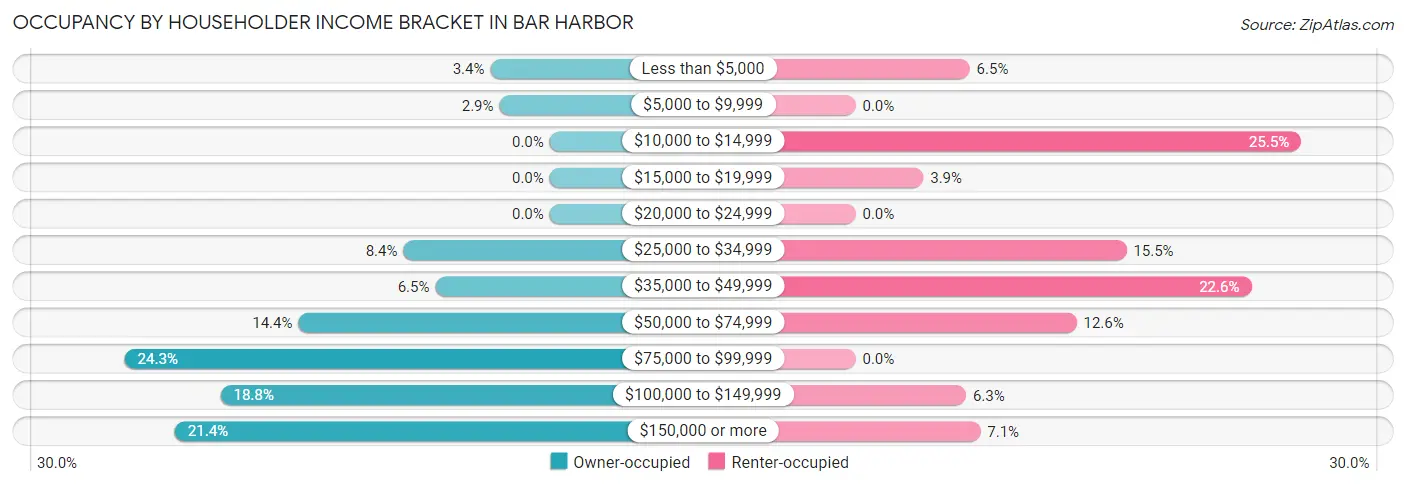
| Income Bracket | Owner-occupied | Renter-occupied |
| Less than $5,000 | 13 (3.4%) | 32 (6.5%) |
| $5,000 to $9,999 | 11 (2.9%) | 0 (0.0%) |
| $10,000 to $14,999 | 0 (0.0%) | 125 (25.5%) |
| $15,000 to $19,999 | 0 (0.0%) | 19 (3.9%) |
| $20,000 to $24,999 | 0 (0.0%) | 0 (0.0%) |
| $25,000 to $34,999 | 32 (8.4%) | 76 (15.5%) |
| $35,000 to $49,999 | 25 (6.5%) | 111 (22.6%) |
| $50,000 to $74,999 | 55 (14.4%) | 62 (12.6%) |
| $75,000 to $99,999 | 93 (24.3%) | 0 (0.0%) |
| $100,000 to $149,999 | 72 (18.8%) | 31 (6.3%) |
| $150,000 or more | 82 (21.4%) | 35 (7.1%) |
| Total | 383 (100.0%) | 491 (100.0%) |
Monthly Housing Cost Tiers in Bar Harbor
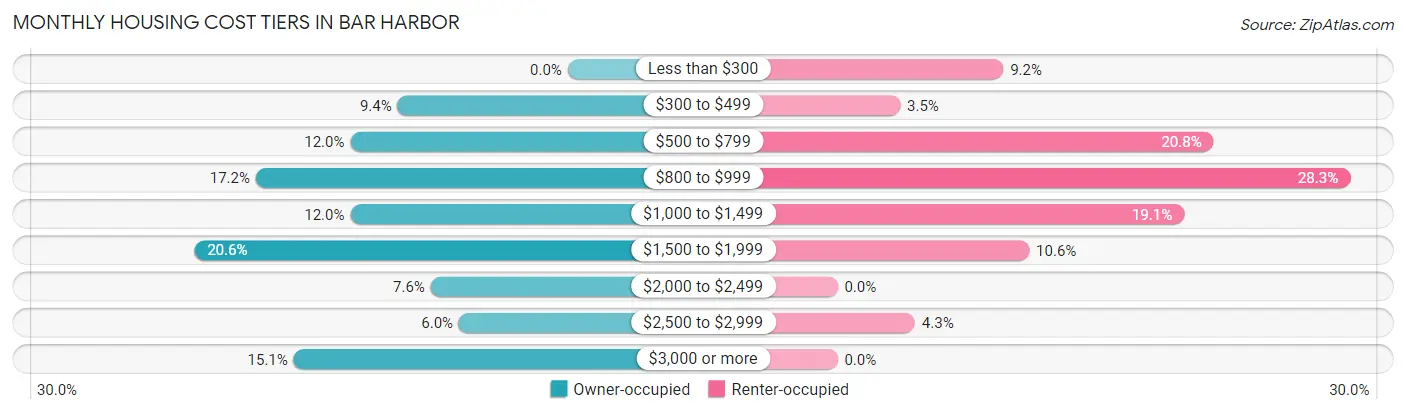
| Monthly Cost | Owner-occupied | Renter-occupied |
| Less than $300 | 0 (0.0%) | 45 (9.2%) |
| $300 to $499 | 36 (9.4%) | 17 (3.5%) |
| $500 to $799 | 46 (12.0%) | 102 (20.8%) |
| $800 to $999 | 66 (17.2%) | 139 (28.3%) |
| $1,000 to $1,499 | 46 (12.0%) | 94 (19.1%) |
| $1,500 to $1,999 | 79 (20.6%) | 52 (10.6%) |
| $2,000 to $2,499 | 29 (7.6%) | 0 (0.0%) |
| $2,500 to $2,999 | 23 (6.0%) | 21 (4.3%) |
| $3,000 or more | 58 (15.1%) | 0 (0.0%) |
| Total | 383 (100.0%) | 491 (100.0%) |
Physical Housing Characteristics in Bar Harbor
Housing Structures in Bar Harbor
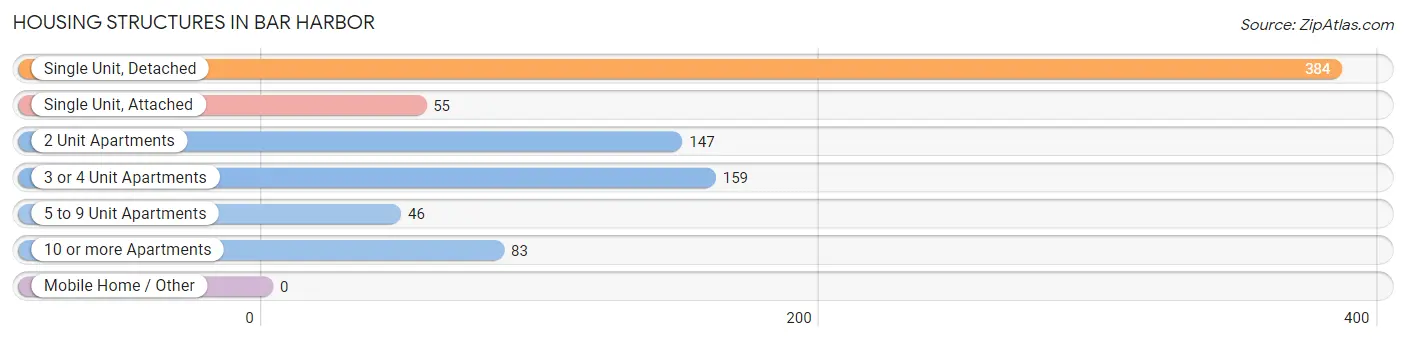
| Structure Type | # Housing Units | % Housing Units |
| Single Unit, Detached | 384 | 43.9% |
| Single Unit, Attached | 55 | 6.3% |
| 2 Unit Apartments | 147 | 16.8% |
| 3 or 4 Unit Apartments | 159 | 18.2% |
| 5 to 9 Unit Apartments | 46 | 5.3% |
| 10 or more Apartments | 83 | 9.5% |
| Mobile Home / Other | 0 | 0.0% |
| Total | 874 | 100.0% |
Housing Structures by Occupancy in Bar Harbor
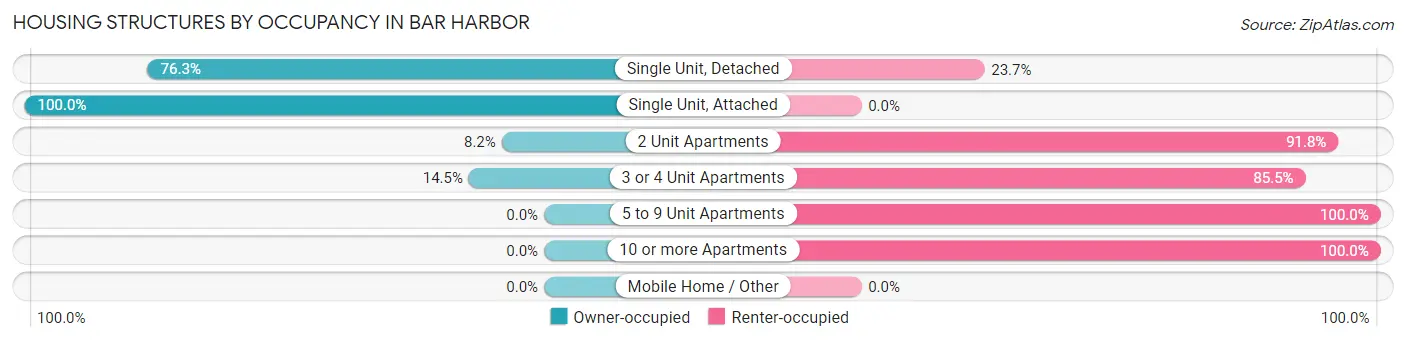
| Structure Type | Owner-occupied | Renter-occupied |
| Single Unit, Detached | 293 (76.3%) | 91 (23.7%) |
| Single Unit, Attached | 55 (100.0%) | 0 (0.0%) |
| 2 Unit Apartments | 12 (8.2%) | 135 (91.8%) |
| 3 or 4 Unit Apartments | 23 (14.5%) | 136 (85.5%) |
| 5 to 9 Unit Apartments | 0 (0.0%) | 46 (100.0%) |
| 10 or more Apartments | 0 (0.0%) | 83 (100.0%) |
| Mobile Home / Other | 0 (0.0%) | 0 (0.0%) |
| Total | 383 (43.8%) | 491 (56.2%) |
Housing Structures by Number of Rooms in Bar Harbor
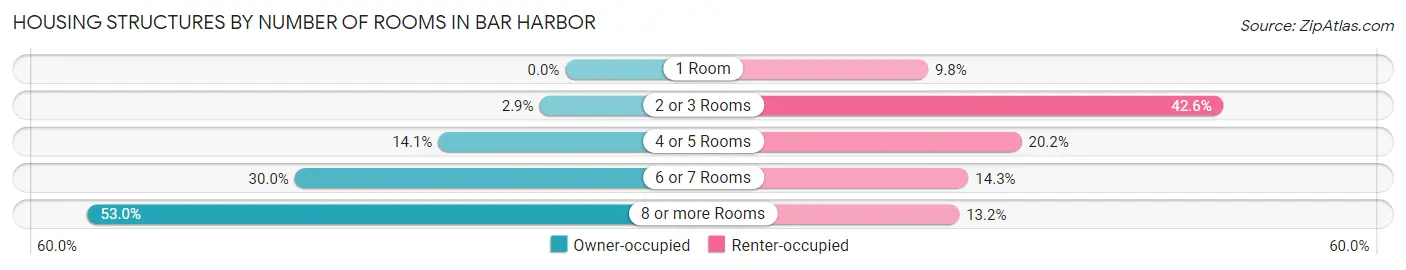
| Number of Rooms | Owner-occupied | Renter-occupied |
| 1 Room | 0 (0.0%) | 48 (9.8%) |
| 2 or 3 Rooms | 11 (2.9%) | 209 (42.6%) |
| 4 or 5 Rooms | 54 (14.1%) | 99 (20.2%) |
| 6 or 7 Rooms | 115 (30.0%) | 70 (14.3%) |
| 8 or more Rooms | 203 (53.0%) | 65 (13.2%) |
| Total | 383 (100.0%) | 491 (100.0%) |
Housing Structure by Heating Type in Bar Harbor
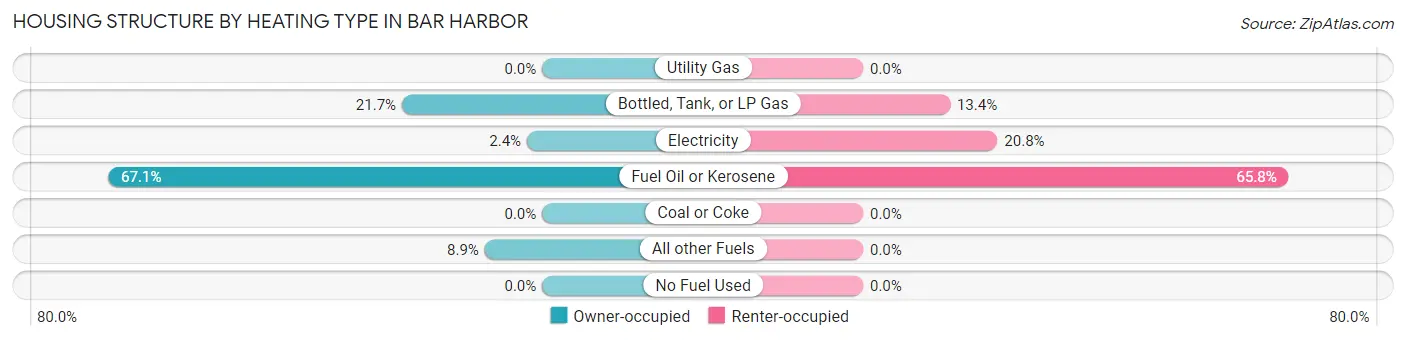
| Heating Type | Owner-occupied | Renter-occupied |
| Utility Gas | 0 (0.0%) | 0 (0.0%) |
| Bottled, Tank, or LP Gas | 83 (21.7%) | 66 (13.4%) |
| Electricity | 9 (2.4%) | 102 (20.8%) |
| Fuel Oil or Kerosene | 257 (67.1%) | 323 (65.8%) |
| Coal or Coke | 0 (0.0%) | 0 (0.0%) |
| All other Fuels | 34 (8.9%) | 0 (0.0%) |
| No Fuel Used | 0 (0.0%) | 0 (0.0%) |
| Total | 383 (100.0%) | 491 (100.0%) |
Household Vehicle Usage in Bar Harbor
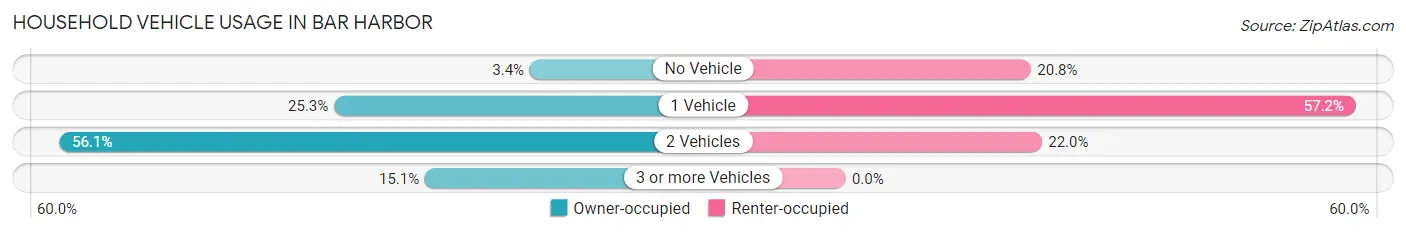
| Vehicles per Household | Owner-occupied | Renter-occupied |
| No Vehicle | 13 (3.4%) | 102 (20.8%) |
| 1 Vehicle | 97 (25.3%) | 281 (57.2%) |
| 2 Vehicles | 215 (56.1%) | 108 (22.0%) |
| 3 or more Vehicles | 58 (15.1%) | 0 (0.0%) |
| Total | 383 (100.0%) | 491 (100.0%) |
Real Estate & Mortgages in Bar Harbor
Real Estate and Mortgage Overview in Bar Harbor
| Characteristic | Without Mortgage | With Mortgage |
| Housing Units | 161 | 222 |
| Median Property Value | $434,700 | $509,100 |
| Median Household Income | $76,193 | $58 |
| Monthly Housing Costs | $841 | $58 |
| Real Estate Taxes | $3,520 | $11 |
Property Value by Mortgage Status in Bar Harbor
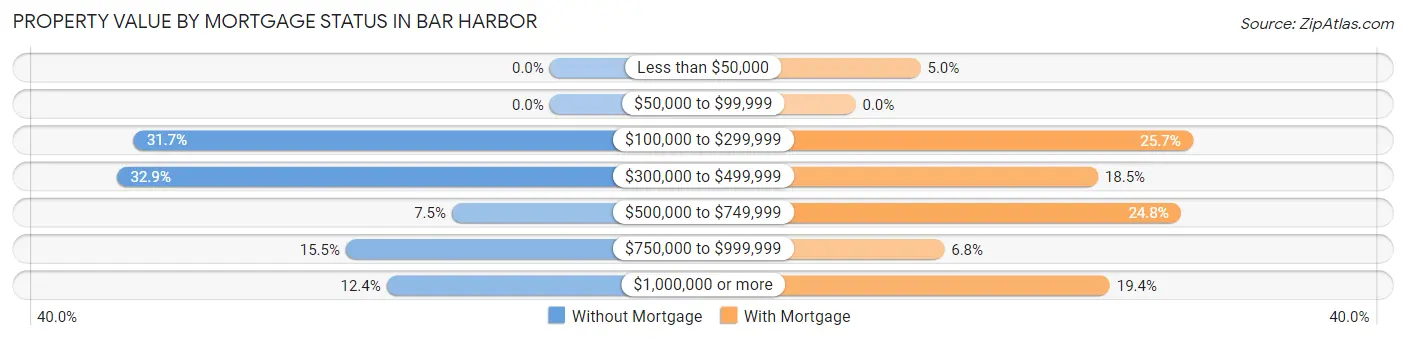
| Property Value | Without Mortgage | With Mortgage |
| Less than $50,000 | 0 (0.0%) | 11 (5.0%) |
| $50,000 to $99,999 | 0 (0.0%) | 0 (0.0%) |
| $100,000 to $299,999 | 51 (31.7%) | 57 (25.7%) |
| $300,000 to $499,999 | 53 (32.9%) | 41 (18.5%) |
| $500,000 to $749,999 | 12 (7.4%) | 55 (24.8%) |
| $750,000 to $999,999 | 25 (15.5%) | 15 (6.8%) |
| $1,000,000 or more | 20 (12.4%) | 43 (19.4%) |
| Total | 161 (100.0%) | 222 (100.0%) |
Household Income by Mortgage Status in Bar Harbor
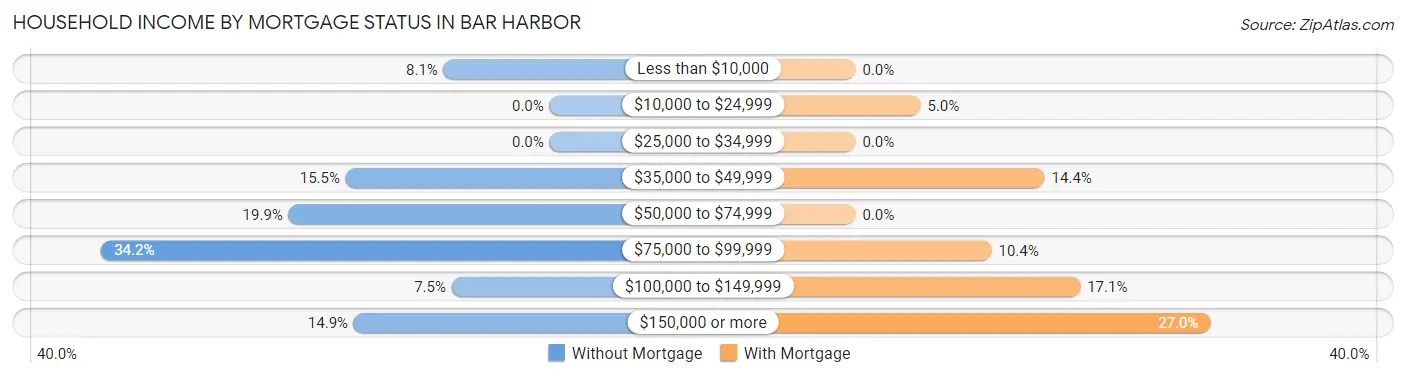
| Household Income | Without Mortgage | With Mortgage |
| Less than $10,000 | 13 (8.1%) | 0 (0.0%) |
| $10,000 to $24,999 | 0 (0.0%) | 11 (5.0%) |
| $25,000 to $34,999 | 0 (0.0%) | 0 (0.0%) |
| $35,000 to $49,999 | 25 (15.5%) | 32 (14.4%) |
| $50,000 to $74,999 | 32 (19.9%) | 0 (0.0%) |
| $75,000 to $99,999 | 55 (34.2%) | 23 (10.4%) |
| $100,000 to $149,999 | 12 (7.4%) | 38 (17.1%) |
| $150,000 or more | 24 (14.9%) | 60 (27.0%) |
| Total | 161 (100.0%) | 222 (100.0%) |
Property Value to Household Income Ratio in Bar Harbor
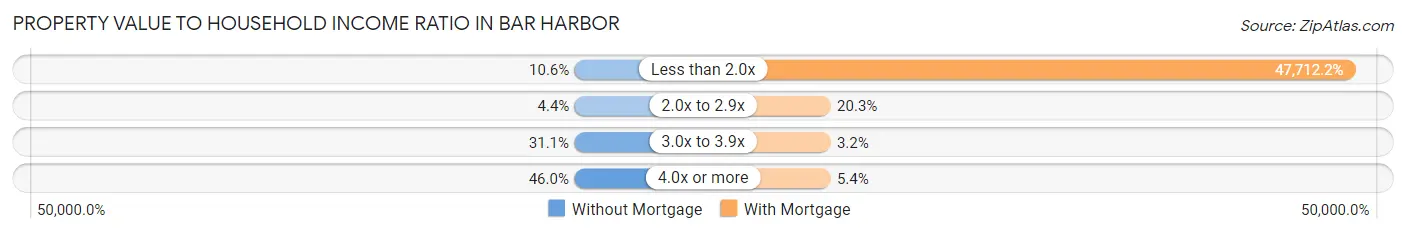
| Value-to-Income Ratio | Without Mortgage | With Mortgage |
| Less than 2.0x | 17 (10.6%) | 105,921 (47,712.2%) |
| 2.0x to 2.9x | 7 (4.3%) | 45 (20.3%) |
| 3.0x to 3.9x | 50 (31.1%) | 7 (3.2%) |
| 4.0x or more | 74 (46.0%) | 12 (5.4%) |
| Total | 161 (100.0%) | 222 (100.0%) |
Real Estate Taxes by Mortgage Status in Bar Harbor
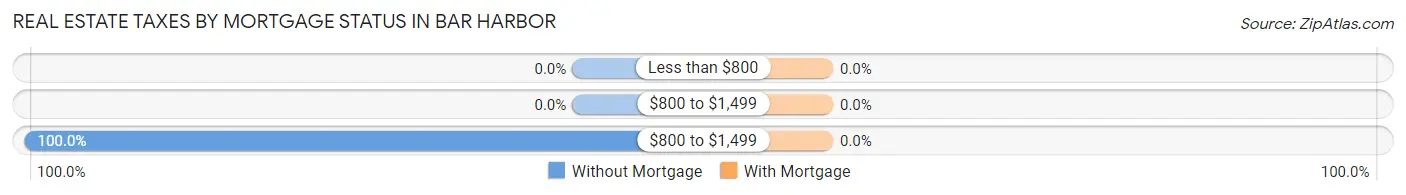
| Property Taxes | Without Mortgage | With Mortgage |
| Less than $800 | 0 (0.0%) | 0 (0.0%) |
| $800 to $1,499 | 0 (0.0%) | 0 (0.0%) |
| $800 to $1,499 | 161 (100.0%) | 0 (0.0%) |
| Total | 161 (100.0%) | 222 (100.0%) |
Health & Disability in Bar Harbor
Health Insurance Coverage by Age in Bar Harbor
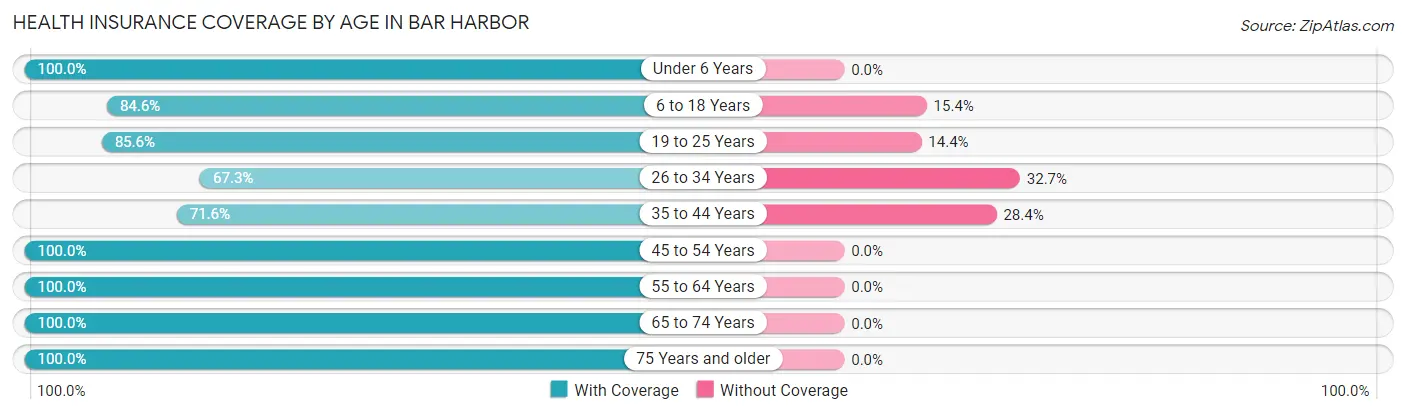
| Age Bracket | With Coverage | Without Coverage |
| Under 6 Years | 44 (100.0%) | 0 (0.0%) |
| 6 to 18 Years | 281 (84.6%) | 51 (15.4%) |
| 19 to 25 Years | 375 (85.6%) | 63 (14.4%) |
| 26 to 34 Years | 152 (67.3%) | 74 (32.7%) |
| 35 to 44 Years | 53 (71.6%) | 21 (28.4%) |
| 45 to 54 Years | 239 (100.0%) | 0 (0.0%) |
| 55 to 64 Years | 387 (100.0%) | 0 (0.0%) |
| 65 to 74 Years | 205 (100.0%) | 0 (0.0%) |
| 75 Years and older | 177 (100.0%) | 0 (0.0%) |
| Total | 1,913 (90.1%) | 209 (9.9%) |
Health Insurance Coverage by Citizenship Status in Bar Harbor
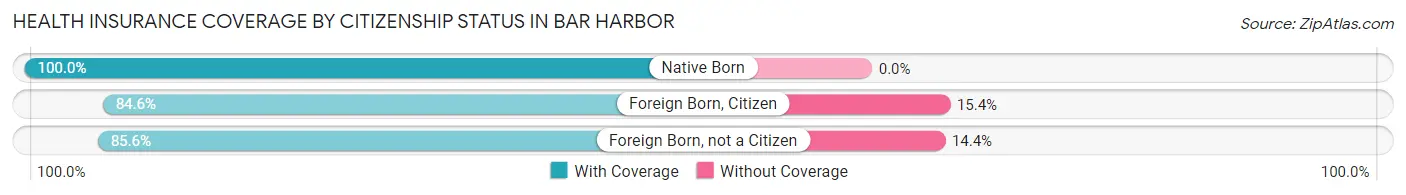
| Citizenship Status | With Coverage | Without Coverage |
| Native Born | 44 (100.0%) | 0 (0.0%) |
| Foreign Born, Citizen | 281 (84.6%) | 51 (15.4%) |
| Foreign Born, not a Citizen | 375 (85.6%) | 63 (14.4%) |
Health Insurance Coverage by Household Income in Bar Harbor
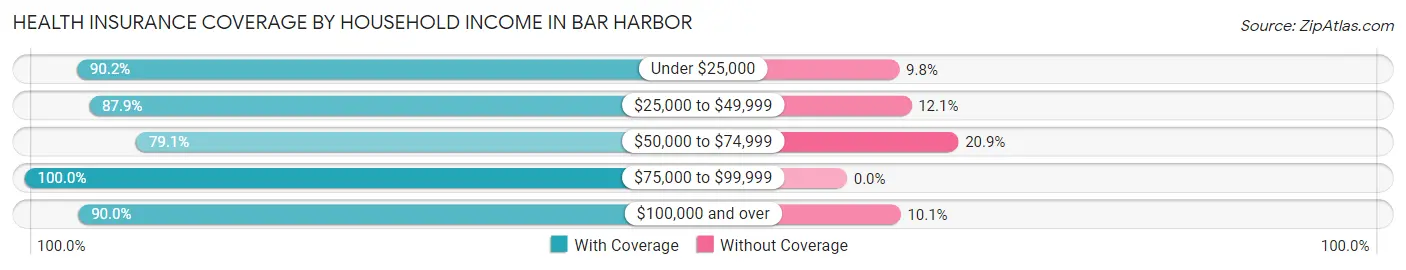
| Household Income | With Coverage | Without Coverage |
| Under $25,000 | 193 (90.2%) | 21 (9.8%) |
| $25,000 to $49,999 | 306 (87.9%) | 42 (12.1%) |
| $50,000 to $74,999 | 273 (79.1%) | 72 (20.9%) |
| $75,000 to $99,999 | 199 (100.0%) | 0 (0.0%) |
| $100,000 and over | 662 (89.9%) | 74 (10.1%) |
Public vs Private Health Insurance Coverage by Age in Bar Harbor
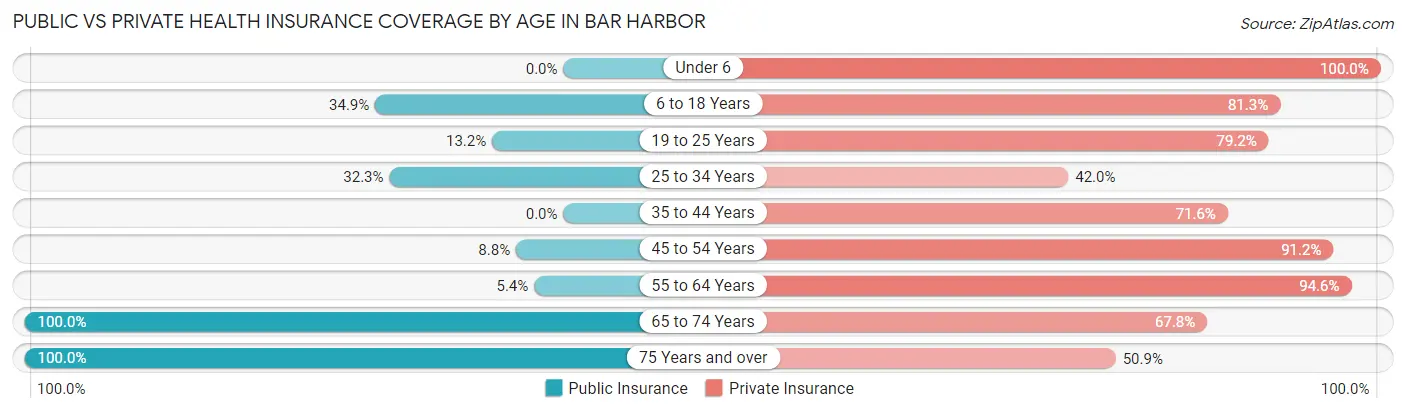
| Age Bracket | Public Insurance | Private Insurance |
| Under 6 | 0 (0.0%) | 44 (100.0%) |
| 6 to 18 Years | 116 (34.9%) | 270 (81.3%) |
| 19 to 25 Years | 58 (13.2%) | 347 (79.2%) |
| 25 to 34 Years | 73 (32.3%) | 95 (42.0%) |
| 35 to 44 Years | 0 (0.0%) | 53 (71.6%) |
| 45 to 54 Years | 21 (8.8%) | 218 (91.2%) |
| 55 to 64 Years | 21 (5.4%) | 366 (94.6%) |
| 65 to 74 Years | 205 (100.0%) | 139 (67.8%) |
| 75 Years and over | 177 (100.0%) | 90 (50.8%) |
| Total | 671 (31.6%) | 1,622 (76.4%) |
Disability Status by Sex by Age in Bar Harbor
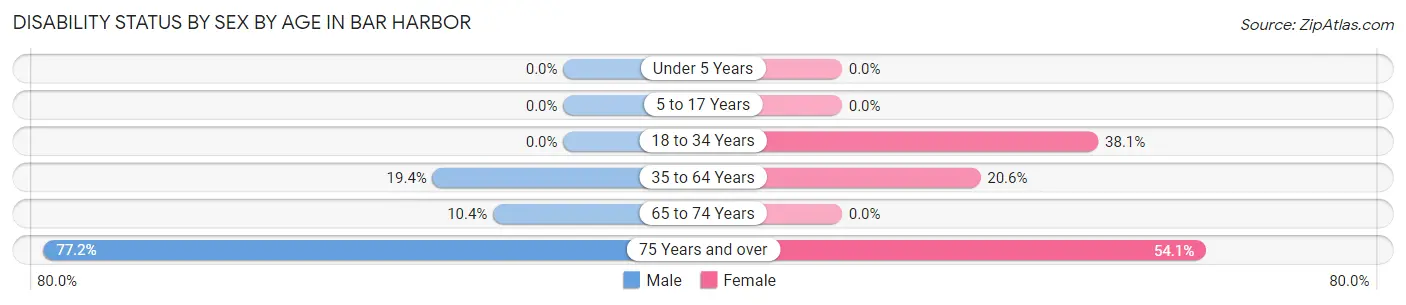
| Age Bracket | Male | Female |
| Under 5 Years | 0 (0.0%) | 0 (0.0%) |
| 5 to 17 Years | 0 (0.0%) | 0 (0.0%) |
| 18 to 34 Years | 0 (0.0%) | 110 (38.1%) |
| 35 to 64 Years | 66 (19.4%) | 74 (20.6%) |
| 65 to 74 Years | 10 (10.4%) | 0 (0.0%) |
| 75 Years and over | 61 (77.2%) | 53 (54.1%) |
Disability Class by Sex by Age in Bar Harbor
Disability Class: Hearing Difficulty
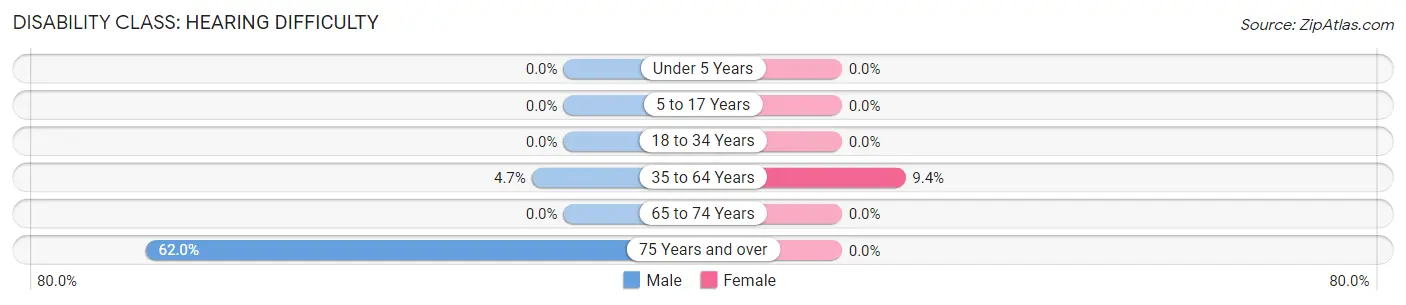
| Age Bracket | Male | Female |
| Under 5 Years | 0 (0.0%) | 0 (0.0%) |
| 5 to 17 Years | 0 (0.0%) | 0 (0.0%) |
| 18 to 34 Years | 0 (0.0%) | 0 (0.0%) |
| 35 to 64 Years | 16 (4.7%) | 34 (9.4%) |
| 65 to 74 Years | 0 (0.0%) | 0 (0.0%) |
| 75 Years and over | 49 (62.0%) | 0 (0.0%) |
Disability Class: Vision Difficulty
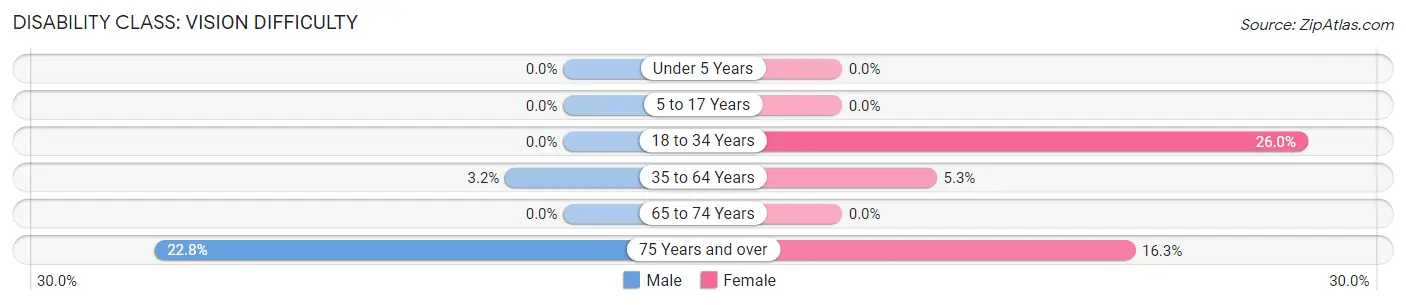
| Age Bracket | Male | Female |
| Under 5 Years | 0 (0.0%) | 0 (0.0%) |
| 5 to 17 Years | 0 (0.0%) | 0 (0.0%) |
| 18 to 34 Years | 0 (0.0%) | 75 (26.0%) |
| 35 to 64 Years | 11 (3.2%) | 19 (5.3%) |
| 65 to 74 Years | 0 (0.0%) | 0 (0.0%) |
| 75 Years and over | 18 (22.8%) | 16 (16.3%) |
Disability Class: Cognitive Difficulty
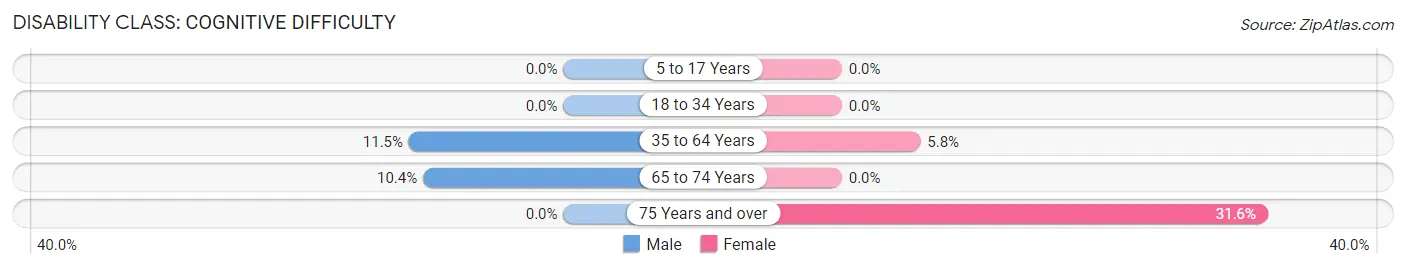
| Age Bracket | Male | Female |
| 5 to 17 Years | 0 (0.0%) | 0 (0.0%) |
| 18 to 34 Years | 0 (0.0%) | 0 (0.0%) |
| 35 to 64 Years | 39 (11.5%) | 21 (5.8%) |
| 65 to 74 Years | 10 (10.4%) | 0 (0.0%) |
| 75 Years and over | 0 (0.0%) | 31 (31.6%) |
Disability Class: Ambulatory Difficulty
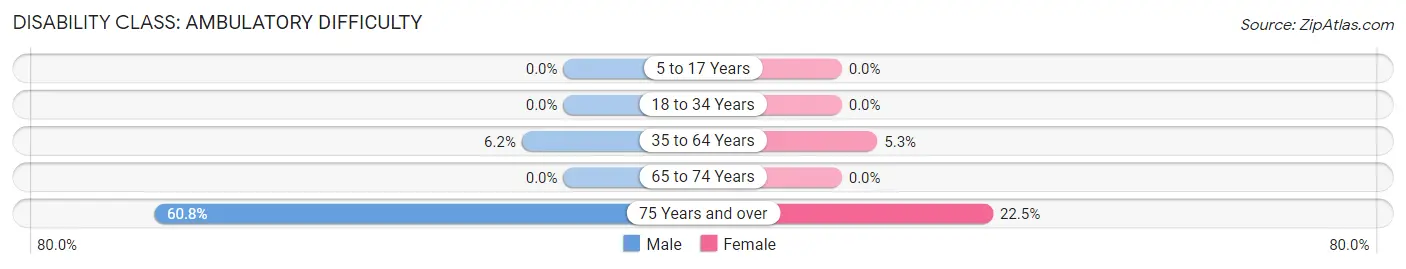
| Age Bracket | Male | Female |
| 5 to 17 Years | 0 (0.0%) | 0 (0.0%) |
| 18 to 34 Years | 0 (0.0%) | 0 (0.0%) |
| 35 to 64 Years | 21 (6.2%) | 19 (5.3%) |
| 65 to 74 Years | 0 (0.0%) | 0 (0.0%) |
| 75 Years and over | 48 (60.8%) | 22 (22.5%) |
Disability Class: Self-Care Difficulty
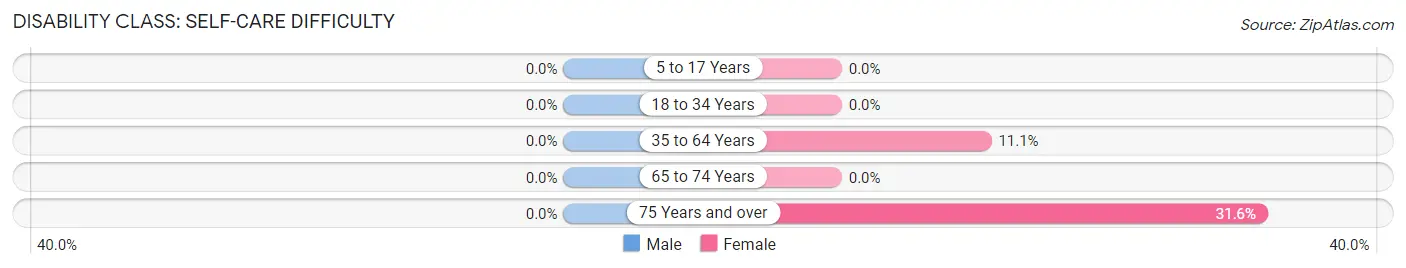
| Age Bracket | Male | Female |
| 5 to 17 Years | 0 (0.0%) | 0 (0.0%) |
| 18 to 34 Years | 0 (0.0%) | 0 (0.0%) |
| 35 to 64 Years | 0 (0.0%) | 40 (11.1%) |
| 65 to 74 Years | 0 (0.0%) | 0 (0.0%) |
| 75 Years and over | 0 (0.0%) | 31 (31.6%) |
Technology Access in Bar Harbor
Computing Device Access in Bar Harbor
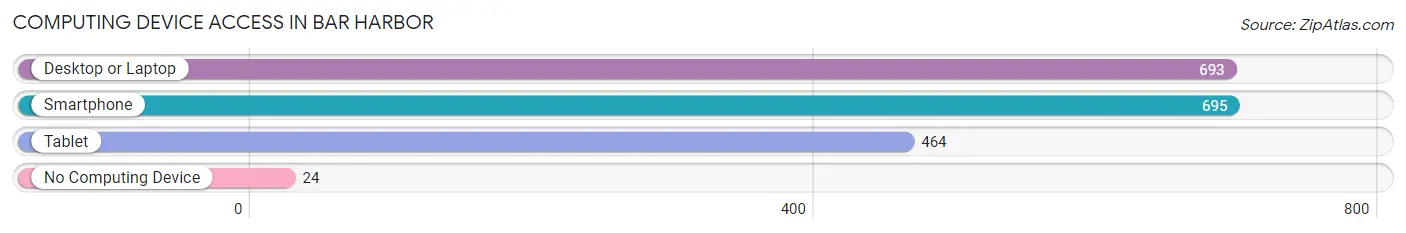
| Device Type | # Households | % Households |
| Desktop or Laptop | 693 | 79.3% |
| Smartphone | 695 | 79.5% |
| Tablet | 464 | 53.1% |
| No Computing Device | 24 | 2.8% |
| Total | 874 | 100.0% |
Internet Access in Bar Harbor
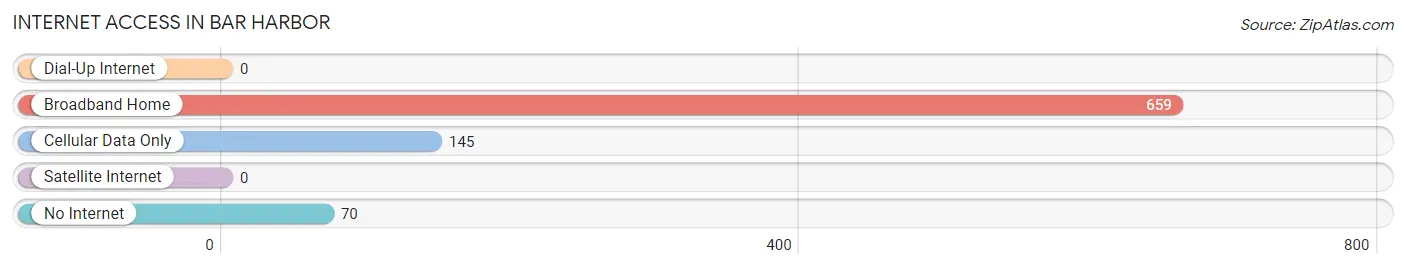
| Internet Type | # Households | % Households |
| Dial-Up Internet | 0 | 0.0% |
| Broadband Home | 659 | 75.4% |
| Cellular Data Only | 145 | 16.6% |
| Satellite Internet | 0 | 0.0% |
| No Internet | 70 | 8.0% |
| Total | 874 | 100.0% |
Bar Harbor Summary
Bar Harbor, Maine is a small town located on the eastern coast of the United States. It is situated on Mount Desert Island, which is part of the larger Acadia National Park. The town has a population of 5,235 people as of the 2010 census.
History
Bar Harbor was first settled in 1763 by a group of French-Canadian fishermen. The town was originally called Eden, but was later renamed Bar Harbor in 1796. The name was derived from the sandbar that formed at the mouth of the harbor. The town quickly grew in popularity as a summer resort destination for wealthy families from the Northeast.
In the late 19th century, Bar Harbor became a popular destination for wealthy families from the Northeast. The town was home to many grand hotels and resorts, including the Bar Harbor Hotel, the Bar Harbor Inn, and the Asticou Inn. The town also became a popular destination for artists, writers, and musicians.
In 1947, a large fire destroyed much of the town. The fire was started by a spark from a passing train and quickly spread throughout the town. The fire destroyed over 1,000 buildings and left many of the town's residents homeless.
Geography
Bar Harbor is located on the eastern coast of the United States, on Mount Desert Island. The town is situated on the western side of the island, near the entrance to Frenchman Bay. The town is surrounded by Acadia National Park, which covers much of the island. The town is located approximately 75 miles northeast of Portland, Maine.
The town has a total area of 8.3 square miles, of which 7.9 square miles is land and 0.4 square miles is water. The town is located on a peninsula, with the harbor to the east and the Atlantic Ocean to the south.
Economy
Bar Harbor's economy is largely based on tourism. The town is a popular destination for visitors from all over the world. The town is home to many hotels, restaurants, and shops, as well as a variety of outdoor activities. The town is also home to the College of the Atlantic, which is a private liberal arts college.
Demographics
As of the 2010 census, the town had a population of 5,235 people. The racial makeup of the town was 95.3% White, 0.7% African American, 0.3% Native American, 1.2% Asian, 0.1% Pacific Islander, 0.7% from other races, and 1.9% from two or more races. Hispanic or Latino of any race were 2.2% of the population.
The median income for a household in the town was $45,938, and the median income for a family was $58,958. The per capita income for the town was $30,945. About 8.2% of families and 11.3% of the population were below the poverty line, including 16.2% of those under age 18 and 5.2% of those age 65 or over.
Common Questions
What is Per Capita Income in Bar Harbor?
Per Capita income in Bar Harbor is $33,268.
What is the Median Family Income in Bar Harbor?
Median Family Income in Bar Harbor is $77,443.
What is the Median Household income in Bar Harbor?
Median Household Income in Bar Harbor is $46,917.
What is Income or Wage Gap in Bar Harbor?
Income or Wage Gap in Bar Harbor is 26.7%.
Women in Bar Harbor earn 73.3 cents for every dollar earned by a man.
What is Inequality or Gini Index in Bar Harbor?
Inequality or Gini Index in Bar Harbor is 0.52.
What is the Total Population of Bar Harbor?
Total Population of Bar Harbor is 2,154.
What is the Total Male Population of Bar Harbor?
Total Male Population of Bar Harbor is 1,158.
What is the Total Female Population of Bar Harbor?
Total Female Population of Bar Harbor is 996.
What is the Ratio of Males per 100 Females in Bar Harbor?
There are 116.27 Males per 100 Females in Bar Harbor.
What is the Ratio of Females per 100 Males in Bar Harbor?
There are 86.01 Females per 100 Males in Bar Harbor.
What is the Median Population Age in Bar Harbor?
Median Population Age in Bar Harbor is 39.2 Years.
What is the Average Family Size in Bar Harbor
Average Family Size in Bar Harbor is 2.8 People.
What is the Average Household Size in Bar Harbor
Average Household Size in Bar Harbor is 2.1 People.
How Large is the Labor Force in Bar Harbor?
There are 1,177 People in the Labor Forcein in Bar Harbor.
What is the Percentage of People in the Labor Force in Bar Harbor?
62.9% of People are in the Labor Force in Bar Harbor.
What is the Unemployment Rate in Bar Harbor?
Unemployment Rate in Bar Harbor is 10.6%.