Houlton, ME Map & Demographics
Houlton Map
Houlton Overview
$30,459
PER CAPITA INCOME
$97,594
AVG FAMILY INCOME
$50,625
AVG HOUSEHOLD INCOME
46.8%
WAGE / INCOME GAP [ % ]
53.2¢/ $1
WAGE / INCOME GAP [ $ ]
0.49
INEQUALITY / GINI INDEX
4,918
TOTAL POPULATION
2,402
MALE POPULATION
2,516
FEMALE POPULATION
95.47
MALES / 100 FEMALES
104.75
FEMALES / 100 MALES
44.2
MEDIAN AGE
3.3
AVG FAMILY SIZE
2.2
AVG HOUSEHOLD SIZE
2,358
LABOR FORCE [ PEOPLE ]
58.3%
PERCENT IN LABOR FORCE
18.6%
UNEMPLOYMENT RATE
Houlton Zip Codes
Houlton Area Codes
Income in Houlton
Income Overview in Houlton
Per Capita Income in Houlton is $30,459, while median incomes of families and households are $97,594 and $50,625 respectively.
| Characteristic | Number | Measure |
| Per Capita Income | 4,918 | $30,459 |
| Median Family Income | 1,007 | $97,594 |
| Mean Family Income | 1,007 | $111,146 |
| Median Household Income | 2,034 | $50,625 |
| Mean Household Income | 2,034 | $73,678 |
| Income Deficit | 1,007 | $0 |
| Wage / Income Gap (%) | 4,918 | 46.81% |
| Wage / Income Gap ($) | 4,918 | 53.19¢ per $1 |
| Gini / Inequality Index | 4,918 | 0.49 |
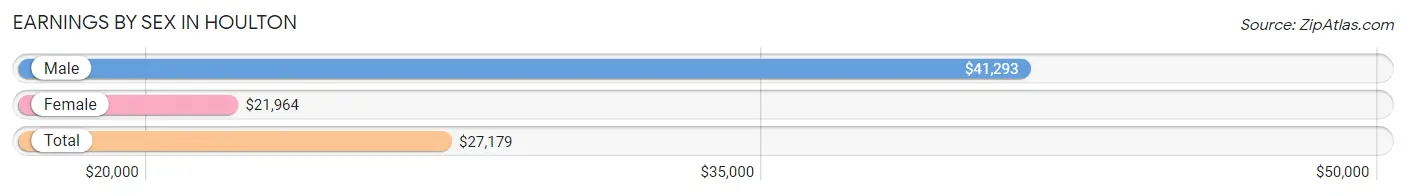
Earnings by Sex in Houlton
Average Earnings in Houlton are $27,179, $41,293 for men and $21,964 for women, a difference of 46.8%.
| Sex | Number | Average Earnings |
| Male | 1,270 (52.2%) | $41,293 |
| Female | 1,162 (47.8%) | $21,964 |
| Total | 2,432 (100.0%) | $27,179 |
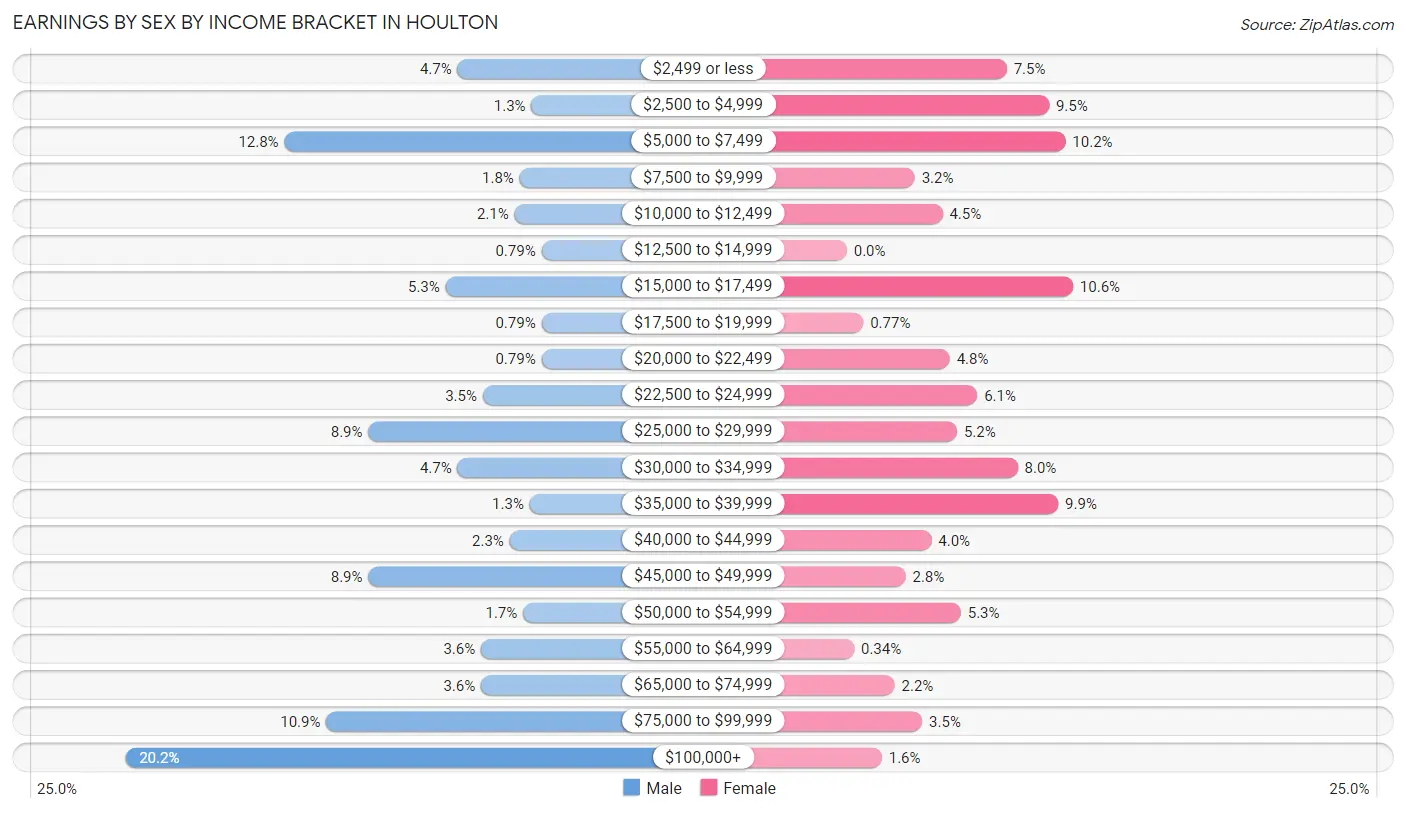
Earnings by Sex by Income Bracket in Houlton
The most common earnings brackets in Houlton are $100,000+ for men (257 | 20.2%) and $15,000 to $17,499 for women (123 | 10.6%).
| Income | Male | Female |
| $2,499 or less | 60 (4.7%) | 87 (7.5%) |
| $2,500 to $4,999 | 16 (1.3%) | 110 (9.5%) |
| $5,000 to $7,499 | 163 (12.8%) | 119 (10.2%) |
| $7,500 to $9,999 | 23 (1.8%) | 37 (3.2%) |
| $10,000 to $12,499 | 26 (2.1%) | 52 (4.5%) |
| $12,500 to $14,999 | 10 (0.8%) | 0 (0.0%) |
| $15,000 to $17,499 | 67 (5.3%) | 123 (10.6%) |
| $17,500 to $19,999 | 10 (0.8%) | 9 (0.8%) |
| $20,000 to $22,499 | 10 (0.8%) | 56 (4.8%) |
| $22,500 to $24,999 | 45 (3.5%) | 71 (6.1%) |
| $25,000 to $29,999 | 113 (8.9%) | 60 (5.2%) |
| $30,000 to $34,999 | 60 (4.7%) | 93 (8.0%) |
| $35,000 to $39,999 | 17 (1.3%) | 115 (9.9%) |
| $40,000 to $44,999 | 29 (2.3%) | 46 (4.0%) |
| $45,000 to $49,999 | 113 (8.9%) | 32 (2.8%) |
| $50,000 to $54,999 | 21 (1.7%) | 62 (5.3%) |
| $55,000 to $64,999 | 46 (3.6%) | 4 (0.3%) |
| $65,000 to $74,999 | 46 (3.6%) | 26 (2.2%) |
| $75,000 to $99,999 | 138 (10.9%) | 41 (3.5%) |
| $100,000+ | 257 (20.2%) | 19 (1.6%) |
| Total | 1,270 (100.0%) | 1,162 (100.0%) |
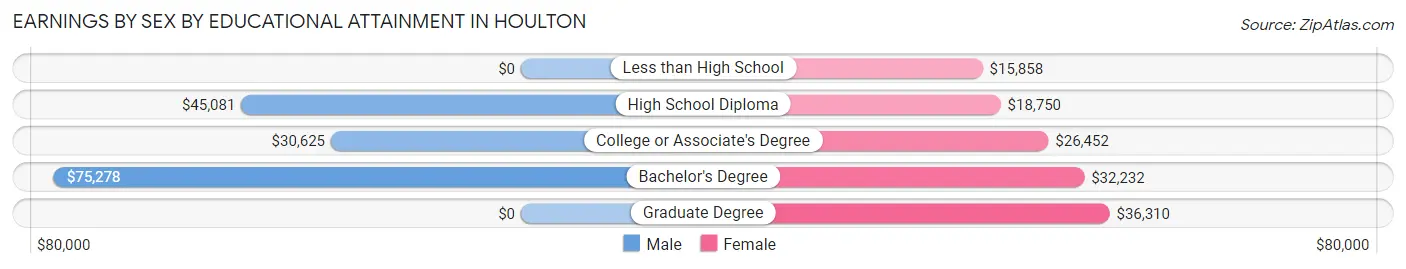
Earnings by Sex by Educational Attainment in Houlton
Average earnings in Houlton are $52,188 for men and $23,528 for women, a difference of 54.9%. Men with an educational attainment of bachelor's degree enjoy the highest average annual earnings of $75,278, while those with college or associate's degree education earn the least with $30,625. Women with an educational attainment of graduate degree earn the most with the average annual earnings of $36,310, while those with less than high school education have the smallest earnings of $15,858.
| Educational Attainment | Male Income | Female Income |
| Less than High School | - | - |
| High School Diploma | $45,081 | $18,750 |
| College or Associate's Degree | $30,625 | $26,452 |
| Bachelor's Degree | $75,278 | $32,232 |
| Graduate Degree | - | - |
| Total | $52,188 | $23,528 |
Family Income in Houlton
Family Income Brackets in Houlton
According to the Houlton family income data, there are 258 families falling into the $100,000 to $149,999 income range, which is the most common income bracket and makes up 25.6% of all families.
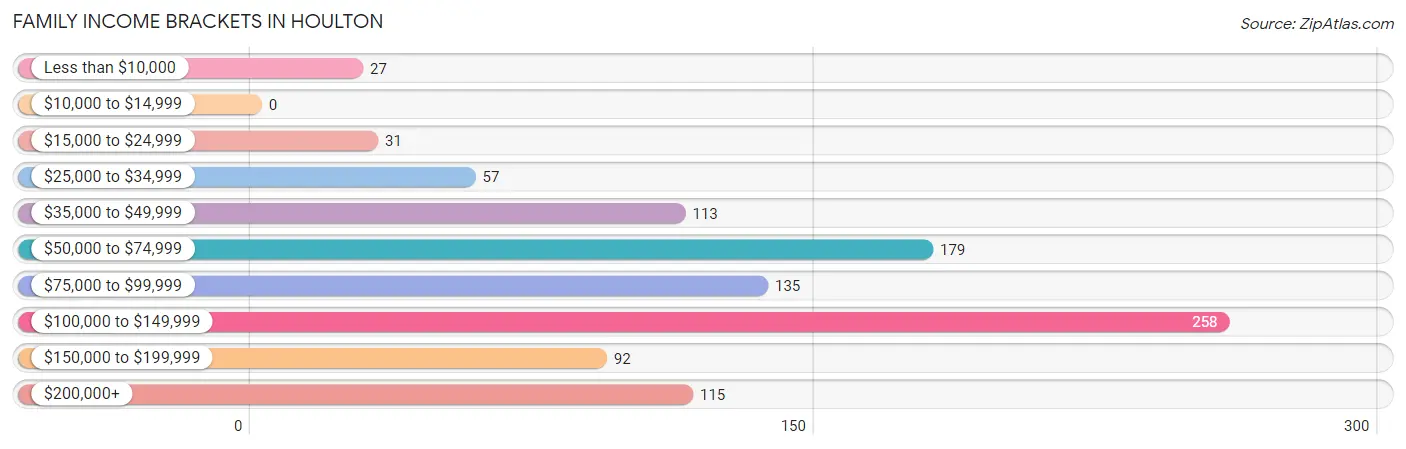
| Income Bracket | # Families | % Families |
| Less than $10,000 | 27 | 2.7% |
| $10,000 to $14,999 | 0 | 0.0% |
| $15,000 to $24,999 | 31 | 3.1% |
| $25,000 to $34,999 | 57 | 5.7% |
| $35,000 to $49,999 | 113 | 11.2% |
| $50,000 to $74,999 | 179 | 17.8% |
| $75,000 to $99,999 | 135 | 13.4% |
| $100,000 to $149,999 | 258 | 25.6% |
| $150,000 to $199,999 | 92 | 9.1% |
| $200,000+ | 115 | 11.4% |
Family Income by Famaliy Size in Houlton
5-person families (201 | 20.0%) account for the highest median family income in Houlton with $150,919 per family, while 2-person families (346 | 34.4%) have the highest median income of $30,972 per family member.
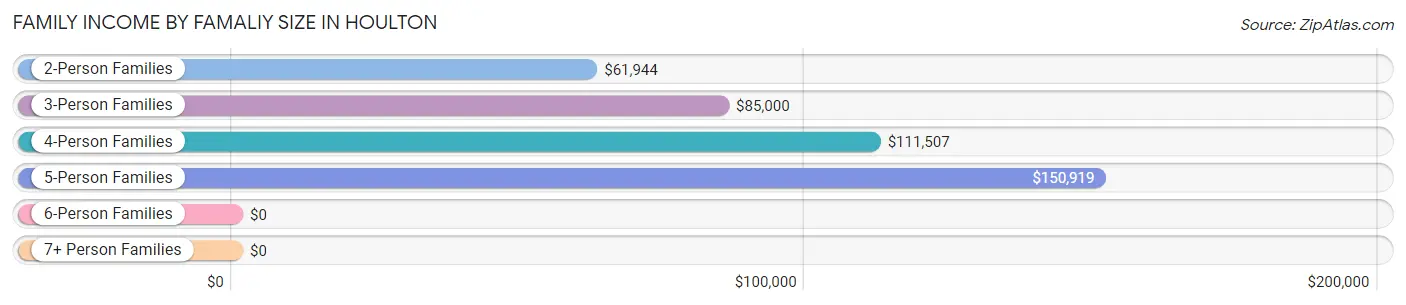
| Income Bracket | # Families | Median Income |
| 2-Person Families | 346 (34.4%) | $61,944 |
| 3-Person Families | 142 (14.1%) | $85,000 |
| 4-Person Families | 243 (24.1%) | $111,507 |
| 5-Person Families | 201 (20.0%) | $150,919 |
| 6-Person Families | 34 (3.4%) | $0 |
| 7+ Person Families | 41 (4.1%) | $0 |
| Total | 1,007 (100.0%) | $97,594 |
Family Income by Number of Earners in Houlton
The median family income in Houlton is $97,594, with families comprising 3+ earners (364) having the highest median family income of $111,887, while families with no earners (170) have the lowest median family income of $36,250, accounting for 36.1% and 16.9% of families, respectively.
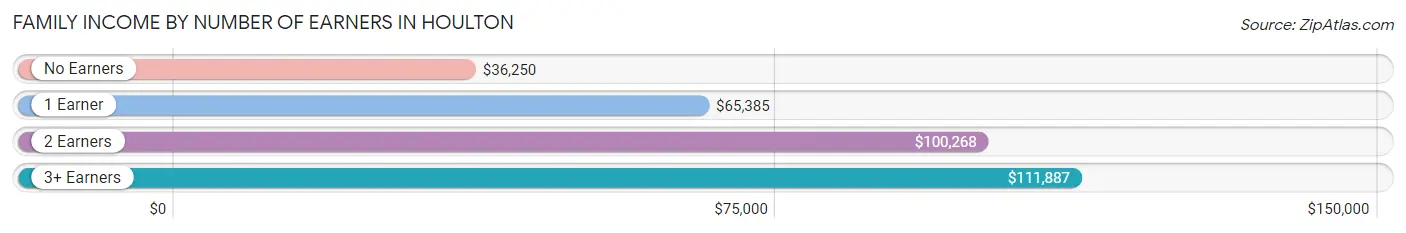
| Number of Earners | # Families | Median Income |
| No Earners | 170 (16.9%) | $36,250 |
| 1 Earner | 190 (18.9%) | $65,385 |
| 2 Earners | 283 (28.1%) | $100,268 |
| 3+ Earners | 364 (36.1%) | $111,887 |
| Total | 1,007 (100.0%) | $97,594 |
Household Income in Houlton
Household Income Brackets in Houlton
With 336 households falling in the category, the $100,000 to $149,999 income range is the most frequent in Houlton, accounting for 16.5% of all households. In contrast, only 104 households (5.1%) fall into the $150,000 to $199,999 income bracket, making it the least populous group.
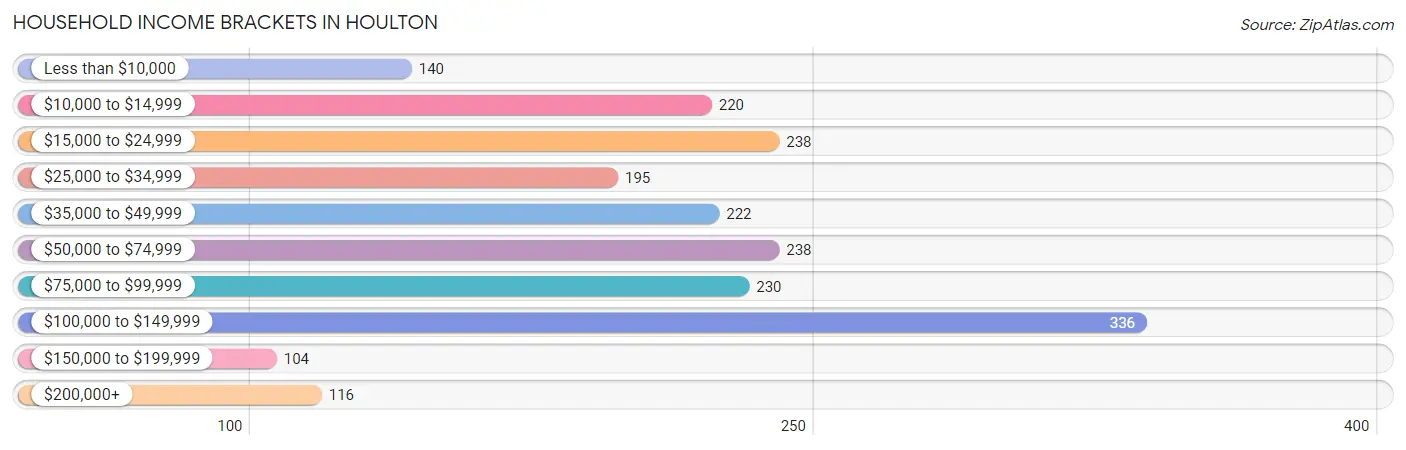
| Income Bracket | # Households | % Households |
| Less than $10,000 | 140 | 6.9% |
| $10,000 to $14,999 | 220 | 10.8% |
| $15,000 to $24,999 | 238 | 11.7% |
| $25,000 to $34,999 | 195 | 9.6% |
| $35,000 to $49,999 | 222 | 10.9% |
| $50,000 to $74,999 | 238 | 11.7% |
| $75,000 to $99,999 | 230 | 11.3% |
| $100,000 to $149,999 | 336 | 16.5% |
| $150,000 to $199,999 | 104 | 5.1% |
| $200,000+ | 116 | 5.7% |
Household Income by Householder Age in Houlton
The median household income in Houlton is $50,625, with the highest median household income of $118,068 found in the 25 to 44 years age bracket for the primary householder. A total of 401 households (19.7%) fall into this category. Meanwhile, the 65+ years age bracket for the primary householder has the lowest median household income of $26,458, with 718 households (35.3%) in this group.
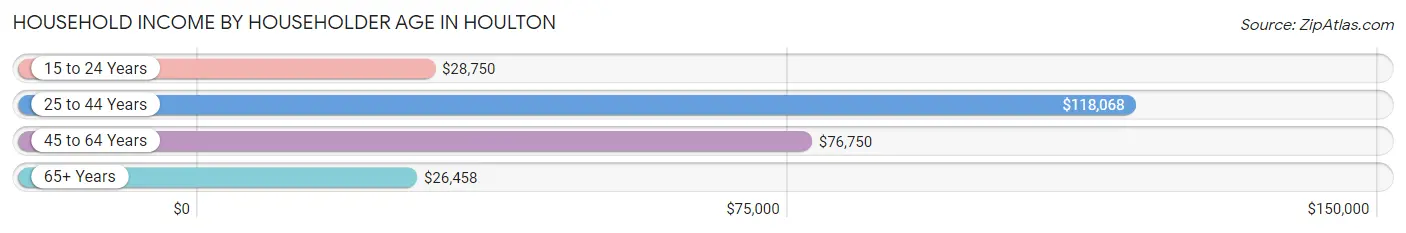
| Income Bracket | # Households | Median Income |
| 15 to 24 Years | 166 (8.2%) | $28,750 |
| 25 to 44 Years | 401 (19.7%) | $118,068 |
| 45 to 64 Years | 749 (36.8%) | $76,750 |
| 65+ Years | 718 (35.3%) | $26,458 |
| Total | 2,034 (100.0%) | $50,625 |
Poverty in Houlton
Income Below Poverty by Sex and Age in Houlton
With 14.1% poverty level for males and 28.5% for females among the residents of Houlton, 6 to 11 year old males and 12 to 14 year old females are the most vulnerable to poverty, with 96 males (41.0%) and 105 females (72.9%) in their respective age groups living below the poverty level.
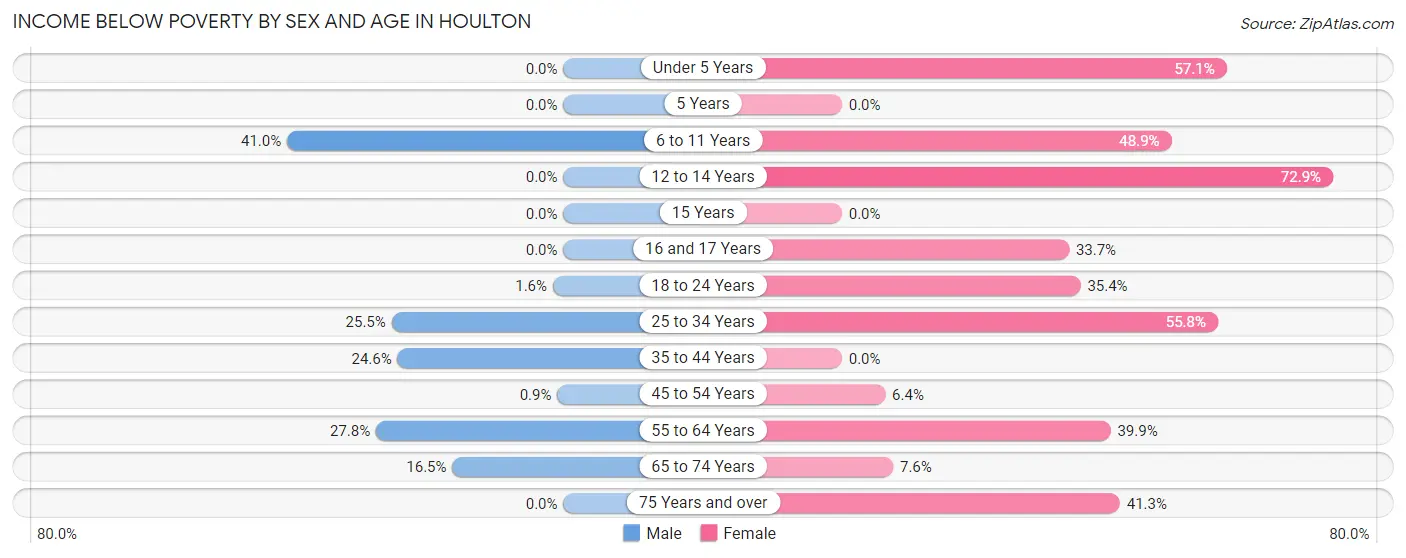
| Age Bracket | Male | Female |
| Under 5 Years | 0 (0.0%) | 36 (57.1%) |
| 5 Years | 0 (0.0%) | 0 (0.0%) |
| 6 to 11 Years | 96 (41.0%) | 69 (48.9%) |
| 12 to 14 Years | 0 (0.0%) | 105 (72.9%) |
| 15 Years | 0 (0.0%) | 0 (0.0%) |
| 16 and 17 Years | 0 (0.0%) | 28 (33.7%) |
| 18 to 24 Years | 5 (1.6%) | 73 (35.4%) |
| 25 to 34 Years | 51 (25.5%) | 115 (55.8%) |
| 35 to 44 Years | 80 (24.6%) | 0 (0.0%) |
| 45 to 54 Years | 3 (0.9%) | 30 (6.4%) |
| 55 to 64 Years | 42 (27.8%) | 81 (39.9%) |
| 65 to 74 Years | 43 (16.5%) | 21 (7.6%) |
| 75 Years and over | 0 (0.0%) | 97 (41.3%) |
| Total | 320 (14.1%) | 655 (28.5%) |
Income Above Poverty by Sex and Age in Houlton
According to the poverty statistics in Houlton, males aged under 5 years and females aged 15 years are the age groups that are most secure financially, with 100.0% of males and 100.0% of females in these age groups living above the poverty line.
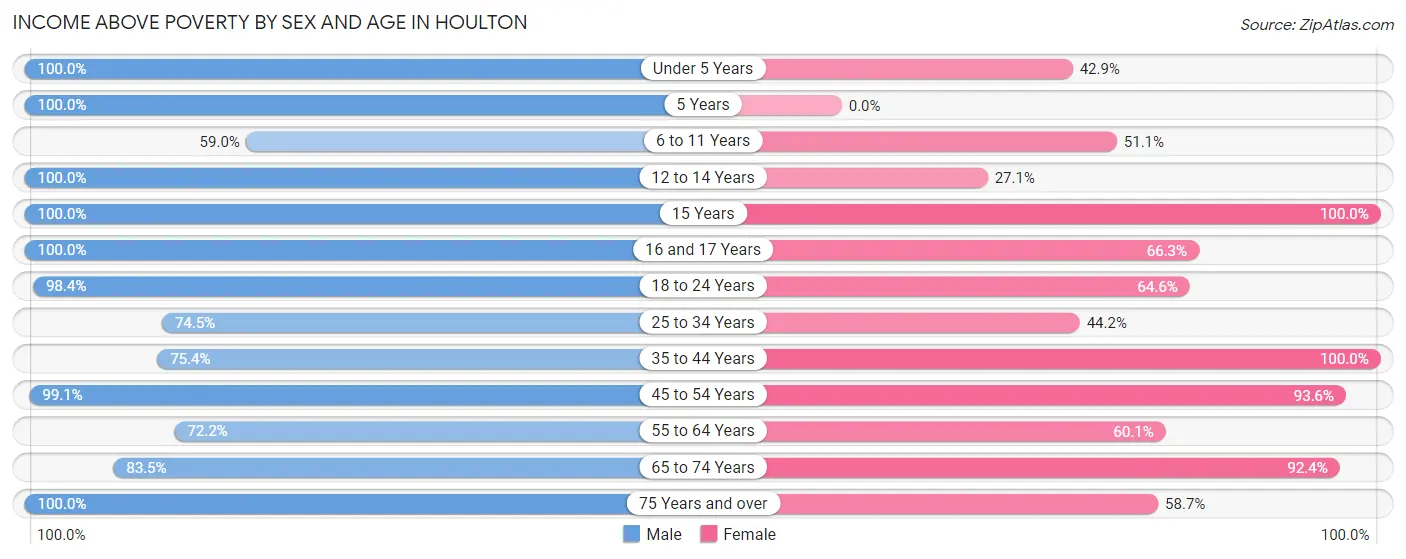
| Age Bracket | Male | Female |
| Under 5 Years | 98 (100.0%) | 27 (42.9%) |
| 5 Years | 14 (100.0%) | 0 (0.0%) |
| 6 to 11 Years | 138 (59.0%) | 72 (51.1%) |
| 12 to 14 Years | 107 (100.0%) | 39 (27.1%) |
| 15 Years | 18 (100.0%) | 54 (100.0%) |
| 16 and 17 Years | 50 (100.0%) | 55 (66.3%) |
| 18 to 24 Years | 316 (98.4%) | 133 (64.6%) |
| 25 to 34 Years | 149 (74.5%) | 91 (44.2%) |
| 35 to 44 Years | 245 (75.4%) | 219 (100.0%) |
| 45 to 54 Years | 331 (99.1%) | 436 (93.6%) |
| 55 to 64 Years | 109 (72.2%) | 122 (60.1%) |
| 65 to 74 Years | 218 (83.5%) | 255 (92.4%) |
| 75 Years and over | 163 (100.0%) | 138 (58.7%) |
| Total | 1,956 (85.9%) | 1,641 (71.5%) |
Income Below Poverty Among Married-Couple Families in Houlton
The poverty statistics for married-couple families in Houlton show that 9.5% or 81 of the total 854 families live below the poverty line. Families with 5 or more children have the highest poverty rate of 100.0%, comprising of 41 families. On the other hand, families with 1 or 2 children have the lowest poverty rate of 0.0%, which includes 0 families.
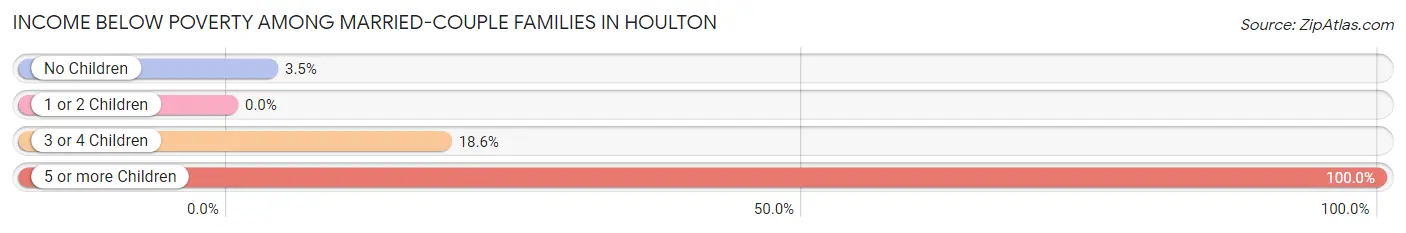
| Children | Above Poverty | Below Poverty |
| No Children | 444 (96.5%) | 16 (3.5%) |
| 1 or 2 Children | 224 (100.0%) | 0 (0.0%) |
| 3 or 4 Children | 105 (81.4%) | 24 (18.6%) |
| 5 or more Children | 0 (0.0%) | 41 (100.0%) |
| Total | 773 (90.5%) | 81 (9.5%) |
Income Below Poverty Among Single-Parent Households in Houlton
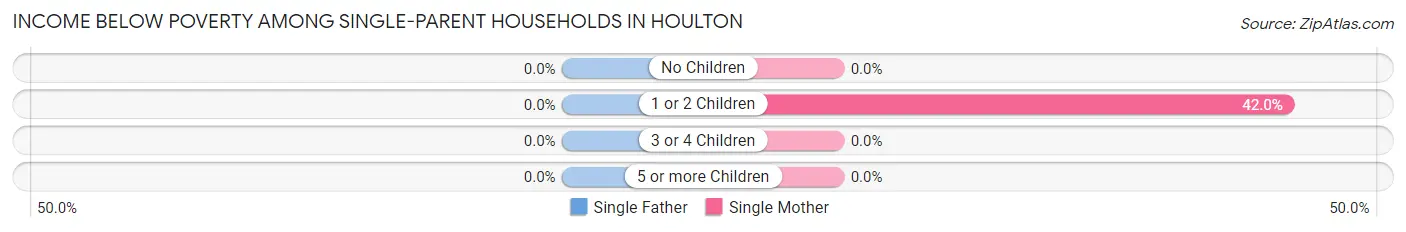
| Children | Single Father | Single Mother |
| No Children | 0 (0.0%) | 0 (0.0%) |
| 1 or 2 Children | 0 (0.0%) | 21 (42.0%) |
| 3 or 4 Children | 0 (0.0%) | 0 (0.0%) |
| 5 or more Children | 0 (0.0%) | 0 (0.0%) |
| Total | 0 (0.0%) | 21 (21.6%) |
Income Below Poverty Among Married-Couple vs Single-Parent Households in Houlton
The poverty data for Houlton shows that 81 of the married-couple family households (9.5%) and 21 of the single-parent households (13.7%) are living below the poverty level. Within the married-couple family households, those with 5 or more children have the highest poverty rate, with 41 households (100.0%) falling below the poverty line. Among the single-parent households, those with 1 or 2 children have the highest poverty rate, with 21 household (22.8%) living below poverty.
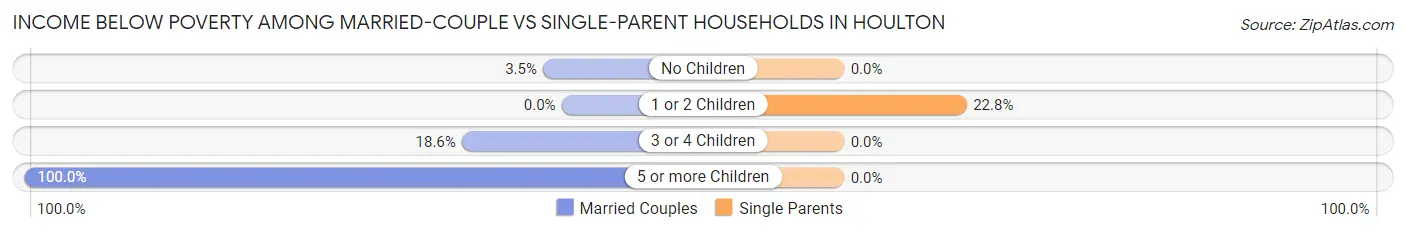
| Children | Married-Couple Families | Single-Parent Households |
| No Children | 16 (3.5%) | 0 (0.0%) |
| 1 or 2 Children | 0 (0.0%) | 21 (22.8%) |
| 3 or 4 Children | 24 (18.6%) | 0 (0.0%) |
| 5 or more Children | 41 (100.0%) | 0 (0.0%) |
| Total | 81 (9.5%) | 21 (13.7%) |
Race in Houlton
The most populous races in Houlton are White / Caucasian (4,643 | 94.4%), Hispanic or Latino (173 | 3.5%), and Black / African American (124 | 2.5%).
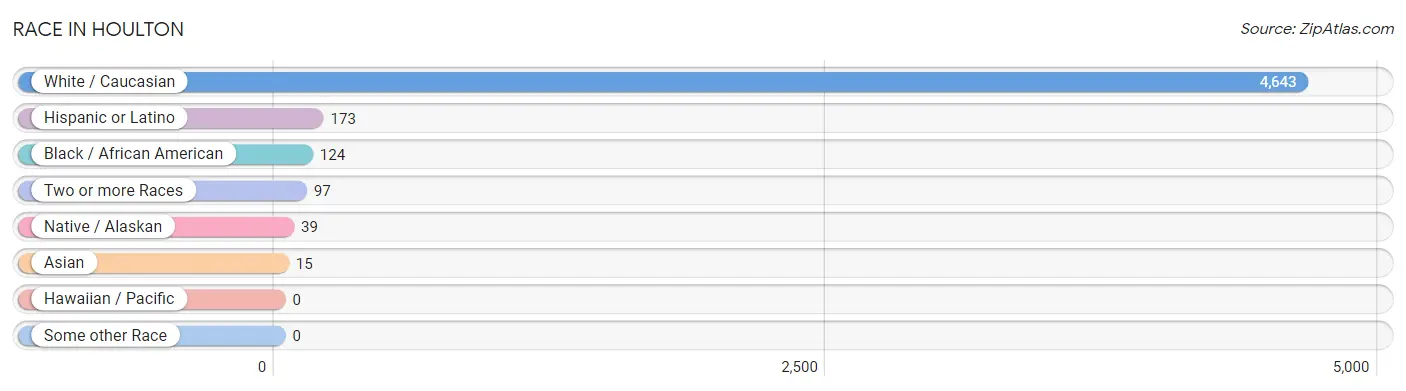
| Race | # Population | % Population |
| Asian | 15 | 0.3% |
| Black / African American | 124 | 2.5% |
| Hawaiian / Pacific | 0 | 0.0% |
| Hispanic or Latino | 173 | 3.5% |
| Native / Alaskan | 39 | 0.8% |
| White / Caucasian | 4,643 | 94.4% |
| Two or more Races | 97 | 2.0% |
| Some other Race | 0 | 0.0% |
| Total | 4,918 | 100.0% |
Ancestry in Houlton
The most populous ancestries reported in Houlton are English (1,160 | 23.6%), Irish (756 | 15.4%), French (310 | 6.3%), American (274 | 5.6%), and Scottish (177 | 3.6%), together accounting for 54.4% of all Houlton residents.
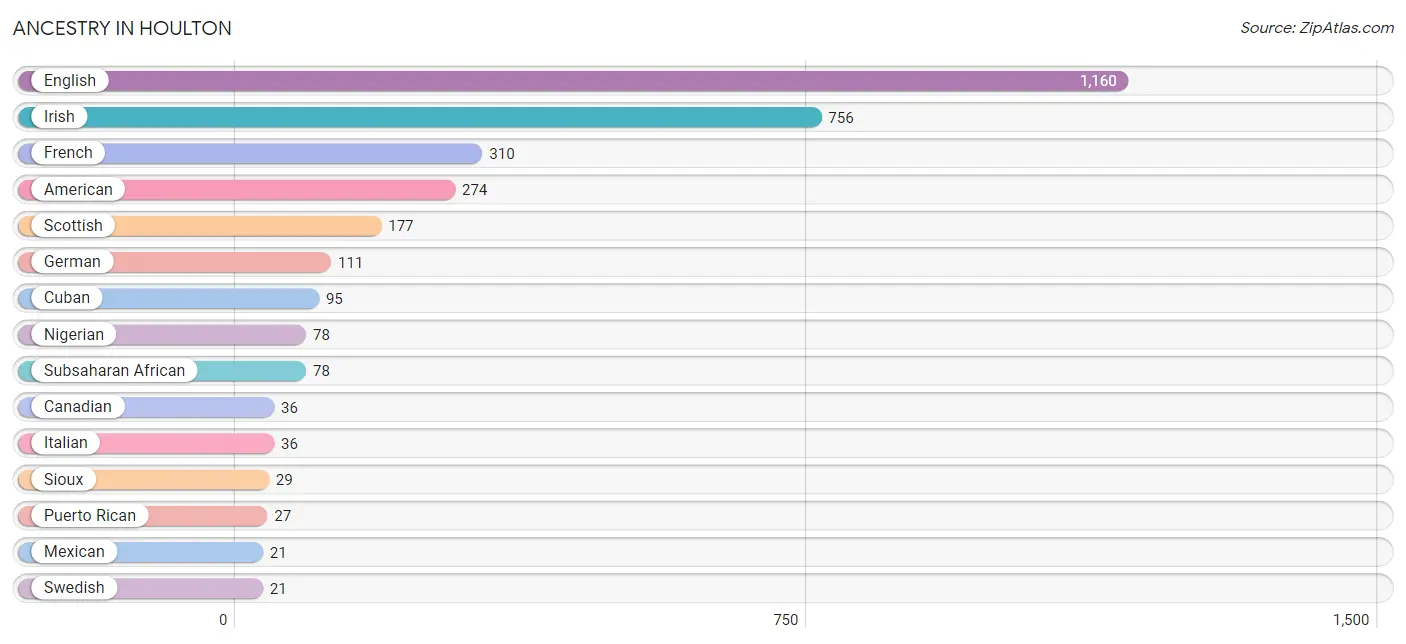
| Ancestry | # Population | % Population |
| American | 274 | 5.6% |
| Armenian | 15 | 0.3% |
| Blackfeet | 10 | 0.2% |
| Cajun | 11 | 0.2% |
| Canadian | 36 | 0.7% |
| Central American | 9 | 0.2% |
| Cherokee | 10 | 0.2% |
| Cuban | 95 | 1.9% |
| Dominican | 10 | 0.2% |
| English | 1,160 | 23.6% |
| French | 310 | 6.3% |
| French American Indian | 11 | 0.2% |
| French Canadian | 19 | 0.4% |
| German | 111 | 2.3% |
| Honduran | 9 | 0.2% |
| Irish | 756 | 15.4% |
| Italian | 36 | 0.7% |
| Jamaican | 9 | 0.2% |
| Korean | 5 | 0.1% |
| Lithuanian | 14 | 0.3% |
| Mexican | 21 | 0.4% |
| Nigerian | 78 | 1.6% |
| Polish | 17 | 0.4% |
| Puerto Rican | 27 | 0.5% |
| Russian | 10 | 0.2% |
| Scotch-Irish | 8 | 0.2% |
| Scottish | 177 | 3.6% |
| Sioux | 29 | 0.6% |
| Sri Lankan | 10 | 0.2% |
| Subsaharan African | 78 | 1.6% |
| Swedish | 21 | 0.4% |
| Thai | 4 | 0.1% |
| Welsh | 14 | 0.3% | View All 33 Rows |
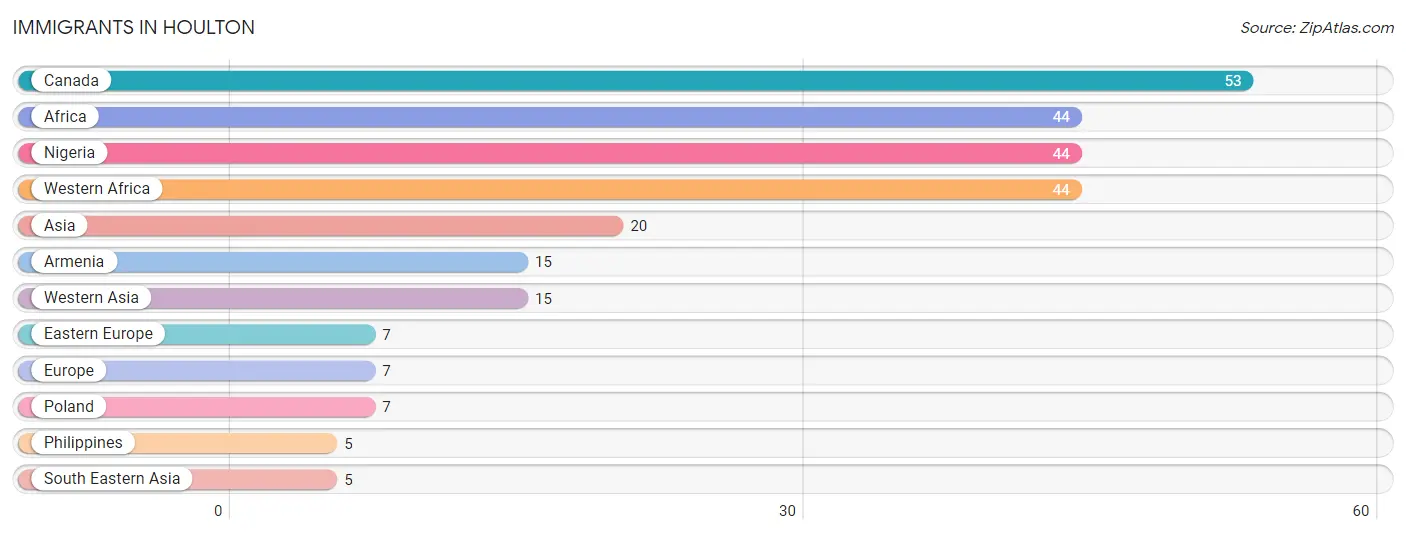
Immigrants in Houlton
The most numerous immigrant groups reported in Houlton came from Canada (53 | 1.1%), Africa (44 | 0.9%), Nigeria (44 | 0.9%), Western Africa (44 | 0.9%), and Asia (20 | 0.4%), together accounting for 4.2% of all Houlton residents.
| Immigration Origin | # Population | % Population |
| Africa | 44 | 0.9% |
| Armenia | 15 | 0.3% |
| Asia | 20 | 0.4% |
| Canada | 53 | 1.1% |
| Eastern Europe | 7 | 0.1% |
| Europe | 7 | 0.1% |
| Nigeria | 44 | 0.9% |
| Philippines | 5 | 0.1% |
| Poland | 7 | 0.1% |
| South Eastern Asia | 5 | 0.1% |
| Western Africa | 44 | 0.9% |
| Western Asia | 15 | 0.3% | View All 12 Rows |
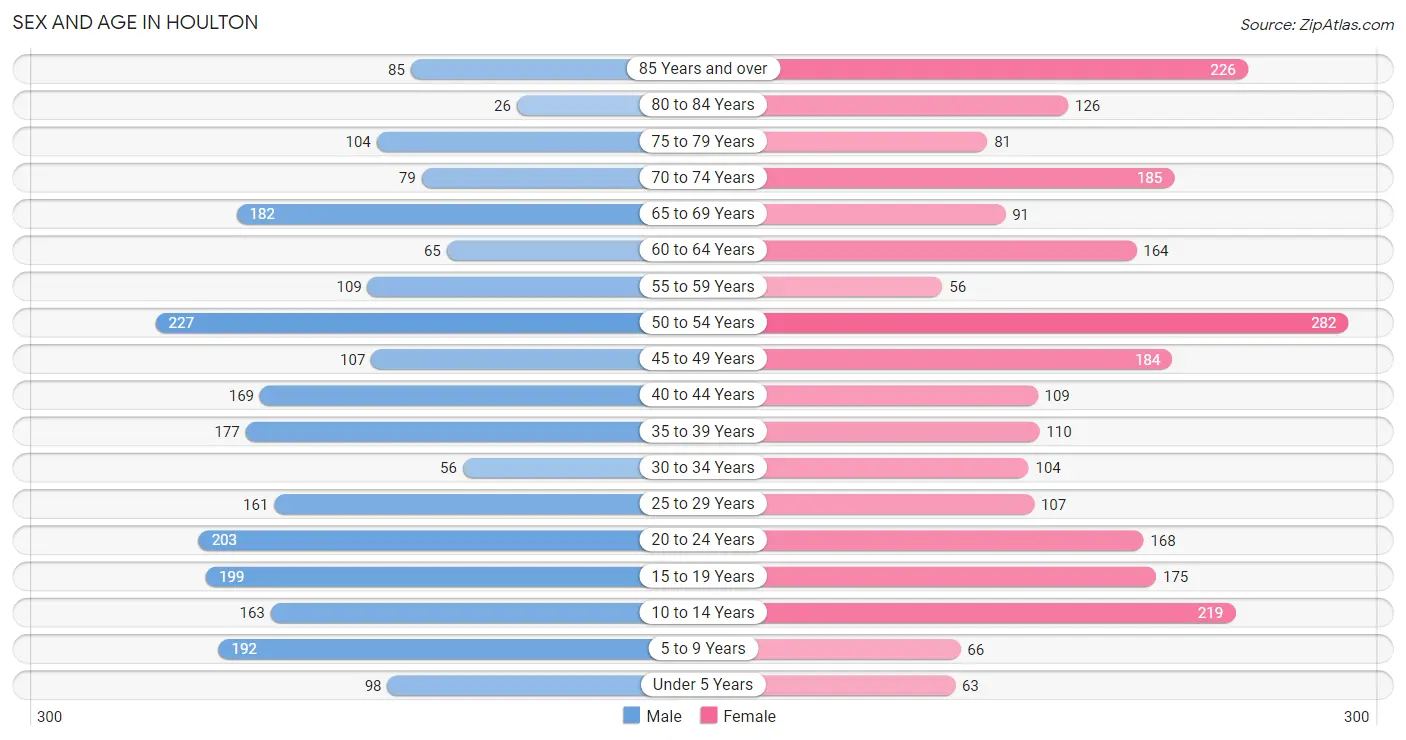
Sex and Age in Houlton
Sex and Age in Houlton
The most populous age groups in Houlton are 50 to 54 Years (227 | 9.5%) for men and 50 to 54 Years (282 | 11.2%) for women.
| Age Bracket | Male | Female |
| Under 5 Years | 98 (4.1%) | 63 (2.5%) |
| 5 to 9 Years | 192 (8.0%) | 66 (2.6%) |
| 10 to 14 Years | 163 (6.8%) | 219 (8.7%) |
| 15 to 19 Years | 199 (8.3%) | 175 (7.0%) |
| 20 to 24 Years | 203 (8.5%) | 168 (6.7%) |
| 25 to 29 Years | 161 (6.7%) | 107 (4.3%) |
| 30 to 34 Years | 56 (2.3%) | 104 (4.1%) |
| 35 to 39 Years | 177 (7.4%) | 110 (4.4%) |
| 40 to 44 Years | 169 (7.0%) | 109 (4.3%) |
| 45 to 49 Years | 107 (4.4%) | 184 (7.3%) |
| 50 to 54 Years | 227 (9.5%) | 282 (11.2%) |
| 55 to 59 Years | 109 (4.5%) | 56 (2.2%) |
| 60 to 64 Years | 65 (2.7%) | 164 (6.5%) |
| 65 to 69 Years | 182 (7.6%) | 91 (3.6%) |
| 70 to 74 Years | 79 (3.3%) | 185 (7.3%) |
| 75 to 79 Years | 104 (4.3%) | 81 (3.2%) |
| 80 to 84 Years | 26 (1.1%) | 126 (5.0%) |
| 85 Years and over | 85 (3.5%) | 226 (9.0%) |
| Total | 2,402 (100.0%) | 2,516 (100.0%) |
Families and Households in Houlton
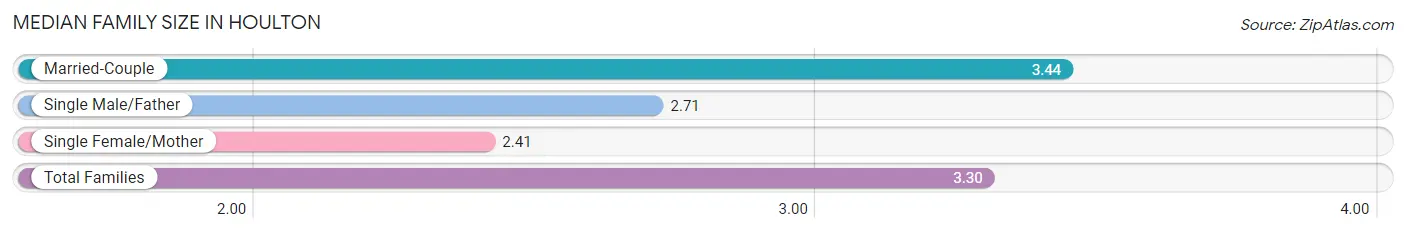
Median Family Size in Houlton
The median family size in Houlton is 3.30 persons per family, with married-couple families (854 | 84.8%) accounting for the largest median family size of 3.44 persons per family. On the other hand, single female/mother families (97 | 9.6%) represent the smallest median family size with 2.41 persons per family.
| Family Type | # Families | Family Size |
| Married-Couple | 854 (84.8%) | 3.44 |
| Single Male/Father | 56 (5.6%) | 2.71 |
| Single Female/Mother | 97 (9.6%) | 2.41 |
| Total Families | 1,007 (100.0%) | 3.30 |
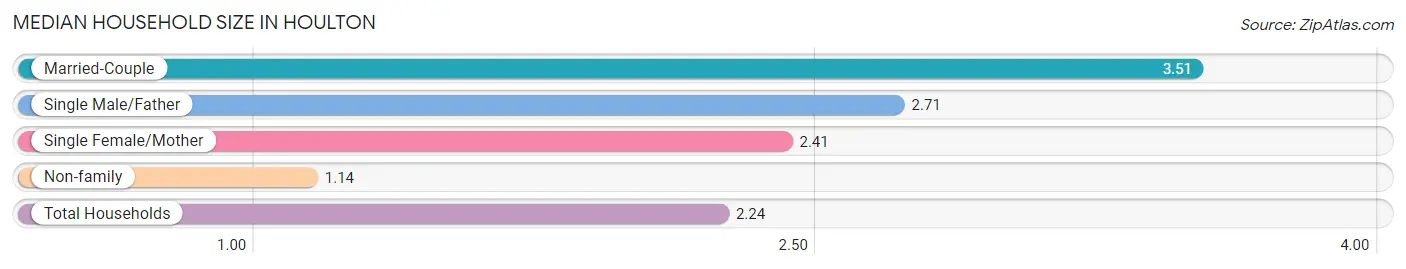
Median Household Size in Houlton
The median household size in Houlton is 2.24 persons per household, with married-couple households (854 | 42.0%) accounting for the largest median household size of 3.51 persons per household. non-family households (1,027 | 50.5%) represent the smallest median household size with 1.14 persons per household.
| Household Type | # Households | Household Size |
| Married-Couple | 854 (42.0%) | 3.51 |
| Single Male/Father | 56 (2.8%) | 2.71 |
| Single Female/Mother | 97 (4.8%) | 2.41 |
| Non-family | 1,027 (50.5%) | 1.14 |
| Total Households | 2,034 (100.0%) | 2.24 |
Household Size by Marriage Status in Houlton
Out of a total of 2,034 households in Houlton, 1,007 (49.5%) are family households, while 1,027 (50.5%) are nonfamily households. The most numerous type of family households are 2-person households, comprising 346, and the most common type of nonfamily households are 1-person households, comprising 879.
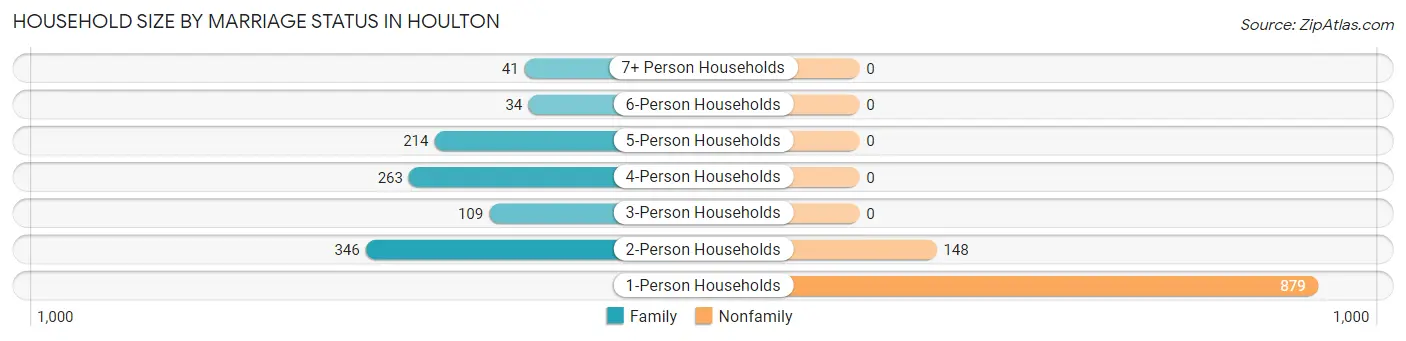
| Household Size | Family Households | Nonfamily Households |
| 1-Person Households | - | 879 (43.2%) |
| 2-Person Households | 346 (17.0%) | 148 (7.3%) |
| 3-Person Households | 109 (5.4%) | 0 (0.0%) |
| 4-Person Households | 263 (12.9%) | 0 (0.0%) |
| 5-Person Households | 214 (10.5%) | 0 (0.0%) |
| 6-Person Households | 34 (1.7%) | 0 (0.0%) |
| 7+ Person Households | 41 (2.0%) | 0 (0.0%) |
| Total | 1,007 (49.5%) | 1,027 (50.5%) |
Female Fertility in Houlton
Fertility by Age in Houlton
Average fertility rate in Houlton is 24.0 births per 1,000 women. Women in the age bracket of 20 to 34 years have the highest fertility rate with 55.0 births per 1,000 women. Women in the age bracket of 20 to 34 years acount for 87.5% of all women with births.
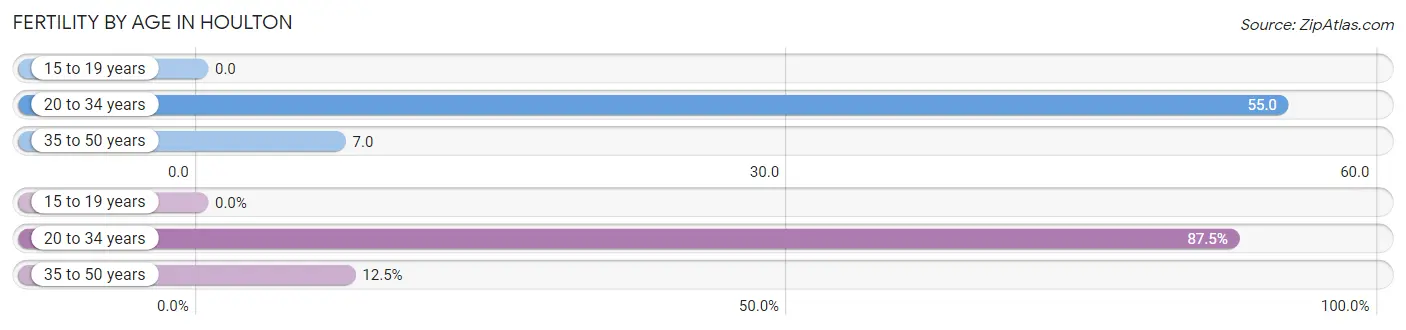
| Age Bracket | Women with Births | Births / 1,000 Women |
| 15 to 19 years | 0 (0.0%) | 0.0 |
| 20 to 34 years | 21 (87.5%) | 55.0 |
| 35 to 50 years | 3 (12.5%) | 7.0 |
| Total | 24 (100.0%) | 24.0 |
Fertility by Age by Marriage Status in Houlton
33.3% of women with births (24) in Houlton are married. The highest percentage of unmarried women with births falls into 20 to 34 years age bracket with 76.2% of them unmarried at the time of birth, while the lowest percentage of unmarried women with births belong to 35 to 50 years age bracket with 0.0% of them unmarried.
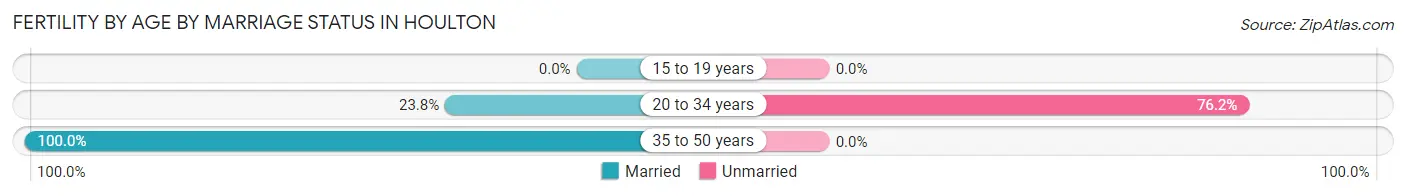
| Age Bracket | Married | Unmarried |
| 15 to 19 years | 0 (0.0%) | 0 (0.0%) |
| 20 to 34 years | 5 (23.8%) | 16 (76.2%) |
| 35 to 50 years | 3 (100.0%) | 0 (0.0%) |
| Total | 8 (33.3%) | 16 (66.7%) |
Fertility by Education in Houlton
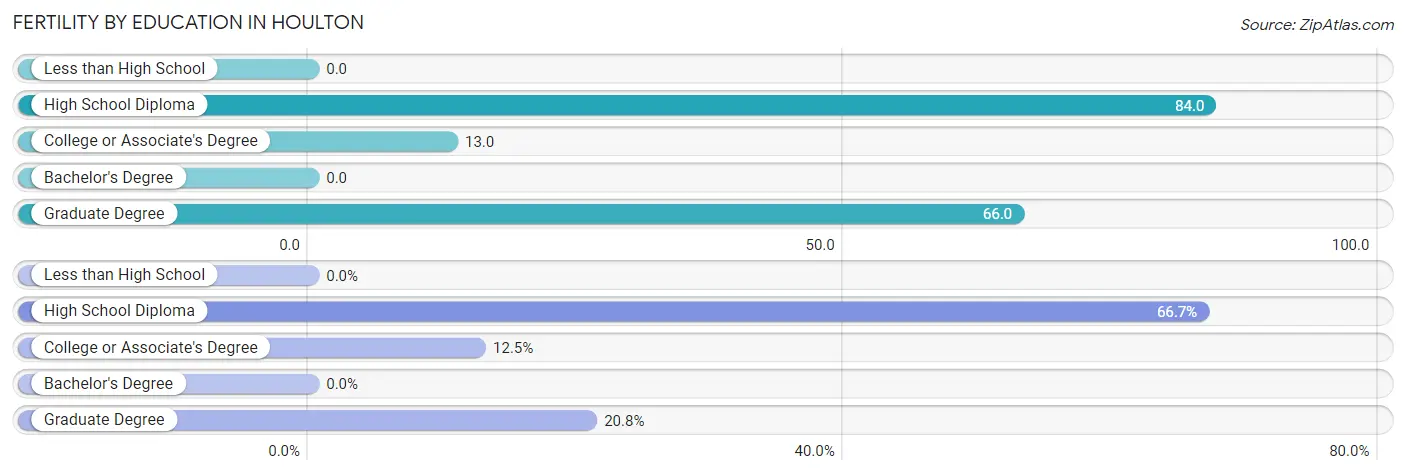
| Educational Attainment | Women with Births | Births / 1,000 Women |
| Less than High School | 0 (0.0%) | 0.0 |
| High School Diploma | 16 (66.7%) | 84.0 |
| College or Associate's Degree | 3 (12.5%) | 13.0 |
| Bachelor's Degree | 0 (0.0%) | 0.0 |
| Graduate Degree | 5 (20.8%) | 66.0 |
| Total | 24 (100.0%) | 24.0 |
Fertility by Education by Marriage Status in Houlton
66.7% of women with births in Houlton are unmarried. Women with the educational attainment of college or associate's degree are most likely to be married with 100.0% of them married at childbirth, while women with the educational attainment of high school diploma are least likely to be married with 100.0% of them unmarried at childbirth.
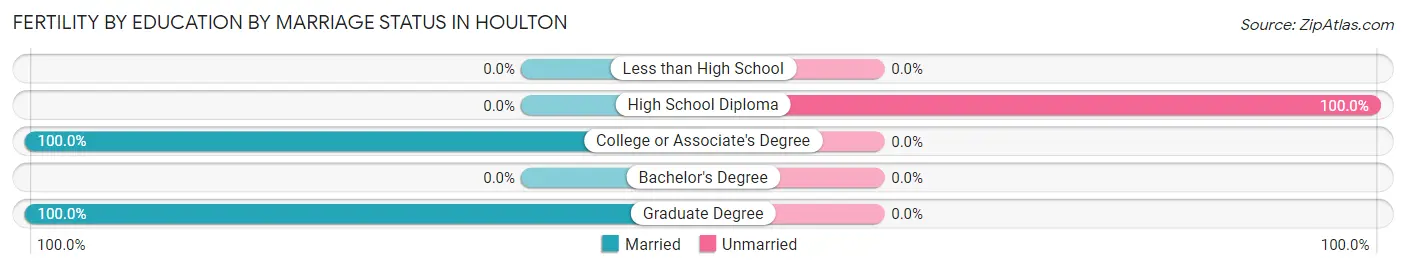
| Educational Attainment | Married | Unmarried |
| Less than High School | 0 (0.0%) | 0 (0.0%) |
| High School Diploma | 0 (0.0%) | 16 (100.0%) |
| College or Associate's Degree | 3 (100.0%) | 0 (0.0%) |
| Bachelor's Degree | 0 (0.0%) | 0 (0.0%) |
| Graduate Degree | 5 (100.0%) | 0 (0.0%) |
| Total | 8 (33.3%) | 16 (66.7%) |
Employment Characteristics in Houlton
Employment by Class of Employer in Houlton
Among the 1,886 employed individuals in Houlton, private company employees (1,255 | 66.5%), not-for-profit organizations (203 | 10.8%), and local government employees (128 | 6.8%) make up the most common classes of employment.
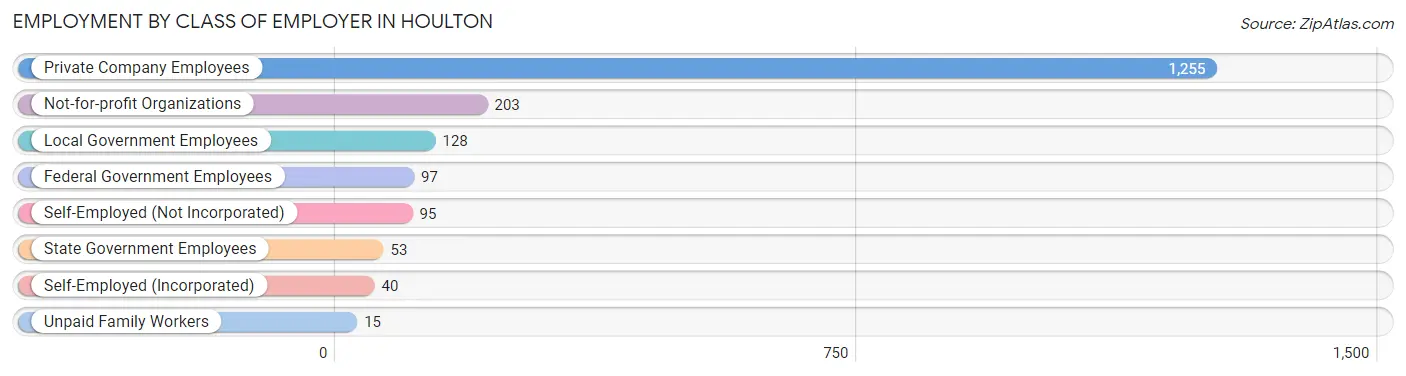
| Employer Class | # Employees | % Employees |
| Private Company Employees | 1,255 | 66.5% |
| Self-Employed (Incorporated) | 40 | 2.1% |
| Self-Employed (Not Incorporated) | 95 | 5.0% |
| Not-for-profit Organizations | 203 | 10.8% |
| Local Government Employees | 128 | 6.8% |
| State Government Employees | 53 | 2.8% |
| Federal Government Employees | 97 | 5.1% |
| Unpaid Family Workers | 15 | 0.8% |
| Total | 1,886 | 100.0% |
Employment Status by Age in Houlton
According to the labor force statistics for Houlton, out of the total population over 16 years of age (4,045), 58.3% or 2,358 individuals are in the labor force, with 18.6% or 439 of them unemployed. The age group with the highest labor force participation rate is 20 to 24 years, with 94.3% or 350 individuals in the labor force. Within the labor force, the 16 to 19 years age range has the highest percentage of unemployed individuals, with 57.4% or 144 of them being unemployed.
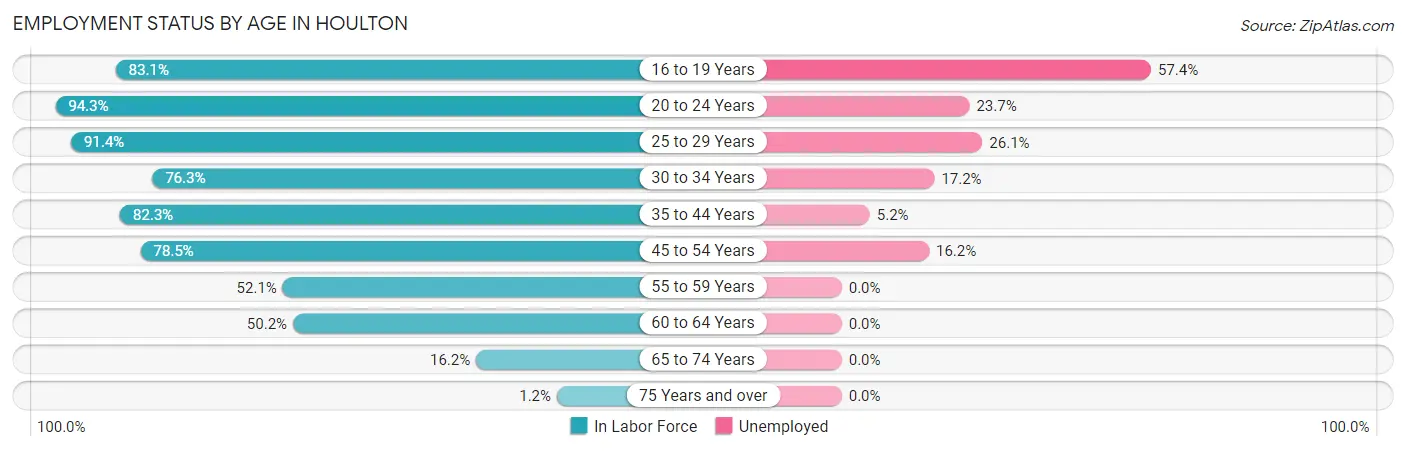
| Age Bracket | In Labor Force | Unemployed |
| 16 to 19 Years | 251 (83.1%) | 144 (57.4%) |
| 20 to 24 Years | 350 (94.3%) | 83 (23.7%) |
| 25 to 29 Years | 245 (91.4%) | 64 (26.1%) |
| 30 to 34 Years | 122 (76.3%) | 21 (17.2%) |
| 35 to 44 Years | 465 (82.3%) | 24 (5.2%) |
| 45 to 54 Years | 628 (78.5%) | 102 (16.2%) |
| 55 to 59 Years | 86 (52.1%) | 0 (0.0%) |
| 60 to 64 Years | 115 (50.2%) | 0 (0.0%) |
| 65 to 74 Years | 87 (16.2%) | 0 (0.0%) |
| 75 Years and over | 8 (1.2%) | 0 (0.0%) |
| Total | 2,358 (58.3%) | 439 (18.6%) |
Employment Status by Educational Attainment in Houlton
According to labor force statistics for Houlton, 75.9% of individuals (1,660) out of the total population between 25 and 64 years of age (2,187) are in the labor force, with 12.7% or 211 of them being unemployed. The group with the highest labor force participation rate are those with the educational attainment of college / associate degree, with 82.0% or 436 individuals in the labor force. Within the labor force, individuals with less than high school education have the highest percentage of unemployment, with 82.7% or 143 of them being unemployed.
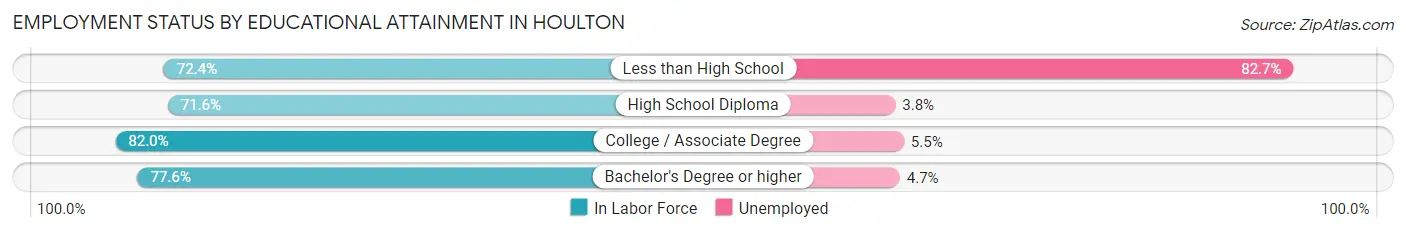
| Educational Attainment | In Labor Force | Unemployed |
| Less than High School | 173 (72.4%) | 198 (82.7%) |
| High School Diploma | 560 (71.6%) | 30 (3.8%) |
| College / Associate Degree | 436 (82.0%) | 29 (5.5%) |
| Bachelor's Degree or higher | 492 (77.6%) | 30 (4.7%) |
| Total | 1,660 (75.9%) | 278 (12.7%) |
Employment Occupations by Sex in Houlton
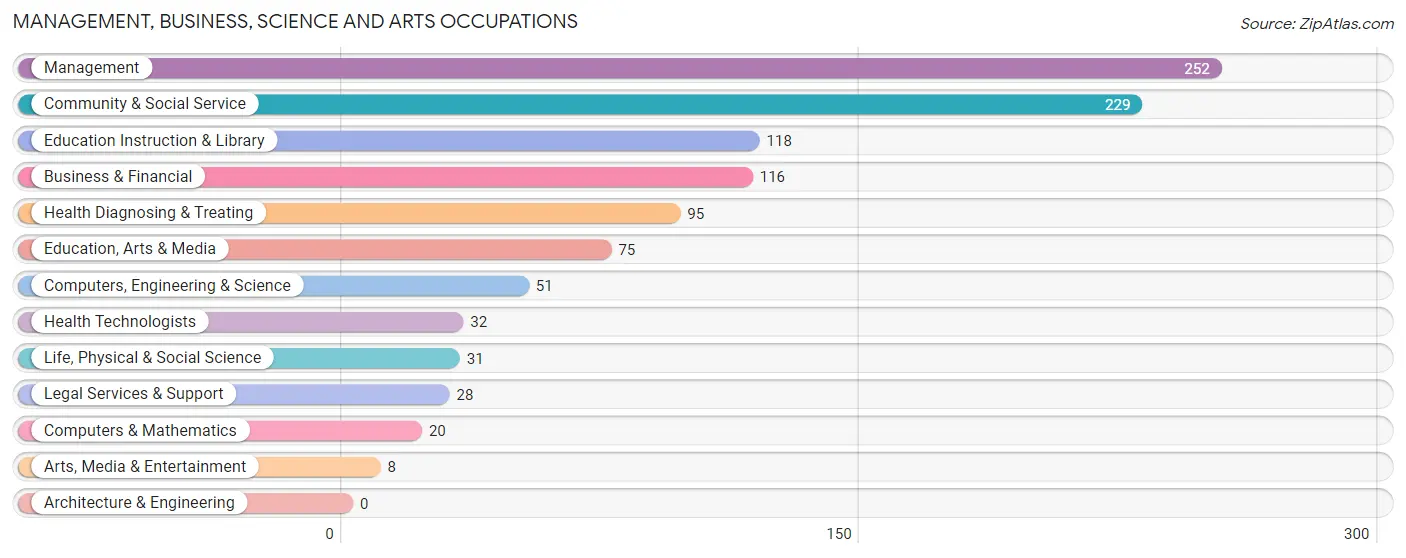
Management, Business, Science and Arts Occupations
The most common Management, Business, Science and Arts occupations in Houlton are Management (252 | 13.1%), Community & Social Service (229 | 11.9%), Education Instruction & Library (118 | 6.1%), Business & Financial (116 | 6.0%), and Health Diagnosing & Treating (95 | 5.0%).
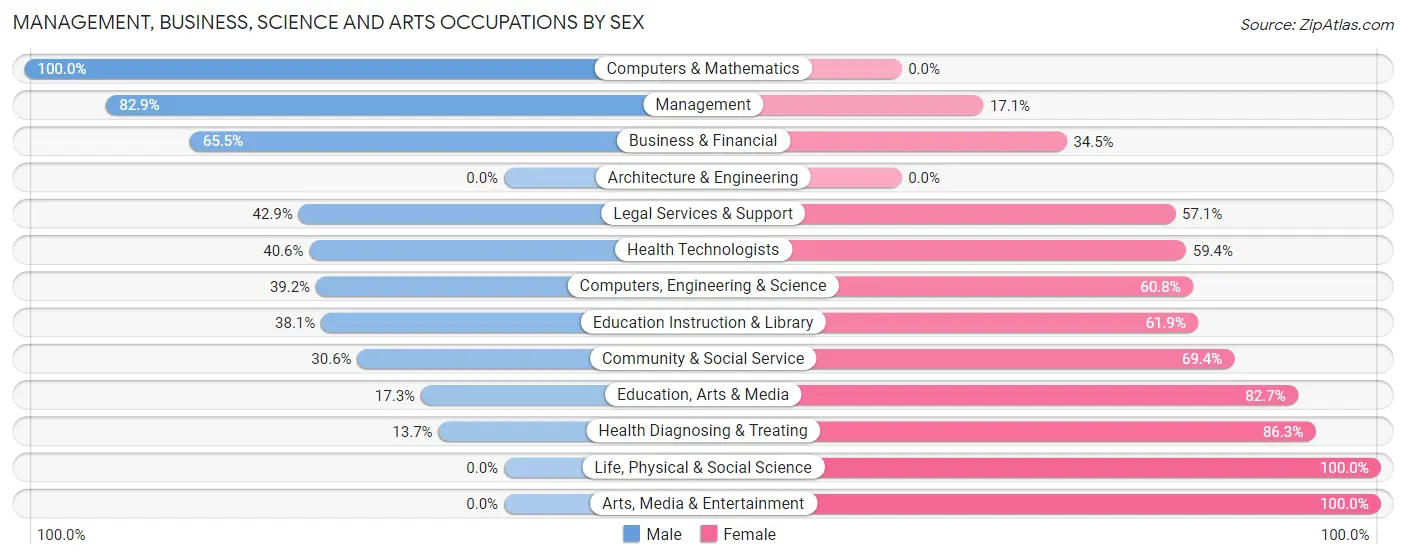
Management, Business, Science and Arts Occupations by Sex
Within the Management, Business, Science and Arts occupations in Houlton, the most male-oriented occupations are Computers & Mathematics (100.0%), Management (82.9%), and Business & Financial (65.5%), while the most female-oriented occupations are Life, Physical & Social Science (100.0%), Arts, Media & Entertainment (100.0%), and Health Diagnosing & Treating (86.3%).
| Occupation | Male | Female |
| Management | 209 (82.9%) | 43 (17.1%) |
| Business & Financial | 76 (65.5%) | 40 (34.5%) |
| Computers, Engineering & Science | 20 (39.2%) | 31 (60.8%) |
| Computers & Mathematics | 20 (100.0%) | 0 (0.0%) |
| Architecture & Engineering | 0 (0.0%) | 0 (0.0%) |
| Life, Physical & Social Science | 0 (0.0%) | 31 (100.0%) |
| Community & Social Service | 70 (30.6%) | 159 (69.4%) |
| Education, Arts & Media | 13 (17.3%) | 62 (82.7%) |
| Legal Services & Support | 12 (42.9%) | 16 (57.1%) |
| Education Instruction & Library | 45 (38.1%) | 73 (61.9%) |
| Arts, Media & Entertainment | 0 (0.0%) | 8 (100.0%) |
| Health Diagnosing & Treating | 13 (13.7%) | 82 (86.3%) |
| Health Technologists | 13 (40.6%) | 19 (59.4%) |
| Total (Category) | 388 (52.2%) | 355 (47.8%) |
| Total (Overall) | 1,079 (56.2%) | 840 (43.8%) |
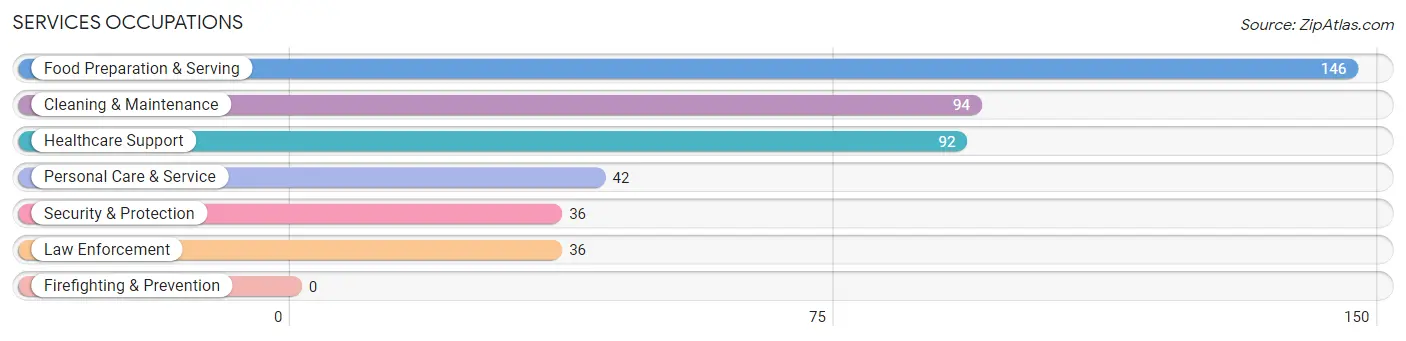
Services Occupations
The most common Services occupations in Houlton are Food Preparation & Serving (146 | 7.6%), Cleaning & Maintenance (94 | 4.9%), Healthcare Support (92 | 4.8%), Personal Care & Service (42 | 2.2%), and Security & Protection (36 | 1.9%).
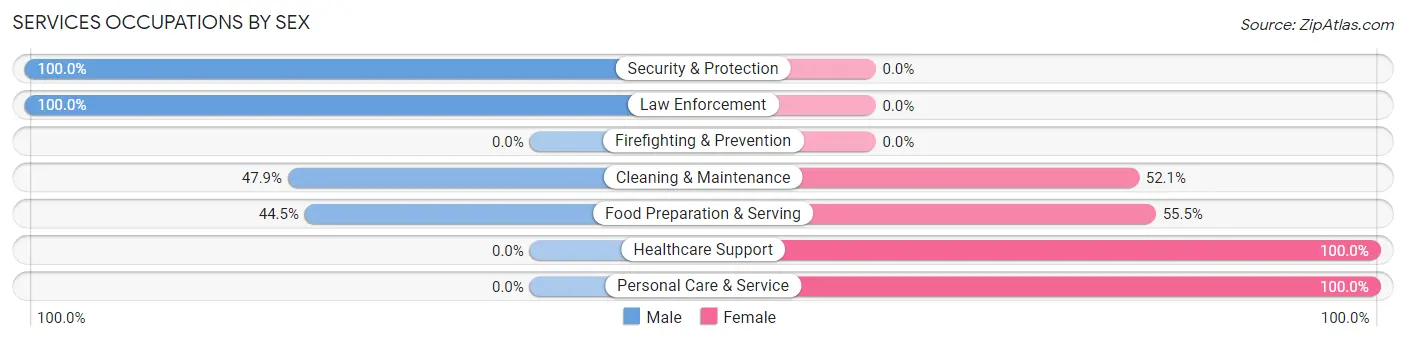
Services Occupations by Sex
Within the Services occupations in Houlton, the most male-oriented occupations are Security & Protection (100.0%), Law Enforcement (100.0%), and Cleaning & Maintenance (47.9%), while the most female-oriented occupations are Healthcare Support (100.0%), Personal Care & Service (100.0%), and Food Preparation & Serving (55.5%).
| Occupation | Male | Female |
| Healthcare Support | 0 (0.0%) | 92 (100.0%) |
| Security & Protection | 36 (100.0%) | 0 (0.0%) |
| Firefighting & Prevention | 0 (0.0%) | 0 (0.0%) |
| Law Enforcement | 36 (100.0%) | 0 (0.0%) |
| Food Preparation & Serving | 65 (44.5%) | 81 (55.5%) |
| Cleaning & Maintenance | 45 (47.9%) | 49 (52.1%) |
| Personal Care & Service | 0 (0.0%) | 42 (100.0%) |
| Total (Category) | 146 (35.6%) | 264 (64.4%) |
| Total (Overall) | 1,079 (56.2%) | 840 (43.8%) |
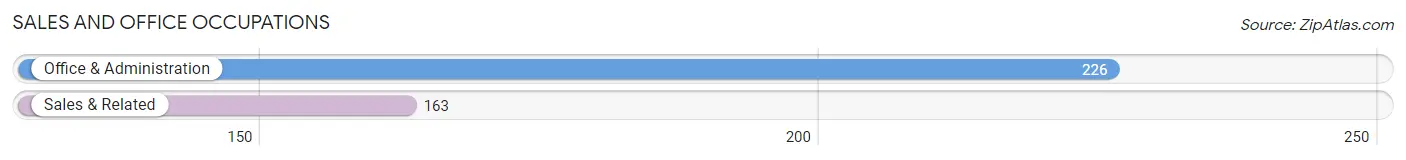
Sales and Office Occupations
The most common Sales and Office occupations in Houlton are Office & Administration (226 | 11.8%), and Sales & Related (163 | 8.5%).
Sales and Office Occupations by Sex
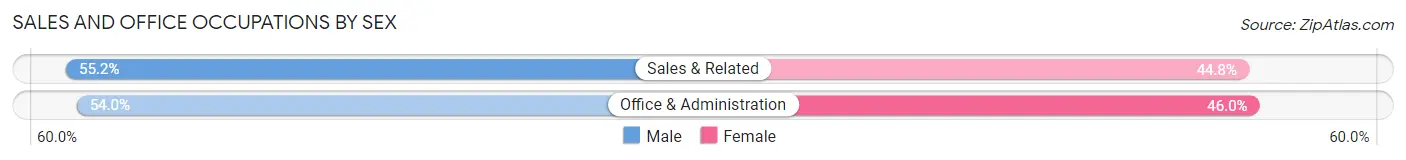
| Occupation | Male | Female |
| Sales & Related | 90 (55.2%) | 73 (44.8%) |
| Office & Administration | 122 (54.0%) | 104 (46.0%) |
| Total (Category) | 212 (54.5%) | 177 (45.5%) |
| Total (Overall) | 1,079 (56.2%) | 840 (43.8%) |
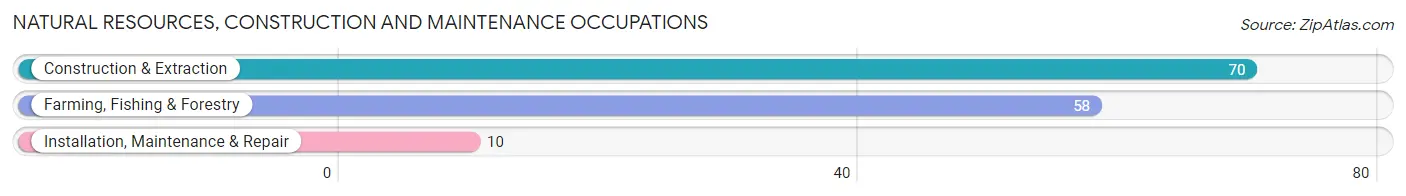
Natural Resources, Construction and Maintenance Occupations
The most common Natural Resources, Construction and Maintenance occupations in Houlton are Construction & Extraction (70 | 3.6%), Farming, Fishing & Forestry (58 | 3.0%), and Installation, Maintenance & Repair (10 | 0.5%).
Natural Resources, Construction and Maintenance Occupations by Sex
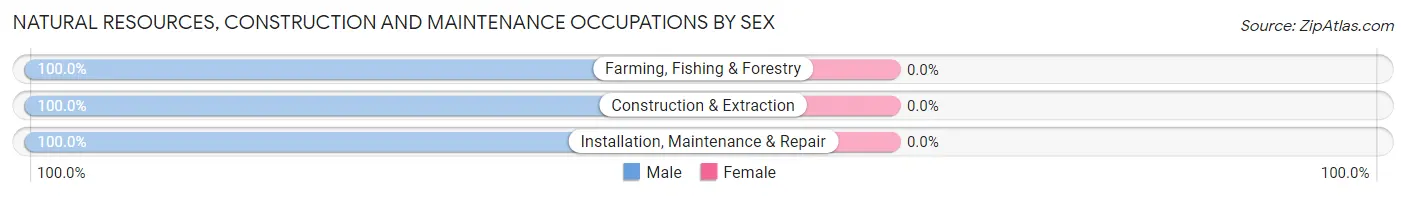
| Occupation | Male | Female |
| Farming, Fishing & Forestry | 58 (100.0%) | 0 (0.0%) |
| Construction & Extraction | 70 (100.0%) | 0 (0.0%) |
| Installation, Maintenance & Repair | 10 (100.0%) | 0 (0.0%) |
| Total (Category) | 138 (100.0%) | 0 (0.0%) |
| Total (Overall) | 1,079 (56.2%) | 840 (43.8%) |
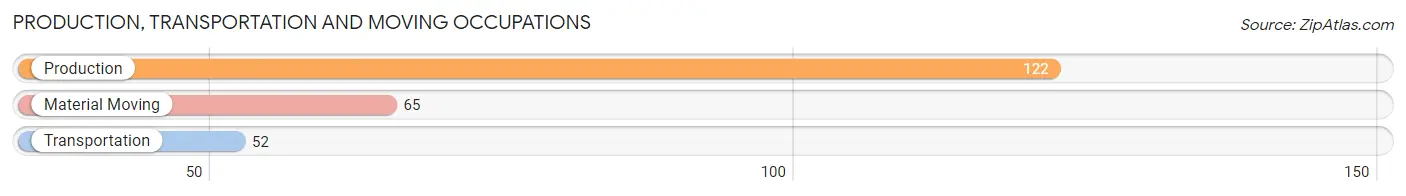
Production, Transportation and Moving Occupations
The most common Production, Transportation and Moving occupations in Houlton are Production (122 | 6.4%), Material Moving (65 | 3.4%), and Transportation (52 | 2.7%).
Production, Transportation and Moving Occupations by Sex
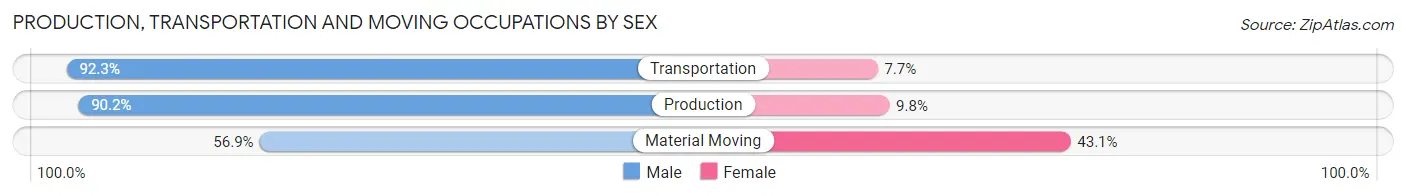
| Occupation | Male | Female |
| Production | 110 (90.2%) | 12 (9.8%) |
| Transportation | 48 (92.3%) | 4 (7.7%) |
| Material Moving | 37 (56.9%) | 28 (43.1%) |
| Total (Category) | 195 (81.6%) | 44 (18.4%) |
| Total (Overall) | 1,079 (56.2%) | 840 (43.8%) |
Employment Industries by Sex in Houlton
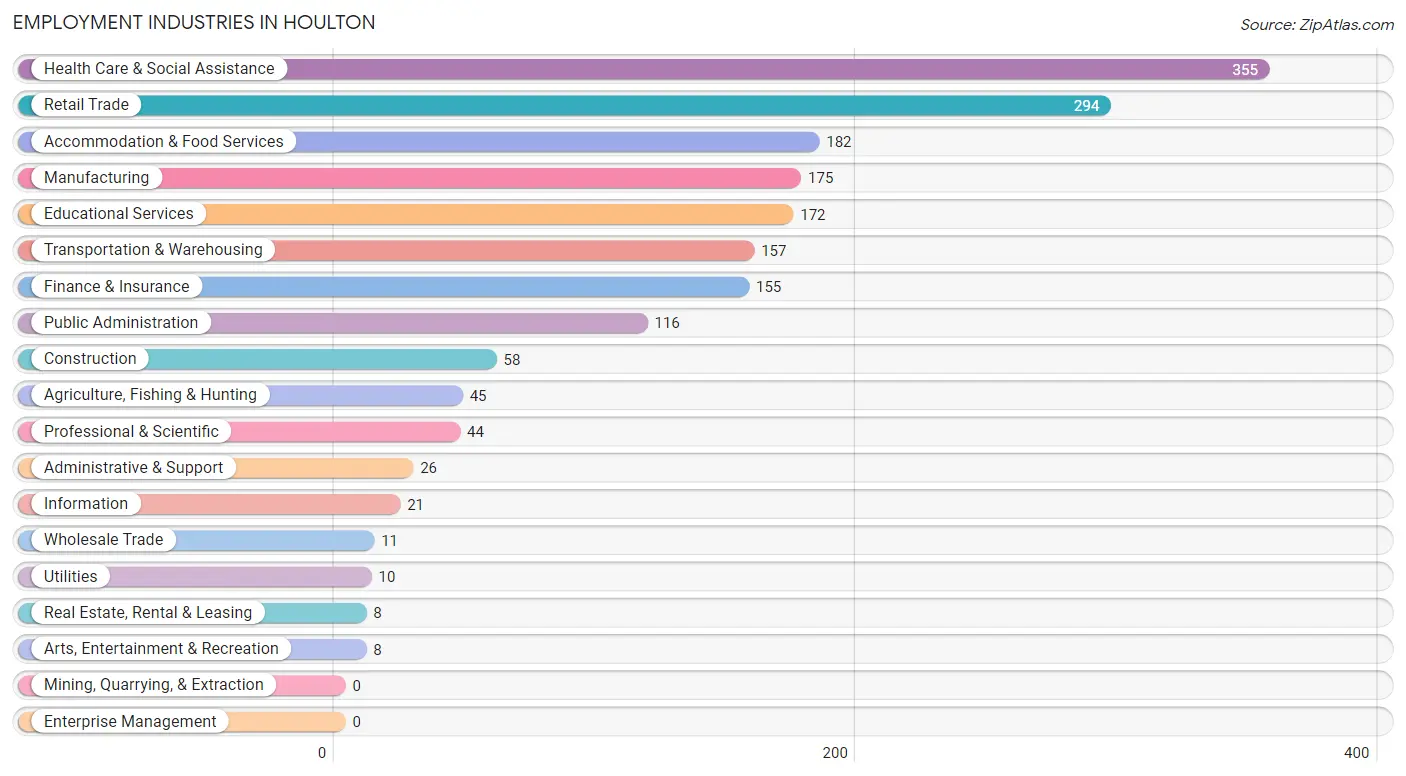
Employment Industries in Houlton
The major employment industries in Houlton include Health Care & Social Assistance (355 | 18.5%), Retail Trade (294 | 15.3%), Accommodation & Food Services (182 | 9.5%), Manufacturing (175 | 9.1%), and Educational Services (172 | 9.0%).
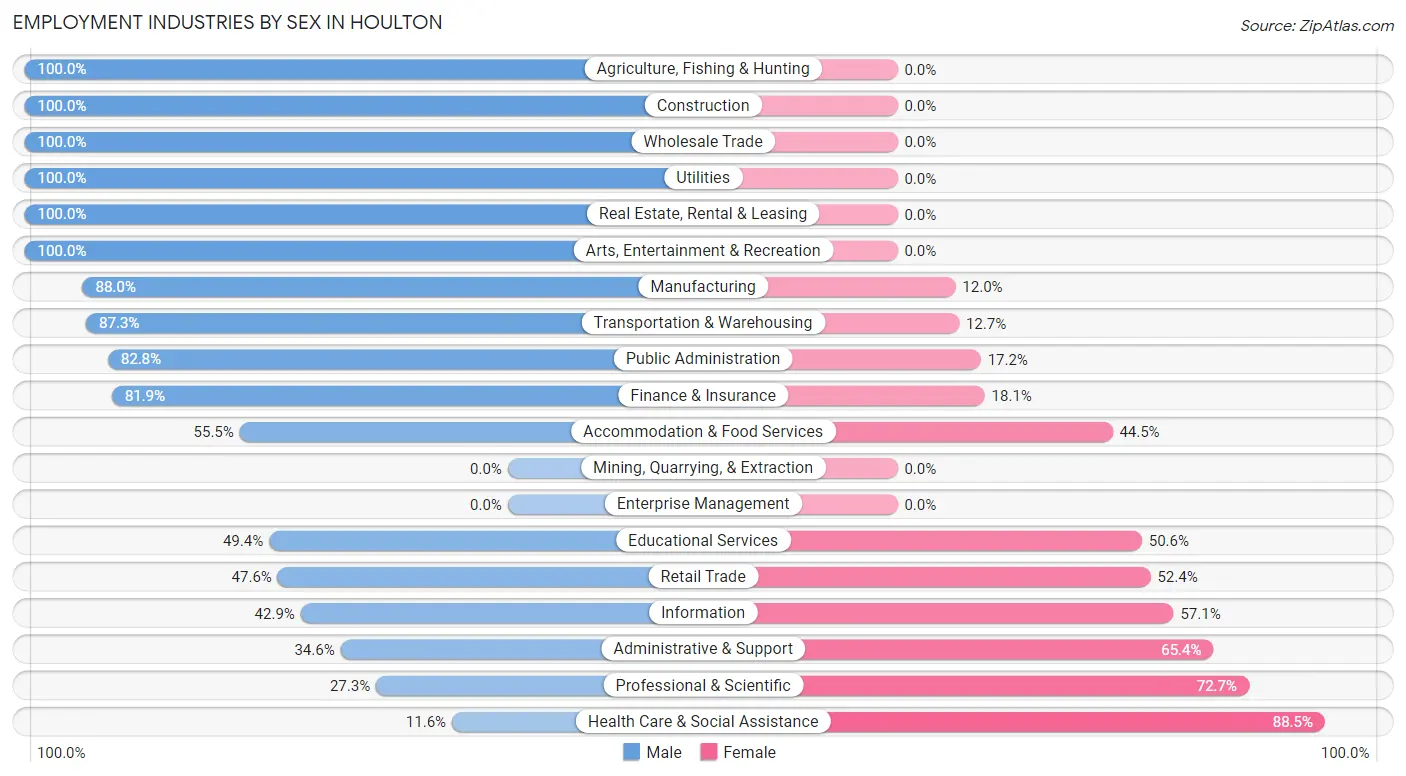
Employment Industries by Sex in Houlton
The Houlton industries that see more men than women are Agriculture, Fishing & Hunting (100.0%), Construction (100.0%), and Wholesale Trade (100.0%), whereas the industries that tend to have a higher number of women are Health Care & Social Assistance (88.4%), Professional & Scientific (72.7%), and Administrative & Support (65.4%).
| Industry | Male | Female |
| Agriculture, Fishing & Hunting | 45 (100.0%) | 0 (0.0%) |
| Mining, Quarrying, & Extraction | 0 (0.0%) | 0 (0.0%) |
| Construction | 58 (100.0%) | 0 (0.0%) |
| Manufacturing | 154 (88.0%) | 21 (12.0%) |
| Wholesale Trade | 11 (100.0%) | 0 (0.0%) |
| Retail Trade | 140 (47.6%) | 154 (52.4%) |
| Transportation & Warehousing | 137 (87.3%) | 20 (12.7%) |
| Utilities | 10 (100.0%) | 0 (0.0%) |
| Information | 9 (42.9%) | 12 (57.1%) |
| Finance & Insurance | 127 (81.9%) | 28 (18.1%) |
| Real Estate, Rental & Leasing | 8 (100.0%) | 0 (0.0%) |
| Professional & Scientific | 12 (27.3%) | 32 (72.7%) |
| Enterprise Management | 0 (0.0%) | 0 (0.0%) |
| Administrative & Support | 9 (34.6%) | 17 (65.4%) |
| Educational Services | 85 (49.4%) | 87 (50.6%) |
| Health Care & Social Assistance | 41 (11.6%) | 314 (88.4%) |
| Arts, Entertainment & Recreation | 8 (100.0%) | 0 (0.0%) |
| Accommodation & Food Services | 101 (55.5%) | 81 (44.5%) |
| Public Administration | 96 (82.8%) | 20 (17.2%) |
| Total | 1,079 (56.2%) | 840 (43.8%) |
Education in Houlton
School Enrollment in Houlton
The most common levels of schooling among the 1,045 students in Houlton are middle school (306 | 29.3%), elementary school (270 | 25.8%), and high school (249 | 23.8%).
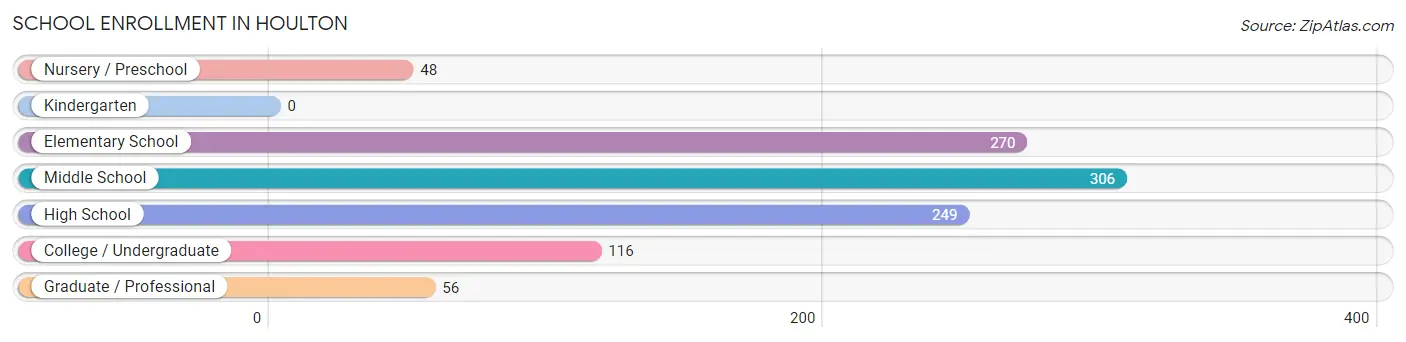
| School Level | # Students | % Students |
| Nursery / Preschool | 48 | 4.6% |
| Kindergarten | 0 | 0.0% |
| Elementary School | 270 | 25.8% |
| Middle School | 306 | 29.3% |
| High School | 249 | 23.8% |
| College / Undergraduate | 116 | 11.1% |
| Graduate / Professional | 56 | 5.4% |
| Total | 1,045 | 100.0% |
School Enrollment by Age by Funding Source in Houlton
Out of a total of 1,045 students who are enrolled in schools in Houlton, 237 (22.7%) attend a private institution, while the remaining 808 (77.3%) are enrolled in public schools. The age group of 18 to 19 year olds has the highest likelihood of being enrolled in private schools, with 38 (65.5% in the age bracket) enrolled. Conversely, the age group of 35 years and over has the lowest likelihood of being enrolled in a private school, with 72 (100.0% in the age bracket) attending a public institution.
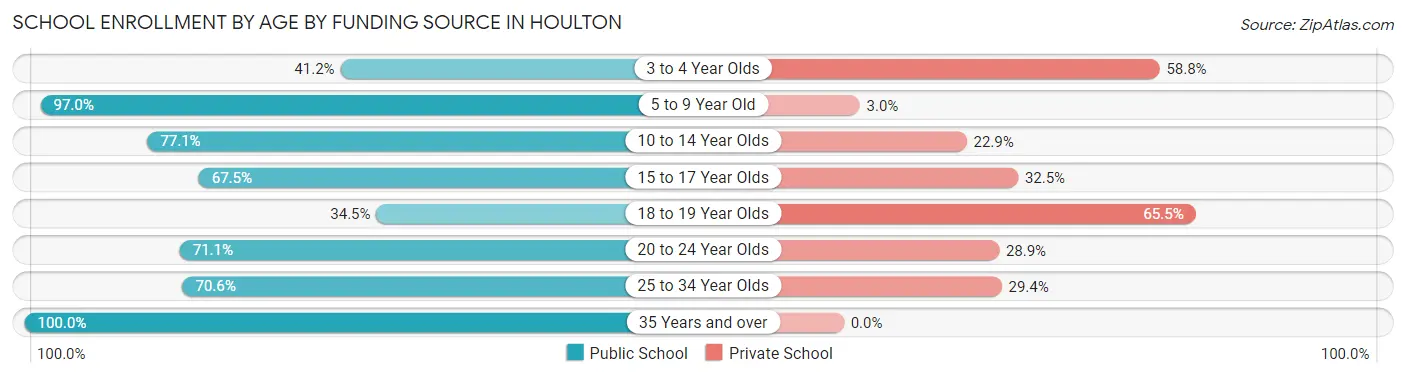
| Age Bracket | Public School | Private School |
| 3 to 4 Year Olds | 14 (41.2%) | 20 (58.8%) |
| 5 to 9 Year Old | 229 (97.0%) | 7 (3.0%) |
| 10 to 14 Year Olds | 273 (77.1%) | 81 (22.9%) |
| 15 to 17 Year Olds | 129 (67.5%) | 62 (32.5%) |
| 18 to 19 Year Olds | 20 (34.5%) | 38 (65.5%) |
| 20 to 24 Year Olds | 59 (71.1%) | 24 (28.9%) |
| 25 to 34 Year Olds | 12 (70.6%) | 5 (29.4%) |
| 35 Years and over | 72 (100.0%) | 0 (0.0%) |
| Total | 808 (77.3%) | 237 (22.7%) |
Educational Attainment by Field of Study in Houlton
Business (256 | 28.2%), education (170 | 18.7%), science & technology (136 | 15.0%), liberal arts & history (94 | 10.4%), and psychology (80 | 8.8%) are the most common fields of study among 907 individuals in Houlton who have obtained a bachelor's degree or higher.
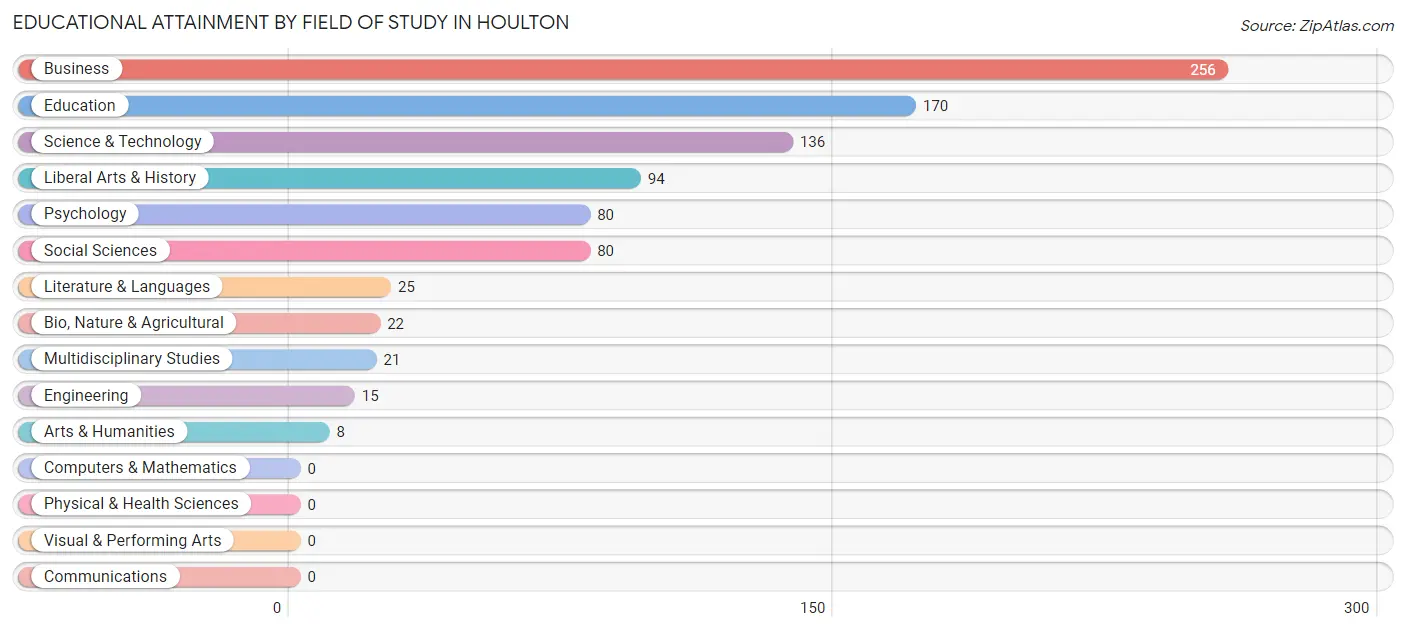
| Field of Study | # Graduates | % Graduates |
| Computers & Mathematics | 0 | 0.0% |
| Bio, Nature & Agricultural | 22 | 2.4% |
| Physical & Health Sciences | 0 | 0.0% |
| Psychology | 80 | 8.8% |
| Social Sciences | 80 | 8.8% |
| Engineering | 15 | 1.7% |
| Multidisciplinary Studies | 21 | 2.3% |
| Science & Technology | 136 | 15.0% |
| Business | 256 | 28.2% |
| Education | 170 | 18.7% |
| Literature & Languages | 25 | 2.8% |
| Liberal Arts & History | 94 | 10.4% |
| Visual & Performing Arts | 0 | 0.0% |
| Communications | 0 | 0.0% |
| Arts & Humanities | 8 | 0.9% |
| Total | 907 | 100.0% |
Transportation & Commute in Houlton
Vehicle Availability by Sex in Houlton
The most prevalent vehicle ownership categories in Houlton are males with 3 vehicles (470, accounting for 44.3%) and females with 3 vehicles (220, making up 58.2%).
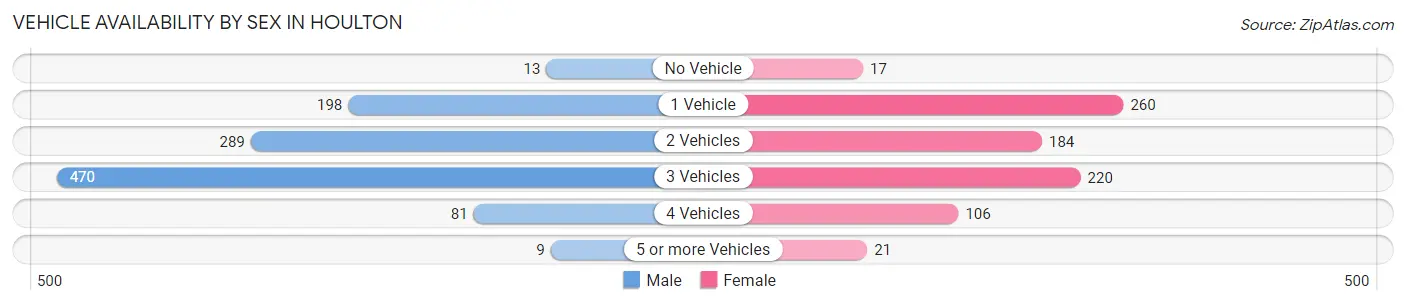
| Vehicles Available | Male | Female |
| No Vehicle | 13 (1.2%) | 17 (2.1%) |
| 1 Vehicle | 198 (18.7%) | 260 (32.2%) |
| 2 Vehicles | 289 (27.3%) | 184 (22.8%) |
| 3 Vehicles | 470 (44.3%) | 220 (27.2%) |
| 4 Vehicles | 81 (7.6%) | 106 (13.1%) |
| 5 or more Vehicles | 9 (0.9%) | 21 (2.6%) |
| Total | 1,060 (100.0%) | 808 (100.0%) |
Commute Time in Houlton
The most frequently occuring commute durations in Houlton are 5 to 9 minutes (568 commuters, 31.6%), 10 to 14 minutes (433 commuters, 24.1%), and less than 5 minutes (311 commuters, 17.3%).
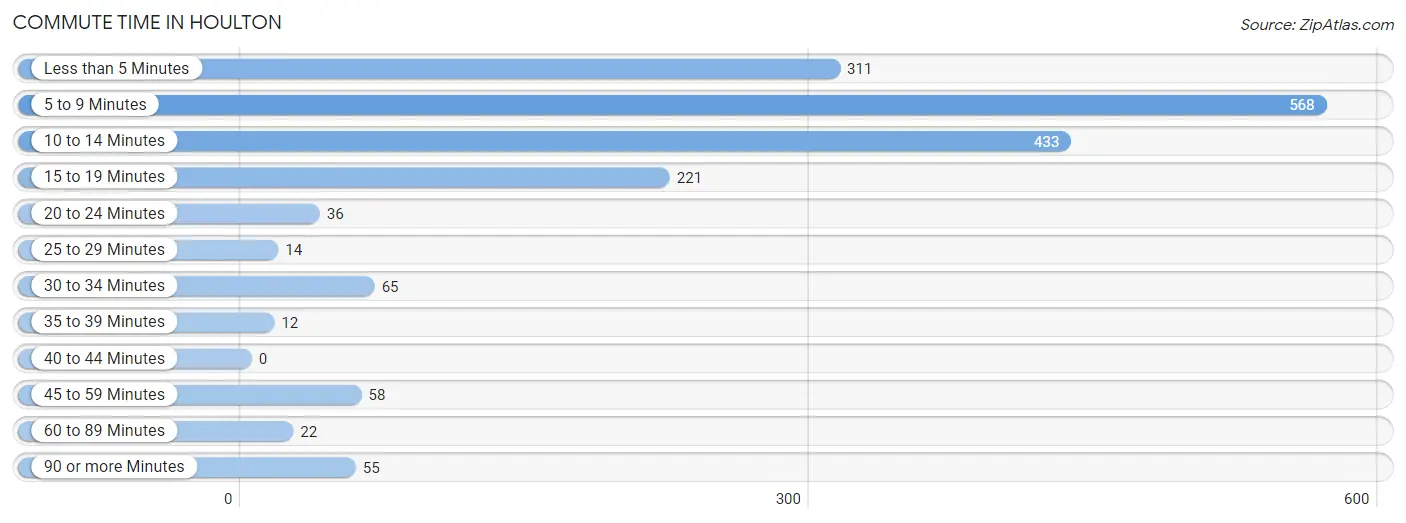
| Commute Time | # Commuters | % Commuters |
| Less than 5 Minutes | 311 | 17.3% |
| 5 to 9 Minutes | 568 | 31.6% |
| 10 to 14 Minutes | 433 | 24.1% |
| 15 to 19 Minutes | 221 | 12.3% |
| 20 to 24 Minutes | 36 | 2.0% |
| 25 to 29 Minutes | 14 | 0.8% |
| 30 to 34 Minutes | 65 | 3.6% |
| 35 to 39 Minutes | 12 | 0.7% |
| 40 to 44 Minutes | 0 | 0.0% |
| 45 to 59 Minutes | 58 | 3.2% |
| 60 to 89 Minutes | 22 | 1.2% |
| 90 or more Minutes | 55 | 3.1% |
Commute Time by Sex in Houlton
The most common commute times in Houlton are 10 to 14 minutes (303 commuters, 28.6%) for males and 5 to 9 minutes (298 commuters, 40.4%) for females.
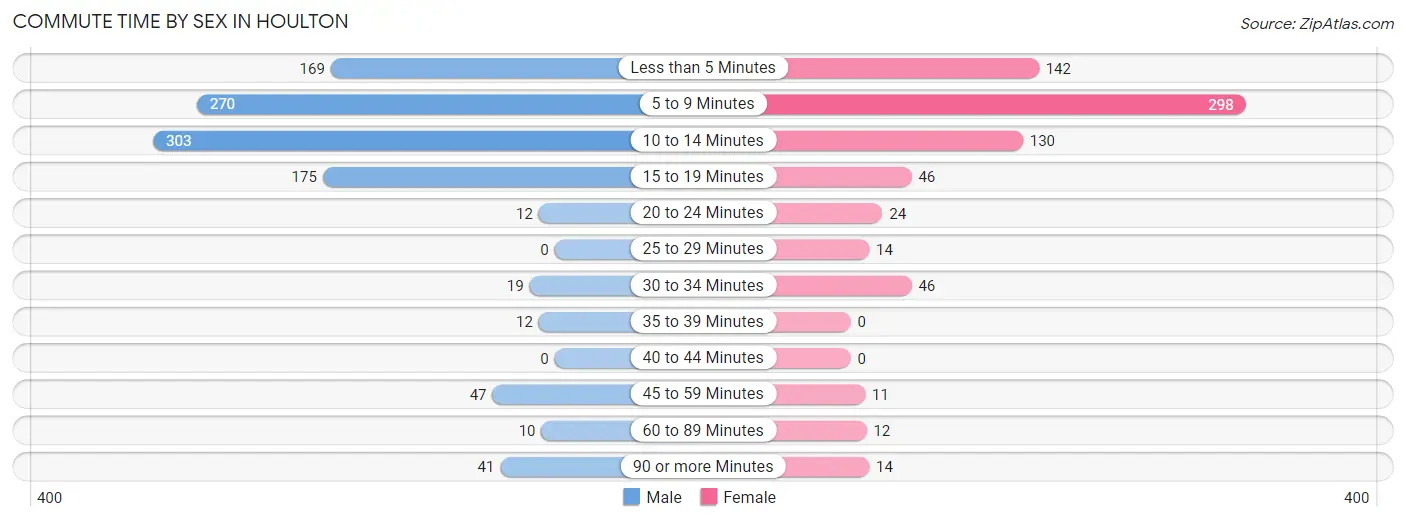
| Commute Time | Male | Female |
| Less than 5 Minutes | 169 (16.0%) | 142 (19.3%) |
| 5 to 9 Minutes | 270 (25.5%) | 298 (40.4%) |
| 10 to 14 Minutes | 303 (28.6%) | 130 (17.6%) |
| 15 to 19 Minutes | 175 (16.5%) | 46 (6.2%) |
| 20 to 24 Minutes | 12 (1.1%) | 24 (3.3%) |
| 25 to 29 Minutes | 0 (0.0%) | 14 (1.9%) |
| 30 to 34 Minutes | 19 (1.8%) | 46 (6.2%) |
| 35 to 39 Minutes | 12 (1.1%) | 0 (0.0%) |
| 40 to 44 Minutes | 0 (0.0%) | 0 (0.0%) |
| 45 to 59 Minutes | 47 (4.4%) | 11 (1.5%) |
| 60 to 89 Minutes | 10 (0.9%) | 12 (1.6%) |
| 90 or more Minutes | 41 (3.9%) | 14 (1.9%) |
Time of Departure to Work by Sex in Houlton
The most frequent times of departure to work in Houlton are 7:00 AM to 7:29 AM (237, 22.4%) for males and 7:00 AM to 7:29 AM (149, 20.2%) for females.
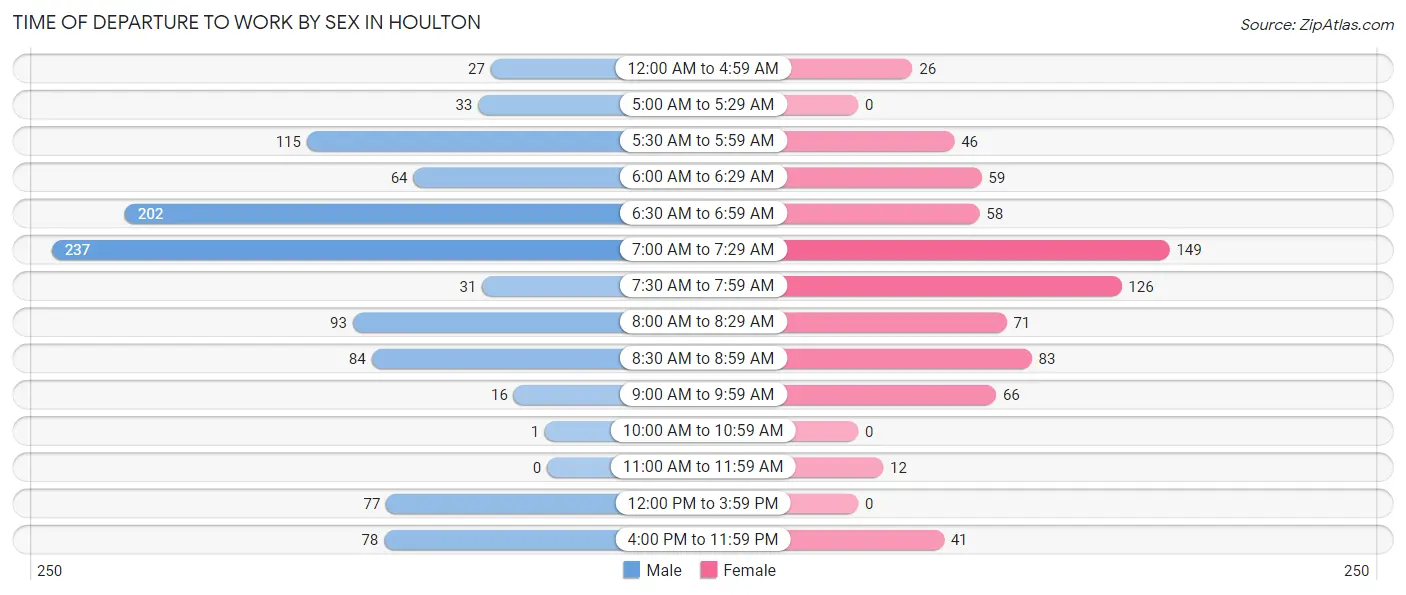
| Time of Departure | Male | Female |
| 12:00 AM to 4:59 AM | 27 (2.5%) | 26 (3.5%) |
| 5:00 AM to 5:29 AM | 33 (3.1%) | 0 (0.0%) |
| 5:30 AM to 5:59 AM | 115 (10.9%) | 46 (6.2%) |
| 6:00 AM to 6:29 AM | 64 (6.0%) | 59 (8.0%) |
| 6:30 AM to 6:59 AM | 202 (19.1%) | 58 (7.9%) |
| 7:00 AM to 7:29 AM | 237 (22.4%) | 149 (20.2%) |
| 7:30 AM to 7:59 AM | 31 (2.9%) | 126 (17.1%) |
| 8:00 AM to 8:29 AM | 93 (8.8%) | 71 (9.6%) |
| 8:30 AM to 8:59 AM | 84 (7.9%) | 83 (11.3%) |
| 9:00 AM to 9:59 AM | 16 (1.5%) | 66 (9.0%) |
| 10:00 AM to 10:59 AM | 1 (0.1%) | 0 (0.0%) |
| 11:00 AM to 11:59 AM | 0 (0.0%) | 12 (1.6%) |
| 12:00 PM to 3:59 PM | 77 (7.3%) | 0 (0.0%) |
| 4:00 PM to 11:59 PM | 78 (7.4%) | 41 (5.6%) |
| Total | 1,058 (100.0%) | 737 (100.0%) |
Housing Occupancy in Houlton
Occupancy by Ownership in Houlton
Of the total 2,034 dwellings in Houlton, owner-occupied units account for 1,274 (62.6%), while renter-occupied units make up 760 (37.4%).
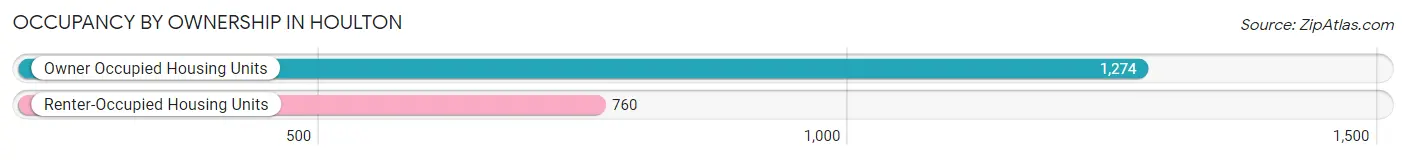
| Occupancy | # Housing Units | % Housing Units |
| Owner Occupied Housing Units | 1,274 | 62.6% |
| Renter-Occupied Housing Units | 760 | 37.4% |
| Total Occupied Housing Units | 2,034 | 100.0% |
Occupancy by Household Size in Houlton
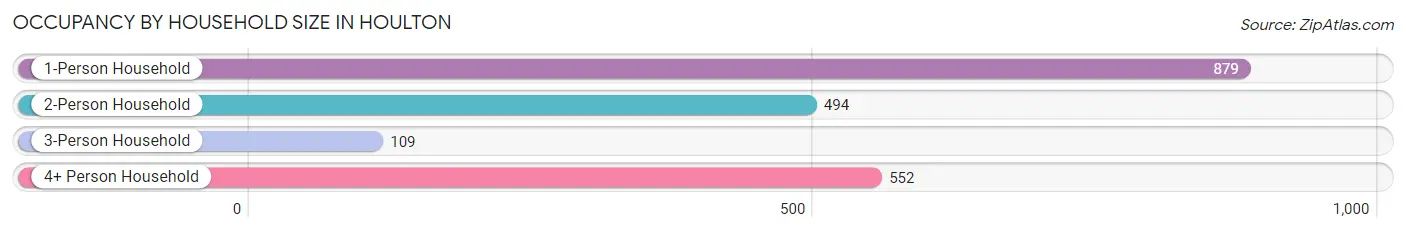
| Household Size | # Housing Units | % Housing Units |
| 1-Person Household | 879 | 43.2% |
| 2-Person Household | 494 | 24.3% |
| 3-Person Household | 109 | 5.4% |
| 4+ Person Household | 552 | 27.1% |
| Total Housing Units | 2,034 | 100.0% |
Occupancy by Ownership by Household Size in Houlton
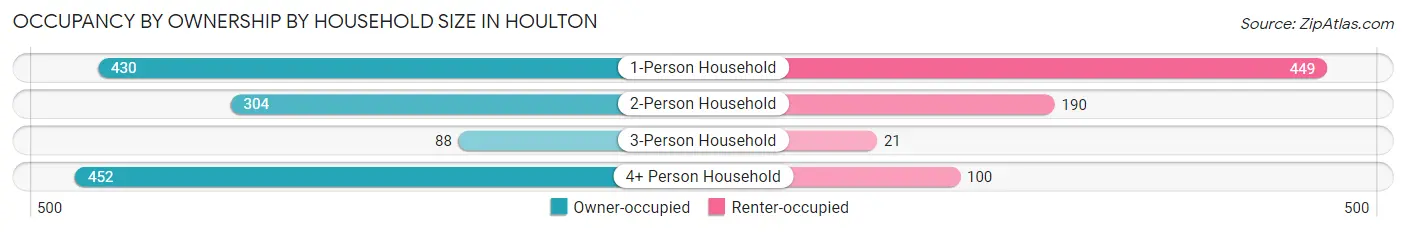
| Household Size | Owner-occupied | Renter-occupied |
| 1-Person Household | 430 (48.9%) | 449 (51.1%) |
| 2-Person Household | 304 (61.5%) | 190 (38.5%) |
| 3-Person Household | 88 (80.7%) | 21 (19.3%) |
| 4+ Person Household | 452 (81.9%) | 100 (18.1%) |
| Total Housing Units | 1,274 (62.6%) | 760 (37.4%) |
Occupancy by Educational Attainment in Houlton
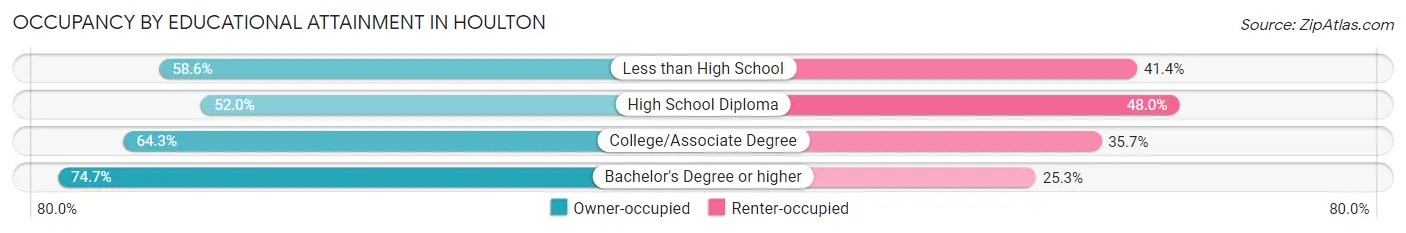
| Household Size | Owner-occupied | Renter-occupied |
| Less than High School | 136 (58.6%) | 96 (41.4%) |
| High School Diploma | 318 (52.0%) | 294 (48.0%) |
| College/Associate Degree | 425 (64.3%) | 236 (35.7%) |
| Bachelor's Degree or higher | 395 (74.7%) | 134 (25.3%) |
Occupancy by Age of Householder in Houlton
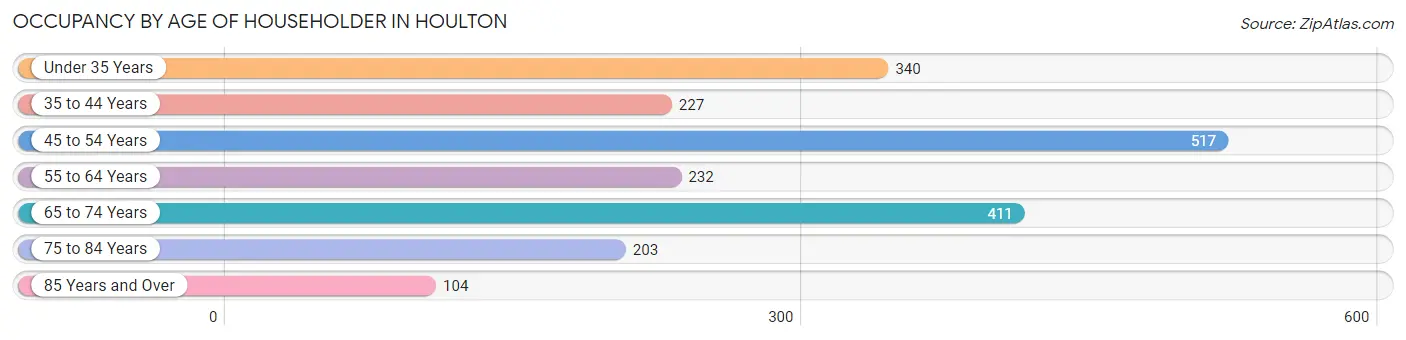
| Age Bracket | # Households | % Households |
| Under 35 Years | 340 | 16.7% |
| 35 to 44 Years | 227 | 11.2% |
| 45 to 54 Years | 517 | 25.4% |
| 55 to 64 Years | 232 | 11.4% |
| 65 to 74 Years | 411 | 20.2% |
| 75 to 84 Years | 203 | 10.0% |
| 85 Years and Over | 104 | 5.1% |
| Total | 2,034 | 100.0% |
Housing Finances in Houlton
Median Income by Occupancy in Houlton
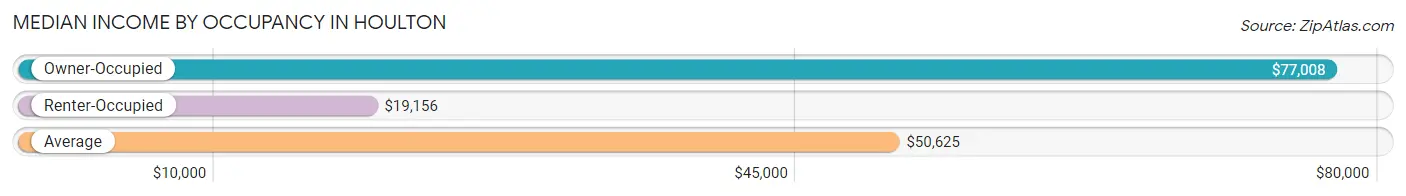
| Occupancy Type | # Households | Median Income |
| Owner-Occupied | 1,274 (62.6%) | $77,008 |
| Renter-Occupied | 760 (37.4%) | $19,156 |
| Average | 2,034 (100.0%) | $50,625 |
Occupancy by Householder Income Bracket in Houlton
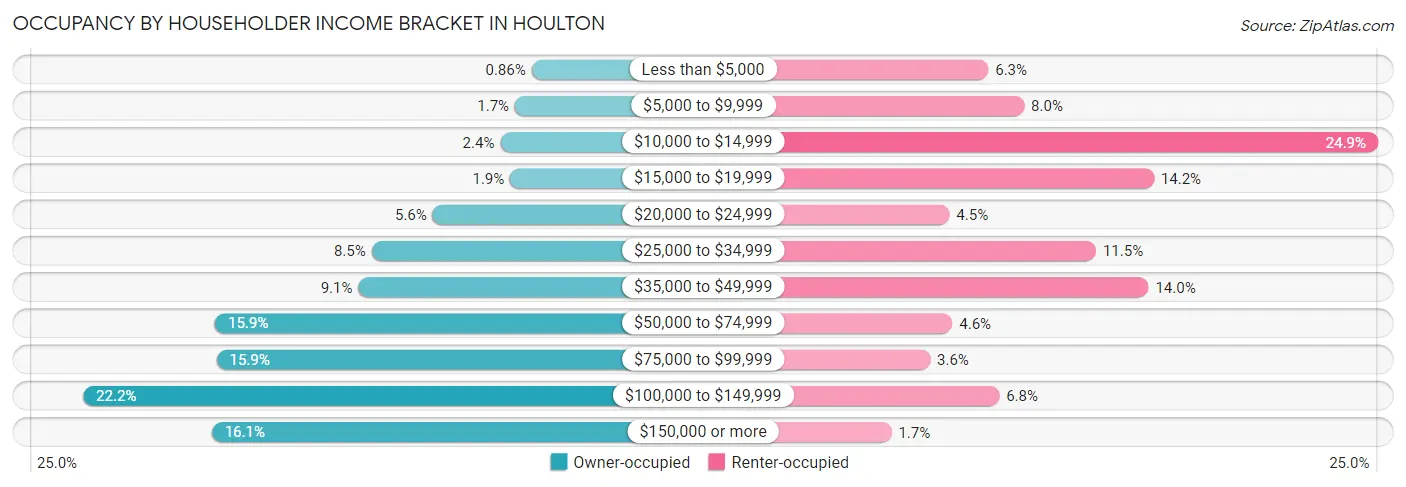
| Income Bracket | Owner-occupied | Renter-occupied |
| Less than $5,000 | 11 (0.9%) | 48 (6.3%) |
| $5,000 to $9,999 | 21 (1.7%) | 61 (8.0%) |
| $10,000 to $14,999 | 30 (2.4%) | 189 (24.9%) |
| $15,000 to $19,999 | 24 (1.9%) | 108 (14.2%) |
| $20,000 to $24,999 | 71 (5.6%) | 34 (4.5%) |
| $25,000 to $34,999 | 108 (8.5%) | 87 (11.5%) |
| $35,000 to $49,999 | 116 (9.1%) | 106 (14.0%) |
| $50,000 to $74,999 | 203 (15.9%) | 35 (4.6%) |
| $75,000 to $99,999 | 202 (15.9%) | 27 (3.5%) |
| $100,000 to $149,999 | 283 (22.2%) | 52 (6.8%) |
| $150,000 or more | 205 (16.1%) | 13 (1.7%) |
| Total | 1,274 (100.0%) | 760 (100.0%) |
Monthly Housing Cost Tiers in Houlton
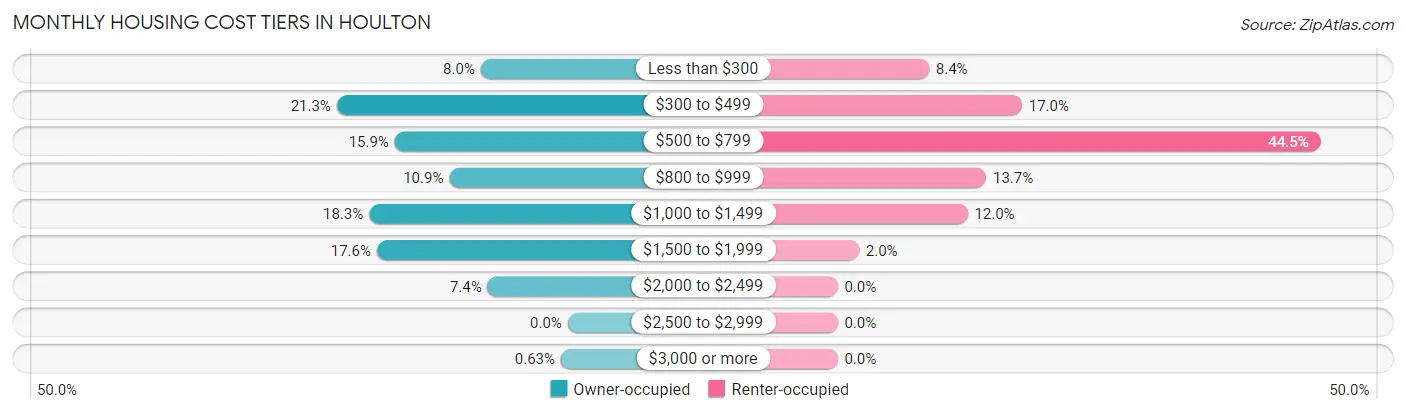
| Monthly Cost | Owner-occupied | Renter-occupied |
| Less than $300 | 102 (8.0%) | 64 (8.4%) |
| $300 to $499 | 271 (21.3%) | 129 (17.0%) |
| $500 to $799 | 203 (15.9%) | 338 (44.5%) |
| $800 to $999 | 139 (10.9%) | 104 (13.7%) |
| $1,000 to $1,499 | 233 (18.3%) | 91 (12.0%) |
| $1,500 to $1,999 | 224 (17.6%) | 15 (2.0%) |
| $2,000 to $2,499 | 94 (7.4%) | 0 (0.0%) |
| $2,500 to $2,999 | 0 (0.0%) | 0 (0.0%) |
| $3,000 or more | 8 (0.6%) | 0 (0.0%) |
| Total | 1,274 (100.0%) | 760 (100.0%) |
Physical Housing Characteristics in Houlton
Housing Structures in Houlton
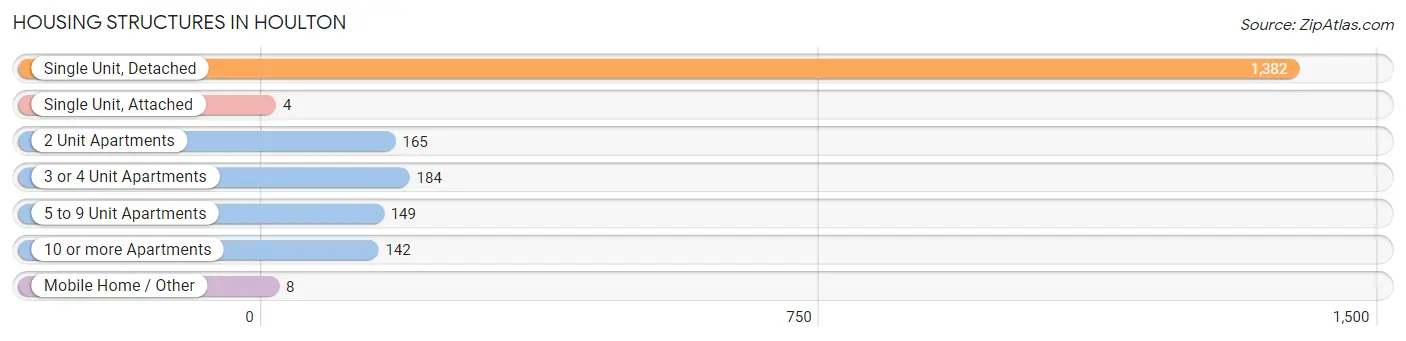
| Structure Type | # Housing Units | % Housing Units |
| Single Unit, Detached | 1,382 | 67.9% |
| Single Unit, Attached | 4 | 0.2% |
| 2 Unit Apartments | 165 | 8.1% |
| 3 or 4 Unit Apartments | 184 | 9.0% |
| 5 to 9 Unit Apartments | 149 | 7.3% |
| 10 or more Apartments | 142 | 7.0% |
| Mobile Home / Other | 8 | 0.4% |
| Total | 2,034 | 100.0% |
Housing Structures by Occupancy in Houlton
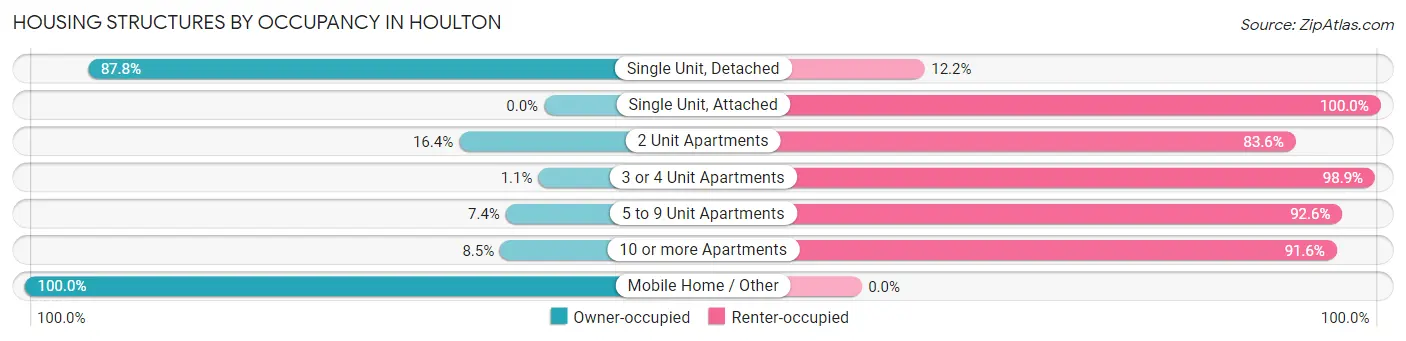
| Structure Type | Owner-occupied | Renter-occupied |
| Single Unit, Detached | 1,214 (87.8%) | 168 (12.2%) |
| Single Unit, Attached | 0 (0.0%) | 4 (100.0%) |
| 2 Unit Apartments | 27 (16.4%) | 138 (83.6%) |
| 3 or 4 Unit Apartments | 2 (1.1%) | 182 (98.9%) |
| 5 to 9 Unit Apartments | 11 (7.4%) | 138 (92.6%) |
| 10 or more Apartments | 12 (8.5%) | 130 (91.5%) |
| Mobile Home / Other | 8 (100.0%) | 0 (0.0%) |
| Total | 1,274 (62.6%) | 760 (37.4%) |
Housing Structures by Number of Rooms in Houlton
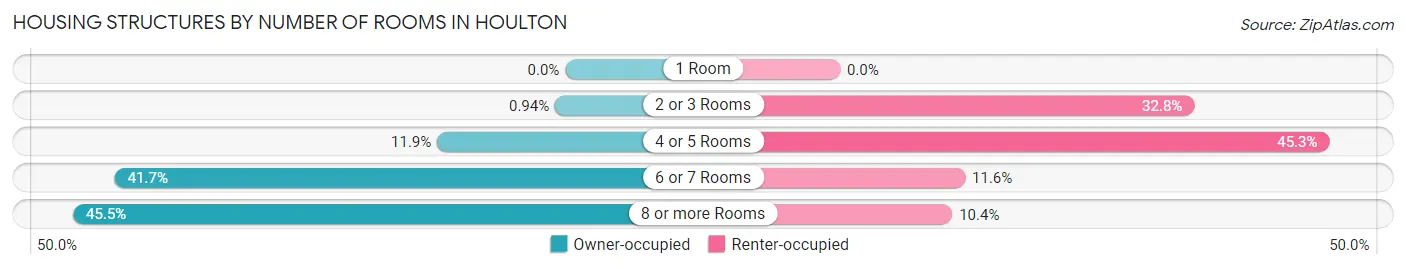
| Number of Rooms | Owner-occupied | Renter-occupied |
| 1 Room | 0 (0.0%) | 0 (0.0%) |
| 2 or 3 Rooms | 12 (0.9%) | 249 (32.8%) |
| 4 or 5 Rooms | 151 (11.8%) | 344 (45.3%) |
| 6 or 7 Rooms | 531 (41.7%) | 88 (11.6%) |
| 8 or more Rooms | 580 (45.5%) | 79 (10.4%) |
| Total | 1,274 (100.0%) | 760 (100.0%) |
Housing Structure by Heating Type in Houlton
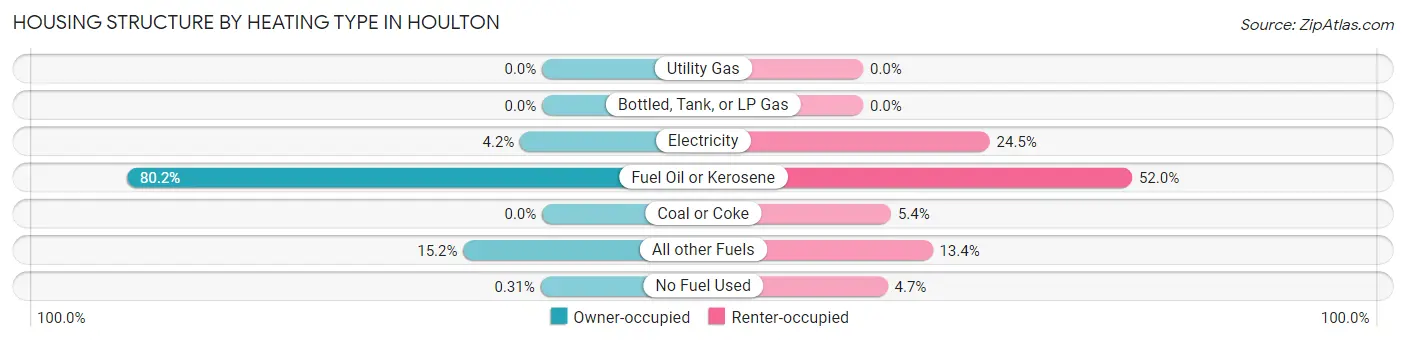
| Heating Type | Owner-occupied | Renter-occupied |
| Utility Gas | 0 (0.0%) | 0 (0.0%) |
| Bottled, Tank, or LP Gas | 0 (0.0%) | 0 (0.0%) |
| Electricity | 54 (4.2%) | 186 (24.5%) |
| Fuel Oil or Kerosene | 1,022 (80.2%) | 395 (52.0%) |
| Coal or Coke | 0 (0.0%) | 41 (5.4%) |
| All other Fuels | 194 (15.2%) | 102 (13.4%) |
| No Fuel Used | 4 (0.3%) | 36 (4.7%) |
| Total | 1,274 (100.0%) | 760 (100.0%) |
Household Vehicle Usage in Houlton
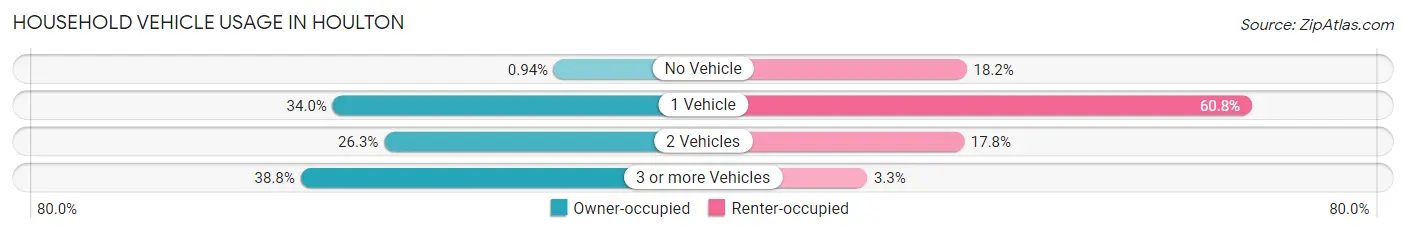
| Vehicles per Household | Owner-occupied | Renter-occupied |
| No Vehicle | 12 (0.9%) | 138 (18.2%) |
| 1 Vehicle | 433 (34.0%) | 462 (60.8%) |
| 2 Vehicles | 335 (26.3%) | 135 (17.8%) |
| 3 or more Vehicles | 494 (38.8%) | 25 (3.3%) |
| Total | 1,274 (100.0%) | 760 (100.0%) |
Real Estate & Mortgages in Houlton
Real Estate and Mortgage Overview in Houlton
| Characteristic | Without Mortgage | With Mortgage |
| Housing Units | 502 | 772 |
| Median Property Value | $101,100 | $152,600 |
| Median Household Income | $42,308 | $182 |
| Monthly Housing Costs | $419 | $8 |
| Real Estate Taxes | $1,407 | $0 |
Property Value by Mortgage Status in Houlton
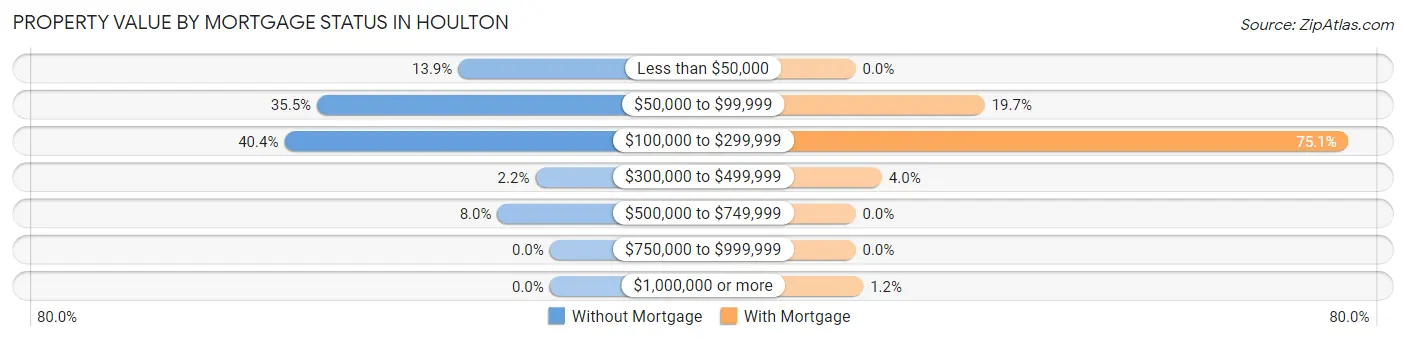
| Property Value | Without Mortgage | With Mortgage |
| Less than $50,000 | 70 (13.9%) | 0 (0.0%) |
| $50,000 to $99,999 | 178 (35.5%) | 152 (19.7%) |
| $100,000 to $299,999 | 203 (40.4%) | 580 (75.1%) |
| $300,000 to $499,999 | 11 (2.2%) | 31 (4.0%) |
| $500,000 to $749,999 | 40 (8.0%) | 0 (0.0%) |
| $750,000 to $999,999 | 0 (0.0%) | 0 (0.0%) |
| $1,000,000 or more | 0 (0.0%) | 9 (1.2%) |
| Total | 502 (100.0%) | 772 (100.0%) |
Household Income by Mortgage Status in Houlton
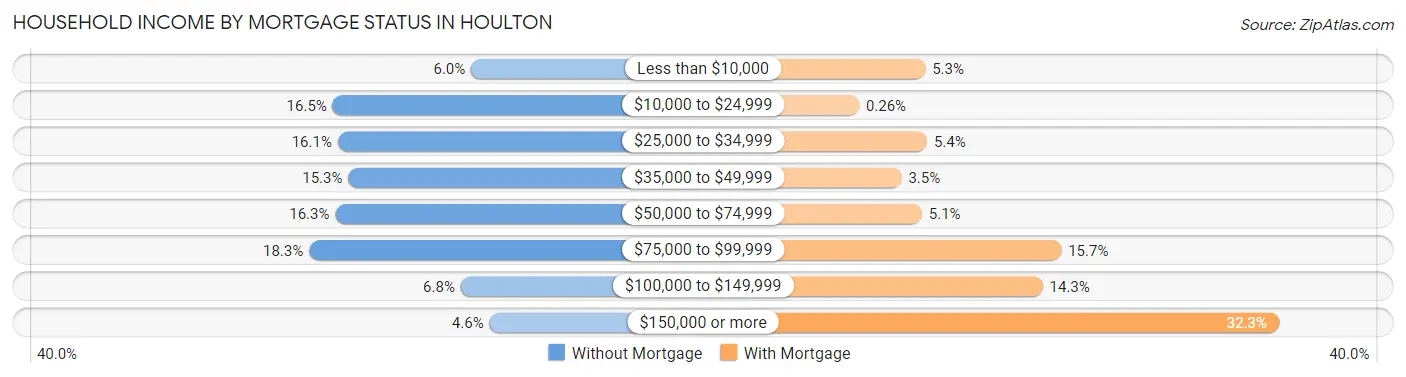
| Household Income | Without Mortgage | With Mortgage |
| Less than $10,000 | 30 (6.0%) | 41 (5.3%) |
| $10,000 to $24,999 | 83 (16.5%) | 2 (0.3%) |
| $25,000 to $34,999 | 81 (16.1%) | 42 (5.4%) |
| $35,000 to $49,999 | 77 (15.3%) | 27 (3.5%) |
| $50,000 to $74,999 | 82 (16.3%) | 39 (5.1%) |
| $75,000 to $99,999 | 92 (18.3%) | 121 (15.7%) |
| $100,000 to $149,999 | 34 (6.8%) | 110 (14.2%) |
| $150,000 or more | 23 (4.6%) | 249 (32.3%) |
| Total | 502 (100.0%) | 772 (100.0%) |
Property Value to Household Income Ratio in Houlton
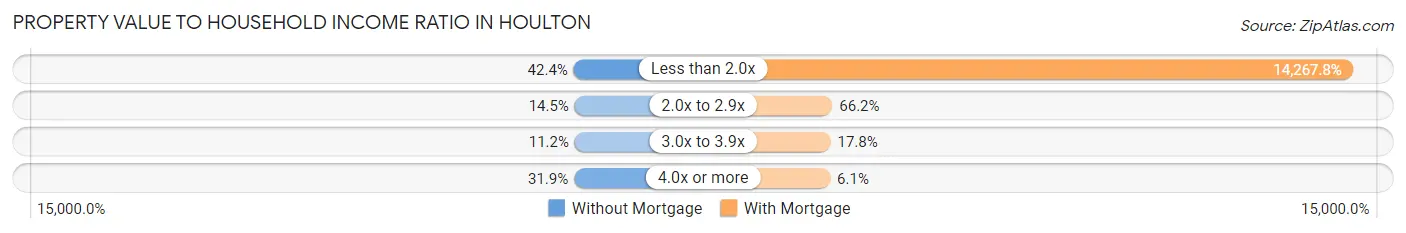
| Value-to-Income Ratio | Without Mortgage | With Mortgage |
| Less than 2.0x | 213 (42.4%) | 110,147 (14,267.8%) |
| 2.0x to 2.9x | 73 (14.5%) | 511 (66.2%) |
| 3.0x to 3.9x | 56 (11.2%) | 137 (17.7%) |
| 4.0x or more | 160 (31.9%) | 47 (6.1%) |
| Total | 502 (100.0%) | 772 (100.0%) |
Real Estate Taxes by Mortgage Status in Houlton
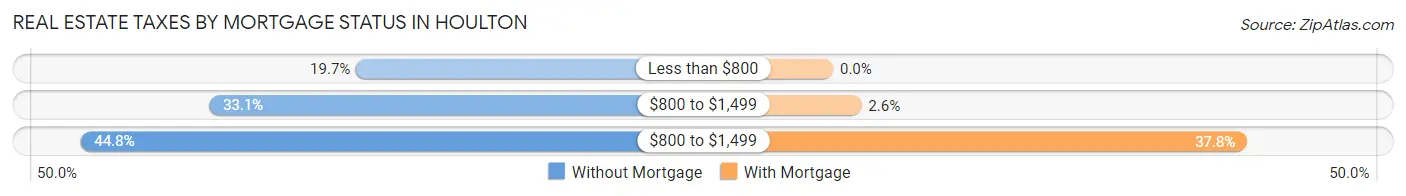
| Property Taxes | Without Mortgage | With Mortgage |
| Less than $800 | 99 (19.7%) | 0 (0.0%) |
| $800 to $1,499 | 166 (33.1%) | 20 (2.6%) |
| $800 to $1,499 | 225 (44.8%) | 292 (37.8%) |
| Total | 502 (100.0%) | 772 (100.0%) |
Health & Disability in Houlton
Health Insurance Coverage by Age in Houlton
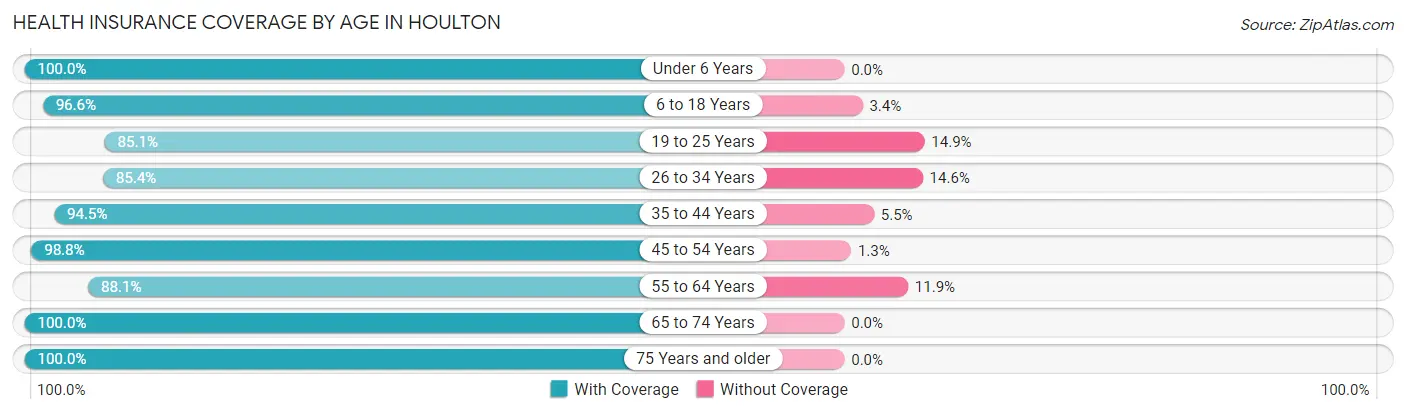
| Age Bracket | With Coverage | Without Coverage |
| Under 6 Years | 175 (100.0%) | 0 (0.0%) |
| 6 to 18 Years | 856 (96.6%) | 30 (3.4%) |
| 19 to 25 Years | 444 (85.1%) | 78 (14.9%) |
| 26 to 34 Years | 304 (85.4%) | 52 (14.6%) |
| 35 to 44 Years | 514 (94.5%) | 30 (5.5%) |
| 45 to 54 Years | 790 (98.8%) | 10 (1.3%) |
| 55 to 64 Years | 312 (88.1%) | 42 (11.9%) |
| 65 to 74 Years | 537 (100.0%) | 0 (0.0%) |
| 75 Years and older | 398 (100.0%) | 0 (0.0%) |
| Total | 4,330 (94.7%) | 242 (5.3%) |
Health Insurance Coverage by Citizenship Status in Houlton
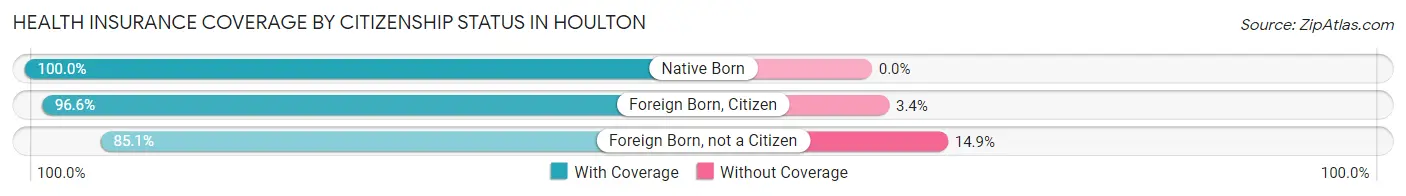
| Citizenship Status | With Coverage | Without Coverage |
| Native Born | 175 (100.0%) | 0 (0.0%) |
| Foreign Born, Citizen | 856 (96.6%) | 30 (3.4%) |
| Foreign Born, not a Citizen | 444 (85.1%) | 78 (14.9%) |
Health Insurance Coverage by Household Income in Houlton
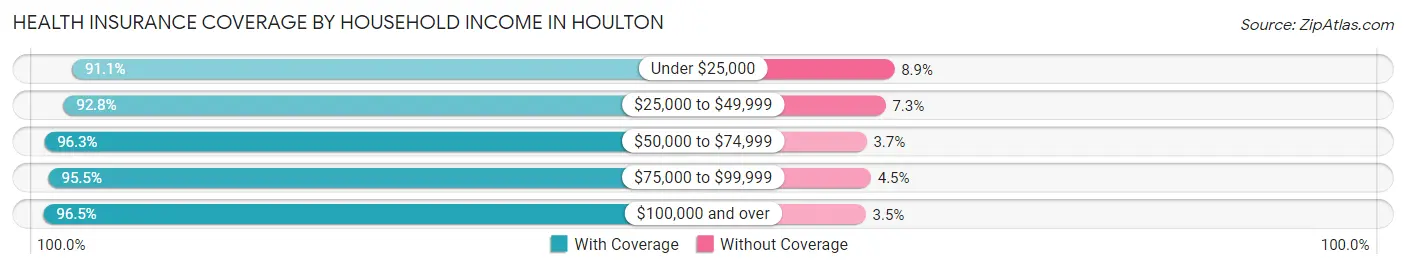
| Household Income | With Coverage | Without Coverage |
| Under $25,000 | 676 (91.1%) | 66 (8.9%) |
| $25,000 to $49,999 | 896 (92.7%) | 70 (7.2%) |
| $50,000 to $74,999 | 498 (96.3%) | 19 (3.7%) |
| $75,000 to $99,999 | 489 (95.5%) | 23 (4.5%) |
| $100,000 and over | 1,749 (96.5%) | 64 (3.5%) |
Public vs Private Health Insurance Coverage by Age in Houlton
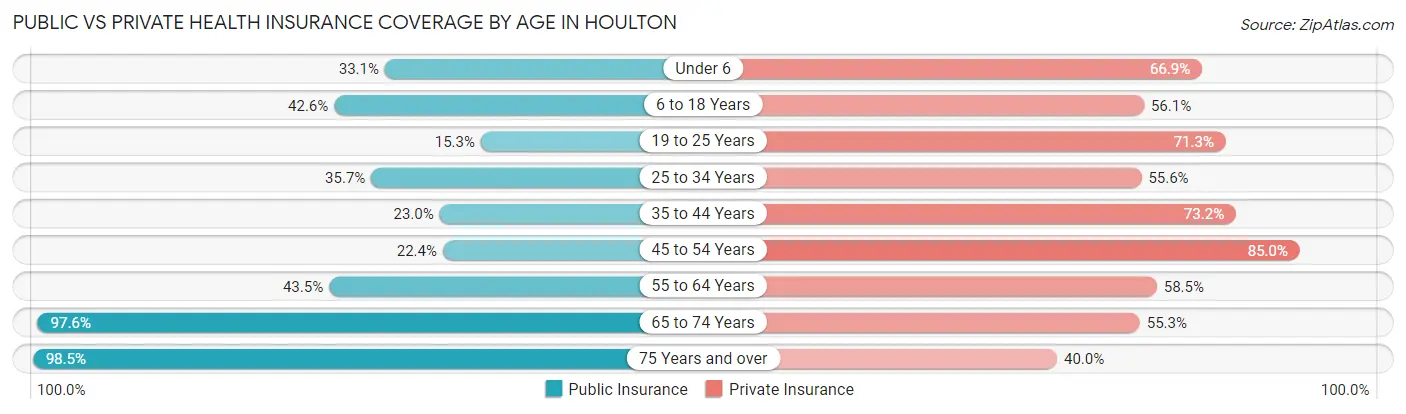
| Age Bracket | Public Insurance | Private Insurance |
| Under 6 | 58 (33.1%) | 117 (66.9%) |
| 6 to 18 Years | 377 (42.5%) | 497 (56.1%) |
| 19 to 25 Years | 80 (15.3%) | 372 (71.3%) |
| 25 to 34 Years | 127 (35.7%) | 198 (55.6%) |
| 35 to 44 Years | 125 (23.0%) | 398 (73.2%) |
| 45 to 54 Years | 179 (22.4%) | 680 (85.0%) |
| 55 to 64 Years | 154 (43.5%) | 207 (58.5%) |
| 65 to 74 Years | 524 (97.6%) | 297 (55.3%) |
| 75 Years and over | 392 (98.5%) | 159 (40.0%) |
| Total | 2,016 (44.1%) | 2,925 (64.0%) |
Disability Status by Sex by Age in Houlton
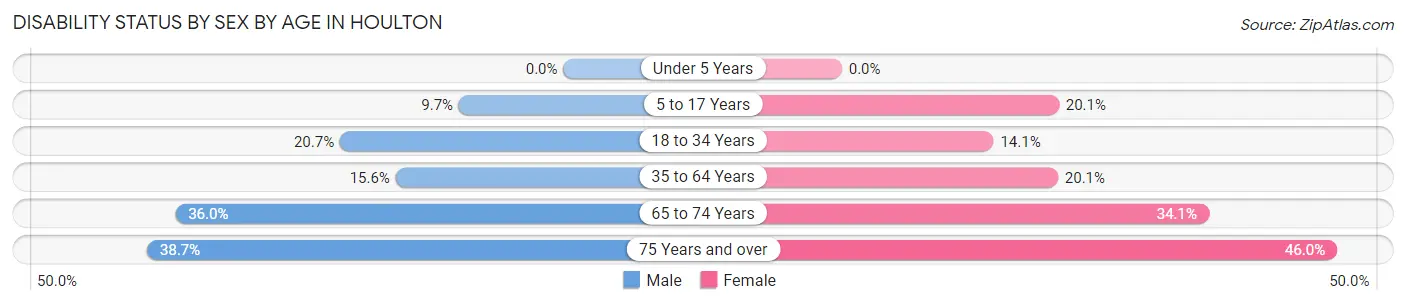
| Age Bracket | Male | Female |
| Under 5 Years | 0 (0.0%) | 0 (0.0%) |
| 5 to 17 Years | 41 (9.7%) | 85 (20.1%) |
| 18 to 34 Years | 108 (20.7%) | 58 (14.1%) |
| 35 to 64 Years | 126 (15.6%) | 178 (20.1%) |
| 65 to 74 Years | 94 (36.0%) | 94 (34.1%) |
| 75 Years and over | 63 (38.7%) | 108 (46.0%) |
Disability Class by Sex by Age in Houlton
Disability Class: Hearing Difficulty
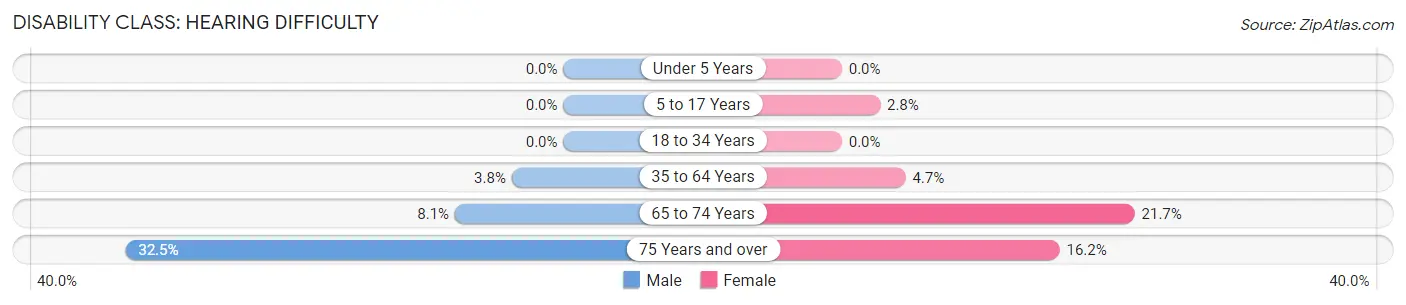
| Age Bracket | Male | Female |
| Under 5 Years | 0 (0.0%) | 0 (0.0%) |
| 5 to 17 Years | 0 (0.0%) | 12 (2.8%) |
| 18 to 34 Years | 0 (0.0%) | 0 (0.0%) |
| 35 to 64 Years | 31 (3.8%) | 42 (4.7%) |
| 65 to 74 Years | 21 (8.1%) | 60 (21.7%) |
| 75 Years and over | 53 (32.5%) | 38 (16.2%) |
Disability Class: Vision Difficulty
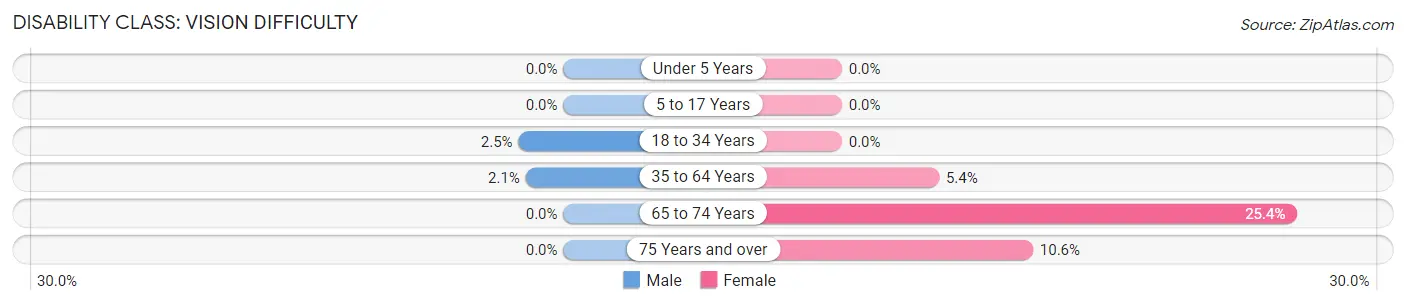
| Age Bracket | Male | Female |
| Under 5 Years | 0 (0.0%) | 0 (0.0%) |
| 5 to 17 Years | 0 (0.0%) | 0 (0.0%) |
| 18 to 34 Years | 13 (2.5%) | 0 (0.0%) |
| 35 to 64 Years | 17 (2.1%) | 48 (5.4%) |
| 65 to 74 Years | 0 (0.0%) | 70 (25.4%) |
| 75 Years and over | 0 (0.0%) | 25 (10.6%) |
Disability Class: Cognitive Difficulty
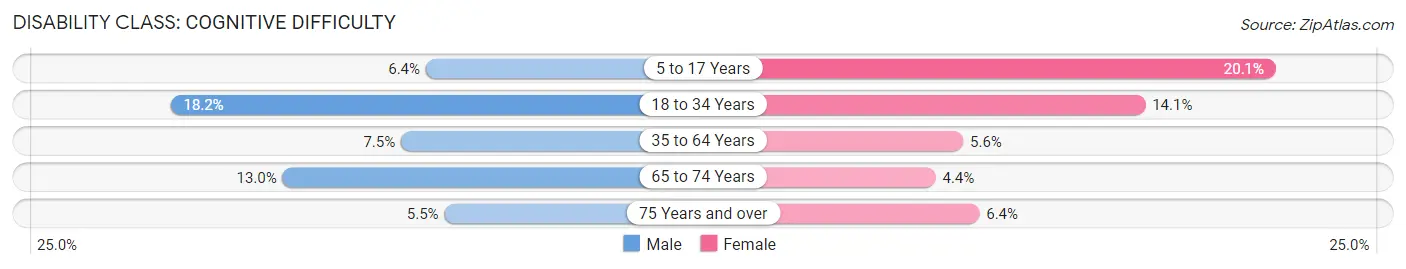
| Age Bracket | Male | Female |
| 5 to 17 Years | 27 (6.4%) | 85 (20.1%) |
| 18 to 34 Years | 95 (18.2%) | 58 (14.1%) |
| 35 to 64 Years | 61 (7.5%) | 50 (5.6%) |
| 65 to 74 Years | 34 (13.0%) | 12 (4.3%) |
| 75 Years and over | 9 (5.5%) | 15 (6.4%) |
Disability Class: Ambulatory Difficulty
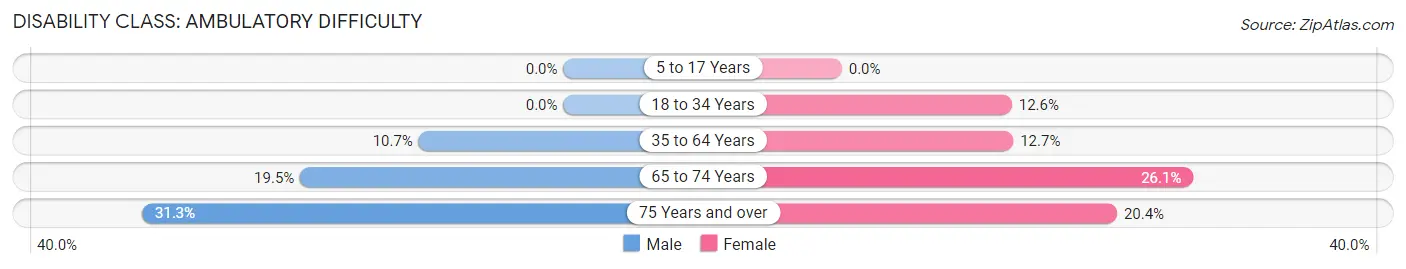
| Age Bracket | Male | Female |
| 5 to 17 Years | 0 (0.0%) | 0 (0.0%) |
| 18 to 34 Years | 0 (0.0%) | 52 (12.6%) |
| 35 to 64 Years | 87 (10.7%) | 113 (12.7%) |
| 65 to 74 Years | 51 (19.5%) | 72 (26.1%) |
| 75 Years and over | 51 (31.3%) | 48 (20.4%) |
Disability Class: Self-Care Difficulty
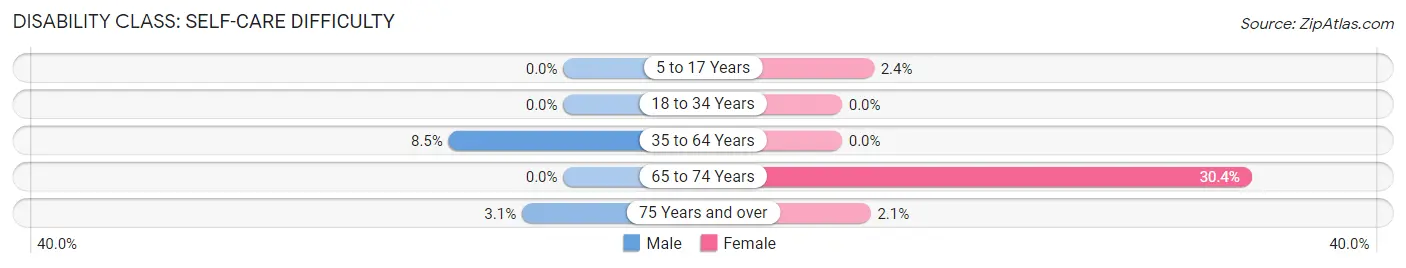
| Age Bracket | Male | Female |
| 5 to 17 Years | 0 (0.0%) | 10 (2.4%) |
| 18 to 34 Years | 0 (0.0%) | 0 (0.0%) |
| 35 to 64 Years | 69 (8.5%) | 0 (0.0%) |
| 65 to 74 Years | 0 (0.0%) | 84 (30.4%) |
| 75 Years and over | 5 (3.1%) | 5 (2.1%) |
Technology Access in Houlton
Computing Device Access in Houlton
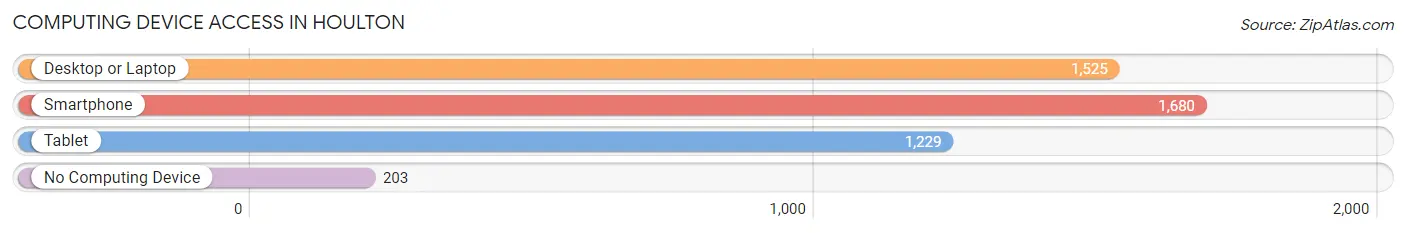
| Device Type | # Households | % Households |
| Desktop or Laptop | 1,525 | 75.0% |
| Smartphone | 1,680 | 82.6% |
| Tablet | 1,229 | 60.4% |
| No Computing Device | 203 | 10.0% |
| Total | 2,034 | 100.0% |
Internet Access in Houlton
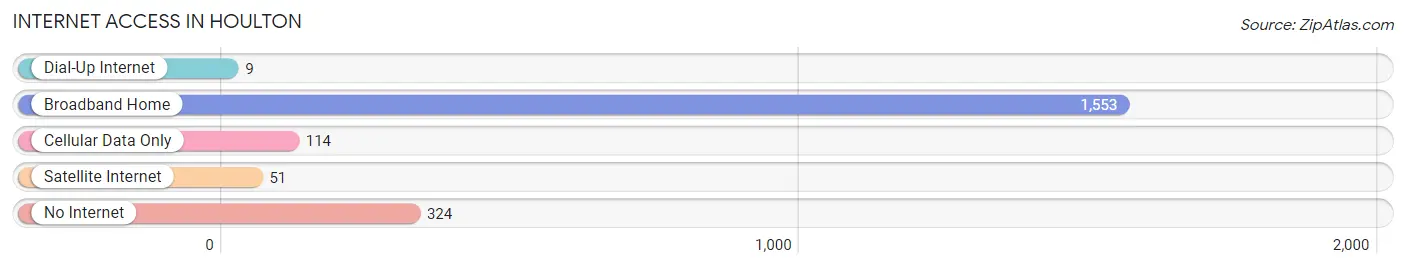
| Internet Type | # Households | % Households |
| Dial-Up Internet | 9 | 0.4% |
| Broadband Home | 1,553 | 76.3% |
| Cellular Data Only | 114 | 5.6% |
| Satellite Internet | 51 | 2.5% |
| No Internet | 324 | 15.9% |
| Total | 2,034 | 100.0% |
Houlton Summary
Houlton, Maine is a small town located in Aroostook County, in the northernmost part of the state. It is the county seat and the largest town in the county, with a population of 6,123 as of the 2010 census. The town is situated on the banks of the Meduxnekeag River, near the border with Canada.
History
Houlton was first settled in 1807 by Joseph Houlton, a Revolutionary War veteran from Massachusetts. He was granted a large tract of land by the state of Maine, and he and his family established a homestead on the banks of the Meduxnekeag River. The town was incorporated in 1831, and the first post office was established in 1832.
In the mid-19th century, Houlton became an important stop on the stagecoach route between Bangor and Fredericton, New Brunswick. The town was also a major center for the lumber industry, and the first sawmill was built in 1845.
In the late 19th century, Houlton became a major hub for the potato industry. The town was home to several large potato warehouses, and the industry provided employment for many of the town's residents.
Geography
Houlton is located in the northernmost part of Maine, near the border with Canada. The town is situated on the banks of the Meduxnekeag River, and is surrounded by rolling hills and forests. The town is located about 40 miles south of the Canadian border, and about 100 miles north of Bangor.
The town has a total area of 8.2 square miles, of which 8.1 square miles is land and 0.1 square miles is water. The town is located in the St. John Valley, and is part of the Aroostook Valley region.
Economy
Houlton's economy is largely based on agriculture and tourism. The town is home to several large potato warehouses, and the potato industry is still an important part of the local economy. The town is also home to several small businesses, including restaurants, retail stores, and service providers.
Tourism is also an important part of the local economy. The town is home to several attractions, including the Aroostook State Park, the Houlton Historical Society Museum, and the Houlton Community Theater. The town is also home to several festivals and events, including the Houlton Fair and the Houlton Agricultural Fair.
Demographics
As of the 2010 census, Houlton had a population of 6,123. The racial makeup of the town was 95.3% White, 0.7% African American, 0.7% Native American, 0.7% Asian, 0.2% Pacific Islander, 0.7% from other races, and 1.6% from two or more races. Hispanic or Latino of any race were 1.3% of the population.
The median income for a household in the town was $35,938, and the median income for a family was $45,938. The per capita income for the town was $18,938. About 11.3% of families and 14.3% of the population were below the poverty line, including 17.3% of those under age 18 and 8.3% of those age 65 or over.
Common Questions
What is Per Capita Income in Houlton?
Per Capita income in Houlton is $30,459.
What is the Median Family Income in Houlton?
Median Family Income in Houlton is $97,594.
What is the Median Household income in Houlton?
Median Household Income in Houlton is $50,625.
What is Income or Wage Gap in Houlton?
Income or Wage Gap in Houlton is 46.8%.
Women in Houlton earn 53.2 cents for every dollar earned by a man.
What is Inequality or Gini Index in Houlton?
Inequality or Gini Index in Houlton is 0.49.
What is the Total Population of Houlton?
Total Population of Houlton is 4,918.
What is the Total Male Population of Houlton?
Total Male Population of Houlton is 2,402.
What is the Total Female Population of Houlton?
Total Female Population of Houlton is 2,516.
What is the Ratio of Males per 100 Females in Houlton?
There are 95.47 Males per 100 Females in Houlton.
What is the Ratio of Females per 100 Males in Houlton?
There are 104.75 Females per 100 Males in Houlton.
What is the Median Population Age in Houlton?
Median Population Age in Houlton is 44.2 Years.
What is the Average Family Size in Houlton
Average Family Size in Houlton is 3.3 People.
What is the Average Household Size in Houlton
Average Household Size in Houlton is 2.2 People.
How Large is the Labor Force in Houlton?
There are 2,358 People in the Labor Forcein in Houlton.
What is the Percentage of People in the Labor Force in Houlton?
58.3% of People are in the Labor Force in Houlton.
What is the Unemployment Rate in Houlton?
Unemployment Rate in Houlton is 18.6%.