Biddeford, ME Map & Demographics
Biddeford Map
Biddeford Overview
$36,617
PER CAPITA INCOME
$80,583
AVG FAMILY INCOME
$63,261
AVG HOUSEHOLD INCOME
27.3%
WAGE / INCOME GAP [ % ]
72.7¢/ $1
WAGE / INCOME GAP [ $ ]
0.43
INEQUALITY / GINI INDEX
22,438
TOTAL POPULATION
11,232
MALE POPULATION
11,206
FEMALE POPULATION
100.23
MALES / 100 FEMALES
99.77
FEMALES / 100 MALES
36.8
MEDIAN AGE
2.9
AVG FAMILY SIZE
2.2
AVG HOUSEHOLD SIZE
13,213
LABOR FORCE [ PEOPLE ]
67.3%
PERCENT IN LABOR FORCE
4.7%
UNEMPLOYMENT RATE
Biddeford Zip Codes
Biddeford Area Codes
Income in Biddeford
Income Overview in Biddeford
Per Capita Income in Biddeford is $36,617, while median incomes of families and households are $80,583 and $63,261 respectively.
| Characteristic | Number | Measure |
| Per Capita Income | 22,438 | $36,617 |
| Median Family Income | 4,876 | $80,583 |
| Mean Family Income | 4,876 | $104,668 |
| Median Household Income | 9,575 | $63,261 |
| Mean Household Income | 9,575 | $83,877 |
| Income Deficit | 4,876 | $0 |
| Wage / Income Gap (%) | 22,438 | 27.30% |
| Wage / Income Gap ($) | 22,438 | 72.70¢ per $1 |
| Gini / Inequality Index | 22,438 | 0.43 |
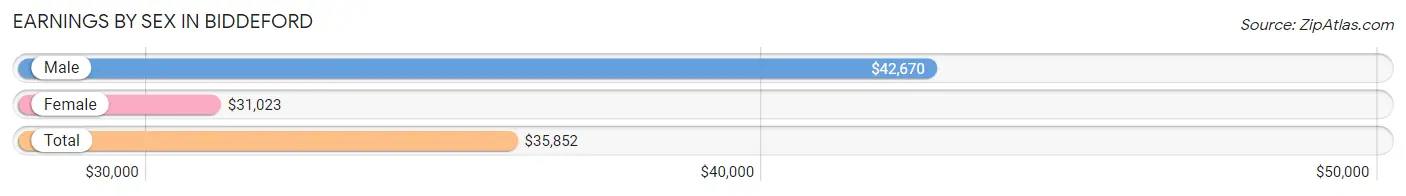
Earnings by Sex in Biddeford
Average Earnings in Biddeford are $35,852, $42,670 for men and $31,023 for women, a difference of 27.3%.
| Sex | Number | Average Earnings |
| Male | 7,395 (51.9%) | $42,670 |
| Female | 6,856 (48.1%) | $31,023 |
| Total | 14,251 (100.0%) | $35,852 |
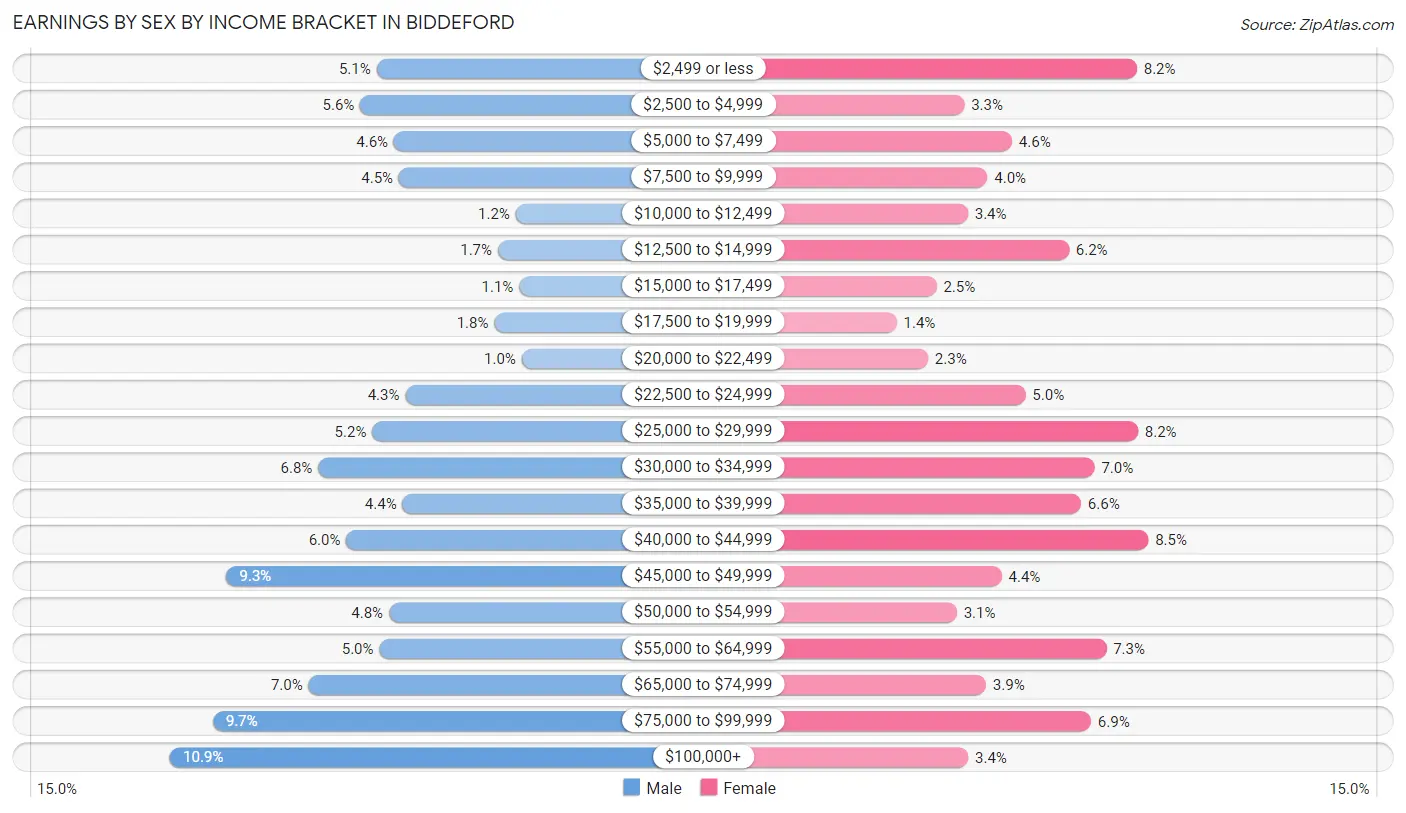
Earnings by Sex by Income Bracket in Biddeford
The most common earnings brackets in Biddeford are $100,000+ for men (807 | 10.9%) and $40,000 to $44,999 for women (581 | 8.5%).
| Income | Male | Female |
| $2,499 or less | 378 (5.1%) | 559 (8.2%) |
| $2,500 to $4,999 | 412 (5.6%) | 226 (3.3%) |
| $5,000 to $7,499 | 342 (4.6%) | 318 (4.6%) |
| $7,500 to $9,999 | 331 (4.5%) | 271 (4.0%) |
| $10,000 to $12,499 | 89 (1.2%) | 233 (3.4%) |
| $12,500 to $14,999 | 126 (1.7%) | 428 (6.2%) |
| $15,000 to $17,499 | 81 (1.1%) | 173 (2.5%) |
| $17,500 to $19,999 | 133 (1.8%) | 96 (1.4%) |
| $20,000 to $22,499 | 76 (1.0%) | 156 (2.3%) |
| $22,500 to $24,999 | 318 (4.3%) | 344 (5.0%) |
| $25,000 to $29,999 | 387 (5.2%) | 561 (8.2%) |
| $30,000 to $34,999 | 499 (6.8%) | 477 (7.0%) |
| $35,000 to $39,999 | 324 (4.4%) | 451 (6.6%) |
| $40,000 to $44,999 | 441 (6.0%) | 581 (8.5%) |
| $45,000 to $49,999 | 690 (9.3%) | 298 (4.3%) |
| $50,000 to $54,999 | 352 (4.8%) | 212 (3.1%) |
| $55,000 to $64,999 | 372 (5.0%) | 500 (7.3%) |
| $65,000 to $74,999 | 519 (7.0%) | 268 (3.9%) |
| $75,000 to $99,999 | 718 (9.7%) | 470 (6.9%) |
| $100,000+ | 807 (10.9%) | 234 (3.4%) |
| Total | 7,395 (100.0%) | 6,856 (100.0%) |
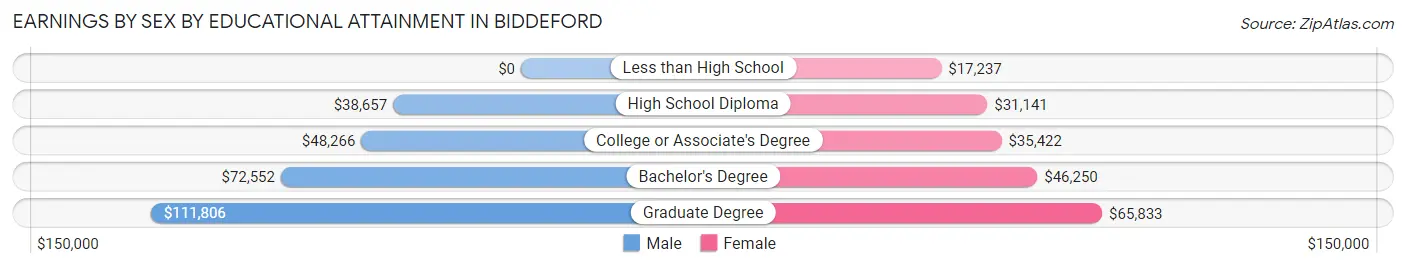
Earnings by Sex by Educational Attainment in Biddeford
Average earnings in Biddeford are $47,884 for men and $39,100 for women, a difference of 18.3%. Men with an educational attainment of graduate degree enjoy the highest average annual earnings of $111,806, while those with high school diploma education earn the least with $38,657. Women with an educational attainment of graduate degree earn the most with the average annual earnings of $65,833, while those with less than high school education have the smallest earnings of $17,237.
| Educational Attainment | Male Income | Female Income |
| Less than High School | - | - |
| High School Diploma | $38,657 | $31,141 |
| College or Associate's Degree | $48,266 | $35,422 |
| Bachelor's Degree | $72,552 | $46,250 |
| Graduate Degree | $111,806 | $65,833 |
| Total | $47,884 | $39,100 |
Family Income in Biddeford
Family Income Brackets in Biddeford
According to the Biddeford family income data, there are 995 families falling into the $50,000 to $74,999 income range, which is the most common income bracket and makes up 20.4% of all families. Conversely, the $10,000 to $14,999 income bracket is the least frequent group with only 34 families (0.7%) belonging to this category.
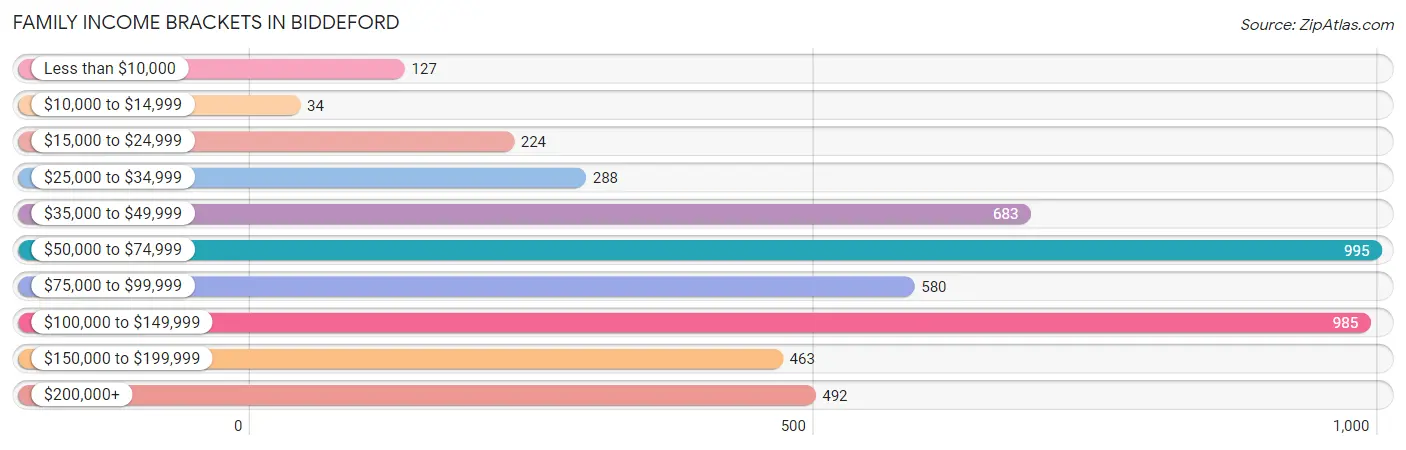
| Income Bracket | # Families | % Families |
| Less than $10,000 | 127 | 2.6% |
| $10,000 to $14,999 | 34 | 0.7% |
| $15,000 to $24,999 | 224 | 4.6% |
| $25,000 to $34,999 | 288 | 5.9% |
| $35,000 to $49,999 | 683 | 14.0% |
| $50,000 to $74,999 | 995 | 20.4% |
| $75,000 to $99,999 | 580 | 11.9% |
| $100,000 to $149,999 | 985 | 20.2% |
| $150,000 to $199,999 | 463 | 9.5% |
| $200,000+ | 492 | 10.1% |
Family Income by Famaliy Size in Biddeford
5-person families (213 | 4.4%) account for the highest median family income in Biddeford with $112,212 per family, while 2-person families (2,513 | 51.5%) have the highest median income of $37,774 per family member.
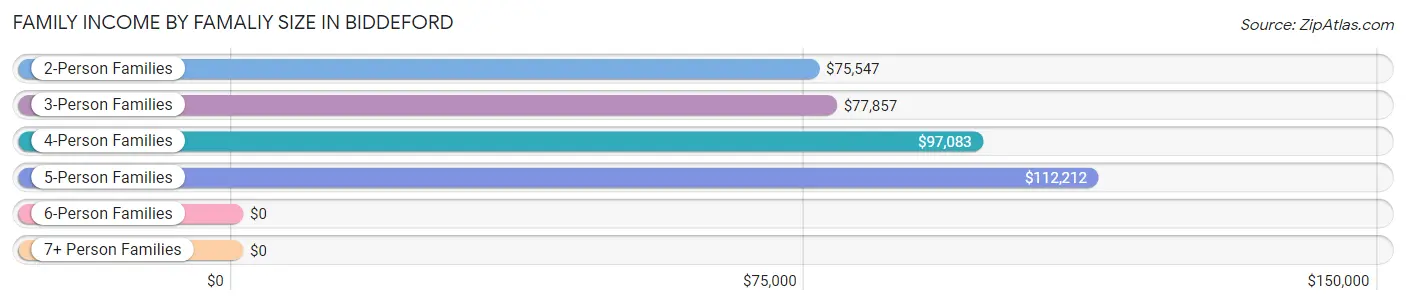
| Income Bracket | # Families | Median Income |
| 2-Person Families | 2,513 (51.5%) | $75,547 |
| 3-Person Families | 1,290 (26.5%) | $77,857 |
| 4-Person Families | 695 (14.2%) | $97,083 |
| 5-Person Families | 213 (4.4%) | $112,212 |
| 6-Person Families | 159 (3.3%) | $0 |
| 7+ Person Families | 6 (0.1%) | $0 |
| Total | 4,876 (100.0%) | $80,583 |
Family Income by Number of Earners in Biddeford
The median family income in Biddeford is $80,583, with families comprising 3+ earners (735) having the highest median family income of $144,489, while families with 1 earner (1,602) have the lowest median family income of $48,715, accounting for 15.1% and 32.9% of families, respectively.
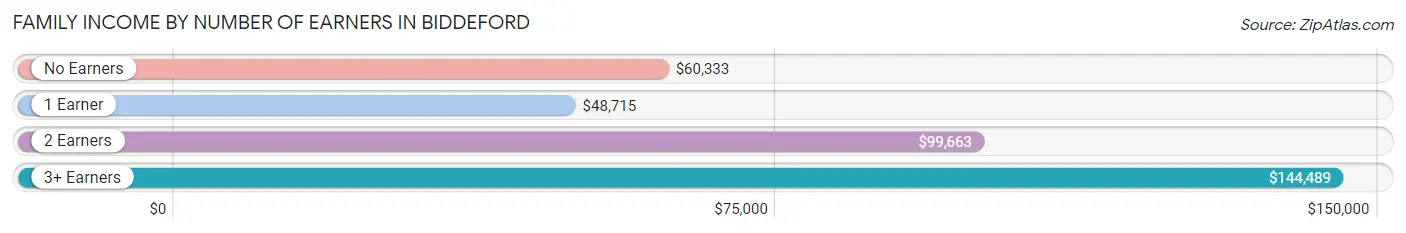
| Number of Earners | # Families | Median Income |
| No Earners | 596 (12.2%) | $60,333 |
| 1 Earner | 1,602 (32.9%) | $48,715 |
| 2 Earners | 1,943 (39.9%) | $99,663 |
| 3+ Earners | 735 (15.1%) | $144,489 |
| Total | 4,876 (100.0%) | $80,583 |
Household Income in Biddeford
Household Income Brackets in Biddeford
With 2,164 households falling in the category, the $50,000 to $74,999 income range is the most frequent in Biddeford, accounting for 22.6% of all households. In contrast, only 326 households (3.4%) fall into the less than $10,000 income bracket, making it the least populous group.
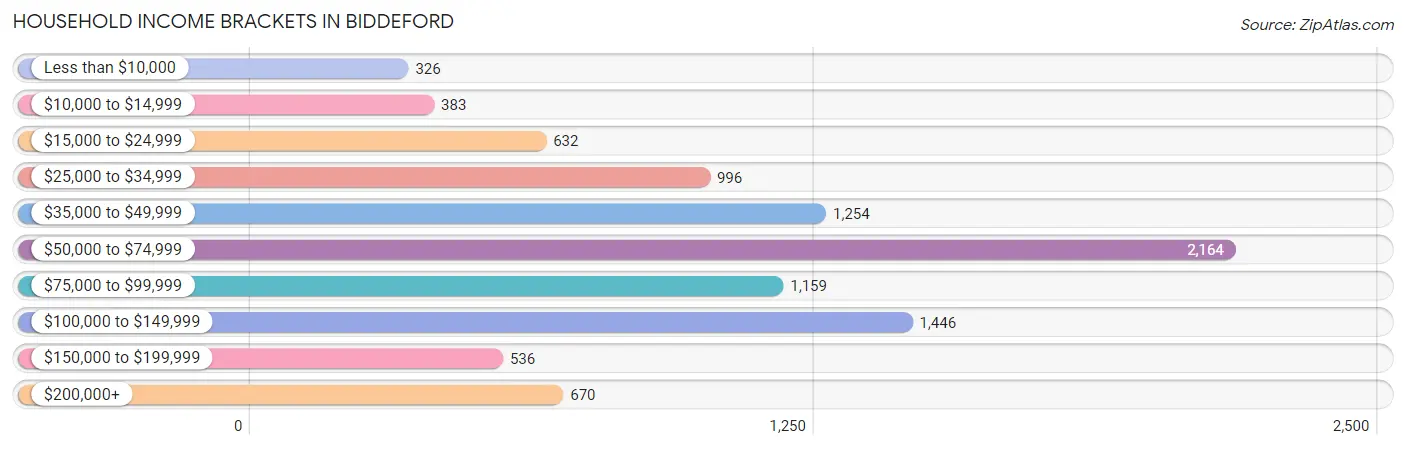
| Income Bracket | # Households | % Households |
| Less than $10,000 | 326 | 3.4% |
| $10,000 to $14,999 | 383 | 4.0% |
| $15,000 to $24,999 | 632 | 6.6% |
| $25,000 to $34,999 | 996 | 10.4% |
| $35,000 to $49,999 | 1,254 | 13.1% |
| $50,000 to $74,999 | 2,164 | 22.6% |
| $75,000 to $99,999 | 1,159 | 12.1% |
| $100,000 to $149,999 | 1,446 | 15.1% |
| $150,000 to $199,999 | 536 | 5.6% |
| $200,000+ | 670 | 7.0% |
Household Income by Householder Age in Biddeford
The median household income in Biddeford is $63,261, with the highest median household income of $68,253 found in the 25 to 44 years age bracket for the primary householder. A total of 3,311 households (34.6%) fall into this category. Meanwhile, the 65+ years age bracket for the primary householder has the lowest median household income of $49,706, with 2,394 households (25.0%) in this group.
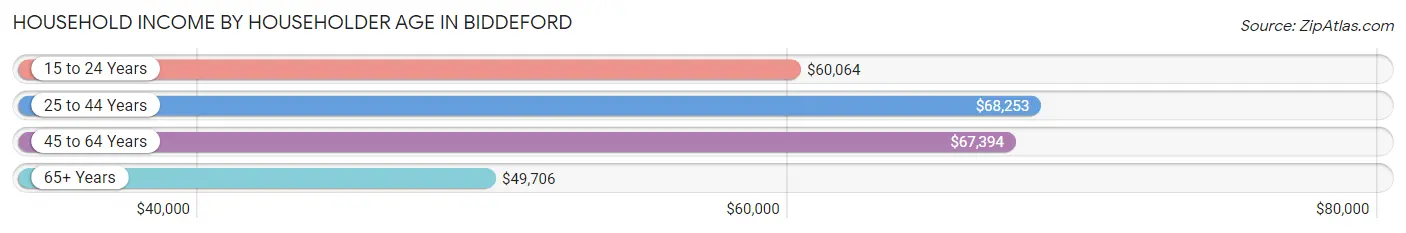
| Income Bracket | # Households | Median Income |
| 15 to 24 Years | 594 (6.2%) | $60,064 |
| 25 to 44 Years | 3,311 (34.6%) | $68,253 |
| 45 to 64 Years | 3,276 (34.2%) | $67,394 |
| 65+ Years | 2,394 (25.0%) | $49,706 |
| Total | 9,575 (100.0%) | $63,261 |
Poverty in Biddeford
Income Below Poverty by Sex and Age in Biddeford
With 12.3% poverty level for males and 13.0% for females among the residents of Biddeford, 12 to 14 year old males and 6 to 11 year old females are the most vulnerable to poverty, with 164 males (54.1%) and 171 females (28.2%) in their respective age groups living below the poverty level.
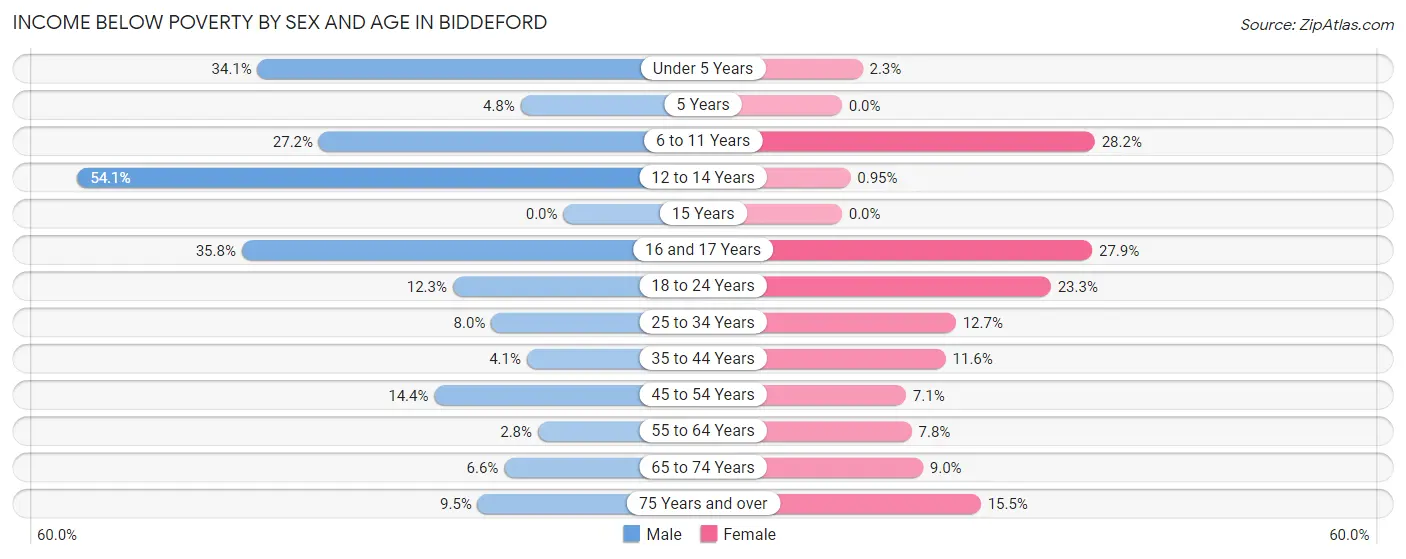
| Age Bracket | Male | Female |
| Under 5 Years | 189 (34.1%) | 8 (2.3%) |
| 5 Years | 2 (4.8%) | 0 (0.0%) |
| 6 to 11 Years | 107 (27.2%) | 171 (28.2%) |
| 12 to 14 Years | 164 (54.1%) | 2 (0.9%) |
| 15 Years | 0 (0.0%) | 0 (0.0%) |
| 16 and 17 Years | 120 (35.8%) | 68 (27.9%) |
| 18 to 24 Years | 113 (12.3%) | 306 (23.3%) |
| 25 to 34 Years | 197 (8.0%) | 224 (12.7%) |
| 35 to 44 Years | 51 (4.1%) | 151 (11.6%) |
| 45 to 54 Years | 210 (14.4%) | 89 (7.1%) |
| 55 to 64 Years | 35 (2.8%) | 99 (7.8%) |
| 65 to 74 Years | 62 (6.6%) | 95 (9.0%) |
| 75 Years and over | 73 (9.5%) | 144 (15.5%) |
| Total | 1,323 (12.3%) | 1,357 (13.0%) |
Income Above Poverty by Sex and Age in Biddeford
According to the poverty statistics in Biddeford, males aged 15 years and females aged 5 years are the age groups that are most secure financially, with 100.0% of males and 100.0% of females in these age groups living above the poverty line.
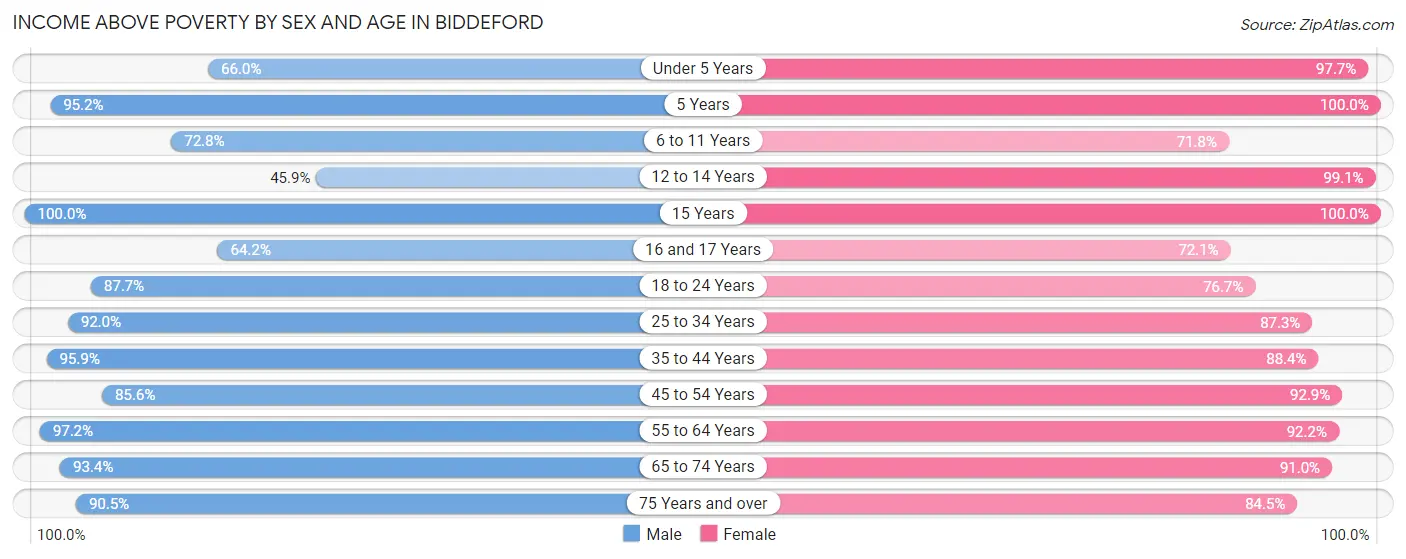
| Age Bracket | Male | Female |
| Under 5 Years | 366 (65.9%) | 339 (97.7%) |
| 5 Years | 40 (95.2%) | 85 (100.0%) |
| 6 to 11 Years | 286 (72.8%) | 436 (71.8%) |
| 12 to 14 Years | 139 (45.9%) | 209 (99.1%) |
| 15 Years | 111 (100.0%) | 75 (100.0%) |
| 16 and 17 Years | 215 (64.2%) | 176 (72.1%) |
| 18 to 24 Years | 805 (87.7%) | 1,009 (76.7%) |
| 25 to 34 Years | 2,255 (92.0%) | 1,541 (87.3%) |
| 35 to 44 Years | 1,201 (95.9%) | 1,155 (88.4%) |
| 45 to 54 Years | 1,251 (85.6%) | 1,157 (92.9%) |
| 55 to 64 Years | 1,198 (97.2%) | 1,175 (92.2%) |
| 65 to 74 Years | 879 (93.4%) | 957 (91.0%) |
| 75 Years and over | 692 (90.5%) | 787 (84.5%) |
| Total | 9,438 (87.7%) | 9,101 (87.0%) |
Income Below Poverty Among Married-Couple Families in Biddeford
The poverty statistics for married-couple families in Biddeford show that 2.1% or 71 of the total 3,421 families live below the poverty line. Families with 3 or 4 children have the highest poverty rate of 6.1%, comprising of 5 families. On the other hand, families with 1 or 2 children have the lowest poverty rate of 1.0%, which includes 9 families.
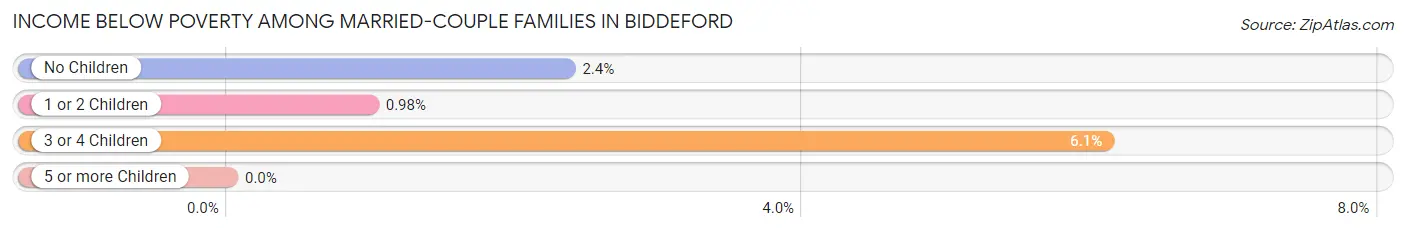
| Children | Above Poverty | Below Poverty |
| No Children | 2,367 (97.7%) | 57 (2.4%) |
| 1 or 2 Children | 906 (99.0%) | 9 (1.0%) |
| 3 or 4 Children | 77 (93.9%) | 5 (6.1%) |
| 5 or more Children | 0 (0.0%) | 0 (0.0%) |
| Total | 3,350 (97.9%) | 71 (2.1%) |
Income Below Poverty Among Single-Parent Households in Biddeford
According to the poverty data in Biddeford, 3.1% or 12 single-father households and 20.3% or 216 single-mother households are living below the poverty line. Among single-father households, those with 1 or 2 children have the highest poverty rate, with 12 households (10.3%) experiencing poverty. Likewise, among single-mother households, those with 3 or 4 children have the highest poverty rate, with 38 households (100.0%) falling below the poverty line.
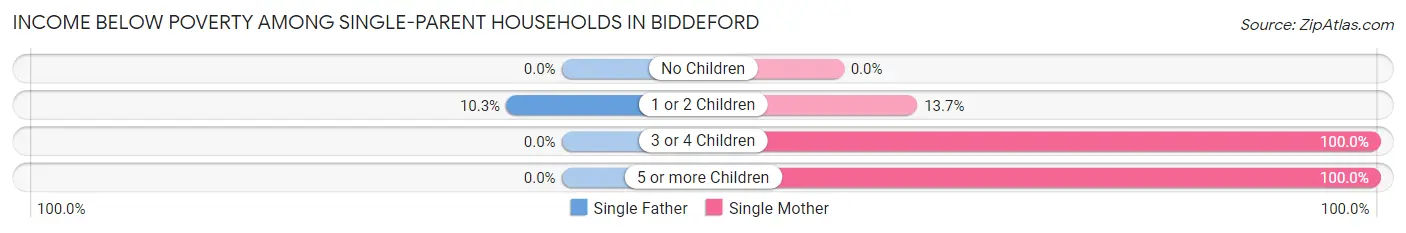
| Children | Single Father | Single Mother |
| No Children | 0 (0.0%) | 0 (0.0%) |
| 1 or 2 Children | 12 (10.3%) | 83 (13.7%) |
| 3 or 4 Children | 0 (0.0%) | 38 (100.0%) |
| 5 or more Children | 0 (0.0%) | 95 (100.0%) |
| Total | 12 (3.1%) | 216 (20.3%) |
Income Below Poverty Among Married-Couple vs Single-Parent Households in Biddeford
The poverty data for Biddeford shows that 71 of the married-couple family households (2.1%) and 228 of the single-parent households (15.7%) are living below the poverty level. Within the married-couple family households, those with 3 or 4 children have the highest poverty rate, with 5 households (6.1%) falling below the poverty line. Among the single-parent households, those with 3 or 4 children have the highest poverty rate, with 38 household (100.0%) living below poverty.
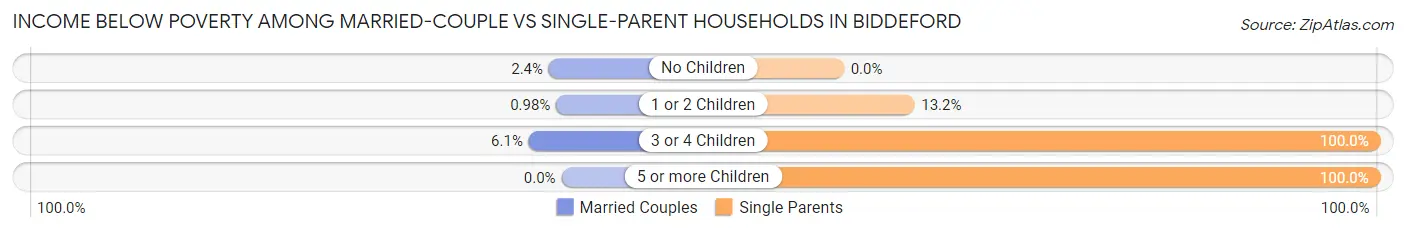
| Children | Married-Couple Families | Single-Parent Households |
| No Children | 57 (2.4%) | 0 (0.0%) |
| 1 or 2 Children | 9 (1.0%) | 95 (13.2%) |
| 3 or 4 Children | 5 (6.1%) | 38 (100.0%) |
| 5 or more Children | 0 (0.0%) | 95 (100.0%) |
| Total | 71 (2.1%) | 228 (15.7%) |
Race in Biddeford
The most populous races in Biddeford are White / Caucasian (20,751 | 92.5%), Two or more Races (805 | 3.6%), and Hispanic or Latino (621 | 2.8%).
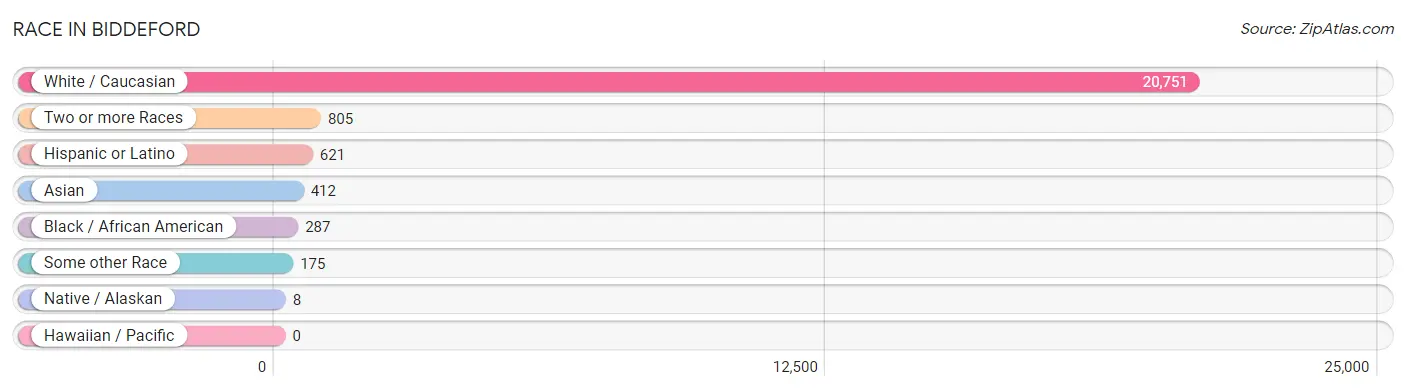
| Race | # Population | % Population |
| Asian | 412 | 1.8% |
| Black / African American | 287 | 1.3% |
| Hawaiian / Pacific | 0 | 0.0% |
| Hispanic or Latino | 621 | 2.8% |
| Native / Alaskan | 8 | 0.0% |
| White / Caucasian | 20,751 | 92.5% |
| Two or more Races | 805 | 3.6% |
| Some other Race | 175 | 0.8% |
| Total | 22,438 | 100.0% |
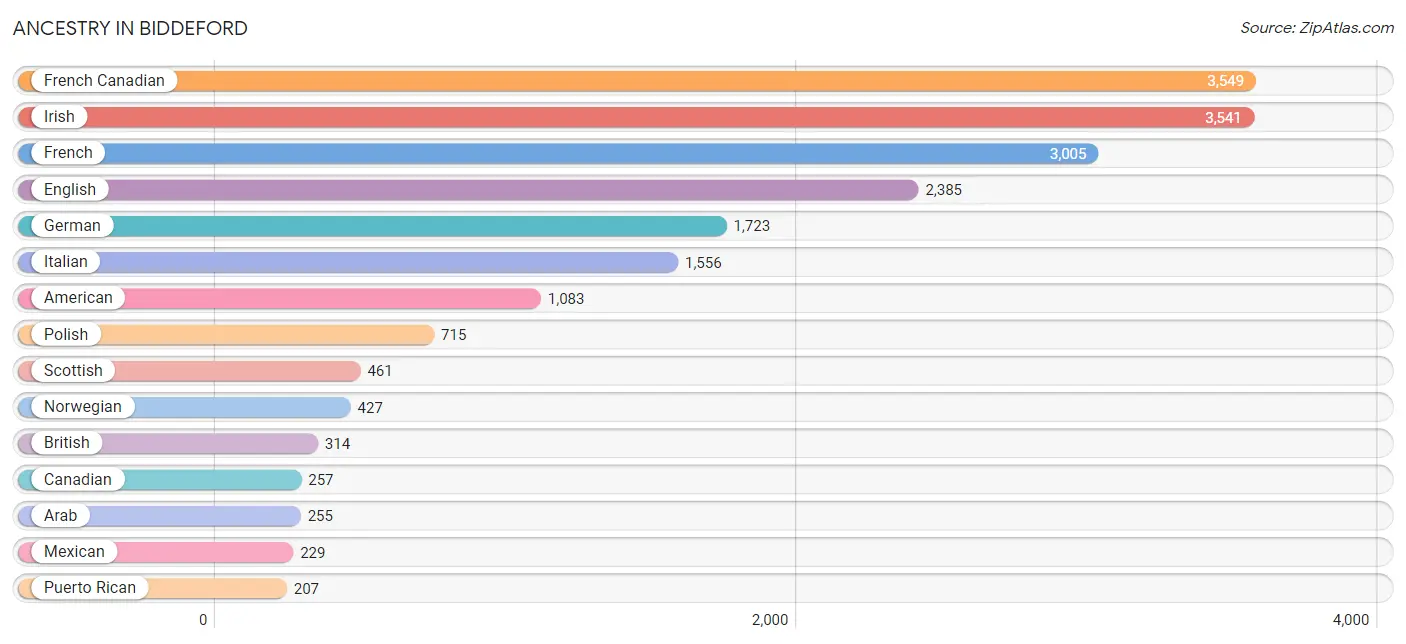
Ancestry in Biddeford
The most populous ancestries reported in Biddeford are French Canadian (3,549 | 15.8%), Irish (3,541 | 15.8%), French (3,005 | 13.4%), English (2,385 | 10.6%), and German (1,723 | 7.7%), together accounting for 63.3% of all Biddeford residents.
| Ancestry | # Population | % Population |
| Albanian | 31 | 0.1% |
| American | 1,083 | 4.8% |
| Arab | 255 | 1.1% |
| Armenian | 6 | 0.0% |
| Austrian | 49 | 0.2% |
| Bhutanese | 54 | 0.2% |
| Blackfeet | 6 | 0.0% |
| British | 314 | 1.4% |
| Burmese | 54 | 0.2% |
| Canadian | 257 | 1.1% |
| Celtic | 21 | 0.1% |
| Central American | 5 | 0.0% |
| Central American Indian | 1 | 0.0% |
| Chippewa | 16 | 0.1% |
| Colombian | 31 | 0.1% |
| Czech | 38 | 0.2% |
| Czechoslovakian | 70 | 0.3% |
| Danish | 68 | 0.3% |
| Dominican | 10 | 0.0% |
| Dutch | 193 | 0.9% |
| Eastern European | 6 | 0.0% |
| Egyptian | 38 | 0.2% |
| English | 2,385 | 10.6% |
| Ethiopian | 1 | 0.0% |
| European | 203 | 0.9% |
| Filipino | 13 | 0.1% |
| Finnish | 55 | 0.3% |
| French | 3,005 | 13.4% |
| French American Indian | 32 | 0.1% |
| French Canadian | 3,549 | 15.8% |
| German | 1,723 | 7.7% |
| Greek | 138 | 0.6% |
| Guatemalan | 1 | 0.0% |
| Guyanese | 6 | 0.0% |
| Indian (Asian) | 155 | 0.7% |
| Irish | 3,541 | 15.8% |
| Italian | 1,556 | 6.9% |
| Japanese | 38 | 0.2% |
| Korean | 15 | 0.1% |
| Lebanese | 43 | 0.2% |
| Lithuanian | 6 | 0.0% |
| Mexican | 229 | 1.0% |
| Native Hawaiian | 54 | 0.2% |
| Navajo | 4 | 0.0% |
| Northern European | 2 | 0.0% |
| Norwegian | 427 | 1.9% |
| Pakistani | 32 | 0.1% |
| Polish | 715 | 3.2% |
| Portuguese | 199 | 0.9% |
| Puerto Rican | 207 | 0.9% |
| Romanian | 41 | 0.2% |
| Russian | 77 | 0.3% |
| Salvadoran | 4 | 0.0% |
| Scandinavian | 15 | 0.1% |
| Scotch-Irish | 89 | 0.4% |
| Scottish | 461 | 2.1% |
| Sioux | 2 | 0.0% |
| Slovak | 13 | 0.1% |
| Slovene | 5 | 0.0% |
| South American | 31 | 0.1% |
| Sri Lankan | 146 | 0.6% |
| Subsaharan African | 11 | 0.1% |
| Swedish | 168 | 0.7% |
| Swiss | 42 | 0.2% |
| Syrian | 13 | 0.1% |
| Thai | 31 | 0.1% |
| Turkish | 4 | 0.0% |
| Ukrainian | 48 | 0.2% |
| Welsh | 83 | 0.4% |
| Yugoslavian | 10 | 0.0% | View All 70 Rows |
Immigrants in Biddeford
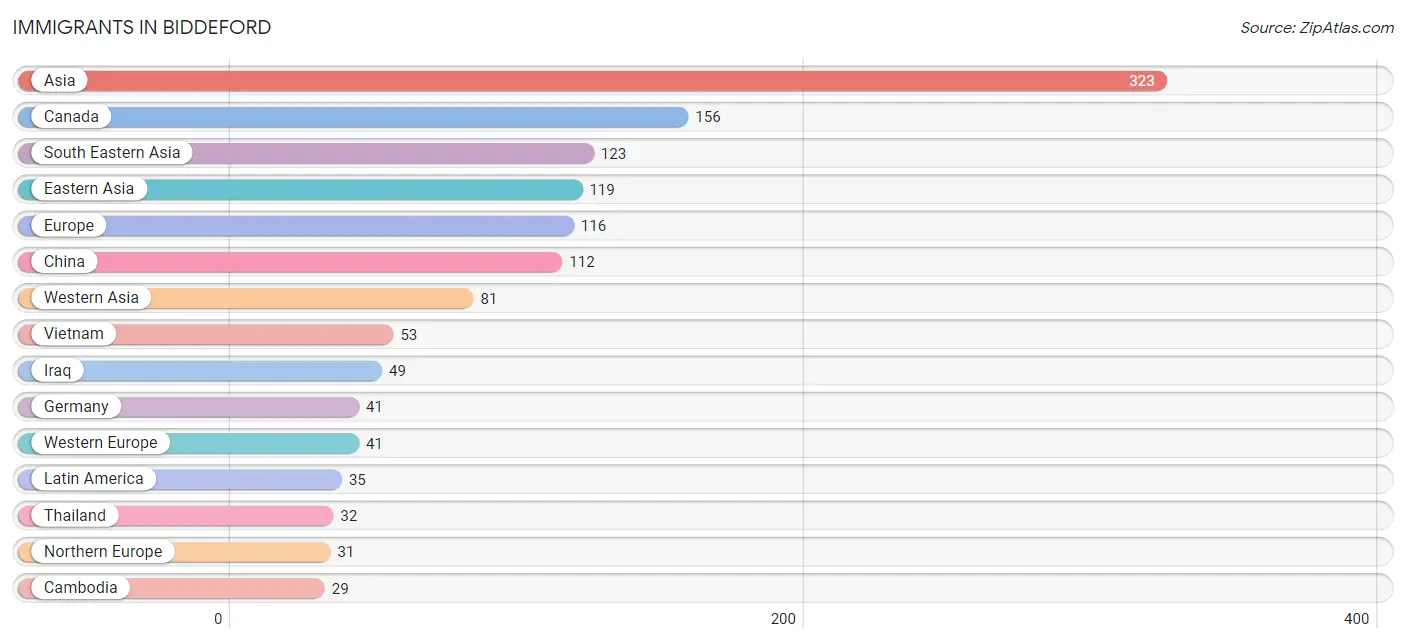
The most numerous immigrant groups reported in Biddeford came from Asia (323 | 1.4%), Canada (156 | 0.7%), South Eastern Asia (123 | 0.5%), Eastern Asia (119 | 0.5%), and Europe (116 | 0.5%), together accounting for 3.7% of all Biddeford residents.
| Immigration Origin | # Population | % Population |
| Africa | 10 | 0.0% |
| Asia | 323 | 1.4% |
| Cambodia | 29 | 0.1% |
| Canada | 156 | 0.7% |
| Central America | 27 | 0.1% |
| China | 112 | 0.5% |
| Colombia | 8 | 0.0% |
| Czechoslovakia | 9 | 0.0% |
| Eastern Africa | 1 | 0.0% |
| Eastern Asia | 119 | 0.5% |
| Eastern Europe | 24 | 0.1% |
| England | 12 | 0.1% |
| Europe | 116 | 0.5% |
| Germany | 41 | 0.2% |
| Greece | 20 | 0.1% |
| Iraq | 49 | 0.2% |
| Korea | 7 | 0.0% |
| Kuwait | 28 | 0.1% |
| Latin America | 35 | 0.2% |
| Mexico | 27 | 0.1% |
| Middle Africa | 9 | 0.0% |
| Northern Europe | 31 | 0.1% |
| Philippines | 9 | 0.0% |
| Romania | 6 | 0.0% |
| Russia | 5 | 0.0% |
| Scotland | 19 | 0.1% |
| South America | 8 | 0.0% |
| South Eastern Asia | 123 | 0.5% |
| Southern Europe | 20 | 0.1% |
| Taiwan | 13 | 0.1% |
| Thailand | 32 | 0.1% |
| Turkey | 4 | 0.0% |
| Vietnam | 53 | 0.2% |
| Western Asia | 81 | 0.4% |
| Western Europe | 41 | 0.2% | View All 35 Rows |
Sex and Age in Biddeford
Sex and Age in Biddeford
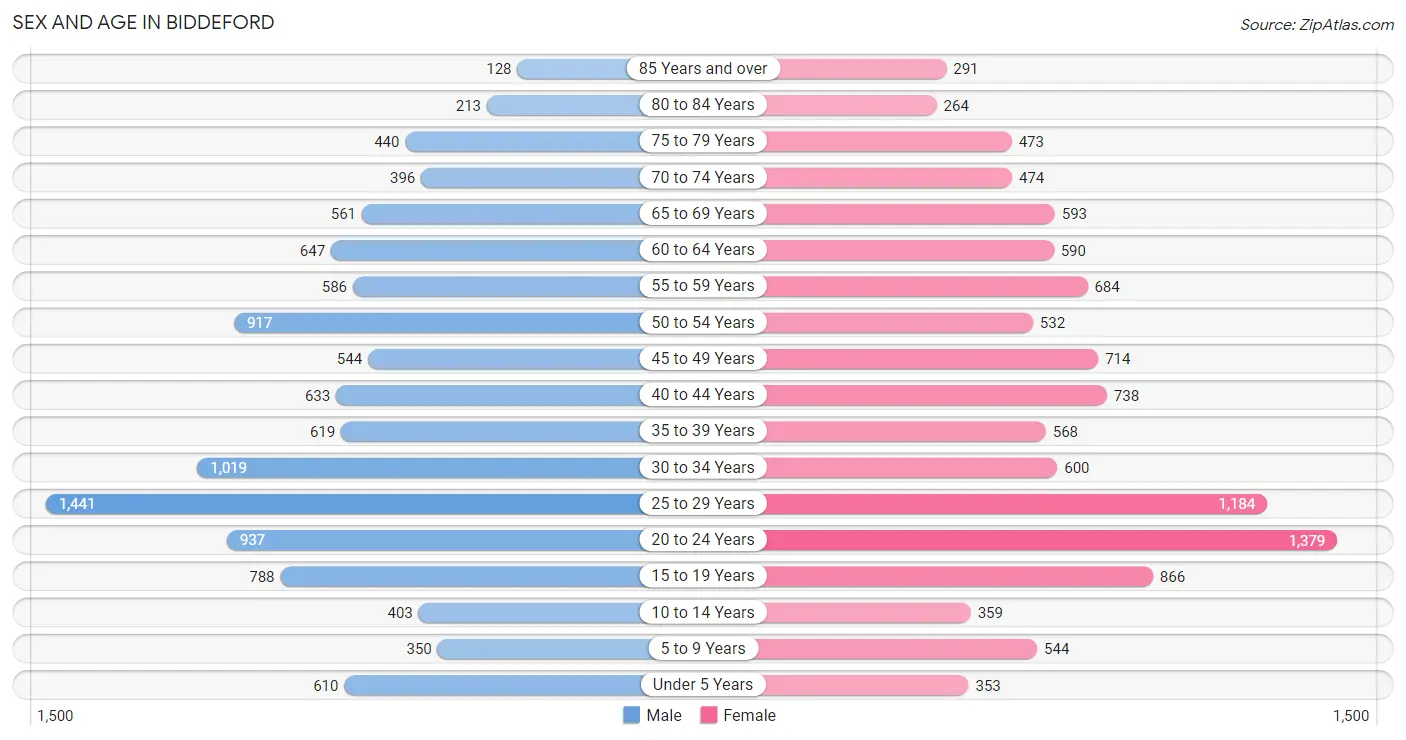
The most populous age groups in Biddeford are 25 to 29 Years (1,441 | 12.8%) for men and 20 to 24 Years (1,379 | 12.3%) for women.
| Age Bracket | Male | Female |
| Under 5 Years | 610 (5.4%) | 353 (3.2%) |
| 5 to 9 Years | 350 (3.1%) | 544 (4.9%) |
| 10 to 14 Years | 403 (3.6%) | 359 (3.2%) |
| 15 to 19 Years | 788 (7.0%) | 866 (7.7%) |
| 20 to 24 Years | 937 (8.3%) | 1,379 (12.3%) |
| 25 to 29 Years | 1,441 (12.8%) | 1,184 (10.6%) |
| 30 to 34 Years | 1,019 (9.1%) | 600 (5.3%) |
| 35 to 39 Years | 619 (5.5%) | 568 (5.1%) |
| 40 to 44 Years | 633 (5.6%) | 738 (6.6%) |
| 45 to 49 Years | 544 (4.8%) | 714 (6.4%) |
| 50 to 54 Years | 917 (8.2%) | 532 (4.8%) |
| 55 to 59 Years | 586 (5.2%) | 684 (6.1%) |
| 60 to 64 Years | 647 (5.8%) | 590 (5.3%) |
| 65 to 69 Years | 561 (5.0%) | 593 (5.3%) |
| 70 to 74 Years | 396 (3.5%) | 474 (4.2%) |
| 75 to 79 Years | 440 (3.9%) | 473 (4.2%) |
| 80 to 84 Years | 213 (1.9%) | 264 (2.4%) |
| 85 Years and over | 128 (1.1%) | 291 (2.6%) |
| Total | 11,232 (100.0%) | 11,206 (100.0%) |
Families and Households in Biddeford
Median Family Size in Biddeford
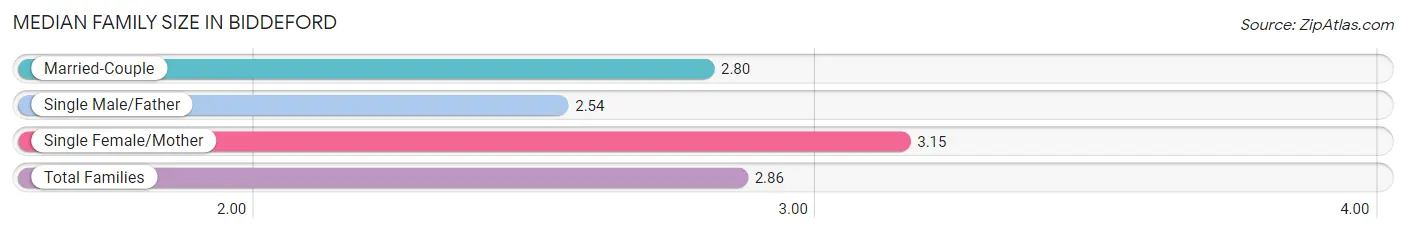
The median family size in Biddeford is 2.86 persons per family, with single female/mother families (1,063 | 21.8%) accounting for the largest median family size of 3.15 persons per family. On the other hand, single male/father families (392 | 8.0%) represent the smallest median family size with 2.54 persons per family.
| Family Type | # Families | Family Size |
| Married-Couple | 3,421 (70.2%) | 2.80 |
| Single Male/Father | 392 (8.0%) | 2.54 |
| Single Female/Mother | 1,063 (21.8%) | 3.15 |
| Total Families | 4,876 (100.0%) | 2.86 |
Median Household Size in Biddeford
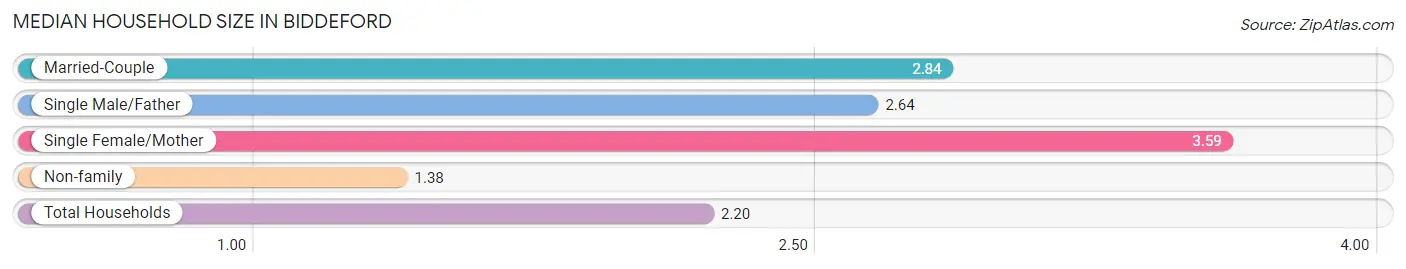
The median household size in Biddeford is 2.20 persons per household, with single female/mother households (1,063 | 11.1%) accounting for the largest median household size of 3.59 persons per household. non-family households (4,699 | 49.1%) represent the smallest median household size with 1.38 persons per household.
| Household Type | # Households | Household Size |
| Married-Couple | 3,421 (35.7%) | 2.84 |
| Single Male/Father | 392 (4.1%) | 2.64 |
| Single Female/Mother | 1,063 (11.1%) | 3.59 |
| Non-family | 4,699 (49.1%) | 1.38 |
| Total Households | 9,575 (100.0%) | 2.20 |
Household Size by Marriage Status in Biddeford
Out of a total of 9,575 households in Biddeford, 4,876 (50.9%) are family households, while 4,699 (49.1%) are nonfamily households. The most numerous type of family households are 2-person households, comprising 2,281, and the most common type of nonfamily households are 1-person households, comprising 3,103.
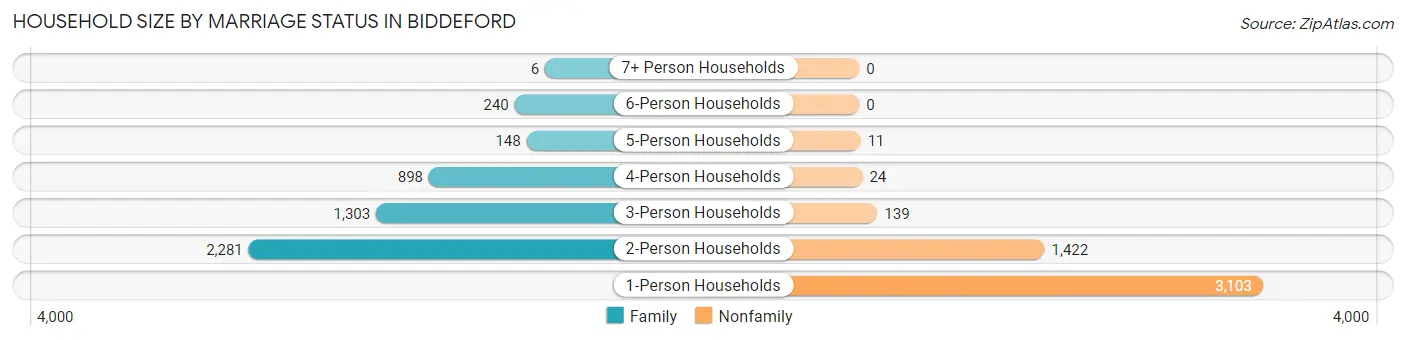
| Household Size | Family Households | Nonfamily Households |
| 1-Person Households | - | 3,103 (32.4%) |
| 2-Person Households | 2,281 (23.8%) | 1,422 (14.8%) |
| 3-Person Households | 1,303 (13.6%) | 139 (1.5%) |
| 4-Person Households | 898 (9.4%) | 24 (0.3%) |
| 5-Person Households | 148 (1.5%) | 11 (0.1%) |
| 6-Person Households | 240 (2.5%) | 0 (0.0%) |
| 7+ Person Households | 6 (0.1%) | 0 (0.0%) |
| Total | 4,876 (50.9%) | 4,699 (49.1%) |
Female Fertility in Biddeford
Fertility by Age in Biddeford
Average fertility rate in Biddeford is 26.0 births per 1,000 women. Women in the age bracket of 20 to 34 years have the highest fertility rate with 32.0 births per 1,000 women. Women in the age bracket of 20 to 34 years acount for 63.3% of all women with births.
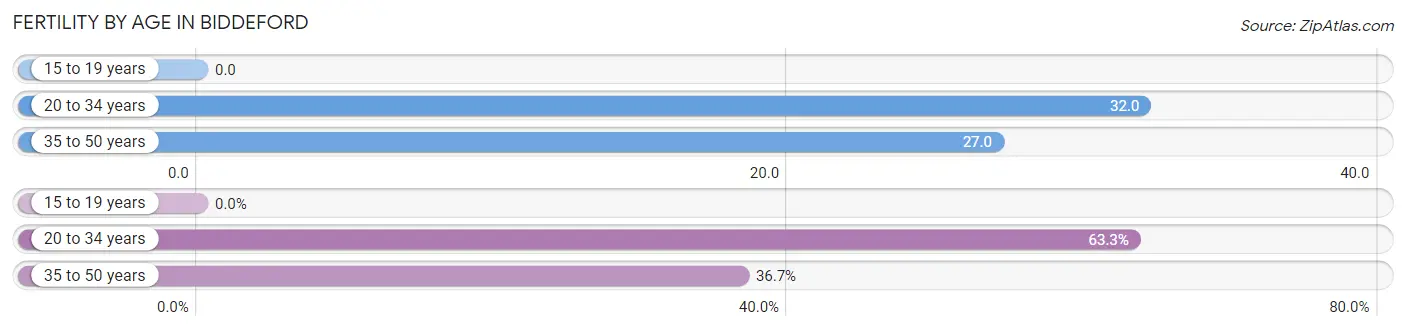
| Age Bracket | Women with Births | Births / 1,000 Women |
| 15 to 19 years | 0 (0.0%) | 0.0 |
| 20 to 34 years | 100 (63.3%) | 32.0 |
| 35 to 50 years | 58 (36.7%) | 27.0 |
| Total | 158 (100.0%) | 26.0 |
Fertility by Age by Marriage Status in Biddeford
68.4% of women with births (158) in Biddeford are married. The highest percentage of unmarried women with births falls into 20 to 34 years age bracket with 50.0% of them unmarried at the time of birth, while the lowest percentage of unmarried women with births belong to 35 to 50 years age bracket with 0.0% of them unmarried.
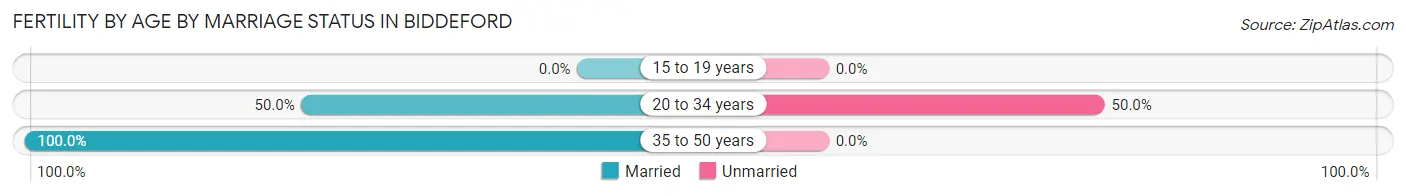
| Age Bracket | Married | Unmarried |
| 15 to 19 years | 0 (0.0%) | 0 (0.0%) |
| 20 to 34 years | 50 (50.0%) | 50 (50.0%) |
| 35 to 50 years | 58 (100.0%) | 0 (0.0%) |
| Total | 108 (68.3%) | 50 (31.7%) |
Fertility by Education in Biddeford
Average fertility rate in Biddeford is 26.0 births per 1,000 women. Women with the education attainment of graduate degree have the highest fertility rate of 84.0 births per 1,000 women, while women with the education attainment of high school diploma have the lowest fertility at 12.0 births per 1,000 women. Women with the education attainment of less than high school represent 26.0% of all women with births.
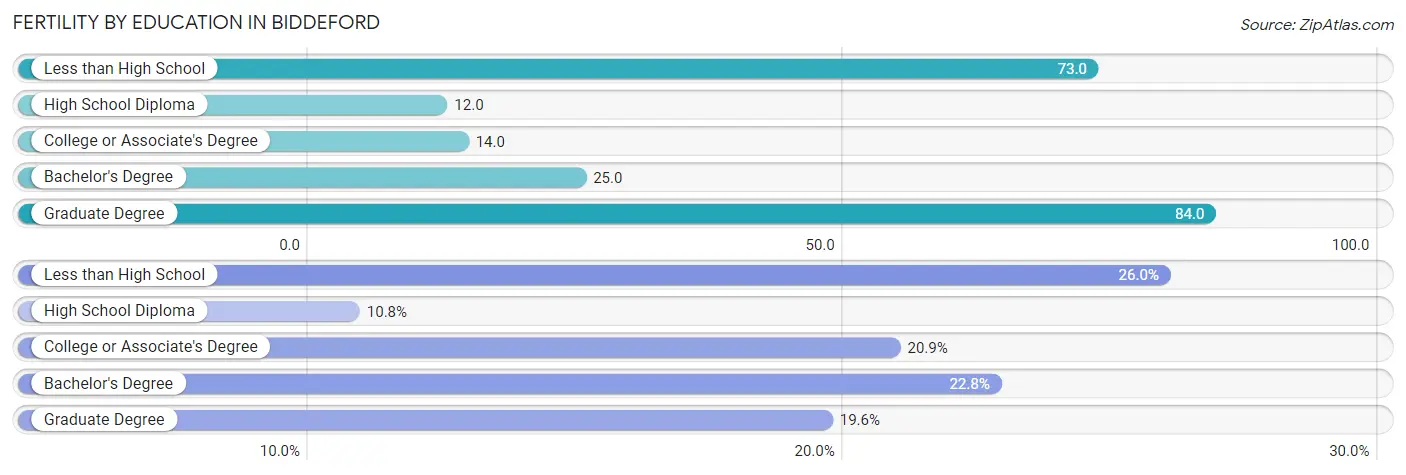
| Educational Attainment | Women with Births | Births / 1,000 Women |
| Less than High School | 41 (26.0%) | 73.0 |
| High School Diploma | 17 (10.8%) | 12.0 |
| College or Associate's Degree | 33 (20.9%) | 14.0 |
| Bachelor's Degree | 36 (22.8%) | 25.0 |
| Graduate Degree | 31 (19.6%) | 84.0 |
| Total | 158 (100.0%) | 26.0 |
Fertility by Education by Marriage Status in Biddeford
31.7% of women with births in Biddeford are unmarried. Women with the educational attainment of bachelor's degree are most likely to be married with 100.0% of them married at childbirth, while women with the educational attainment of less than high school are least likely to be married with 82.9% of them unmarried at childbirth.
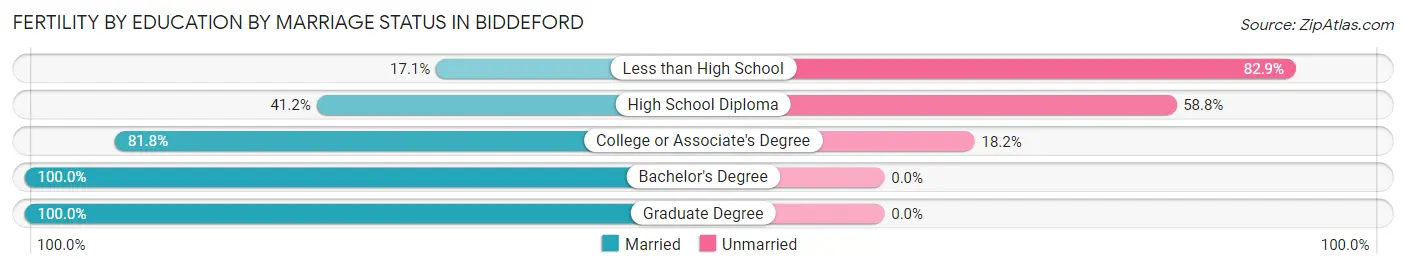
| Educational Attainment | Married | Unmarried |
| Less than High School | 7 (17.1%) | 34 (82.9%) |
| High School Diploma | 7 (41.2%) | 10 (58.8%) |
| College or Associate's Degree | 27 (81.8%) | 6 (18.2%) |
| Bachelor's Degree | 36 (100.0%) | 0 (0.0%) |
| Graduate Degree | 31 (100.0%) | 0 (0.0%) |
| Total | 108 (68.3%) | 50 (31.7%) |
Employment Characteristics in Biddeford
Employment by Class of Employer in Biddeford
Among the 12,477 employed individuals in Biddeford, private company employees (8,227 | 65.9%), not-for-profit organizations (1,573 | 12.6%), and local government employees (890 | 7.1%) make up the most common classes of employment.
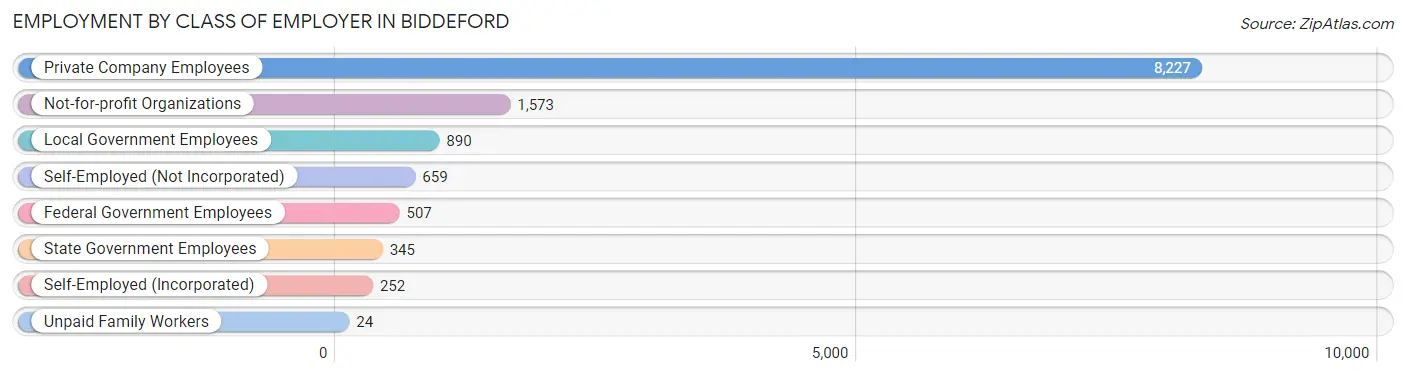
| Employer Class | # Employees | % Employees |
| Private Company Employees | 8,227 | 65.9% |
| Self-Employed (Incorporated) | 252 | 2.0% |
| Self-Employed (Not Incorporated) | 659 | 5.3% |
| Not-for-profit Organizations | 1,573 | 12.6% |
| Local Government Employees | 890 | 7.1% |
| State Government Employees | 345 | 2.8% |
| Federal Government Employees | 507 | 4.1% |
| Unpaid Family Workers | 24 | 0.2% |
| Total | 12,477 | 100.0% |
Employment Status by Age in Biddeford
According to the labor force statistics for Biddeford, out of the total population over 16 years of age (19,633), 67.3% or 13,213 individuals are in the labor force, with 4.7% or 621 of them unemployed. The age group with the highest labor force participation rate is 30 to 34 years, with 88.9% or 1,439 individuals in the labor force. Within the labor force, the 16 to 19 years age range has the highest percentage of unemployed individuals, with 12.4% or 97 of them being unemployed.
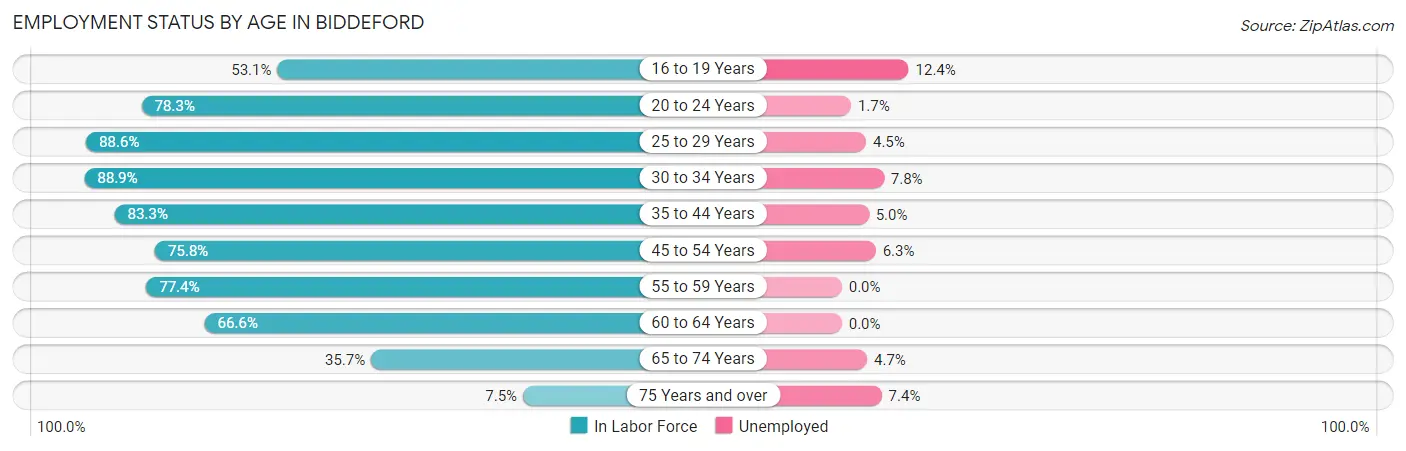
| Age Bracket | In Labor Force | Unemployed |
| 16 to 19 Years | 780 (53.1%) | 97 (12.4%) |
| 20 to 24 Years | 1,813 (78.3%) | 31 (1.7%) |
| 25 to 29 Years | 2,326 (88.6%) | 105 (4.5%) |
| 30 to 34 Years | 1,439 (88.9%) | 112 (7.8%) |
| 35 to 44 Years | 2,131 (83.3%) | 107 (5.0%) |
| 45 to 54 Years | 2,052 (75.8%) | 129 (6.3%) |
| 55 to 59 Years | 983 (77.4%) | 0 (0.0%) |
| 60 to 64 Years | 824 (66.6%) | 0 (0.0%) |
| 65 to 74 Years | 723 (35.7%) | 34 (4.7%) |
| 75 Years and over | 136 (7.5%) | 10 (7.4%) |
| Total | 13,213 (67.3%) | 621 (4.7%) |
Employment Status by Educational Attainment in Biddeford
According to labor force statistics for Biddeford, 81.2% of individuals (9,757) out of the total population between 25 and 64 years of age (12,016) are in the labor force, with 4.7% or 459 of them being unemployed. The group with the highest labor force participation rate are those with the educational attainment of bachelor's degree or higher, with 87.6% or 2,906 individuals in the labor force. Within the labor force, individuals with less than high school education have the highest percentage of unemployment, with 11.1% or 45 of them being unemployed.
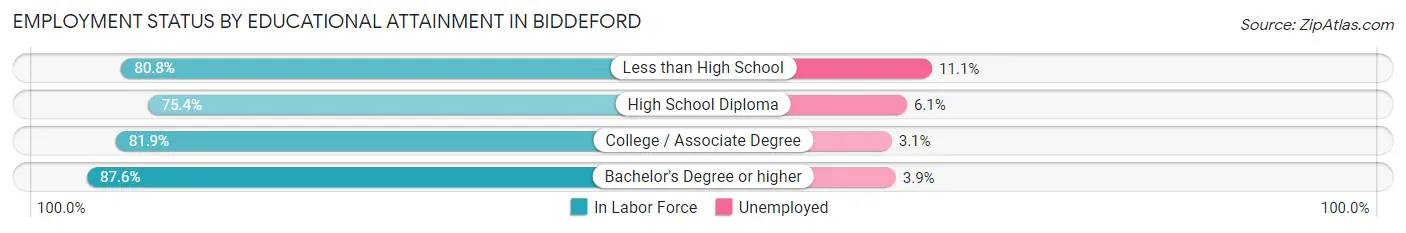
| Educational Attainment | In Labor Force | Unemployed |
| Less than High School | 407 (80.8%) | 56 (11.1%) |
| High School Diploma | 3,155 (75.4%) | 255 (6.1%) |
| College / Associate Degree | 3,285 (81.9%) | 124 (3.1%) |
| Bachelor's Degree or higher | 2,906 (87.6%) | 129 (3.9%) |
| Total | 9,757 (81.2%) | 565 (4.7%) |
Employment Occupations by Sex in Biddeford
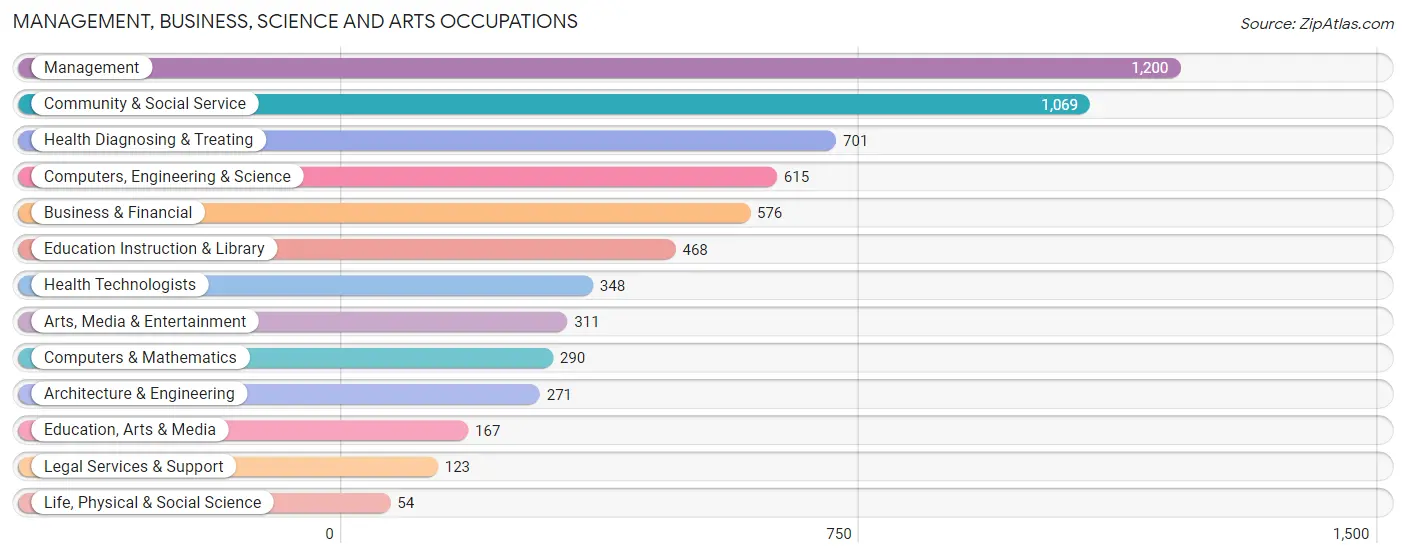
Management, Business, Science and Arts Occupations
The most common Management, Business, Science and Arts occupations in Biddeford are Management (1,200 | 9.6%), Community & Social Service (1,069 | 8.5%), Health Diagnosing & Treating (701 | 5.6%), Computers, Engineering & Science (615 | 4.9%), and Business & Financial (576 | 4.6%).
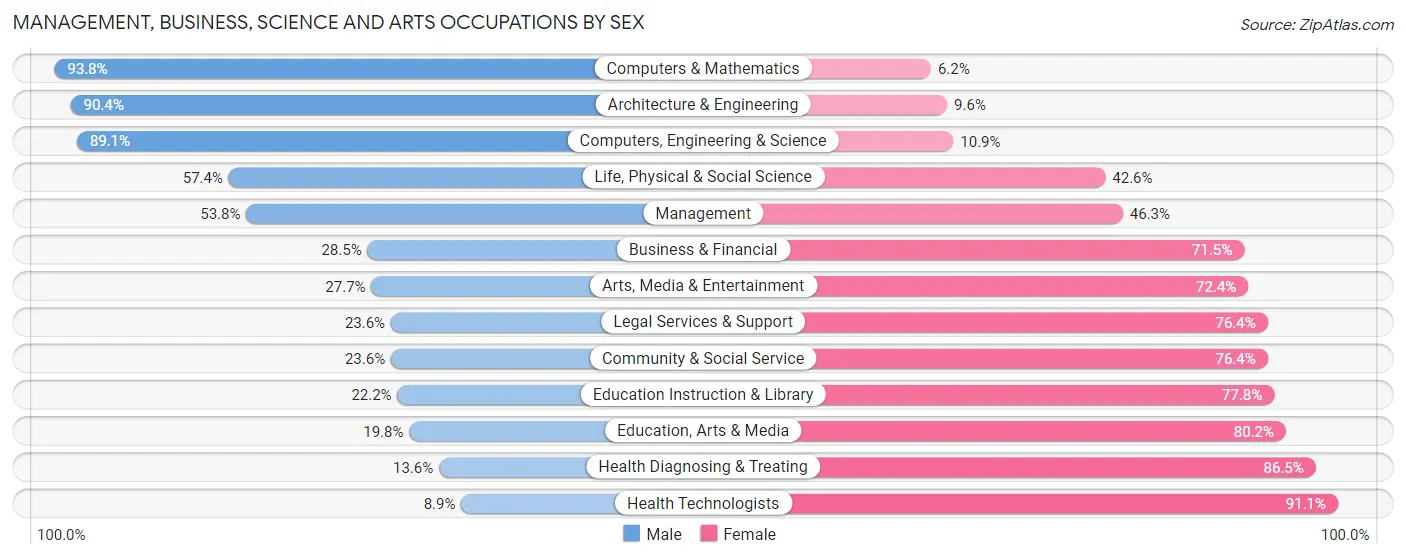
Management, Business, Science and Arts Occupations by Sex
Within the Management, Business, Science and Arts occupations in Biddeford, the most male-oriented occupations are Computers & Mathematics (93.8%), Architecture & Engineering (90.4%), and Computers, Engineering & Science (89.1%), while the most female-oriented occupations are Health Technologists (91.1%), Health Diagnosing & Treating (86.5%), and Education, Arts & Media (80.2%).
| Occupation | Male | Female |
| Management | 645 (53.7%) | 555 (46.3%) |
| Business & Financial | 164 (28.5%) | 412 (71.5%) |
| Computers, Engineering & Science | 548 (89.1%) | 67 (10.9%) |
| Computers & Mathematics | 272 (93.8%) | 18 (6.2%) |
| Architecture & Engineering | 245 (90.4%) | 26 (9.6%) |
| Life, Physical & Social Science | 31 (57.4%) | 23 (42.6%) |
| Community & Social Service | 252 (23.6%) | 817 (76.4%) |
| Education, Arts & Media | 33 (19.8%) | 134 (80.2%) |
| Legal Services & Support | 29 (23.6%) | 94 (76.4%) |
| Education Instruction & Library | 104 (22.2%) | 364 (77.8%) |
| Arts, Media & Entertainment | 86 (27.7%) | 225 (72.4%) |
| Health Diagnosing & Treating | 95 (13.6%) | 606 (86.5%) |
| Health Technologists | 31 (8.9%) | 317 (91.1%) |
| Total (Category) | 1,704 (40.9%) | 2,457 (59.1%) |
| Total (Overall) | 6,502 (51.8%) | 6,039 (48.1%) |
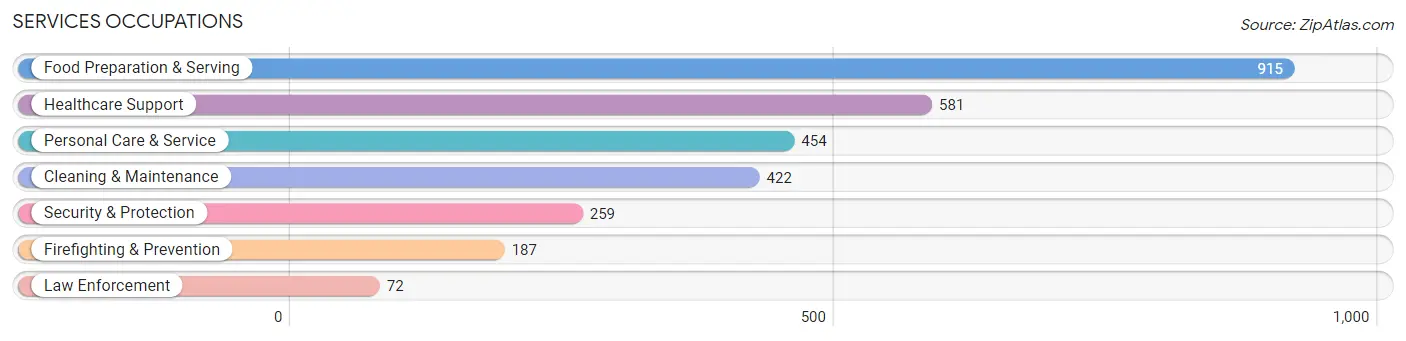
Services Occupations
The most common Services occupations in Biddeford are Food Preparation & Serving (915 | 7.3%), Healthcare Support (581 | 4.6%), Personal Care & Service (454 | 3.6%), Cleaning & Maintenance (422 | 3.4%), and Security & Protection (259 | 2.1%).
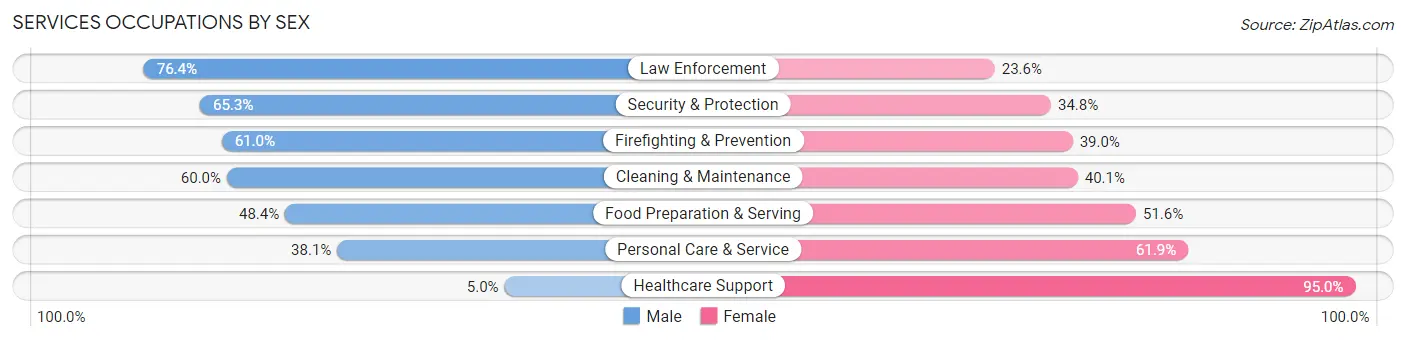
Services Occupations by Sex
Within the Services occupations in Biddeford, the most male-oriented occupations are Law Enforcement (76.4%), Security & Protection (65.2%), and Firefighting & Prevention (61.0%), while the most female-oriented occupations are Healthcare Support (95.0%), Personal Care & Service (61.9%), and Food Preparation & Serving (51.6%).
| Occupation | Male | Female |
| Healthcare Support | 29 (5.0%) | 552 (95.0%) |
| Security & Protection | 169 (65.2%) | 90 (34.7%) |
| Firefighting & Prevention | 114 (61.0%) | 73 (39.0%) |
| Law Enforcement | 55 (76.4%) | 17 (23.6%) |
| Food Preparation & Serving | 443 (48.4%) | 472 (51.6%) |
| Cleaning & Maintenance | 253 (60.0%) | 169 (40.1%) |
| Personal Care & Service | 173 (38.1%) | 281 (61.9%) |
| Total (Category) | 1,067 (40.6%) | 1,564 (59.5%) |
| Total (Overall) | 6,502 (51.8%) | 6,039 (48.1%) |
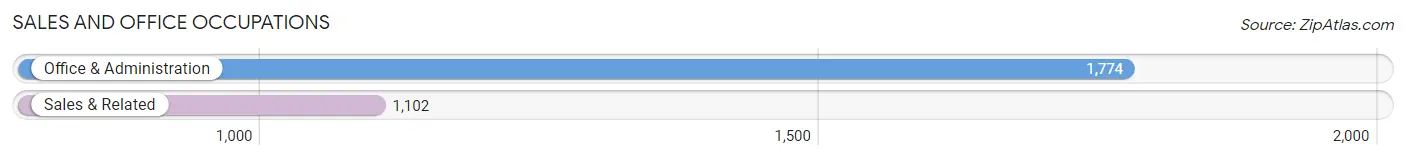
Sales and Office Occupations
The most common Sales and Office occupations in Biddeford are Office & Administration (1,774 | 14.1%), and Sales & Related (1,102 | 8.8%).
Sales and Office Occupations by Sex
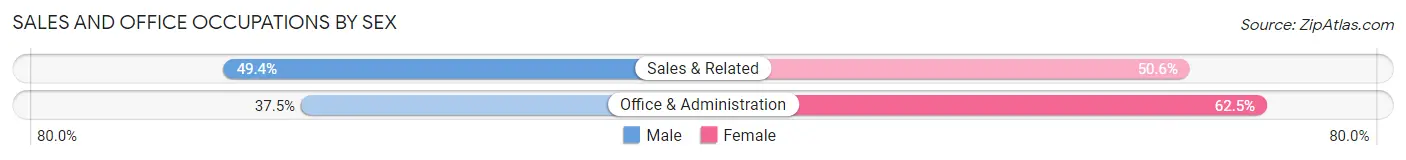
| Occupation | Male | Female |
| Sales & Related | 544 (49.4%) | 558 (50.6%) |
| Office & Administration | 665 (37.5%) | 1,109 (62.5%) |
| Total (Category) | 1,209 (42.0%) | 1,667 (58.0%) |
| Total (Overall) | 6,502 (51.8%) | 6,039 (48.1%) |
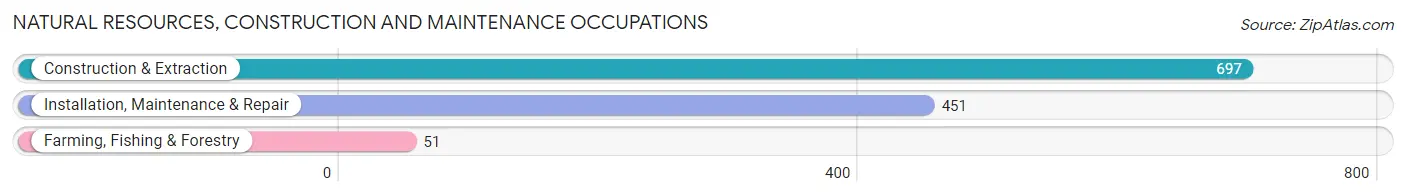
Natural Resources, Construction and Maintenance Occupations
The most common Natural Resources, Construction and Maintenance occupations in Biddeford are Construction & Extraction (697 | 5.6%), Installation, Maintenance & Repair (451 | 3.6%), and Farming, Fishing & Forestry (51 | 0.4%).
Natural Resources, Construction and Maintenance Occupations by Sex
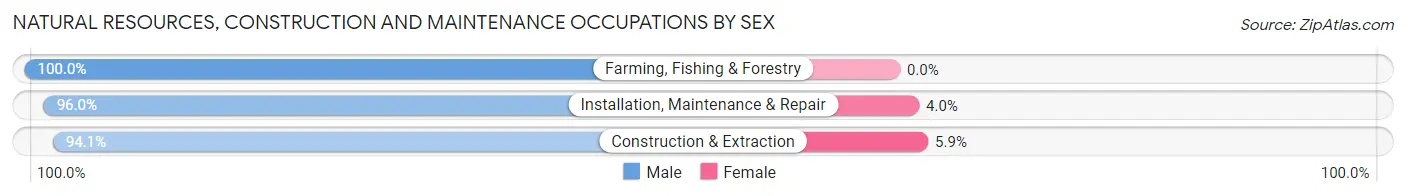
| Occupation | Male | Female |
| Farming, Fishing & Forestry | 51 (100.0%) | 0 (0.0%) |
| Construction & Extraction | 656 (94.1%) | 41 (5.9%) |
| Installation, Maintenance & Repair | 433 (96.0%) | 18 (4.0%) |
| Total (Category) | 1,140 (95.1%) | 59 (4.9%) |
| Total (Overall) | 6,502 (51.8%) | 6,039 (48.1%) |
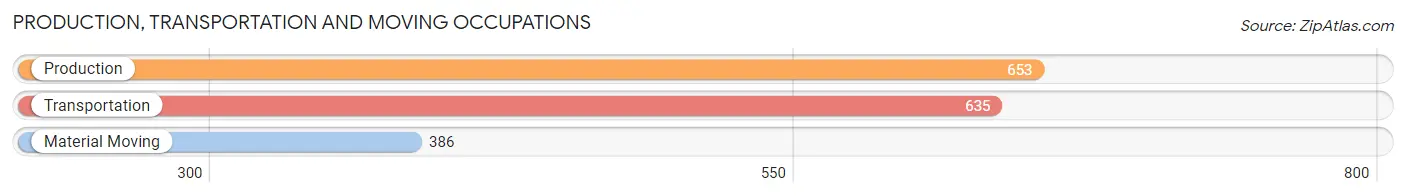
Production, Transportation and Moving Occupations
The most common Production, Transportation and Moving occupations in Biddeford are Production (653 | 5.2%), Transportation (635 | 5.1%), and Material Moving (386 | 3.1%).
Production, Transportation and Moving Occupations by Sex
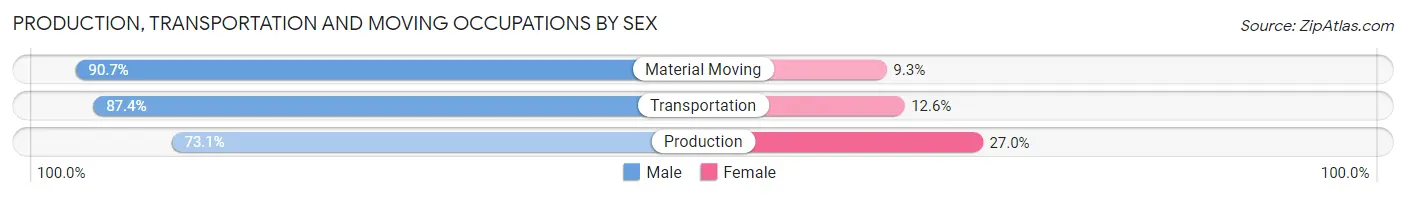
| Occupation | Male | Female |
| Production | 477 (73.1%) | 176 (27.0%) |
| Transportation | 555 (87.4%) | 80 (12.6%) |
| Material Moving | 350 (90.7%) | 36 (9.3%) |
| Total (Category) | 1,382 (82.6%) | 292 (17.4%) |
| Total (Overall) | 6,502 (51.8%) | 6,039 (48.1%) |
Employment Industries by Sex in Biddeford
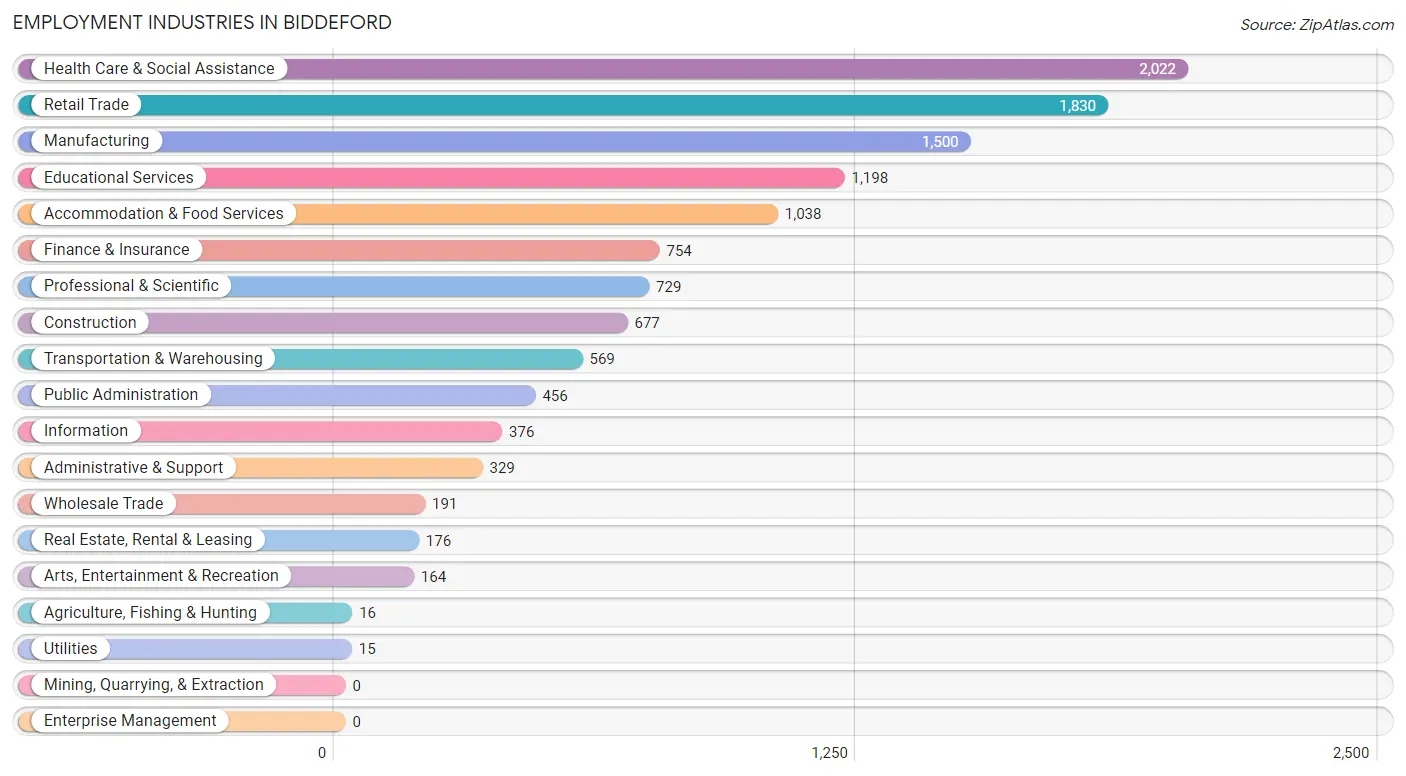
Employment Industries in Biddeford
The major employment industries in Biddeford include Health Care & Social Assistance (2,022 | 16.1%), Retail Trade (1,830 | 14.6%), Manufacturing (1,500 | 12.0%), Educational Services (1,198 | 9.6%), and Accommodation & Food Services (1,038 | 8.3%).
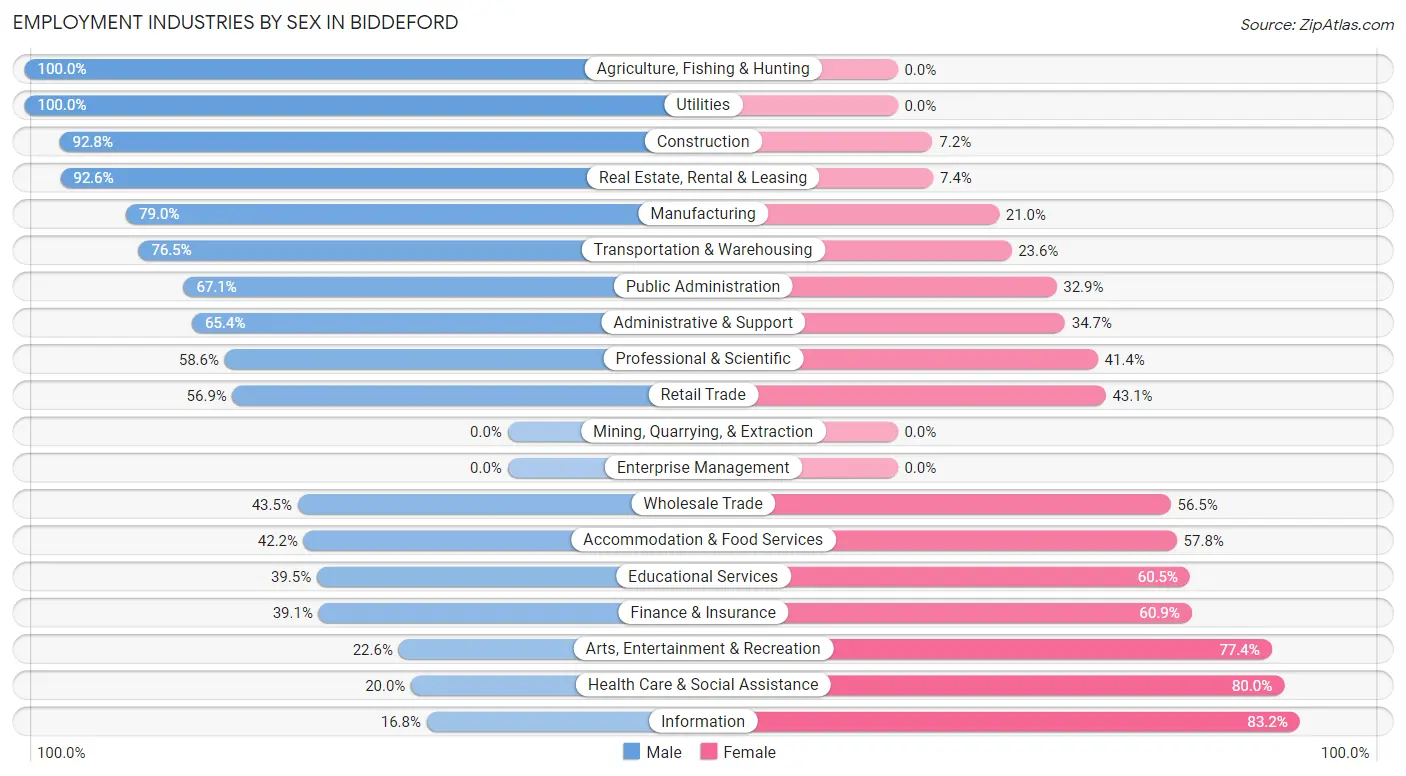
Employment Industries by Sex in Biddeford
The Biddeford industries that see more men than women are Agriculture, Fishing & Hunting (100.0%), Utilities (100.0%), and Construction (92.8%), whereas the industries that tend to have a higher number of women are Information (83.2%), Health Care & Social Assistance (80.0%), and Arts, Entertainment & Recreation (77.4%).
| Industry | Male | Female |
| Agriculture, Fishing & Hunting | 16 (100.0%) | 0 (0.0%) |
| Mining, Quarrying, & Extraction | 0 (0.0%) | 0 (0.0%) |
| Construction | 628 (92.8%) | 49 (7.2%) |
| Manufacturing | 1,185 (79.0%) | 315 (21.0%) |
| Wholesale Trade | 83 (43.5%) | 108 (56.5%) |
| Retail Trade | 1,042 (56.9%) | 788 (43.1%) |
| Transportation & Warehousing | 435 (76.4%) | 134 (23.5%) |
| Utilities | 15 (100.0%) | 0 (0.0%) |
| Information | 63 (16.8%) | 313 (83.2%) |
| Finance & Insurance | 295 (39.1%) | 459 (60.9%) |
| Real Estate, Rental & Leasing | 163 (92.6%) | 13 (7.4%) |
| Professional & Scientific | 427 (58.6%) | 302 (41.4%) |
| Enterprise Management | 0 (0.0%) | 0 (0.0%) |
| Administrative & Support | 215 (65.3%) | 114 (34.6%) |
| Educational Services | 473 (39.5%) | 725 (60.5%) |
| Health Care & Social Assistance | 404 (20.0%) | 1,618 (80.0%) |
| Arts, Entertainment & Recreation | 37 (22.6%) | 127 (77.4%) |
| Accommodation & Food Services | 438 (42.2%) | 600 (57.8%) |
| Public Administration | 306 (67.1%) | 150 (32.9%) |
| Total | 6,502 (51.8%) | 6,039 (48.1%) |
Education in Biddeford
School Enrollment in Biddeford
The most common levels of schooling among the 4,824 students in Biddeford are college / undergraduate (1,807 | 37.5%), high school (1,095 | 22.7%), and elementary school (661 | 13.7%).
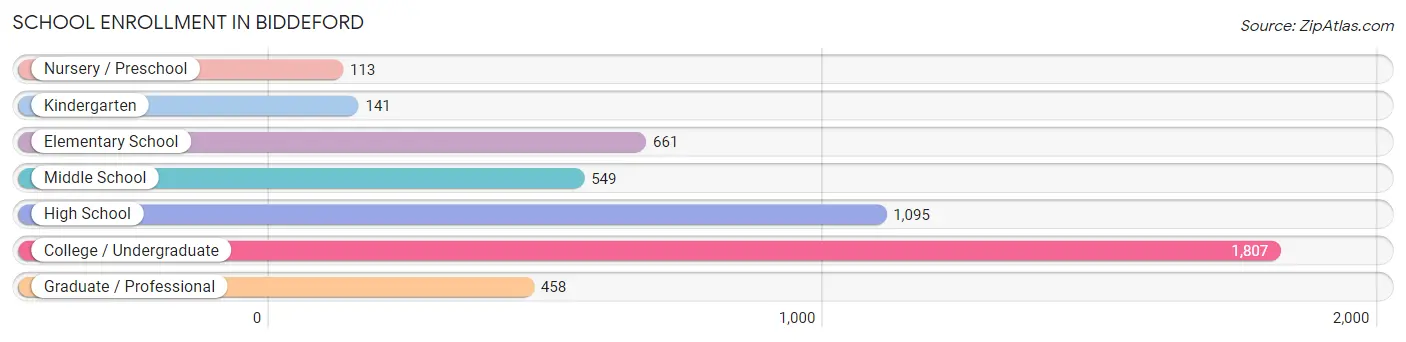
| School Level | # Students | % Students |
| Nursery / Preschool | 113 | 2.3% |
| Kindergarten | 141 | 2.9% |
| Elementary School | 661 | 13.7% |
| Middle School | 549 | 11.4% |
| High School | 1,095 | 22.7% |
| College / Undergraduate | 1,807 | 37.5% |
| Graduate / Professional | 458 | 9.5% |
| Total | 4,824 | 100.0% |
School Enrollment by Age by Funding Source in Biddeford
Out of a total of 4,824 students who are enrolled in schools in Biddeford, 1,881 (39.0%) attend a private institution, while the remaining 2,943 (61.0%) are enrolled in public schools. The age group of 3 to 4 year olds has the highest likelihood of being enrolled in private schools, with 67 (85.9% in the age bracket) enrolled. Conversely, the age group of 15 to 17 year olds has the lowest likelihood of being enrolled in a private school, with 758 (98.2% in the age bracket) attending a public institution.
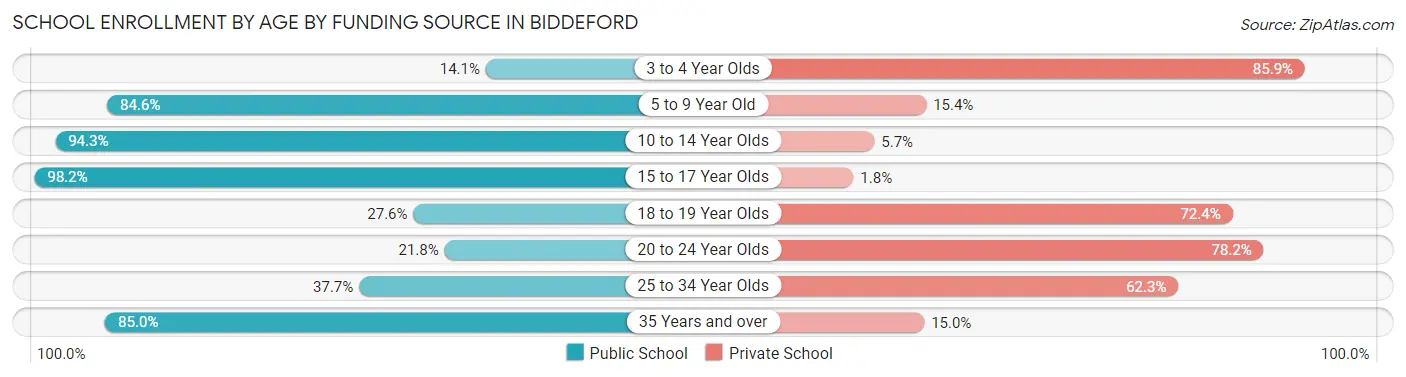
| Age Bracket | Public School | Private School |
| 3 to 4 Year Olds | 11 (14.1%) | 67 (85.9%) |
| 5 to 9 Year Old | 683 (84.6%) | 124 (15.4%) |
| 10 to 14 Year Olds | 710 (94.3%) | 43 (5.7%) |
| 15 to 17 Year Olds | 758 (98.2%) | 14 (1.8%) |
| 18 to 19 Year Olds | 205 (27.6%) | 538 (72.4%) |
| 20 to 24 Year Olds | 193 (21.8%) | 693 (78.2%) |
| 25 to 34 Year Olds | 228 (37.7%) | 377 (62.3%) |
| 35 Years and over | 153 (85.0%) | 27 (15.0%) |
| Total | 2,943 (61.0%) | 1,881 (39.0%) |
Educational Attainment by Field of Study in Biddeford
Business (769 | 17.2%), education (702 | 15.7%), science & technology (607 | 13.6%), bio, nature & agricultural (403 | 9.0%), and literature & languages (314 | 7.0%) are the most common fields of study among 4,465 individuals in Biddeford who have obtained a bachelor's degree or higher.
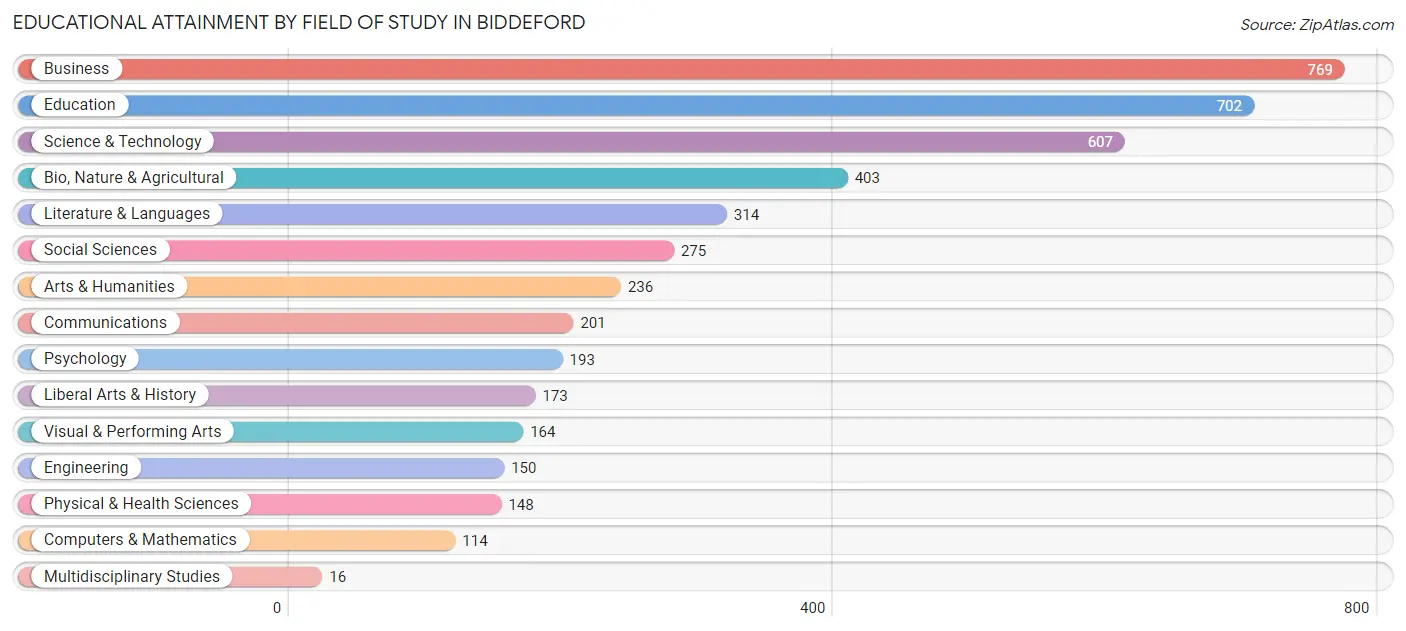
| Field of Study | # Graduates | % Graduates |
| Computers & Mathematics | 114 | 2.5% |
| Bio, Nature & Agricultural | 403 | 9.0% |
| Physical & Health Sciences | 148 | 3.3% |
| Psychology | 193 | 4.3% |
| Social Sciences | 275 | 6.2% |
| Engineering | 150 | 3.4% |
| Multidisciplinary Studies | 16 | 0.4% |
| Science & Technology | 607 | 13.6% |
| Business | 769 | 17.2% |
| Education | 702 | 15.7% |
| Literature & Languages | 314 | 7.0% |
| Liberal Arts & History | 173 | 3.9% |
| Visual & Performing Arts | 164 | 3.7% |
| Communications | 201 | 4.5% |
| Arts & Humanities | 236 | 5.3% |
| Total | 4,465 | 100.0% |
Transportation & Commute in Biddeford
Vehicle Availability by Sex in Biddeford
The most prevalent vehicle ownership categories in Biddeford are males with 2 vehicles (2,381, accounting for 37.9%) and females with 2 vehicles (2,320, making up 41.7%).
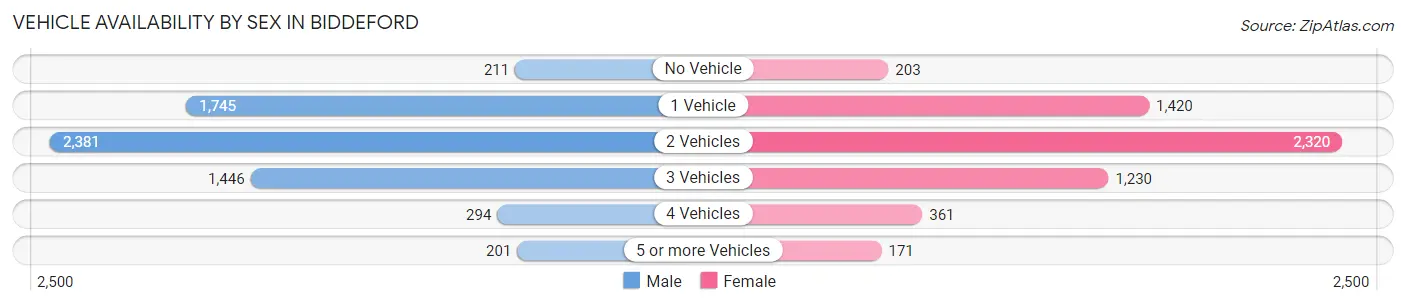
| Vehicles Available | Male | Female |
| No Vehicle | 211 (3.4%) | 203 (3.6%) |
| 1 Vehicle | 1,745 (27.8%) | 1,420 (24.9%) |
| 2 Vehicles | 2,381 (37.9%) | 2,320 (40.7%) |
| 3 Vehicles | 1,446 (23.0%) | 1,230 (21.6%) |
| 4 Vehicles | 294 (4.7%) | 361 (6.3%) |
| 5 or more Vehicles | 201 (3.2%) | 171 (3.0%) |
| Total | 6,278 (100.0%) | 5,705 (100.0%) |
Commute Time in Biddeford
The most frequently occuring commute durations in Biddeford are 10 to 14 minutes (2,185 commuters, 19.5%), 5 to 9 minutes (1,660 commuters, 14.8%), and 30 to 34 minutes (1,601 commuters, 14.3%).
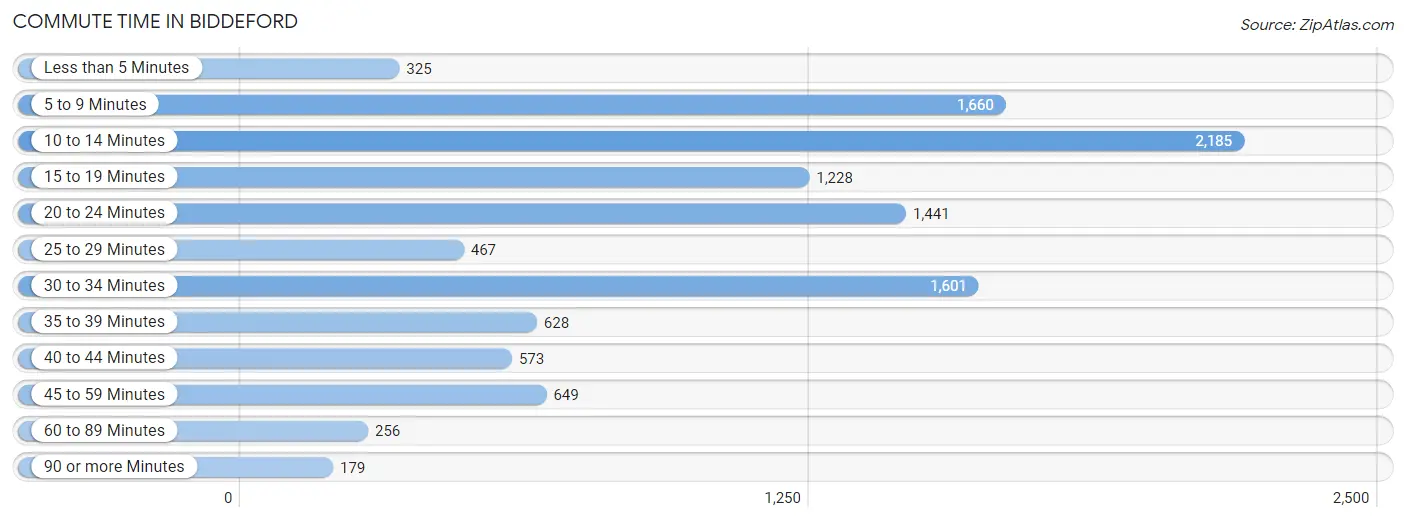
| Commute Time | # Commuters | % Commuters |
| Less than 5 Minutes | 325 | 2.9% |
| 5 to 9 Minutes | 1,660 | 14.8% |
| 10 to 14 Minutes | 2,185 | 19.5% |
| 15 to 19 Minutes | 1,228 | 11.0% |
| 20 to 24 Minutes | 1,441 | 12.9% |
| 25 to 29 Minutes | 467 | 4.2% |
| 30 to 34 Minutes | 1,601 | 14.3% |
| 35 to 39 Minutes | 628 | 5.6% |
| 40 to 44 Minutes | 573 | 5.1% |
| 45 to 59 Minutes | 649 | 5.8% |
| 60 to 89 Minutes | 256 | 2.3% |
| 90 or more Minutes | 179 | 1.6% |
Commute Time by Sex in Biddeford
The most common commute times in Biddeford are 20 to 24 minutes (1,015 commuters, 17.7%) for males and 10 to 14 minutes (1,355 commuters, 24.8%) for females.
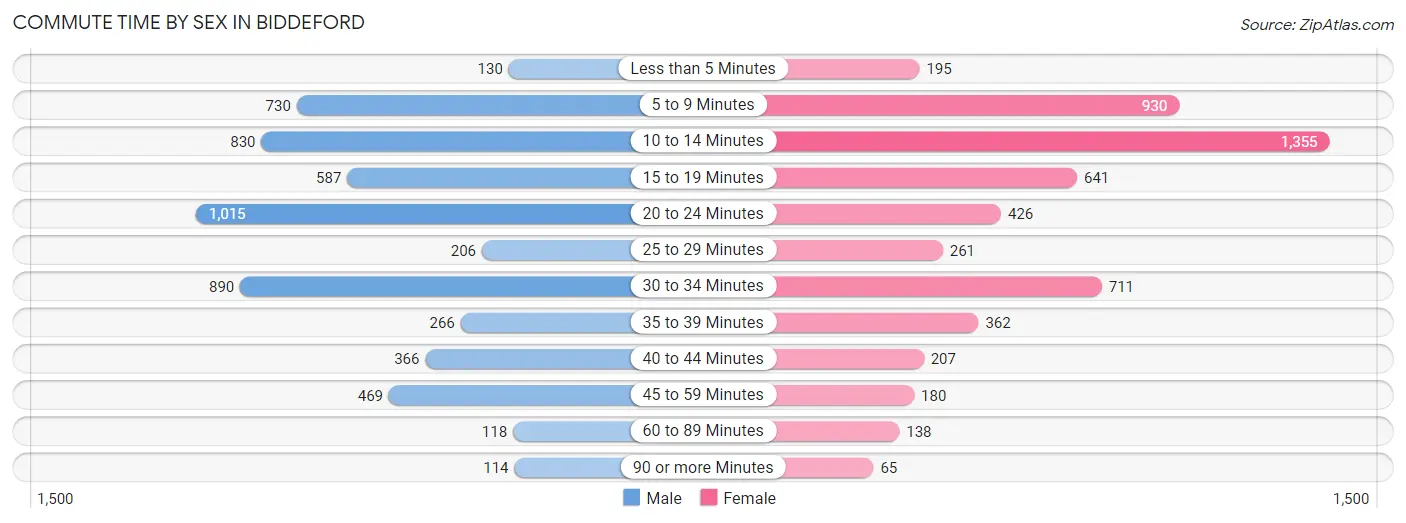
| Commute Time | Male | Female |
| Less than 5 Minutes | 130 (2.3%) | 195 (3.6%) |
| 5 to 9 Minutes | 730 (12.8%) | 930 (17.0%) |
| 10 to 14 Minutes | 830 (14.5%) | 1,355 (24.8%) |
| 15 to 19 Minutes | 587 (10.3%) | 641 (11.7%) |
| 20 to 24 Minutes | 1,015 (17.7%) | 426 (7.8%) |
| 25 to 29 Minutes | 206 (3.6%) | 261 (4.8%) |
| 30 to 34 Minutes | 890 (15.6%) | 711 (13.0%) |
| 35 to 39 Minutes | 266 (4.6%) | 362 (6.6%) |
| 40 to 44 Minutes | 366 (6.4%) | 207 (3.8%) |
| 45 to 59 Minutes | 469 (8.2%) | 180 (3.3%) |
| 60 to 89 Minutes | 118 (2.1%) | 138 (2.5%) |
| 90 or more Minutes | 114 (2.0%) | 65 (1.2%) |
Time of Departure to Work by Sex in Biddeford
The most frequent times of departure to work in Biddeford are 6:30 AM to 6:59 AM (958, 16.8%) for males and 7:00 AM to 7:29 AM (1,052, 19.2%) for females.
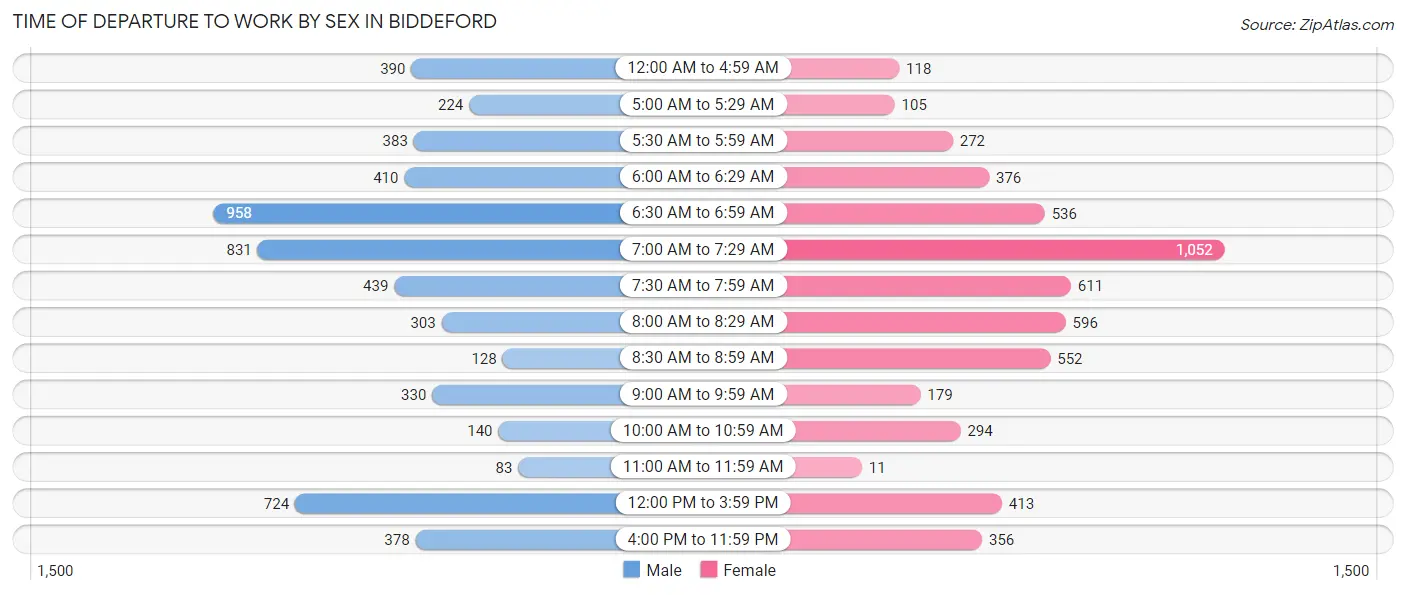
| Time of Departure | Male | Female |
| 12:00 AM to 4:59 AM | 390 (6.8%) | 118 (2.2%) |
| 5:00 AM to 5:29 AM | 224 (3.9%) | 105 (1.9%) |
| 5:30 AM to 5:59 AM | 383 (6.7%) | 272 (5.0%) |
| 6:00 AM to 6:29 AM | 410 (7.2%) | 376 (6.9%) |
| 6:30 AM to 6:59 AM | 958 (16.8%) | 536 (9.8%) |
| 7:00 AM to 7:29 AM | 831 (14.5%) | 1,052 (19.2%) |
| 7:30 AM to 7:59 AM | 439 (7.7%) | 611 (11.2%) |
| 8:00 AM to 8:29 AM | 303 (5.3%) | 596 (10.9%) |
| 8:30 AM to 8:59 AM | 128 (2.2%) | 552 (10.1%) |
| 9:00 AM to 9:59 AM | 330 (5.8%) | 179 (3.3%) |
| 10:00 AM to 10:59 AM | 140 (2.5%) | 294 (5.4%) |
| 11:00 AM to 11:59 AM | 83 (1.5%) | 11 (0.2%) |
| 12:00 PM to 3:59 PM | 724 (12.7%) | 413 (7.5%) |
| 4:00 PM to 11:59 PM | 378 (6.6%) | 356 (6.5%) |
| Total | 5,721 (100.0%) | 5,471 (100.0%) |
Housing Occupancy in Biddeford
Occupancy by Ownership in Biddeford
Of the total 9,575 dwellings in Biddeford, owner-occupied units account for 4,387 (45.8%), while renter-occupied units make up 5,188 (54.2%).
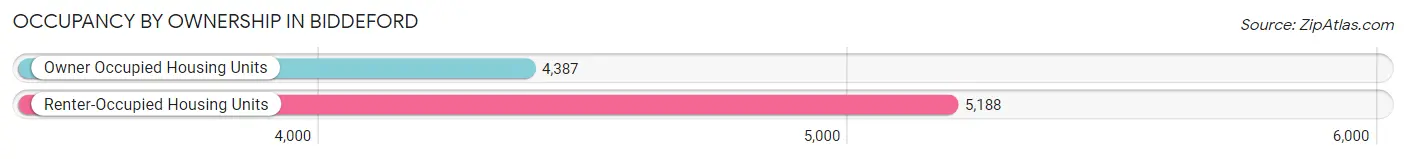
| Occupancy | # Housing Units | % Housing Units |
| Owner Occupied Housing Units | 4,387 | 45.8% |
| Renter-Occupied Housing Units | 5,188 | 54.2% |
| Total Occupied Housing Units | 9,575 | 100.0% |
Occupancy by Household Size in Biddeford
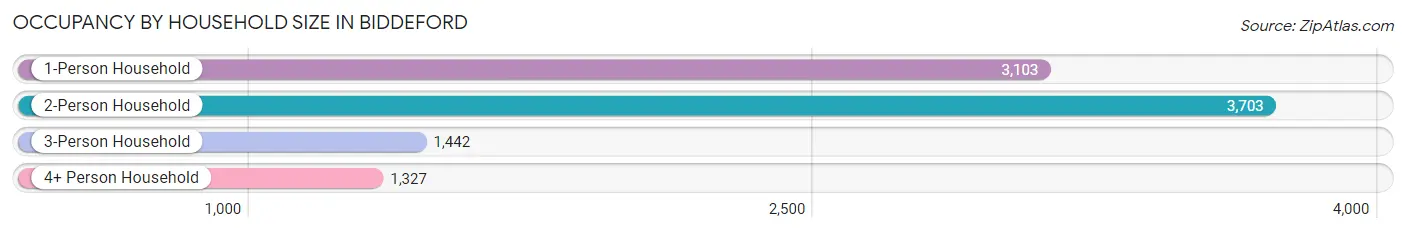
| Household Size | # Housing Units | % Housing Units |
| 1-Person Household | 3,103 | 32.4% |
| 2-Person Household | 3,703 | 38.7% |
| 3-Person Household | 1,442 | 15.1% |
| 4+ Person Household | 1,327 | 13.9% |
| Total Housing Units | 9,575 | 100.0% |
Occupancy by Ownership by Household Size in Biddeford
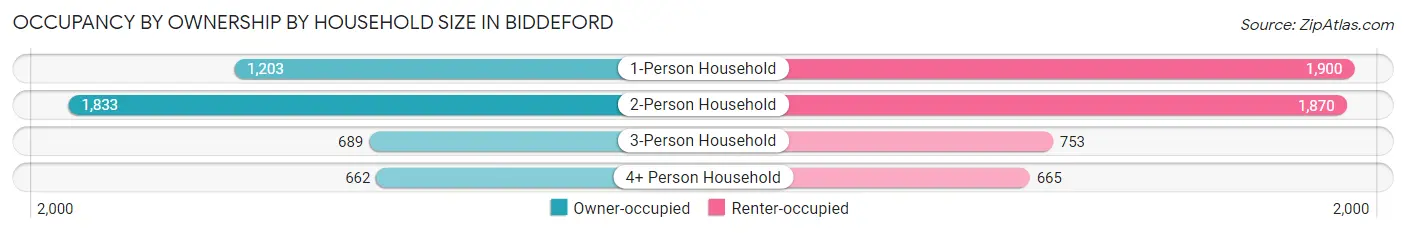
| Household Size | Owner-occupied | Renter-occupied |
| 1-Person Household | 1,203 (38.8%) | 1,900 (61.2%) |
| 2-Person Household | 1,833 (49.5%) | 1,870 (50.5%) |
| 3-Person Household | 689 (47.8%) | 753 (52.2%) |
| 4+ Person Household | 662 (49.9%) | 665 (50.1%) |
| Total Housing Units | 4,387 (45.8%) | 5,188 (54.2%) |
Occupancy by Educational Attainment in Biddeford
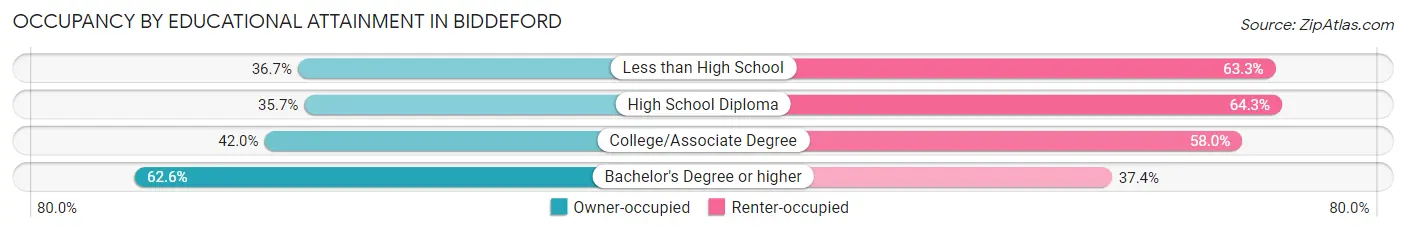
| Household Size | Owner-occupied | Renter-occupied |
| Less than High School | 208 (36.7%) | 359 (63.3%) |
| High School Diploma | 1,068 (35.7%) | 1,927 (64.3%) |
| College/Associate Degree | 1,330 (42.0%) | 1,839 (58.0%) |
| Bachelor's Degree or higher | 1,781 (62.6%) | 1,063 (37.4%) |
Occupancy by Age of Householder in Biddeford
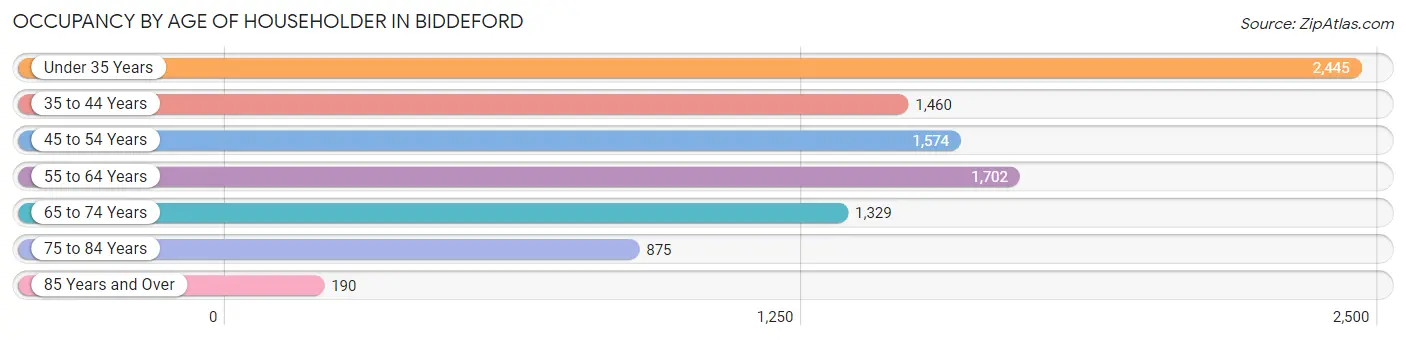
| Age Bracket | # Households | % Households |
| Under 35 Years | 2,445 | 25.5% |
| 35 to 44 Years | 1,460 | 15.2% |
| 45 to 54 Years | 1,574 | 16.4% |
| 55 to 64 Years | 1,702 | 17.8% |
| 65 to 74 Years | 1,329 | 13.9% |
| 75 to 84 Years | 875 | 9.1% |
| 85 Years and Over | 190 | 2.0% |
| Total | 9,575 | 100.0% |
Housing Finances in Biddeford
Median Income by Occupancy in Biddeford
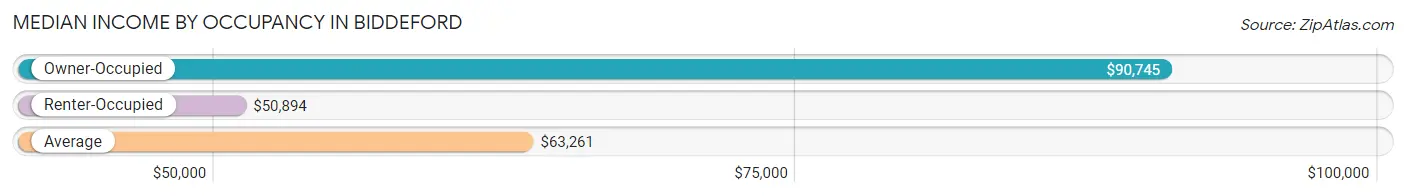
| Occupancy Type | # Households | Median Income |
| Owner-Occupied | 4,387 (45.8%) | $90,745 |
| Renter-Occupied | 5,188 (54.2%) | $50,894 |
| Average | 9,575 (100.0%) | $63,261 |
Occupancy by Householder Income Bracket in Biddeford
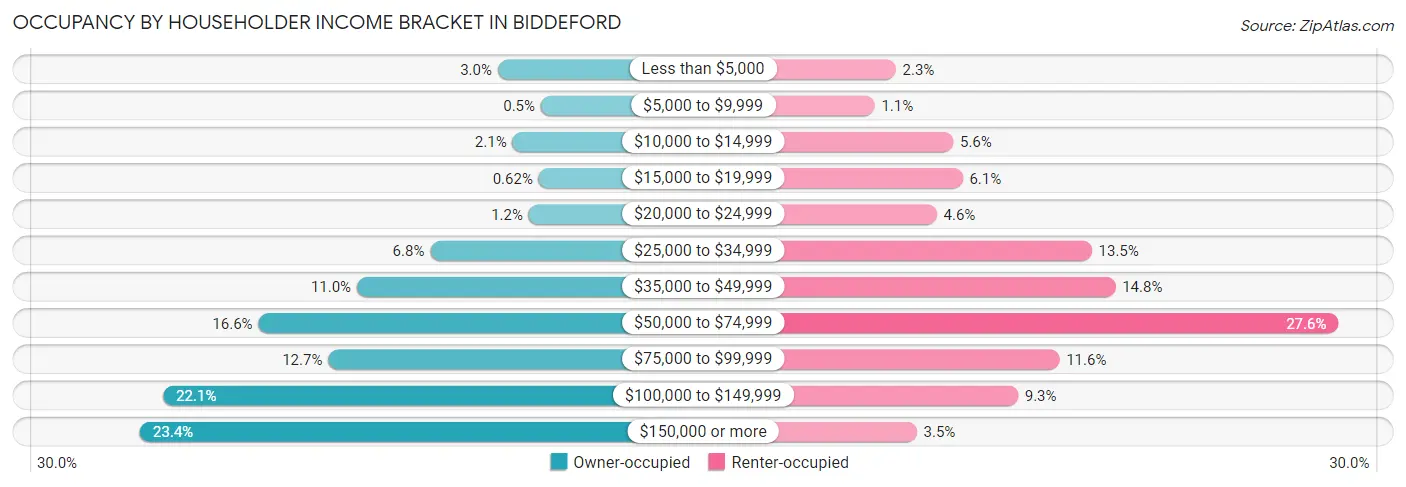
| Income Bracket | Owner-occupied | Renter-occupied |
| Less than $5,000 | 130 (3.0%) | 119 (2.3%) |
| $5,000 to $9,999 | 22 (0.5%) | 56 (1.1%) |
| $10,000 to $14,999 | 93 (2.1%) | 289 (5.6%) |
| $15,000 to $19,999 | 27 (0.6%) | 317 (6.1%) |
| $20,000 to $24,999 | 52 (1.2%) | 240 (4.6%) |
| $25,000 to $34,999 | 299 (6.8%) | 700 (13.5%) |
| $35,000 to $49,999 | 483 (11.0%) | 770 (14.8%) |
| $50,000 to $74,999 | 730 (16.6%) | 1,431 (27.6%) |
| $75,000 to $99,999 | 555 (12.7%) | 604 (11.6%) |
| $100,000 to $149,999 | 969 (22.1%) | 481 (9.3%) |
| $150,000 or more | 1,027 (23.4%) | 181 (3.5%) |
| Total | 4,387 (100.0%) | 5,188 (100.0%) |
Monthly Housing Cost Tiers in Biddeford
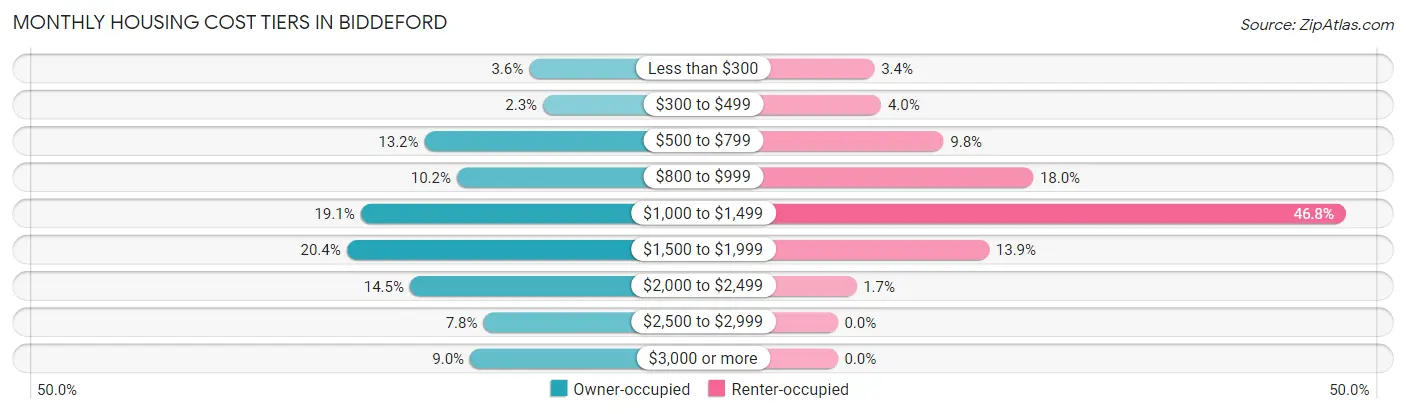
| Monthly Cost | Owner-occupied | Renter-occupied |
| Less than $300 | 156 (3.6%) | 176 (3.4%) |
| $300 to $499 | 100 (2.3%) | 208 (4.0%) |
| $500 to $799 | 579 (13.2%) | 506 (9.8%) |
| $800 to $999 | 448 (10.2%) | 934 (18.0%) |
| $1,000 to $1,499 | 837 (19.1%) | 2,428 (46.8%) |
| $1,500 to $1,999 | 893 (20.4%) | 723 (13.9%) |
| $2,000 to $2,499 | 638 (14.5%) | 90 (1.7%) |
| $2,500 to $2,999 | 341 (7.8%) | 0 (0.0%) |
| $3,000 or more | 395 (9.0%) | 0 (0.0%) |
| Total | 4,387 (100.0%) | 5,188 (100.0%) |
Physical Housing Characteristics in Biddeford
Housing Structures in Biddeford
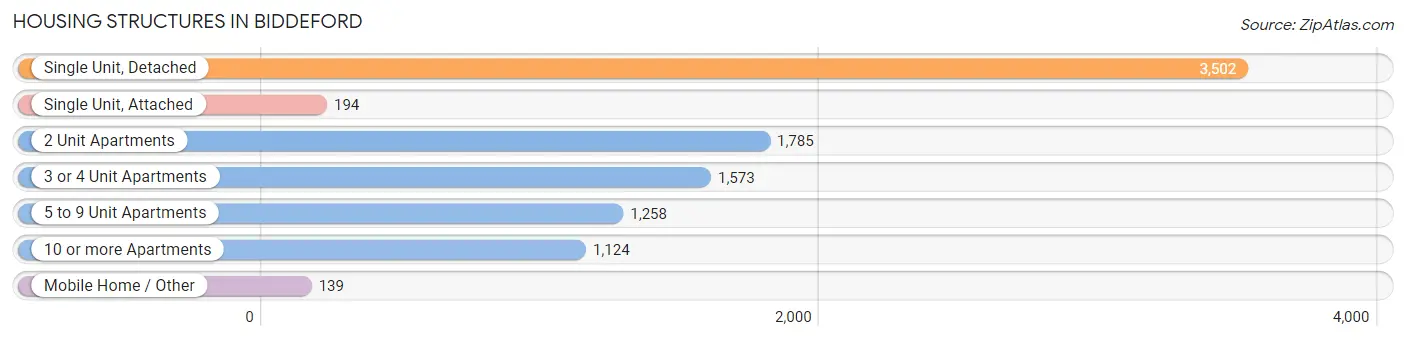
| Structure Type | # Housing Units | % Housing Units |
| Single Unit, Detached | 3,502 | 36.6% |
| Single Unit, Attached | 194 | 2.0% |
| 2 Unit Apartments | 1,785 | 18.6% |
| 3 or 4 Unit Apartments | 1,573 | 16.4% |
| 5 to 9 Unit Apartments | 1,258 | 13.1% |
| 10 or more Apartments | 1,124 | 11.7% |
| Mobile Home / Other | 139 | 1.5% |
| Total | 9,575 | 100.0% |
Housing Structures by Occupancy in Biddeford
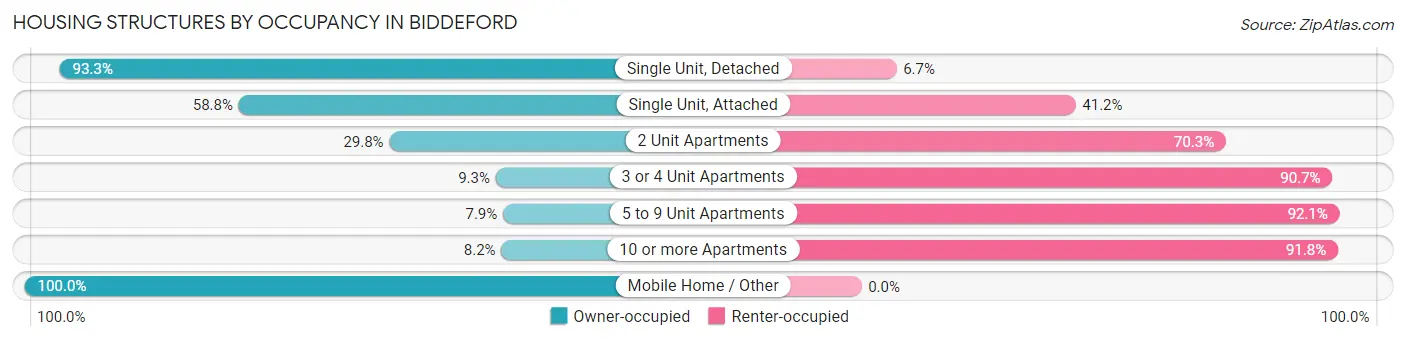
| Structure Type | Owner-occupied | Renter-occupied |
| Single Unit, Detached | 3,266 (93.3%) | 236 (6.7%) |
| Single Unit, Attached | 114 (58.8%) | 80 (41.2%) |
| 2 Unit Apartments | 531 (29.7%) | 1,254 (70.3%) |
| 3 or 4 Unit Apartments | 146 (9.3%) | 1,427 (90.7%) |
| 5 to 9 Unit Apartments | 99 (7.9%) | 1,159 (92.1%) |
| 10 or more Apartments | 92 (8.2%) | 1,032 (91.8%) |
| Mobile Home / Other | 139 (100.0%) | 0 (0.0%) |
| Total | 4,387 (45.8%) | 5,188 (54.2%) |
Housing Structures by Number of Rooms in Biddeford
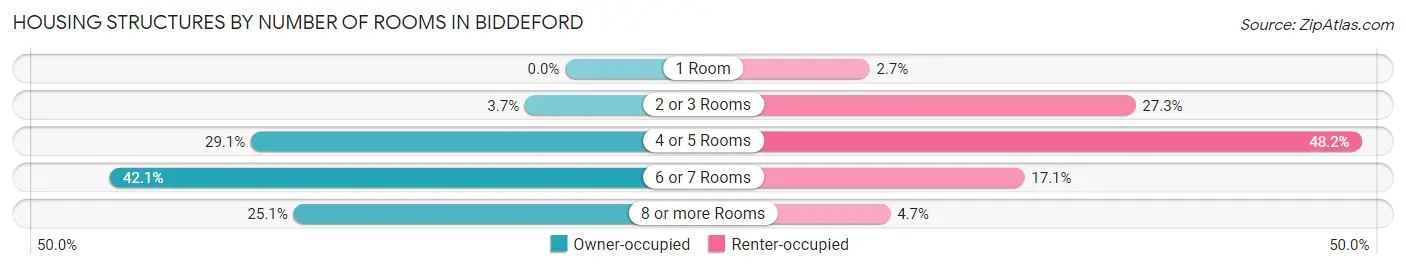
| Number of Rooms | Owner-occupied | Renter-occupied |
| 1 Room | 0 (0.0%) | 142 (2.7%) |
| 2 or 3 Rooms | 163 (3.7%) | 1,418 (27.3%) |
| 4 or 5 Rooms | 1,275 (29.1%) | 2,502 (48.2%) |
| 6 or 7 Rooms | 1,847 (42.1%) | 885 (17.1%) |
| 8 or more Rooms | 1,102 (25.1%) | 241 (4.6%) |
| Total | 4,387 (100.0%) | 5,188 (100.0%) |
Housing Structure by Heating Type in Biddeford
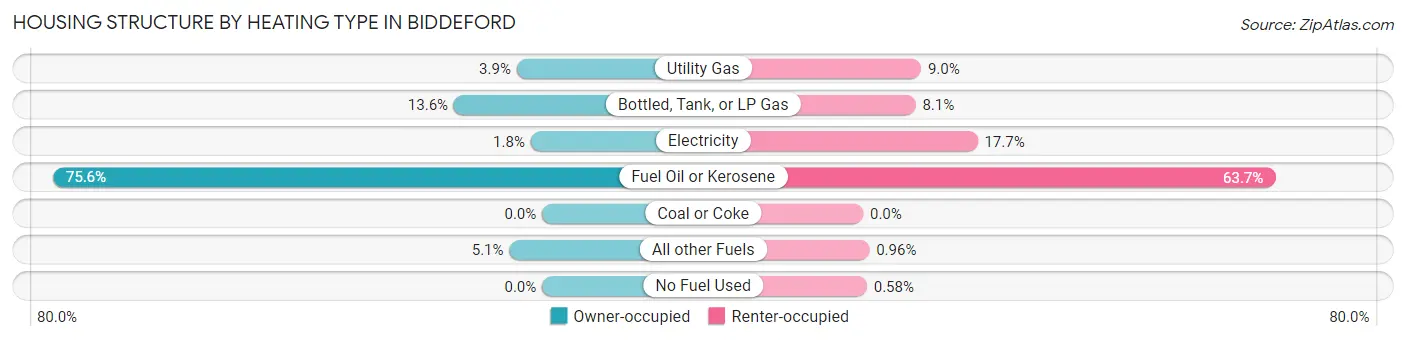
| Heating Type | Owner-occupied | Renter-occupied |
| Utility Gas | 172 (3.9%) | 465 (9.0%) |
| Bottled, Tank, or LP Gas | 598 (13.6%) | 420 (8.1%) |
| Electricity | 77 (1.8%) | 918 (17.7%) |
| Fuel Oil or Kerosene | 3,318 (75.6%) | 3,305 (63.7%) |
| Coal or Coke | 0 (0.0%) | 0 (0.0%) |
| All other Fuels | 222 (5.1%) | 50 (1.0%) |
| No Fuel Used | 0 (0.0%) | 30 (0.6%) |
| Total | 4,387 (100.0%) | 5,188 (100.0%) |
Household Vehicle Usage in Biddeford
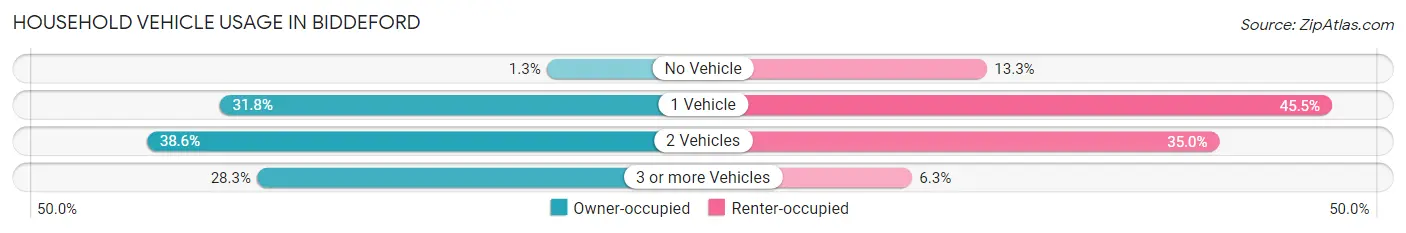
| Vehicles per Household | Owner-occupied | Renter-occupied |
| No Vehicle | 56 (1.3%) | 690 (13.3%) |
| 1 Vehicle | 1,395 (31.8%) | 2,358 (45.5%) |
| 2 Vehicles | 1,693 (38.6%) | 1,813 (34.9%) |
| 3 or more Vehicles | 1,243 (28.3%) | 327 (6.3%) |
| Total | 4,387 (100.0%) | 5,188 (100.0%) |
Real Estate & Mortgages in Biddeford
Real Estate and Mortgage Overview in Biddeford
| Characteristic | Without Mortgage | With Mortgage |
| Housing Units | 1,401 | 2,986 |
| Median Property Value | $292,600 | $334,500 |
| Median Household Income | $58,210 | $810 |
| Monthly Housing Costs | $778 | $385 |
| Real Estate Taxes | $3,894 | $28 |
Property Value by Mortgage Status in Biddeford
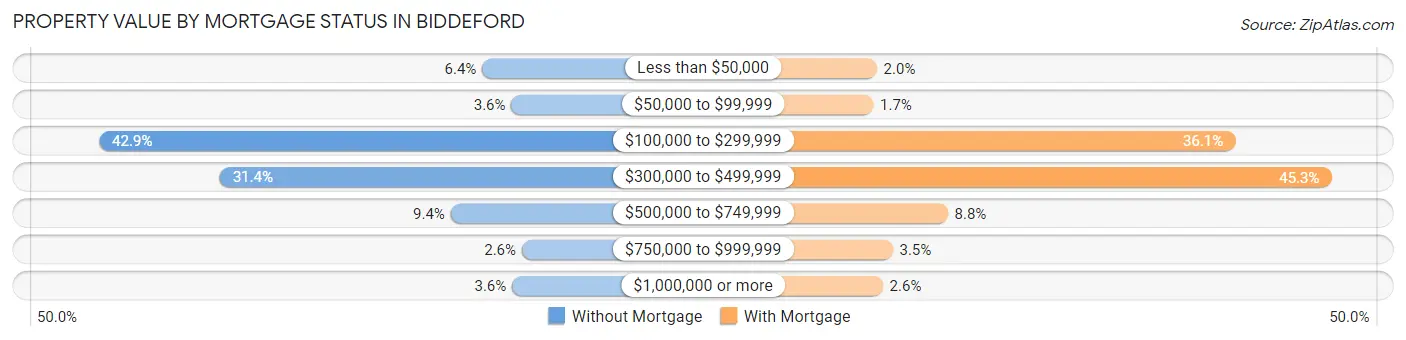
| Property Value | Without Mortgage | With Mortgage |
| Less than $50,000 | 90 (6.4%) | 60 (2.0%) |
| $50,000 to $99,999 | 51 (3.6%) | 50 (1.7%) |
| $100,000 to $299,999 | 601 (42.9%) | 1,079 (36.1%) |
| $300,000 to $499,999 | 440 (31.4%) | 1,353 (45.3%) |
| $500,000 to $749,999 | 132 (9.4%) | 262 (8.8%) |
| $750,000 to $999,999 | 37 (2.6%) | 105 (3.5%) |
| $1,000,000 or more | 50 (3.6%) | 77 (2.6%) |
| Total | 1,401 (100.0%) | 2,986 (100.0%) |
Household Income by Mortgage Status in Biddeford
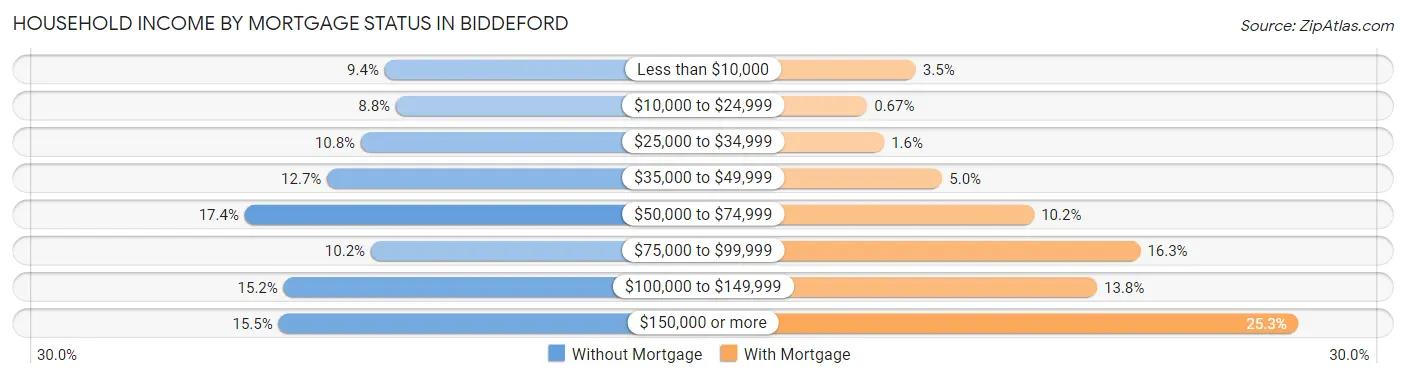
| Household Income | Without Mortgage | With Mortgage |
| Less than $10,000 | 132 (9.4%) | 103 (3.5%) |
| $10,000 to $24,999 | 123 (8.8%) | 20 (0.7%) |
| $25,000 to $34,999 | 151 (10.8%) | 49 (1.6%) |
| $35,000 to $49,999 | 178 (12.7%) | 148 (5.0%) |
| $50,000 to $74,999 | 244 (17.4%) | 305 (10.2%) |
| $75,000 to $99,999 | 143 (10.2%) | 486 (16.3%) |
| $100,000 to $149,999 | 213 (15.2%) | 412 (13.8%) |
| $150,000 or more | 217 (15.5%) | 756 (25.3%) |
| Total | 1,401 (100.0%) | 2,986 (100.0%) |
Property Value to Household Income Ratio in Biddeford
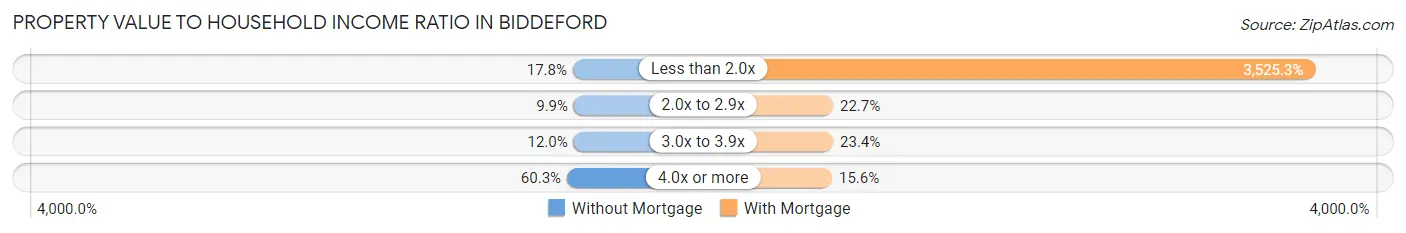
| Value-to-Income Ratio | Without Mortgage | With Mortgage |
| Less than 2.0x | 249 (17.8%) | 105,266 (3,525.3%) |
| 2.0x to 2.9x | 139 (9.9%) | 678 (22.7%) |
| 3.0x to 3.9x | 168 (12.0%) | 699 (23.4%) |
| 4.0x or more | 845 (60.3%) | 465 (15.6%) |
| Total | 1,401 (100.0%) | 2,986 (100.0%) |
Real Estate Taxes by Mortgage Status in Biddeford
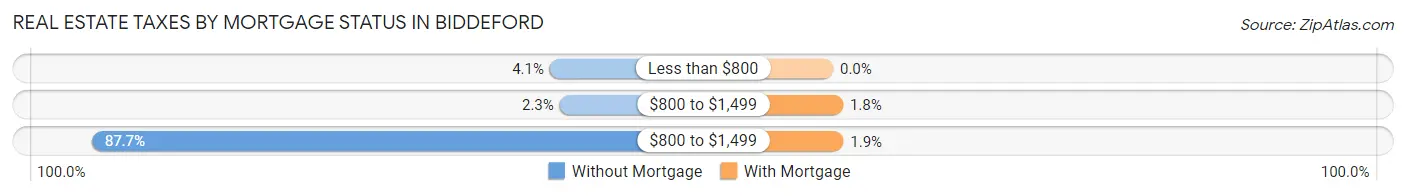
| Property Taxes | Without Mortgage | With Mortgage |
| Less than $800 | 57 (4.1%) | 0 (0.0%) |
| $800 to $1,499 | 32 (2.3%) | 54 (1.8%) |
| $800 to $1,499 | 1,229 (87.7%) | 56 (1.9%) |
| Total | 1,401 (100.0%) | 2,986 (100.0%) |
Health & Disability in Biddeford
Health Insurance Coverage by Age in Biddeford
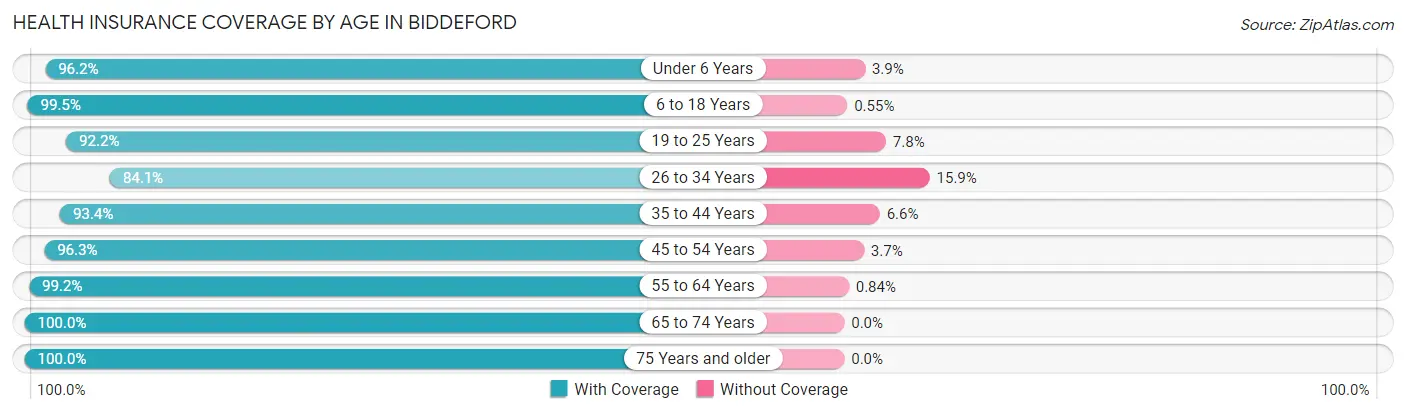
| Age Bracket | With Coverage | Without Coverage |
| Under 6 Years | 1,048 (96.2%) | 42 (3.8%) |
| 6 to 18 Years | 2,717 (99.5%) | 15 (0.5%) |
| 19 to 25 Years | 2,759 (92.2%) | 232 (7.8%) |
| 26 to 34 Years | 3,235 (84.1%) | 612 (15.9%) |
| 35 to 44 Years | 2,389 (93.4%) | 169 (6.6%) |
| 45 to 54 Years | 2,608 (96.3%) | 99 (3.7%) |
| 55 to 64 Years | 2,486 (99.2%) | 21 (0.8%) |
| 65 to 74 Years | 1,993 (100.0%) | 0 (0.0%) |
| 75 Years and older | 1,696 (100.0%) | 0 (0.0%) |
| Total | 20,931 (94.6%) | 1,190 (5.4%) |
Health Insurance Coverage by Citizenship Status in Biddeford
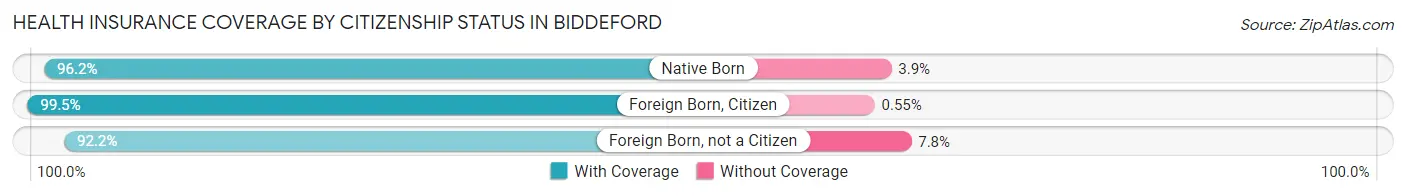
| Citizenship Status | With Coverage | Without Coverage |
| Native Born | 1,048 (96.2%) | 42 (3.8%) |
| Foreign Born, Citizen | 2,717 (99.5%) | 15 (0.5%) |
| Foreign Born, not a Citizen | 2,759 (92.2%) | 232 (7.8%) |
Health Insurance Coverage by Household Income in Biddeford
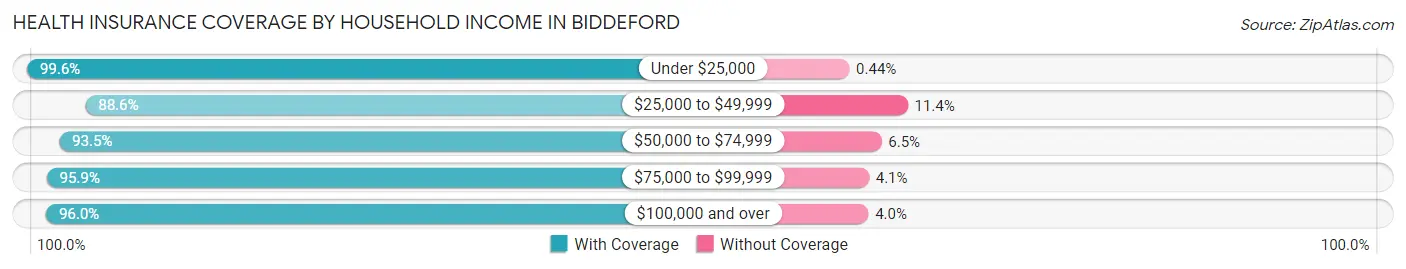
| Household Income | With Coverage | Without Coverage |
| Under $25,000 | 2,282 (99.6%) | 10 (0.4%) |
| $25,000 to $49,999 | 3,559 (88.6%) | 457 (11.4%) |
| $50,000 to $74,999 | 4,241 (93.5%) | 294 (6.5%) |
| $75,000 to $99,999 | 2,466 (95.9%) | 106 (4.1%) |
| $100,000 and over | 7,318 (96.0%) | 306 (4.0%) |
Public vs Private Health Insurance Coverage by Age in Biddeford
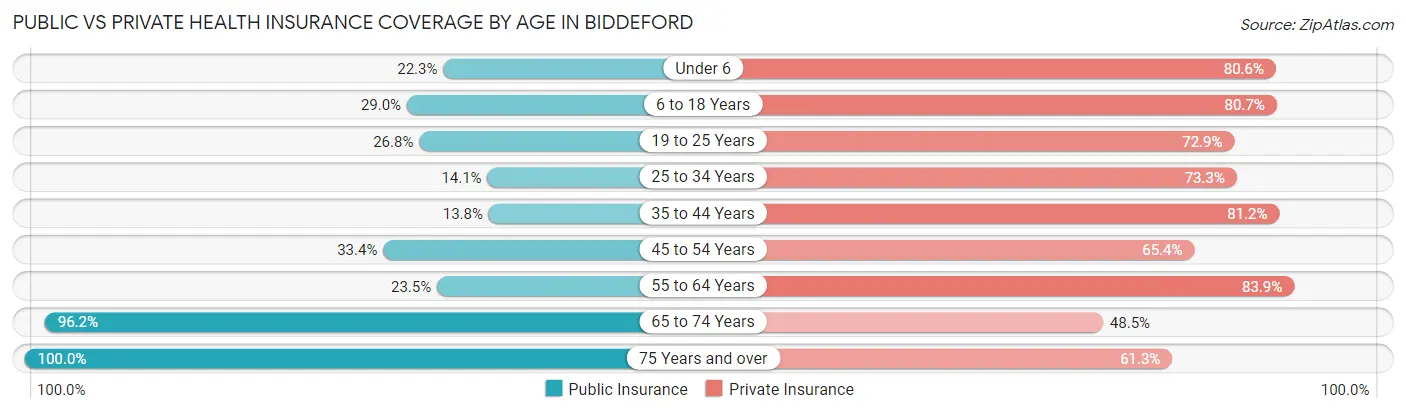
| Age Bracket | Public Insurance | Private Insurance |
| Under 6 | 243 (22.3%) | 878 (80.5%) |
| 6 to 18 Years | 793 (29.0%) | 2,205 (80.7%) |
| 19 to 25 Years | 800 (26.8%) | 2,179 (72.9%) |
| 25 to 34 Years | 542 (14.1%) | 2,820 (73.3%) |
| 35 to 44 Years | 354 (13.8%) | 2,077 (81.2%) |
| 45 to 54 Years | 905 (33.4%) | 1,771 (65.4%) |
| 55 to 64 Years | 588 (23.4%) | 2,104 (83.9%) |
| 65 to 74 Years | 1,918 (96.2%) | 966 (48.5%) |
| 75 Years and over | 1,696 (100.0%) | 1,040 (61.3%) |
| Total | 7,839 (35.4%) | 16,040 (72.5%) |
Disability Status by Sex by Age in Biddeford
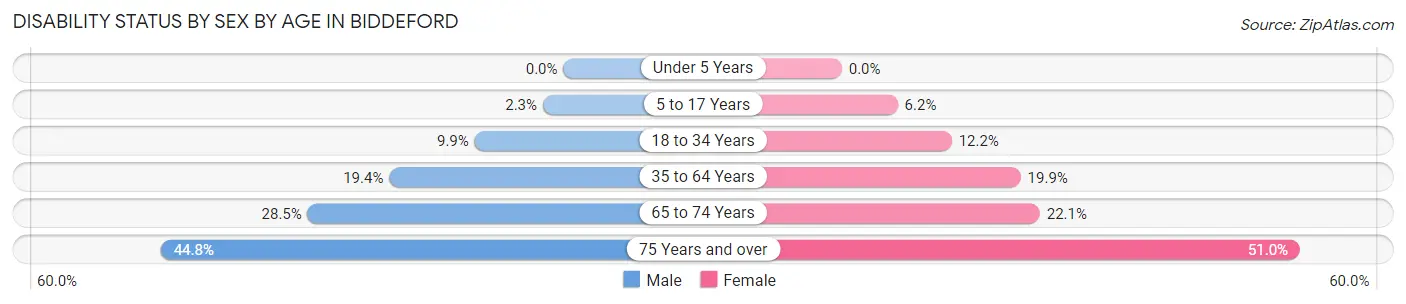
| Age Bracket | Male | Female |
| Under 5 Years | 0 (0.0%) | 0 (0.0%) |
| 5 to 17 Years | 27 (2.3%) | 76 (6.2%) |
| 18 to 34 Years | 362 (9.9%) | 444 (12.2%) |
| 35 to 64 Years | 765 (19.4%) | 762 (19.9%) |
| 65 to 74 Years | 268 (28.5%) | 232 (22.1%) |
| 75 Years and over | 343 (44.8%) | 475 (51.0%) |
Disability Class by Sex by Age in Biddeford
Disability Class: Hearing Difficulty
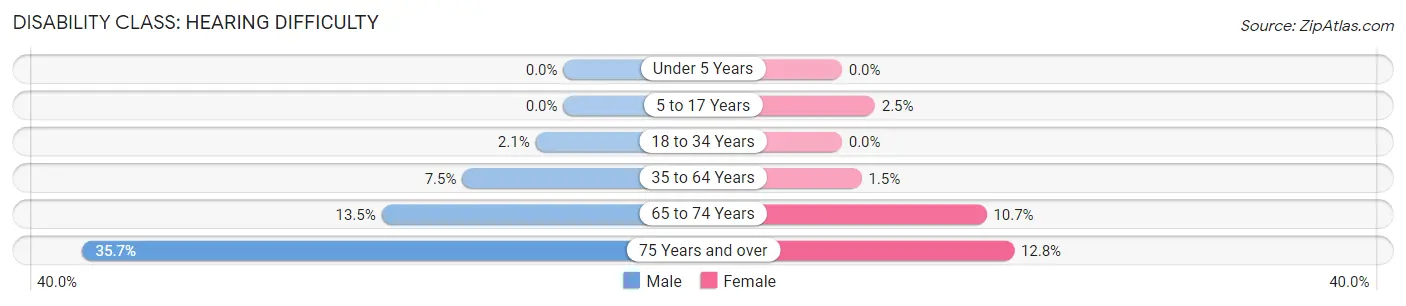
| Age Bracket | Male | Female |
| Under 5 Years | 0 (0.0%) | 0 (0.0%) |
| 5 to 17 Years | 0 (0.0%) | 30 (2.5%) |
| 18 to 34 Years | 76 (2.1%) | 0 (0.0%) |
| 35 to 64 Years | 296 (7.5%) | 56 (1.5%) |
| 65 to 74 Years | 127 (13.5%) | 113 (10.7%) |
| 75 Years and over | 273 (35.7%) | 119 (12.8%) |
Disability Class: Vision Difficulty
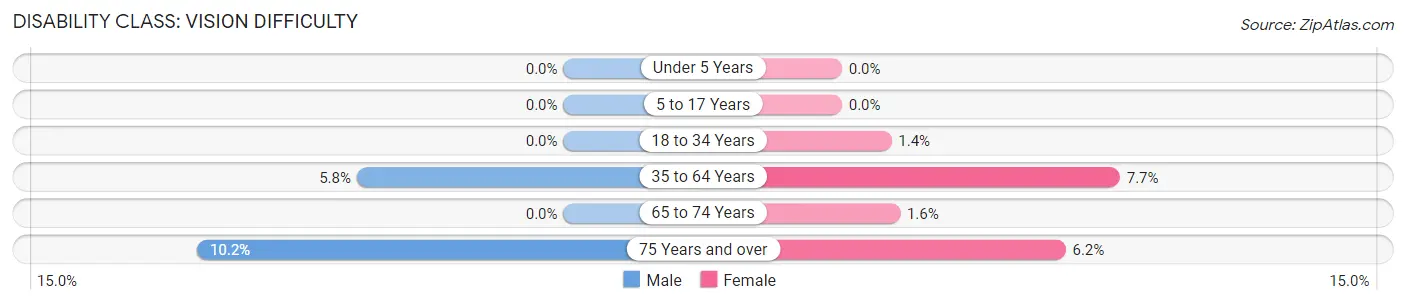
| Age Bracket | Male | Female |
| Under 5 Years | 0 (0.0%) | 0 (0.0%) |
| 5 to 17 Years | 0 (0.0%) | 0 (0.0%) |
| 18 to 34 Years | 0 (0.0%) | 50 (1.4%) |
| 35 to 64 Years | 227 (5.8%) | 296 (7.7%) |
| 65 to 74 Years | 0 (0.0%) | 17 (1.6%) |
| 75 Years and over | 78 (10.2%) | 58 (6.2%) |
Disability Class: Cognitive Difficulty
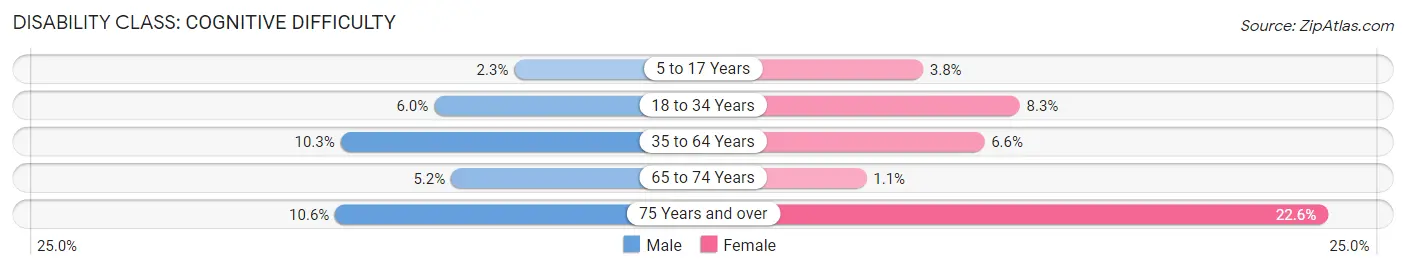
| Age Bracket | Male | Female |
| 5 to 17 Years | 27 (2.3%) | 46 (3.8%) |
| 18 to 34 Years | 220 (6.0%) | 299 (8.3%) |
| 35 to 64 Years | 408 (10.3%) | 253 (6.6%) |
| 65 to 74 Years | 49 (5.2%) | 12 (1.1%) |
| 75 Years and over | 81 (10.6%) | 210 (22.6%) |
Disability Class: Ambulatory Difficulty
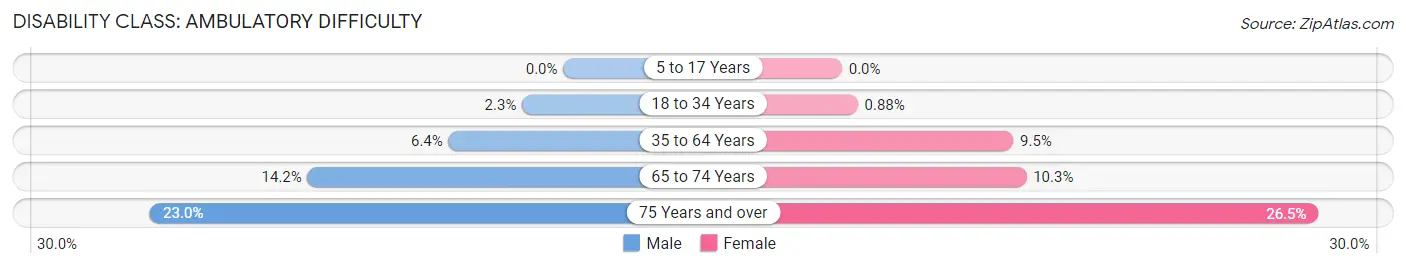
| Age Bracket | Male | Female |
| 5 to 17 Years | 0 (0.0%) | 0 (0.0%) |
| 18 to 34 Years | 84 (2.3%) | 32 (0.9%) |
| 35 to 64 Years | 252 (6.4%) | 365 (9.5%) |
| 65 to 74 Years | 134 (14.2%) | 108 (10.3%) |
| 75 Years and over | 176 (23.0%) | 247 (26.5%) |
Disability Class: Self-Care Difficulty
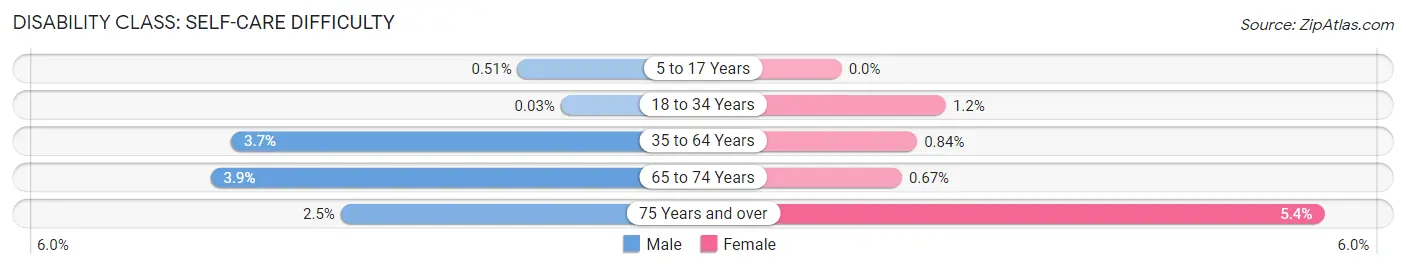
| Age Bracket | Male | Female |
| 5 to 17 Years | 6 (0.5%) | 0 (0.0%) |
| 18 to 34 Years | 1 (0.0%) | 42 (1.2%) |
| 35 to 64 Years | 146 (3.7%) | 32 (0.8%) |
| 65 to 74 Years | 37 (3.9%) | 7 (0.7%) |
| 75 Years and over | 19 (2.5%) | 50 (5.4%) |
Technology Access in Biddeford
Computing Device Access in Biddeford
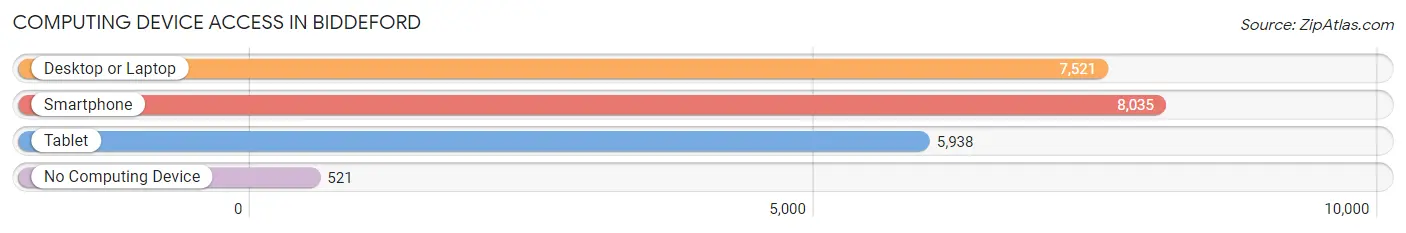
| Device Type | # Households | % Households |
| Desktop or Laptop | 7,521 | 78.5% |
| Smartphone | 8,035 | 83.9% |
| Tablet | 5,938 | 62.0% |
| No Computing Device | 521 | 5.4% |
| Total | 9,575 | 100.0% |
Internet Access in Biddeford
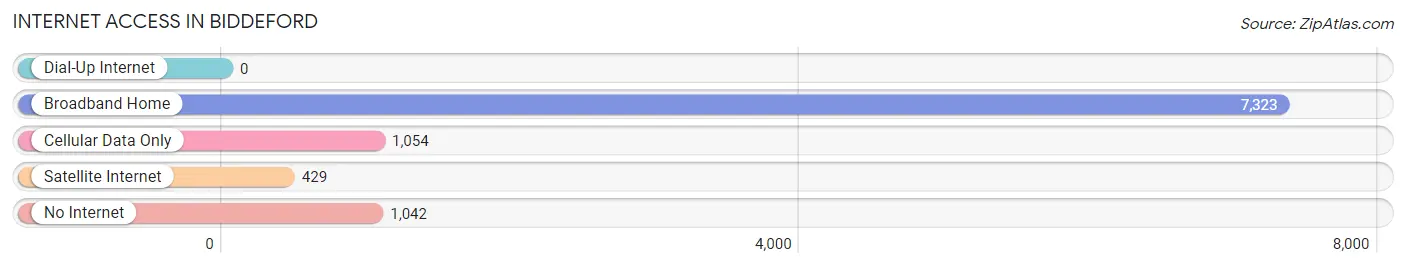
| Internet Type | # Households | % Households |
| Dial-Up Internet | 0 | 0.0% |
| Broadband Home | 7,323 | 76.5% |
| Cellular Data Only | 1,054 | 11.0% |
| Satellite Internet | 429 | 4.5% |
| No Internet | 1,042 | 10.9% |
| Total | 9,575 | 100.0% |
Biddeford Summary
Biddeford is a city located in York County, Maine, United States. It is the largest city in the county and the sixth-largest city in the state. As of the 2010 census, the city had a population of 21,277. Biddeford is home to the University of New England and the annual La Kermesse Franco-Americaine Festival.
History
The area now known as Biddeford was once inhabited by the Abenaki Indians, who called the area "Mechegonne", meaning "great tidal river". The first Europeans to settle in the area were the English, who established a trading post in 1616. The town was incorporated in 1630 as Saco, which included what is now Biddeford and Saco. In 1653, the town was renamed Biddeford after Bideford, a town in Devon, England.
In 1762, the town was divided, with the portion east of the Saco River becoming the town of Biddeford. In the early 19th century, Biddeford became a center for shipbuilding and textile mills. The city was also home to the first cotton mill in the United States, built in 1793.
In the late 19th century, Biddeford became a popular summer resort for wealthy families from Boston and New York. The city was also home to the first roller coaster in the United States, built in 1885.
Geography
Biddeford is located at 43°25'N 70°31'W (43.4139, -70.5183). According to the United States Census Bureau, the city has a total area of 24.2 square miles (62.7 km2), of which 23.2 square miles (60.1 km2) is land and 1.0 square mile (2.6 km2) is water.
The city is situated on the Saco River, which flows into the Atlantic Ocean. The city is bordered by Saco to the west, Scarborough to the east, and Old Orchard Beach to the south.
Economy
Biddeford's economy is largely based on the service industry, with many restaurants, hotels, and retail stores located in the city. The city is also home to several manufacturing companies, including a paper mill, a plastics manufacturer, and a printing company.
The University of New England is located in Biddeford, and is a major employer in the city. The university also serves as a major economic driver for the city, with many students and faculty living in the city and spending money in the local economy.
Demographics
As of the 2010 census, there were 21,277 people, 8,717 households, and 4,945 families residing in the city. The population density was 917.2 people per square mile (354.2/km2). There were 9,521 housing units at an average density of 409.3 per square mile (158.1/km2). The racial makeup of the city was 92.2% White, 2.3% African American, 0.5% Native American, 1.7% Asian, 0.1% Pacific Islander, 1.2% from other races, and 2.1% from two or more races. Hispanic or Latino of any race were 3.3% of the population.
There were 8,717 households, out of which 25.3% had children under the age of 18 living with them, 39.2% were married couples living together, 12.7% had a female householder with no husband present, and 44.2% were non-families. 35.2% of all households were made up of individuals, and 13.2% had someone living alone who was 65 years of age or older. The average household size was 2.27 and the average family size was 2.94.
In the city, the population was spread out, with 21.3% under the age of 18, 11.7% from 18 to 24, 28.2% from 25 to 44, 22.2% from 45 to 64, and 16.6% who were 65 years of age or older. The median age was 36 years. For every 100 females, there were 91.2 males. For every 100 females age 18 and over, there were 88.2 males.
The median income for a household in the city was $35,945, and the median income for a family was $45,945. Males had a median income of $32,945 versus $25,945 for females. The per capita income for the city was $19,945. About 10.2% of families and 13.2% of the population were below the poverty line, including 17.2% of those under age 18 and 10.2% of those age 65 or over.
Common Questions
What is Per Capita Income in Biddeford?
Per Capita income in Biddeford is $36,617.
What is the Median Family Income in Biddeford?
Median Family Income in Biddeford is $80,583.
What is the Median Household income in Biddeford?
Median Household Income in Biddeford is $63,261.
What is Income or Wage Gap in Biddeford?
Income or Wage Gap in Biddeford is 27.3%.
Women in Biddeford earn 72.7 cents for every dollar earned by a man.
What is Inequality or Gini Index in Biddeford?
Inequality or Gini Index in Biddeford is 0.43.
What is the Total Population of Biddeford?
Total Population of Biddeford is 22,438.
What is the Total Male Population of Biddeford?
Total Male Population of Biddeford is 11,232.
What is the Total Female Population of Biddeford?
Total Female Population of Biddeford is 11,206.
What is the Ratio of Males per 100 Females in Biddeford?
There are 100.23 Males per 100 Females in Biddeford.
What is the Ratio of Females per 100 Males in Biddeford?
There are 99.77 Females per 100 Males in Biddeford.
What is the Median Population Age in Biddeford?
Median Population Age in Biddeford is 36.8 Years.
What is the Average Family Size in Biddeford
Average Family Size in Biddeford is 2.9 People.
What is the Average Household Size in Biddeford
Average Household Size in Biddeford is 2.2 People.
How Large is the Labor Force in Biddeford?
There are 13,213 People in the Labor Forcein in Biddeford.
What is the Percentage of People in the Labor Force in Biddeford?
67.3% of People are in the Labor Force in Biddeford.
What is the Unemployment Rate in Biddeford?
Unemployment Rate in Biddeford is 4.7%.