Westbrook, ME Map & Demographics
Westbrook Map
Westbrook Overview
$40,736
PER CAPITA INCOME
$93,185
AVG FAMILY INCOME
$81,198
AVG HOUSEHOLD INCOME
18.0%
WAGE / INCOME GAP [ % ]
82.0¢/ $1
WAGE / INCOME GAP [ $ ]
0.37
INEQUALITY / GINI INDEX
20,339
TOTAL POPULATION
9,813
MALE POPULATION
10,526
FEMALE POPULATION
93.23
MALES / 100 FEMALES
107.27
FEMALES / 100 MALES
37.7
MEDIAN AGE
3.0
AVG FAMILY SIZE
2.3
AVG HOUSEHOLD SIZE
12,728
LABOR FORCE [ PEOPLE ]
72.6%
PERCENT IN LABOR FORCE
2.9%
UNEMPLOYMENT RATE
Westbrook Zip Codes
Westbrook Area Codes
Income in Westbrook
Income Overview in Westbrook
Per Capita Income in Westbrook is $40,736, while median incomes of families and households are $93,185 and $81,198 respectively.
| Characteristic | Number | Measure |
| Per Capita Income | 20,339 | $40,736 |
| Median Family Income | 4,701 | $93,185 |
| Mean Family Income | 4,701 | $110,168 |
| Median Household Income | 8,910 | $81,198 |
| Mean Household Income | 8,910 | $91,846 |
| Income Deficit | 4,701 | $0 |
| Wage / Income Gap (%) | 20,339 | 18.02% |
| Wage / Income Gap ($) | 20,339 | 81.98¢ per $1 |
| Gini / Inequality Index | 20,339 | 0.37 |
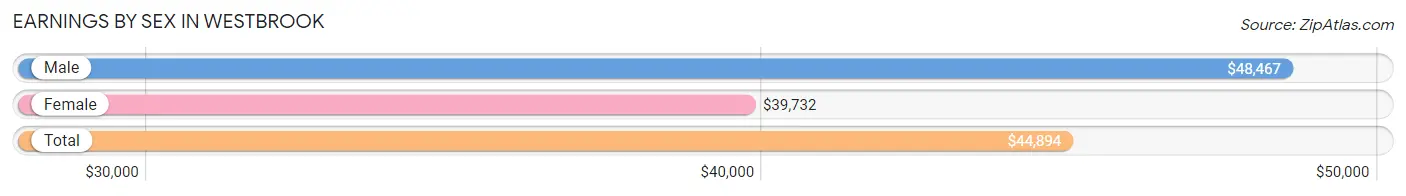
Earnings by Sex in Westbrook
Average Earnings in Westbrook are $44,894, $48,467 for men and $39,732 for women, a difference of 18.0%.
| Sex | Number | Average Earnings |
| Male | 6,715 (50.7%) | $48,467 |
| Female | 6,529 (49.3%) | $39,732 |
| Total | 13,244 (100.0%) | $44,894 |
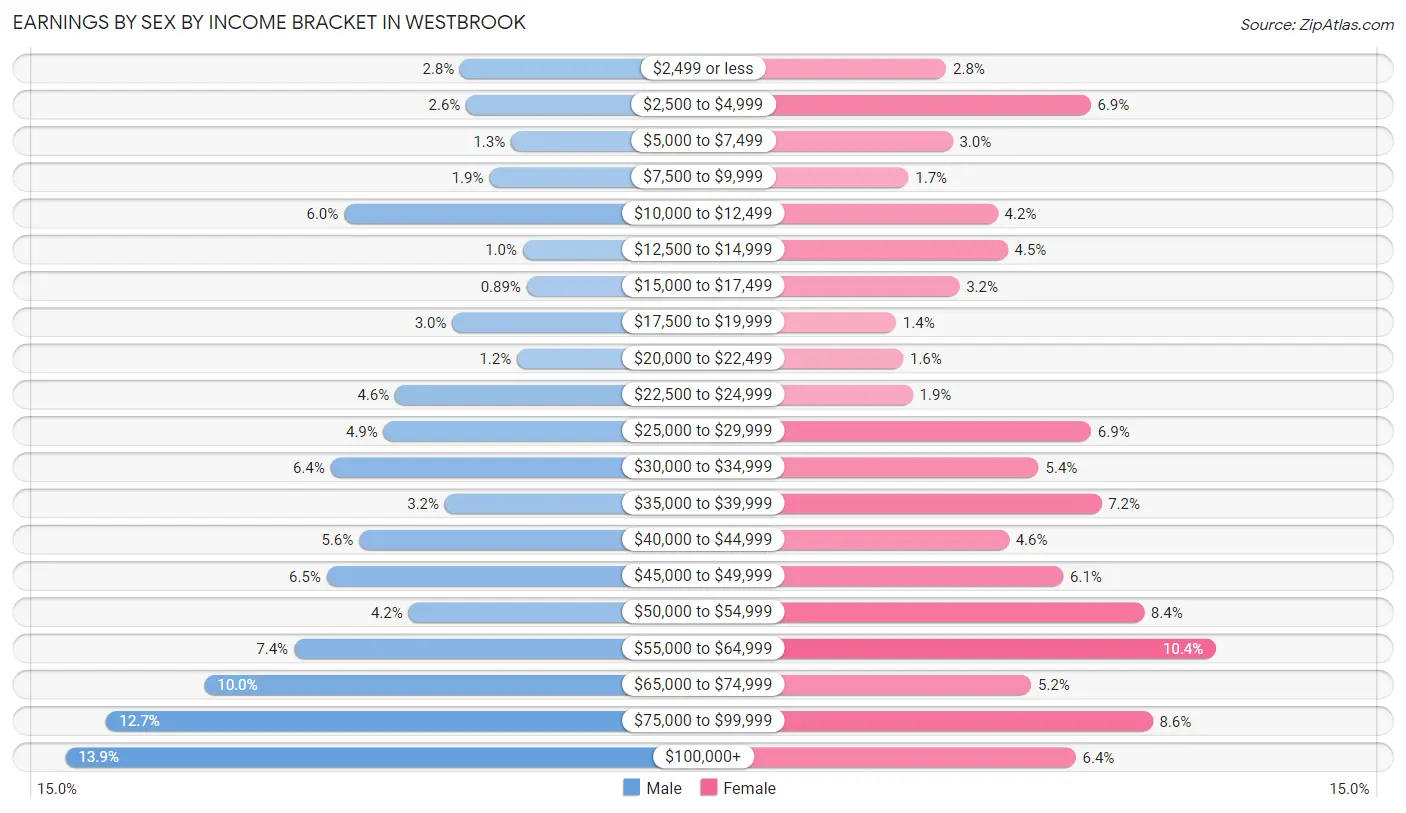
Earnings by Sex by Income Bracket in Westbrook
The most common earnings brackets in Westbrook are $100,000+ for men (930 | 13.9%) and $55,000 to $64,999 for women (676 | 10.3%).
| Income | Male | Female |
| $2,499 or less | 185 (2.8%) | 182 (2.8%) |
| $2,500 to $4,999 | 174 (2.6%) | 447 (6.9%) |
| $5,000 to $7,499 | 89 (1.3%) | 194 (3.0%) |
| $7,500 to $9,999 | 130 (1.9%) | 113 (1.7%) |
| $10,000 to $12,499 | 404 (6.0%) | 277 (4.2%) |
| $12,500 to $14,999 | 67 (1.0%) | 295 (4.5%) |
| $15,000 to $17,499 | 60 (0.9%) | 206 (3.2%) |
| $17,500 to $19,999 | 200 (3.0%) | 90 (1.4%) |
| $20,000 to $22,499 | 78 (1.2%) | 103 (1.6%) |
| $22,500 to $24,999 | 308 (4.6%) | 121 (1.8%) |
| $25,000 to $29,999 | 330 (4.9%) | 448 (6.9%) |
| $30,000 to $34,999 | 430 (6.4%) | 352 (5.4%) |
| $35,000 to $39,999 | 214 (3.2%) | 467 (7.1%) |
| $40,000 to $44,999 | 376 (5.6%) | 297 (4.5%) |
| $45,000 to $49,999 | 437 (6.5%) | 397 (6.1%) |
| $50,000 to $54,999 | 283 (4.2%) | 545 (8.4%) |
| $55,000 to $64,999 | 499 (7.4%) | 676 (10.3%) |
| $65,000 to $74,999 | 668 (10.0%) | 338 (5.2%) |
| $75,000 to $99,999 | 853 (12.7%) | 561 (8.6%) |
| $100,000+ | 930 (13.9%) | 420 (6.4%) |
| Total | 6,715 (100.0%) | 6,529 (100.0%) |
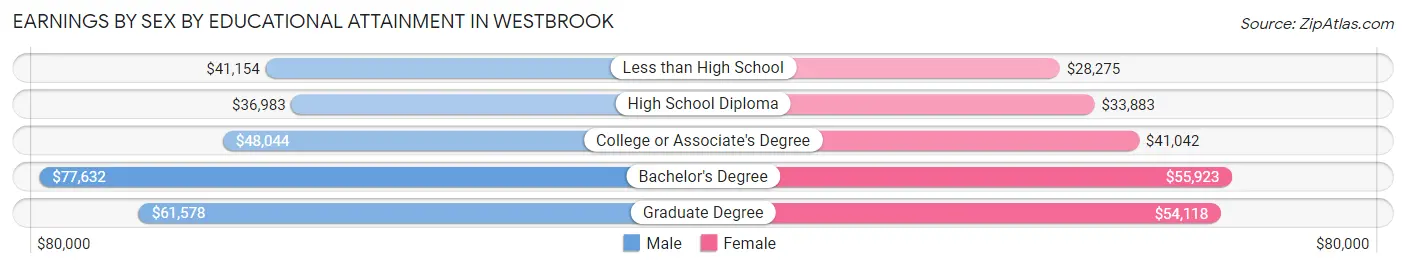
Earnings by Sex by Educational Attainment in Westbrook
Average earnings in Westbrook are $53,983 for men and $45,860 for women, a difference of 15.0%. Men with an educational attainment of bachelor's degree enjoy the highest average annual earnings of $77,632, while those with high school diploma education earn the least with $36,983. Women with an educational attainment of bachelor's degree earn the most with the average annual earnings of $55,923, while those with less than high school education have the smallest earnings of $28,275.
| Educational Attainment | Male Income | Female Income |
| Less than High School | $41,154 | $28,275 |
| High School Diploma | $36,983 | $33,883 |
| College or Associate's Degree | $48,044 | $41,042 |
| Bachelor's Degree | $77,632 | $55,923 |
| Graduate Degree | $61,578 | $54,118 |
| Total | $53,983 | $45,860 |
Family Income in Westbrook
Family Income Brackets in Westbrook
According to the Westbrook family income data, there are 1,020 families falling into the $100,000 to $149,999 income range, which is the most common income bracket and makes up 21.7% of all families. Conversely, the $15,000 to $24,999 income bracket is the least frequent group with only 56 families (1.2%) belonging to this category.
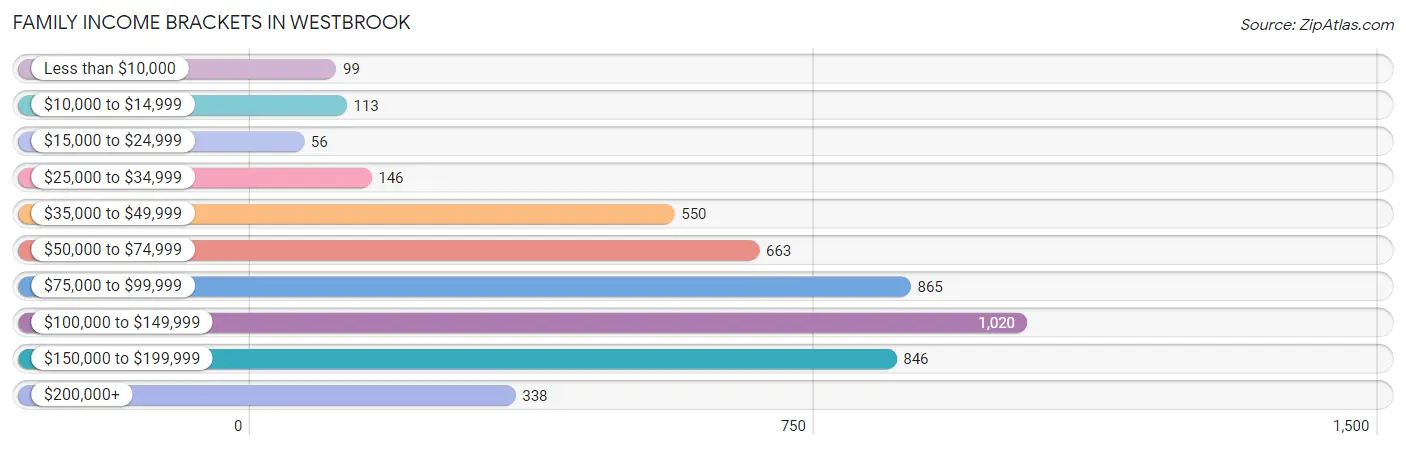
| Income Bracket | # Families | % Families |
| Less than $10,000 | 99 | 2.1% |
| $10,000 to $14,999 | 113 | 2.4% |
| $15,000 to $24,999 | 56 | 1.2% |
| $25,000 to $34,999 | 146 | 3.1% |
| $35,000 to $49,999 | 550 | 11.7% |
| $50,000 to $74,999 | 663 | 14.1% |
| $75,000 to $99,999 | 865 | 18.4% |
| $100,000 to $149,999 | 1,020 | 21.7% |
| $150,000 to $199,999 | 846 | 18.0% |
| $200,000+ | 338 | 7.2% |
Family Income by Famaliy Size in Westbrook
7+ person families (48 | 1.0%) account for the highest median family income in Westbrook with $177,200 per family, while 2-person families (2,268 | 48.2%) have the highest median income of $43,552 per family member.
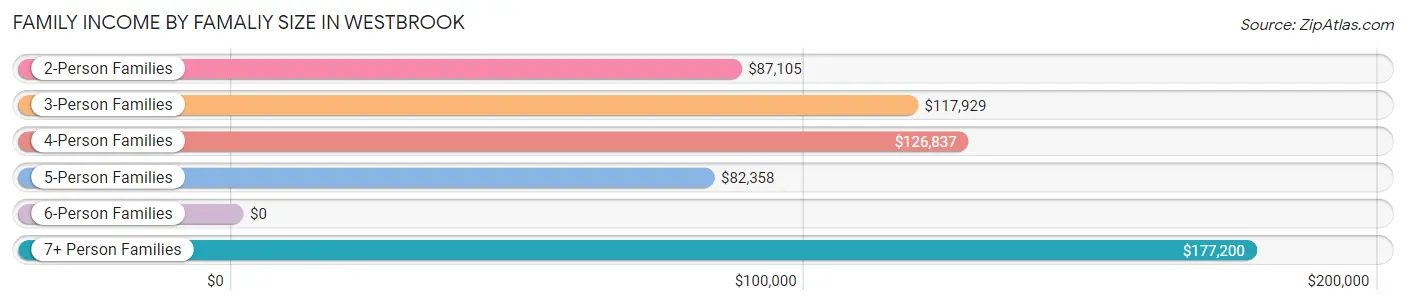
| Income Bracket | # Families | Median Income |
| 2-Person Families | 2,268 (48.2%) | $87,105 |
| 3-Person Families | 1,387 (29.5%) | $117,929 |
| 4-Person Families | 703 (14.9%) | $126,837 |
| 5-Person Families | 241 (5.1%) | $82,358 |
| 6-Person Families | 54 (1.1%) | $0 |
| 7+ Person Families | 48 (1.0%) | $177,200 |
| Total | 4,701 (100.0%) | $93,185 |
Family Income by Number of Earners in Westbrook
The median family income in Westbrook is $93,185, with families comprising 3+ earners (854) having the highest median family income of $142,045, while families with 1 earner (1,076) have the lowest median family income of $44,752, accounting for 18.2% and 22.9% of families, respectively.
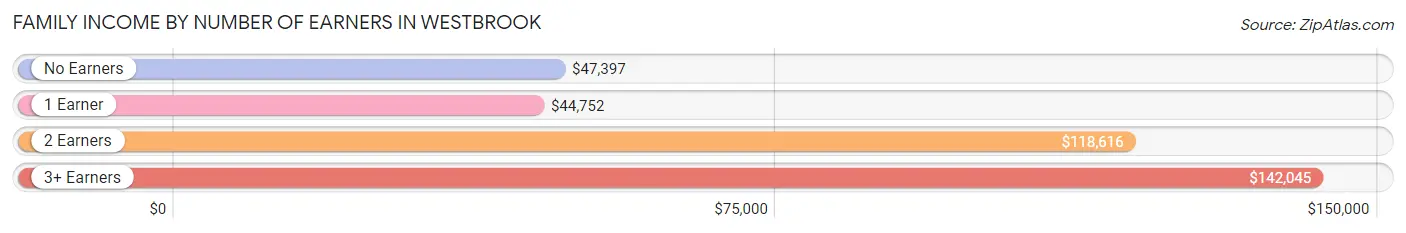
| Number of Earners | # Families | Median Income |
| No Earners | 494 (10.5%) | $47,397 |
| 1 Earner | 1,076 (22.9%) | $44,752 |
| 2 Earners | 2,277 (48.4%) | $118,616 |
| 3+ Earners | 854 (18.2%) | $142,045 |
| Total | 4,701 (100.0%) | $93,185 |
Household Income in Westbrook
Household Income Brackets in Westbrook
With 2,005 households falling in the category, the $100,000 to $149,999 income range is the most frequent in Westbrook, accounting for 22.5% of all households. In contrast, only 258 households (2.9%) fall into the less than $10,000 income bracket, making it the least populous group.
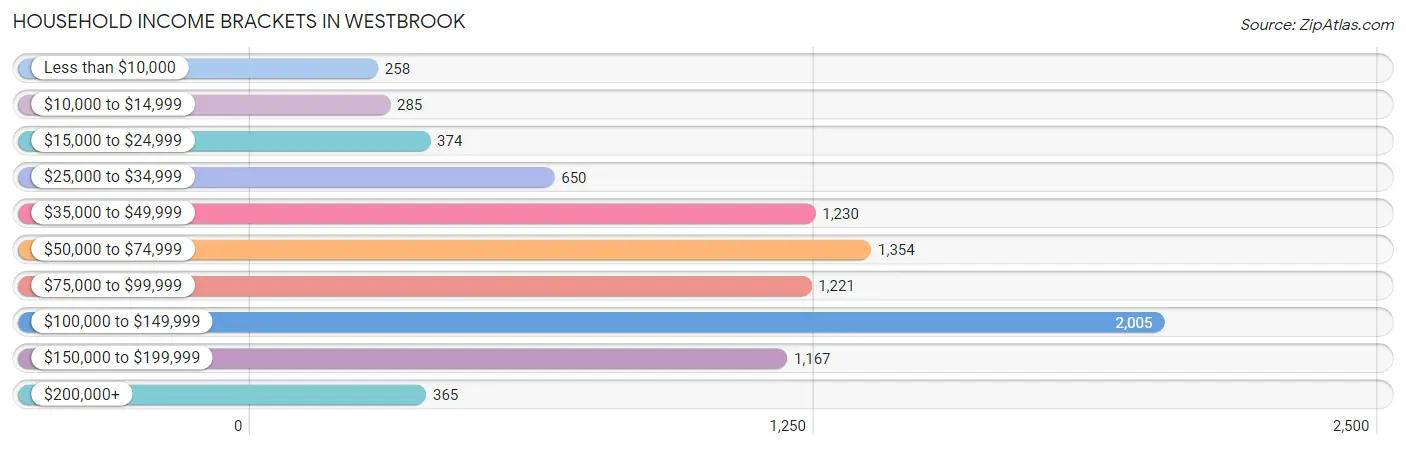
| Income Bracket | # Households | % Households |
| Less than $10,000 | 258 | 2.9% |
| $10,000 to $14,999 | 285 | 3.2% |
| $15,000 to $24,999 | 374 | 4.2% |
| $25,000 to $34,999 | 650 | 7.3% |
| $35,000 to $49,999 | 1,230 | 13.8% |
| $50,000 to $74,999 | 1,354 | 15.2% |
| $75,000 to $99,999 | 1,221 | 13.7% |
| $100,000 to $149,999 | 2,005 | 22.5% |
| $150,000 to $199,999 | 1,167 | 13.1% |
| $200,000+ | 365 | 4.1% |
Household Income by Householder Age in Westbrook
The median household income in Westbrook is $81,198, with the highest median household income of $100,082 found in the 25 to 44 years age bracket for the primary householder. A total of 3,461 households (38.8%) fall into this category. Meanwhile, the 15 to 24 years age bracket for the primary householder has the lowest median household income of $44,672, with 236 households (2.6%) in this group.
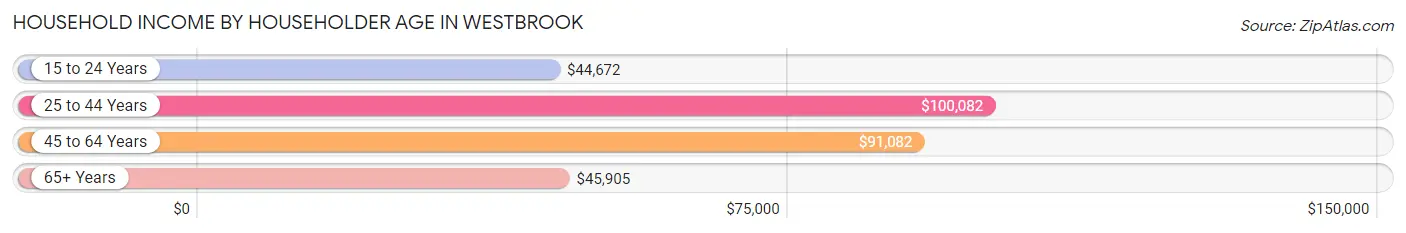
| Income Bracket | # Households | Median Income |
| 15 to 24 Years | 236 (2.6%) | $44,672 |
| 25 to 44 Years | 3,461 (38.8%) | $100,082 |
| 45 to 64 Years | 2,880 (32.3%) | $91,082 |
| 65+ Years | 2,333 (26.2%) | $45,905 |
| Total | 8,910 (100.0%) | $81,198 |
Poverty in Westbrook
Income Below Poverty by Sex and Age in Westbrook
With 9.0% poverty level for males and 9.7% for females among the residents of Westbrook, under 5 year old males and 6 to 11 year old females are the most vulnerable to poverty, with 103 males (21.8%) and 183 females (45.2%) in their respective age groups living below the poverty level.
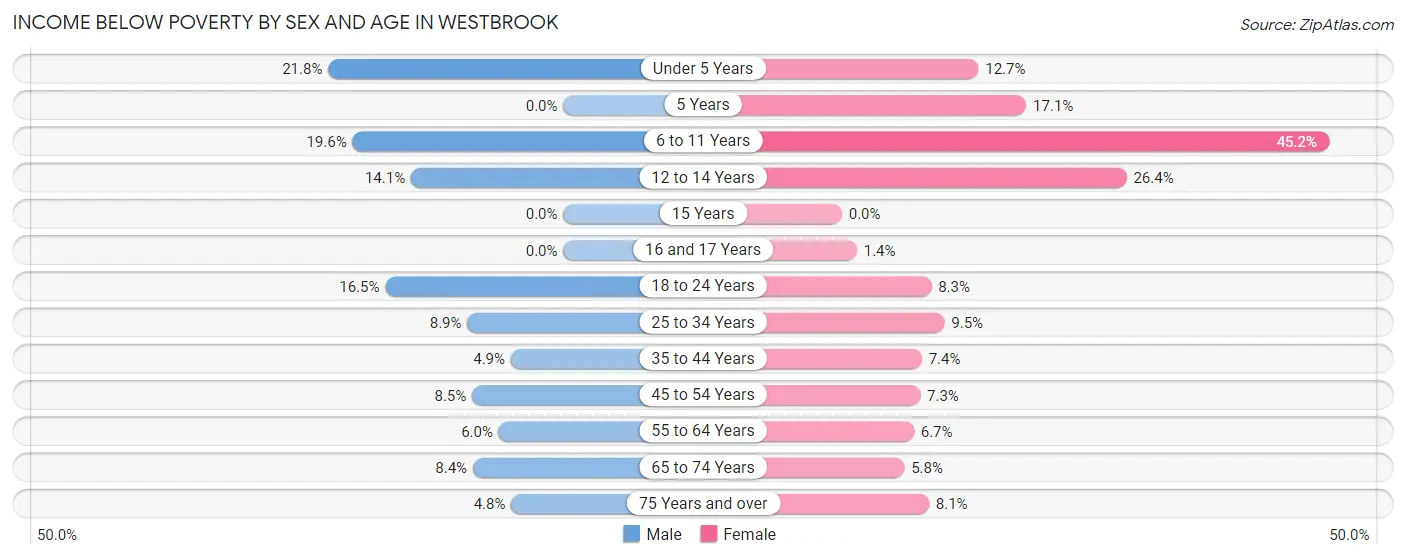
| Age Bracket | Male | Female |
| Under 5 Years | 103 (21.8%) | 73 (12.7%) |
| 5 Years | 0 (0.0%) | 13 (17.1%) |
| 6 to 11 Years | 82 (19.6%) | 183 (45.2%) |
| 12 to 14 Years | 43 (14.1%) | 65 (26.4%) |
| 15 Years | 0 (0.0%) | 0 (0.0%) |
| 16 and 17 Years | 0 (0.0%) | 6 (1.4%) |
| 18 to 24 Years | 113 (16.5%) | 72 (8.3%) |
| 25 to 34 Years | 172 (8.9%) | 206 (9.5%) |
| 35 to 44 Years | 78 (4.9%) | 85 (7.4%) |
| 45 to 54 Years | 88 (8.5%) | 91 (7.3%) |
| 55 to 64 Years | 85 (6.0%) | 84 (6.7%) |
| 65 to 74 Years | 75 (8.4%) | 68 (5.8%) |
| 75 Years and over | 32 (4.8%) | 62 (8.1%) |
| Total | 871 (9.0%) | 1,008 (9.7%) |
Income Above Poverty by Sex and Age in Westbrook
According to the poverty statistics in Westbrook, males aged 5 years and females aged 15 years are the age groups that are most secure financially, with 100.0% of males and 100.0% of females in these age groups living above the poverty line.
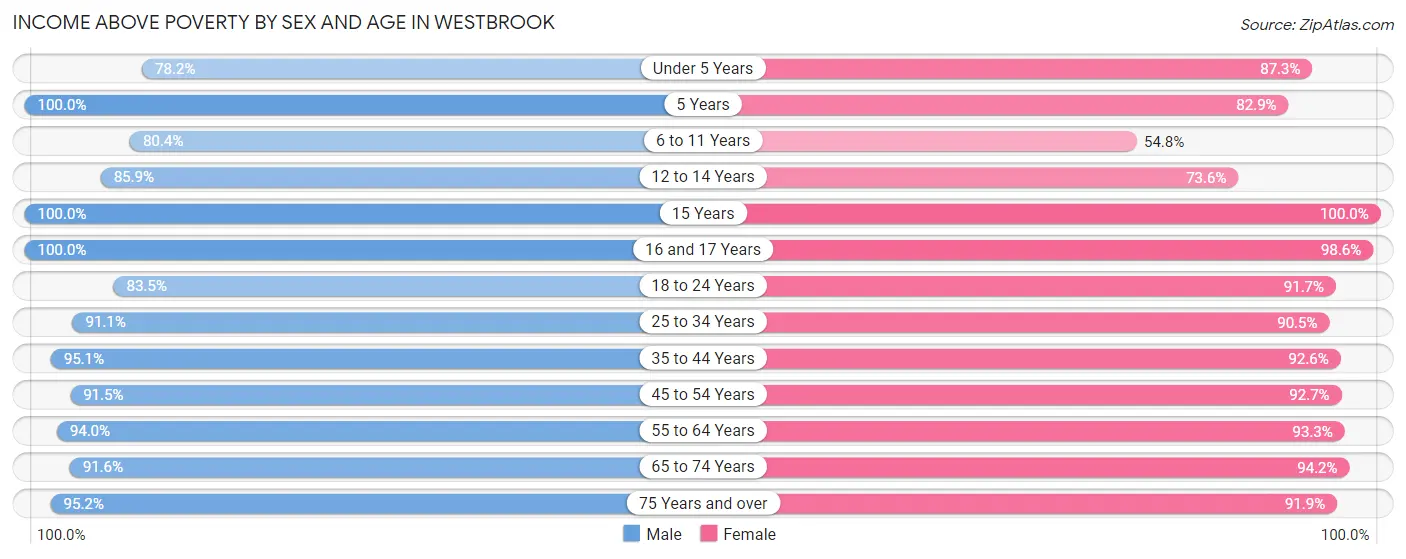
| Age Bracket | Male | Female |
| Under 5 Years | 369 (78.2%) | 503 (87.3%) |
| 5 Years | 120 (100.0%) | 63 (82.9%) |
| 6 to 11 Years | 337 (80.4%) | 222 (54.8%) |
| 12 to 14 Years | 261 (85.9%) | 181 (73.6%) |
| 15 Years | 49 (100.0%) | 37 (100.0%) |
| 16 and 17 Years | 116 (100.0%) | 426 (98.6%) |
| 18 to 24 Years | 571 (83.5%) | 795 (91.7%) |
| 25 to 34 Years | 1,759 (91.1%) | 1,959 (90.5%) |
| 35 to 44 Years | 1,524 (95.1%) | 1,061 (92.6%) |
| 45 to 54 Years | 951 (91.5%) | 1,161 (92.7%) |
| 55 to 64 Years | 1,335 (94.0%) | 1,173 (93.3%) |
| 65 to 74 Years | 819 (91.6%) | 1,107 (94.2%) |
| 75 Years and over | 631 (95.2%) | 705 (91.9%) |
| Total | 8,842 (91.0%) | 9,393 (90.3%) |
Income Below Poverty Among Married-Couple Families in Westbrook
The poverty statistics for married-couple families in Westbrook show that 2.9% or 103 of the total 3,603 families live below the poverty line. Families with 3 or 4 children have the highest poverty rate of 25.3%, comprising of 41 families. On the other hand, families with 1 or 2 children have the lowest poverty rate of 0.0%, which includes 0 families.
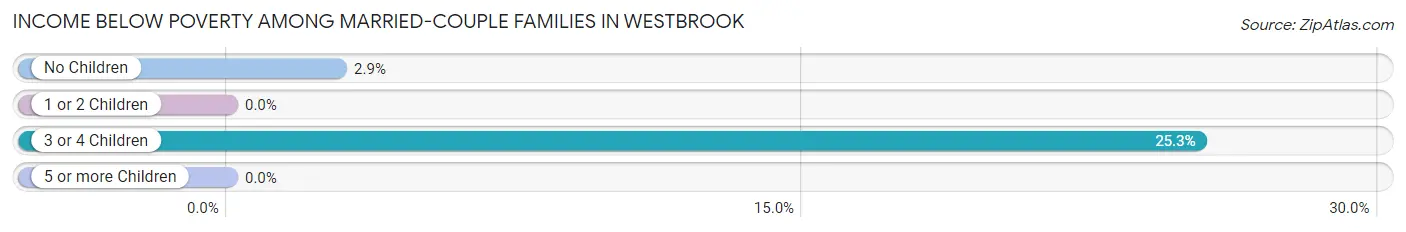
| Children | Above Poverty | Below Poverty |
| No Children | 2,116 (97.2%) | 62 (2.9%) |
| 1 or 2 Children | 1,240 (100.0%) | 0 (0.0%) |
| 3 or 4 Children | 121 (74.7%) | 41 (25.3%) |
| 5 or more Children | 23 (100.0%) | 0 (0.0%) |
| Total | 3,500 (97.1%) | 103 (2.9%) |
Income Below Poverty Among Single-Parent Households in Westbrook
According to the poverty data in Westbrook, 6.2% or 19 single-father households and 19.6% or 155 single-mother households are living below the poverty line. Among single-father households, those with 1 or 2 children have the highest poverty rate, with 19 households (13.2%) experiencing poverty. Likewise, among single-mother households, those with 3 or 4 children have the highest poverty rate, with 25 households (100.0%) falling below the poverty line.
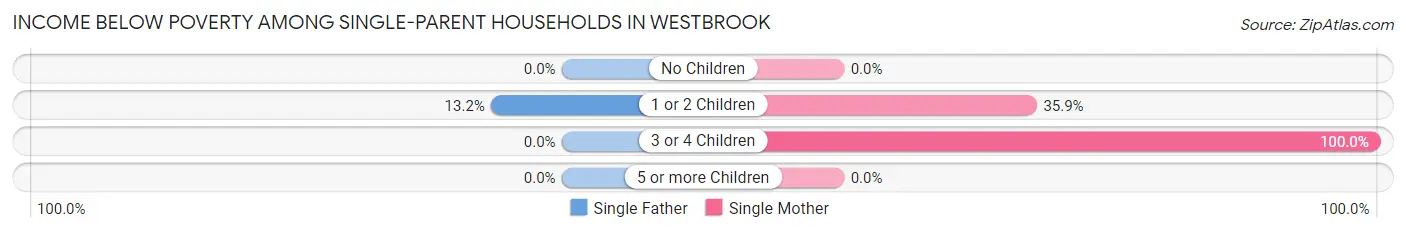
| Children | Single Father | Single Mother |
| No Children | 0 (0.0%) | 0 (0.0%) |
| 1 or 2 Children | 19 (13.2%) | 130 (35.9%) |
| 3 or 4 Children | 0 (0.0%) | 25 (100.0%) |
| 5 or more Children | 0 (0.0%) | 0 (0.0%) |
| Total | 19 (6.2%) | 155 (19.6%) |
Income Below Poverty Among Married-Couple vs Single-Parent Households in Westbrook
The poverty data for Westbrook shows that 103 of the married-couple family households (2.9%) and 174 of the single-parent households (15.9%) are living below the poverty level. Within the married-couple family households, those with 3 or 4 children have the highest poverty rate, with 41 households (25.3%) falling below the poverty line. Among the single-parent households, those with 3 or 4 children have the highest poverty rate, with 25 household (100.0%) living below poverty.
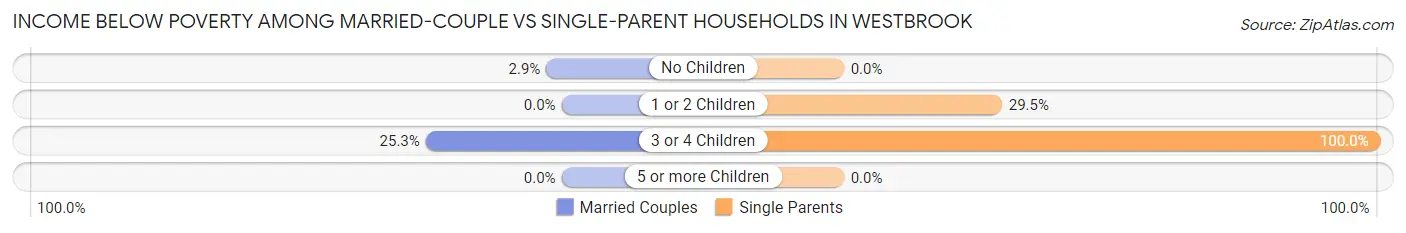
| Children | Married-Couple Families | Single-Parent Households |
| No Children | 62 (2.9%) | 0 (0.0%) |
| 1 or 2 Children | 0 (0.0%) | 149 (29.4%) |
| 3 or 4 Children | 41 (25.3%) | 25 (100.0%) |
| 5 or more Children | 0 (0.0%) | 0 (0.0%) |
| Total | 103 (2.9%) | 174 (15.9%) |
Race in Westbrook
The most populous races in Westbrook are White / Caucasian (17,487 | 86.0%), Two or more Races (1,002 | 4.9%), and Black / African American (867 | 4.3%).
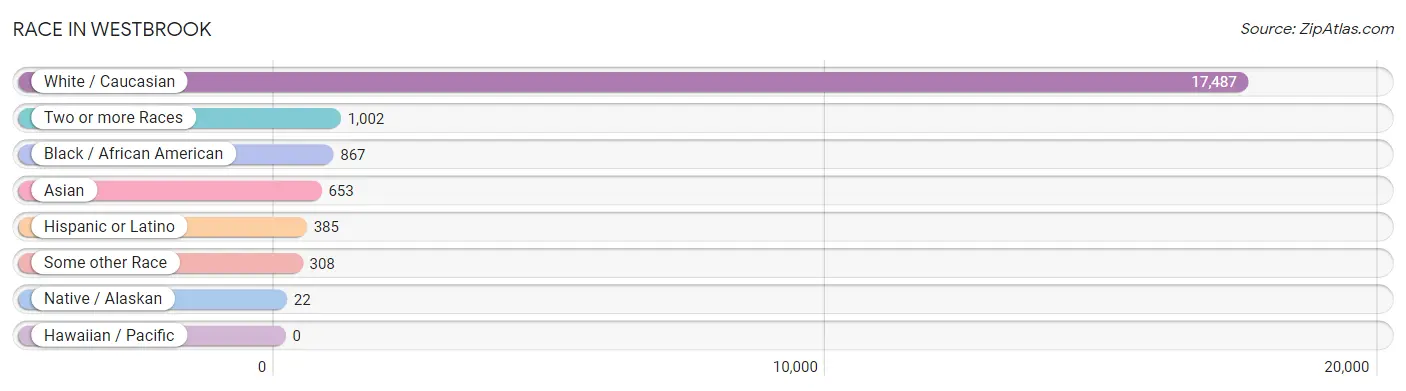
| Race | # Population | % Population |
| Asian | 653 | 3.2% |
| Black / African American | 867 | 4.3% |
| Hawaiian / Pacific | 0 | 0.0% |
| Hispanic or Latino | 385 | 1.9% |
| Native / Alaskan | 22 | 0.1% |
| White / Caucasian | 17,487 | 86.0% |
| Two or more Races | 1,002 | 4.9% |
| Some other Race | 308 | 1.5% |
| Total | 20,339 | 100.0% |
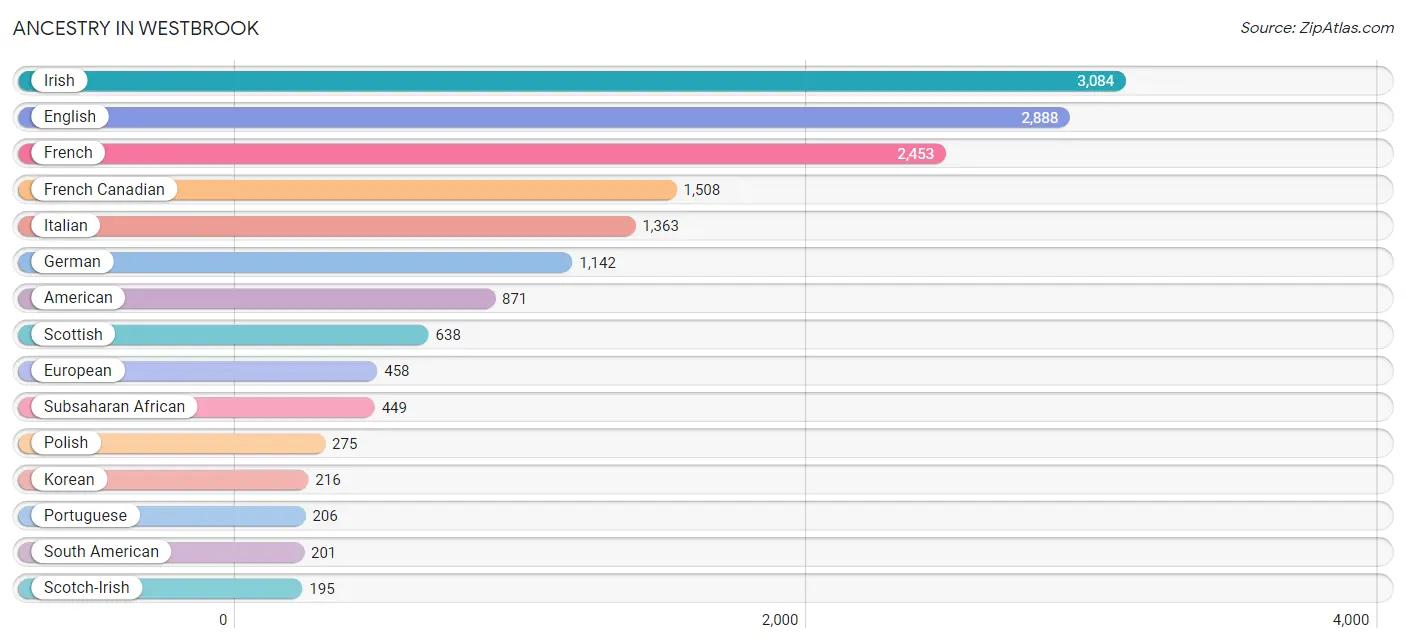
Ancestry in Westbrook
The most populous ancestries reported in Westbrook are Irish (3,084 | 15.2%), English (2,888 | 14.2%), French (2,453 | 12.1%), French Canadian (1,508 | 7.4%), and Italian (1,363 | 6.7%), together accounting for 55.5% of all Westbrook residents.
| Ancestry | # Population | % Population |
| Afghan | 25 | 0.1% |
| African | 152 | 0.7% |
| American | 871 | 4.3% |
| Arab | 188 | 0.9% |
| Argentinean | 157 | 0.8% |
| Armenian | 11 | 0.1% |
| Australian | 15 | 0.1% |
| Austrian | 30 | 0.2% |
| Barbadian | 42 | 0.2% |
| Bhutanese | 14 | 0.1% |
| British | 113 | 0.6% |
| British West Indian | 2 | 0.0% |
| Burmese | 42 | 0.2% |
| Cajun | 18 | 0.1% |
| Canadian | 46 | 0.2% |
| Comanche | 19 | 0.1% |
| Croatian | 14 | 0.1% |
| Czech | 34 | 0.2% |
| Danish | 60 | 0.3% |
| Dutch | 57 | 0.3% |
| English | 2,888 | 14.2% |
| European | 458 | 2.2% |
| Finnish | 77 | 0.4% |
| French | 2,453 | 12.1% |
| French Canadian | 1,508 | 7.4% |
| German | 1,142 | 5.6% |
| Greek | 82 | 0.4% |
| Haitian | 6 | 0.0% |
| Hungarian | 74 | 0.4% |
| Indian (Asian) | 15 | 0.1% |
| Iranian | 19 | 0.1% |
| Iraqi | 159 | 0.8% |
| Irish | 3,084 | 15.2% |
| Italian | 1,363 | 6.7% |
| Japanese | 181 | 0.9% |
| Korean | 216 | 1.1% |
| Lebanese | 27 | 0.1% |
| Mexican | 73 | 0.4% |
| Native Hawaiian | 145 | 0.7% |
| Nigerian | 17 | 0.1% |
| Northern European | 16 | 0.1% |
| Norwegian | 94 | 0.5% |
| Pakistani | 11 | 0.1% |
| Pennsylvania German | 1 | 0.0% |
| Peruvian | 44 | 0.2% |
| Polish | 275 | 1.3% |
| Portuguese | 206 | 1.0% |
| Russian | 75 | 0.4% |
| Scandinavian | 64 | 0.3% |
| Scotch-Irish | 195 | 1.0% |
| Scottish | 638 | 3.1% |
| Serbian | 25 | 0.1% |
| Slavic | 12 | 0.1% |
| Slovak | 30 | 0.2% |
| Slovene | 19 | 0.1% |
| Somali | 2 | 0.0% |
| South American | 201 | 1.0% |
| Sri Lankan | 14 | 0.1% |
| Subsaharan African | 449 | 2.2% |
| Swedish | 151 | 0.7% |
| Swiss | 14 | 0.1% |
| Thai | 83 | 0.4% |
| Trinidadian and Tobagonian | 4 | 0.0% |
| Ukrainian | 10 | 0.1% |
| Welsh | 98 | 0.5% |
| West Indian | 14 | 0.1% | View All 66 Rows |
Immigrants in Westbrook
The most numerous immigrant groups reported in Westbrook came from Asia (744 | 3.7%), Africa (489 | 2.4%), Middle Africa (285 | 1.4%), South Eastern Asia (276 | 1.4%), and Latin America (253 | 1.2%), together accounting for 10.1% of all Westbrook residents.
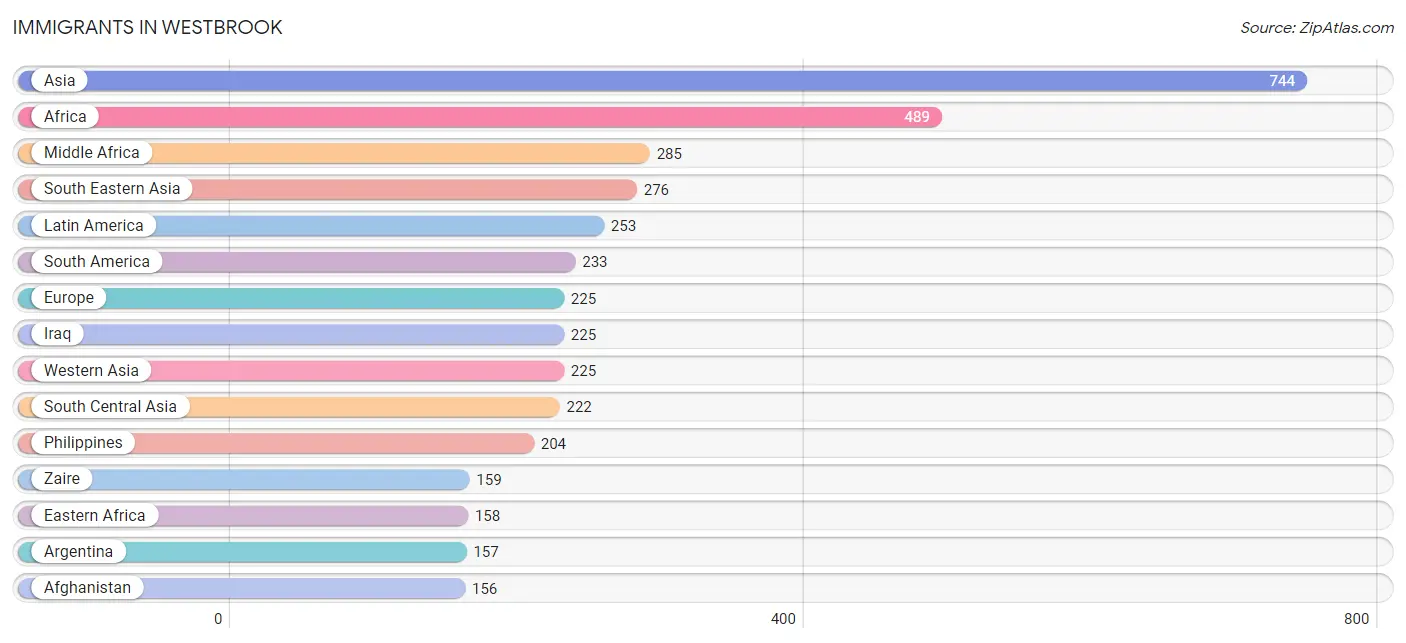
| Immigration Origin | # Population | % Population |
| Afghanistan | 156 | 0.8% |
| Africa | 489 | 2.4% |
| Albania | 9 | 0.0% |
| Argentina | 157 | 0.8% |
| Asia | 744 | 3.7% |
| Australia | 15 | 0.1% |
| Barbados | 14 | 0.1% |
| Canada | 43 | 0.2% |
| Caribbean | 20 | 0.1% |
| Eastern Africa | 158 | 0.8% |
| Eastern Asia | 21 | 0.1% |
| Eastern Europe | 39 | 0.2% |
| Europe | 225 | 1.1% |
| Germany | 76 | 0.4% |
| Guyana | 32 | 0.2% |
| India | 66 | 0.3% |
| Iraq | 225 | 1.1% |
| Ireland | 18 | 0.1% |
| Korea | 21 | 0.1% |
| Laos | 46 | 0.2% |
| Latin America | 253 | 1.2% |
| Middle Africa | 285 | 1.4% |
| Northern Europe | 110 | 0.5% |
| Oceania | 15 | 0.1% |
| Peru | 44 | 0.2% |
| Philippines | 204 | 1.0% |
| Russia | 11 | 0.1% |
| Somalia | 3 | 0.0% |
| South America | 233 | 1.1% |
| South Central Asia | 222 | 1.1% |
| South Eastern Asia | 276 | 1.4% |
| St. Vincent and the Grenadines | 2 | 0.0% |
| Thailand | 26 | 0.1% |
| Trinidad and Tobago | 4 | 0.0% |
| Western Asia | 225 | 1.1% |
| Western Europe | 76 | 0.4% |
| Zaire | 159 | 0.8% | View All 37 Rows |
Sex and Age in Westbrook
Sex and Age in Westbrook
The most populous age groups in Westbrook are 35 to 39 Years (1,150 | 11.7%) for men and 30 to 34 Years (1,159 | 11.0%) for women.
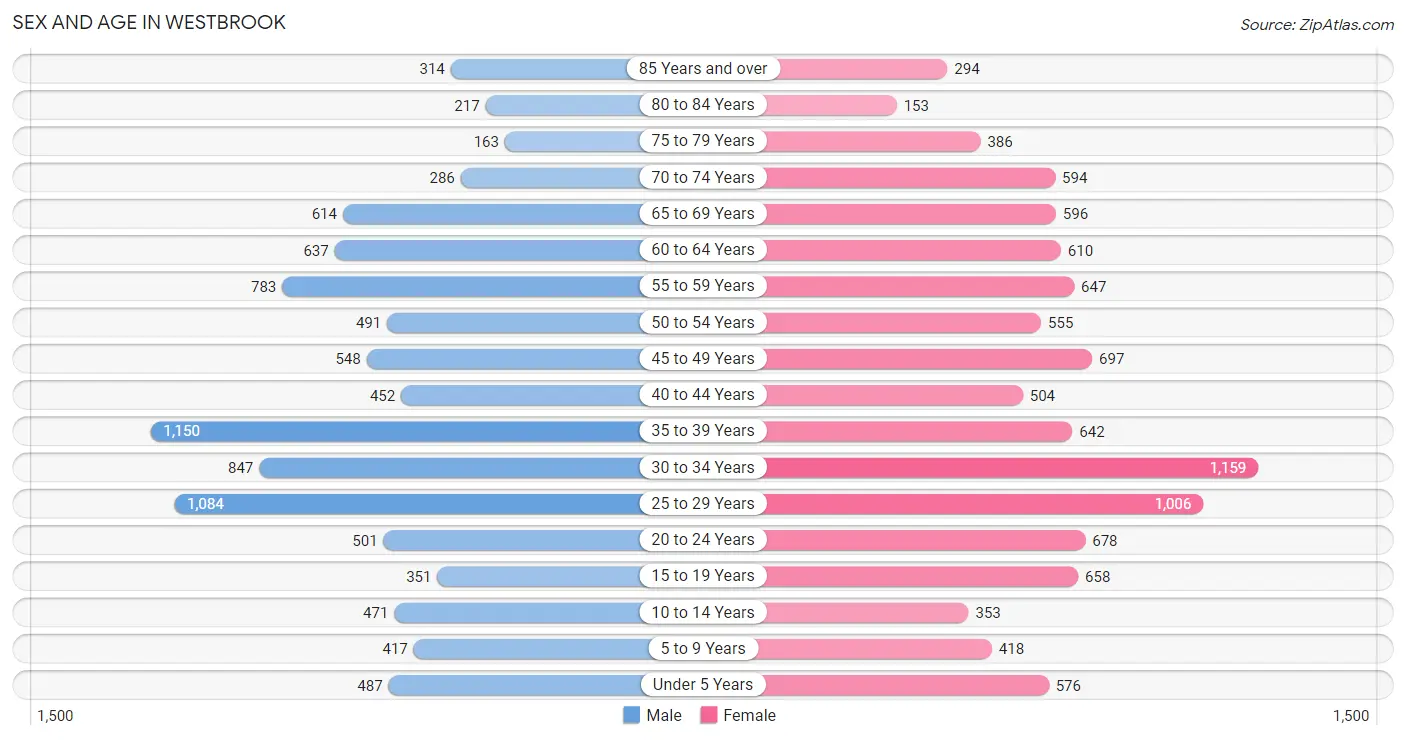
| Age Bracket | Male | Female |
| Under 5 Years | 487 (5.0%) | 576 (5.5%) |
| 5 to 9 Years | 417 (4.3%) | 418 (4.0%) |
| 10 to 14 Years | 471 (4.8%) | 353 (3.4%) |
| 15 to 19 Years | 351 (3.6%) | 658 (6.2%) |
| 20 to 24 Years | 501 (5.1%) | 678 (6.4%) |
| 25 to 29 Years | 1,084 (11.1%) | 1,006 (9.6%) |
| 30 to 34 Years | 847 (8.6%) | 1,159 (11.0%) |
| 35 to 39 Years | 1,150 (11.7%) | 642 (6.1%) |
| 40 to 44 Years | 452 (4.6%) | 504 (4.8%) |
| 45 to 49 Years | 548 (5.6%) | 697 (6.6%) |
| 50 to 54 Years | 491 (5.0%) | 555 (5.3%) |
| 55 to 59 Years | 783 (8.0%) | 647 (6.1%) |
| 60 to 64 Years | 637 (6.5%) | 610 (5.8%) |
| 65 to 69 Years | 614 (6.3%) | 596 (5.7%) |
| 70 to 74 Years | 286 (2.9%) | 594 (5.6%) |
| 75 to 79 Years | 163 (1.7%) | 386 (3.7%) |
| 80 to 84 Years | 217 (2.2%) | 153 (1.5%) |
| 85 Years and over | 314 (3.2%) | 294 (2.8%) |
| Total | 9,813 (100.0%) | 10,526 (100.0%) |
Families and Households in Westbrook
Median Family Size in Westbrook
The median family size in Westbrook is 2.98 persons per family, with married-couple families (3,603 | 76.6%) accounting for the largest median family size of 3.02 persons per family. On the other hand, single female/mother families (793 | 16.9%) represent the smallest median family size with 2.83 persons per family.
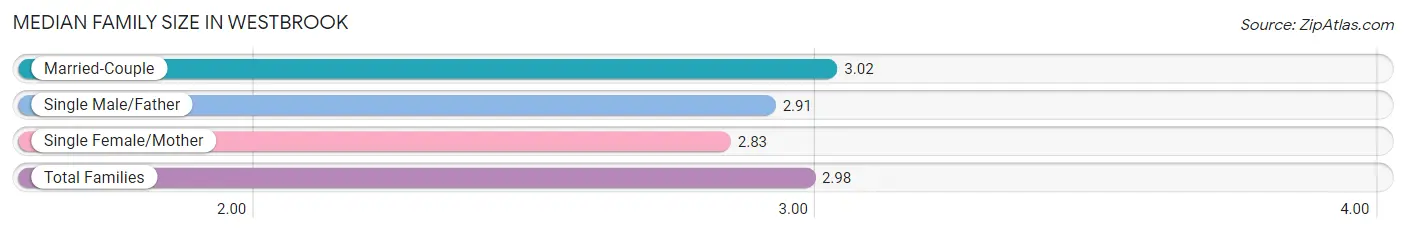
| Family Type | # Families | Family Size |
| Married-Couple | 3,603 (76.6%) | 3.02 |
| Single Male/Father | 305 (6.5%) | 2.91 |
| Single Female/Mother | 793 (16.9%) | 2.83 |
| Total Families | 4,701 (100.0%) | 2.98 |
Median Household Size in Westbrook
The median household size in Westbrook is 2.26 persons per household, with single female/mother households (793 | 8.9%) accounting for the largest median household size of 3.2 persons per household. non-family households (4,209 | 47.2%) represent the smallest median household size with 1.36 persons per household.
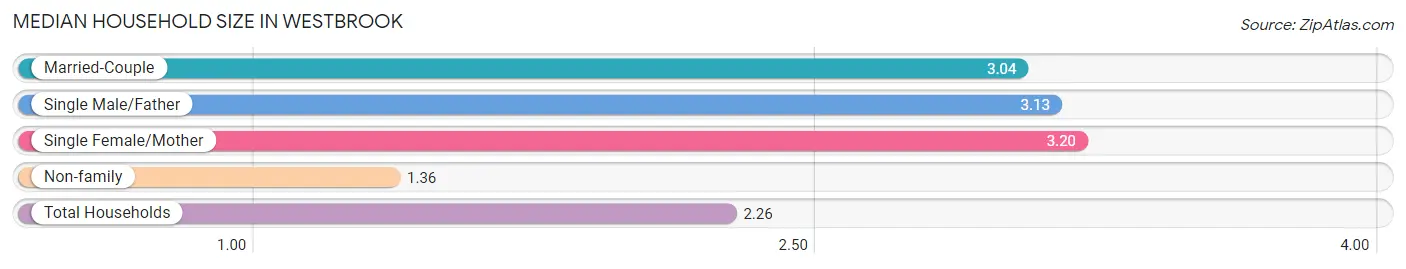
| Household Type | # Households | Household Size |
| Married-Couple | 3,603 (40.4%) | 3.04 |
| Single Male/Father | 305 (3.4%) | 3.13 |
| Single Female/Mother | 793 (8.9%) | 3.20 |
| Non-family | 4,209 (47.2%) | 1.36 |
| Total Households | 8,910 (100.0%) | 2.26 |
Household Size by Marriage Status in Westbrook
Out of a total of 8,910 households in Westbrook, 4,701 (52.8%) are family households, while 4,209 (47.2%) are nonfamily households. The most numerous type of family households are 2-person households, comprising 2,122, and the most common type of nonfamily households are 1-person households, comprising 2,976.
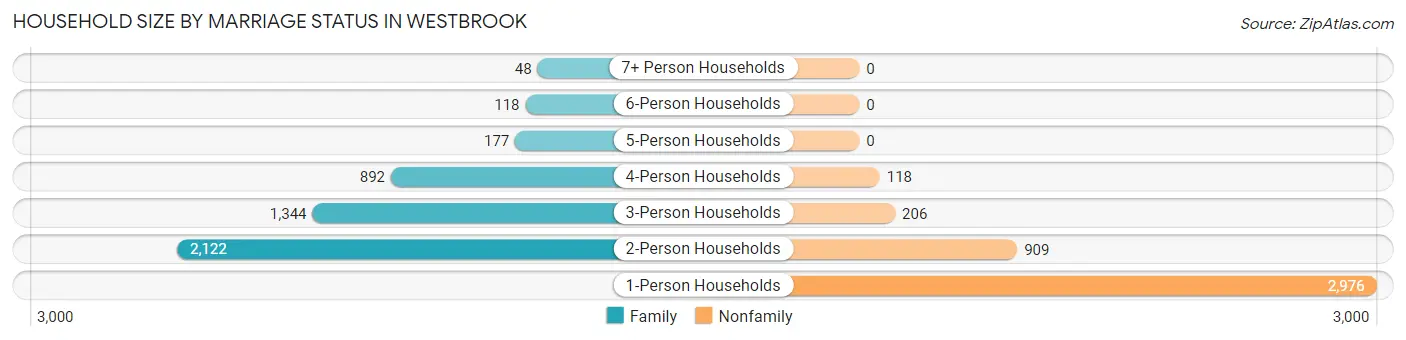
| Household Size | Family Households | Nonfamily Households |
| 1-Person Households | - | 2,976 (33.4%) |
| 2-Person Households | 2,122 (23.8%) | 909 (10.2%) |
| 3-Person Households | 1,344 (15.1%) | 206 (2.3%) |
| 4-Person Households | 892 (10.0%) | 118 (1.3%) |
| 5-Person Households | 177 (2.0%) | 0 (0.0%) |
| 6-Person Households | 118 (1.3%) | 0 (0.0%) |
| 7+ Person Households | 48 (0.5%) | 0 (0.0%) |
| Total | 4,701 (52.8%) | 4,209 (47.2%) |
Female Fertility in Westbrook
Fertility by Age in Westbrook
Average fertility rate in Westbrook is 33.0 births per 1,000 women. Women in the age bracket of 20 to 34 years have the highest fertility rate with 48.0 births per 1,000 women. Women in the age bracket of 20 to 34 years acount for 77.0% of all women with births.
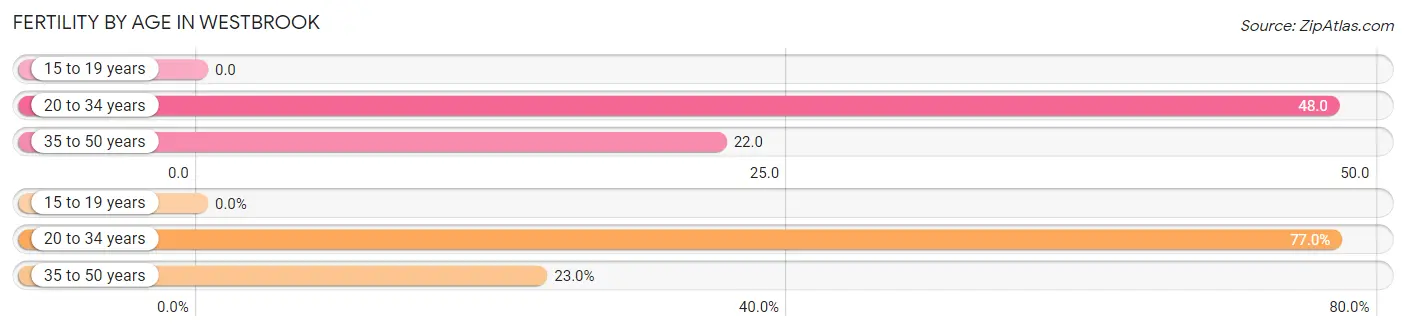
| Age Bracket | Women with Births | Births / 1,000 Women |
| 15 to 19 years | 0 (0.0%) | 0.0 |
| 20 to 34 years | 137 (77.0%) | 48.0 |
| 35 to 50 years | 41 (23.0%) | 22.0 |
| Total | 178 (100.0%) | 33.0 |
Fertility by Age by Marriage Status in Westbrook
83.7% of women with births (178) in Westbrook are married. The highest percentage of unmarried women with births falls into 35 to 50 years age bracket with 36.6% of them unmarried at the time of birth, while the lowest percentage of unmarried women with births belong to 20 to 34 years age bracket with 10.2% of them unmarried.
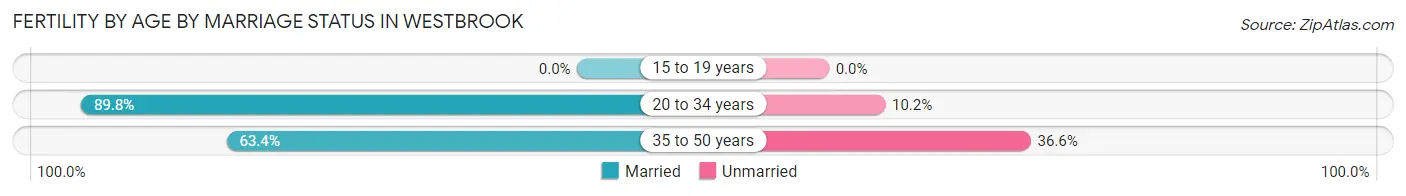
| Age Bracket | Married | Unmarried |
| 15 to 19 years | 0 (0.0%) | 0 (0.0%) |
| 20 to 34 years | 123 (89.8%) | 14 (10.2%) |
| 35 to 50 years | 26 (63.4%) | 15 (36.6%) |
| Total | 149 (83.7%) | 29 (16.3%) |
Fertility by Education in Westbrook
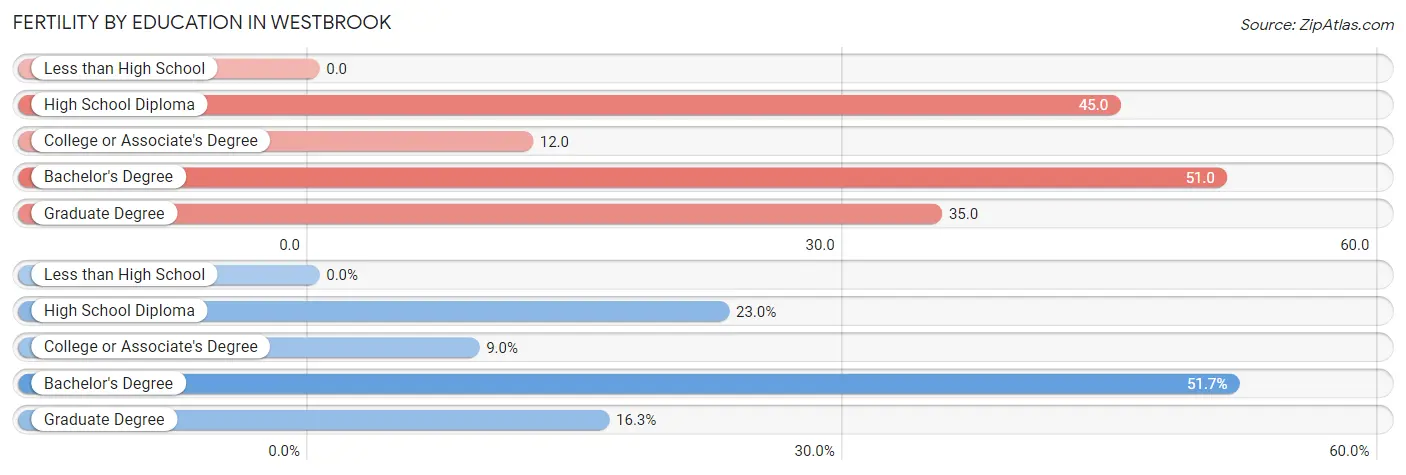
| Educational Attainment | Women with Births | Births / 1,000 Women |
| Less than High School | 0 (0.0%) | 0.0 |
| High School Diploma | 41 (23.0%) | 45.0 |
| College or Associate's Degree | 16 (9.0%) | 12.0 |
| Bachelor's Degree | 92 (51.7%) | 51.0 |
| Graduate Degree | 29 (16.3%) | 35.0 |
| Total | 178 (100.0%) | 33.0 |
Fertility by Education by Marriage Status in Westbrook
16.3% of women with births in Westbrook are unmarried. Women with the educational attainment of college or associate's degree are most likely to be married with 100.0% of them married at childbirth, while women with the educational attainment of graduate degree are least likely to be married with 48.3% of them unmarried at childbirth.
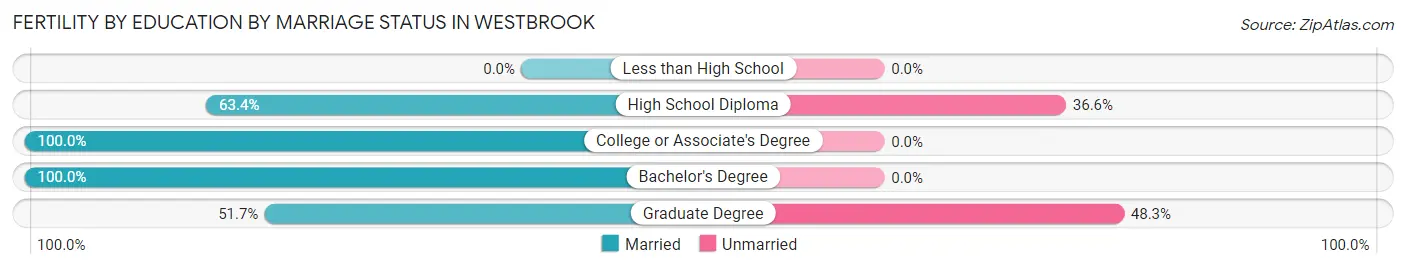
| Educational Attainment | Married | Unmarried |
| Less than High School | 0 (0.0%) | 0 (0.0%) |
| High School Diploma | 26 (63.4%) | 15 (36.6%) |
| College or Associate's Degree | 16 (100.0%) | 0 (0.0%) |
| Bachelor's Degree | 92 (100.0%) | 0 (0.0%) |
| Graduate Degree | 15 (51.7%) | 14 (48.3%) |
| Total | 149 (83.7%) | 29 (16.3%) |
Employment Characteristics in Westbrook
Employment by Class of Employer in Westbrook
Among the 12,170 employed individuals in Westbrook, private company employees (8,141 | 66.9%), not-for-profit organizations (1,648 | 13.5%), and local government employees (1,042 | 8.6%) make up the most common classes of employment.
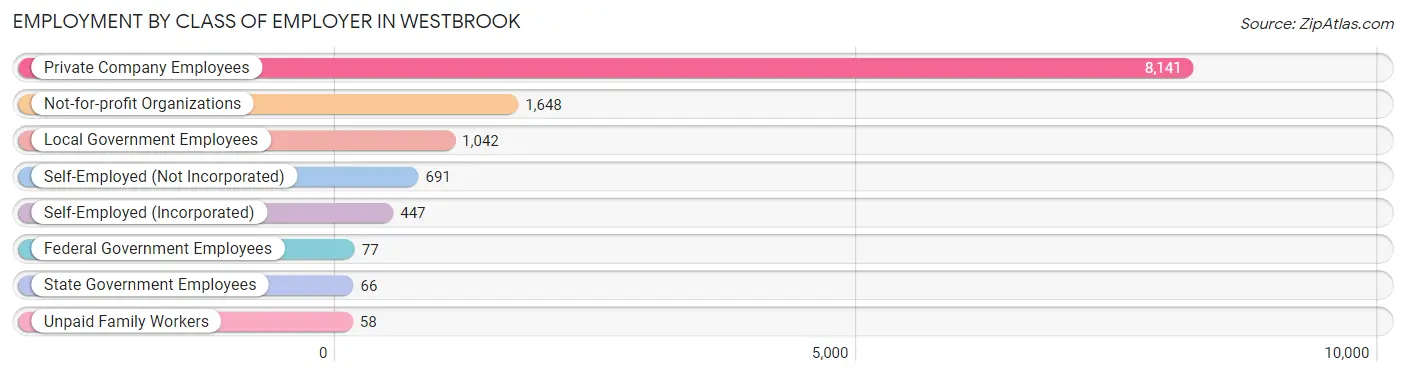
| Employer Class | # Employees | % Employees |
| Private Company Employees | 8,141 | 66.9% |
| Self-Employed (Incorporated) | 447 | 3.7% |
| Self-Employed (Not Incorporated) | 691 | 5.7% |
| Not-for-profit Organizations | 1,648 | 13.5% |
| Local Government Employees | 1,042 | 8.6% |
| State Government Employees | 66 | 0.5% |
| Federal Government Employees | 77 | 0.6% |
| Unpaid Family Workers | 58 | 0.5% |
| Total | 12,170 | 100.0% |
Employment Status by Age in Westbrook
According to the labor force statistics for Westbrook, out of the total population over 16 years of age (17,531), 72.6% or 12,728 individuals are in the labor force, with 2.9% or 369 of them unemployed. The age group with the highest labor force participation rate is 55 to 59 years, with 92.3% or 1,320 individuals in the labor force. Within the labor force, the 16 to 19 years age range has the highest percentage of unemployed individuals, with 9.6% or 64 of them being unemployed.
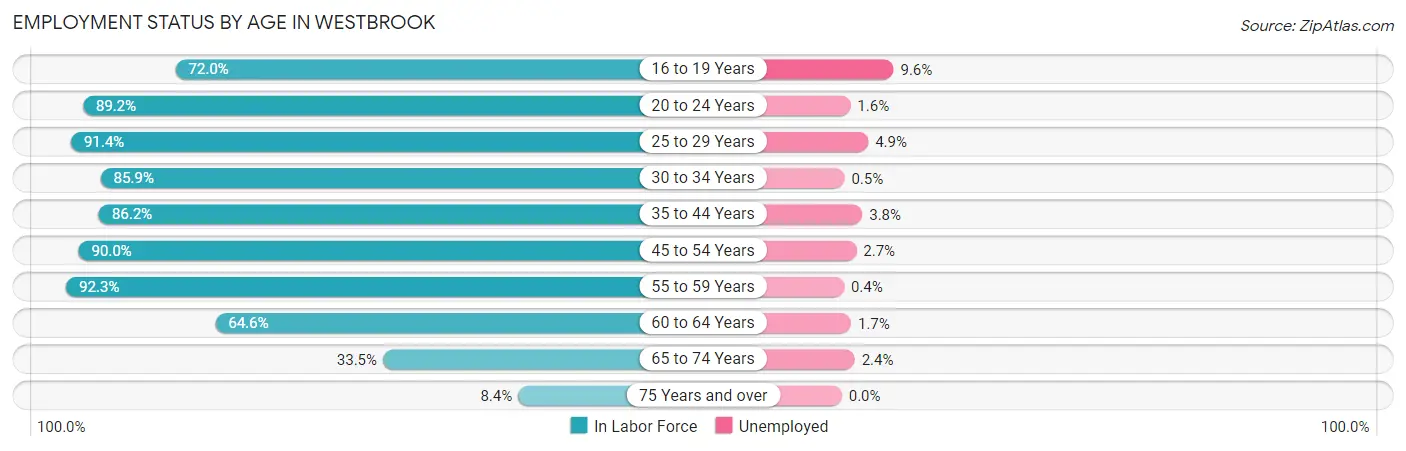
| Age Bracket | In Labor Force | Unemployed |
| 16 to 19 Years | 665 (72.0%) | 64 (9.6%) |
| 20 to 24 Years | 1,052 (89.2%) | 17 (1.6%) |
| 25 to 29 Years | 1,910 (91.4%) | 94 (4.9%) |
| 30 to 34 Years | 1,723 (85.9%) | 9 (0.5%) |
| 35 to 44 Years | 2,369 (86.2%) | 90 (3.8%) |
| 45 to 54 Years | 2,062 (90.0%) | 56 (2.7%) |
| 55 to 59 Years | 1,320 (92.3%) | 5 (0.4%) |
| 60 to 64 Years | 806 (64.6%) | 14 (1.7%) |
| 65 to 74 Years | 700 (33.5%) | 17 (2.4%) |
| 75 Years and over | 128 (8.4%) | 0 (0.0%) |
| Total | 12,728 (72.6%) | 369 (2.9%) |
Employment Status by Educational Attainment in Westbrook
According to labor force statistics for Westbrook, 86.3% of individuals (10,194) out of the total population between 25 and 64 years of age (11,812) are in the labor force, with 2.6% or 265 of them being unemployed. The group with the highest labor force participation rate are those with the educational attainment of bachelor's degree or higher, with 92.1% or 4,710 individuals in the labor force. Within the labor force, individuals with high school diploma education have the highest percentage of unemployment, with 7.0% or 155 of them being unemployed.
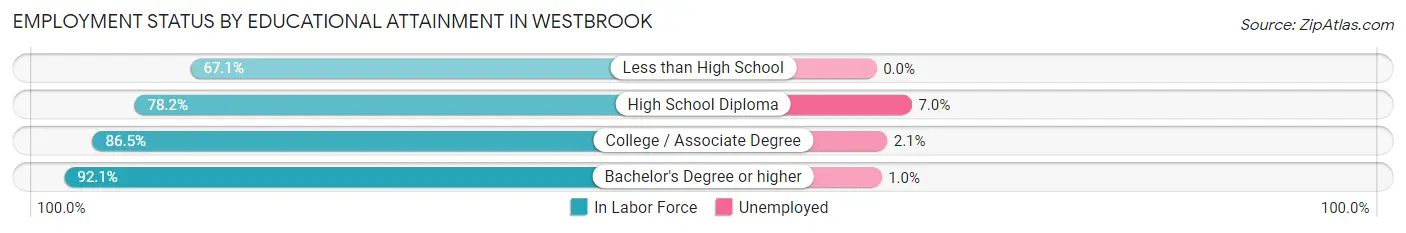
| Educational Attainment | In Labor Force | Unemployed |
| Less than High School | 278 (67.1%) | 0 (0.0%) |
| High School Diploma | 2,218 (78.2%) | 199 (7.0%) |
| College / Associate Degree | 2,983 (86.5%) | 72 (2.1%) |
| Bachelor's Degree or higher | 4,710 (92.1%) | 51 (1.0%) |
| Total | 10,194 (86.3%) | 307 (2.6%) |
Employment Occupations by Sex in Westbrook
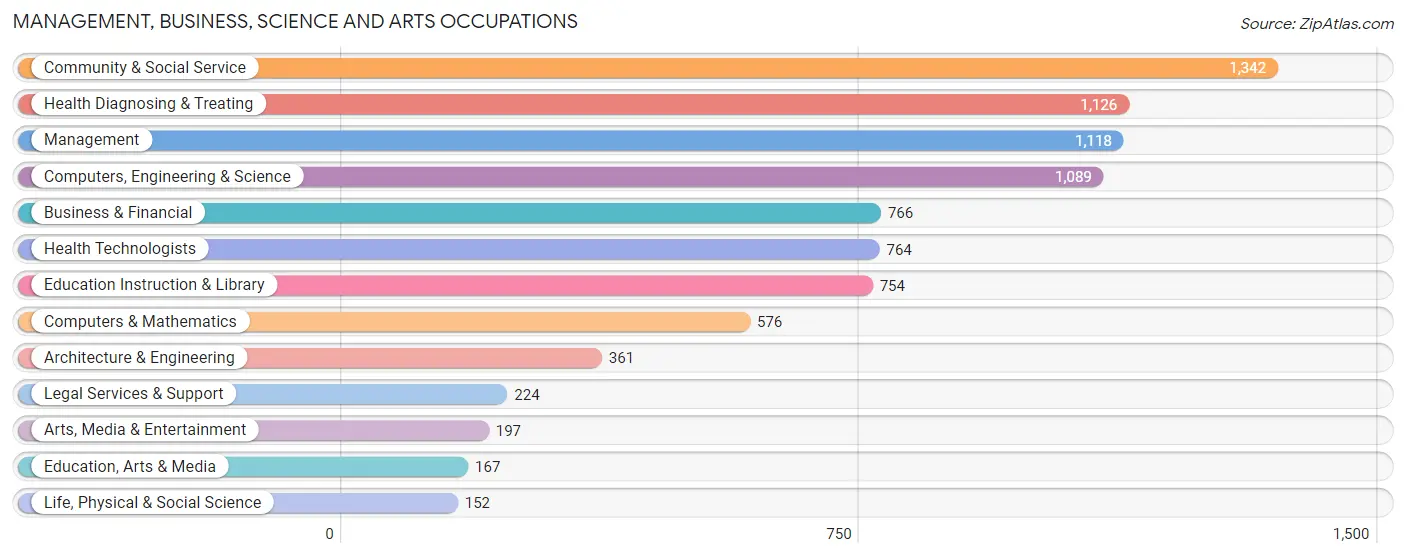
Management, Business, Science and Arts Occupations
The most common Management, Business, Science and Arts occupations in Westbrook are Community & Social Service (1,342 | 10.8%), Health Diagnosing & Treating (1,126 | 9.1%), Management (1,118 | 9.0%), Computers, Engineering & Science (1,089 | 8.8%), and Business & Financial (766 | 6.2%).
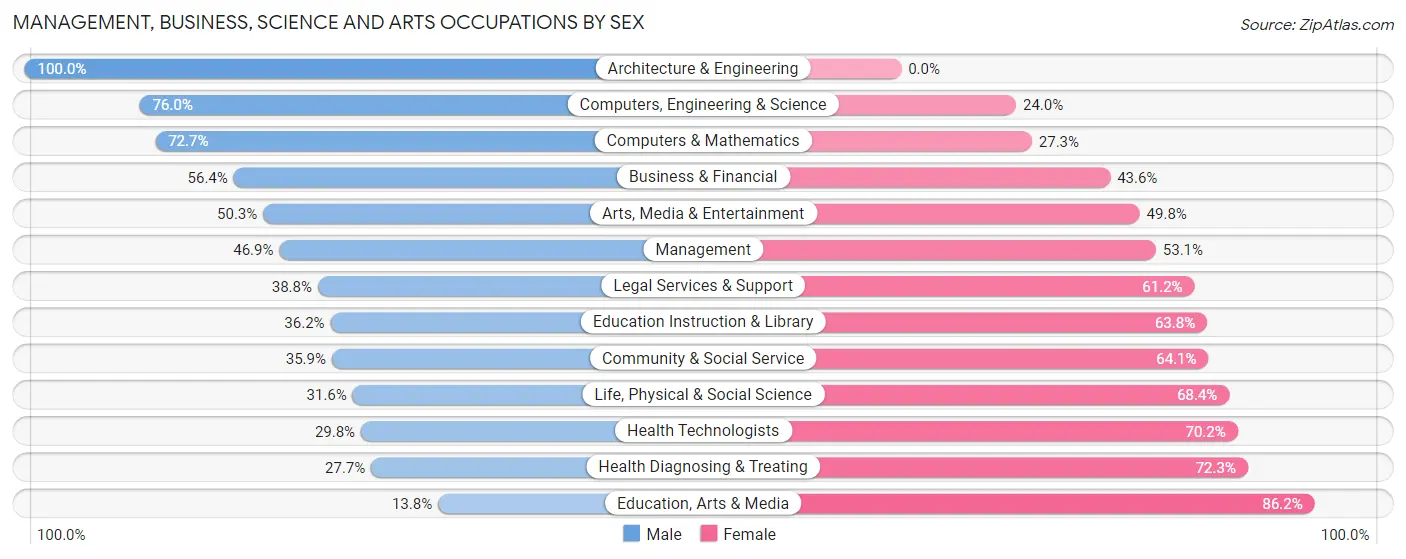
Management, Business, Science and Arts Occupations by Sex
Within the Management, Business, Science and Arts occupations in Westbrook, the most male-oriented occupations are Architecture & Engineering (100.0%), Computers, Engineering & Science (76.0%), and Computers & Mathematics (72.7%), while the most female-oriented occupations are Education, Arts & Media (86.2%), Health Diagnosing & Treating (72.3%), and Health Technologists (70.2%).
| Occupation | Male | Female |
| Management | 524 (46.9%) | 594 (53.1%) |
| Business & Financial | 432 (56.4%) | 334 (43.6%) |
| Computers, Engineering & Science | 828 (76.0%) | 261 (24.0%) |
| Computers & Mathematics | 419 (72.7%) | 157 (27.3%) |
| Architecture & Engineering | 361 (100.0%) | 0 (0.0%) |
| Life, Physical & Social Science | 48 (31.6%) | 104 (68.4%) |
| Community & Social Service | 482 (35.9%) | 860 (64.1%) |
| Education, Arts & Media | 23 (13.8%) | 144 (86.2%) |
| Legal Services & Support | 87 (38.8%) | 137 (61.2%) |
| Education Instruction & Library | 273 (36.2%) | 481 (63.8%) |
| Arts, Media & Entertainment | 99 (50.2%) | 98 (49.7%) |
| Health Diagnosing & Treating | 312 (27.7%) | 814 (72.3%) |
| Health Technologists | 228 (29.8%) | 536 (70.2%) |
| Total (Category) | 2,578 (47.4%) | 2,863 (52.6%) |
| Total (Overall) | 6,346 (51.3%) | 6,025 (48.7%) |
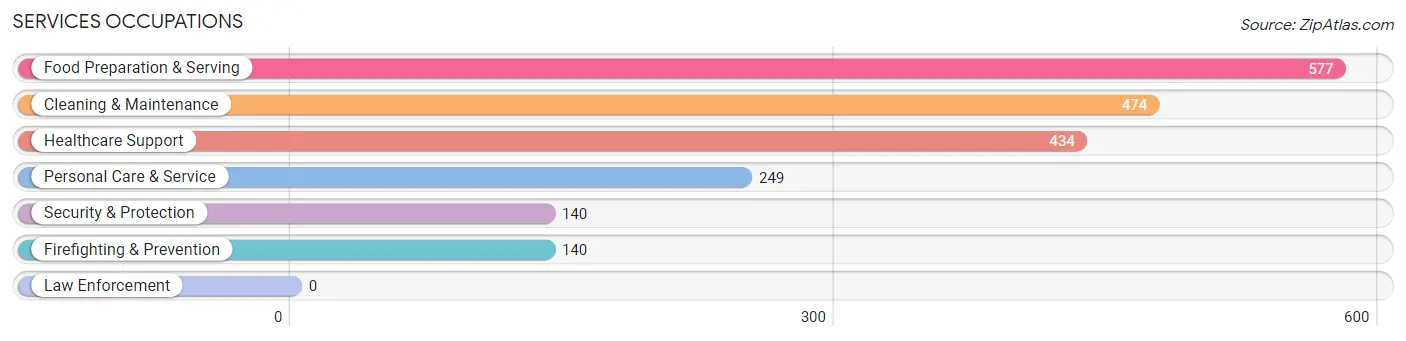
Services Occupations
The most common Services occupations in Westbrook are Food Preparation & Serving (577 | 4.7%), Cleaning & Maintenance (474 | 3.8%), Healthcare Support (434 | 3.5%), Personal Care & Service (249 | 2.0%), and Security & Protection (140 | 1.1%).
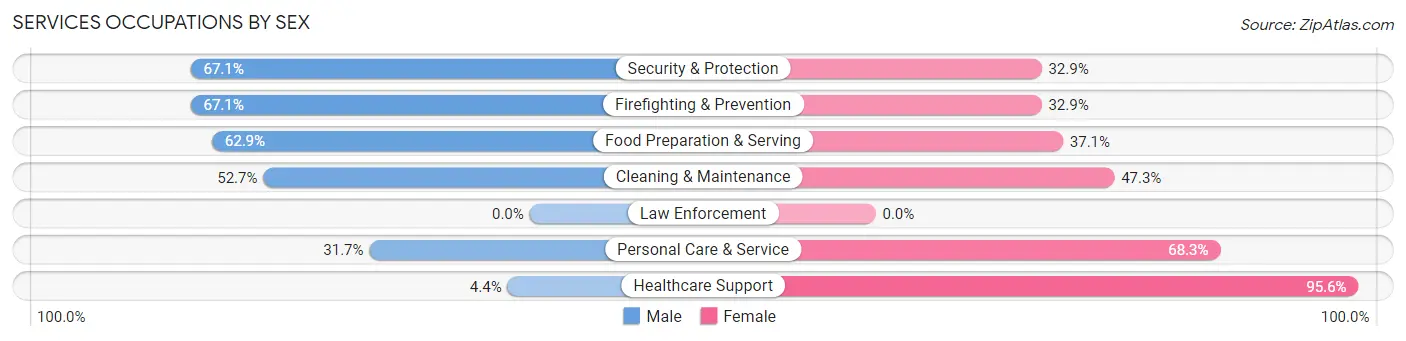
Services Occupations by Sex
Within the Services occupations in Westbrook, the most male-oriented occupations are Security & Protection (67.1%), Firefighting & Prevention (67.1%), and Food Preparation & Serving (62.9%), while the most female-oriented occupations are Healthcare Support (95.6%), Personal Care & Service (68.3%), and Cleaning & Maintenance (47.3%).
| Occupation | Male | Female |
| Healthcare Support | 19 (4.4%) | 415 (95.6%) |
| Security & Protection | 94 (67.1%) | 46 (32.9%) |
| Firefighting & Prevention | 94 (67.1%) | 46 (32.9%) |
| Law Enforcement | 0 (0.0%) | 0 (0.0%) |
| Food Preparation & Serving | 363 (62.9%) | 214 (37.1%) |
| Cleaning & Maintenance | 250 (52.7%) | 224 (47.3%) |
| Personal Care & Service | 79 (31.7%) | 170 (68.3%) |
| Total (Category) | 805 (43.0%) | 1,069 (57.0%) |
| Total (Overall) | 6,346 (51.3%) | 6,025 (48.7%) |
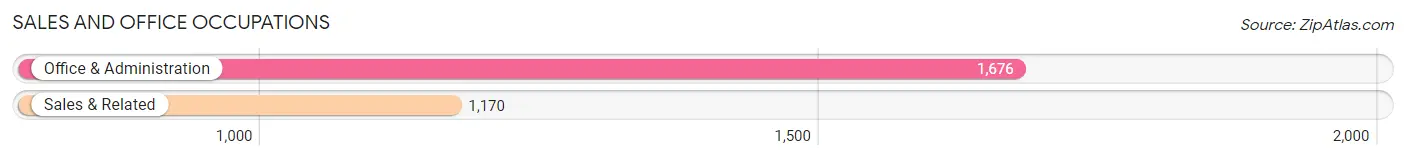
Sales and Office Occupations
The most common Sales and Office occupations in Westbrook are Office & Administration (1,676 | 13.6%), and Sales & Related (1,170 | 9.5%).
Sales and Office Occupations by Sex
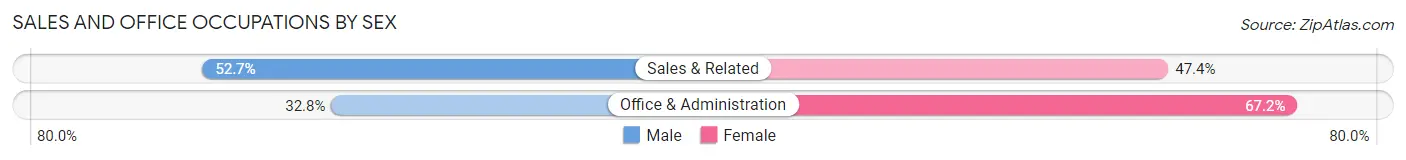
| Occupation | Male | Female |
| Sales & Related | 616 (52.6%) | 554 (47.3%) |
| Office & Administration | 550 (32.8%) | 1,126 (67.2%) |
| Total (Category) | 1,166 (41.0%) | 1,680 (59.0%) |
| Total (Overall) | 6,346 (51.3%) | 6,025 (48.7%) |
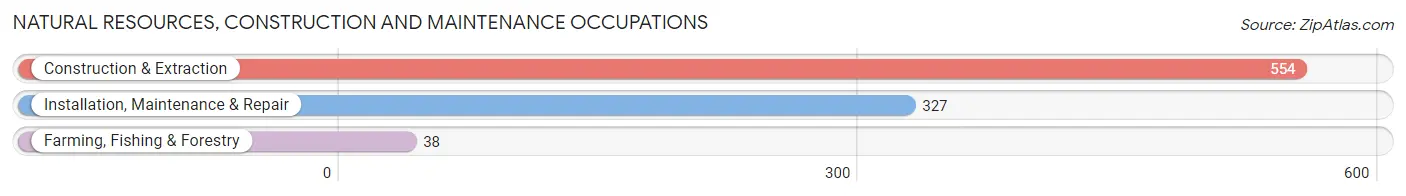
Natural Resources, Construction and Maintenance Occupations
The most common Natural Resources, Construction and Maintenance occupations in Westbrook are Construction & Extraction (554 | 4.5%), Installation, Maintenance & Repair (327 | 2.6%), and Farming, Fishing & Forestry (38 | 0.3%).
Natural Resources, Construction and Maintenance Occupations by Sex
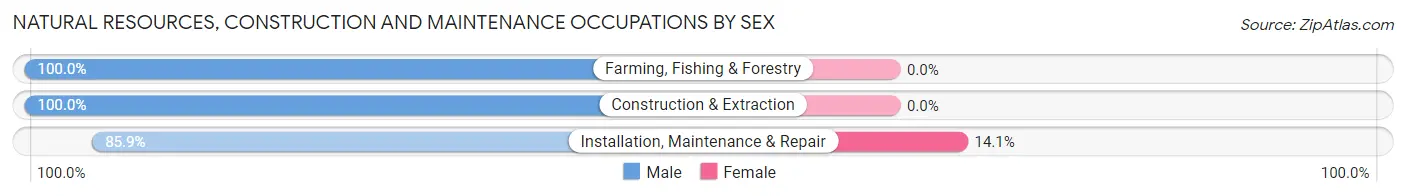
| Occupation | Male | Female |
| Farming, Fishing & Forestry | 38 (100.0%) | 0 (0.0%) |
| Construction & Extraction | 554 (100.0%) | 0 (0.0%) |
| Installation, Maintenance & Repair | 281 (85.9%) | 46 (14.1%) |
| Total (Category) | 873 (95.0%) | 46 (5.0%) |
| Total (Overall) | 6,346 (51.3%) | 6,025 (48.7%) |
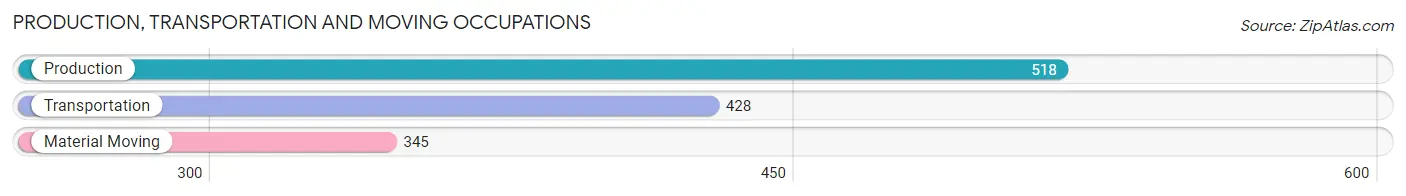
Production, Transportation and Moving Occupations
The most common Production, Transportation and Moving occupations in Westbrook are Production (518 | 4.2%), Transportation (428 | 3.5%), and Material Moving (345 | 2.8%).
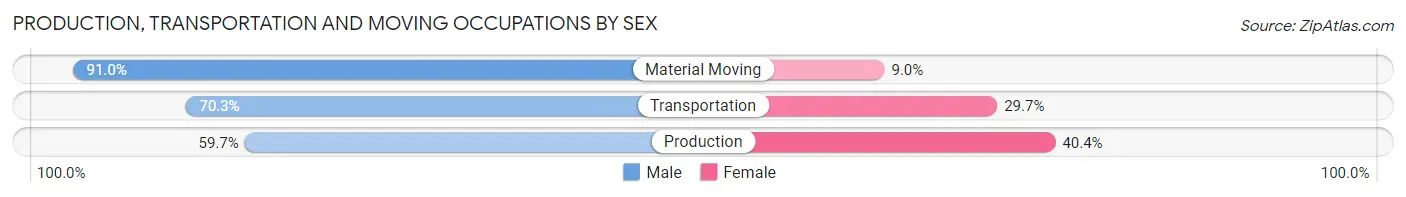
Production, Transportation and Moving Occupations by Sex
| Occupation | Male | Female |
| Production | 309 (59.7%) | 209 (40.4%) |
| Transportation | 301 (70.3%) | 127 (29.7%) |
| Material Moving | 314 (91.0%) | 31 (9.0%) |
| Total (Category) | 924 (71.6%) | 367 (28.4%) |
| Total (Overall) | 6,346 (51.3%) | 6,025 (48.7%) |
Employment Industries by Sex in Westbrook
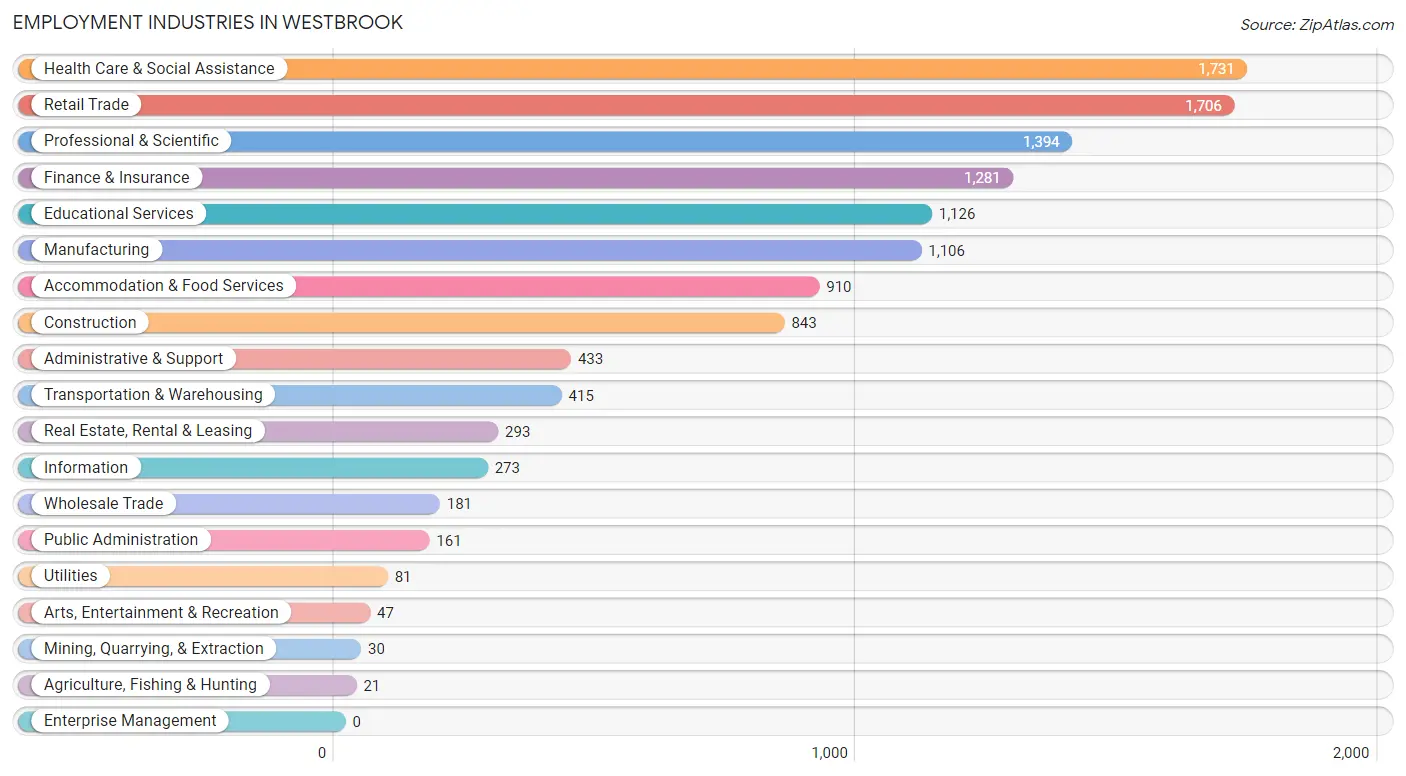
Employment Industries in Westbrook
The major employment industries in Westbrook include Health Care & Social Assistance (1,731 | 14.0%), Retail Trade (1,706 | 13.8%), Professional & Scientific (1,394 | 11.3%), Finance & Insurance (1,281 | 10.3%), and Educational Services (1,126 | 9.1%).
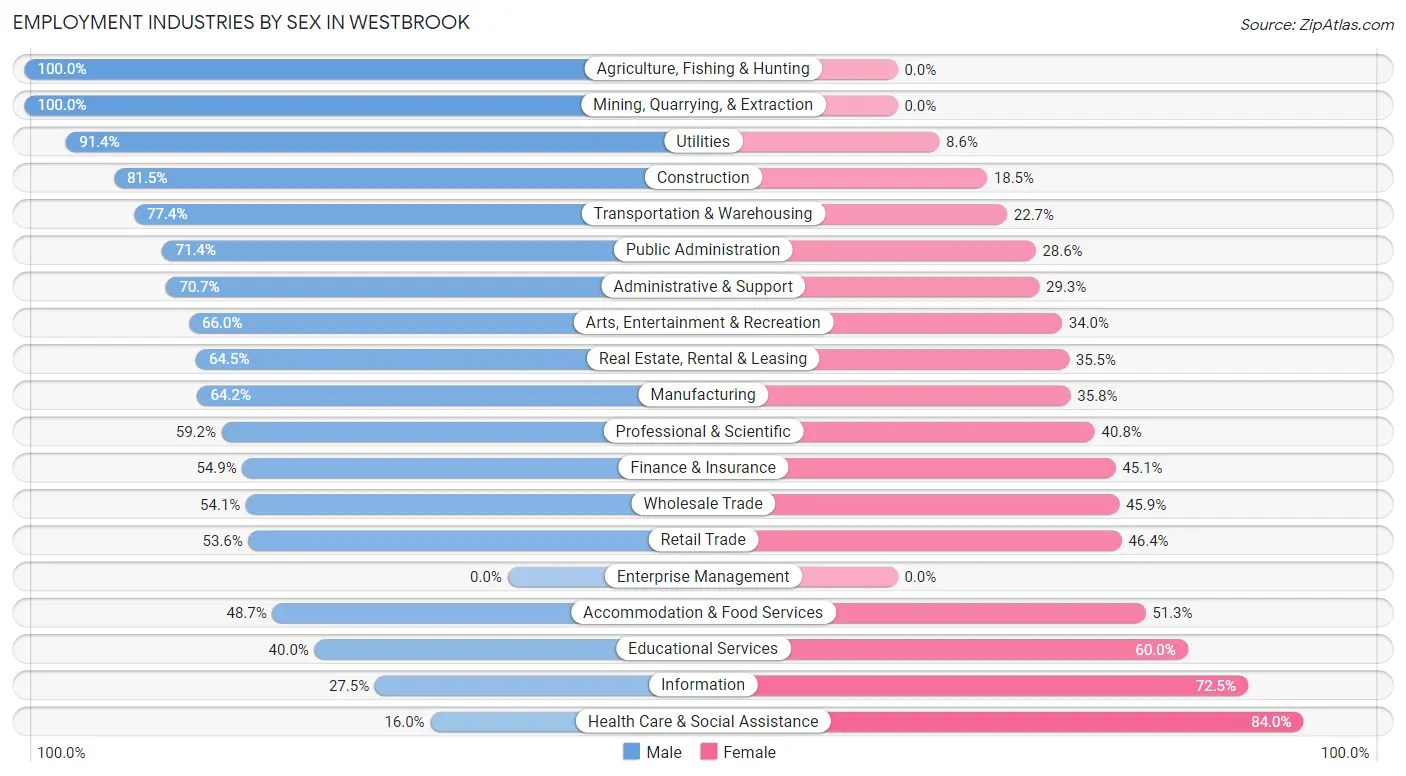
Employment Industries by Sex in Westbrook
The Westbrook industries that see more men than women are Agriculture, Fishing & Hunting (100.0%), Mining, Quarrying, & Extraction (100.0%), and Utilities (91.4%), whereas the industries that tend to have a higher number of women are Health Care & Social Assistance (84.0%), Information (72.5%), and Educational Services (60.0%).
| Industry | Male | Female |
| Agriculture, Fishing & Hunting | 21 (100.0%) | 0 (0.0%) |
| Mining, Quarrying, & Extraction | 30 (100.0%) | 0 (0.0%) |
| Construction | 687 (81.5%) | 156 (18.5%) |
| Manufacturing | 710 (64.2%) | 396 (35.8%) |
| Wholesale Trade | 98 (54.1%) | 83 (45.9%) |
| Retail Trade | 915 (53.6%) | 791 (46.4%) |
| Transportation & Warehousing | 321 (77.3%) | 94 (22.7%) |
| Utilities | 74 (91.4%) | 7 (8.6%) |
| Information | 75 (27.5%) | 198 (72.5%) |
| Finance & Insurance | 703 (54.9%) | 578 (45.1%) |
| Real Estate, Rental & Leasing | 189 (64.5%) | 104 (35.5%) |
| Professional & Scientific | 825 (59.2%) | 569 (40.8%) |
| Enterprise Management | 0 (0.0%) | 0 (0.0%) |
| Administrative & Support | 306 (70.7%) | 127 (29.3%) |
| Educational Services | 450 (40.0%) | 676 (60.0%) |
| Health Care & Social Assistance | 277 (16.0%) | 1,454 (84.0%) |
| Arts, Entertainment & Recreation | 31 (66.0%) | 16 (34.0%) |
| Accommodation & Food Services | 443 (48.7%) | 467 (51.3%) |
| Public Administration | 115 (71.4%) | 46 (28.6%) |
| Total | 6,346 (51.3%) | 6,025 (48.7%) |
Education in Westbrook
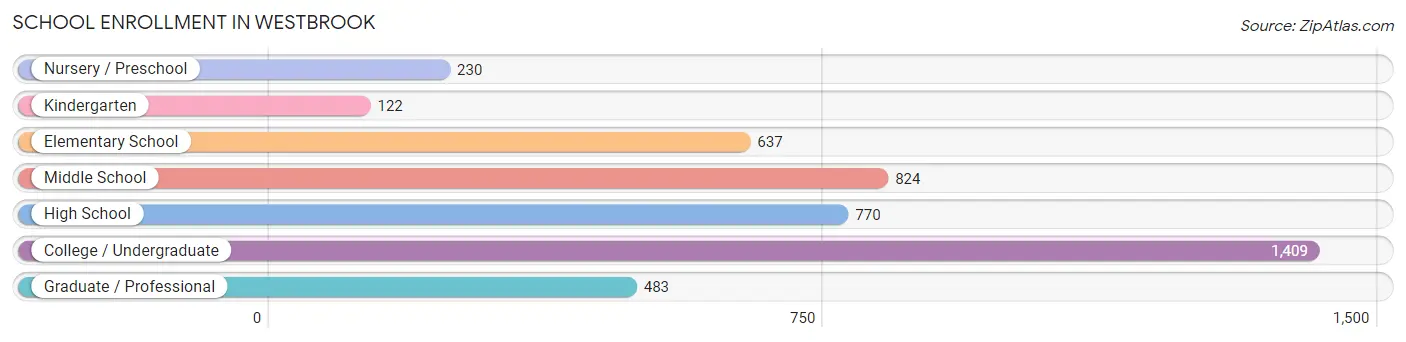
School Enrollment in Westbrook
The most common levels of schooling among the 4,475 students in Westbrook are college / undergraduate (1,409 | 31.5%), middle school (824 | 18.4%), and high school (770 | 17.2%).
| School Level | # Students | % Students |
| Nursery / Preschool | 230 | 5.1% |
| Kindergarten | 122 | 2.7% |
| Elementary School | 637 | 14.2% |
| Middle School | 824 | 18.4% |
| High School | 770 | 17.2% |
| College / Undergraduate | 1,409 | 31.5% |
| Graduate / Professional | 483 | 10.8% |
| Total | 4,475 | 100.0% |
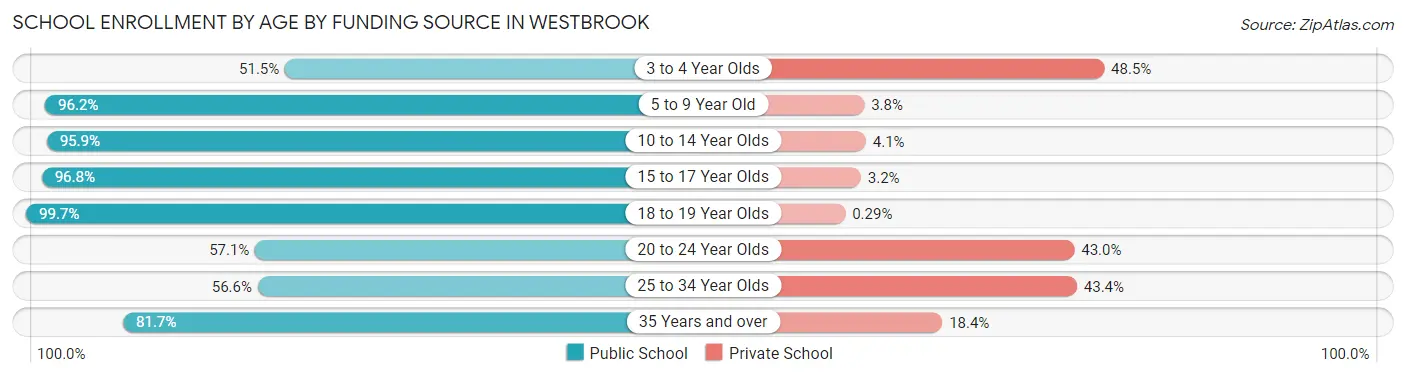
School Enrollment by Age by Funding Source in Westbrook
Out of a total of 4,475 students who are enrolled in schools in Westbrook, 801 (17.9%) attend a private institution, while the remaining 3,674 (82.1%) are enrolled in public schools. The age group of 3 to 4 year olds has the highest likelihood of being enrolled in private schools, with 82 (48.5% in the age bracket) enrolled. Conversely, the age group of 18 to 19 year olds has the lowest likelihood of being enrolled in a private school, with 345 (99.7% in the age bracket) attending a public institution.
| Age Bracket | Public School | Private School |
| 3 to 4 Year Olds | 87 (51.5%) | 82 (48.5%) |
| 5 to 9 Year Old | 803 (96.2%) | 32 (3.8%) |
| 10 to 14 Year Olds | 790 (95.9%) | 34 (4.1%) |
| 15 to 17 Year Olds | 605 (96.8%) | 20 (3.2%) |
| 18 to 19 Year Olds | 345 (99.7%) | 1 (0.3%) |
| 20 to 24 Year Olds | 429 (57.1%) | 323 (42.9%) |
| 25 to 34 Year Olds | 310 (56.6%) | 238 (43.4%) |
| 35 Years and over | 307 (81.7%) | 69 (18.3%) |
| Total | 3,674 (82.1%) | 801 (17.9%) |
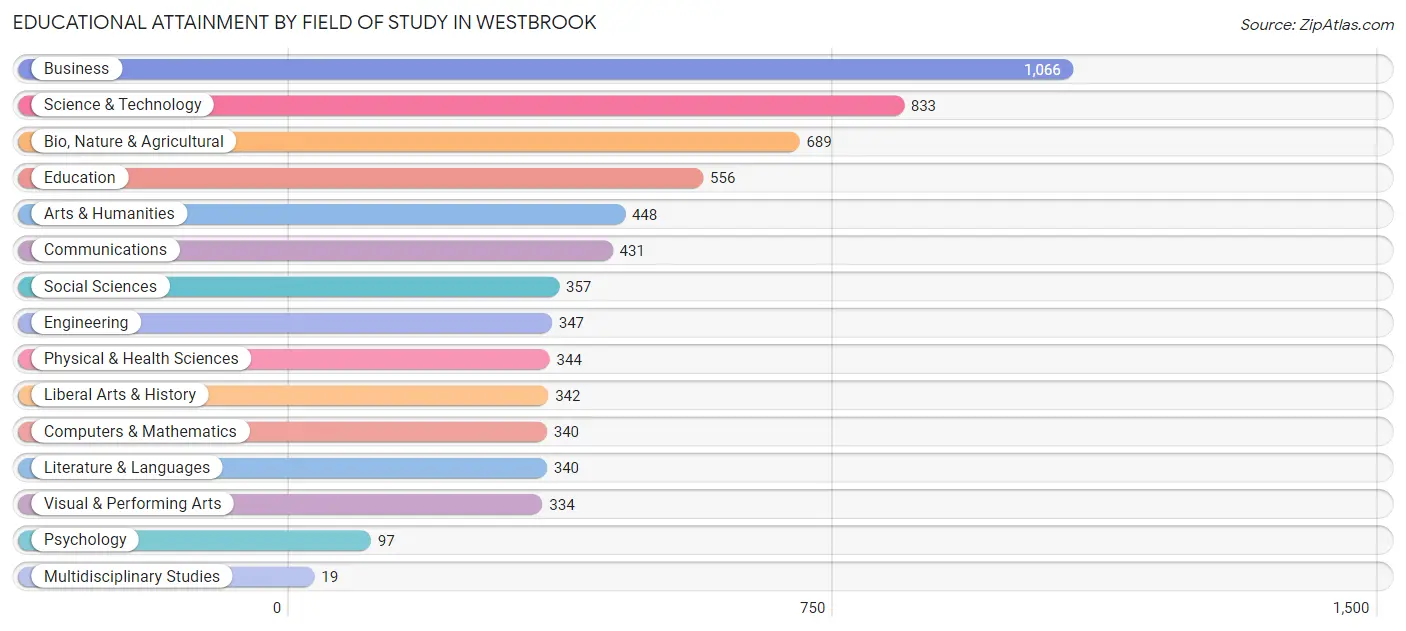
Educational Attainment by Field of Study in Westbrook
Business (1,066 | 16.3%), science & technology (833 | 12.7%), bio, nature & agricultural (689 | 10.5%), education (556 | 8.5%), and arts & humanities (448 | 6.9%) are the most common fields of study among 6,543 individuals in Westbrook who have obtained a bachelor's degree or higher.
| Field of Study | # Graduates | % Graduates |
| Computers & Mathematics | 340 | 5.2% |
| Bio, Nature & Agricultural | 689 | 10.5% |
| Physical & Health Sciences | 344 | 5.3% |
| Psychology | 97 | 1.5% |
| Social Sciences | 357 | 5.5% |
| Engineering | 347 | 5.3% |
| Multidisciplinary Studies | 19 | 0.3% |
| Science & Technology | 833 | 12.7% |
| Business | 1,066 | 16.3% |
| Education | 556 | 8.5% |
| Literature & Languages | 340 | 5.2% |
| Liberal Arts & History | 342 | 5.2% |
| Visual & Performing Arts | 334 | 5.1% |
| Communications | 431 | 6.6% |
| Arts & Humanities | 448 | 6.9% |
| Total | 6,543 | 100.0% |
Transportation & Commute in Westbrook
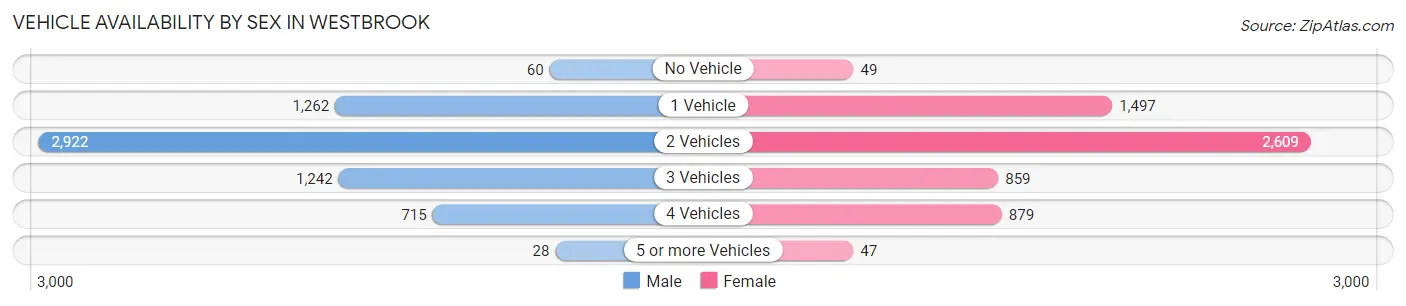
Vehicle Availability by Sex in Westbrook
The most prevalent vehicle ownership categories in Westbrook are males with 2 vehicles (2,922, accounting for 46.9%) and females with 2 vehicles (2,609, making up 49.2%).
| Vehicles Available | Male | Female |
| No Vehicle | 60 (1.0%) | 49 (0.8%) |
| 1 Vehicle | 1,262 (20.3%) | 1,497 (25.2%) |
| 2 Vehicles | 2,922 (46.9%) | 2,609 (43.9%) |
| 3 Vehicles | 1,242 (19.9%) | 859 (14.5%) |
| 4 Vehicles | 715 (11.5%) | 879 (14.8%) |
| 5 or more Vehicles | 28 (0.4%) | 47 (0.8%) |
| Total | 6,229 (100.0%) | 5,940 (100.0%) |
Commute Time in Westbrook
The most frequently occuring commute durations in Westbrook are 15 to 19 minutes (2,691 commuters, 26.3%), 20 to 24 minutes (2,252 commuters, 22.0%), and 5 to 9 minutes (1,412 commuters, 13.8%).
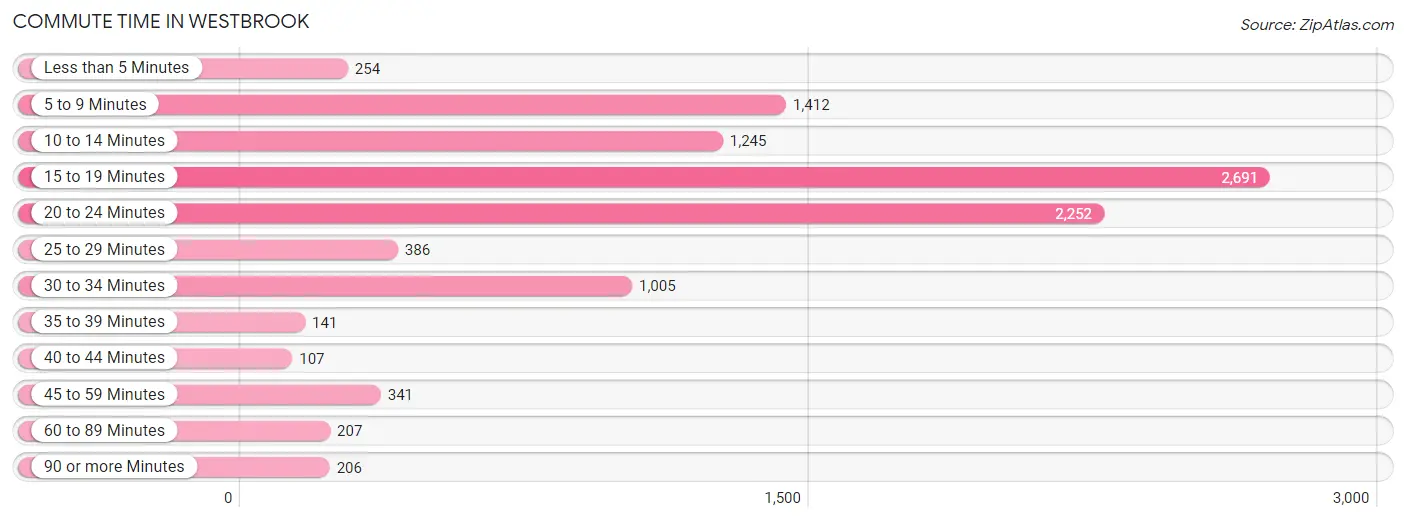
| Commute Time | # Commuters | % Commuters |
| Less than 5 Minutes | 254 | 2.5% |
| 5 to 9 Minutes | 1,412 | 13.8% |
| 10 to 14 Minutes | 1,245 | 12.1% |
| 15 to 19 Minutes | 2,691 | 26.3% |
| 20 to 24 Minutes | 2,252 | 22.0% |
| 25 to 29 Minutes | 386 | 3.8% |
| 30 to 34 Minutes | 1,005 | 9.8% |
| 35 to 39 Minutes | 141 | 1.4% |
| 40 to 44 Minutes | 107 | 1.0% |
| 45 to 59 Minutes | 341 | 3.3% |
| 60 to 89 Minutes | 207 | 2.0% |
| 90 or more Minutes | 206 | 2.0% |
Commute Time by Sex in Westbrook
The most common commute times in Westbrook are 15 to 19 minutes (1,443 commuters, 27.7%) for males and 15 to 19 minutes (1,248 commuters, 24.7%) for females.
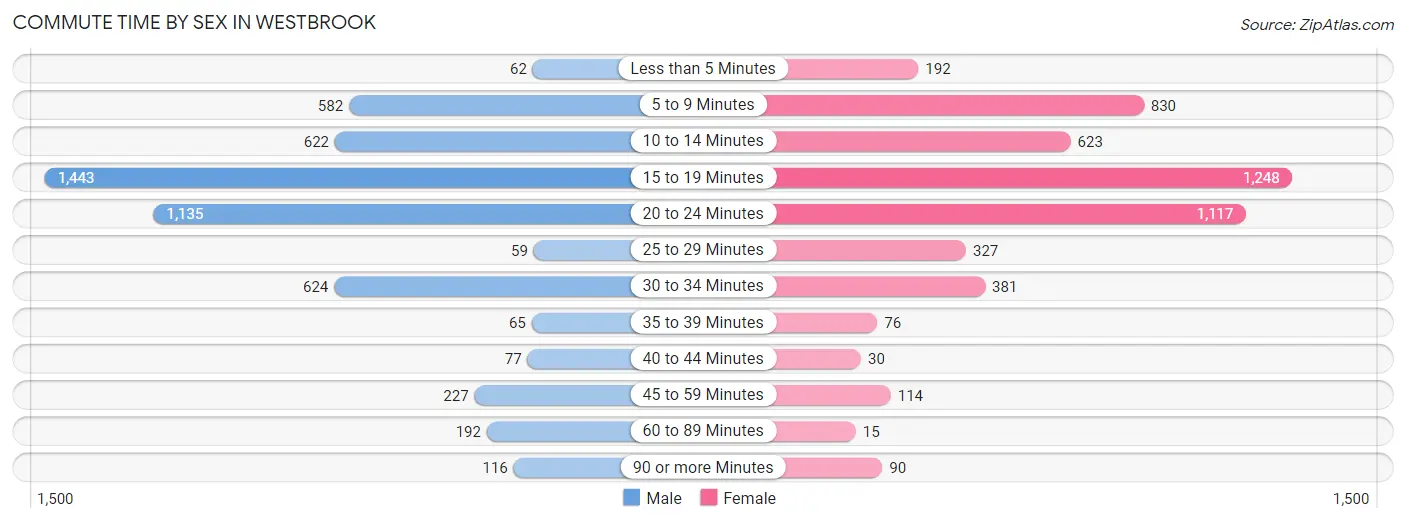
| Commute Time | Male | Female |
| Less than 5 Minutes | 62 (1.2%) | 192 (3.8%) |
| 5 to 9 Minutes | 582 (11.2%) | 830 (16.5%) |
| 10 to 14 Minutes | 622 (11.9%) | 623 (12.3%) |
| 15 to 19 Minutes | 1,443 (27.7%) | 1,248 (24.7%) |
| 20 to 24 Minutes | 1,135 (21.8%) | 1,117 (22.2%) |
| 25 to 29 Minutes | 59 (1.1%) | 327 (6.5%) |
| 30 to 34 Minutes | 624 (12.0%) | 381 (7.6%) |
| 35 to 39 Minutes | 65 (1.3%) | 76 (1.5%) |
| 40 to 44 Minutes | 77 (1.5%) | 30 (0.6%) |
| 45 to 59 Minutes | 227 (4.4%) | 114 (2.3%) |
| 60 to 89 Minutes | 192 (3.7%) | 15 (0.3%) |
| 90 or more Minutes | 116 (2.2%) | 90 (1.8%) |
Time of Departure to Work by Sex in Westbrook
The most frequent times of departure to work in Westbrook are 7:00 AM to 7:29 AM (725, 13.9%) for males and 7:30 AM to 7:59 AM (1,013, 20.1%) for females.
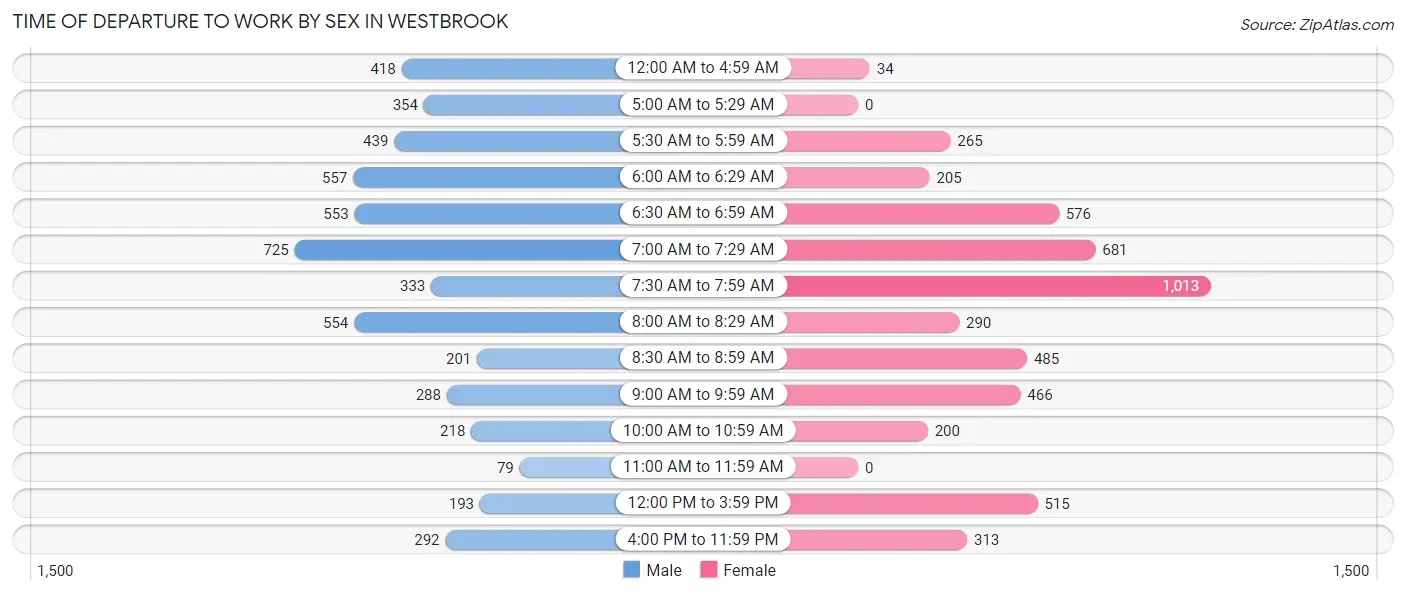
| Time of Departure | Male | Female |
| 12:00 AM to 4:59 AM | 418 (8.0%) | 34 (0.7%) |
| 5:00 AM to 5:29 AM | 354 (6.8%) | 0 (0.0%) |
| 5:30 AM to 5:59 AM | 439 (8.4%) | 265 (5.2%) |
| 6:00 AM to 6:29 AM | 557 (10.7%) | 205 (4.1%) |
| 6:30 AM to 6:59 AM | 553 (10.6%) | 576 (11.4%) |
| 7:00 AM to 7:29 AM | 725 (13.9%) | 681 (13.5%) |
| 7:30 AM to 7:59 AM | 333 (6.4%) | 1,013 (20.1%) |
| 8:00 AM to 8:29 AM | 554 (10.6%) | 290 (5.8%) |
| 8:30 AM to 8:59 AM | 201 (3.9%) | 485 (9.6%) |
| 9:00 AM to 9:59 AM | 288 (5.5%) | 466 (9.2%) |
| 10:00 AM to 10:59 AM | 218 (4.2%) | 200 (4.0%) |
| 11:00 AM to 11:59 AM | 79 (1.5%) | 0 (0.0%) |
| 12:00 PM to 3:59 PM | 193 (3.7%) | 515 (10.2%) |
| 4:00 PM to 11:59 PM | 292 (5.6%) | 313 (6.2%) |
| Total | 5,204 (100.0%) | 5,043 (100.0%) |
Housing Occupancy in Westbrook
Occupancy by Ownership in Westbrook
Of the total 8,910 dwellings in Westbrook, owner-occupied units account for 5,674 (63.7%), while renter-occupied units make up 3,236 (36.3%).
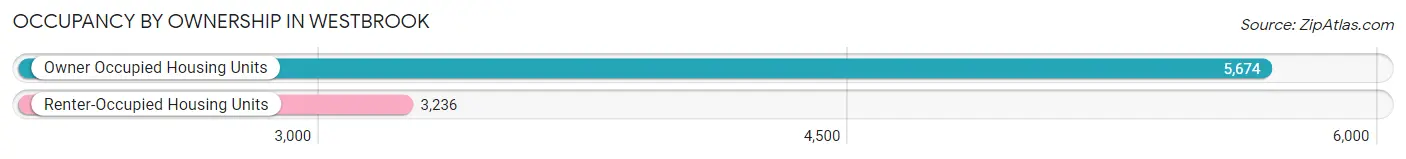
| Occupancy | # Housing Units | % Housing Units |
| Owner Occupied Housing Units | 5,674 | 63.7% |
| Renter-Occupied Housing Units | 3,236 | 36.3% |
| Total Occupied Housing Units | 8,910 | 100.0% |
Occupancy by Household Size in Westbrook
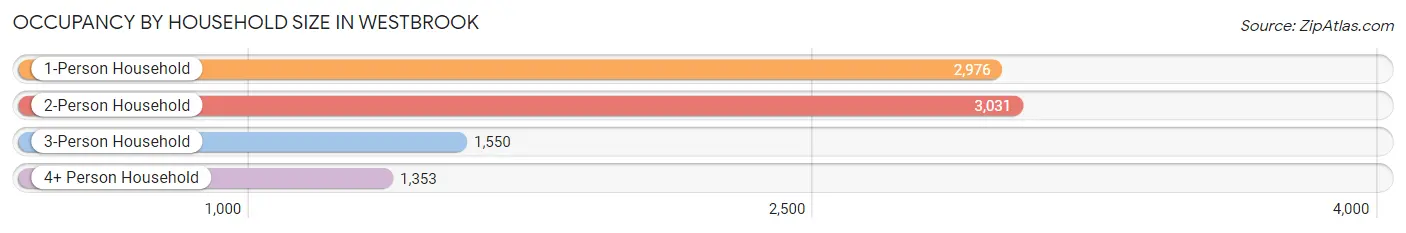
| Household Size | # Housing Units | % Housing Units |
| 1-Person Household | 2,976 | 33.4% |
| 2-Person Household | 3,031 | 34.0% |
| 3-Person Household | 1,550 | 17.4% |
| 4+ Person Household | 1,353 | 15.2% |
| Total Housing Units | 8,910 | 100.0% |
Occupancy by Ownership by Household Size in Westbrook
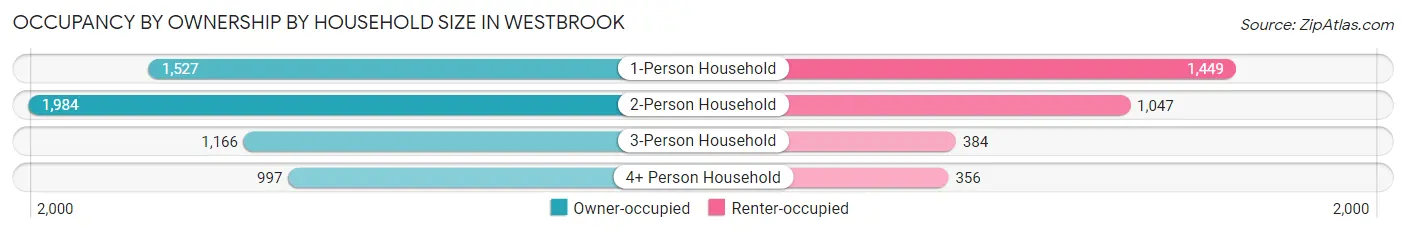
| Household Size | Owner-occupied | Renter-occupied |
| 1-Person Household | 1,527 (51.3%) | 1,449 (48.7%) |
| 2-Person Household | 1,984 (65.5%) | 1,047 (34.5%) |
| 3-Person Household | 1,166 (75.2%) | 384 (24.8%) |
| 4+ Person Household | 997 (73.7%) | 356 (26.3%) |
| Total Housing Units | 5,674 (63.7%) | 3,236 (36.3%) |
Occupancy by Educational Attainment in Westbrook
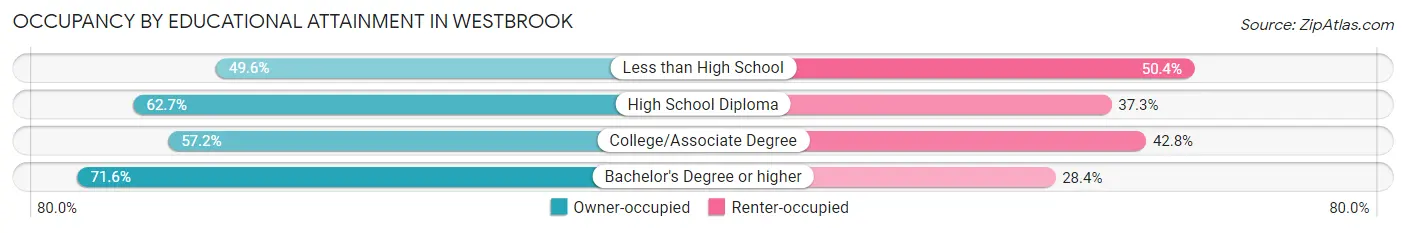
| Household Size | Owner-occupied | Renter-occupied |
| Less than High School | 203 (49.6%) | 206 (50.4%) |
| High School Diploma | 1,216 (62.7%) | 723 (37.3%) |
| College/Associate Degree | 1,762 (57.2%) | 1,318 (42.8%) |
| Bachelor's Degree or higher | 2,493 (71.6%) | 989 (28.4%) |
Occupancy by Age of Householder in Westbrook
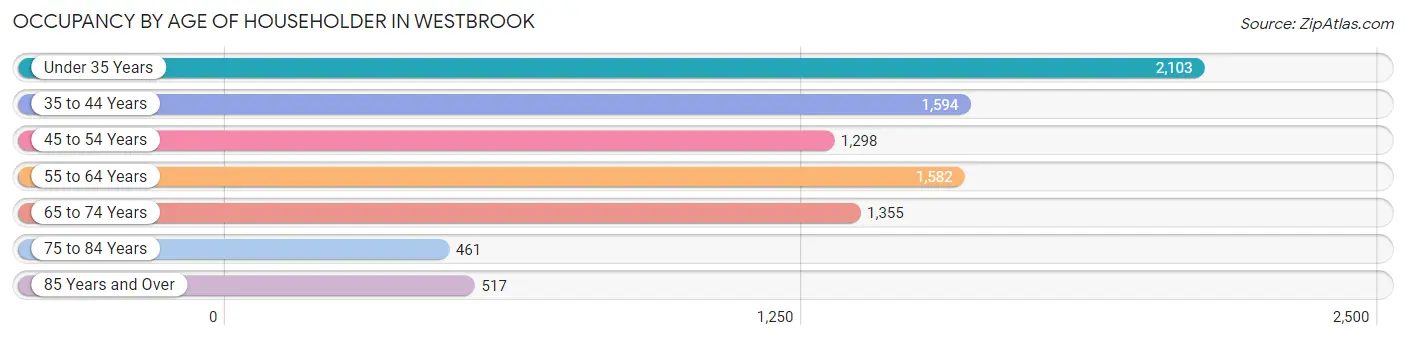
| Age Bracket | # Households | % Households |
| Under 35 Years | 2,103 | 23.6% |
| 35 to 44 Years | 1,594 | 17.9% |
| 45 to 54 Years | 1,298 | 14.6% |
| 55 to 64 Years | 1,582 | 17.8% |
| 65 to 74 Years | 1,355 | 15.2% |
| 75 to 84 Years | 461 | 5.2% |
| 85 Years and Over | 517 | 5.8% |
| Total | 8,910 | 100.0% |
Housing Finances in Westbrook
Median Income by Occupancy in Westbrook
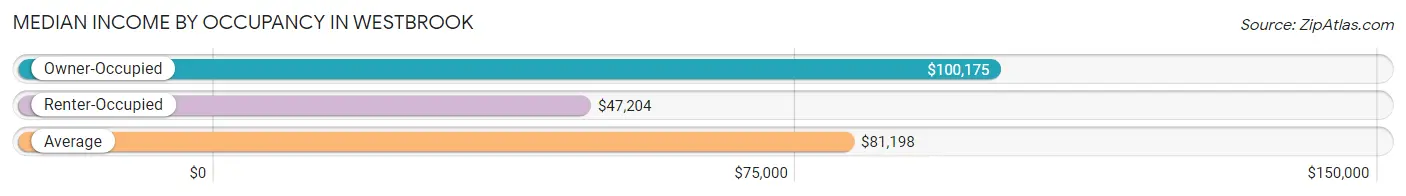
| Occupancy Type | # Households | Median Income |
| Owner-Occupied | 5,674 (63.7%) | $100,175 |
| Renter-Occupied | 3,236 (36.3%) | $47,204 |
| Average | 8,910 (100.0%) | $81,198 |
Occupancy by Householder Income Bracket in Westbrook
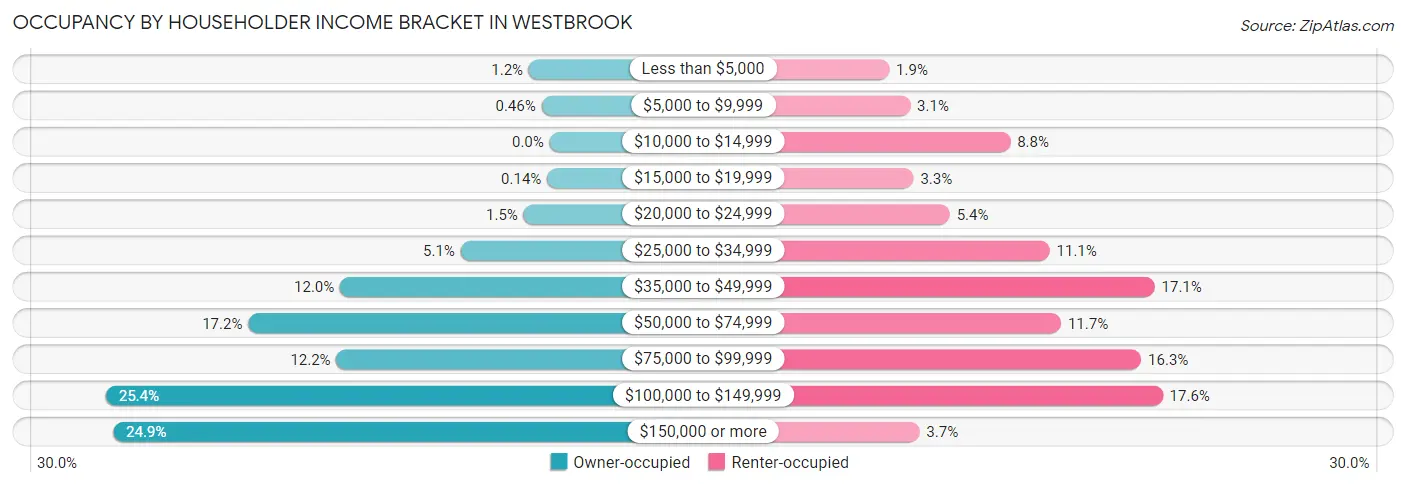
| Income Bracket | Owner-occupied | Renter-occupied |
| Less than $5,000 | 67 (1.2%) | 62 (1.9%) |
| $5,000 to $9,999 | 26 (0.5%) | 101 (3.1%) |
| $10,000 to $14,999 | 0 (0.0%) | 286 (8.8%) |
| $15,000 to $19,999 | 8 (0.1%) | 107 (3.3%) |
| $20,000 to $24,999 | 84 (1.5%) | 174 (5.4%) |
| $25,000 to $34,999 | 288 (5.1%) | 359 (11.1%) |
| $35,000 to $49,999 | 679 (12.0%) | 553 (17.1%) |
| $50,000 to $74,999 | 977 (17.2%) | 380 (11.7%) |
| $75,000 to $99,999 | 691 (12.2%) | 528 (16.3%) |
| $100,000 to $149,999 | 1,439 (25.4%) | 568 (17.5%) |
| $150,000 or more | 1,415 (24.9%) | 118 (3.6%) |
| Total | 5,674 (100.0%) | 3,236 (100.0%) |
Monthly Housing Cost Tiers in Westbrook
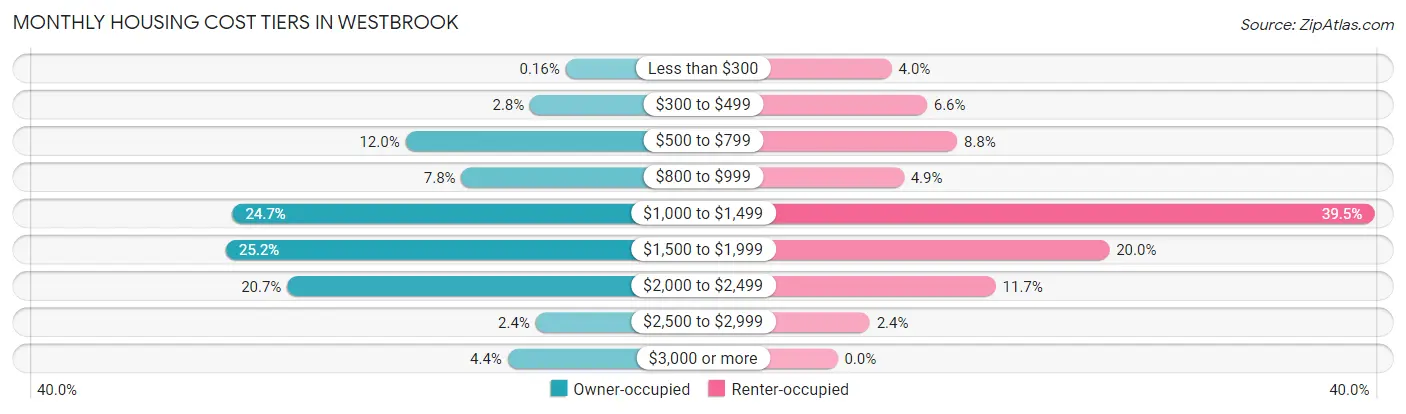
| Monthly Cost | Owner-occupied | Renter-occupied |
| Less than $300 | 9 (0.2%) | 129 (4.0%) |
| $300 to $499 | 157 (2.8%) | 213 (6.6%) |
| $500 to $799 | 678 (11.9%) | 285 (8.8%) |
| $800 to $999 | 444 (7.8%) | 158 (4.9%) |
| $1,000 to $1,499 | 1,401 (24.7%) | 1,279 (39.5%) |
| $1,500 to $1,999 | 1,428 (25.2%) | 648 (20.0%) |
| $2,000 to $2,499 | 1,172 (20.7%) | 377 (11.7%) |
| $2,500 to $2,999 | 134 (2.4%) | 77 (2.4%) |
| $3,000 or more | 251 (4.4%) | 0 (0.0%) |
| Total | 5,674 (100.0%) | 3,236 (100.0%) |
Physical Housing Characteristics in Westbrook
Housing Structures in Westbrook
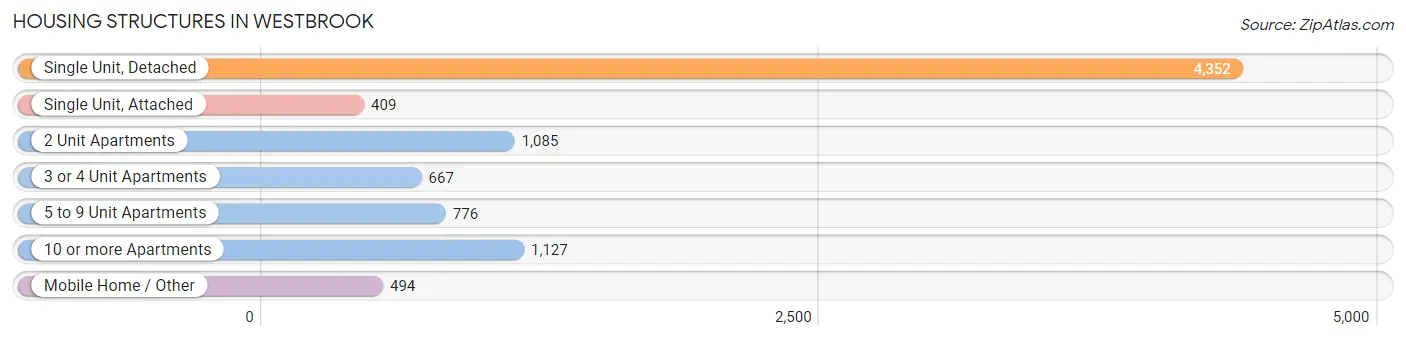
| Structure Type | # Housing Units | % Housing Units |
| Single Unit, Detached | 4,352 | 48.8% |
| Single Unit, Attached | 409 | 4.6% |
| 2 Unit Apartments | 1,085 | 12.2% |
| 3 or 4 Unit Apartments | 667 | 7.5% |
| 5 to 9 Unit Apartments | 776 | 8.7% |
| 10 or more Apartments | 1,127 | 12.7% |
| Mobile Home / Other | 494 | 5.5% |
| Total | 8,910 | 100.0% |
Housing Structures by Occupancy in Westbrook
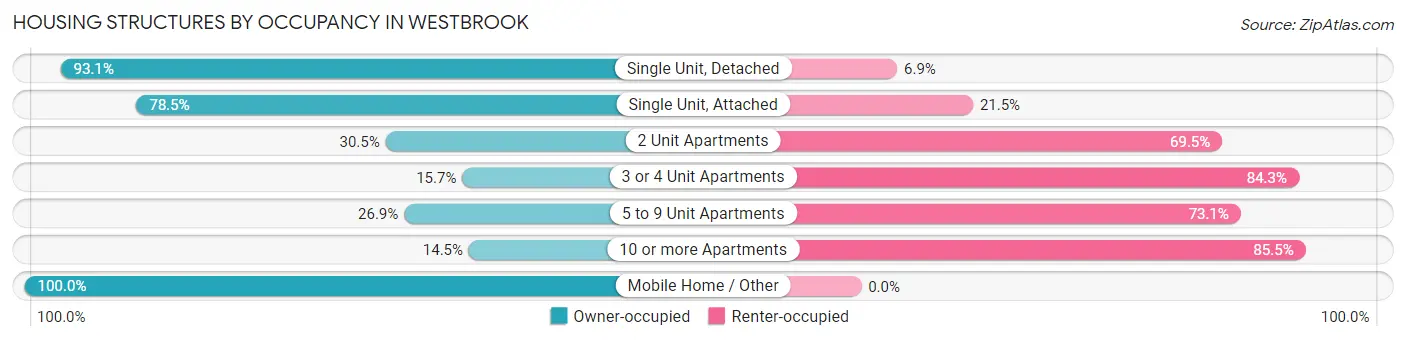
| Structure Type | Owner-occupied | Renter-occupied |
| Single Unit, Detached | 4,051 (93.1%) | 301 (6.9%) |
| Single Unit, Attached | 321 (78.5%) | 88 (21.5%) |
| 2 Unit Apartments | 331 (30.5%) | 754 (69.5%) |
| 3 or 4 Unit Apartments | 105 (15.7%) | 562 (84.3%) |
| 5 to 9 Unit Apartments | 209 (26.9%) | 567 (73.1%) |
| 10 or more Apartments | 163 (14.5%) | 964 (85.5%) |
| Mobile Home / Other | 494 (100.0%) | 0 (0.0%) |
| Total | 5,674 (63.7%) | 3,236 (36.3%) |
Housing Structures by Number of Rooms in Westbrook
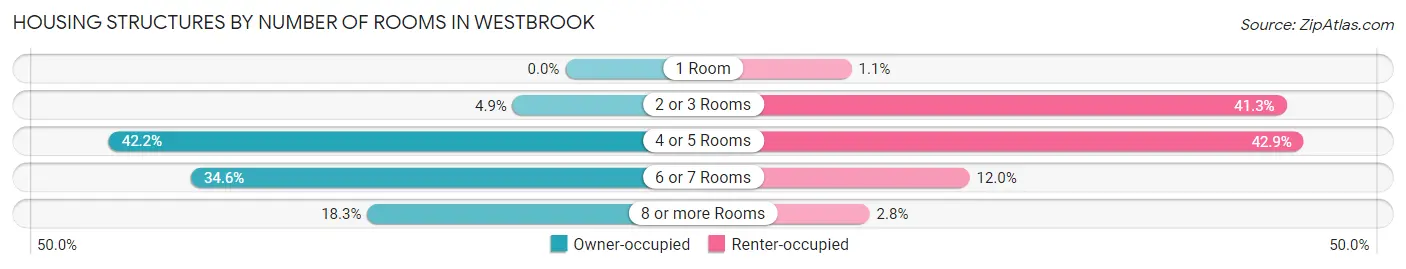
| Number of Rooms | Owner-occupied | Renter-occupied |
| 1 Room | 0 (0.0%) | 35 (1.1%) |
| 2 or 3 Rooms | 276 (4.9%) | 1,336 (41.3%) |
| 4 or 5 Rooms | 2,395 (42.2%) | 1,388 (42.9%) |
| 6 or 7 Rooms | 1,964 (34.6%) | 388 (12.0%) |
| 8 or more Rooms | 1,039 (18.3%) | 89 (2.8%) |
| Total | 5,674 (100.0%) | 3,236 (100.0%) |
Housing Structure by Heating Type in Westbrook
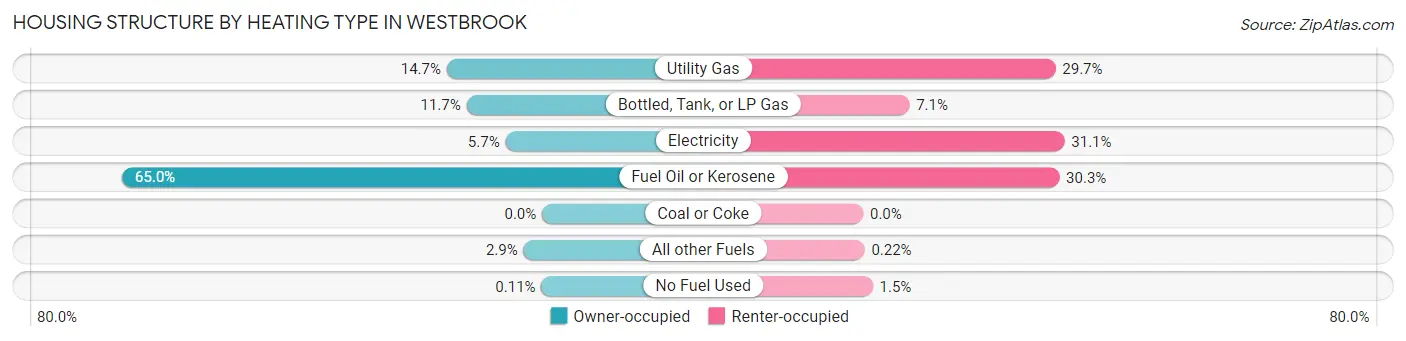
| Heating Type | Owner-occupied | Renter-occupied |
| Utility Gas | 836 (14.7%) | 962 (29.7%) |
| Bottled, Tank, or LP Gas | 663 (11.7%) | 231 (7.1%) |
| Electricity | 321 (5.7%) | 1,007 (31.1%) |
| Fuel Oil or Kerosene | 3,685 (64.9%) | 981 (30.3%) |
| Coal or Coke | 0 (0.0%) | 0 (0.0%) |
| All other Fuels | 163 (2.9%) | 7 (0.2%) |
| No Fuel Used | 6 (0.1%) | 48 (1.5%) |
| Total | 5,674 (100.0%) | 3,236 (100.0%) |
Household Vehicle Usage in Westbrook
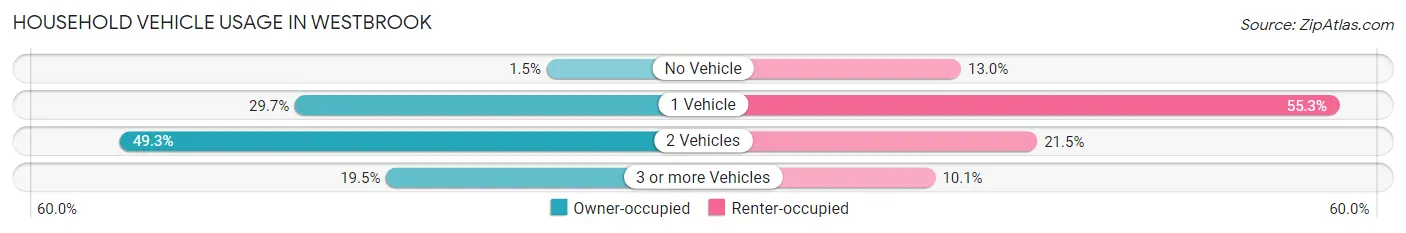
| Vehicles per Household | Owner-occupied | Renter-occupied |
| No Vehicle | 85 (1.5%) | 421 (13.0%) |
| 1 Vehicle | 1,685 (29.7%) | 1,790 (55.3%) |
| 2 Vehicles | 2,798 (49.3%) | 697 (21.5%) |
| 3 or more Vehicles | 1,106 (19.5%) | 328 (10.1%) |
| Total | 5,674 (100.0%) | 3,236 (100.0%) |
Real Estate & Mortgages in Westbrook
Real Estate and Mortgage Overview in Westbrook
| Characteristic | Without Mortgage | With Mortgage |
| Housing Units | 1,496 | 4,178 |
| Median Property Value | $272,900 | $315,000 |
| Median Household Income | $72,877 | $1,273 |
| Monthly Housing Costs | $787 | $251 |
| Real Estate Taxes | $3,442 | $73 |
Property Value by Mortgage Status in Westbrook
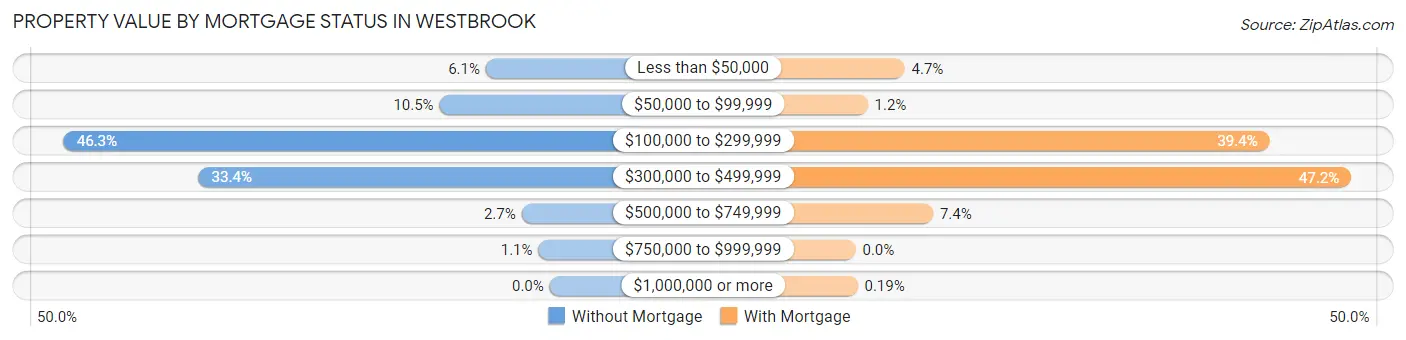
| Property Value | Without Mortgage | With Mortgage |
| Less than $50,000 | 91 (6.1%) | 195 (4.7%) |
| $50,000 to $99,999 | 157 (10.5%) | 48 (1.1%) |
| $100,000 to $299,999 | 692 (46.3%) | 1,647 (39.4%) |
| $300,000 to $499,999 | 500 (33.4%) | 1,972 (47.2%) |
| $500,000 to $749,999 | 40 (2.7%) | 308 (7.4%) |
| $750,000 to $999,999 | 16 (1.1%) | 0 (0.0%) |
| $1,000,000 or more | 0 (0.0%) | 8 (0.2%) |
| Total | 1,496 (100.0%) | 4,178 (100.0%) |
Household Income by Mortgage Status in Westbrook
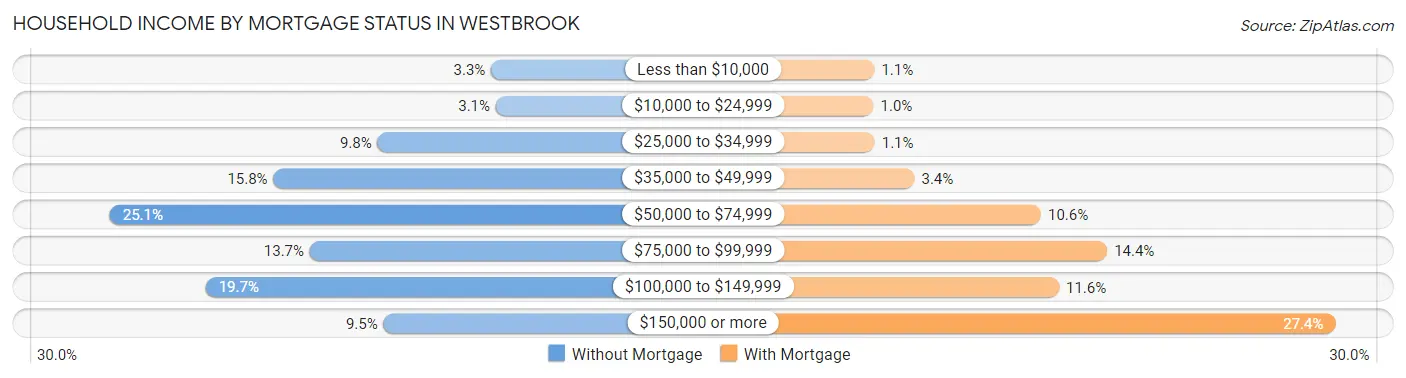
| Household Income | Without Mortgage | With Mortgage |
| Less than $10,000 | 50 (3.3%) | 45 (1.1%) |
| $10,000 to $24,999 | 46 (3.1%) | 43 (1.0%) |
| $25,000 to $34,999 | 147 (9.8%) | 46 (1.1%) |
| $35,000 to $49,999 | 236 (15.8%) | 141 (3.4%) |
| $50,000 to $74,999 | 376 (25.1%) | 443 (10.6%) |
| $75,000 to $99,999 | 205 (13.7%) | 601 (14.4%) |
| $100,000 to $149,999 | 294 (19.7%) | 486 (11.6%) |
| $150,000 or more | 142 (9.5%) | 1,145 (27.4%) |
| Total | 1,496 (100.0%) | 4,178 (100.0%) |
Property Value to Household Income Ratio in Westbrook
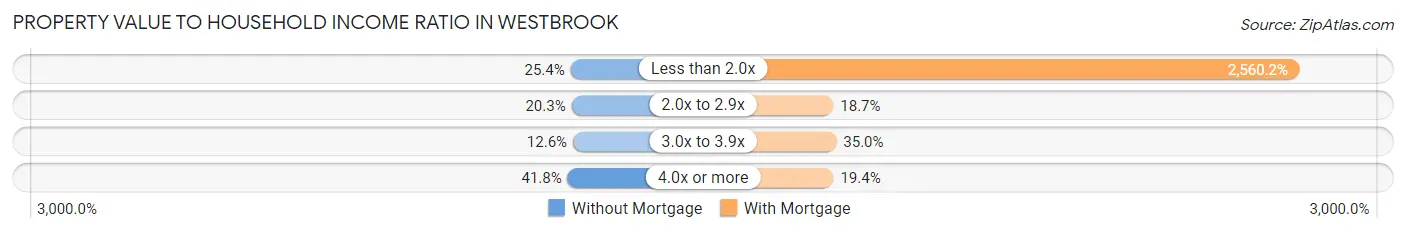
| Value-to-Income Ratio | Without Mortgage | With Mortgage |
| Less than 2.0x | 380 (25.4%) | 106,964 (2,560.2%) |
| 2.0x to 2.9x | 303 (20.3%) | 780 (18.7%) |
| 3.0x to 3.9x | 188 (12.6%) | 1,461 (35.0%) |
| 4.0x or more | 625 (41.8%) | 811 (19.4%) |
| Total | 1,496 (100.0%) | 4,178 (100.0%) |
Real Estate Taxes by Mortgage Status in Westbrook
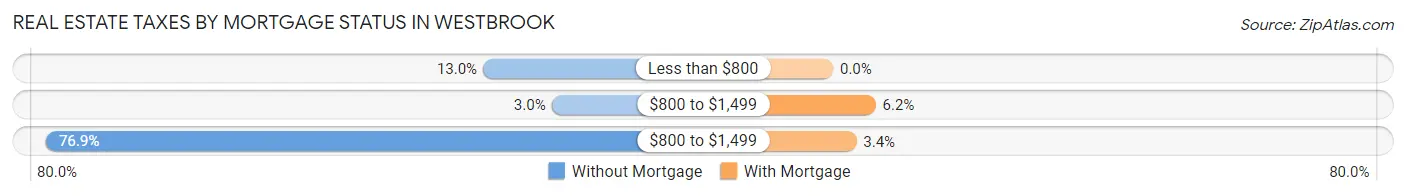
| Property Taxes | Without Mortgage | With Mortgage |
| Less than $800 | 195 (13.0%) | 0 (0.0%) |
| $800 to $1,499 | 45 (3.0%) | 260 (6.2%) |
| $800 to $1,499 | 1,150 (76.9%) | 142 (3.4%) |
| Total | 1,496 (100.0%) | 4,178 (100.0%) |
Health & Disability in Westbrook
Health Insurance Coverage by Age in Westbrook
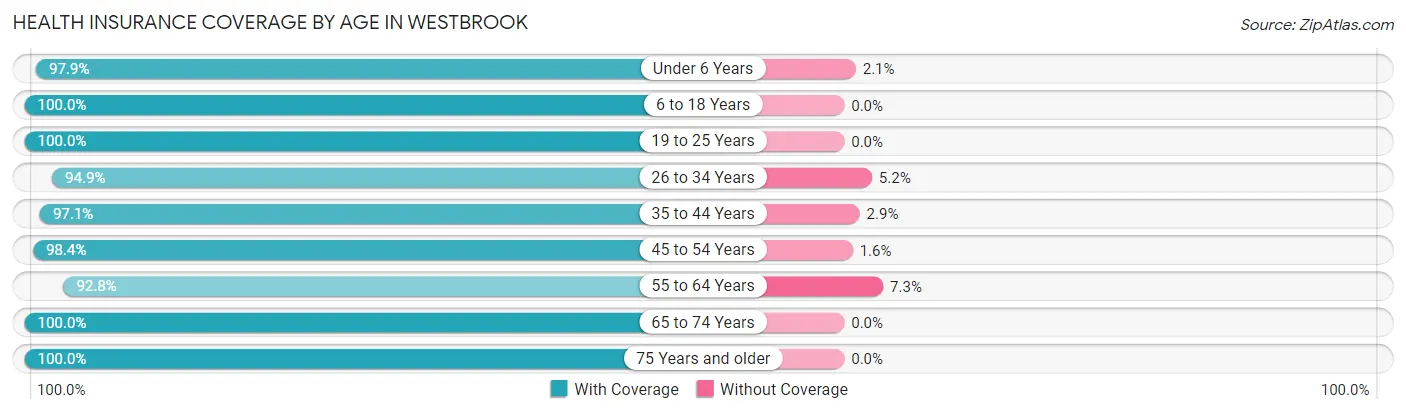
| Age Bracket | With Coverage | Without Coverage |
| Under 6 Years | 1,232 (97.9%) | 27 (2.1%) |
| 6 to 18 Years | 2,346 (100.0%) | 0 (0.0%) |
| 19 to 25 Years | 1,648 (100.0%) | 0 (0.0%) |
| 26 to 34 Years | 3,557 (94.9%) | 193 (5.1%) |
| 35 to 44 Years | 2,669 (97.1%) | 79 (2.9%) |
| 45 to 54 Years | 2,255 (98.4%) | 36 (1.6%) |
| 55 to 64 Years | 2,483 (92.7%) | 194 (7.2%) |
| 65 to 74 Years | 2,069 (100.0%) | 0 (0.0%) |
| 75 Years and older | 1,430 (100.0%) | 0 (0.0%) |
| Total | 19,689 (97.4%) | 529 (2.6%) |
Health Insurance Coverage by Citizenship Status in Westbrook
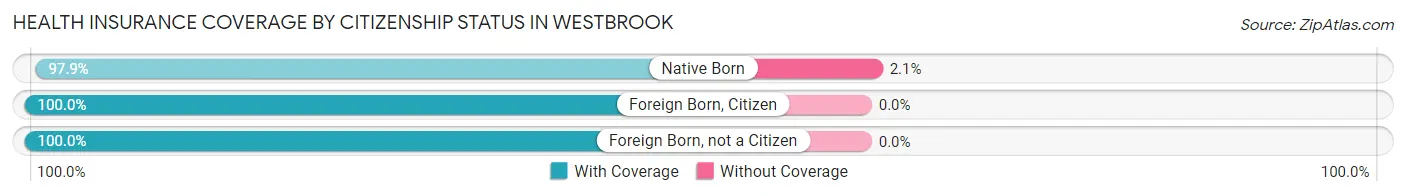
| Citizenship Status | With Coverage | Without Coverage |
| Native Born | 1,232 (97.9%) | 27 (2.1%) |
| Foreign Born, Citizen | 2,346 (100.0%) | 0 (0.0%) |
| Foreign Born, not a Citizen | 1,648 (100.0%) | 0 (0.0%) |
Health Insurance Coverage by Household Income in Westbrook
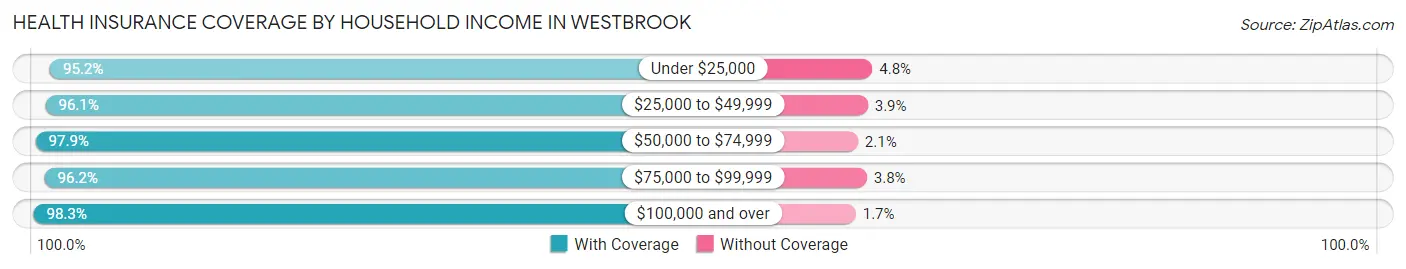
| Household Income | With Coverage | Without Coverage |
| Under $25,000 | 1,414 (95.2%) | 71 (4.8%) |
| $25,000 to $49,999 | 3,106 (96.1%) | 127 (3.9%) |
| $50,000 to $74,999 | 2,539 (97.9%) | 54 (2.1%) |
| $75,000 to $99,999 | 2,814 (96.2%) | 110 (3.8%) |
| $100,000 and over | 9,771 (98.3%) | 167 (1.7%) |
Public vs Private Health Insurance Coverage by Age in Westbrook
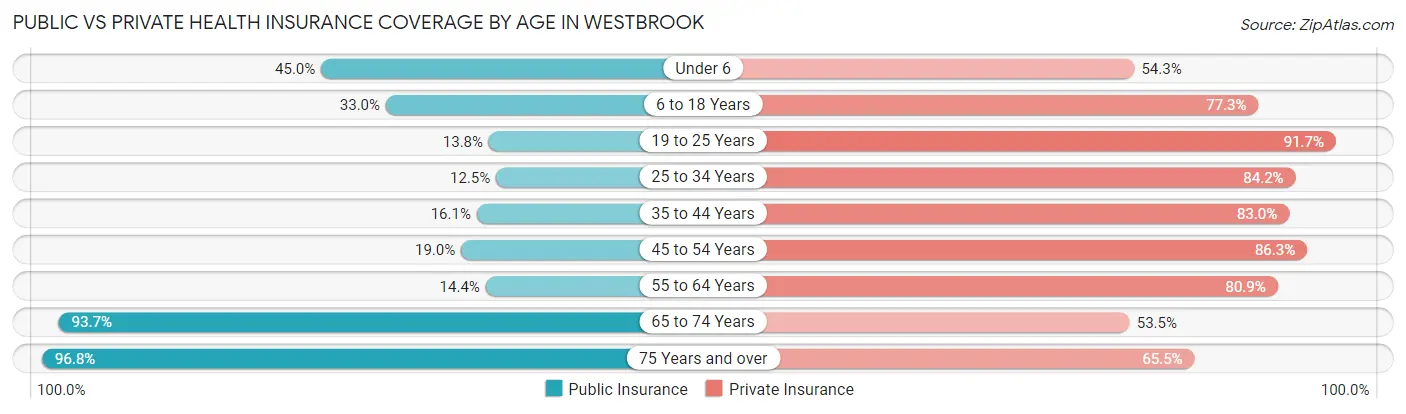
| Age Bracket | Public Insurance | Private Insurance |
| Under 6 | 566 (45.0%) | 684 (54.3%) |
| 6 to 18 Years | 773 (33.0%) | 1,814 (77.3%) |
| 19 to 25 Years | 228 (13.8%) | 1,511 (91.7%) |
| 25 to 34 Years | 468 (12.5%) | 3,157 (84.2%) |
| 35 to 44 Years | 442 (16.1%) | 2,281 (83.0%) |
| 45 to 54 Years | 435 (19.0%) | 1,978 (86.3%) |
| 55 to 64 Years | 386 (14.4%) | 2,165 (80.9%) |
| 65 to 74 Years | 1,938 (93.7%) | 1,106 (53.5%) |
| 75 Years and over | 1,384 (96.8%) | 936 (65.4%) |
| Total | 6,620 (32.7%) | 15,632 (77.3%) |
Disability Status by Sex by Age in Westbrook
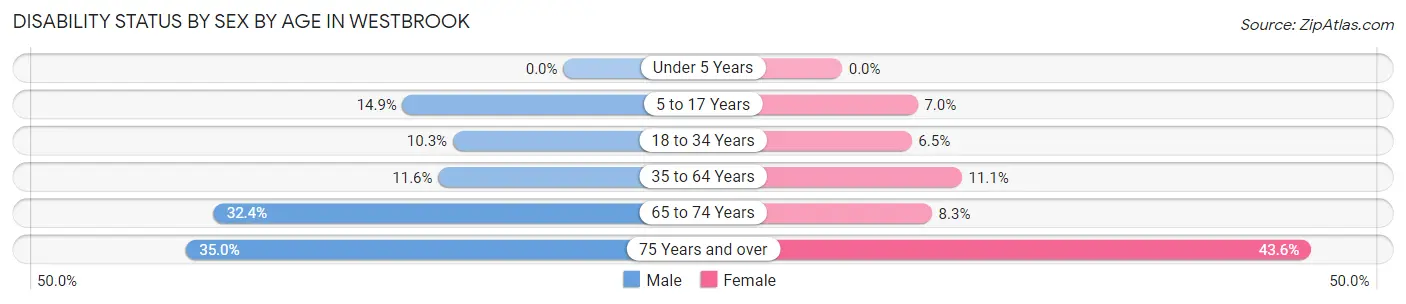
| Age Bracket | Male | Female |
| Under 5 Years | 0 (0.0%) | 0 (0.0%) |
| 5 to 17 Years | 157 (14.9%) | 87 (7.0%) |
| 18 to 34 Years | 268 (10.2%) | 196 (6.5%) |
| 35 to 64 Years | 471 (11.6%) | 406 (11.1%) |
| 65 to 74 Years | 290 (32.4%) | 98 (8.3%) |
| 75 Years and over | 232 (35.0%) | 334 (43.5%) |
Disability Class by Sex by Age in Westbrook
Disability Class: Hearing Difficulty
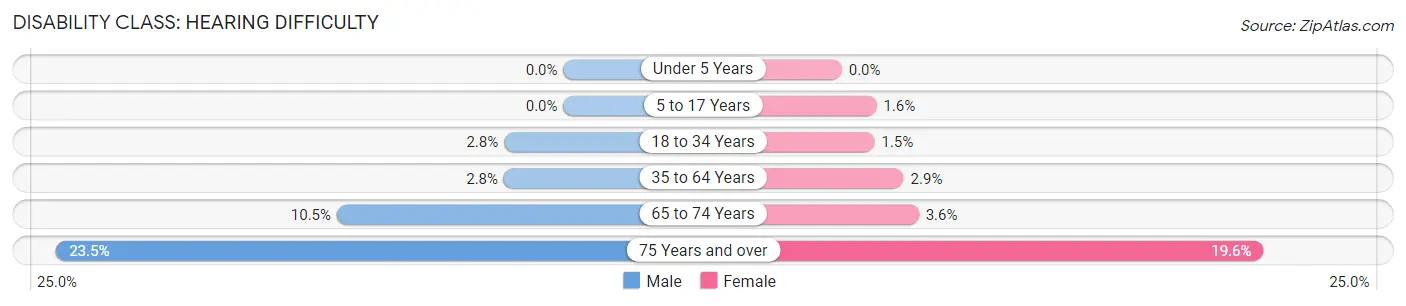
| Age Bracket | Male | Female |
| Under 5 Years | 0 (0.0%) | 0 (0.0%) |
| 5 to 17 Years | 0 (0.0%) | 20 (1.6%) |
| 18 to 34 Years | 72 (2.8%) | 46 (1.5%) |
| 35 to 64 Years | 112 (2.8%) | 105 (2.9%) |
| 65 to 74 Years | 94 (10.5%) | 42 (3.6%) |
| 75 Years and over | 156 (23.5%) | 150 (19.6%) |
Disability Class: Vision Difficulty
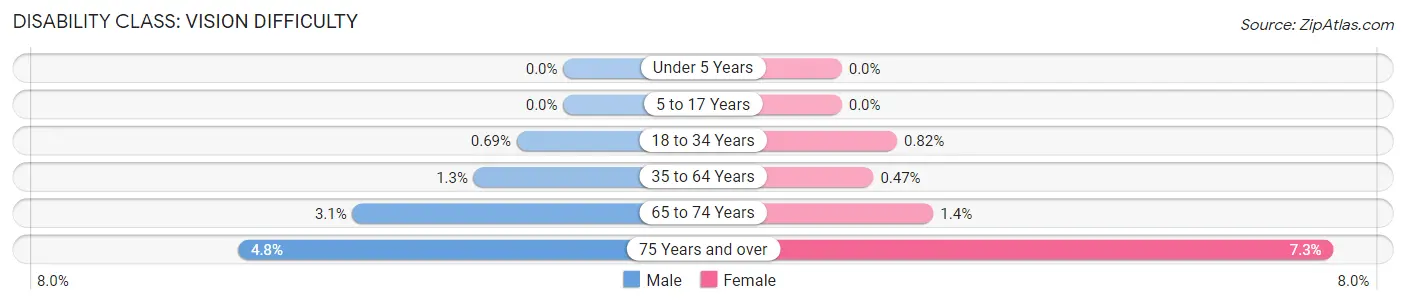
| Age Bracket | Male | Female |
| Under 5 Years | 0 (0.0%) | 0 (0.0%) |
| 5 to 17 Years | 0 (0.0%) | 0 (0.0%) |
| 18 to 34 Years | 18 (0.7%) | 25 (0.8%) |
| 35 to 64 Years | 54 (1.3%) | 17 (0.5%) |
| 65 to 74 Years | 28 (3.1%) | 16 (1.4%) |
| 75 Years and over | 32 (4.8%) | 56 (7.3%) |
Disability Class: Cognitive Difficulty
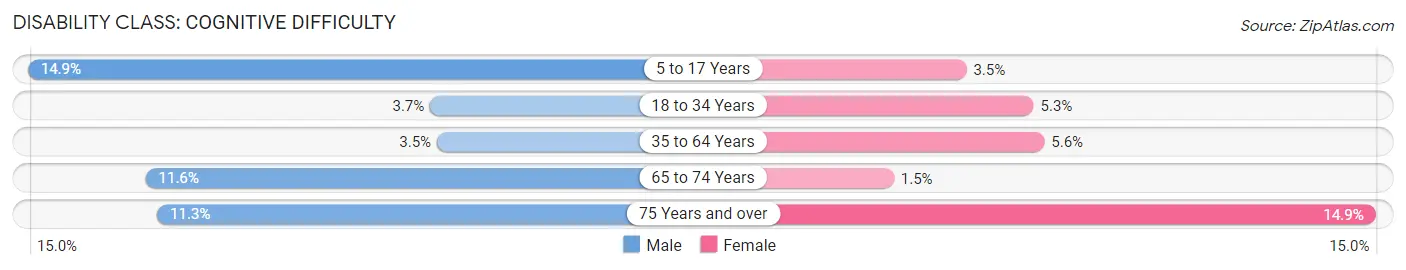
| Age Bracket | Male | Female |
| 5 to 17 Years | 157 (14.9%) | 43 (3.5%) |
| 18 to 34 Years | 97 (3.7%) | 162 (5.3%) |
| 35 to 64 Years | 143 (3.5%) | 206 (5.6%) |
| 65 to 74 Years | 104 (11.6%) | 17 (1.5%) |
| 75 Years and over | 75 (11.3%) | 114 (14.9%) |
Disability Class: Ambulatory Difficulty
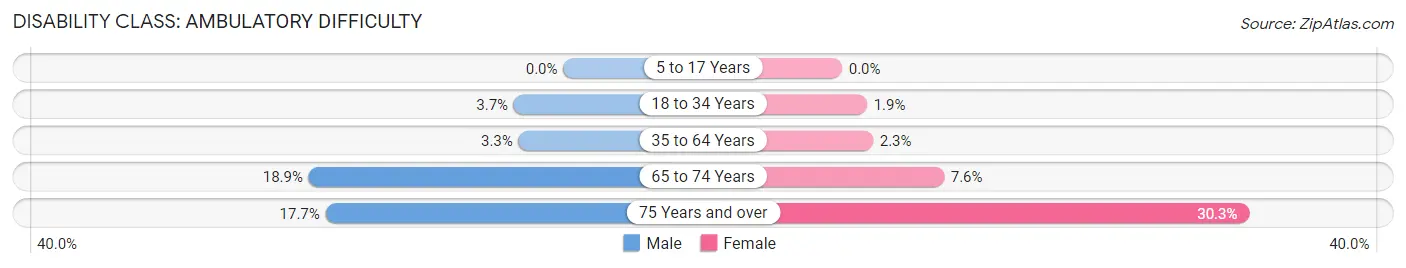
| Age Bracket | Male | Female |
| 5 to 17 Years | 0 (0.0%) | 0 (0.0%) |
| 18 to 34 Years | 96 (3.7%) | 56 (1.8%) |
| 35 to 64 Years | 135 (3.3%) | 84 (2.3%) |
| 65 to 74 Years | 169 (18.9%) | 89 (7.6%) |
| 75 Years and over | 117 (17.6%) | 232 (30.2%) |
Disability Class: Self-Care Difficulty
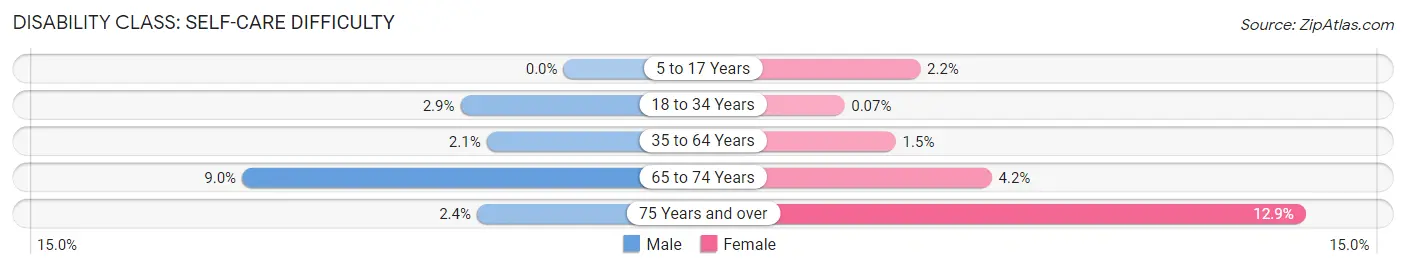
| Age Bracket | Male | Female |
| 5 to 17 Years | 0 (0.0%) | 27 (2.2%) |
| 18 to 34 Years | 75 (2.9%) | 2 (0.1%) |
| 35 to 64 Years | 87 (2.1%) | 55 (1.5%) |
| 65 to 74 Years | 80 (8.9%) | 49 (4.2%) |
| 75 Years and over | 16 (2.4%) | 99 (12.9%) |
Technology Access in Westbrook
Computing Device Access in Westbrook
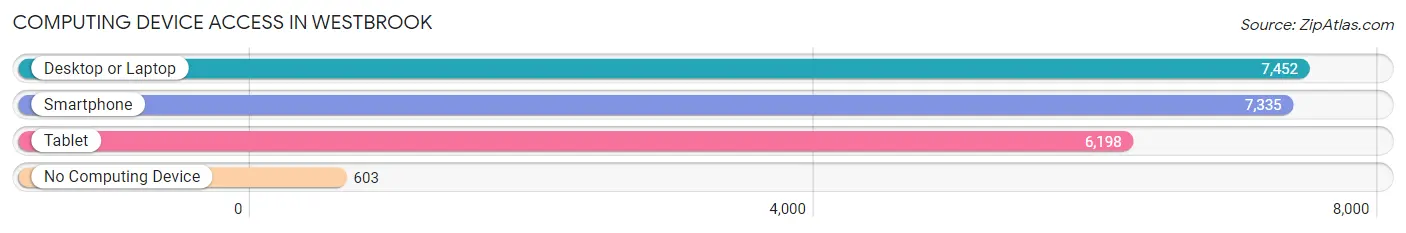
| Device Type | # Households | % Households |
| Desktop or Laptop | 7,452 | 83.6% |
| Smartphone | 7,335 | 82.3% |
| Tablet | 6,198 | 69.6% |
| No Computing Device | 603 | 6.8% |
| Total | 8,910 | 100.0% |
Internet Access in Westbrook
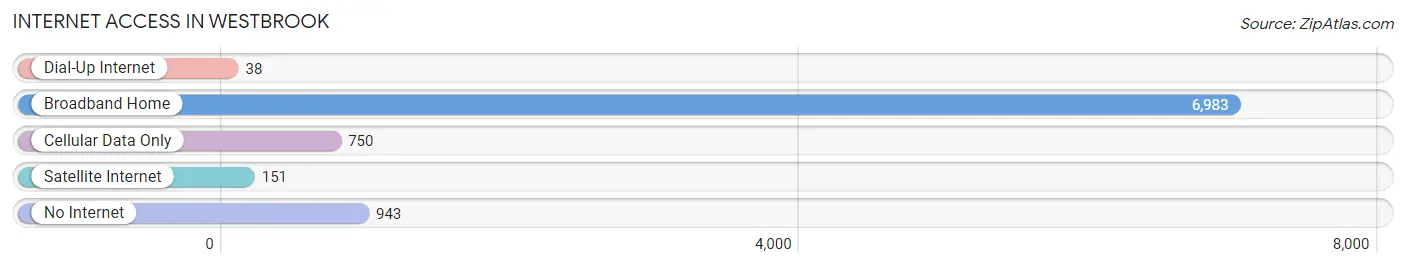
| Internet Type | # Households | % Households |
| Dial-Up Internet | 38 | 0.4% |
| Broadband Home | 6,983 | 78.4% |
| Cellular Data Only | 750 | 8.4% |
| Satellite Internet | 151 | 1.7% |
| No Internet | 943 | 10.6% |
| Total | 8,910 | 100.0% |
Westbrook Summary
Westbrook, Maine is a city located in Cumberland County, Maine, United States. It is part of the Portland–South Portland–Biddeford metropolitan statistical area. The population was 17,494 at the 2010 census. It is part of the Portland–South Portland–Biddeford, Maine metropolitan statistical area.
History
Westbrook was first settled in 1632 by Europeans. It was originally part of Falmouth, Maine, which was incorporated in 1718. In 1814, Westbrook was set off and incorporated as a town. It was named after Colonel Thomas Westbrook, a prominent local citizen.
In 1871, Westbrook was incorporated as a city. It was the first city in Maine to be incorporated under the new state constitution.
Geography
Westbrook is located at 43°40′N 70°17′W (43.6667, -70.2833). According to the United States Census Bureau, the city has a total area of 16.2 square miles (41.8 km2), of which 15.9 square miles (41.2 km2) is land and 0.3 square miles (0.7 km2) is water.
Westbrook is bordered by the cities of Portland and South Portland to the south, Falmouth to the east, and Windham to the north. The Presumpscot River forms the western boundary of the city.
Economy
Westbrook is home to several large employers, including Idexx Laboratories, WEX Inc., and Unum. The city is also home to several small businesses, including restaurants, retail stores, and professional services.
Demographics
As of the census of 2010, there were 17,494 people, 7,541 households, and 4,541 families residing in the city. The population density was 1,097.3 people per square mile (423.2/km2). There were 8,072 housing units at an average density of 506.3 per square mile (195.3/km2). The racial makeup of the city was 94.2% White, 1.3% African American, 0.4% Native American, 1.3% Asian, 0.2% Pacific Islander, 0.7% from other races, and 2.1% from two or more races. Hispanic or Latino of any race were 2.3% of the population.
There were 7,541 households, out of which 28.2% had children under the age of 18 living with them, 43.2% were married couples living together, 12.7% had a female householder with no husband present, and 39.3% were non-families. 32.2% of all households were made up of individuals, and 11.7% had someone living alone who was 65 years of age or older. The average household size was 2.30 and the average family size was 2.93.
In the city, the population was spread out, with 23.2% under the age of 18, 8.2% from 18 to 24, 30.2% from 25 to 44, 22.7% from 45 to 64, and 15.7% who were 65 years of age or older. The median age was 37 years. For every 100 females, there were 91.2 males. For every 100 females age 18 and over, there were 87.7 males.
The median income for a household in the city was $41,945, and the median income for a family was $51,945. Males had a median income of $37,945 versus $30,945 for females. The per capita income for the city was $22,945. About 8.2% of families and 10.2% of the population were below the poverty line, including 14.2% of those under age 18 and 8.2% of those age 65 or over.
Common Questions
What is Per Capita Income in Westbrook?
Per Capita income in Westbrook is $40,736.
What is the Median Family Income in Westbrook?
Median Family Income in Westbrook is $93,185.
What is the Median Household income in Westbrook?
Median Household Income in Westbrook is $81,198.
What is Income or Wage Gap in Westbrook?
Income or Wage Gap in Westbrook is 18.0%.
Women in Westbrook earn 82.0 cents for every dollar earned by a man.
What is Inequality or Gini Index in Westbrook?
Inequality or Gini Index in Westbrook is 0.37.
What is the Total Population of Westbrook?
Total Population of Westbrook is 20,339.
What is the Total Male Population of Westbrook?
Total Male Population of Westbrook is 9,813.
What is the Total Female Population of Westbrook?
Total Female Population of Westbrook is 10,526.
What is the Ratio of Males per 100 Females in Westbrook?
There are 93.23 Males per 100 Females in Westbrook.
What is the Ratio of Females per 100 Males in Westbrook?
There are 107.27 Females per 100 Males in Westbrook.
What is the Median Population Age in Westbrook?
Median Population Age in Westbrook is 37.7 Years.
What is the Average Family Size in Westbrook
Average Family Size in Westbrook is 3.0 People.
What is the Average Household Size in Westbrook
Average Household Size in Westbrook is 2.3 People.
How Large is the Labor Force in Westbrook?
There are 12,728 People in the Labor Forcein in Westbrook.
What is the Percentage of People in the Labor Force in Westbrook?
72.6% of People are in the Labor Force in Westbrook.
What is the Unemployment Rate in Westbrook?
Unemployment Rate in Westbrook is 2.9%.