Fairfield, ME Map & Demographics
Fairfield Map
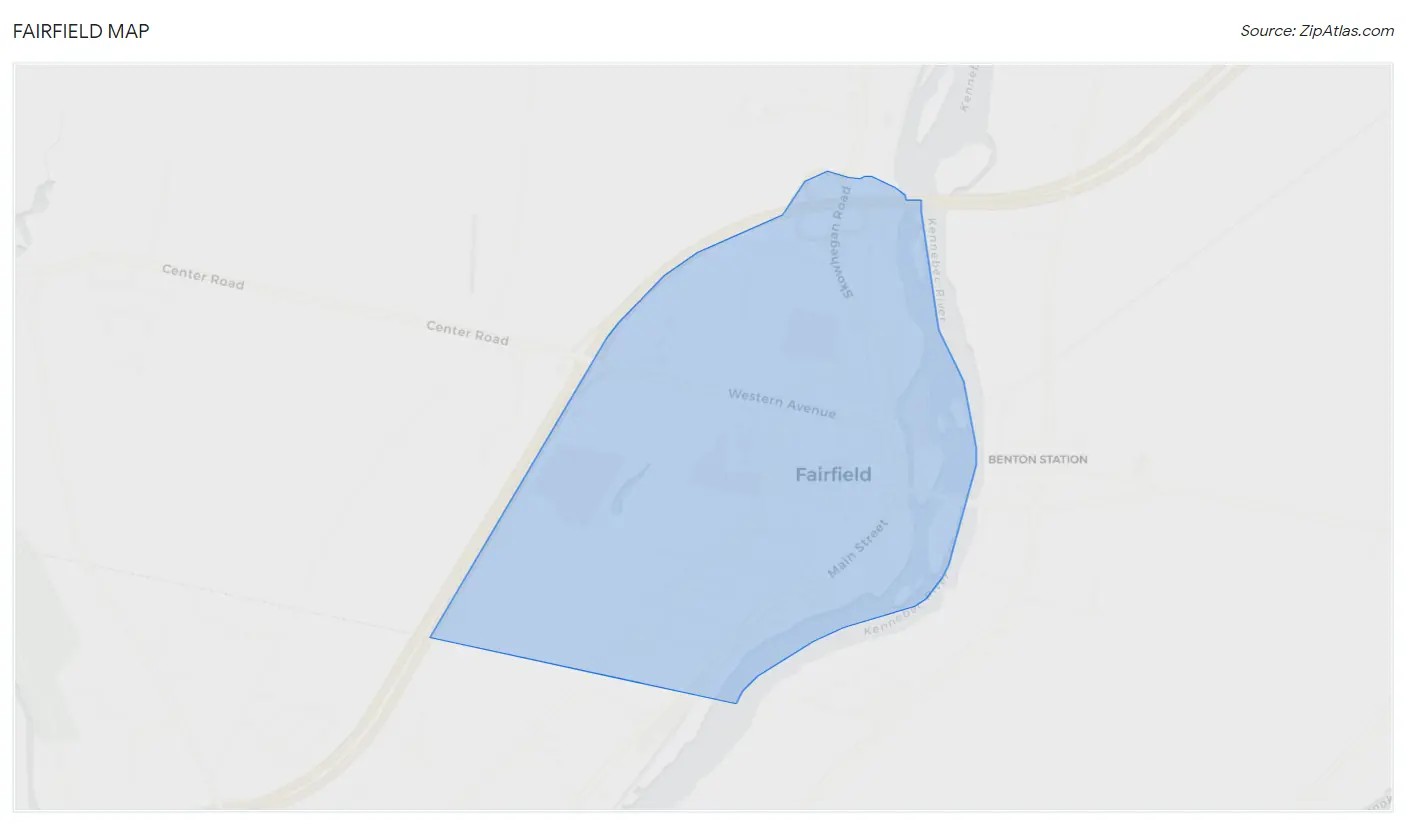
Fairfield Overview
$24,598
PER CAPITA INCOME
$77,083
AVG FAMILY INCOME
$34,657
AVG HOUSEHOLD INCOME
32.7%
WAGE / INCOME GAP [ % ]
67.3¢/ $1
WAGE / INCOME GAP [ $ ]
0.45
INEQUALITY / GINI INDEX
2,647
TOTAL POPULATION
1,215
MALE POPULATION
1,432
FEMALE POPULATION
84.85
MALES / 100 FEMALES
117.86
FEMALES / 100 MALES
35.3
MEDIAN AGE
3.0
AVG FAMILY SIZE
2.2
AVG HOUSEHOLD SIZE
1,445
LABOR FORCE [ PEOPLE ]
67.5%
PERCENT IN LABOR FORCE
4.6%
UNEMPLOYMENT RATE
Fairfield Zip Codes
Fairfield Area Codes
Income in Fairfield
Income Overview in Fairfield
Per Capita Income in Fairfield is $24,598, while median incomes of families and households are $77,083 and $34,657 respectively.
| Characteristic | Number | Measure |
| Per Capita Income | 2,647 | $24,598 |
| Median Family Income | 578 | $77,083 |
| Mean Family Income | 578 | $79,374 |
| Median Household Income | 1,213 | $34,657 |
| Mean Household Income | 1,213 | $55,752 |
| Income Deficit | 578 | $0 |
| Wage / Income Gap (%) | 2,647 | 32.67% |
| Wage / Income Gap ($) | 2,647 | 67.33¢ per $1 |
| Gini / Inequality Index | 2,647 | 0.45 |
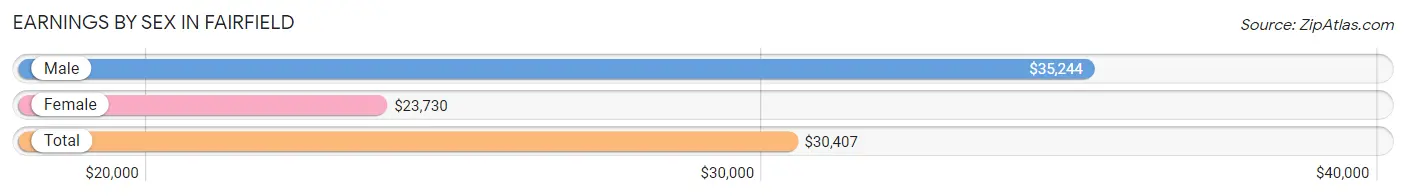
Earnings by Sex in Fairfield
Average Earnings in Fairfield are $30,407, $35,244 for men and $23,730 for women, a difference of 32.7%.
| Sex | Number | Average Earnings |
| Male | 735 (48.9%) | $35,244 |
| Female | 767 (51.1%) | $23,730 |
| Total | 1,502 (100.0%) | $30,407 |
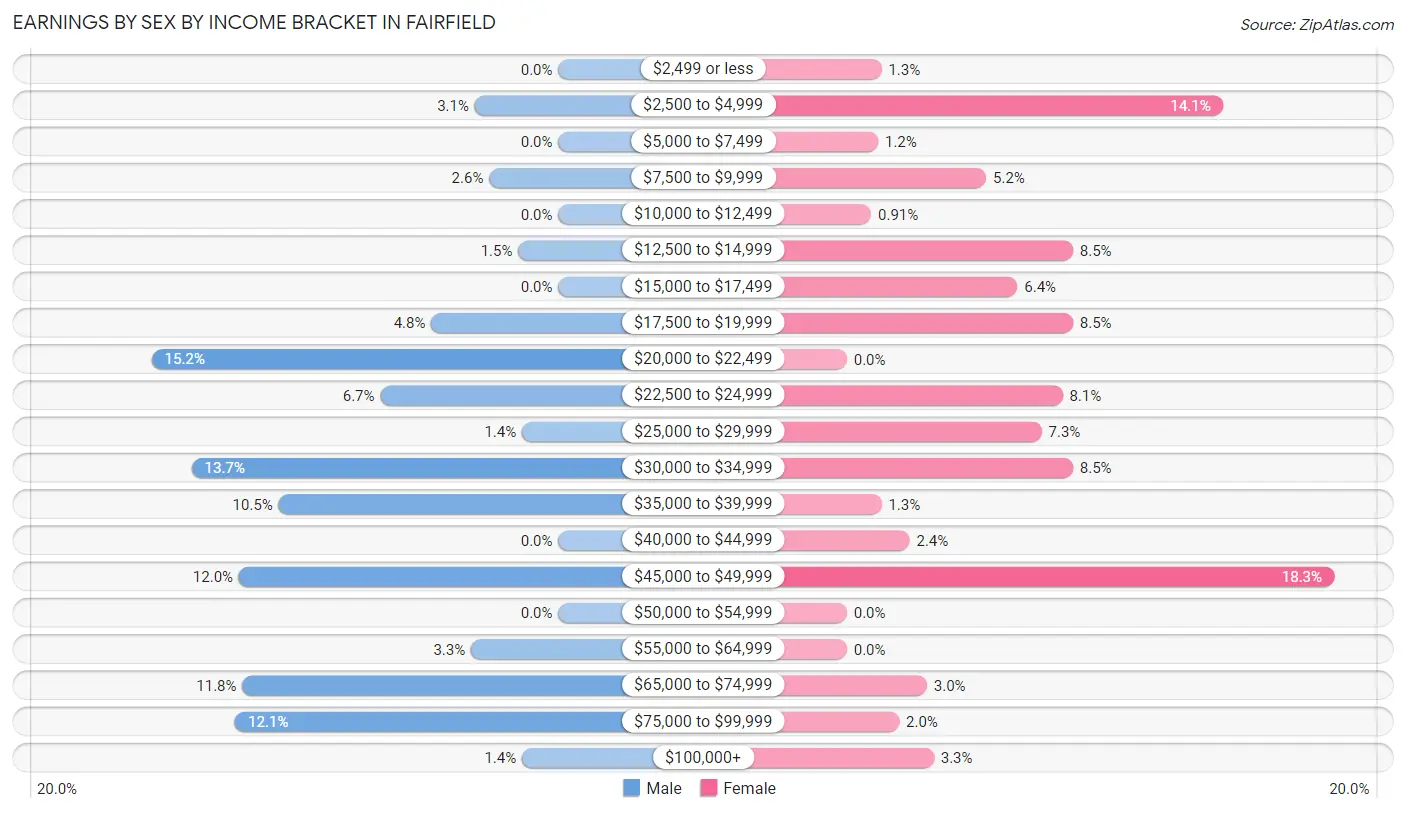
Earnings by Sex by Income Bracket in Fairfield
The most common earnings brackets in Fairfield are $20,000 to $22,499 for men (112 | 15.2%) and $45,000 to $49,999 for women (140 | 18.2%).
| Income | Male | Female |
| $2,499 or less | 0 (0.0%) | 10 (1.3%) |
| $2,500 to $4,999 | 23 (3.1%) | 108 (14.1%) |
| $5,000 to $7,499 | 0 (0.0%) | 9 (1.2%) |
| $7,500 to $9,999 | 19 (2.6%) | 40 (5.2%) |
| $10,000 to $12,499 | 0 (0.0%) | 7 (0.9%) |
| $12,500 to $14,999 | 11 (1.5%) | 65 (8.5%) |
| $15,000 to $17,499 | 0 (0.0%) | 49 (6.4%) |
| $17,500 to $19,999 | 35 (4.8%) | 65 (8.5%) |
| $20,000 to $22,499 | 112 (15.2%) | 0 (0.0%) |
| $22,500 to $24,999 | 49 (6.7%) | 62 (8.1%) |
| $25,000 to $29,999 | 10 (1.4%) | 56 (7.3%) |
| $30,000 to $34,999 | 101 (13.7%) | 65 (8.5%) |
| $35,000 to $39,999 | 77 (10.5%) | 10 (1.3%) |
| $40,000 to $44,999 | 0 (0.0%) | 18 (2.4%) |
| $45,000 to $49,999 | 88 (12.0%) | 140 (18.2%) |
| $50,000 to $54,999 | 0 (0.0%) | 0 (0.0%) |
| $55,000 to $64,999 | 24 (3.3%) | 0 (0.0%) |
| $65,000 to $74,999 | 87 (11.8%) | 23 (3.0%) |
| $75,000 to $99,999 | 89 (12.1%) | 15 (2.0%) |
| $100,000+ | 10 (1.4%) | 25 (3.3%) |
| Total | 735 (100.0%) | 767 (100.0%) |
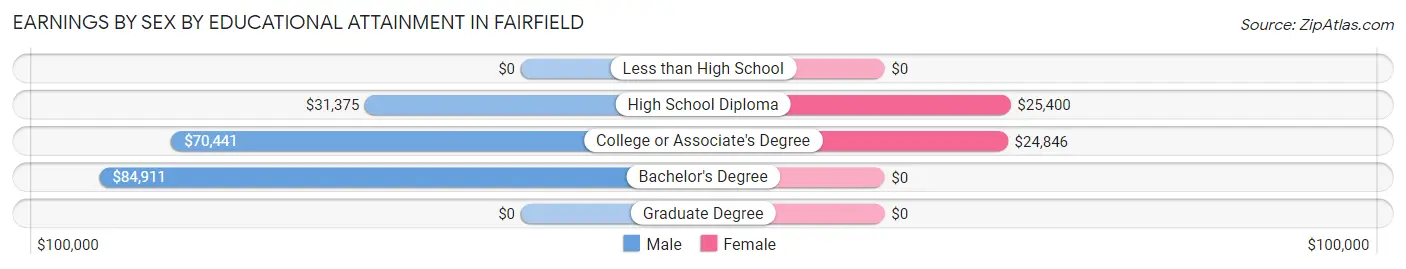
Earnings by Sex by Educational Attainment in Fairfield
Average earnings in Fairfield are $45,114 for men and $26,200 for women, a difference of 41.9%. Men with an educational attainment of bachelor's degree enjoy the highest average annual earnings of $84,911, while those with high school diploma education earn the least with $31,375. Women with an educational attainment of high school diploma earn the most with the average annual earnings of $25,400, while those with college or associate's degree education have the smallest earnings of $24,846.
| Educational Attainment | Male Income | Female Income |
| Less than High School | - | - |
| High School Diploma | $31,375 | $25,400 |
| College or Associate's Degree | $70,441 | $24,846 |
| Bachelor's Degree | $84,911 | $0 |
| Graduate Degree | - | - |
| Total | $45,114 | $26,200 |
Family Income in Fairfield
Family Income Brackets in Fairfield
According to the Fairfield family income data, there are 261 families falling into the $100,000 to $149,999 income range, which is the most common income bracket and makes up 45.2% of all families.
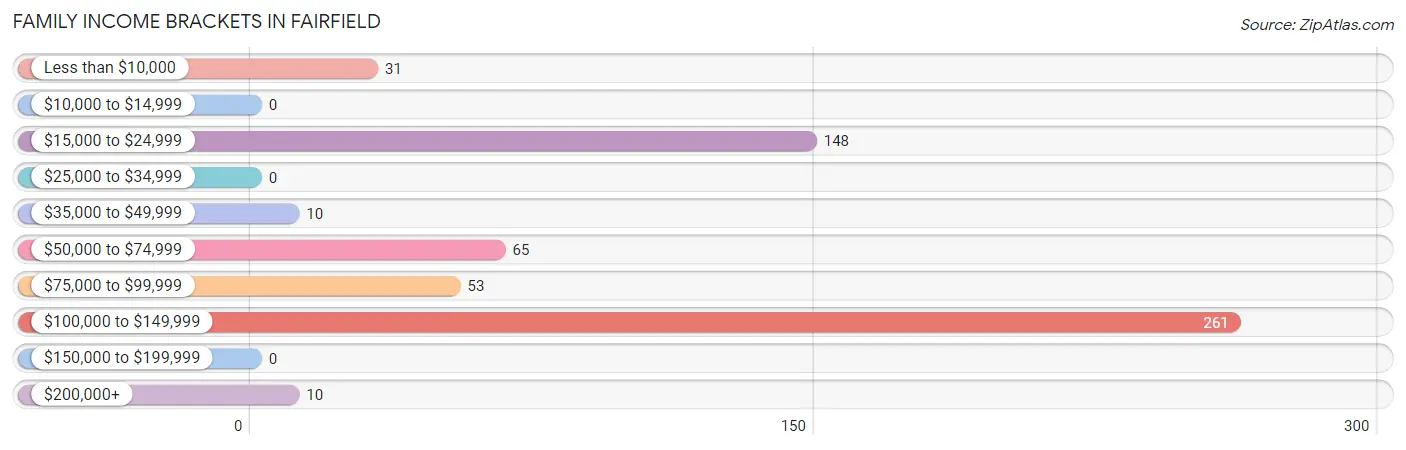
| Income Bracket | # Families | % Families |
| Less than $10,000 | 31 | 5.4% |
| $10,000 to $14,999 | 0 | 0.0% |
| $15,000 to $24,999 | 148 | 25.6% |
| $25,000 to $34,999 | 0 | 0.0% |
| $35,000 to $49,999 | 10 | 1.7% |
| $50,000 to $74,999 | 65 | 11.2% |
| $75,000 to $99,999 | 53 | 9.2% |
| $100,000 to $149,999 | 261 | 45.2% |
| $150,000 to $199,999 | 0 | 0.0% |
| $200,000+ | 10 | 1.7% |
Family Income by Famaliy Size in Fairfield
4-person families (59 | 10.2%) account for the highest median family income in Fairfield with $104,350 per family, while 3-person families (386 | 66.8%) have the highest median income of $33,553 per family member.
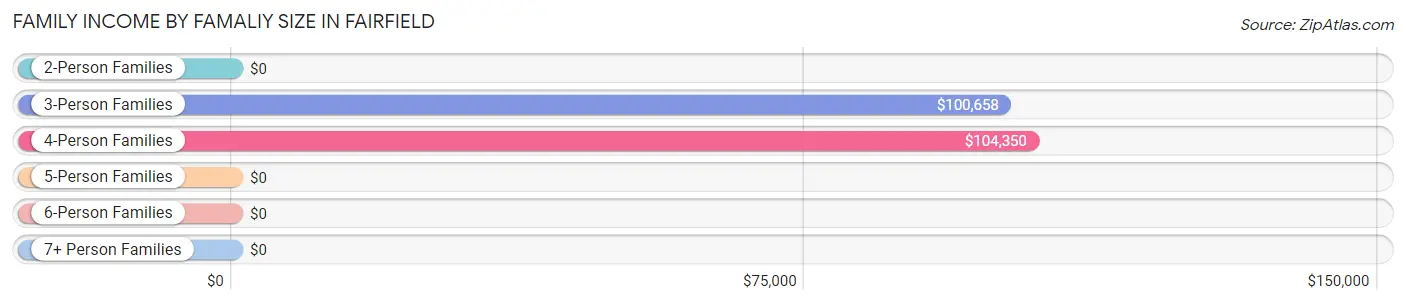
| Income Bracket | # Families | Median Income |
| 2-Person Families | 81 (14.0%) | $0 |
| 3-Person Families | 386 (66.8%) | $100,658 |
| 4-Person Families | 59 (10.2%) | $104,350 |
| 5-Person Families | 0 (0.0%) | $0 |
| 6-Person Families | 52 (9.0%) | $0 |
| 7+ Person Families | 0 (0.0%) | $0 |
| Total | 578 (100.0%) | $77,083 |
Family Income by Number of Earners in Fairfield
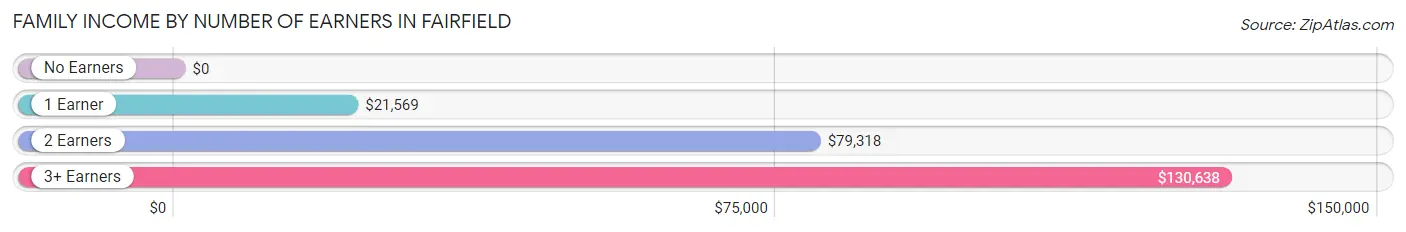
| Number of Earners | # Families | Median Income |
| No Earners | 7 (1.2%) | $0 |
| 1 Earner | 239 (41.3%) | $21,569 |
| 2 Earners | 166 (28.7%) | $79,318 |
| 3+ Earners | 166 (28.7%) | $130,638 |
| Total | 578 (100.0%) | $77,083 |
Household Income in Fairfield
Household Income Brackets in Fairfield
With 278 households falling in the category, the $100,000 to $149,999 income range is the most frequent in Fairfield, accounting for 22.9% of all households.
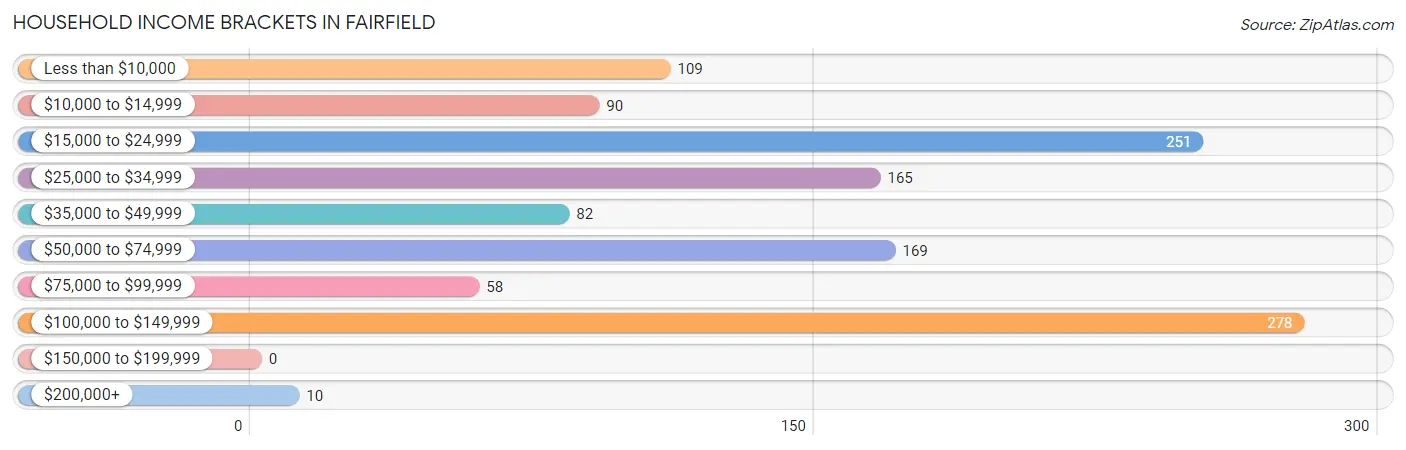
| Income Bracket | # Households | % Households |
| Less than $10,000 | 109 | 9.0% |
| $10,000 to $14,999 | 90 | 7.4% |
| $15,000 to $24,999 | 251 | 20.7% |
| $25,000 to $34,999 | 165 | 13.6% |
| $35,000 to $49,999 | 82 | 6.8% |
| $50,000 to $74,999 | 169 | 13.9% |
| $75,000 to $99,999 | 58 | 4.8% |
| $100,000 to $149,999 | 278 | 22.9% |
| $150,000 to $199,999 | 0 | 0.0% |
| $200,000+ | 10 | 0.8% |
Household Income by Householder Age in Fairfield
The median household income in Fairfield is $34,657, with the highest median household income of $60,256 found in the 25 to 44 years age bracket for the primary householder. A total of 206 households (17.0%) fall into this category. Meanwhile, the 15 to 24 years age bracket for the primary householder has the lowest median household income of $0, with 153 households (12.6%) in this group.
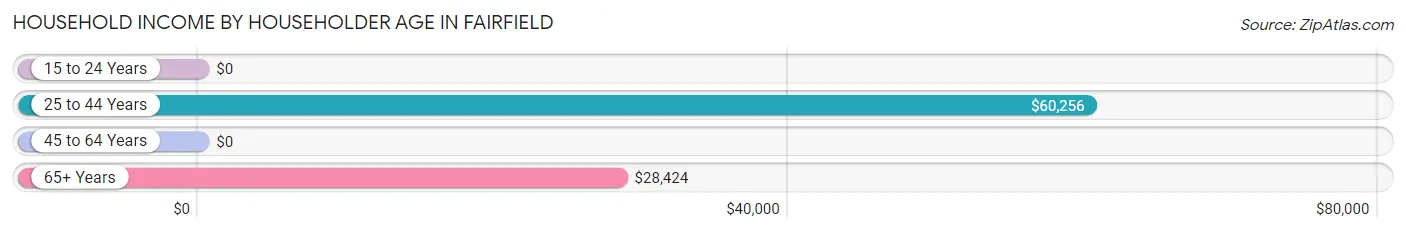
| Income Bracket | # Households | Median Income |
| 15 to 24 Years | 153 (12.6%) | $0 |
| 25 to 44 Years | 206 (17.0%) | $60,256 |
| 45 to 64 Years | 646 (53.3%) | $0 |
| 65+ Years | 208 (17.2%) | $28,424 |
| Total | 1,213 (100.0%) | $34,657 |
Poverty in Fairfield
Income Below Poverty by Sex and Age in Fairfield
With 29.0% poverty level for males and 28.5% for females among the residents of Fairfield, 25 to 34 year old males and 6 to 11 year old females are the most vulnerable to poverty, with 113 males (66.1%) and 28 females (100.0%) in their respective age groups living below the poverty level.
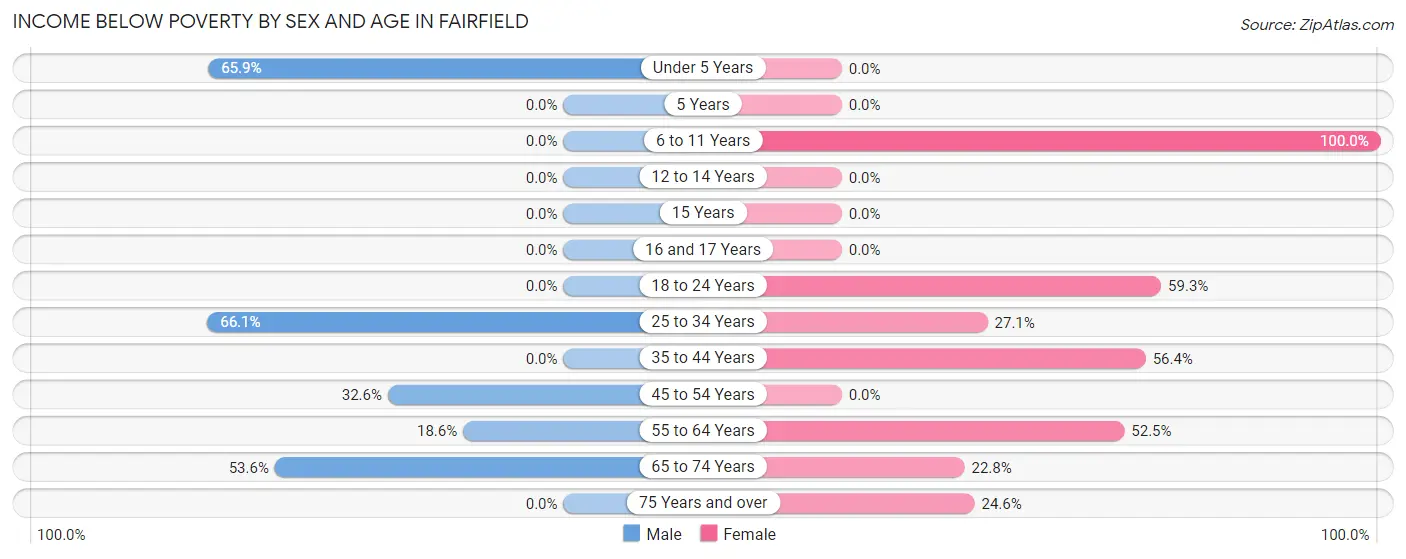
| Age Bracket | Male | Female |
| Under 5 Years | 87 (65.9%) | 0 (0.0%) |
| 5 Years | 0 (0.0%) | 0 (0.0%) |
| 6 to 11 Years | 0 (0.0%) | 28 (100.0%) |
| 12 to 14 Years | 0 (0.0%) | 0 (0.0%) |
| 15 Years | 0 (0.0%) | 0 (0.0%) |
| 16 and 17 Years | 0 (0.0%) | 0 (0.0%) |
| 18 to 24 Years | 0 (0.0%) | 131 (59.3%) |
| 25 to 34 Years | 113 (66.1%) | 49 (27.1%) |
| 35 to 44 Years | 0 (0.0%) | 44 (56.4%) |
| 45 to 54 Years | 58 (32.6%) | 0 (0.0%) |
| 55 to 64 Years | 46 (18.6%) | 107 (52.4%) |
| 65 to 74 Years | 45 (53.6%) | 18 (22.8%) |
| 75 Years and over | 0 (0.0%) | 17 (24.6%) |
| Total | 349 (29.0%) | 394 (28.5%) |
Income Above Poverty by Sex and Age in Fairfield
According to the poverty statistics in Fairfield, males aged 5 years and females aged 12 to 14 years are the age groups that are most secure financially, with 100.0% of males and 100.0% of females in these age groups living above the poverty line.
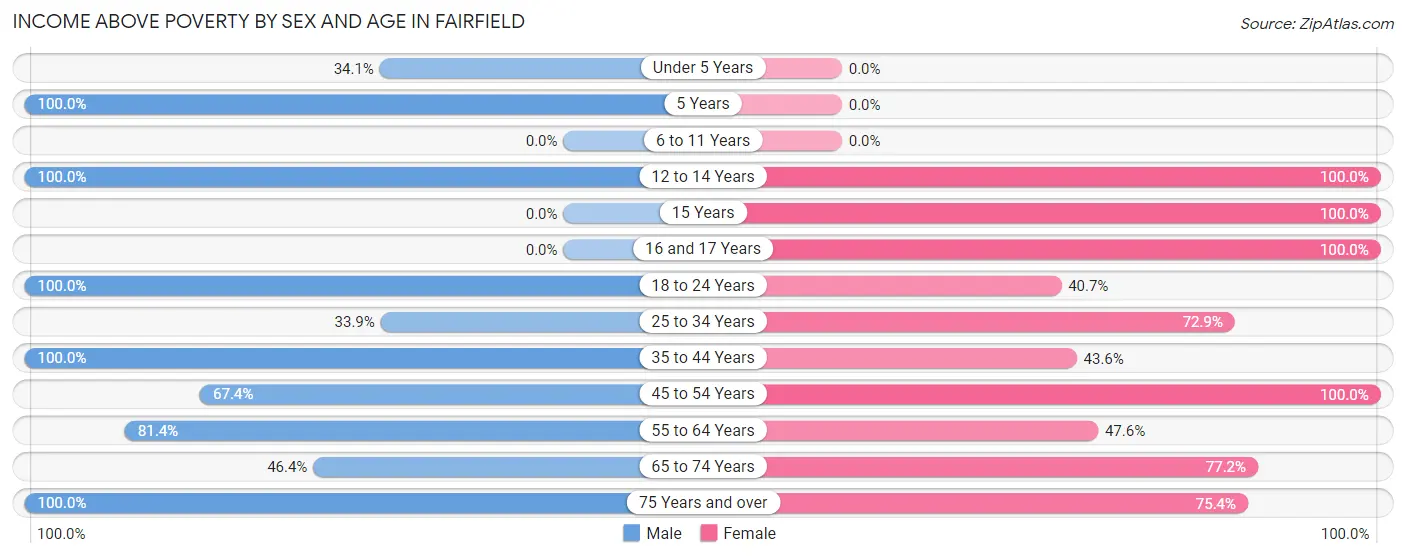
| Age Bracket | Male | Female |
| Under 5 Years | 45 (34.1%) | 0 (0.0%) |
| 5 Years | 45 (100.0%) | 0 (0.0%) |
| 6 to 11 Years | 0 (0.0%) | 0 (0.0%) |
| 12 to 14 Years | 61 (100.0%) | 108 (100.0%) |
| 15 Years | 0 (0.0%) | 70 (100.0%) |
| 16 and 17 Years | 0 (0.0%) | 63 (100.0%) |
| 18 to 24 Years | 147 (100.0%) | 90 (40.7%) |
| 25 to 34 Years | 58 (33.9%) | 132 (72.9%) |
| 35 to 44 Years | 127 (100.0%) | 34 (43.6%) |
| 45 to 54 Years | 120 (67.4%) | 281 (100.0%) |
| 55 to 64 Years | 201 (81.4%) | 97 (47.5%) |
| 65 to 74 Years | 39 (46.4%) | 61 (77.2%) |
| 75 Years and over | 11 (100.0%) | 52 (75.4%) |
| Total | 854 (71.0%) | 988 (71.5%) |
Income Below Poverty Among Married-Couple Families in Fairfield
The poverty statistics for married-couple families in Fairfield show that 30.7% or 138 of the total 449 families live below the poverty line. Families with 1 or 2 children have the highest poverty rate of 51.4%, comprising of 131 families. On the other hand, families with 3 or 4 children have the lowest poverty rate of 0.0%, which includes 0 families.
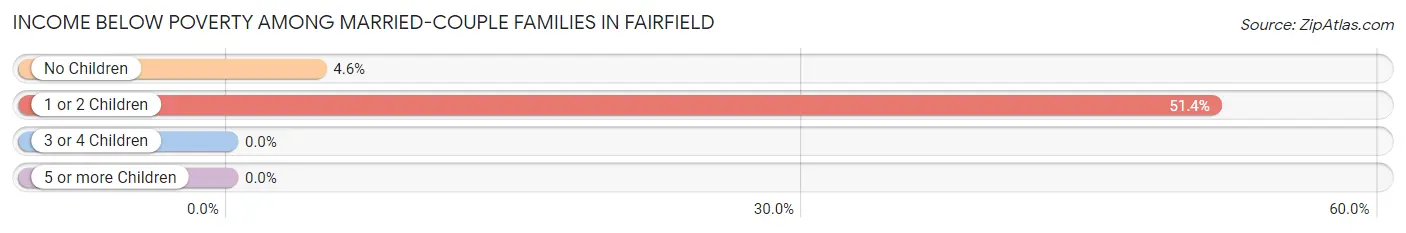
| Children | Above Poverty | Below Poverty |
| No Children | 145 (95.4%) | 7 (4.6%) |
| 1 or 2 Children | 124 (48.6%) | 131 (51.4%) |
| 3 or 4 Children | 42 (100.0%) | 0 (0.0%) |
| 5 or more Children | 0 (0.0%) | 0 (0.0%) |
| Total | 311 (69.3%) | 138 (30.7%) |
Income Below Poverty Among Single-Parent Households in Fairfield
According to the poverty data in Fairfield, 100.0% or 10 single-father households and 26.1% or 31 single-mother households are living below the poverty line. Among single-father households, those with 1 or 2 children have the highest poverty rate, with 10 households (100.0%) experiencing poverty. Likewise, among single-mother households, those with 1 or 2 children have the highest poverty rate, with 31 households (31.6%) falling below the poverty line.
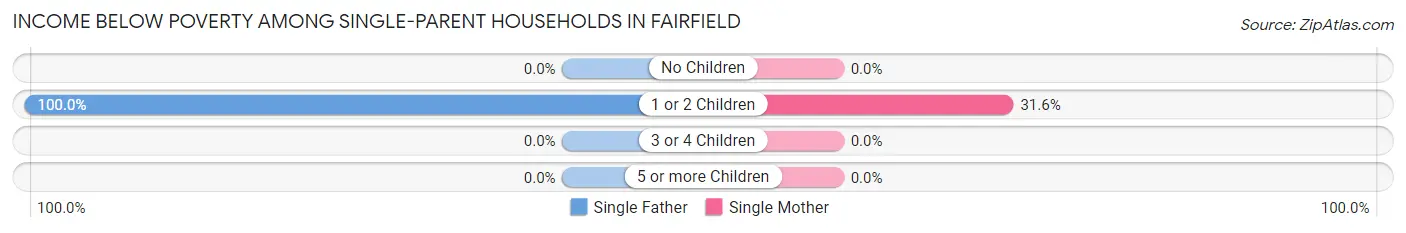
| Children | Single Father | Single Mother |
| No Children | 0 (0.0%) | 0 (0.0%) |
| 1 or 2 Children | 10 (100.0%) | 31 (31.6%) |
| 3 or 4 Children | 0 (0.0%) | 0 (0.0%) |
| 5 or more Children | 0 (0.0%) | 0 (0.0%) |
| Total | 10 (100.0%) | 31 (26.1%) |
Income Below Poverty Among Married-Couple vs Single-Parent Households in Fairfield
The poverty data for Fairfield shows that 138 of the married-couple family households (30.7%) and 41 of the single-parent households (31.8%) are living below the poverty level. Within the married-couple family households, those with 1 or 2 children have the highest poverty rate, with 131 households (51.4%) falling below the poverty line. Among the single-parent households, those with 1 or 2 children have the highest poverty rate, with 41 household (38.0%) living below poverty.
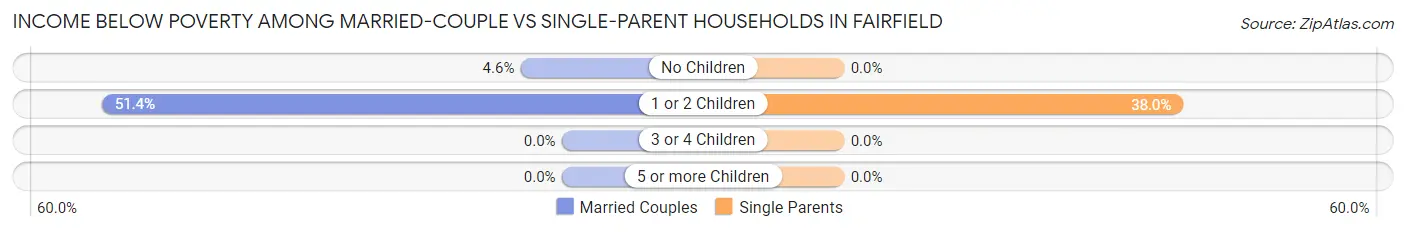
| Children | Married-Couple Families | Single-Parent Households |
| No Children | 7 (4.6%) | 0 (0.0%) |
| 1 or 2 Children | 131 (51.4%) | 41 (38.0%) |
| 3 or 4 Children | 0 (0.0%) | 0 (0.0%) |
| 5 or more Children | 0 (0.0%) | 0 (0.0%) |
| Total | 138 (30.7%) | 41 (31.8%) |
Race in Fairfield
The most populous races in Fairfield are White / Caucasian (2,626 | 99.2%), Native / Alaskan (11 | 0.4%), and Two or more Races (10 | 0.4%).
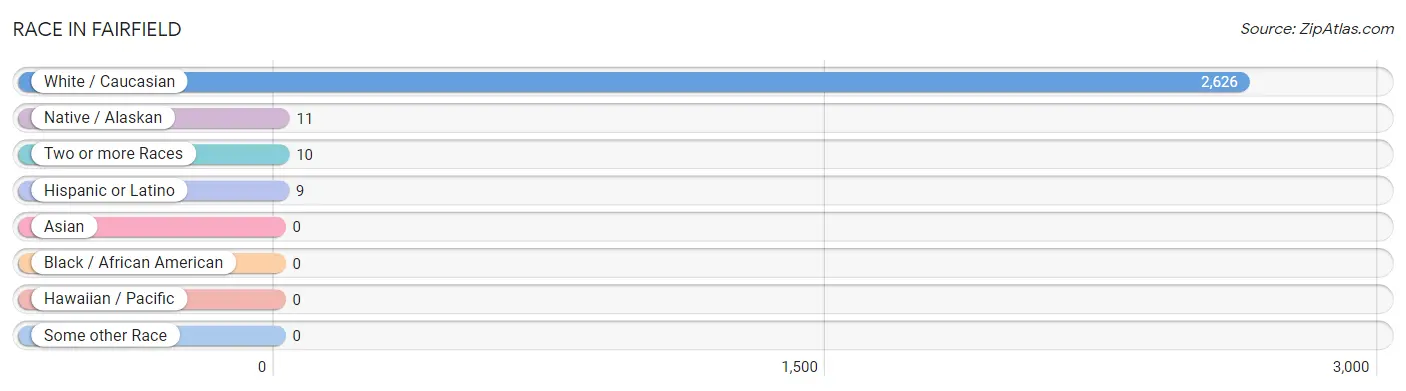
| Race | # Population | % Population |
| Asian | 0 | 0.0% |
| Black / African American | 0 | 0.0% |
| Hawaiian / Pacific | 0 | 0.0% |
| Hispanic or Latino | 9 | 0.3% |
| Native / Alaskan | 11 | 0.4% |
| White / Caucasian | 2,626 | 99.2% |
| Two or more Races | 10 | 0.4% |
| Some other Race | 0 | 0.0% |
| Total | 2,647 | 100.0% |
Ancestry in Fairfield
The most populous ancestries reported in Fairfield are English (549 | 20.7%), Irish (416 | 15.7%), French (393 | 14.8%), Scottish (294 | 11.1%), and French Canadian (290 | 11.0%), together accounting for 73.4% of all Fairfield residents.
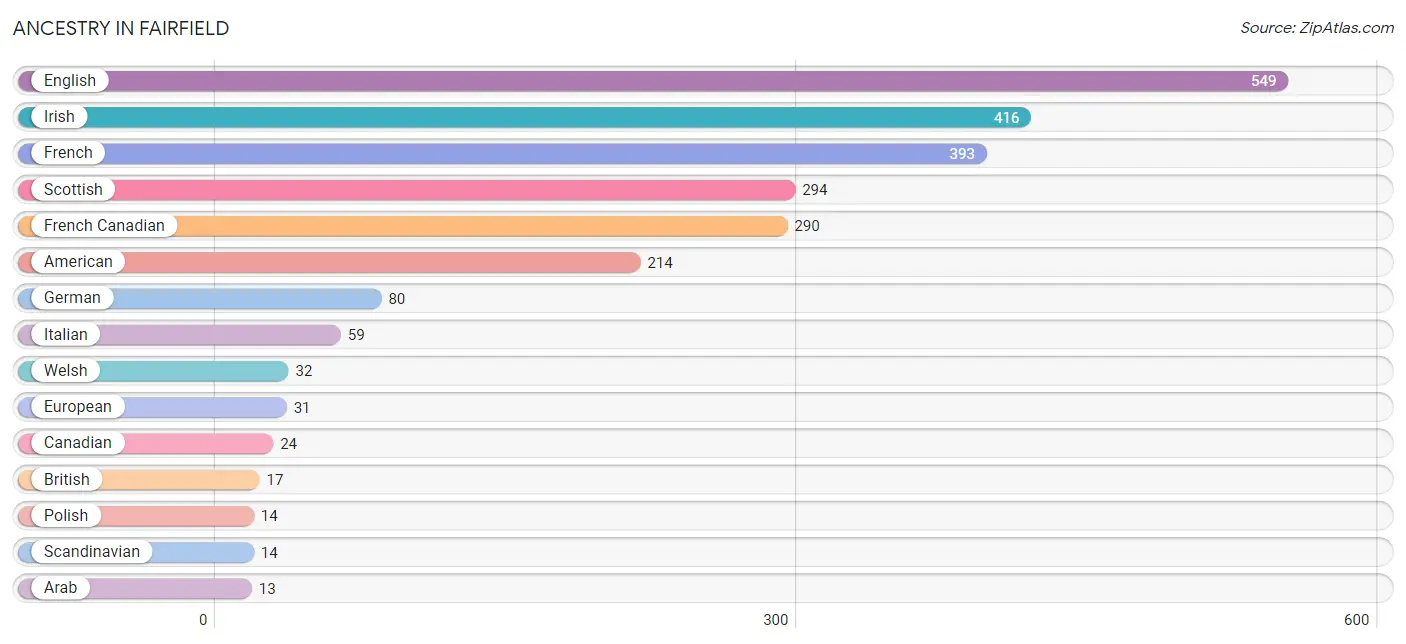
| Ancestry | # Population | % Population |
| American | 214 | 8.1% |
| Arab | 13 | 0.5% |
| British | 17 | 0.6% |
| Canadian | 24 | 0.9% |
| English | 549 | 20.7% |
| European | 31 | 1.2% |
| French | 393 | 14.8% |
| French Canadian | 290 | 11.0% |
| German | 80 | 3.0% |
| Irish | 416 | 15.7% |
| Italian | 59 | 2.2% |
| Polish | 14 | 0.5% |
| Russian | 1 | 0.0% |
| Scandinavian | 14 | 0.5% |
| Scottish | 294 | 11.1% |
| Swedish | 9 | 0.3% |
| Welsh | 32 | 1.2% | View All 17 Rows |
Immigrants in Fairfield

| Immigration Origin | # Population | % Population | View All 0 Rows |
Sex and Age in Fairfield
Sex and Age in Fairfield
The most populous age groups in Fairfield are 25 to 29 Years (151 | 12.4%) for men and 60 to 64 Years (184 | 12.9%) for women.
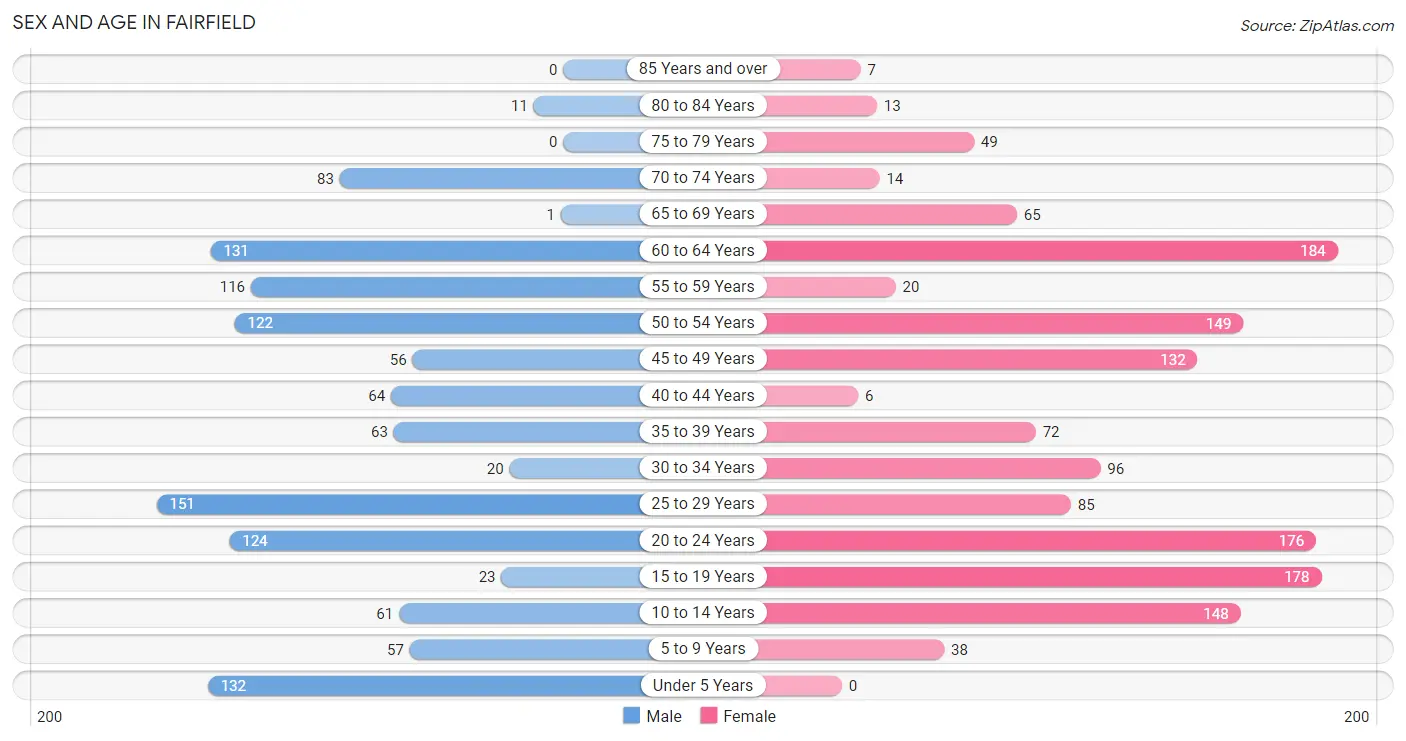
| Age Bracket | Male | Female |
| Under 5 Years | 132 (10.9%) | 0 (0.0%) |
| 5 to 9 Years | 57 (4.7%) | 38 (2.6%) |
| 10 to 14 Years | 61 (5.0%) | 148 (10.3%) |
| 15 to 19 Years | 23 (1.9%) | 178 (12.4%) |
| 20 to 24 Years | 124 (10.2%) | 176 (12.3%) |
| 25 to 29 Years | 151 (12.4%) | 85 (5.9%) |
| 30 to 34 Years | 20 (1.7%) | 96 (6.7%) |
| 35 to 39 Years | 63 (5.2%) | 72 (5.0%) |
| 40 to 44 Years | 64 (5.3%) | 6 (0.4%) |
| 45 to 49 Years | 56 (4.6%) | 132 (9.2%) |
| 50 to 54 Years | 122 (10.0%) | 149 (10.4%) |
| 55 to 59 Years | 116 (9.6%) | 20 (1.4%) |
| 60 to 64 Years | 131 (10.8%) | 184 (12.9%) |
| 65 to 69 Years | 1 (0.1%) | 65 (4.5%) |
| 70 to 74 Years | 83 (6.8%) | 14 (1.0%) |
| 75 to 79 Years | 0 (0.0%) | 49 (3.4%) |
| 80 to 84 Years | 11 (0.9%) | 13 (0.9%) |
| 85 Years and over | 0 (0.0%) | 7 (0.5%) |
| Total | 1,215 (100.0%) | 1,432 (100.0%) |
Families and Households in Fairfield
Median Family Size in Fairfield
The median family size in Fairfield is 3.02 persons per family, with married-couple families (449 | 77.7%) accounting for the largest median family size of 3.19 persons per family. On the other hand, single male/father families (10 | 1.7%) represent the smallest median family size with 1.90 persons per family.
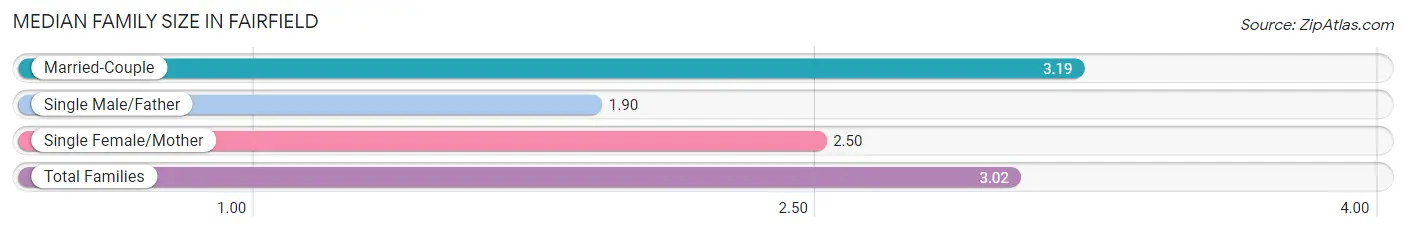
| Family Type | # Families | Family Size |
| Married-Couple | 449 (77.7%) | 3.19 |
| Single Male/Father | 10 (1.7%) | 1.90 |
| Single Female/Mother | 119 (20.6%) | 2.50 |
| Total Families | 578 (100.0%) | 3.02 |
Median Household Size in Fairfield
The median household size in Fairfield is 2.18 persons per household, with single male/father households (10 | 0.8%) accounting for the largest median household size of 5.1 persons per household. non-family households (635 | 52.3%) represent the smallest median household size with 1.24 persons per household.
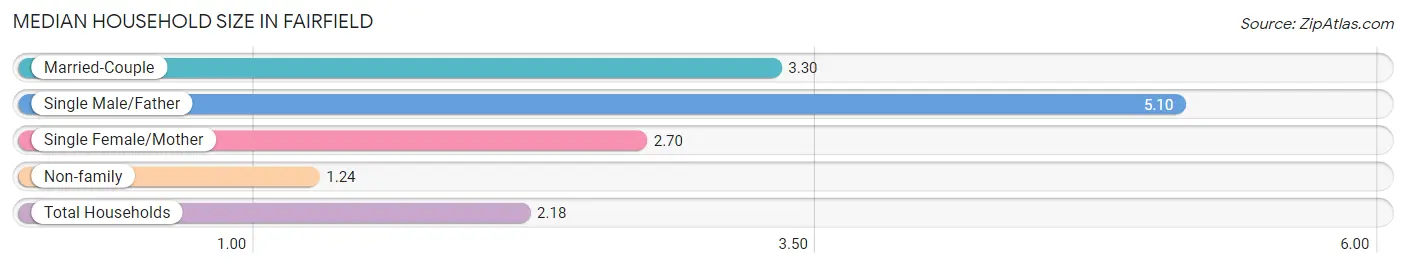
| Household Type | # Households | Household Size |
| Married-Couple | 449 (37.0%) | 3.30 |
| Single Male/Father | 10 (0.8%) | 5.10 |
| Single Female/Mother | 119 (9.8%) | 2.70 |
| Non-family | 635 (52.3%) | 1.24 |
| Total Households | 1,213 (100.0%) | 2.18 |
Household Size by Marriage Status in Fairfield
Out of a total of 1,213 households in Fairfield, 578 (47.6%) are family households, while 635 (52.3%) are nonfamily households. The most numerous type of family households are 3-person households, comprising 417, and the most common type of nonfamily households are 1-person households, comprising 502.
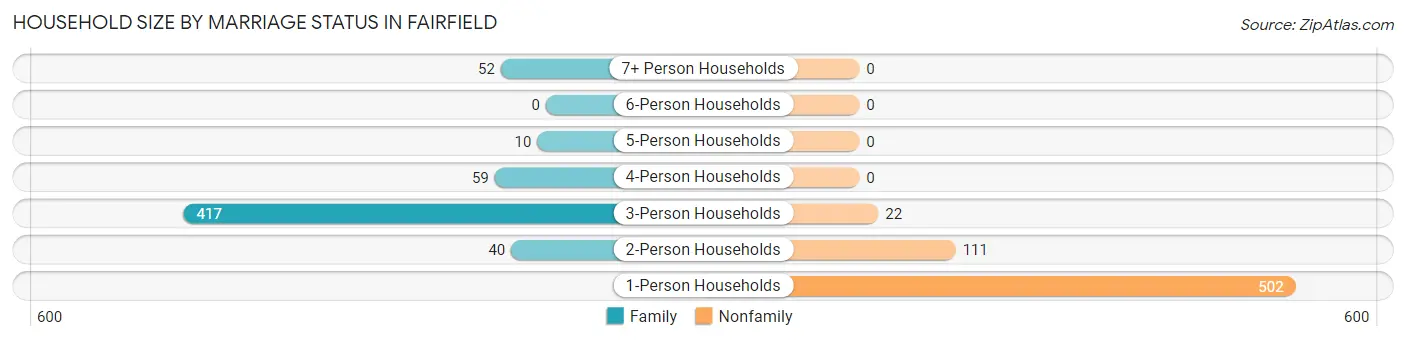
| Household Size | Family Households | Nonfamily Households |
| 1-Person Households | - | 502 (41.4%) |
| 2-Person Households | 40 (3.3%) | 111 (9.1%) |
| 3-Person Households | 417 (34.4%) | 22 (1.8%) |
| 4-Person Households | 59 (4.9%) | 0 (0.0%) |
| 5-Person Households | 10 (0.8%) | 0 (0.0%) |
| 6-Person Households | 0 (0.0%) | 0 (0.0%) |
| 7+ Person Households | 52 (4.3%) | 0 (0.0%) |
| Total | 578 (47.6%) | 635 (52.3%) |
Female Fertility in Fairfield
Fertility by Age in Fairfield
Average fertility rate in Fairfield is 22.0 births per 1,000 women. Women in the age bracket of 35 to 50 years have the highest fertility rate with 31.0 births per 1,000 women. Women in the age bracket of 20 to 34 years acount for 58.8% of all women with births.
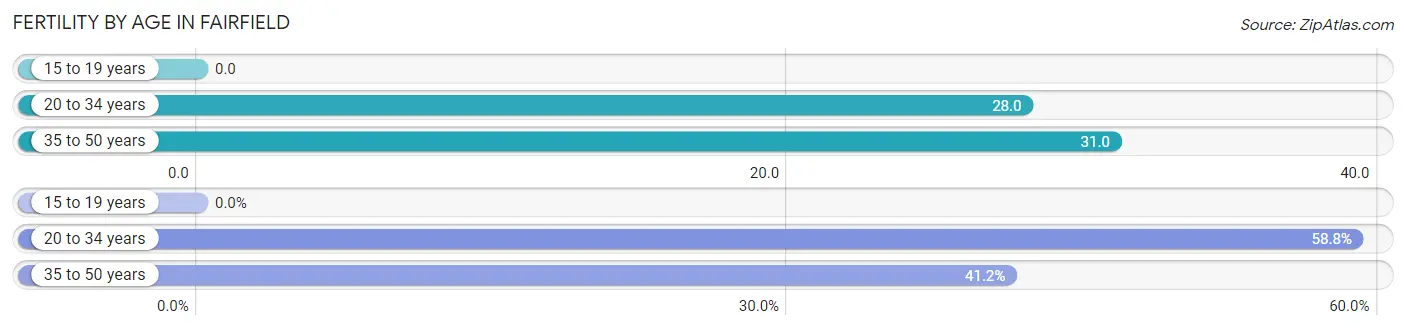
| Age Bracket | Women with Births | Births / 1,000 Women |
| 15 to 19 years | 0 (0.0%) | 0.0 |
| 20 to 34 years | 10 (58.8%) | 28.0 |
| 35 to 50 years | 7 (41.2%) | 31.0 |
| Total | 17 (100.0%) | 22.0 |
Fertility by Age by Marriage Status in Fairfield
41.2% of women with births (17) in Fairfield are married. The highest percentage of unmarried women with births falls into 20 to 34 years age bracket with 100.0% of them unmarried at the time of birth, while the lowest percentage of unmarried women with births belong to 35 to 50 years age bracket with 0.0% of them unmarried.
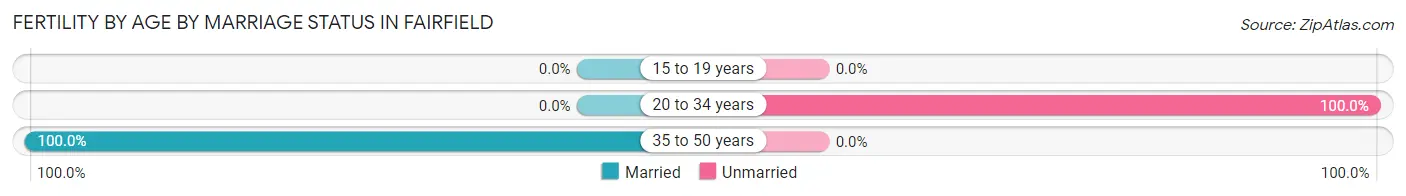
| Age Bracket | Married | Unmarried |
| 15 to 19 years | 0 (0.0%) | 0 (0.0%) |
| 20 to 34 years | 0 (0.0%) | 10 (100.0%) |
| 35 to 50 years | 7 (100.0%) | 0 (0.0%) |
| Total | 7 (41.2%) | 10 (58.8%) |
Fertility by Education in Fairfield
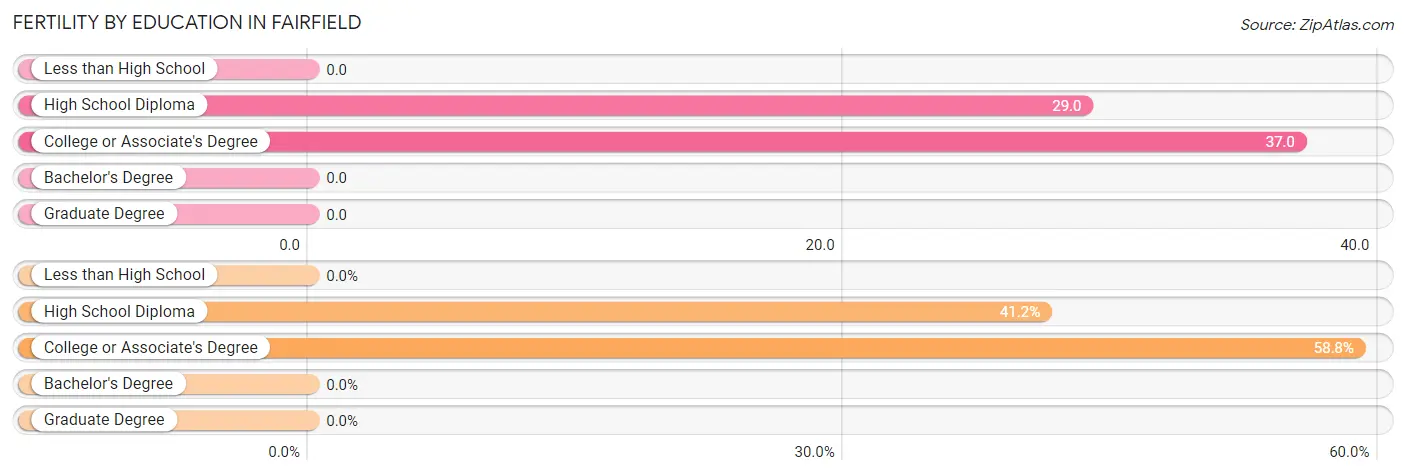
| Educational Attainment | Women with Births | Births / 1,000 Women |
| Less than High School | 0 (0.0%) | 0.0 |
| High School Diploma | 7 (41.2%) | 29.0 |
| College or Associate's Degree | 10 (58.8%) | 37.0 |
| Bachelor's Degree | 0 (0.0%) | 0.0 |
| Graduate Degree | 0 (0.0%) | 0.0 |
| Total | 17 (100.0%) | 22.0 |
Fertility by Education by Marriage Status in Fairfield
58.8% of women with births in Fairfield are unmarried. Women with the educational attainment of high school diploma are most likely to be married with 100.0% of them married at childbirth, while women with the educational attainment of college or associate's degree are least likely to be married with 100.0% of them unmarried at childbirth.
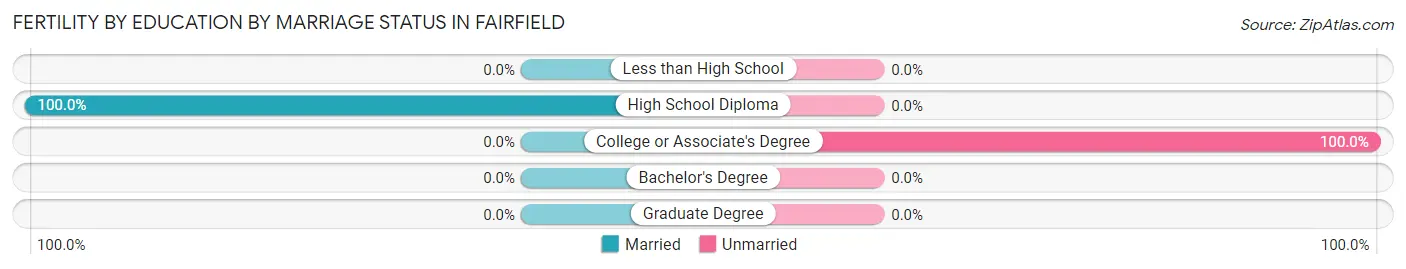
| Educational Attainment | Married | Unmarried |
| Less than High School | 0 (0.0%) | 0 (0.0%) |
| High School Diploma | 7 (100.0%) | 0 (0.0%) |
| College or Associate's Degree | 0 (0.0%) | 10 (100.0%) |
| Bachelor's Degree | 0 (0.0%) | 0 (0.0%) |
| Graduate Degree | 0 (0.0%) | 0 (0.0%) |
| Total | 7 (41.2%) | 10 (58.8%) |
Employment Characteristics in Fairfield
Employment by Class of Employer in Fairfield
Among the 1,297 employed individuals in Fairfield, private company employees (836 | 64.5%), not-for-profit organizations (327 | 25.2%), and self-employed (not incorporated) (113 | 8.7%) make up the most common classes of employment.
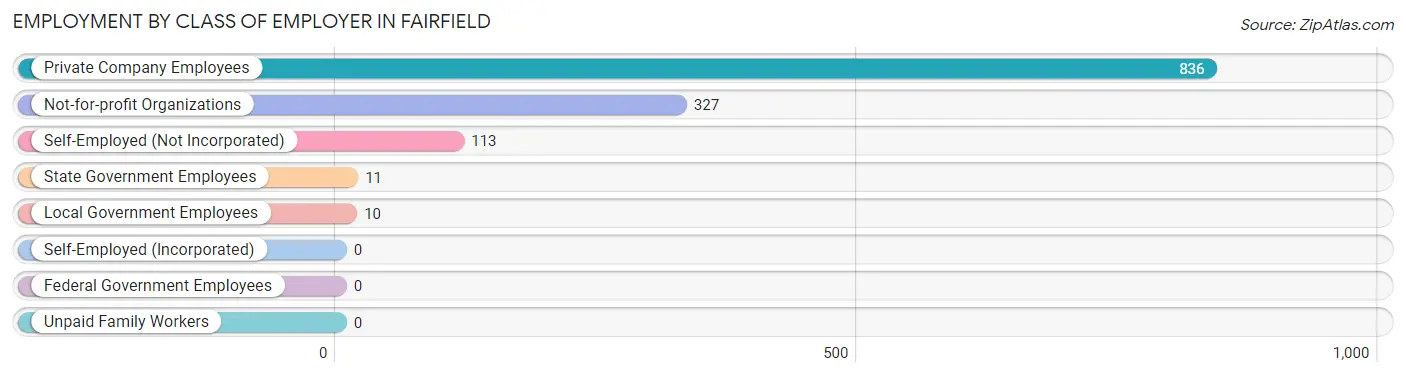
| Employer Class | # Employees | % Employees |
| Private Company Employees | 836 | 64.5% |
| Self-Employed (Incorporated) | 0 | 0.0% |
| Self-Employed (Not Incorporated) | 113 | 8.7% |
| Not-for-profit Organizations | 327 | 25.2% |
| Local Government Employees | 10 | 0.8% |
| State Government Employees | 11 | 0.9% |
| Federal Government Employees | 0 | 0.0% |
| Unpaid Family Workers | 0 | 0.0% |
| Total | 1,297 | 100.0% |
Employment Status by Age in Fairfield
According to the labor force statistics for Fairfield, out of the total population over 16 years of age (2,141), 67.5% or 1,445 individuals are in the labor force, with 4.6% or 66 of them unemployed. The age group with the highest labor force participation rate is 30 to 34 years, with 100.0% or 116 individuals in the labor force. Within the labor force, the 60 to 64 years age range has the highest percentage of unemployed individuals, with 38.6% or 49 of them being unemployed.
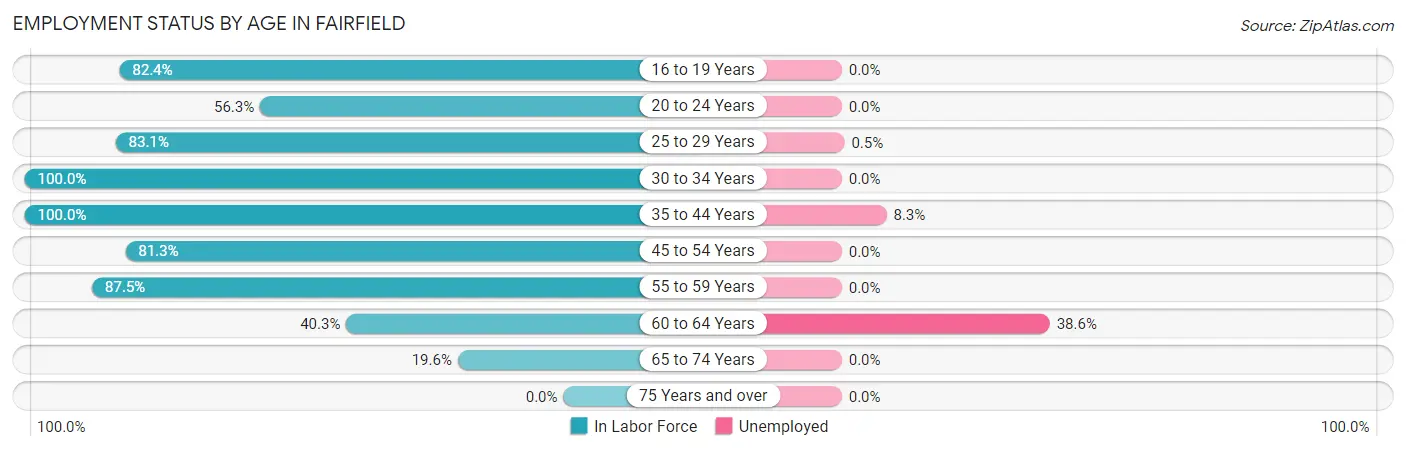
| Age Bracket | In Labor Force | Unemployed |
| 16 to 19 Years | 108 (82.4%) | 0 (0.0%) |
| 20 to 24 Years | 169 (56.3%) | 0 (0.0%) |
| 25 to 29 Years | 196 (83.1%) | 1 (0.5%) |
| 30 to 34 Years | 116 (100.0%) | 0 (0.0%) |
| 35 to 44 Years | 205 (100.0%) | 17 (8.3%) |
| 45 to 54 Years | 373 (81.3%) | 0 (0.0%) |
| 55 to 59 Years | 119 (87.5%) | 0 (0.0%) |
| 60 to 64 Years | 127 (40.3%) | 49 (38.6%) |
| 65 to 74 Years | 32 (19.6%) | 0 (0.0%) |
| 75 Years and over | 0 (0.0%) | 0 (0.0%) |
| Total | 1,445 (67.5%) | 66 (4.6%) |
Employment Status by Educational Attainment in Fairfield
According to labor force statistics for Fairfield, 77.4% of individuals (1,135) out of the total population between 25 and 64 years of age (1,467) are in the labor force, with 5.9% or 67 of them being unemployed. The group with the highest labor force participation rate are those with the educational attainment of less than high school, with 100.0% or 87 individuals in the labor force. Within the labor force, individuals with less than high school education have the highest percentage of unemployment, with 56.3% or 49 of them being unemployed.
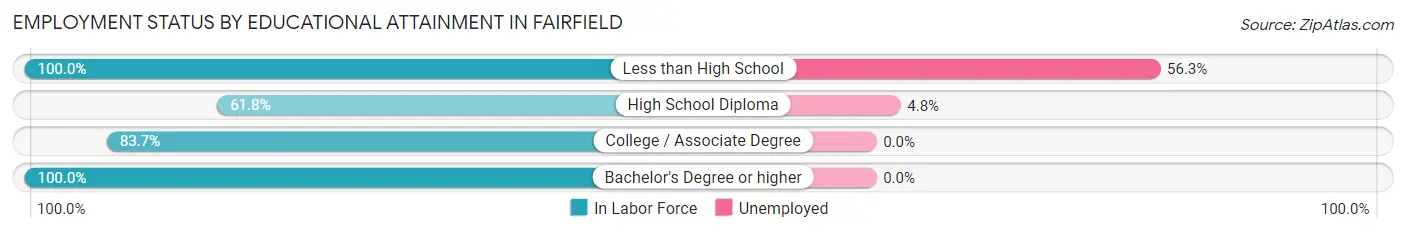
| Educational Attainment | In Labor Force | Unemployed |
| Less than High School | 87 (100.0%) | 49 (56.3%) |
| High School Diploma | 375 (61.8%) | 29 (4.8%) |
| College / Associate Degree | 510 (83.7%) | 0 (0.0%) |
| Bachelor's Degree or higher | 164 (100.0%) | 0 (0.0%) |
| Total | 1,135 (77.4%) | 87 (5.9%) |
Employment Occupations by Sex in Fairfield
Management, Business, Science and Arts Occupations
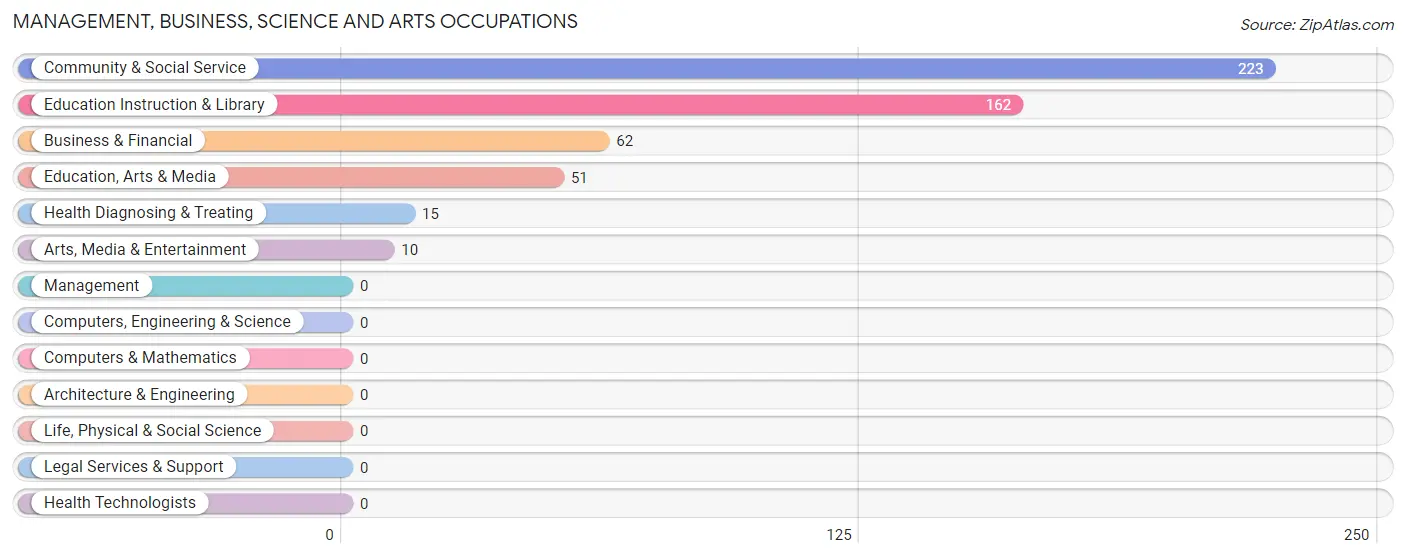
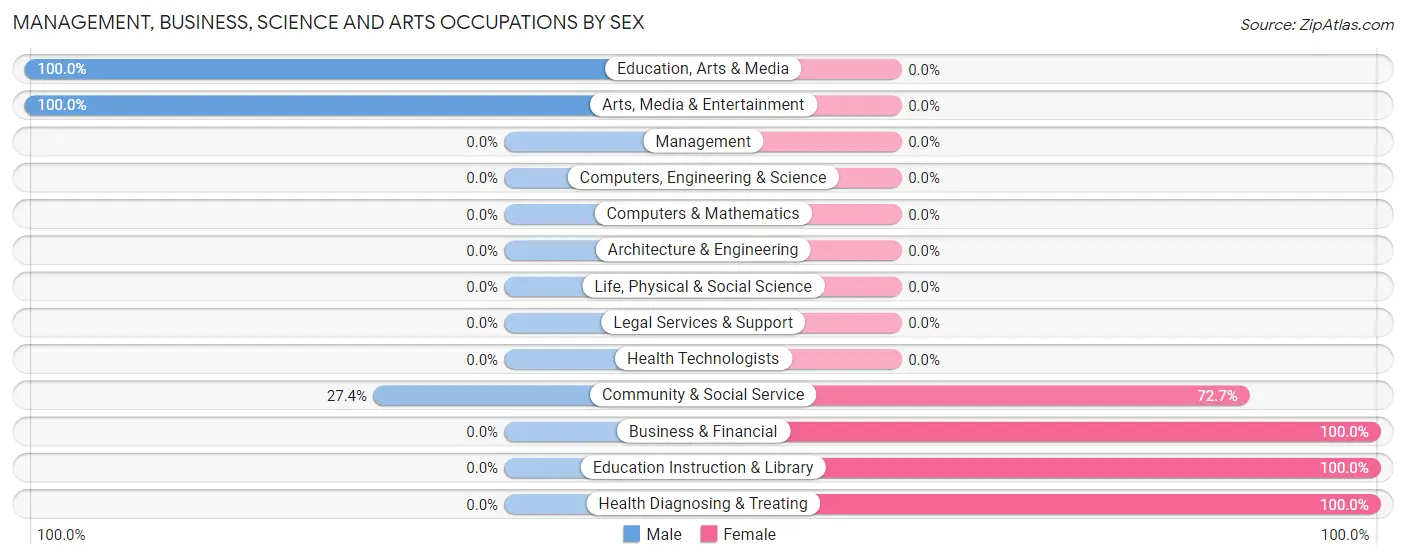
The most common Management, Business, Science and Arts occupations in Fairfield are Community & Social Service (223 | 16.2%), Education Instruction & Library (162 | 11.8%), Business & Financial (62 | 4.5%), Education, Arts & Media (51 | 3.7%), and Health Diagnosing & Treating (15 | 1.1%).
Management, Business, Science and Arts Occupations by Sex
Within the Management, Business, Science and Arts occupations in Fairfield, the most male-oriented occupations are Education, Arts & Media (100.0%), Arts, Media & Entertainment (100.0%), and Community & Social Service (27.4%), while the most female-oriented occupations are Business & Financial (100.0%), Education Instruction & Library (100.0%), and Health Diagnosing & Treating (100.0%).
| Occupation | Male | Female |
| Management | 0 (0.0%) | 0 (0.0%) |
| Business & Financial | 0 (0.0%) | 62 (100.0%) |
| Computers, Engineering & Science | 0 (0.0%) | 0 (0.0%) |
| Computers & Mathematics | 0 (0.0%) | 0 (0.0%) |
| Architecture & Engineering | 0 (0.0%) | 0 (0.0%) |
| Life, Physical & Social Science | 0 (0.0%) | 0 (0.0%) |
| Community & Social Service | 61 (27.4%) | 162 (72.7%) |
| Education, Arts & Media | 51 (100.0%) | 0 (0.0%) |
| Legal Services & Support | 0 (0.0%) | 0 (0.0%) |
| Education Instruction & Library | 0 (0.0%) | 162 (100.0%) |
| Arts, Media & Entertainment | 10 (100.0%) | 0 (0.0%) |
| Health Diagnosing & Treating | 0 (0.0%) | 15 (100.0%) |
| Health Technologists | 0 (0.0%) | 0 (0.0%) |
| Total (Category) | 61 (20.3%) | 239 (79.7%) |
| Total (Overall) | 674 (48.9%) | 704 (51.1%) |
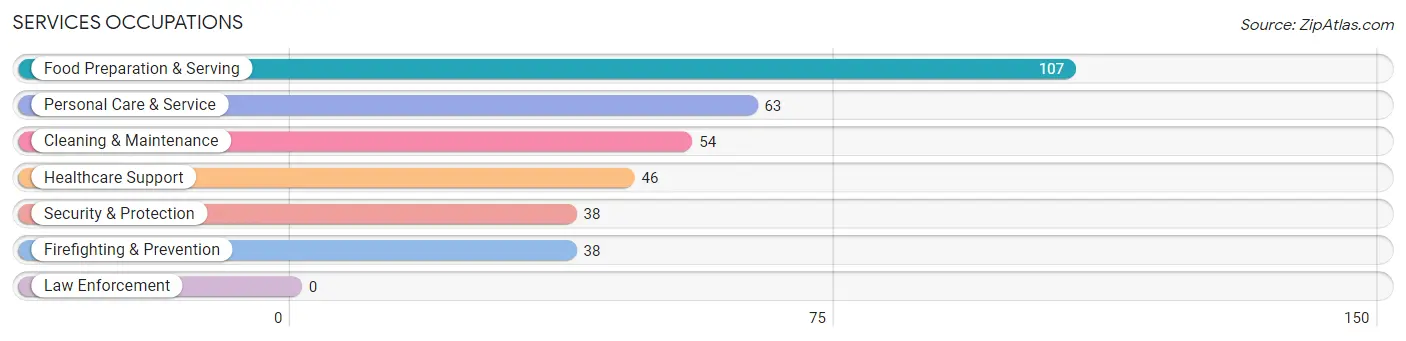
Services Occupations
The most common Services occupations in Fairfield are Food Preparation & Serving (107 | 7.8%), Personal Care & Service (63 | 4.6%), Cleaning & Maintenance (54 | 3.9%), Healthcare Support (46 | 3.3%), and Security & Protection (38 | 2.8%).
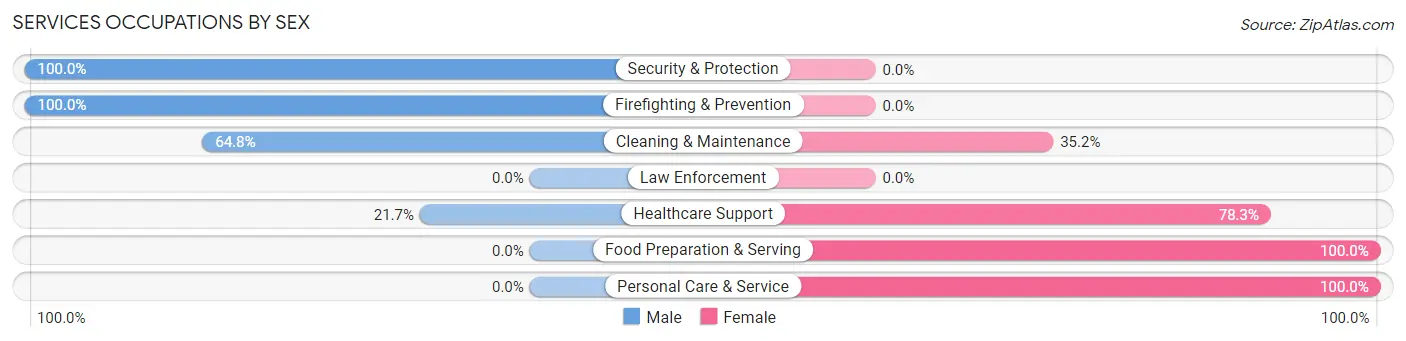
Services Occupations by Sex
Within the Services occupations in Fairfield, the most male-oriented occupations are Security & Protection (100.0%), Firefighting & Prevention (100.0%), and Cleaning & Maintenance (64.8%), while the most female-oriented occupations are Food Preparation & Serving (100.0%), Personal Care & Service (100.0%), and Healthcare Support (78.3%).
| Occupation | Male | Female |
| Healthcare Support | 10 (21.7%) | 36 (78.3%) |
| Security & Protection | 38 (100.0%) | 0 (0.0%) |
| Firefighting & Prevention | 38 (100.0%) | 0 (0.0%) |
| Law Enforcement | 0 (0.0%) | 0 (0.0%) |
| Food Preparation & Serving | 0 (0.0%) | 107 (100.0%) |
| Cleaning & Maintenance | 35 (64.8%) | 19 (35.2%) |
| Personal Care & Service | 0 (0.0%) | 63 (100.0%) |
| Total (Category) | 83 (27.0%) | 225 (73.1%) |
| Total (Overall) | 674 (48.9%) | 704 (51.1%) |
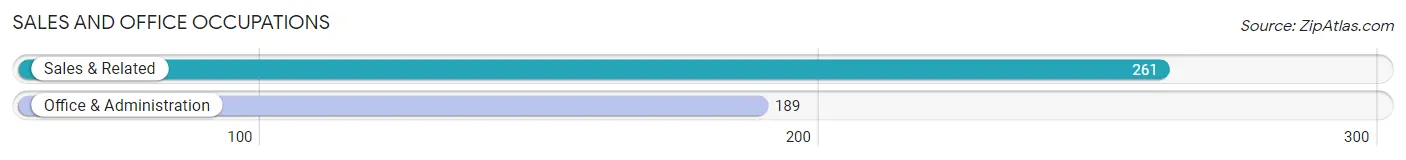
Sales and Office Occupations
The most common Sales and Office occupations in Fairfield are Sales & Related (261 | 18.9%), and Office & Administration (189 | 13.7%).
Sales and Office Occupations by Sex
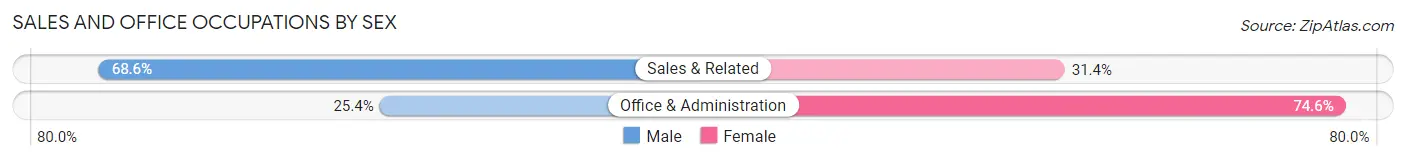
| Occupation | Male | Female |
| Sales & Related | 179 (68.6%) | 82 (31.4%) |
| Office & Administration | 48 (25.4%) | 141 (74.6%) |
| Total (Category) | 227 (50.4%) | 223 (49.6%) |
| Total (Overall) | 674 (48.9%) | 704 (51.1%) |
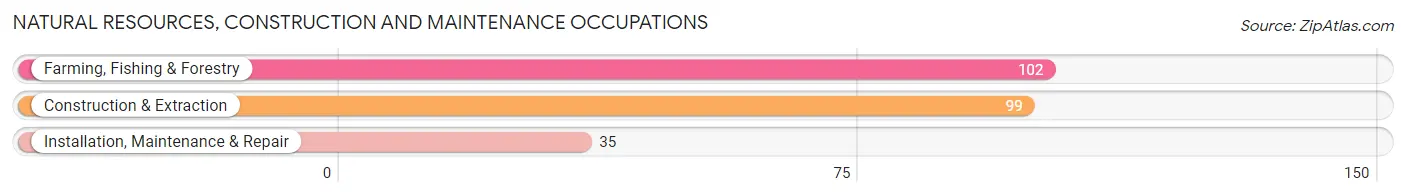
Natural Resources, Construction and Maintenance Occupations
The most common Natural Resources, Construction and Maintenance occupations in Fairfield are Farming, Fishing & Forestry (102 | 7.4%), Construction & Extraction (99 | 7.2%), and Installation, Maintenance & Repair (35 | 2.5%).
Natural Resources, Construction and Maintenance Occupations by Sex
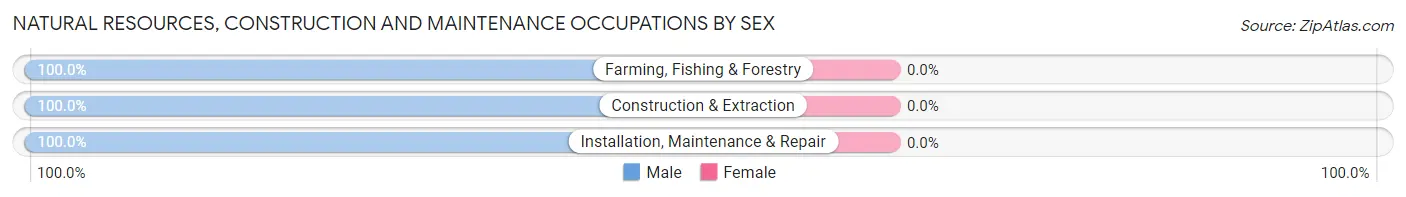
| Occupation | Male | Female |
| Farming, Fishing & Forestry | 102 (100.0%) | 0 (0.0%) |
| Construction & Extraction | 99 (100.0%) | 0 (0.0%) |
| Installation, Maintenance & Repair | 35 (100.0%) | 0 (0.0%) |
| Total (Category) | 236 (100.0%) | 0 (0.0%) |
| Total (Overall) | 674 (48.9%) | 704 (51.1%) |
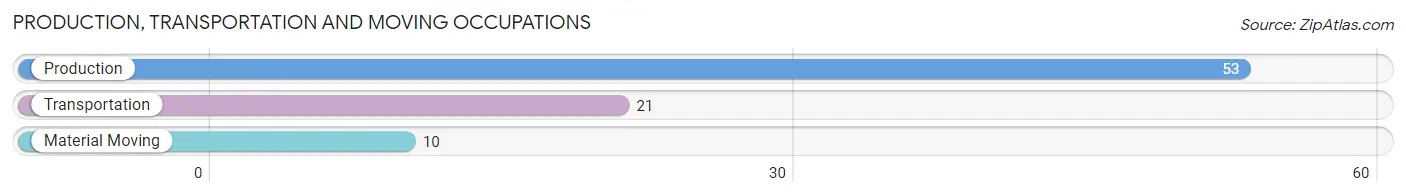
Production, Transportation and Moving Occupations
The most common Production, Transportation and Moving occupations in Fairfield are Production (53 | 3.8%), Transportation (21 | 1.5%), and Material Moving (10 | 0.7%).
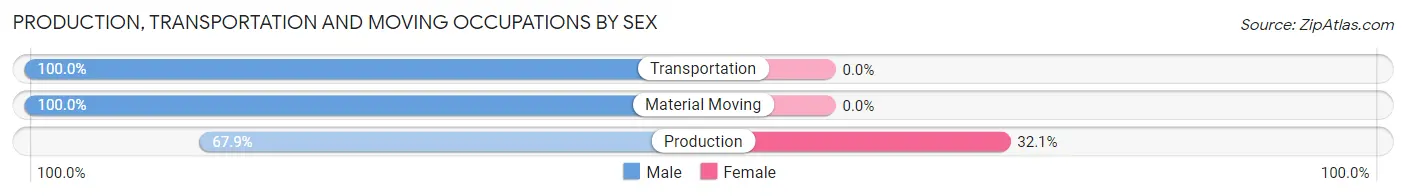
Production, Transportation and Moving Occupations by Sex
| Occupation | Male | Female |
| Production | 36 (67.9%) | 17 (32.1%) |
| Transportation | 21 (100.0%) | 0 (0.0%) |
| Material Moving | 10 (100.0%) | 0 (0.0%) |
| Total (Category) | 67 (79.8%) | 17 (20.2%) |
| Total (Overall) | 674 (48.9%) | 704 (51.1%) |
Employment Industries by Sex in Fairfield
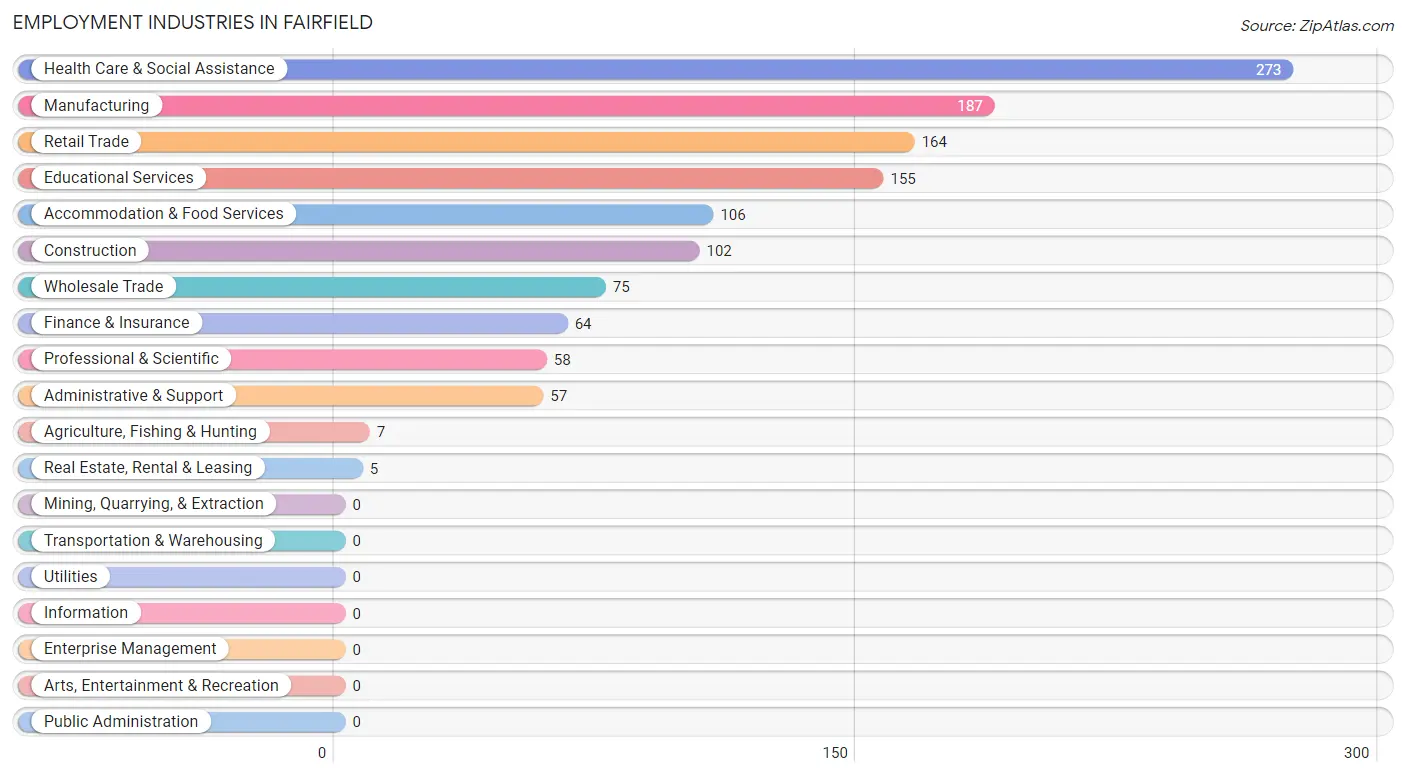
Employment Industries in Fairfield
The major employment industries in Fairfield include Health Care & Social Assistance (273 | 19.8%), Manufacturing (187 | 13.6%), Retail Trade (164 | 11.9%), Educational Services (155 | 11.3%), and Accommodation & Food Services (106 | 7.7%).
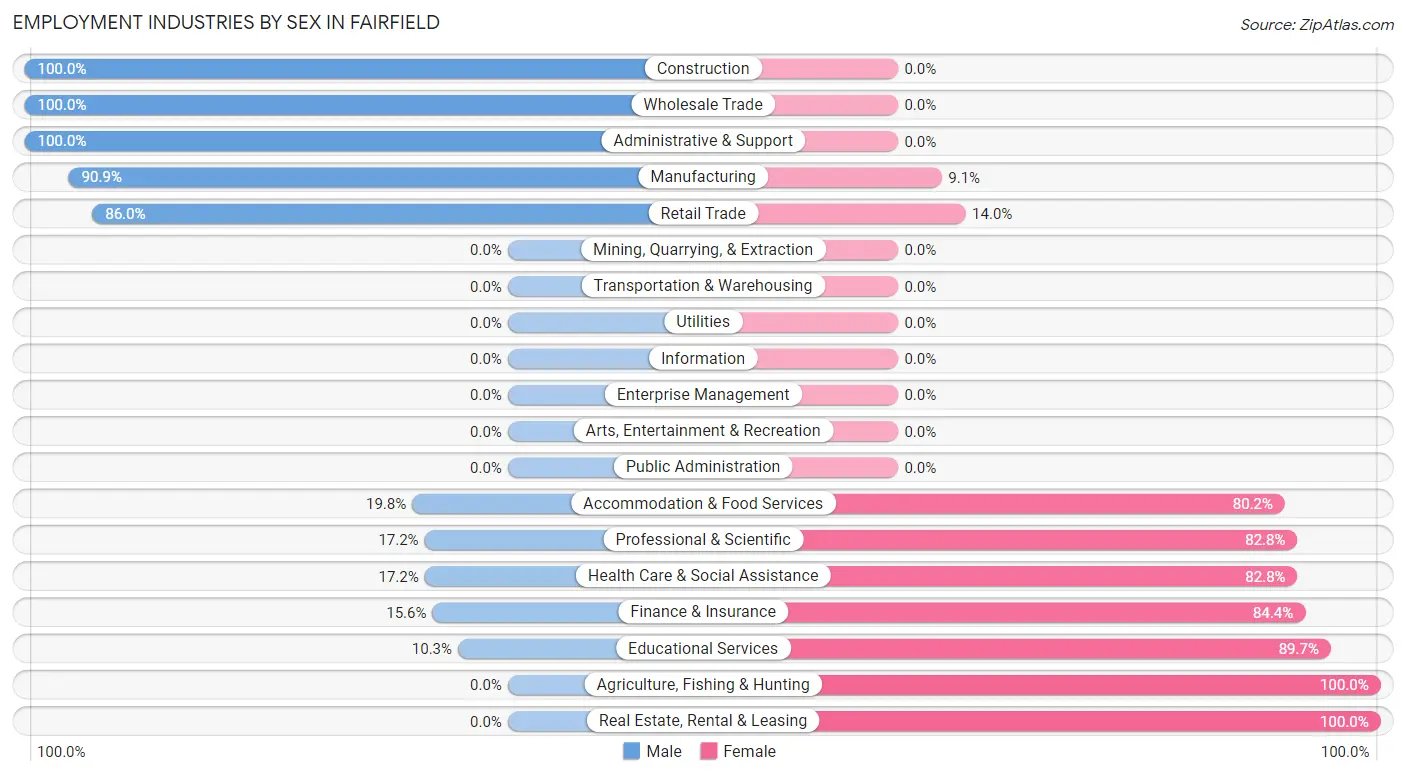
Employment Industries by Sex in Fairfield
The Fairfield industries that see more men than women are Construction (100.0%), Wholesale Trade (100.0%), and Administrative & Support (100.0%), whereas the industries that tend to have a higher number of women are Agriculture, Fishing & Hunting (100.0%), Real Estate, Rental & Leasing (100.0%), and Educational Services (89.7%).
| Industry | Male | Female |
| Agriculture, Fishing & Hunting | 0 (0.0%) | 7 (100.0%) |
| Mining, Quarrying, & Extraction | 0 (0.0%) | 0 (0.0%) |
| Construction | 102 (100.0%) | 0 (0.0%) |
| Manufacturing | 170 (90.9%) | 17 (9.1%) |
| Wholesale Trade | 75 (100.0%) | 0 (0.0%) |
| Retail Trade | 141 (86.0%) | 23 (14.0%) |
| Transportation & Warehousing | 0 (0.0%) | 0 (0.0%) |
| Utilities | 0 (0.0%) | 0 (0.0%) |
| Information | 0 (0.0%) | 0 (0.0%) |
| Finance & Insurance | 10 (15.6%) | 54 (84.4%) |
| Real Estate, Rental & Leasing | 0 (0.0%) | 5 (100.0%) |
| Professional & Scientific | 10 (17.2%) | 48 (82.8%) |
| Enterprise Management | 0 (0.0%) | 0 (0.0%) |
| Administrative & Support | 57 (100.0%) | 0 (0.0%) |
| Educational Services | 16 (10.3%) | 139 (89.7%) |
| Health Care & Social Assistance | 47 (17.2%) | 226 (82.8%) |
| Arts, Entertainment & Recreation | 0 (0.0%) | 0 (0.0%) |
| Accommodation & Food Services | 21 (19.8%) | 85 (80.2%) |
| Public Administration | 0 (0.0%) | 0 (0.0%) |
| Total | 674 (48.9%) | 704 (51.1%) |
Education in Fairfield
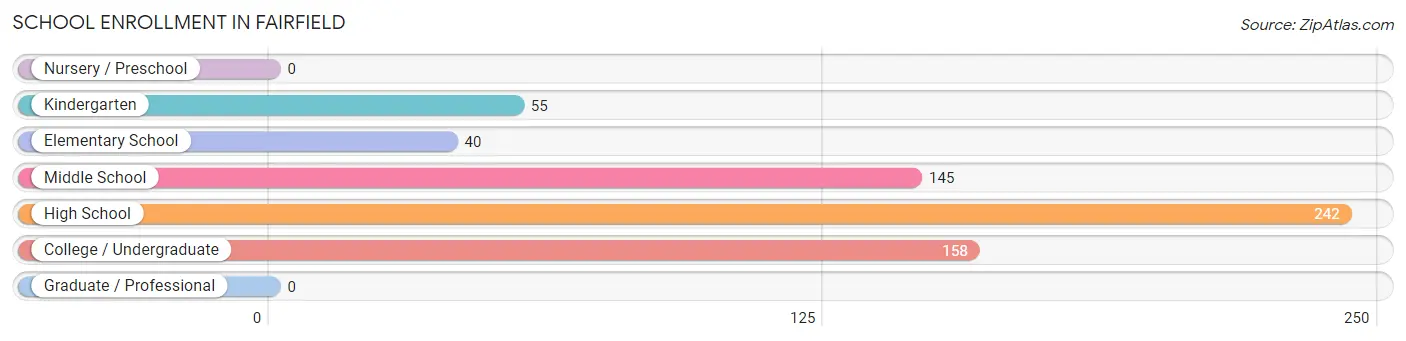
School Enrollment in Fairfield
The most common levels of schooling among the 640 students in Fairfield are high school (242 | 37.8%), college / undergraduate (158 | 24.7%), and middle school (145 | 22.7%).
| School Level | # Students | % Students |
| Nursery / Preschool | 0 | 0.0% |
| Kindergarten | 55 | 8.6% |
| Elementary School | 40 | 6.2% |
| Middle School | 145 | 22.7% |
| High School | 242 | 37.8% |
| College / Undergraduate | 158 | 24.7% |
| Graduate / Professional | 0 | 0.0% |
| Total | 640 | 100.0% |
School Enrollment by Age by Funding Source in Fairfield
Out of a total of 640 students who are enrolled in schools in Fairfield, 102 (15.9%) attend a private institution, while the remaining 538 (84.1%) are enrolled in public schools. The age group of 20 to 24 year olds has the highest likelihood of being enrolled in private schools, with 22 (57.9% in the age bracket) enrolled. Conversely, the age group of 5 to 9 year old has the lowest likelihood of being enrolled in a private school, with 95 (100.0% in the age bracket) attending a public institution.
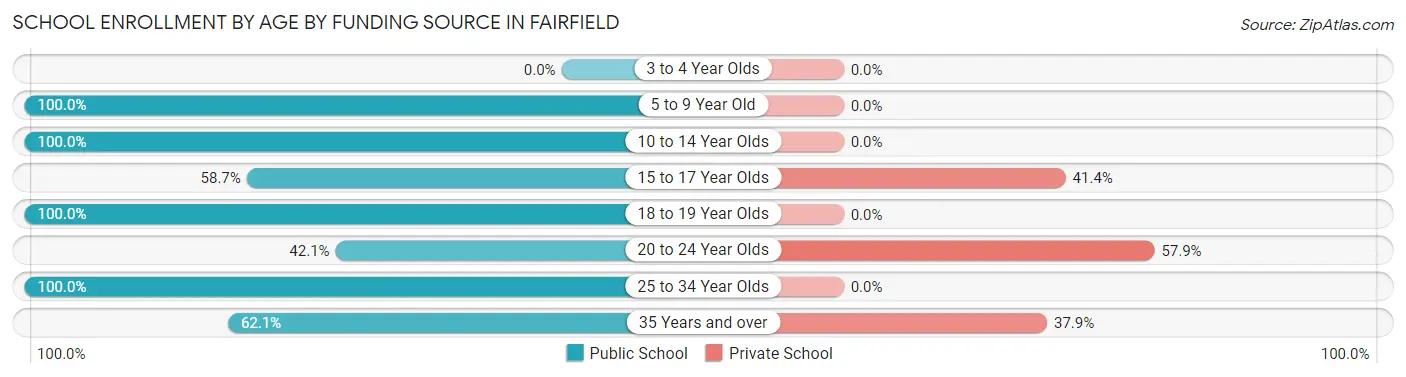
| Age Bracket | Public School | Private School |
| 3 to 4 Year Olds | 0 (0.0%) | 0 (0.0%) |
| 5 to 9 Year Old | 95 (100.0%) | 0 (0.0%) |
| 10 to 14 Year Olds | 209 (100.0%) | 0 (0.0%) |
| 15 to 17 Year Olds | 78 (58.7%) | 55 (41.3%) |
| 18 to 19 Year Olds | 68 (100.0%) | 0 (0.0%) |
| 20 to 24 Year Olds | 16 (42.1%) | 22 (57.9%) |
| 25 to 34 Year Olds | 31 (100.0%) | 0 (0.0%) |
| 35 Years and over | 41 (62.1%) | 25 (37.9%) |
| Total | 538 (84.1%) | 102 (15.9%) |
Educational Attainment by Field of Study in Fairfield
Liberal arts & history (75 | 42.4%), bio, nature & agricultural (37 | 20.9%), multidisciplinary studies (25 | 14.1%), education (24 | 13.6%), and engineering (11 | 6.2%) are the most common fields of study among 177 individuals in Fairfield who have obtained a bachelor's degree or higher.
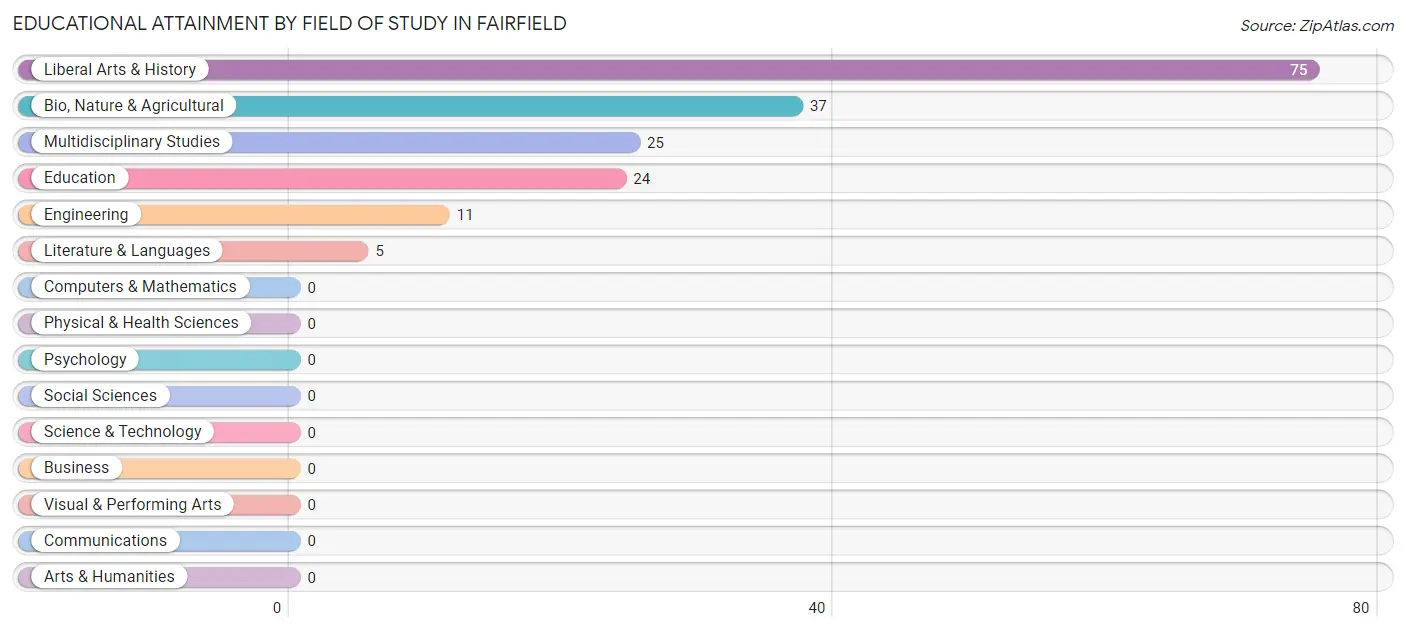
| Field of Study | # Graduates | % Graduates |
| Computers & Mathematics | 0 | 0.0% |
| Bio, Nature & Agricultural | 37 | 20.9% |
| Physical & Health Sciences | 0 | 0.0% |
| Psychology | 0 | 0.0% |
| Social Sciences | 0 | 0.0% |
| Engineering | 11 | 6.2% |
| Multidisciplinary Studies | 25 | 14.1% |
| Science & Technology | 0 | 0.0% |
| Business | 0 | 0.0% |
| Education | 24 | 13.6% |
| Literature & Languages | 5 | 2.8% |
| Liberal Arts & History | 75 | 42.4% |
| Visual & Performing Arts | 0 | 0.0% |
| Communications | 0 | 0.0% |
| Arts & Humanities | 0 | 0.0% |
| Total | 177 | 100.0% |
Transportation & Commute in Fairfield
Vehicle Availability by Sex in Fairfield
The most prevalent vehicle ownership categories in Fairfield are males with 1 vehicle (222, accounting for 34.8%) and females with 1 vehicle (165, making up 33.6%).
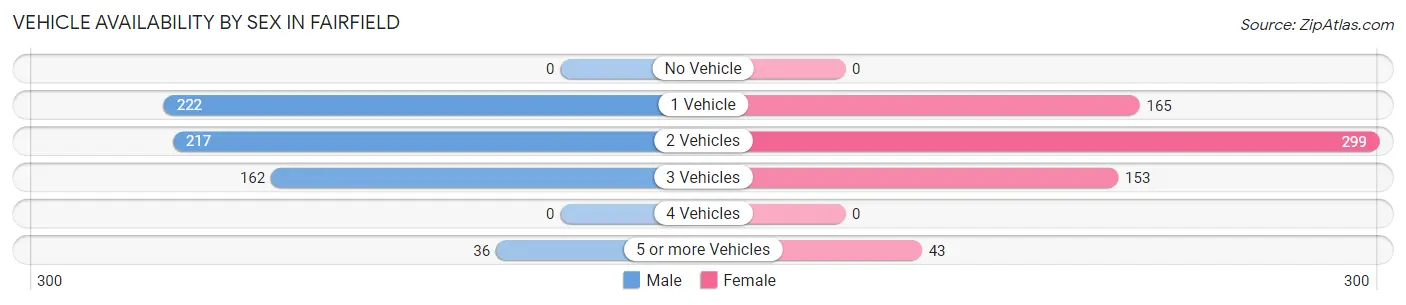
| Vehicles Available | Male | Female |
| No Vehicle | 0 (0.0%) | 0 (0.0%) |
| 1 Vehicle | 222 (34.8%) | 165 (25.0%) |
| 2 Vehicles | 217 (34.1%) | 299 (45.3%) |
| 3 Vehicles | 162 (25.4%) | 153 (23.2%) |
| 4 Vehicles | 0 (0.0%) | 0 (0.0%) |
| 5 or more Vehicles | 36 (5.7%) | 43 (6.5%) |
| Total | 637 (100.0%) | 660 (100.0%) |
Commute Time in Fairfield
The most frequently occuring commute durations in Fairfield are 5 to 9 minutes (344 commuters, 28.8%), 15 to 19 minutes (276 commuters, 23.1%), and 10 to 14 minutes (190 commuters, 15.9%).
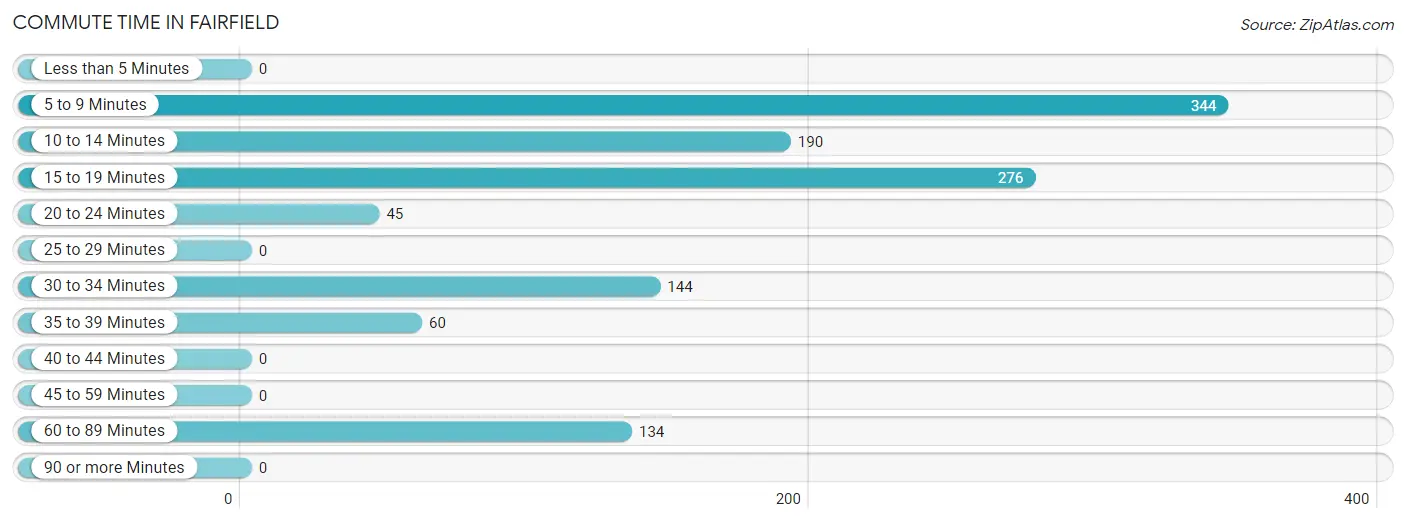
| Commute Time | # Commuters | % Commuters |
| Less than 5 Minutes | 0 | 0.0% |
| 5 to 9 Minutes | 344 | 28.8% |
| 10 to 14 Minutes | 190 | 15.9% |
| 15 to 19 Minutes | 276 | 23.1% |
| 20 to 24 Minutes | 45 | 3.8% |
| 25 to 29 Minutes | 0 | 0.0% |
| 30 to 34 Minutes | 144 | 12.1% |
| 35 to 39 Minutes | 60 | 5.0% |
| 40 to 44 Minutes | 0 | 0.0% |
| 45 to 59 Minutes | 0 | 0.0% |
| 60 to 89 Minutes | 134 | 11.2% |
| 90 or more Minutes | 0 | 0.0% |
Commute Time by Sex in Fairfield
The most common commute times in Fairfield are 15 to 19 minutes (181 commuters, 28.4%) for males and 5 to 9 minutes (222 commuters, 39.9%) for females.
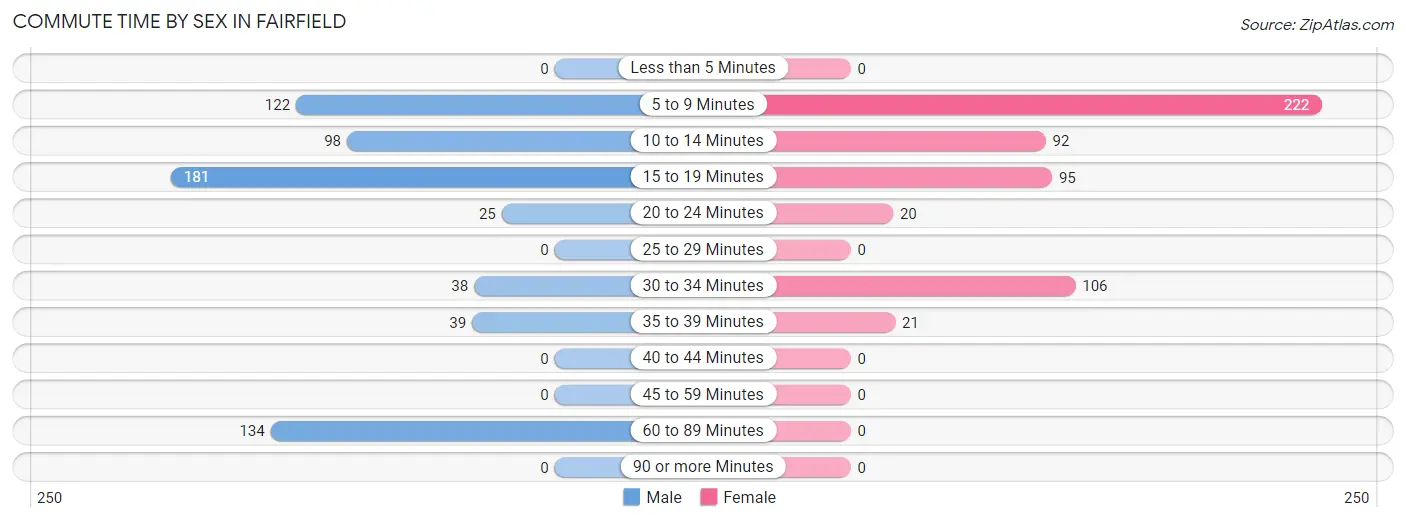
| Commute Time | Male | Female |
| Less than 5 Minutes | 0 (0.0%) | 0 (0.0%) |
| 5 to 9 Minutes | 122 (19.2%) | 222 (39.9%) |
| 10 to 14 Minutes | 98 (15.4%) | 92 (16.6%) |
| 15 to 19 Minutes | 181 (28.4%) | 95 (17.1%) |
| 20 to 24 Minutes | 25 (3.9%) | 20 (3.6%) |
| 25 to 29 Minutes | 0 (0.0%) | 0 (0.0%) |
| 30 to 34 Minutes | 38 (6.0%) | 106 (19.1%) |
| 35 to 39 Minutes | 39 (6.1%) | 21 (3.8%) |
| 40 to 44 Minutes | 0 (0.0%) | 0 (0.0%) |
| 45 to 59 Minutes | 0 (0.0%) | 0 (0.0%) |
| 60 to 89 Minutes | 134 (21.0%) | 0 (0.0%) |
| 90 or more Minutes | 0 (0.0%) | 0 (0.0%) |
Time of Departure to Work by Sex in Fairfield
The most frequent times of departure to work in Fairfield are 6:00 AM to 6:29 AM (140, 22.0%) for males and 7:30 AM to 7:59 AM (117, 21.0%) for females.
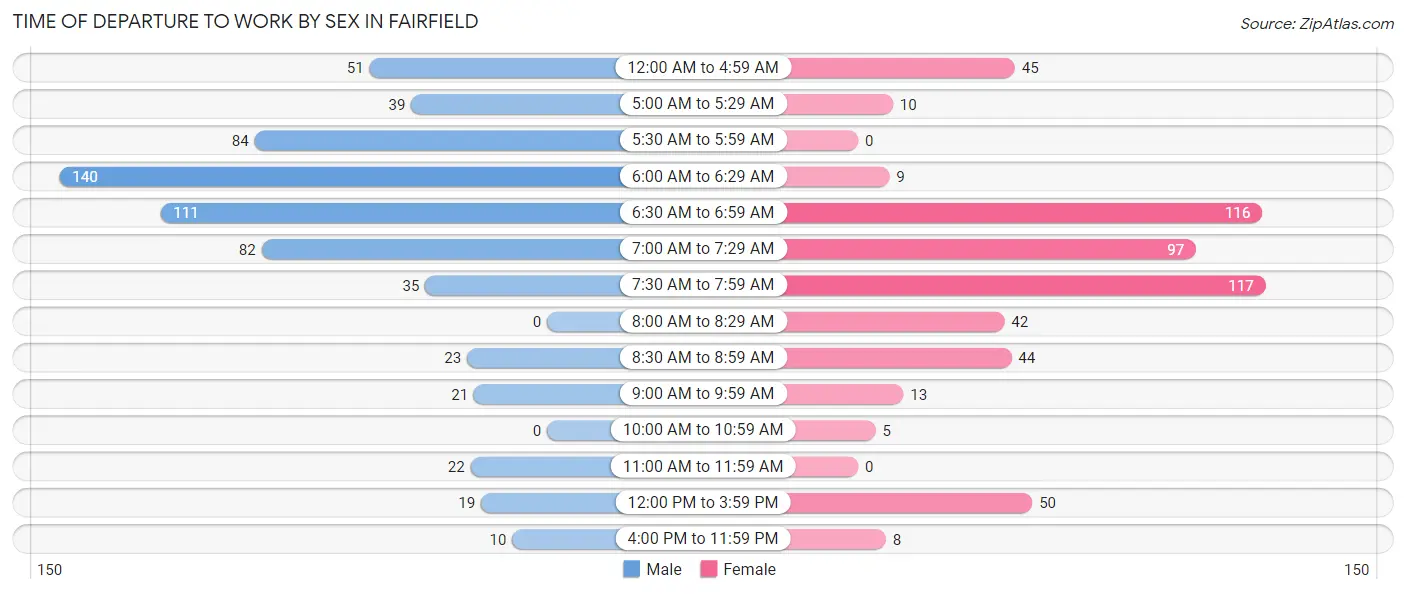
| Time of Departure | Male | Female |
| 12:00 AM to 4:59 AM | 51 (8.0%) | 45 (8.1%) |
| 5:00 AM to 5:29 AM | 39 (6.1%) | 10 (1.8%) |
| 5:30 AM to 5:59 AM | 84 (13.2%) | 0 (0.0%) |
| 6:00 AM to 6:29 AM | 140 (22.0%) | 9 (1.6%) |
| 6:30 AM to 6:59 AM | 111 (17.4%) | 116 (20.9%) |
| 7:00 AM to 7:29 AM | 82 (12.9%) | 97 (17.4%) |
| 7:30 AM to 7:59 AM | 35 (5.5%) | 117 (21.0%) |
| 8:00 AM to 8:29 AM | 0 (0.0%) | 42 (7.5%) |
| 8:30 AM to 8:59 AM | 23 (3.6%) | 44 (7.9%) |
| 9:00 AM to 9:59 AM | 21 (3.3%) | 13 (2.3%) |
| 10:00 AM to 10:59 AM | 0 (0.0%) | 5 (0.9%) |
| 11:00 AM to 11:59 AM | 22 (3.5%) | 0 (0.0%) |
| 12:00 PM to 3:59 PM | 19 (3.0%) | 50 (9.0%) |
| 4:00 PM to 11:59 PM | 10 (1.6%) | 8 (1.4%) |
| Total | 637 (100.0%) | 556 (100.0%) |
Housing Occupancy in Fairfield
Occupancy by Ownership in Fairfield
Of the total 1,213 dwellings in Fairfield, owner-occupied units account for 618 (50.9%), while renter-occupied units make up 595 (49.0%).
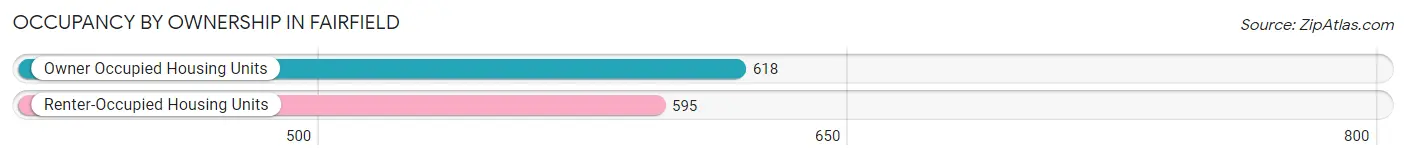
| Occupancy | # Housing Units | % Housing Units |
| Owner Occupied Housing Units | 618 | 50.9% |
| Renter-Occupied Housing Units | 595 | 49.0% |
| Total Occupied Housing Units | 1,213 | 100.0% |
Occupancy by Household Size in Fairfield
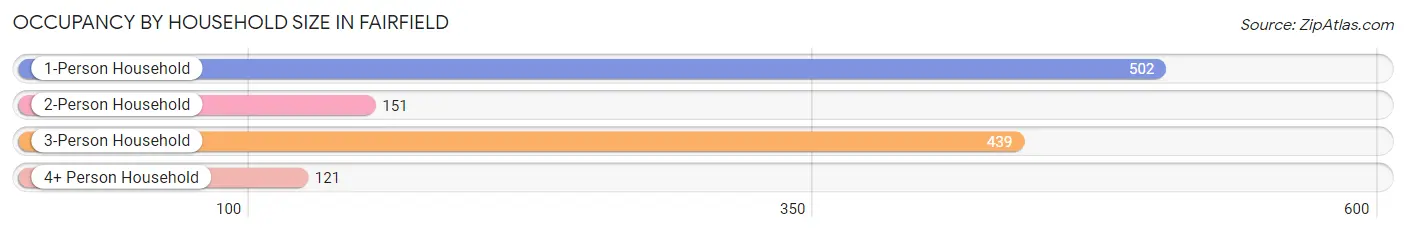
| Household Size | # Housing Units | % Housing Units |
| 1-Person Household | 502 | 41.4% |
| 2-Person Household | 151 | 12.4% |
| 3-Person Household | 439 | 36.2% |
| 4+ Person Household | 121 | 10.0% |
| Total Housing Units | 1,213 | 100.0% |
Occupancy by Ownership by Household Size in Fairfield
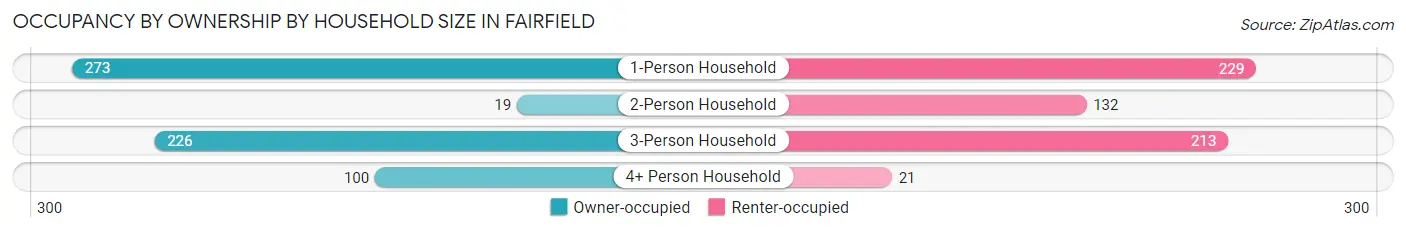
| Household Size | Owner-occupied | Renter-occupied |
| 1-Person Household | 273 (54.4%) | 229 (45.6%) |
| 2-Person Household | 19 (12.6%) | 132 (87.4%) |
| 3-Person Household | 226 (51.5%) | 213 (48.5%) |
| 4+ Person Household | 100 (82.6%) | 21 (17.4%) |
| Total Housing Units | 618 (50.9%) | 595 (49.0%) |
Occupancy by Educational Attainment in Fairfield
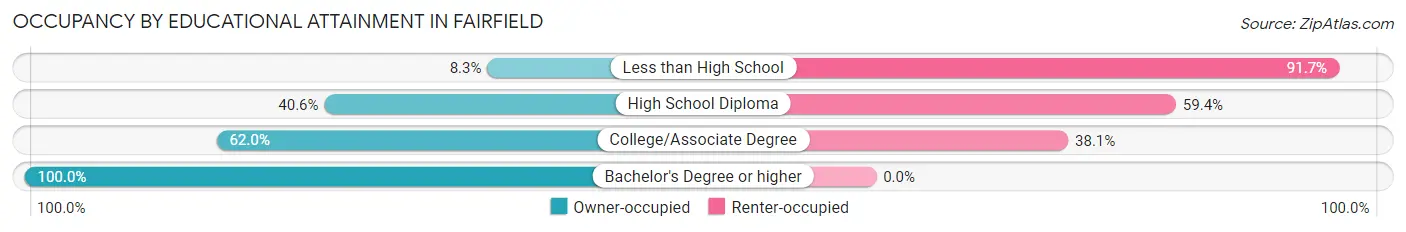
| Household Size | Owner-occupied | Renter-occupied |
| Less than High School | 9 (8.3%) | 100 (91.7%) |
| High School Diploma | 226 (40.6%) | 331 (59.4%) |
| College/Associate Degree | 267 (62.0%) | 164 (38.1%) |
| Bachelor's Degree or higher | 116 (100.0%) | 0 (0.0%) |
Occupancy by Age of Householder in Fairfield
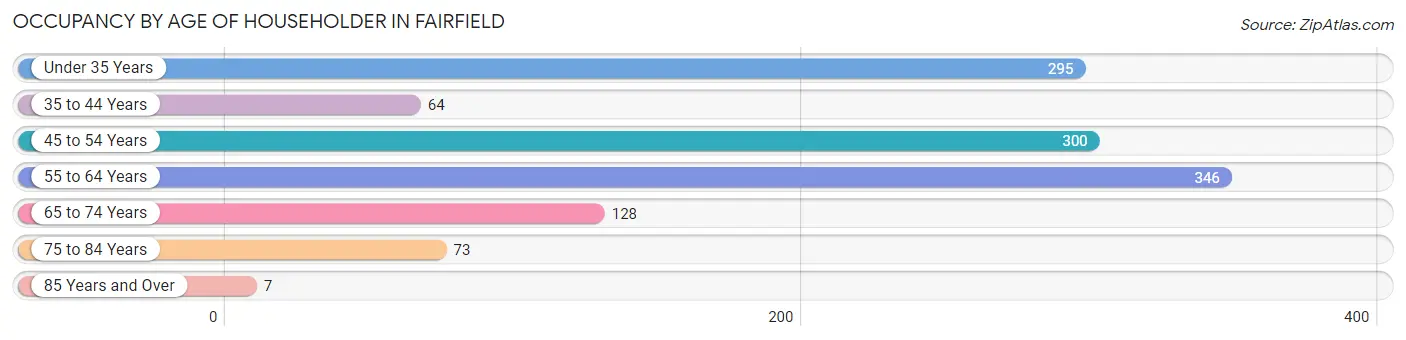
| Age Bracket | # Households | % Households |
| Under 35 Years | 295 | 24.3% |
| 35 to 44 Years | 64 | 5.3% |
| 45 to 54 Years | 300 | 24.7% |
| 55 to 64 Years | 346 | 28.5% |
| 65 to 74 Years | 128 | 10.5% |
| 75 to 84 Years | 73 | 6.0% |
| 85 Years and Over | 7 | 0.6% |
| Total | 1,213 | 100.0% |
Housing Finances in Fairfield
Median Income by Occupancy in Fairfield
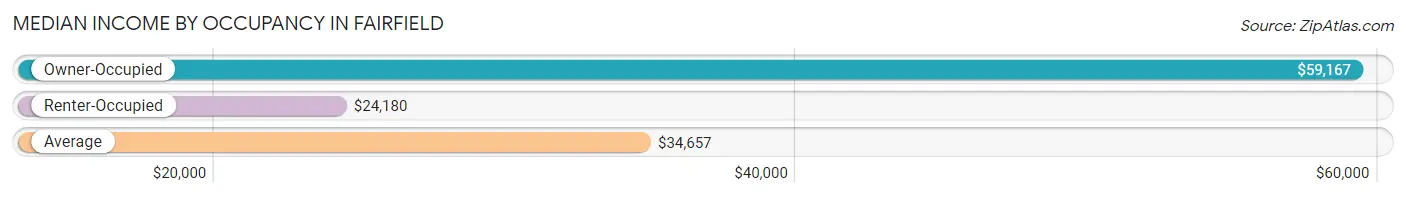
| Occupancy Type | # Households | Median Income |
| Owner-Occupied | 618 (50.9%) | $59,167 |
| Renter-Occupied | 595 (49.0%) | $24,180 |
| Average | 1,213 (100.0%) | $34,657 |
Occupancy by Householder Income Bracket in Fairfield
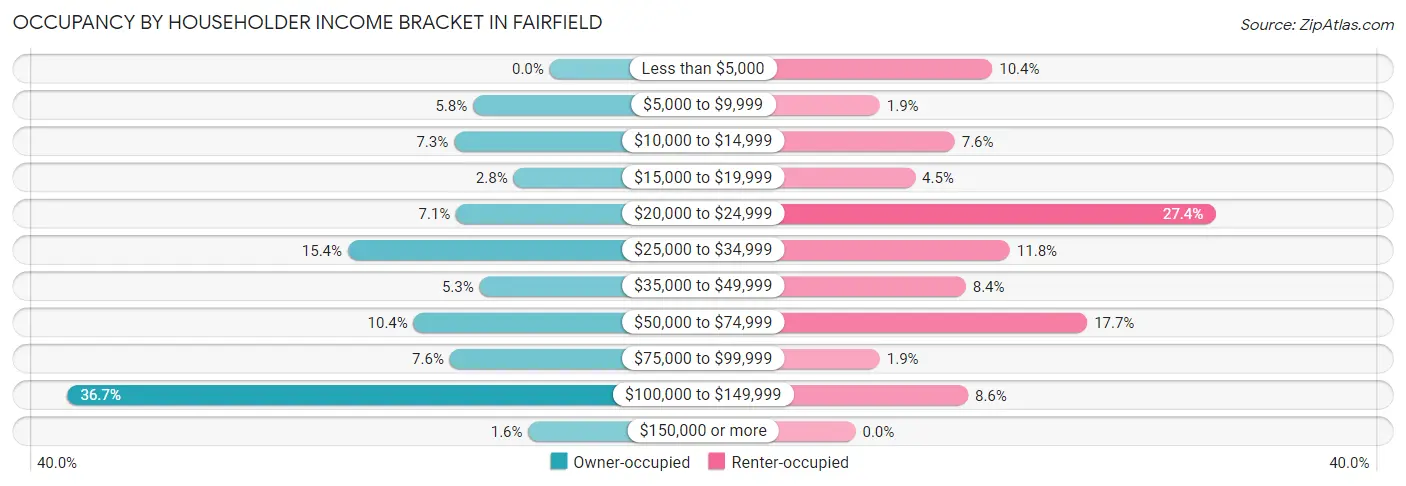
| Income Bracket | Owner-occupied | Renter-occupied |
| Less than $5,000 | 0 (0.0%) | 62 (10.4%) |
| $5,000 to $9,999 | 36 (5.8%) | 11 (1.8%) |
| $10,000 to $14,999 | 45 (7.3%) | 45 (7.6%) |
| $15,000 to $19,999 | 17 (2.8%) | 27 (4.5%) |
| $20,000 to $24,999 | 44 (7.1%) | 163 (27.4%) |
| $25,000 to $34,999 | 95 (15.4%) | 70 (11.8%) |
| $35,000 to $49,999 | 33 (5.3%) | 50 (8.4%) |
| $50,000 to $74,999 | 64 (10.4%) | 105 (17.6%) |
| $75,000 to $99,999 | 47 (7.6%) | 11 (1.8%) |
| $100,000 to $149,999 | 227 (36.7%) | 51 (8.6%) |
| $150,000 or more | 10 (1.6%) | 0 (0.0%) |
| Total | 618 (100.0%) | 595 (100.0%) |
Monthly Housing Cost Tiers in Fairfield
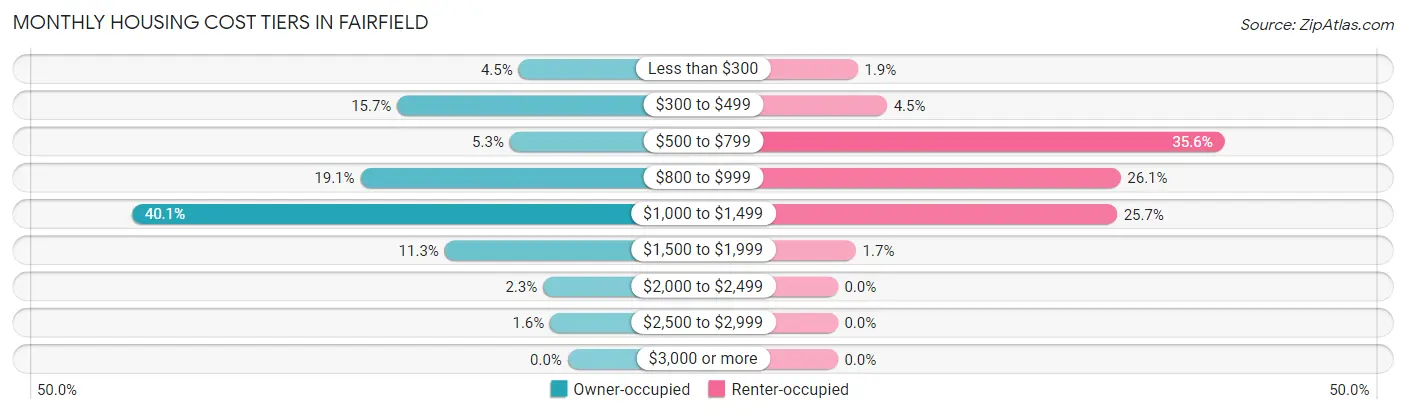
| Monthly Cost | Owner-occupied | Renter-occupied |
| Less than $300 | 28 (4.5%) | 11 (1.8%) |
| $300 to $499 | 97 (15.7%) | 27 (4.5%) |
| $500 to $799 | 33 (5.3%) | 212 (35.6%) |
| $800 to $999 | 118 (19.1%) | 155 (26.1%) |
| $1,000 to $1,499 | 248 (40.1%) | 153 (25.7%) |
| $1,500 to $1,999 | 70 (11.3%) | 10 (1.7%) |
| $2,000 to $2,499 | 14 (2.3%) | 0 (0.0%) |
| $2,500 to $2,999 | 10 (1.6%) | 0 (0.0%) |
| $3,000 or more | 0 (0.0%) | 0 (0.0%) |
| Total | 618 (100.0%) | 595 (100.0%) |
Physical Housing Characteristics in Fairfield
Housing Structures in Fairfield
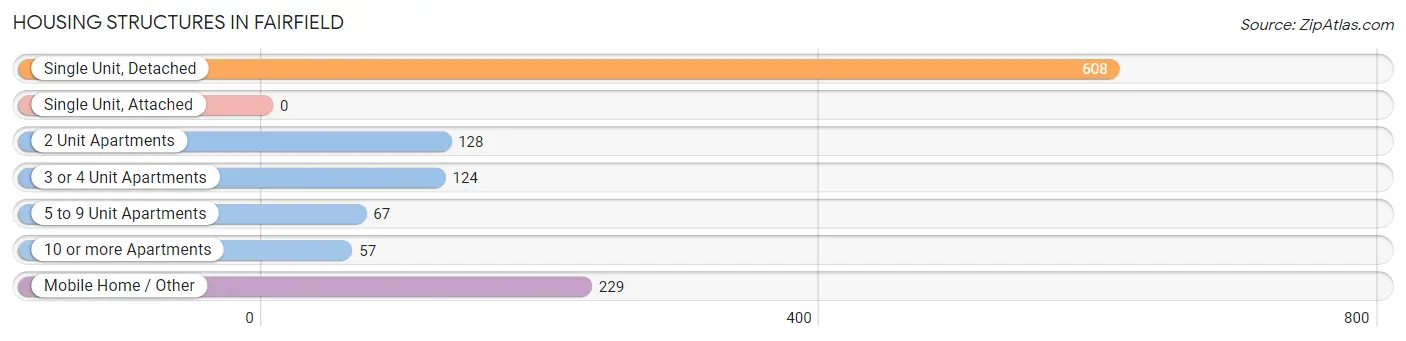
| Structure Type | # Housing Units | % Housing Units |
| Single Unit, Detached | 608 | 50.1% |
| Single Unit, Attached | 0 | 0.0% |
| 2 Unit Apartments | 128 | 10.5% |
| 3 or 4 Unit Apartments | 124 | 10.2% |
| 5 to 9 Unit Apartments | 67 | 5.5% |
| 10 or more Apartments | 57 | 4.7% |
| Mobile Home / Other | 229 | 18.9% |
| Total | 1,213 | 100.0% |
Housing Structures by Occupancy in Fairfield
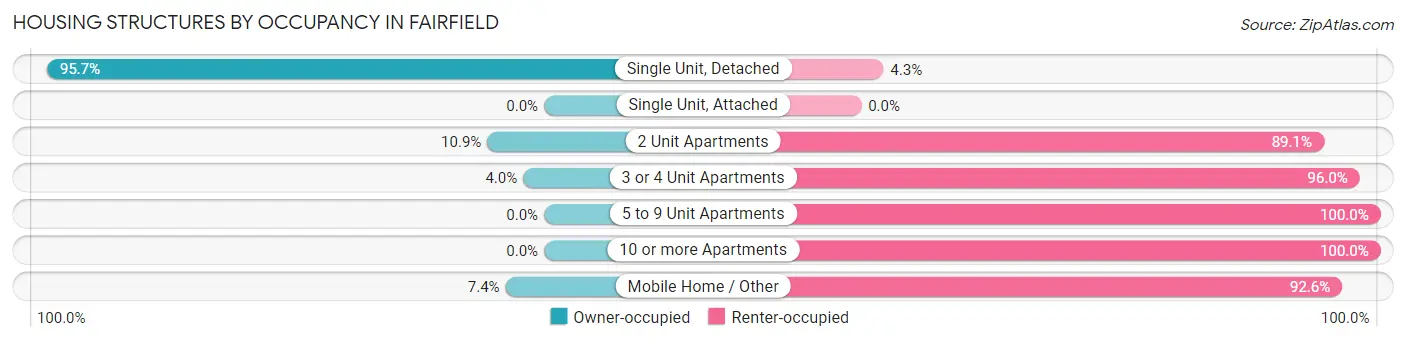
| Structure Type | Owner-occupied | Renter-occupied |
| Single Unit, Detached | 582 (95.7%) | 26 (4.3%) |
| Single Unit, Attached | 0 (0.0%) | 0 (0.0%) |
| 2 Unit Apartments | 14 (10.9%) | 114 (89.1%) |
| 3 or 4 Unit Apartments | 5 (4.0%) | 119 (96.0%) |
| 5 to 9 Unit Apartments | 0 (0.0%) | 67 (100.0%) |
| 10 or more Apartments | 0 (0.0%) | 57 (100.0%) |
| Mobile Home / Other | 17 (7.4%) | 212 (92.6%) |
| Total | 618 (50.9%) | 595 (49.0%) |
Housing Structures by Number of Rooms in Fairfield
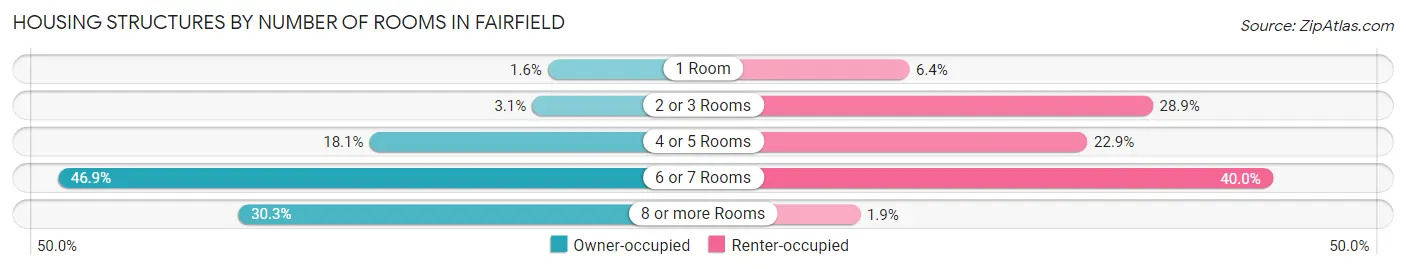
| Number of Rooms | Owner-occupied | Renter-occupied |
| 1 Room | 10 (1.6%) | 38 (6.4%) |
| 2 or 3 Rooms | 19 (3.1%) | 172 (28.9%) |
| 4 or 5 Rooms | 112 (18.1%) | 136 (22.9%) |
| 6 or 7 Rooms | 290 (46.9%) | 238 (40.0%) |
| 8 or more Rooms | 187 (30.3%) | 11 (1.8%) |
| Total | 618 (100.0%) | 595 (100.0%) |
Housing Structure by Heating Type in Fairfield
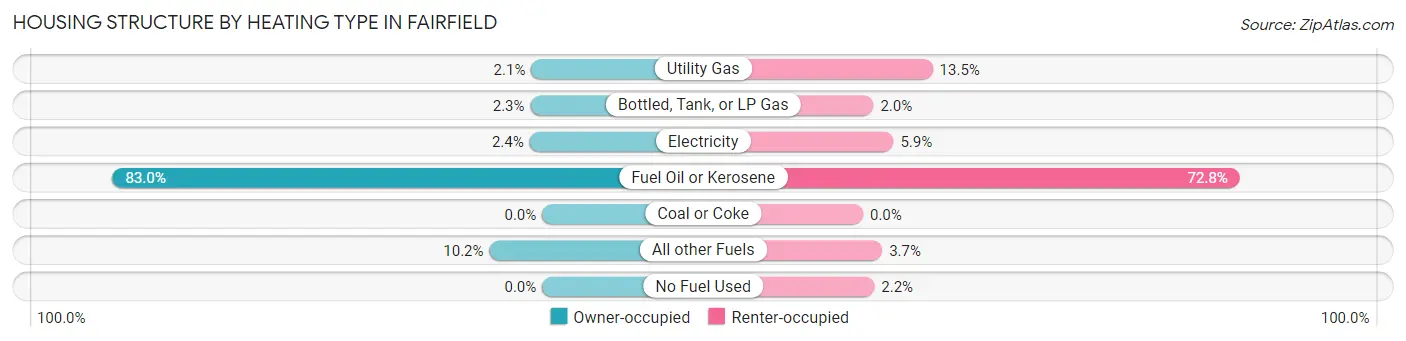
| Heating Type | Owner-occupied | Renter-occupied |
| Utility Gas | 13 (2.1%) | 80 (13.5%) |
| Bottled, Tank, or LP Gas | 14 (2.3%) | 12 (2.0%) |
| Electricity | 15 (2.4%) | 35 (5.9%) |
| Fuel Oil or Kerosene | 513 (83.0%) | 433 (72.8%) |
| Coal or Coke | 0 (0.0%) | 0 (0.0%) |
| All other Fuels | 63 (10.2%) | 22 (3.7%) |
| No Fuel Used | 0 (0.0%) | 13 (2.2%) |
| Total | 618 (100.0%) | 595 (100.0%) |
Household Vehicle Usage in Fairfield
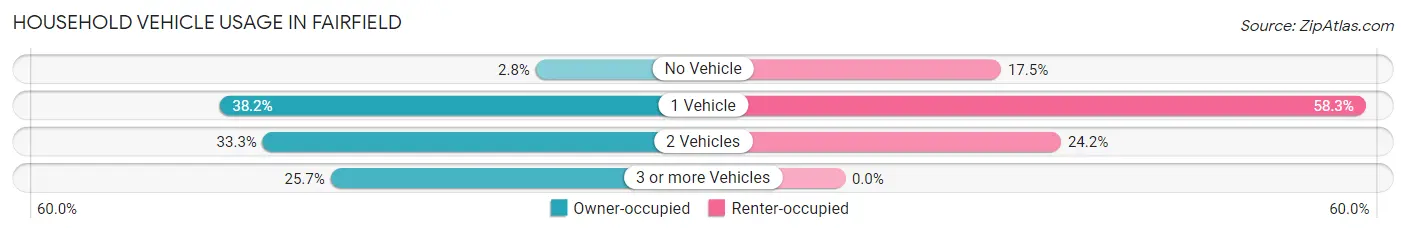
| Vehicles per Household | Owner-occupied | Renter-occupied |
| No Vehicle | 17 (2.8%) | 104 (17.5%) |
| 1 Vehicle | 236 (38.2%) | 347 (58.3%) |
| 2 Vehicles | 206 (33.3%) | 144 (24.2%) |
| 3 or more Vehicles | 159 (25.7%) | 0 (0.0%) |
| Total | 618 (100.0%) | 595 (100.0%) |
Real Estate & Mortgages in Fairfield
Real Estate and Mortgage Overview in Fairfield
| Characteristic | Without Mortgage | With Mortgage |
| Housing Units | 174 | 444 |
| Median Property Value | $126,500 | $140,100 |
| Median Household Income | $29,524 | $10 |
| Monthly Housing Costs | $432 | $0 |
| Real Estate Taxes | $2,396 | $15 |
Property Value by Mortgage Status in Fairfield
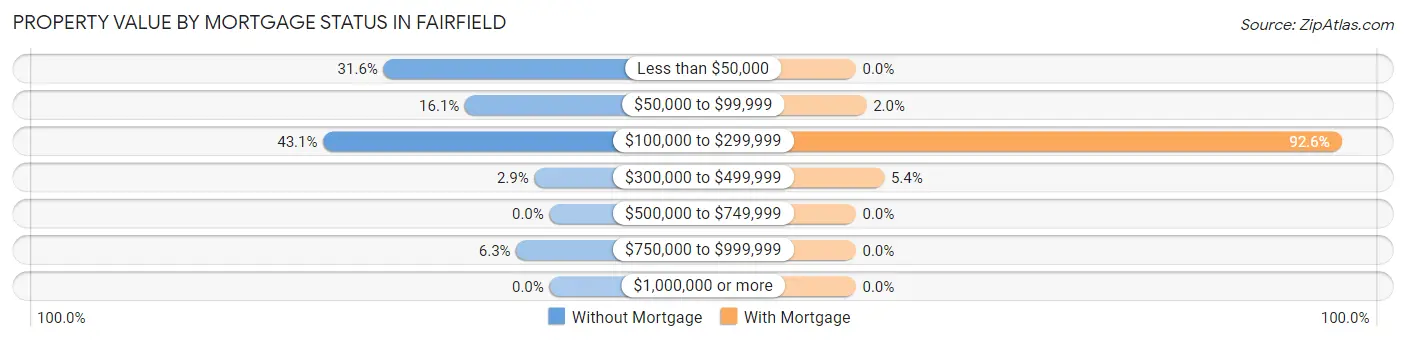
| Property Value | Without Mortgage | With Mortgage |
| Less than $50,000 | 55 (31.6%) | 0 (0.0%) |
| $50,000 to $99,999 | 28 (16.1%) | 9 (2.0%) |
| $100,000 to $299,999 | 75 (43.1%) | 411 (92.6%) |
| $300,000 to $499,999 | 5 (2.9%) | 24 (5.4%) |
| $500,000 to $749,999 | 0 (0.0%) | 0 (0.0%) |
| $750,000 to $999,999 | 11 (6.3%) | 0 (0.0%) |
| $1,000,000 or more | 0 (0.0%) | 0 (0.0%) |
| Total | 174 (100.0%) | 444 (100.0%) |
Household Income by Mortgage Status in Fairfield
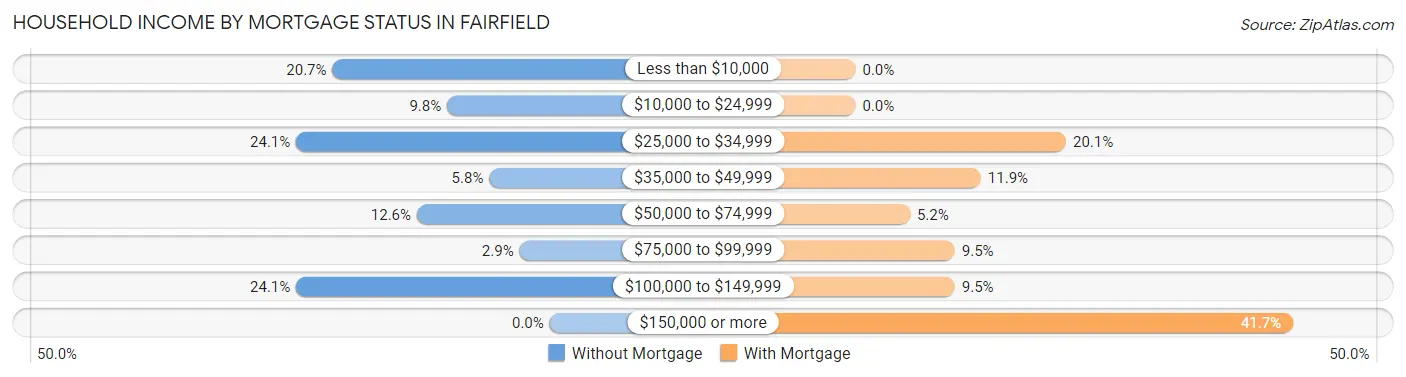
| Household Income | Without Mortgage | With Mortgage |
| Less than $10,000 | 36 (20.7%) | 0 (0.0%) |
| $10,000 to $24,999 | 17 (9.8%) | 0 (0.0%) |
| $25,000 to $34,999 | 42 (24.1%) | 89 (20.1%) |
| $35,000 to $49,999 | 10 (5.8%) | 53 (11.9%) |
| $50,000 to $74,999 | 22 (12.6%) | 23 (5.2%) |
| $75,000 to $99,999 | 5 (2.9%) | 42 (9.5%) |
| $100,000 to $149,999 | 42 (24.1%) | 42 (9.5%) |
| $150,000 or more | 0 (0.0%) | 185 (41.7%) |
| Total | 174 (100.0%) | 444 (100.0%) |
Property Value to Household Income Ratio in Fairfield
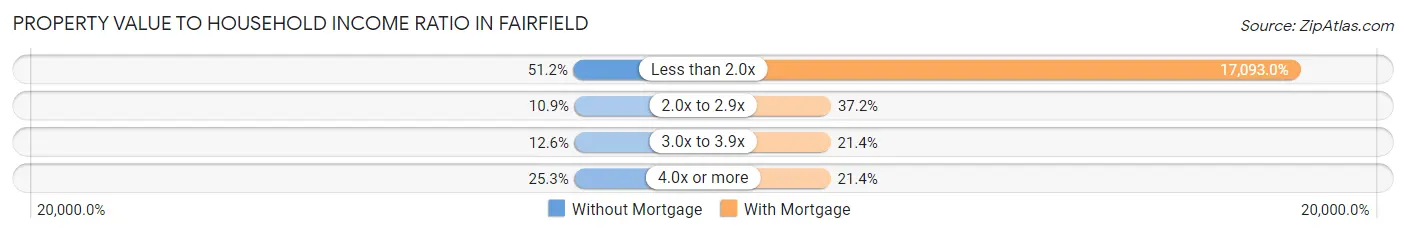
| Value-to-Income Ratio | Without Mortgage | With Mortgage |
| Less than 2.0x | 89 (51.1%) | 75,893 (17,093.0%) |
| 2.0x to 2.9x | 19 (10.9%) | 165 (37.2%) |
| 3.0x to 3.9x | 22 (12.6%) | 95 (21.4%) |
| 4.0x or more | 44 (25.3%) | 95 (21.4%) |
| Total | 174 (100.0%) | 444 (100.0%) |
Real Estate Taxes by Mortgage Status in Fairfield
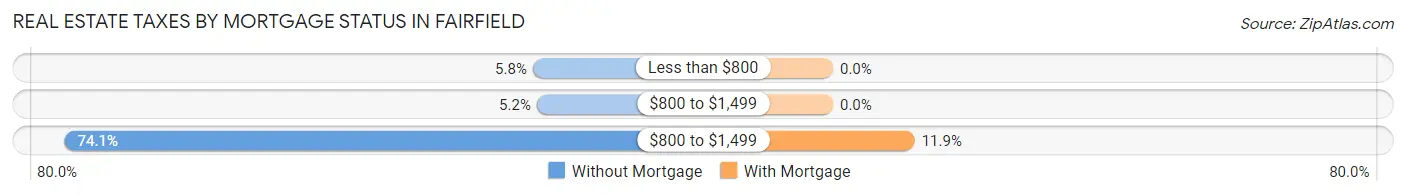
| Property Taxes | Without Mortgage | With Mortgage |
| Less than $800 | 10 (5.8%) | 0 (0.0%) |
| $800 to $1,499 | 9 (5.2%) | 0 (0.0%) |
| $800 to $1,499 | 129 (74.1%) | 53 (11.9%) |
| Total | 174 (100.0%) | 444 (100.0%) |
Health & Disability in Fairfield
Health Insurance Coverage by Age in Fairfield
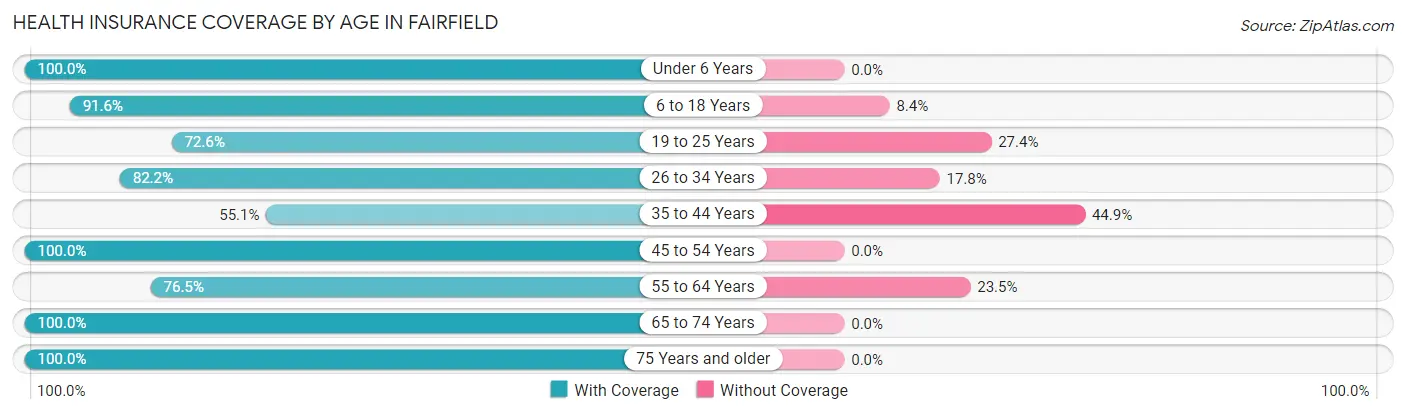
| Age Bracket | With Coverage | Without Coverage |
| Under 6 Years | 177 (100.0%) | 0 (0.0%) |
| 6 to 18 Years | 359 (91.6%) | 33 (8.4%) |
| 19 to 25 Years | 302 (72.6%) | 114 (27.4%) |
| 26 to 34 Years | 250 (82.2%) | 54 (17.8%) |
| 35 to 44 Years | 113 (55.1%) | 92 (44.9%) |
| 45 to 54 Years | 459 (100.0%) | 0 (0.0%) |
| 55 to 64 Years | 345 (76.5%) | 106 (23.5%) |
| 65 to 74 Years | 163 (100.0%) | 0 (0.0%) |
| 75 Years and older | 80 (100.0%) | 0 (0.0%) |
| Total | 2,248 (84.9%) | 399 (15.1%) |
Health Insurance Coverage by Citizenship Status in Fairfield
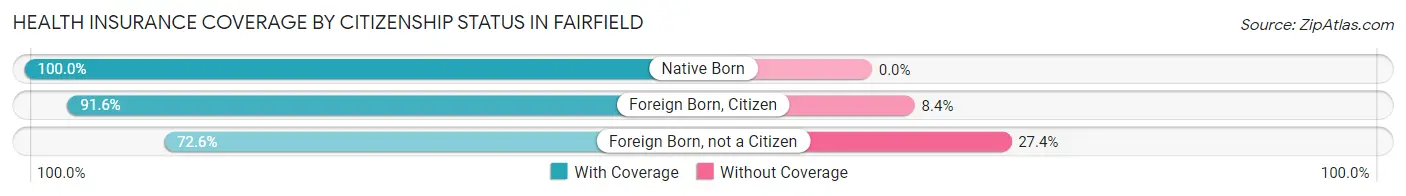
| Citizenship Status | With Coverage | Without Coverage |
| Native Born | 177 (100.0%) | 0 (0.0%) |
| Foreign Born, Citizen | 359 (91.6%) | 33 (8.4%) |
| Foreign Born, not a Citizen | 302 (72.6%) | 114 (27.4%) |
Health Insurance Coverage by Household Income in Fairfield
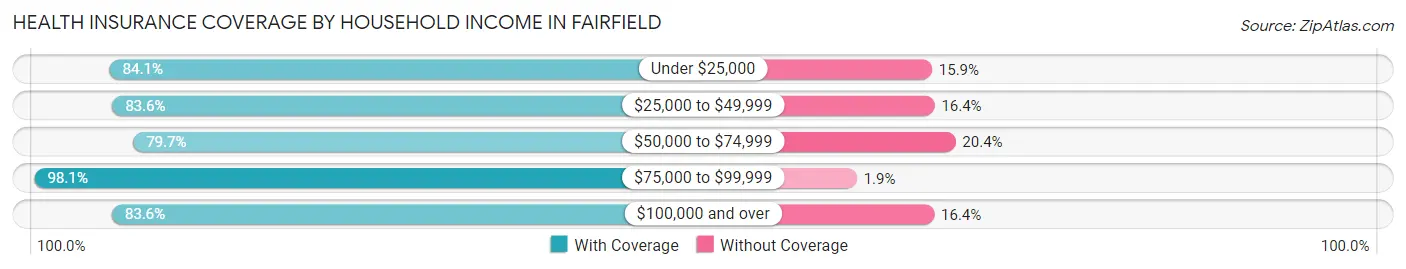
| Household Income | With Coverage | Without Coverage |
| Under $25,000 | 559 (84.1%) | 106 (15.9%) |
| $25,000 to $49,999 | 280 (83.6%) | 55 (16.4%) |
| $50,000 to $74,999 | 317 (79.6%) | 81 (20.3%) |
| $75,000 to $99,999 | 317 (98.1%) | 6 (1.9%) |
| $100,000 and over | 772 (83.6%) | 151 (16.4%) |
Public vs Private Health Insurance Coverage by Age in Fairfield
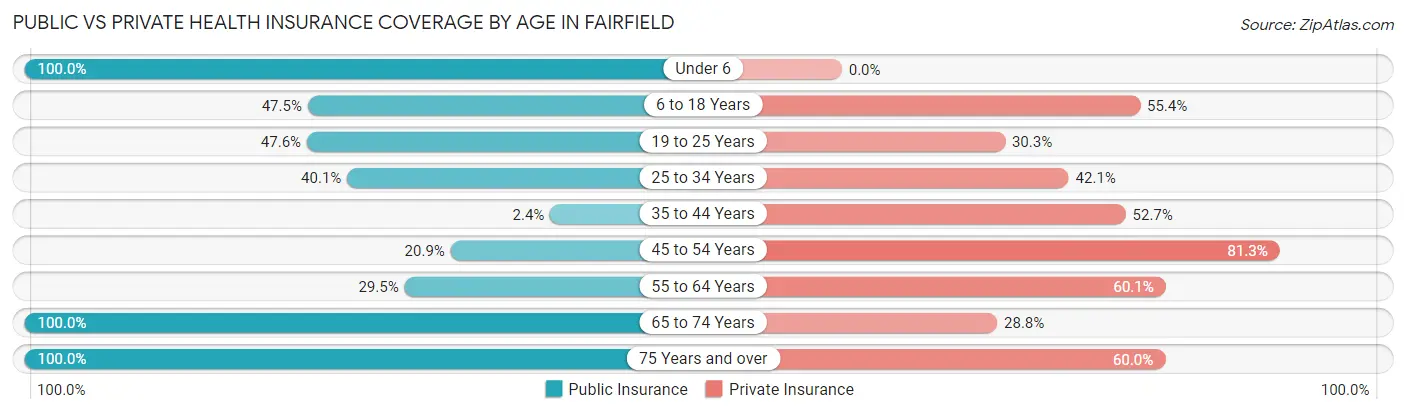
| Age Bracket | Public Insurance | Private Insurance |
| Under 6 | 177 (100.0%) | 0 (0.0%) |
| 6 to 18 Years | 186 (47.4%) | 217 (55.4%) |
| 19 to 25 Years | 198 (47.6%) | 126 (30.3%) |
| 25 to 34 Years | 122 (40.1%) | 128 (42.1%) |
| 35 to 44 Years | 5 (2.4%) | 108 (52.7%) |
| 45 to 54 Years | 96 (20.9%) | 373 (81.3%) |
| 55 to 64 Years | 133 (29.5%) | 271 (60.1%) |
| 65 to 74 Years | 163 (100.0%) | 47 (28.8%) |
| 75 Years and over | 80 (100.0%) | 48 (60.0%) |
| Total | 1,160 (43.8%) | 1,318 (49.8%) |
Disability Status by Sex by Age in Fairfield
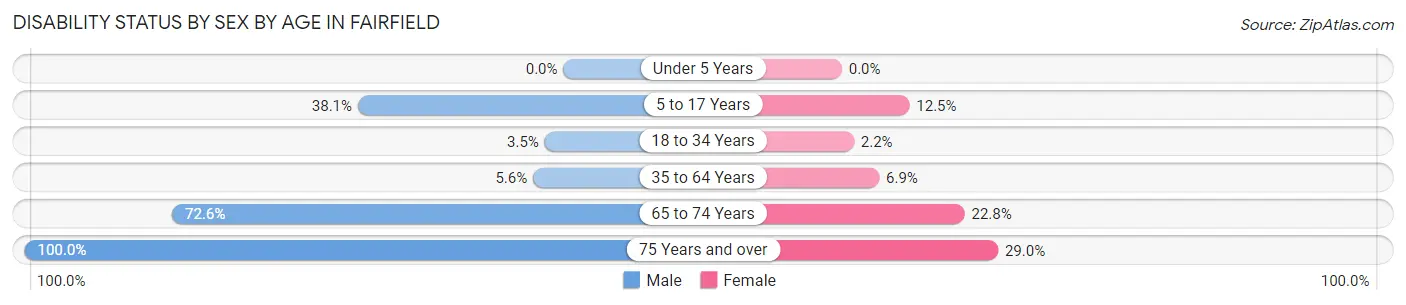
| Age Bracket | Male | Female |
| Under 5 Years | 0 (0.0%) | 0 (0.0%) |
| 5 to 17 Years | 45 (38.1%) | 40 (12.5%) |
| 18 to 34 Years | 11 (3.5%) | 9 (2.2%) |
| 35 to 64 Years | 31 (5.6%) | 39 (6.9%) |
| 65 to 74 Years | 61 (72.6%) | 18 (22.8%) |
| 75 Years and over | 11 (100.0%) | 20 (29.0%) |
Disability Class by Sex by Age in Fairfield
Disability Class: Hearing Difficulty
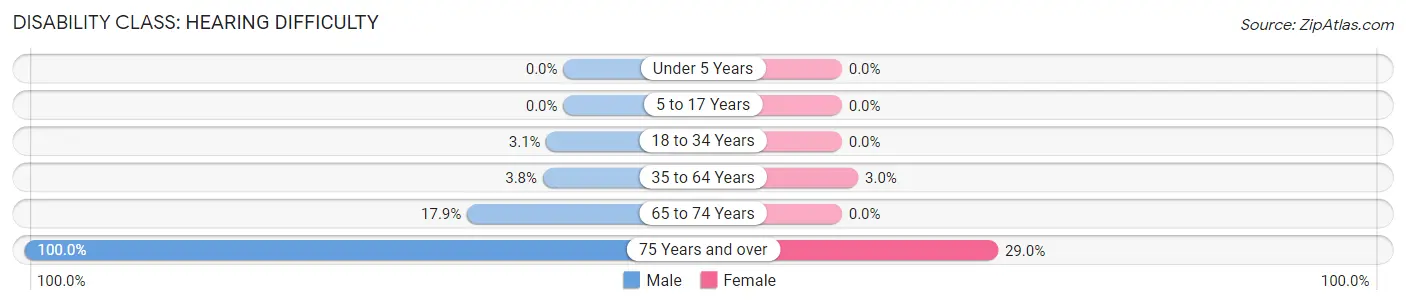
| Age Bracket | Male | Female |
| Under 5 Years | 0 (0.0%) | 0 (0.0%) |
| 5 to 17 Years | 0 (0.0%) | 0 (0.0%) |
| 18 to 34 Years | 10 (3.1%) | 0 (0.0%) |
| 35 to 64 Years | 21 (3.8%) | 17 (3.0%) |
| 65 to 74 Years | 15 (17.9%) | 0 (0.0%) |
| 75 Years and over | 11 (100.0%) | 20 (29.0%) |
Disability Class: Vision Difficulty
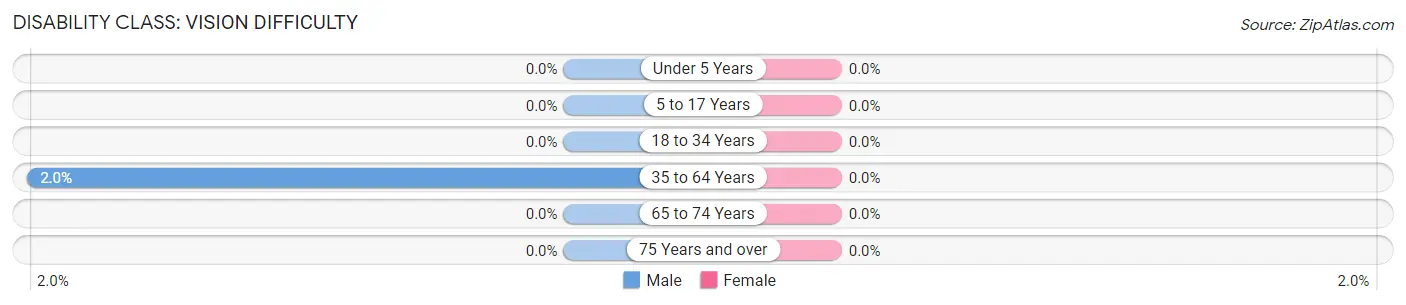
| Age Bracket | Male | Female |
| Under 5 Years | 0 (0.0%) | 0 (0.0%) |
| 5 to 17 Years | 0 (0.0%) | 0 (0.0%) |
| 18 to 34 Years | 0 (0.0%) | 0 (0.0%) |
| 35 to 64 Years | 11 (2.0%) | 0 (0.0%) |
| 65 to 74 Years | 0 (0.0%) | 0 (0.0%) |
| 75 Years and over | 0 (0.0%) | 0 (0.0%) |
Disability Class: Cognitive Difficulty
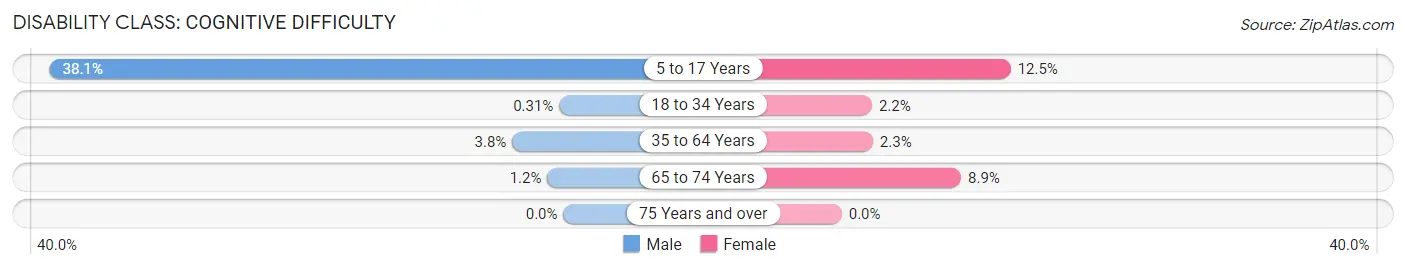
| Age Bracket | Male | Female |
| 5 to 17 Years | 45 (38.1%) | 40 (12.5%) |
| 18 to 34 Years | 1 (0.3%) | 9 (2.2%) |
| 35 to 64 Years | 21 (3.8%) | 13 (2.3%) |
| 65 to 74 Years | 1 (1.2%) | 7 (8.9%) |
| 75 Years and over | 0 (0.0%) | 0 (0.0%) |
Disability Class: Ambulatory Difficulty
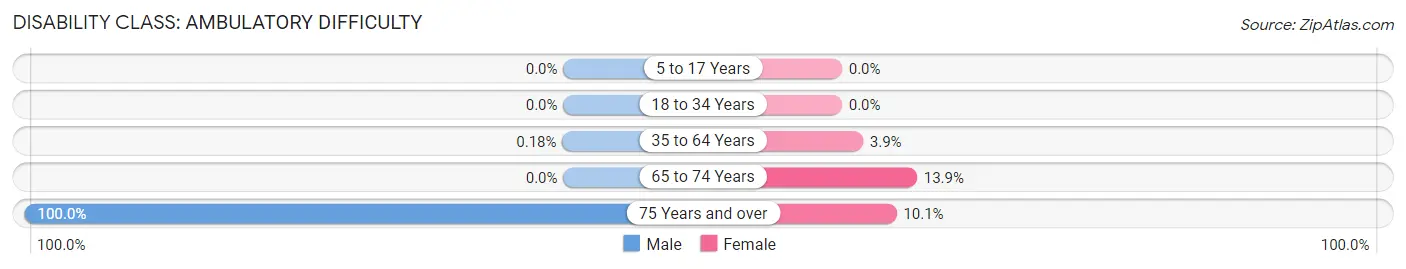
| Age Bracket | Male | Female |
| 5 to 17 Years | 0 (0.0%) | 0 (0.0%) |
| 18 to 34 Years | 0 (0.0%) | 0 (0.0%) |
| 35 to 64 Years | 1 (0.2%) | 22 (3.9%) |
| 65 to 74 Years | 0 (0.0%) | 11 (13.9%) |
| 75 Years and over | 11 (100.0%) | 7 (10.1%) |
Disability Class: Self-Care Difficulty
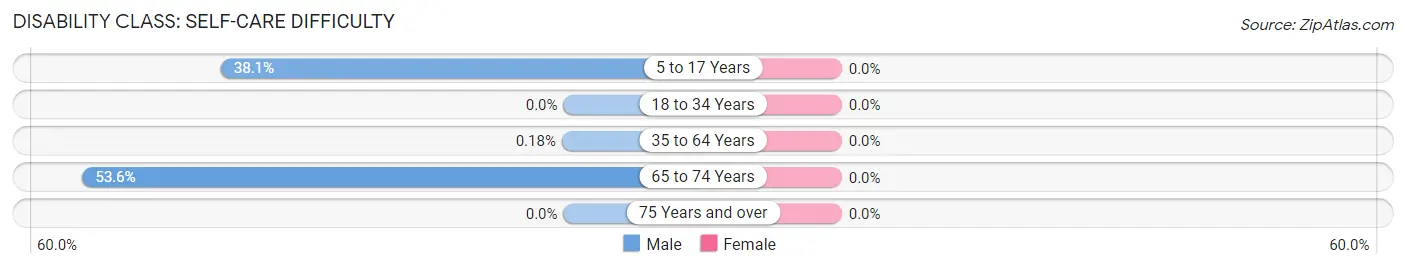
| Age Bracket | Male | Female |
| 5 to 17 Years | 45 (38.1%) | 0 (0.0%) |
| 18 to 34 Years | 0 (0.0%) | 0 (0.0%) |
| 35 to 64 Years | 1 (0.2%) | 0 (0.0%) |
| 65 to 74 Years | 45 (53.6%) | 0 (0.0%) |
| 75 Years and over | 0 (0.0%) | 0 (0.0%) |
Technology Access in Fairfield
Computing Device Access in Fairfield
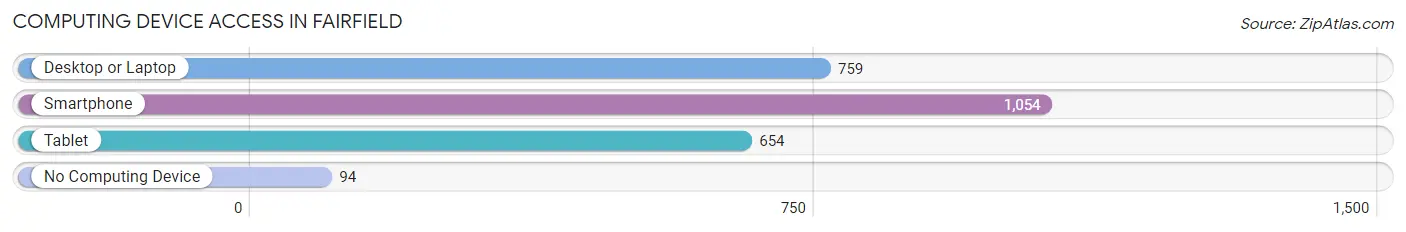
| Device Type | # Households | % Households |
| Desktop or Laptop | 759 | 62.6% |
| Smartphone | 1,054 | 86.9% |
| Tablet | 654 | 53.9% |
| No Computing Device | 94 | 7.7% |
| Total | 1,213 | 100.0% |
Internet Access in Fairfield
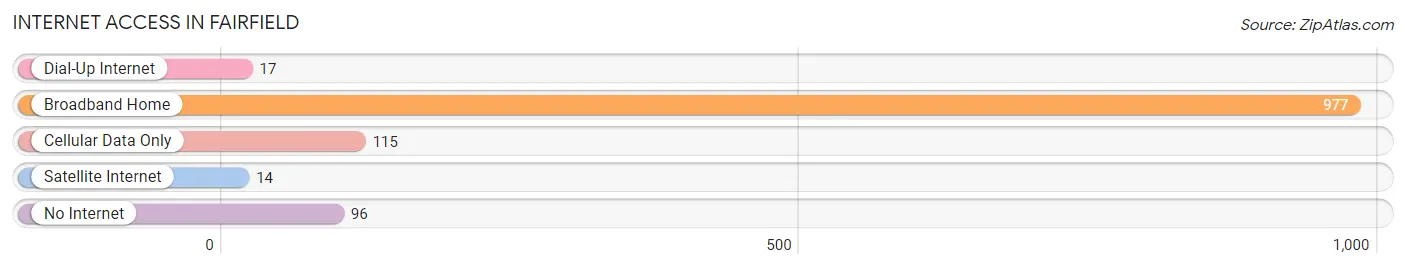
| Internet Type | # Households | % Households |
| Dial-Up Internet | 17 | 1.4% |
| Broadband Home | 977 | 80.5% |
| Cellular Data Only | 115 | 9.5% |
| Satellite Internet | 14 | 1.1% |
| No Internet | 96 | 7.9% |
| Total | 1,213 | 100.0% |
Fairfield Summary
Fairfield, Maine is a small town located in the heart of Kennebec County. It is situated on the banks of the Kennebec River, and is home to a population of approximately 5,000 people. The town is known for its rural charm and its close proximity to the state capital of Augusta.
History
Fairfield was first settled in 1774 by a group of settlers from Massachusetts. The town was originally known as "The Plantation of Fairfield," and was incorporated in 1788. The town was named after Fairfield, Connecticut, which was the hometown of many of the original settlers.
The town was an important center of commerce and industry in the 19th century. It was home to several mills, including a paper mill, a grist mill, and a sawmill. The town was also home to a number of other businesses, including a tannery, a blacksmith shop, and a shoe factory.
Geography
Fairfield is located in the center of Kennebec County, and is bordered by the towns of Waterville, Oakland, and Winslow. The town is situated on the banks of the Kennebec River, and is home to several small lakes, including Messalonskee Lake and Long Pond. The town is also home to several small streams, including the Cobbosseecontee Stream and the Sebasticook River.
The town has a total area of 28.2 square miles, of which 27.7 square miles is land and 0.5 square miles is water. The town is located at an elevation of approximately 200 feet above sea level.
Economy
Fairfield is a small, rural town, and its economy is largely based on agriculture and tourism. The town is home to several farms, which produce a variety of crops, including potatoes, corn, and hay. The town is also home to several small businesses, including restaurants, retail stores, and a variety of service-based businesses.
The town is also home to several manufacturing companies, including a paper mill, a wood products company, and a plastics manufacturer. The town is also home to several small businesses, including a brewery, a winery, and a distillery.
Demographics
As of the 2010 census, the town had a population of 4,937 people. The racial makeup of the town was 97.3% White, 0.7% African American, 0.3% Native American, 0.3% Asian, 0.1% Pacific Islander, 0.2% from other races, and 1.2% from two or more races. Hispanic or Latino of any race were 0.9% of the population.
The median income for a household in the town was $41,944, and the median income for a family was $50,917. The per capita income for the town was $20,945. About 8.3% of families and 11.2% of the population were below the poverty line, including 15.2% of those under age 18 and 8.2% of those age 65 or over.
Common Questions
What is Per Capita Income in Fairfield?
Per Capita income in Fairfield is $24,598.
What is the Median Family Income in Fairfield?
Median Family Income in Fairfield is $77,083.
What is the Median Household income in Fairfield?
Median Household Income in Fairfield is $34,657.
What is Income or Wage Gap in Fairfield?
Income or Wage Gap in Fairfield is 32.7%.
Women in Fairfield earn 67.3 cents for every dollar earned by a man.
What is Inequality or Gini Index in Fairfield?
Inequality or Gini Index in Fairfield is 0.45.
What is the Total Population of Fairfield?
Total Population of Fairfield is 2,647.
What is the Total Male Population of Fairfield?
Total Male Population of Fairfield is 1,215.
What is the Total Female Population of Fairfield?
Total Female Population of Fairfield is 1,432.
What is the Ratio of Males per 100 Females in Fairfield?
There are 84.85 Males per 100 Females in Fairfield.
What is the Ratio of Females per 100 Males in Fairfield?
There are 117.86 Females per 100 Males in Fairfield.
What is the Median Population Age in Fairfield?
Median Population Age in Fairfield is 35.3 Years.
What is the Average Family Size in Fairfield
Average Family Size in Fairfield is 3.0 People.
What is the Average Household Size in Fairfield
Average Household Size in Fairfield is 2.2 People.
How Large is the Labor Force in Fairfield?
There are 1,445 People in the Labor Forcein in Fairfield.
What is the Percentage of People in the Labor Force in Fairfield?
67.5% of People are in the Labor Force in Fairfield.
What is the Unemployment Rate in Fairfield?
Unemployment Rate in Fairfield is 4.6%.