North Berwick, ME Map & Demographics
North Berwick Map
North Berwick Overview
$46,189
PER CAPITA INCOME
$102,273
AVG FAMILY INCOME
$50,579
AVG HOUSEHOLD INCOME
49.4%
WAGE / INCOME GAP [ % ]
50.6¢/ $1
WAGE / INCOME GAP [ $ ]
0.56
INEQUALITY / GINI INDEX
1,806
TOTAL POPULATION
702
MALE POPULATION
1,104
FEMALE POPULATION
63.59
MALES / 100 FEMALES
157.26
FEMALES / 100 MALES
45.7
MEDIAN AGE
2.9
AVG FAMILY SIZE
2.2
AVG HOUSEHOLD SIZE
955
LABOR FORCE [ PEOPLE ]
65.8%
PERCENT IN LABOR FORCE
0.7%
UNEMPLOYMENT RATE
North Berwick Zip Codes
North Berwick Area Codes
Income in North Berwick
Income Overview in North Berwick
Per Capita Income in North Berwick is $46,189, while median incomes of families and households are $102,273 and $50,579 respectively.
| Characteristic | Number | Measure |
| Per Capita Income | 1,806 | $46,189 |
| Median Family Income | 460 | $102,273 |
| Mean Family Income | 460 | $104,892 |
| Median Household Income | 785 | $50,579 |
| Mean Household Income | 785 | $104,802 |
| Income Deficit | 460 | $0 |
| Wage / Income Gap (%) | 1,806 | 49.42% |
| Wage / Income Gap ($) | 1,806 | 50.58¢ per $1 |
| Gini / Inequality Index | 1,806 | 0.56 |
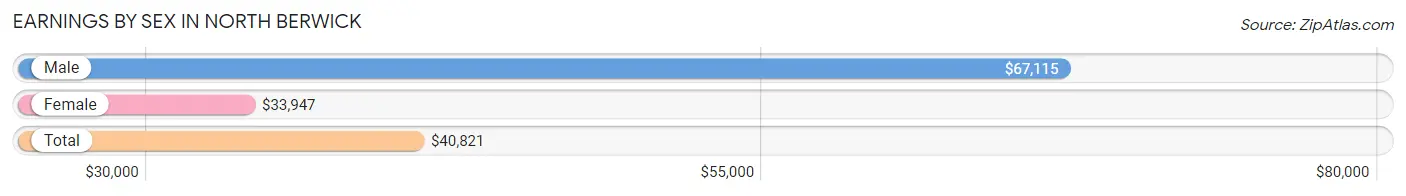
Earnings by Sex in North Berwick
Average Earnings in North Berwick are $40,821, $67,115 for men and $33,947 for women, a difference of 49.4%.
| Sex | Number | Average Earnings |
| Male | 442 (44.1%) | $67,115 |
| Female | 560 (55.9%) | $33,947 |
| Total | 1,002 (100.0%) | $40,821 |
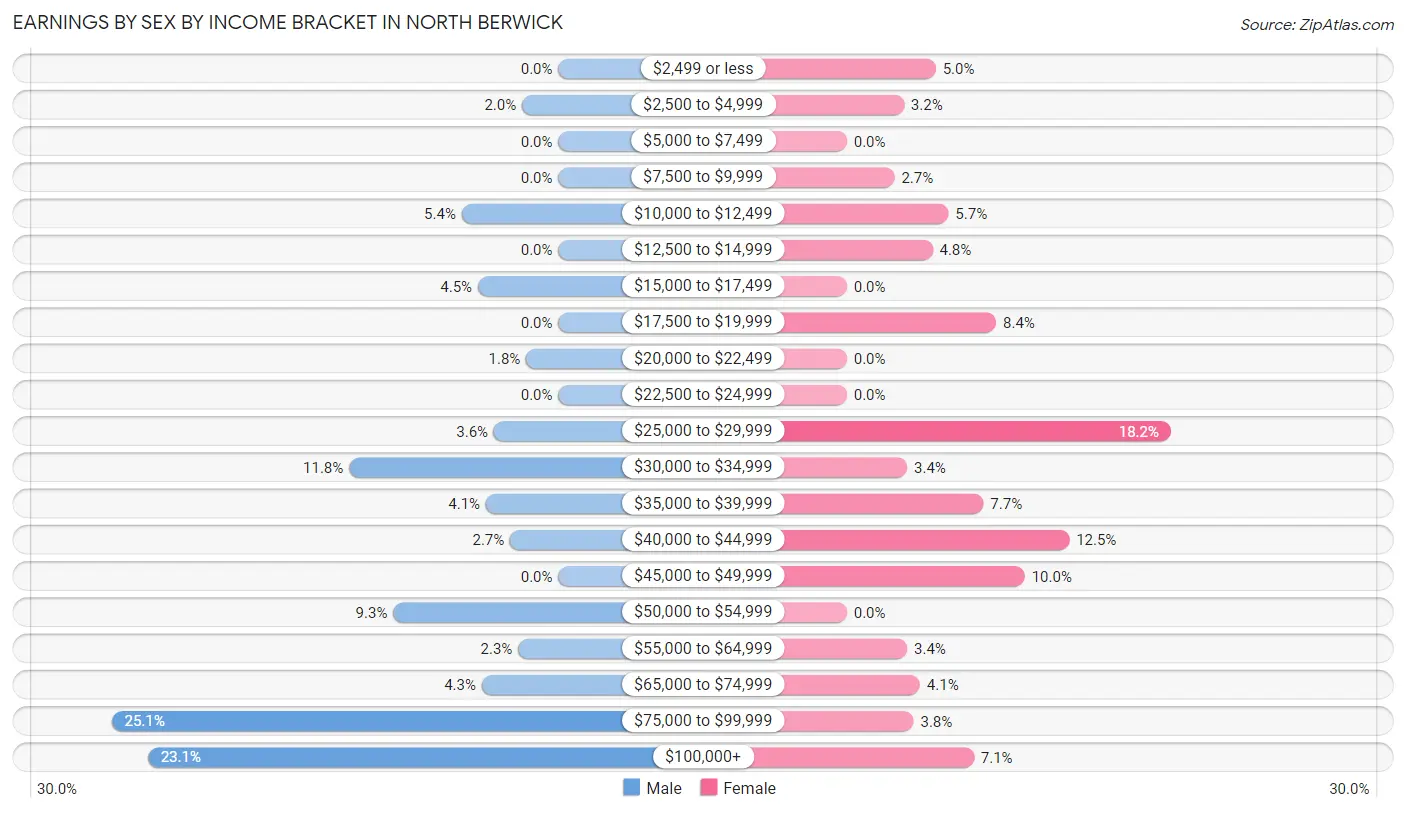
Earnings by Sex by Income Bracket in North Berwick
The most common earnings brackets in North Berwick are $75,000 to $99,999 for men (111 | 25.1%) and $25,000 to $29,999 for women (102 | 18.2%).
| Income | Male | Female |
| $2,499 or less | 0 (0.0%) | 28 (5.0%) |
| $2,500 to $4,999 | 9 (2.0%) | 18 (3.2%) |
| $5,000 to $7,499 | 0 (0.0%) | 0 (0.0%) |
| $7,500 to $9,999 | 0 (0.0%) | 15 (2.7%) |
| $10,000 to $12,499 | 24 (5.4%) | 32 (5.7%) |
| $12,500 to $14,999 | 0 (0.0%) | 27 (4.8%) |
| $15,000 to $17,499 | 20 (4.5%) | 0 (0.0%) |
| $17,500 to $19,999 | 0 (0.0%) | 47 (8.4%) |
| $20,000 to $22,499 | 8 (1.8%) | 0 (0.0%) |
| $22,500 to $24,999 | 0 (0.0%) | 0 (0.0%) |
| $25,000 to $29,999 | 16 (3.6%) | 102 (18.2%) |
| $30,000 to $34,999 | 52 (11.8%) | 19 (3.4%) |
| $35,000 to $39,999 | 18 (4.1%) | 43 (7.7%) |
| $40,000 to $44,999 | 12 (2.7%) | 70 (12.5%) |
| $45,000 to $49,999 | 0 (0.0%) | 56 (10.0%) |
| $50,000 to $54,999 | 41 (9.3%) | 0 (0.0%) |
| $55,000 to $64,999 | 10 (2.3%) | 19 (3.4%) |
| $65,000 to $74,999 | 19 (4.3%) | 23 (4.1%) |
| $75,000 to $99,999 | 111 (25.1%) | 21 (3.7%) |
| $100,000+ | 102 (23.1%) | 40 (7.1%) |
| Total | 442 (100.0%) | 560 (100.0%) |
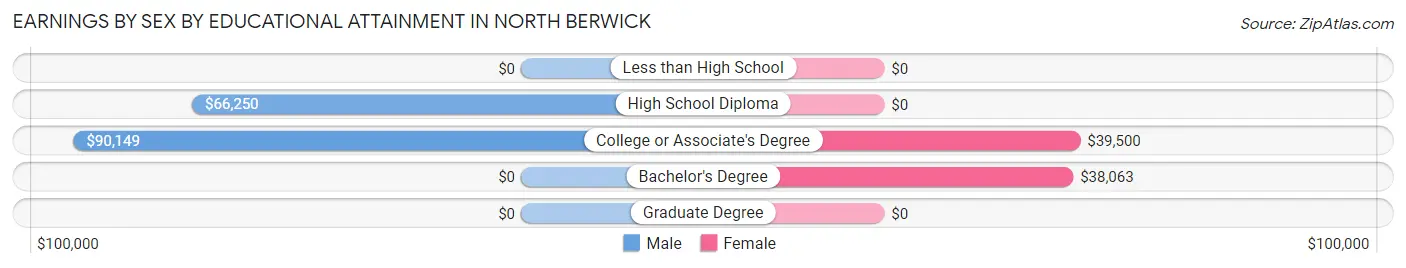
Earnings by Sex by Educational Attainment in North Berwick
Average earnings in North Berwick are $75,670 for men and $34,145 for women, a difference of 54.9%. Men with an educational attainment of college or associate's degree enjoy the highest average annual earnings of $90,149, while those with high school diploma education earn the least with $66,250. Women with an educational attainment of college or associate's degree earn the most with the average annual earnings of $39,500, while those with bachelor's degree education have the smallest earnings of $38,063.
| Educational Attainment | Male Income | Female Income |
| Less than High School | - | - |
| High School Diploma | $66,250 | $0 |
| College or Associate's Degree | $90,149 | $39,500 |
| Bachelor's Degree | - | - |
| Graduate Degree | - | - |
| Total | $75,670 | $34,145 |
Family Income in North Berwick
Family Income Brackets in North Berwick
According to the North Berwick family income data, there are 120 families falling into the $35,000 to $49,999 income range, which is the most common income bracket and makes up 26.1% of all families.
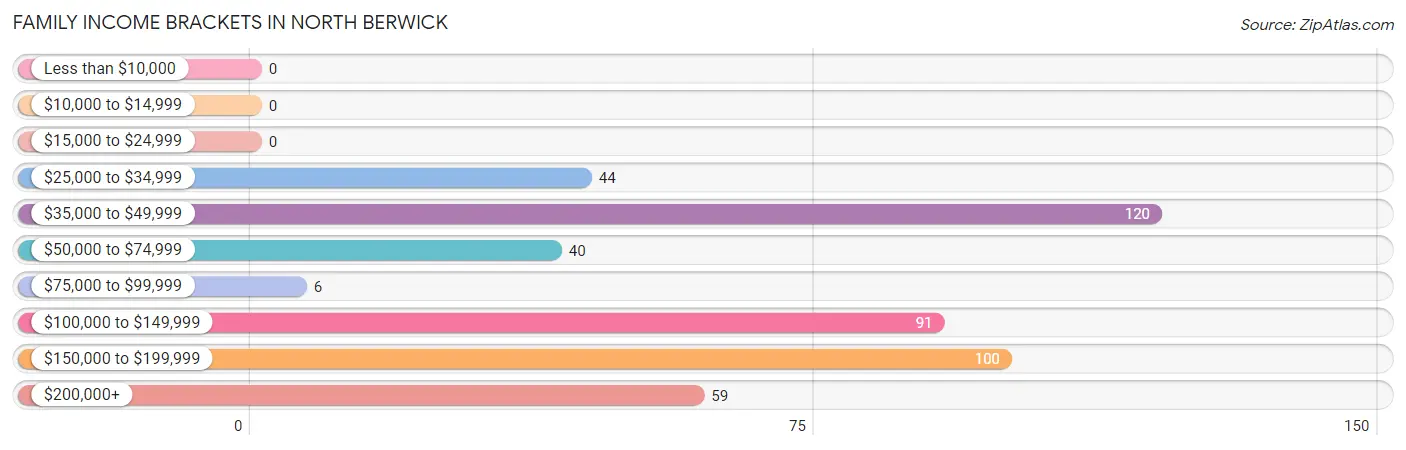
| Income Bracket | # Families | % Families |
| Less than $10,000 | 0 | 0.0% |
| $10,000 to $14,999 | 0 | 0.0% |
| $15,000 to $24,999 | 0 | 0.0% |
| $25,000 to $34,999 | 44 | 9.6% |
| $35,000 to $49,999 | 120 | 26.1% |
| $50,000 to $74,999 | 40 | 8.7% |
| $75,000 to $99,999 | 6 | 1.3% |
| $100,000 to $149,999 | 91 | 19.8% |
| $150,000 to $199,999 | 100 | 21.7% |
| $200,000+ | 59 | 12.8% |
Family Income by Famaliy Size in North Berwick
5-person families (68 | 14.8%) account for the highest median family income in North Berwick with $158,077 per family, while 5-person families (68 | 14.8%) have the highest median income of $31,615 per family member.
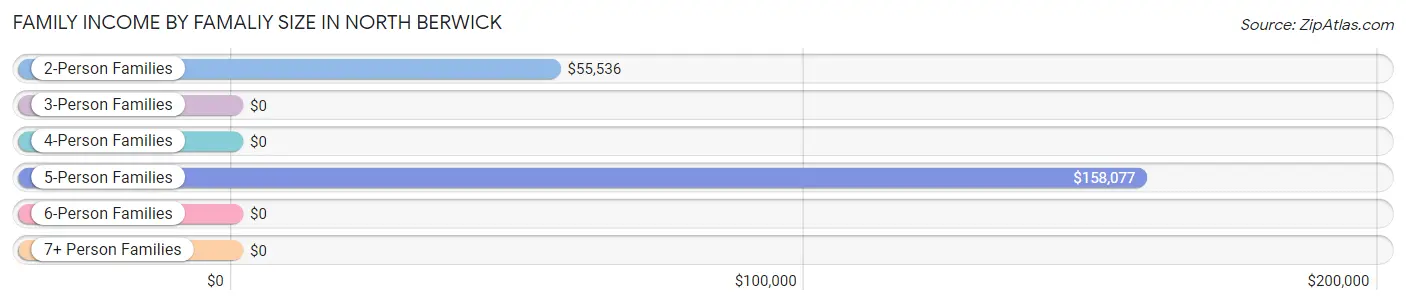
| Income Bracket | # Families | Median Income |
| 2-Person Families | 199 (43.3%) | $55,536 |
| 3-Person Families | 151 (32.8%) | $0 |
| 4-Person Families | 42 (9.1%) | $0 |
| 5-Person Families | 68 (14.8%) | $158,077 |
| 6-Person Families | 0 (0.0%) | $0 |
| 7+ Person Families | 0 (0.0%) | $0 |
| Total | 460 (100.0%) | $102,273 |
Family Income by Number of Earners in North Berwick
The median family income in North Berwick is $102,273, with families comprising 3+ earners (112) having the highest median family income of $151,845, while families with 1 earner (159) have the lowest median family income of $42,161, accounting for 24.3% and 34.6% of families, respectively.
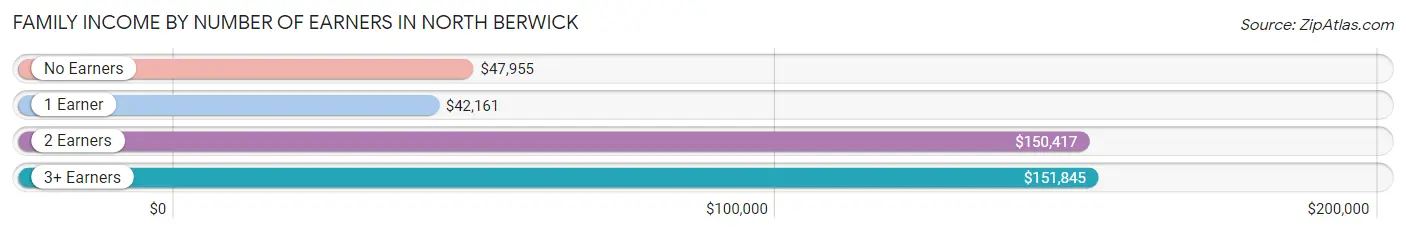
| Number of Earners | # Families | Median Income |
| No Earners | 48 (10.4%) | $47,955 |
| 1 Earner | 159 (34.6%) | $42,161 |
| 2 Earners | 141 (30.6%) | $150,417 |
| 3+ Earners | 112 (24.3%) | $151,845 |
| Total | 460 (100.0%) | $102,273 |
Household Income in North Berwick
Household Income Brackets in North Berwick
With 152 households falling in the category, the $35,000 to $49,999 income range is the most frequent in North Berwick, accounting for 19.4% of all households. In contrast, only 6 households (0.8%) fall into the $75,000 to $99,999 income bracket, making it the least populous group.
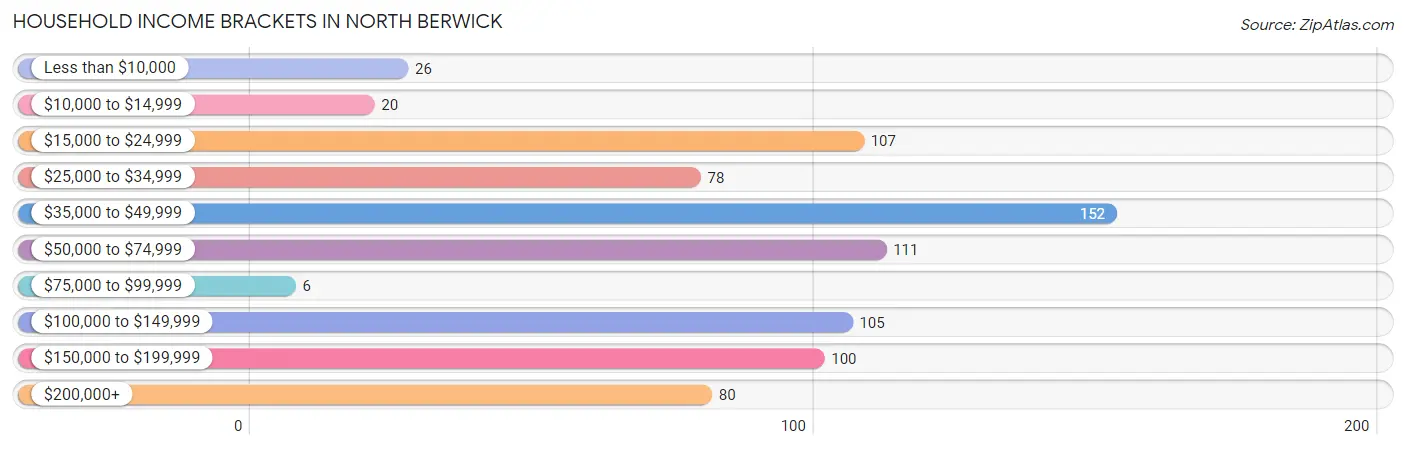
| Income Bracket | # Households | % Households |
| Less than $10,000 | 26 | 3.3% |
| $10,000 to $14,999 | 20 | 2.5% |
| $15,000 to $24,999 | 107 | 13.6% |
| $25,000 to $34,999 | 78 | 9.9% |
| $35,000 to $49,999 | 152 | 19.4% |
| $50,000 to $74,999 | 111 | 14.1% |
| $75,000 to $99,999 | 6 | 0.8% |
| $100,000 to $149,999 | 105 | 13.4% |
| $150,000 to $199,999 | 100 | 12.7% |
| $200,000+ | 80 | 10.2% |
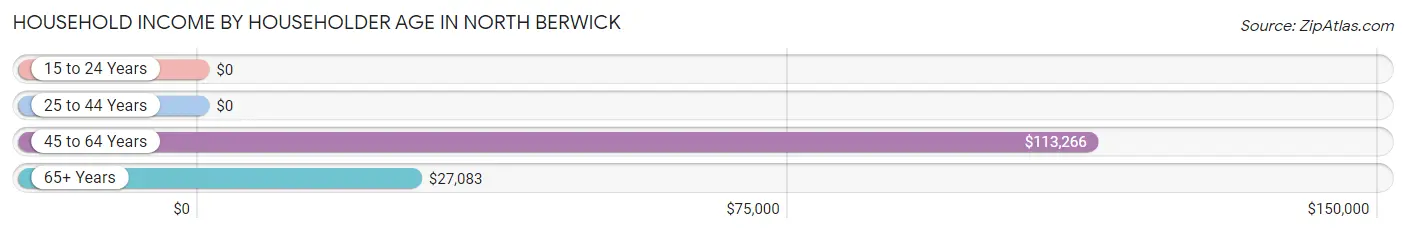
Household Income by Householder Age in North Berwick
The median household income in North Berwick is $50,579, with the highest median household income of $113,266 found in the 45 to 64 years age bracket for the primary householder. A total of 285 households (36.3%) fall into this category. Meanwhile, the 15 to 24 years age bracket for the primary householder has the lowest median household income of $0, with 11 households (1.4%) in this group.
| Income Bracket | # Households | Median Income |
| 15 to 24 Years | 11 (1.4%) | $0 |
| 25 to 44 Years | 219 (27.9%) | $0 |
| 45 to 64 Years | 285 (36.3%) | $113,266 |
| 65+ Years | 270 (34.4%) | $27,083 |
| Total | 785 (100.0%) | $50,579 |
Poverty in North Berwick
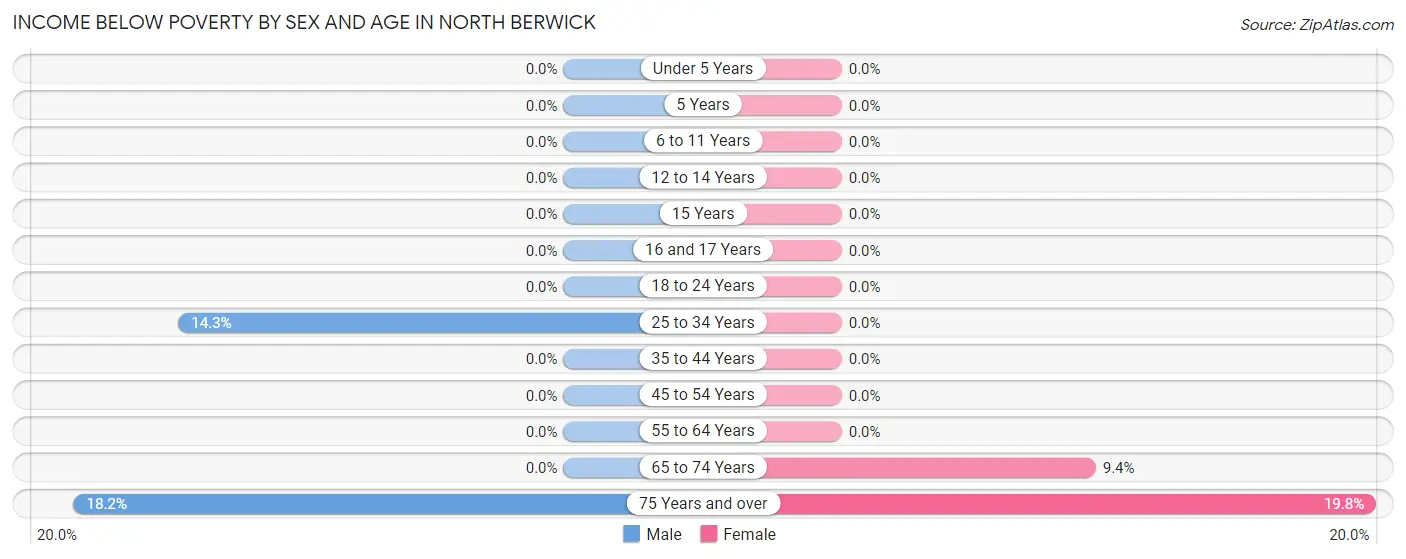
Income Below Poverty by Sex and Age in North Berwick
With 2.8% poverty level for males and 3.3% for females among the residents of North Berwick, 75 year old and over males and 75 year old and over females are the most vulnerable to poverty, with 12 males (18.2%) and 24 females (19.8%) in their respective age groups living below the poverty level.
| Age Bracket | Male | Female |
| Under 5 Years | 0 (0.0%) | 0 (0.0%) |
| 5 Years | 0 (0.0%) | 0 (0.0%) |
| 6 to 11 Years | 0 (0.0%) | 0 (0.0%) |
| 12 to 14 Years | 0 (0.0%) | 0 (0.0%) |
| 15 Years | 0 (0.0%) | 0 (0.0%) |
| 16 and 17 Years | 0 (0.0%) | 0 (0.0%) |
| 18 to 24 Years | 0 (0.0%) | 0 (0.0%) |
| 25 to 34 Years | 7 (14.3%) | 0 (0.0%) |
| 35 to 44 Years | 0 (0.0%) | 0 (0.0%) |
| 45 to 54 Years | 0 (0.0%) | 0 (0.0%) |
| 55 to 64 Years | 0 (0.0%) | 0 (0.0%) |
| 65 to 74 Years | 0 (0.0%) | 10 (9.4%) |
| 75 Years and over | 12 (18.2%) | 24 (19.8%) |
| Total | 19 (2.8%) | 34 (3.3%) |
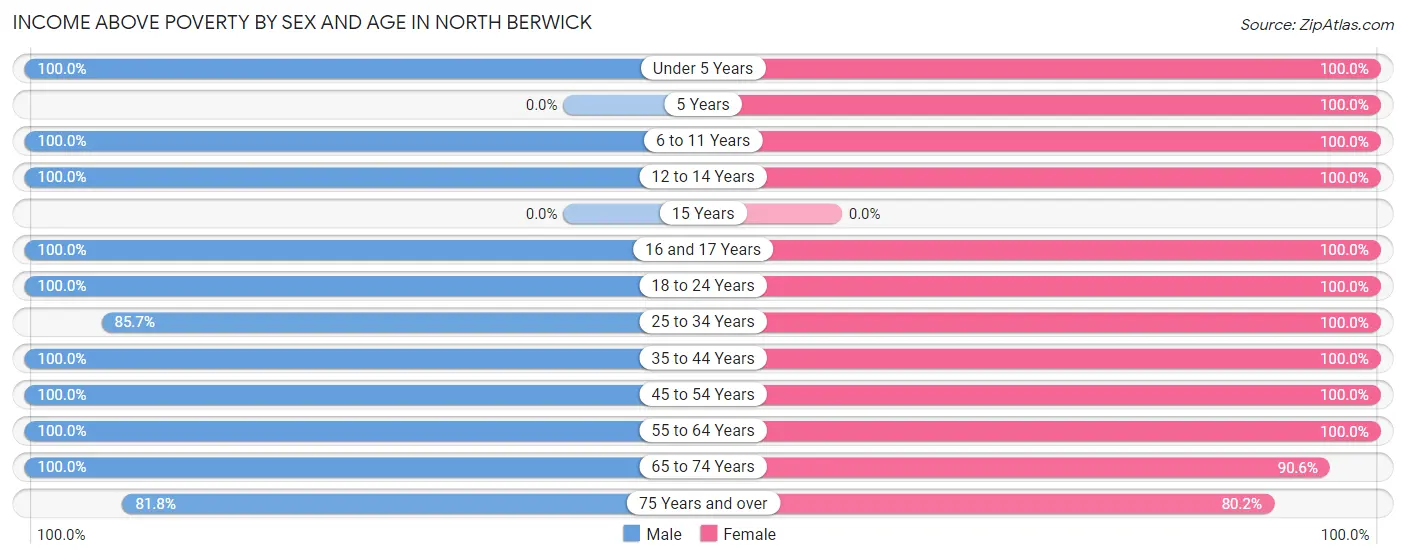
Income Above Poverty by Sex and Age in North Berwick
According to the poverty statistics in North Berwick, males aged under 5 years and females aged under 5 years are the age groups that are most secure financially, with 100.0% of males and 100.0% of females in these age groups living above the poverty line.
| Age Bracket | Male | Female |
| Under 5 Years | 17 (100.0%) | 31 (100.0%) |
| 5 Years | 0 (0.0%) | 50 (100.0%) |
| 6 to 11 Years | 47 (100.0%) | 76 (100.0%) |
| 12 to 14 Years | 69 (100.0%) | 64 (100.0%) |
| 15 Years | 0 (0.0%) | 0 (0.0%) |
| 16 and 17 Years | 9 (100.0%) | 49 (100.0%) |
| 18 to 24 Years | 37 (100.0%) | 99 (100.0%) |
| 25 to 34 Years | 42 (85.7%) | 92 (100.0%) |
| 35 to 44 Years | 104 (100.0%) | 72 (100.0%) |
| 45 to 54 Years | 110 (100.0%) | 134 (100.0%) |
| 55 to 64 Years | 121 (100.0%) | 147 (100.0%) |
| 65 to 74 Years | 57 (100.0%) | 96 (90.6%) |
| 75 Years and over | 54 (81.8%) | 97 (80.2%) |
| Total | 667 (97.2%) | 1,007 (96.7%) |
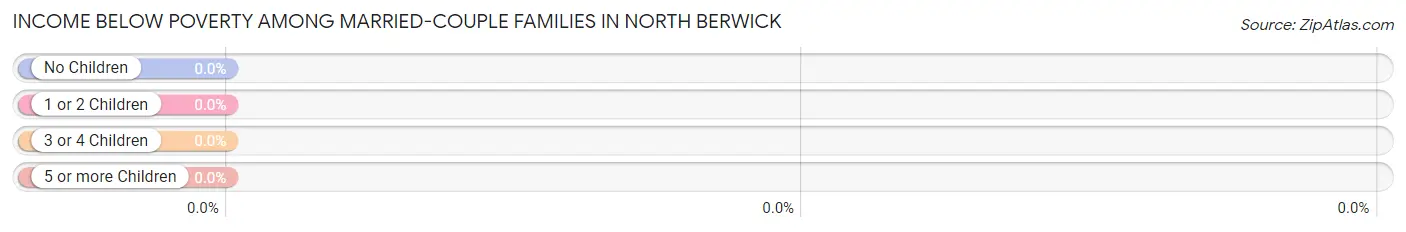
Income Below Poverty Among Married-Couple Families in North Berwick
| Children | Above Poverty | Below Poverty |
| No Children | 199 (100.0%) | 0 (0.0%) |
| 1 or 2 Children | 97 (100.0%) | 0 (0.0%) |
| 3 or 4 Children | 27 (100.0%) | 0 (0.0%) |
| 5 or more Children | 0 (0.0%) | 0 (0.0%) |
| Total | 323 (100.0%) | 0 (0.0%) |
Income Below Poverty Among Single-Parent Households in North Berwick
| Children | Single Father | Single Mother |
| No Children | 0 (0.0%) | 0 (0.0%) |
| 1 or 2 Children | 0 (0.0%) | 0 (0.0%) |
| 3 or 4 Children | 0 (0.0%) | 0 (0.0%) |
| 5 or more Children | 0 (0.0%) | 0 (0.0%) |
| Total | 0 (0.0%) | 0 (0.0%) |
Income Below Poverty Among Married-Couple vs Single-Parent Households in North Berwick
| Children | Married-Couple Families | Single-Parent Households |
| No Children | 0 (0.0%) | 0 (0.0%) |
| 1 or 2 Children | 0 (0.0%) | 0 (0.0%) |
| 3 or 4 Children | 0 (0.0%) | 0 (0.0%) |
| 5 or more Children | 0 (0.0%) | 0 (0.0%) |
| Total | 0 (0.0%) | 0 (0.0%) |
Race in North Berwick
The most populous races in North Berwick are White / Caucasian (1,610 | 89.1%), Two or more Races (174 | 9.6%), and Hispanic or Latino (107 | 5.9%).
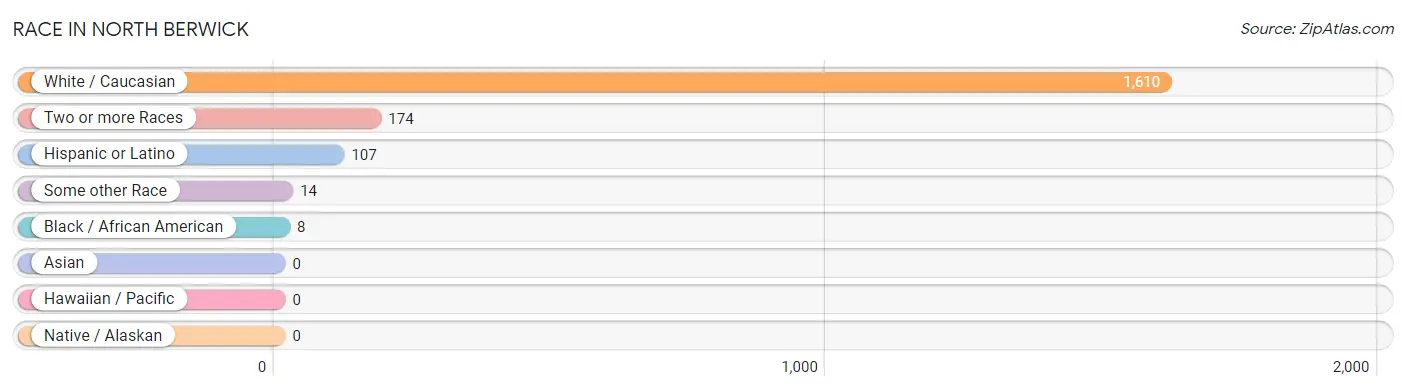
| Race | # Population | % Population |
| Asian | 0 | 0.0% |
| Black / African American | 8 | 0.4% |
| Hawaiian / Pacific | 0 | 0.0% |
| Hispanic or Latino | 107 | 5.9% |
| Native / Alaskan | 0 | 0.0% |
| White / Caucasian | 1,610 | 89.1% |
| Two or more Races | 174 | 9.6% |
| Some other Race | 14 | 0.8% |
| Total | 1,806 | 100.0% |
Ancestry in North Berwick
The most populous ancestries reported in North Berwick are English (697 | 38.6%), Irish (267 | 14.8%), French (244 | 13.5%), American (179 | 9.9%), and Norwegian (147 | 8.1%), together accounting for 84.9% of all North Berwick residents.
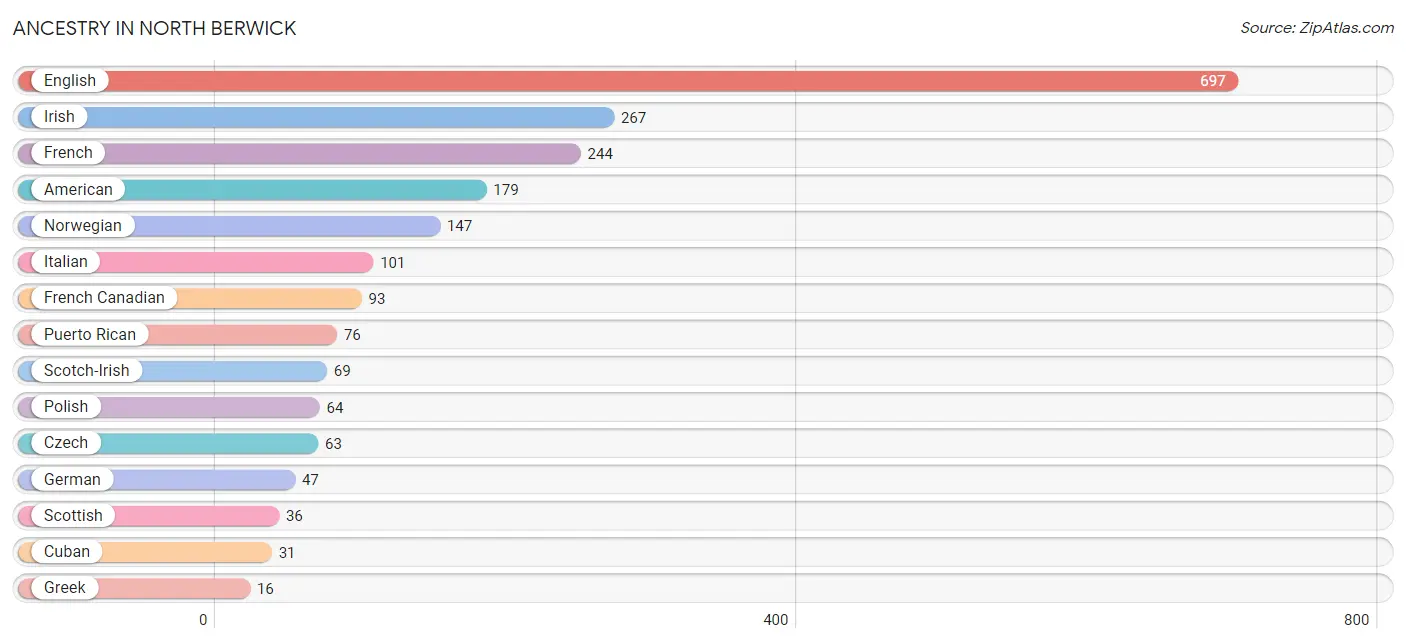
| Ancestry | # Population | % Population |
| American | 179 | 9.9% |
| Austrian | 4 | 0.2% |
| Brazilian | 14 | 0.8% |
| Cuban | 31 | 1.7% |
| Czech | 63 | 3.5% |
| Czechoslovakian | 10 | 0.5% |
| Dutch | 9 | 0.5% |
| Eastern European | 10 | 0.5% |
| English | 697 | 38.6% |
| French | 244 | 13.5% |
| French Canadian | 93 | 5.1% |
| German | 47 | 2.6% |
| Greek | 16 | 0.9% |
| Irish | 267 | 14.8% |
| Italian | 101 | 5.6% |
| Northern European | 6 | 0.3% |
| Norwegian | 147 | 8.1% |
| Pennsylvania German | 12 | 0.7% |
| Polish | 64 | 3.5% |
| Puerto Rican | 76 | 4.2% |
| Russian | 10 | 0.5% |
| Scotch-Irish | 69 | 3.8% |
| Scottish | 36 | 2.0% | View All 23 Rows |
Immigrants in North Berwick
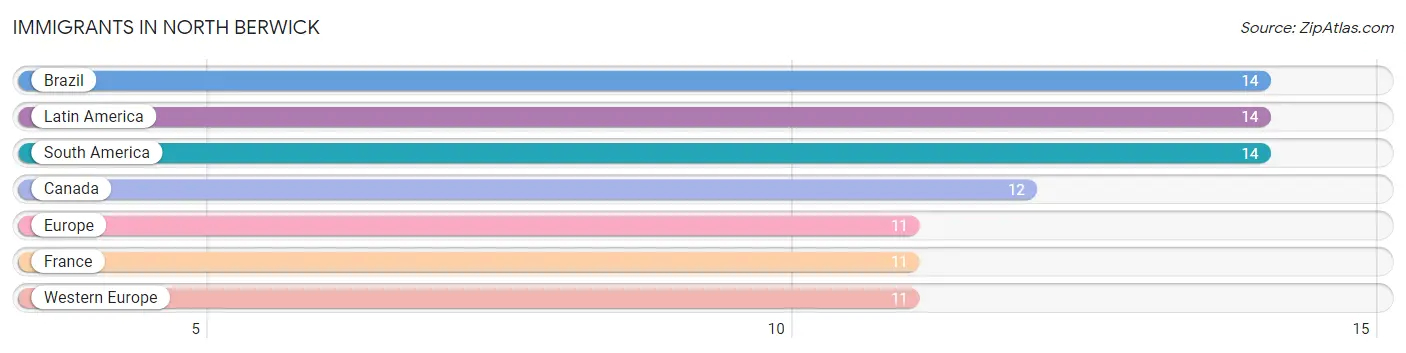
The most numerous immigrant groups reported in North Berwick came from Brazil (14 | 0.8%), Latin America (14 | 0.8%), South America (14 | 0.8%), Canada (12 | 0.7%), and Europe (11 | 0.6%), together accounting for 3.6% of all North Berwick residents.
| Immigration Origin | # Population | % Population |
| Brazil | 14 | 0.8% |
| Canada | 12 | 0.7% |
| Europe | 11 | 0.6% |
| France | 11 | 0.6% |
| Latin America | 14 | 0.8% |
| South America | 14 | 0.8% |
| Western Europe | 11 | 0.6% | View All 7 Rows |
Sex and Age in North Berwick
Sex and Age in North Berwick
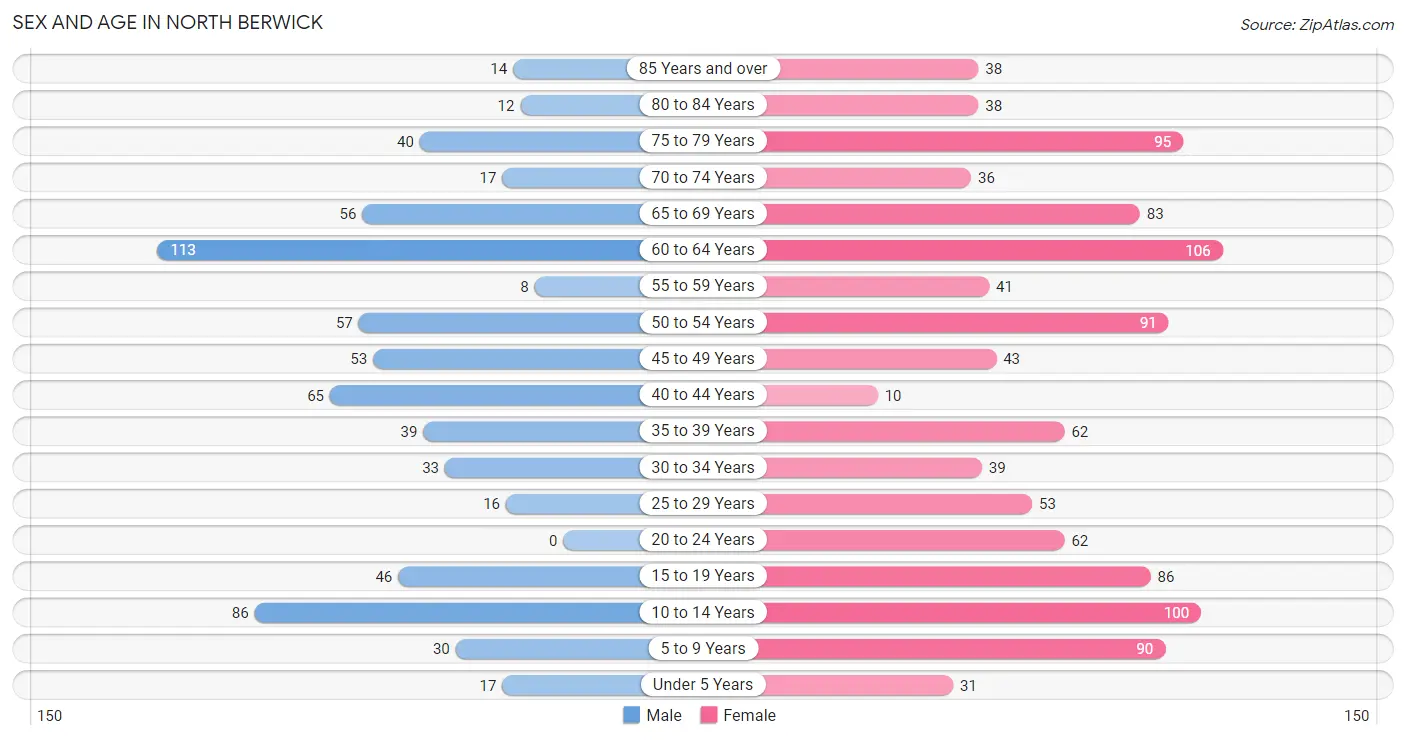
The most populous age groups in North Berwick are 60 to 64 Years (113 | 16.1%) for men and 60 to 64 Years (106 | 9.6%) for women.
| Age Bracket | Male | Female |
| Under 5 Years | 17 (2.4%) | 31 (2.8%) |
| 5 to 9 Years | 30 (4.3%) | 90 (8.2%) |
| 10 to 14 Years | 86 (12.2%) | 100 (9.1%) |
| 15 to 19 Years | 46 (6.6%) | 86 (7.8%) |
| 20 to 24 Years | 0 (0.0%) | 62 (5.6%) |
| 25 to 29 Years | 16 (2.3%) | 53 (4.8%) |
| 30 to 34 Years | 33 (4.7%) | 39 (3.5%) |
| 35 to 39 Years | 39 (5.6%) | 62 (5.6%) |
| 40 to 44 Years | 65 (9.3%) | 10 (0.9%) |
| 45 to 49 Years | 53 (7.5%) | 43 (3.9%) |
| 50 to 54 Years | 57 (8.1%) | 91 (8.2%) |
| 55 to 59 Years | 8 (1.1%) | 41 (3.7%) |
| 60 to 64 Years | 113 (16.1%) | 106 (9.6%) |
| 65 to 69 Years | 56 (8.0%) | 83 (7.5%) |
| 70 to 74 Years | 17 (2.4%) | 36 (3.3%) |
| 75 to 79 Years | 40 (5.7%) | 95 (8.6%) |
| 80 to 84 Years | 12 (1.7%) | 38 (3.4%) |
| 85 Years and over | 14 (2.0%) | 38 (3.4%) |
| Total | 702 (100.0%) | 1,104 (100.0%) |
Families and Households in North Berwick
Median Family Size in North Berwick
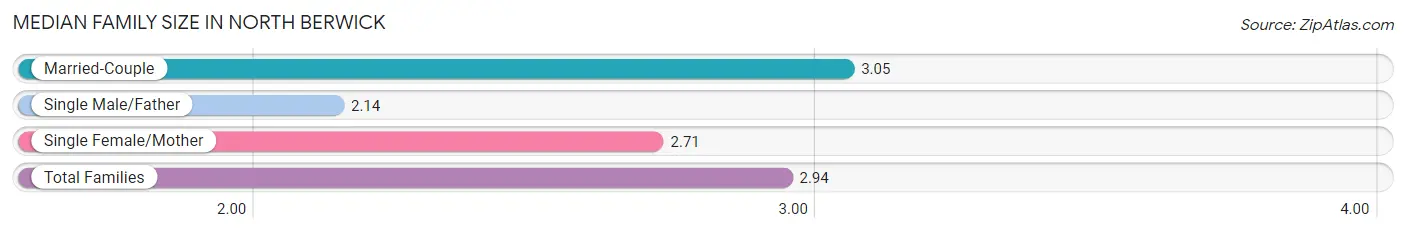
The median family size in North Berwick is 2.94 persons per family, with married-couple families (323 | 70.2%) accounting for the largest median family size of 3.05 persons per family. On the other hand, single male/father families (7 | 1.5%) represent the smallest median family size with 2.14 persons per family.
| Family Type | # Families | Family Size |
| Married-Couple | 323 (70.2%) | 3.05 |
| Single Male/Father | 7 (1.5%) | 2.14 |
| Single Female/Mother | 130 (28.3%) | 2.71 |
| Total Families | 460 (100.0%) | 2.94 |
Median Household Size in North Berwick
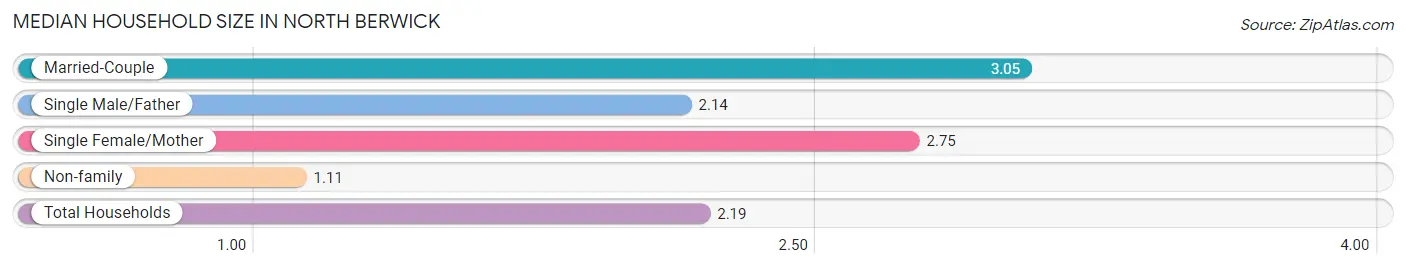
The median household size in North Berwick is 2.19 persons per household, with married-couple households (323 | 41.1%) accounting for the largest median household size of 3.05 persons per household. non-family households (325 | 41.4%) represent the smallest median household size with 1.11 persons per household.
| Household Type | # Households | Household Size |
| Married-Couple | 323 (41.1%) | 3.05 |
| Single Male/Father | 7 (0.9%) | 2.14 |
| Single Female/Mother | 130 (16.6%) | 2.75 |
| Non-family | 325 (41.4%) | 1.11 |
| Total Households | 785 (100.0%) | 2.19 |
Household Size by Marriage Status in North Berwick
Out of a total of 785 households in North Berwick, 460 (58.6%) are family households, while 325 (41.4%) are nonfamily households. The most numerous type of family households are 2-person households, comprising 199, and the most common type of nonfamily households are 1-person households, comprising 285.
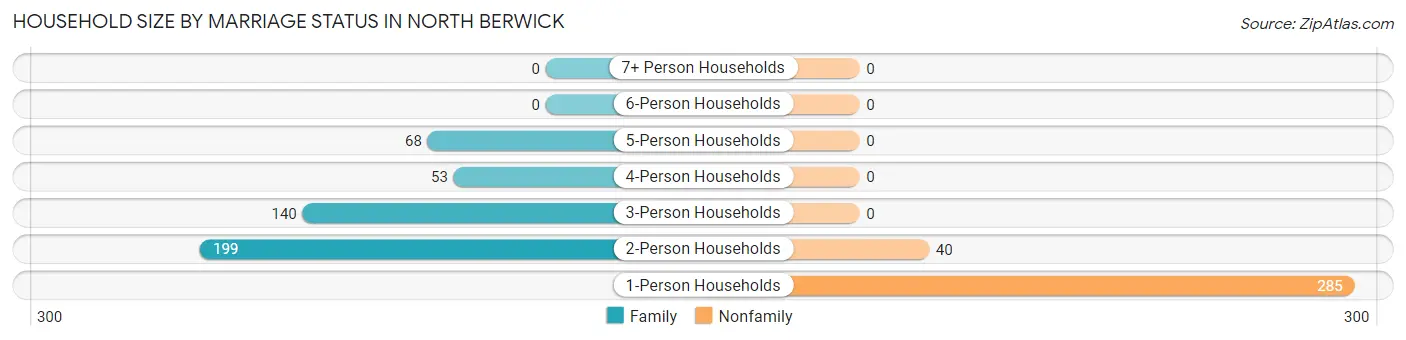
| Household Size | Family Households | Nonfamily Households |
| 1-Person Households | - | 285 (36.3%) |
| 2-Person Households | 199 (25.4%) | 40 (5.1%) |
| 3-Person Households | 140 (17.8%) | 0 (0.0%) |
| 4-Person Households | 53 (6.8%) | 0 (0.0%) |
| 5-Person Households | 68 (8.7%) | 0 (0.0%) |
| 6-Person Households | 0 (0.0%) | 0 (0.0%) |
| 7+ Person Households | 0 (0.0%) | 0 (0.0%) |
| Total | 460 (58.6%) | 325 (41.4%) |
Female Fertility in North Berwick
Fertility by Age in North Berwick
Average fertility rate in North Berwick is 48.0 births per 1,000 women. Women in the age bracket of 35 to 50 years have the highest fertility rate with 122.0 births per 1,000 women. Women in the age bracket of 35 to 50 years acount for 82.4% of all women with births.
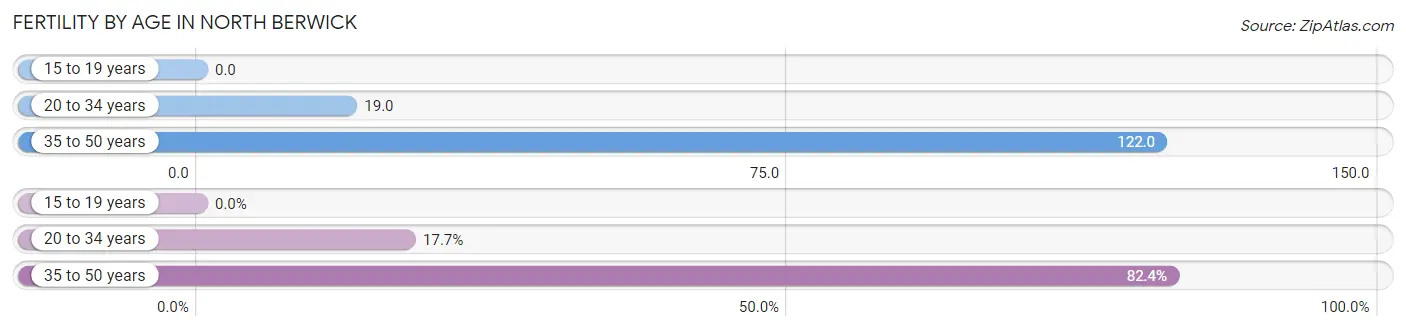
| Age Bracket | Women with Births | Births / 1,000 Women |
| 15 to 19 years | 0 (0.0%) | 0.0 |
| 20 to 34 years | 3 (17.6%) | 19.0 |
| 35 to 50 years | 14 (82.4%) | 122.0 |
| Total | 17 (100.0%) | 48.0 |
Fertility by Age by Marriage Status in North Berwick
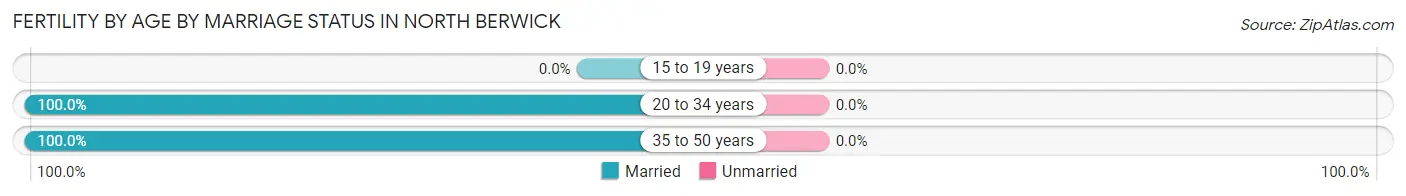
| Age Bracket | Married | Unmarried |
| 15 to 19 years | 0 (0.0%) | 0 (0.0%) |
| 20 to 34 years | 3 (100.0%) | 0 (0.0%) |
| 35 to 50 years | 14 (100.0%) | 0 (0.0%) |
| Total | 17 (100.0%) | 0 (0.0%) |
Fertility by Education in North Berwick
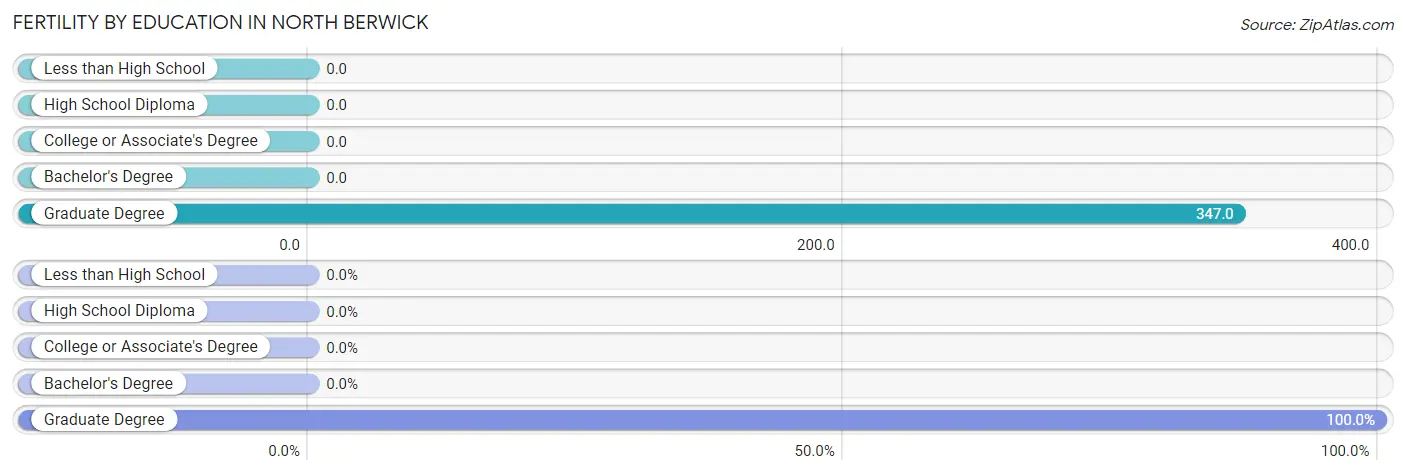
| Educational Attainment | Women with Births | Births / 1,000 Women |
| Less than High School | 0 (0.0%) | 0.0 |
| High School Diploma | 0 (0.0%) | 0.0 |
| College or Associate's Degree | 0 (0.0%) | 0.0 |
| Bachelor's Degree | 0 (0.0%) | 0.0 |
| Graduate Degree | 17 (100.0%) | 347.0 |
| Total | 17 (100.0%) | 48.0 |
Fertility by Education by Marriage Status in North Berwick
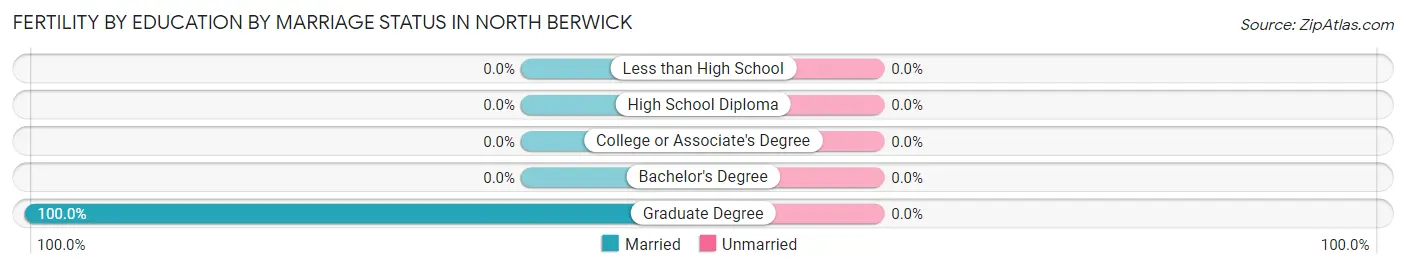
| Educational Attainment | Married | Unmarried |
| Less than High School | 0 (0.0%) | 0 (0.0%) |
| High School Diploma | 0 (0.0%) | 0 (0.0%) |
| College or Associate's Degree | 0 (0.0%) | 0 (0.0%) |
| Bachelor's Degree | 0 (0.0%) | 0 (0.0%) |
| Graduate Degree | 17 (100.0%) | 0 (0.0%) |
| Total | 17 (100.0%) | 0 (0.0%) |
Employment Characteristics in North Berwick
Employment by Class of Employer in North Berwick
Among the 911 employed individuals in North Berwick, private company employees (541 | 59.4%), not-for-profit organizations (114 | 12.5%), and local government employees (81 | 8.9%) make up the most common classes of employment.
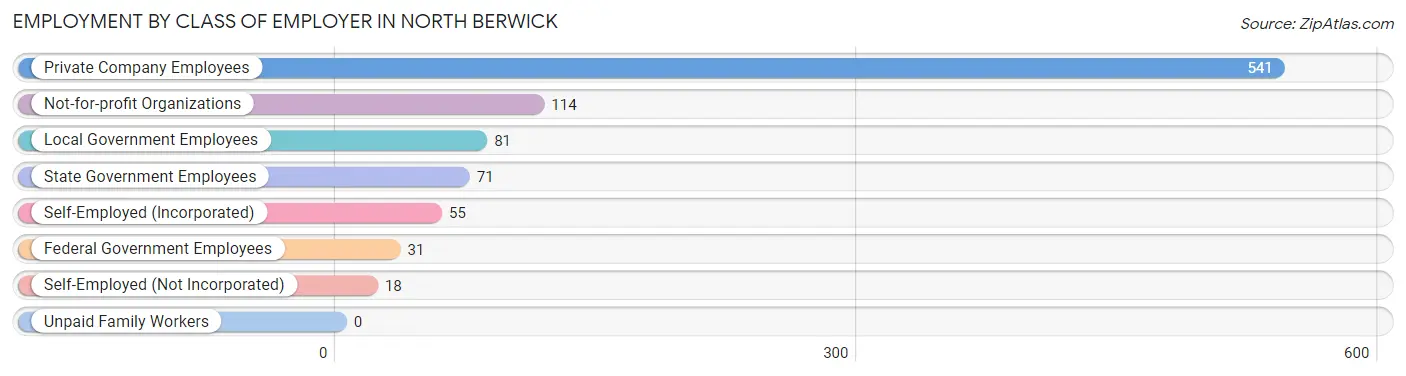
| Employer Class | # Employees | % Employees |
| Private Company Employees | 541 | 59.4% |
| Self-Employed (Incorporated) | 55 | 6.0% |
| Self-Employed (Not Incorporated) | 18 | 2.0% |
| Not-for-profit Organizations | 114 | 12.5% |
| Local Government Employees | 81 | 8.9% |
| State Government Employees | 71 | 7.8% |
| Federal Government Employees | 31 | 3.4% |
| Unpaid Family Workers | 0 | 0.0% |
| Total | 911 | 100.0% |
Employment Status by Age in North Berwick
According to the labor force statistics for North Berwick, out of the total population over 16 years of age (1,452), 65.8% or 955 individuals are in the labor force, with 0.7% or 7 of them unemployed. The age group with the highest labor force participation rate is 20 to 24 years, with 100.0% or 62 individuals in the labor force. Within the labor force, the 30 to 34 years age range has the highest percentage of unemployed individuals, with 9.7% or 7 of them being unemployed.
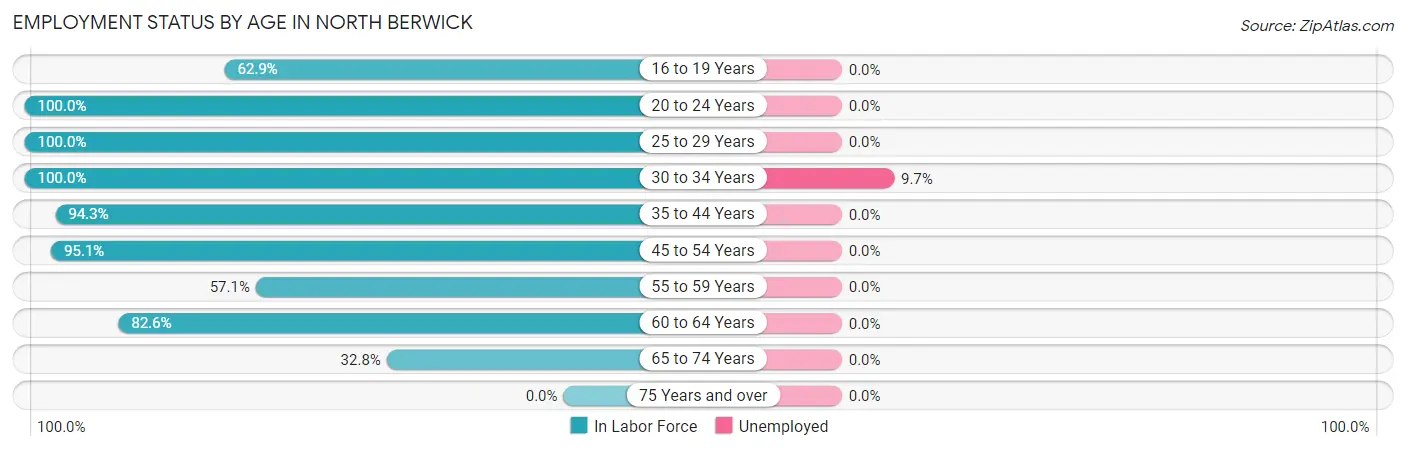
| Age Bracket | In Labor Force | Unemployed |
| 16 to 19 Years | 83 (62.9%) | 0 (0.0%) |
| 20 to 24 Years | 62 (100.0%) | 0 (0.0%) |
| 25 to 29 Years | 69 (100.0%) | 0 (0.0%) |
| 30 to 34 Years | 72 (100.0%) | 7 (9.7%) |
| 35 to 44 Years | 166 (94.3%) | 0 (0.0%) |
| 45 to 54 Years | 232 (95.1%) | 0 (0.0%) |
| 55 to 59 Years | 28 (57.1%) | 0 (0.0%) |
| 60 to 64 Years | 181 (82.6%) | 0 (0.0%) |
| 65 to 74 Years | 63 (32.8%) | 0 (0.0%) |
| 75 Years and over | 0 (0.0%) | 0 (0.0%) |
| Total | 955 (65.8%) | 7 (0.7%) |
Employment Status by Educational Attainment in North Berwick
According to labor force statistics for North Berwick, 90.2% of individuals (748) out of the total population between 25 and 64 years of age (829) are in the labor force, with 0.9% or 7 of them being unemployed. The group with the highest labor force participation rate are those with the educational attainment of less than high school, with 100.0% or 12 individuals in the labor force. Within the labor force, individuals with high school diploma education have the highest percentage of unemployment, with 3.4% or 7 of them being unemployed.
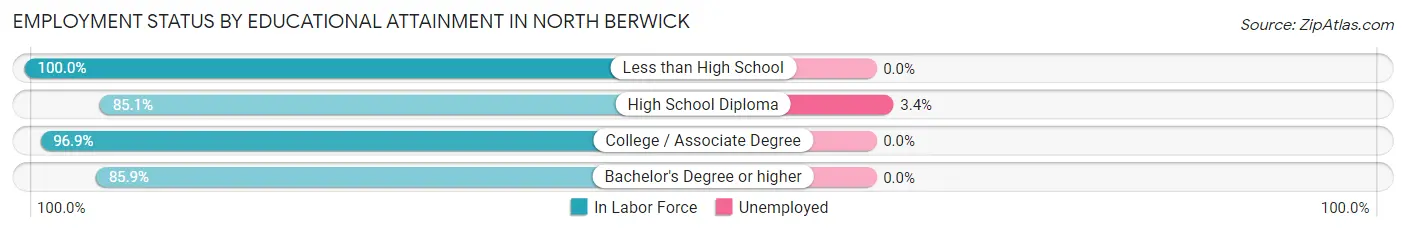
| Educational Attainment | In Labor Force | Unemployed |
| Less than High School | 12 (100.0%) | 0 (0.0%) |
| High School Diploma | 206 (85.1%) | 8 (3.4%) |
| College / Associate Degree | 316 (96.9%) | 0 (0.0%) |
| Bachelor's Degree or higher | 214 (85.9%) | 0 (0.0%) |
| Total | 748 (90.2%) | 7 (0.9%) |
Employment Occupations by Sex in North Berwick
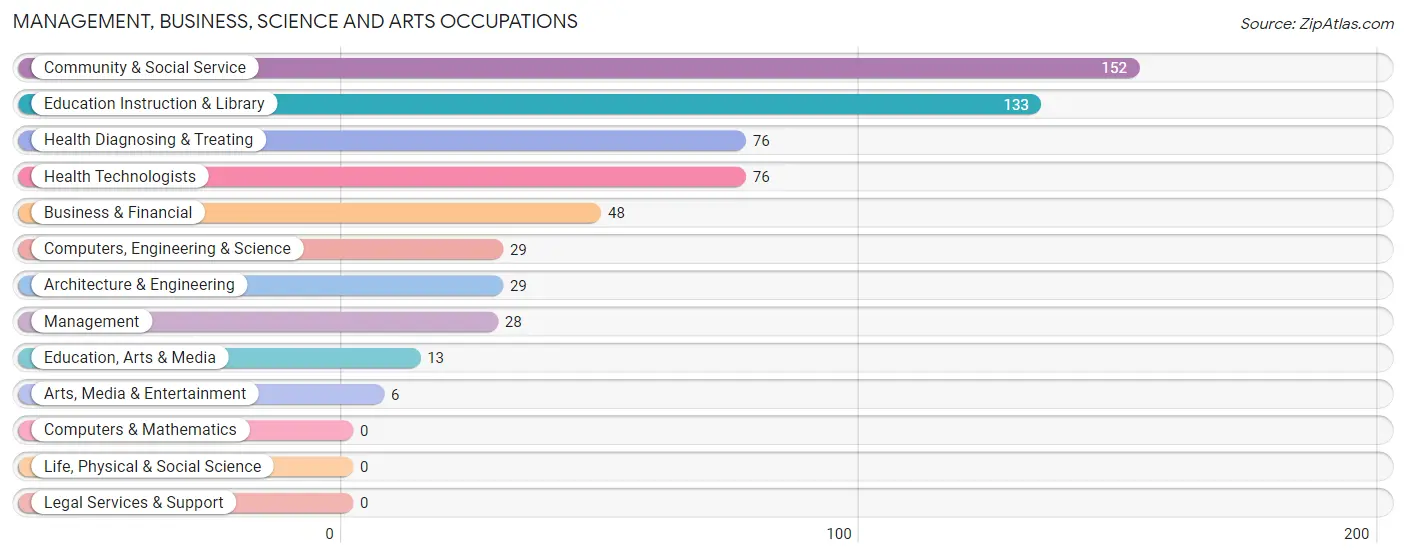
Management, Business, Science and Arts Occupations
The most common Management, Business, Science and Arts occupations in North Berwick are Community & Social Service (152 | 16.0%), Education Instruction & Library (133 | 14.0%), Health Diagnosing & Treating (76 | 8.0%), Health Technologists (76 | 8.0%), and Business & Financial (48 | 5.1%).
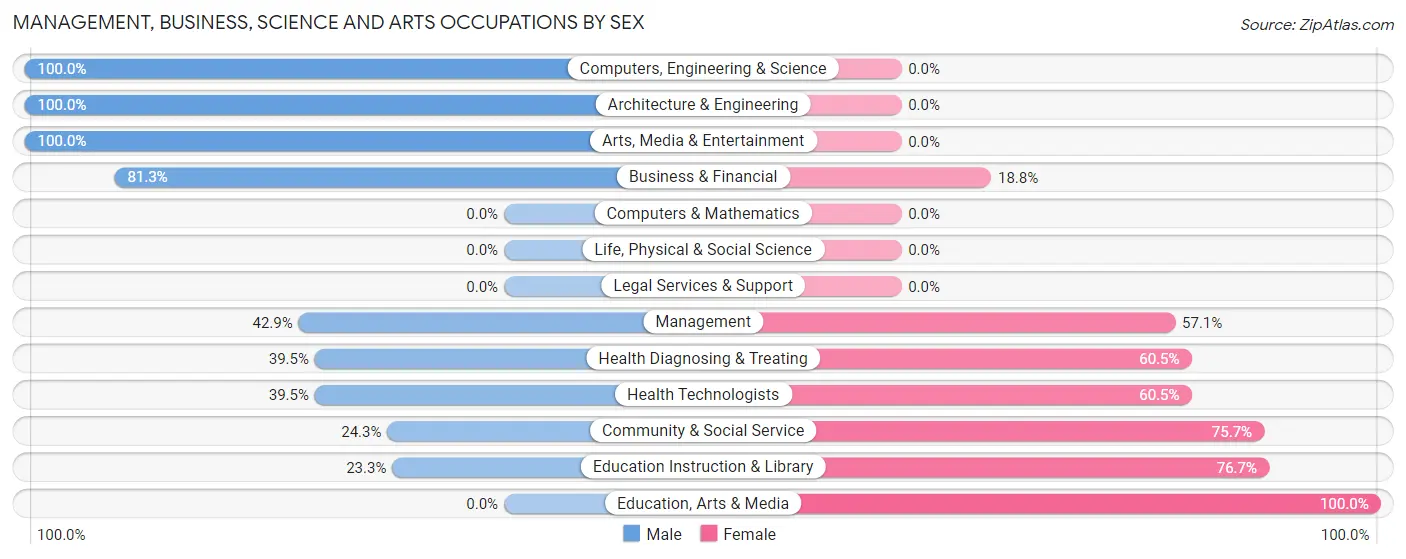
Management, Business, Science and Arts Occupations by Sex
Within the Management, Business, Science and Arts occupations in North Berwick, the most male-oriented occupations are Computers, Engineering & Science (100.0%), Architecture & Engineering (100.0%), and Arts, Media & Entertainment (100.0%), while the most female-oriented occupations are Education, Arts & Media (100.0%), Education Instruction & Library (76.7%), and Community & Social Service (75.7%).
| Occupation | Male | Female |
| Management | 12 (42.9%) | 16 (57.1%) |
| Business & Financial | 39 (81.2%) | 9 (18.8%) |
| Computers, Engineering & Science | 29 (100.0%) | 0 (0.0%) |
| Computers & Mathematics | 0 (0.0%) | 0 (0.0%) |
| Architecture & Engineering | 29 (100.0%) | 0 (0.0%) |
| Life, Physical & Social Science | 0 (0.0%) | 0 (0.0%) |
| Community & Social Service | 37 (24.3%) | 115 (75.7%) |
| Education, Arts & Media | 0 (0.0%) | 13 (100.0%) |
| Legal Services & Support | 0 (0.0%) | 0 (0.0%) |
| Education Instruction & Library | 31 (23.3%) | 102 (76.7%) |
| Arts, Media & Entertainment | 6 (100.0%) | 0 (0.0%) |
| Health Diagnosing & Treating | 30 (39.5%) | 46 (60.5%) |
| Health Technologists | 30 (39.5%) | 46 (60.5%) |
| Total (Category) | 147 (44.1%) | 186 (55.9%) |
| Total (Overall) | 435 (45.8%) | 514 (54.2%) |
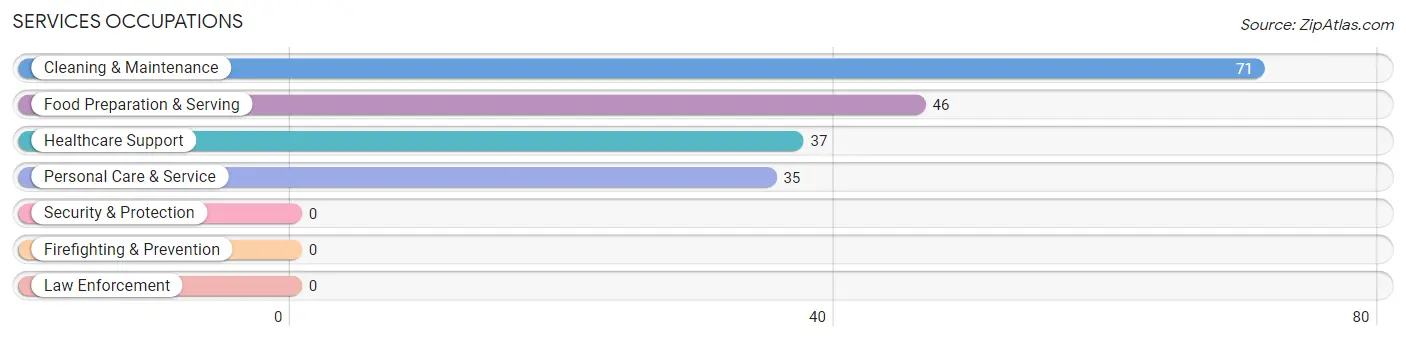
Services Occupations
The most common Services occupations in North Berwick are Cleaning & Maintenance (71 | 7.5%), Food Preparation & Serving (46 | 4.9%), Healthcare Support (37 | 3.9%), and Personal Care & Service (35 | 3.7%).
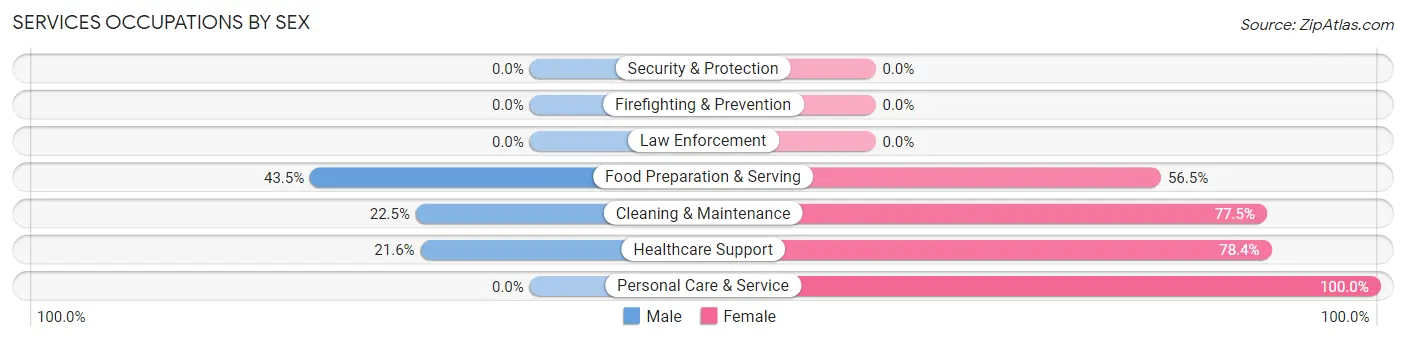
Services Occupations by Sex
Within the Services occupations in North Berwick, the most male-oriented occupations are Food Preparation & Serving (43.5%), Cleaning & Maintenance (22.5%), and Healthcare Support (21.6%), while the most female-oriented occupations are Personal Care & Service (100.0%), Healthcare Support (78.4%), and Cleaning & Maintenance (77.5%).
| Occupation | Male | Female |
| Healthcare Support | 8 (21.6%) | 29 (78.4%) |
| Security & Protection | 0 (0.0%) | 0 (0.0%) |
| Firefighting & Prevention | 0 (0.0%) | 0 (0.0%) |
| Law Enforcement | 0 (0.0%) | 0 (0.0%) |
| Food Preparation & Serving | 20 (43.5%) | 26 (56.5%) |
| Cleaning & Maintenance | 16 (22.5%) | 55 (77.5%) |
| Personal Care & Service | 0 (0.0%) | 35 (100.0%) |
| Total (Category) | 44 (23.3%) | 145 (76.7%) |
| Total (Overall) | 435 (45.8%) | 514 (54.2%) |
Sales and Office Occupations
The most common Sales and Office occupations in North Berwick are Office & Administration (172 | 18.1%), and Sales & Related (30 | 3.2%).
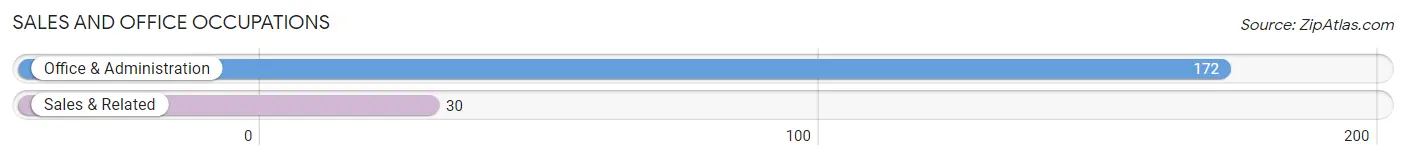
Sales and Office Occupations by Sex
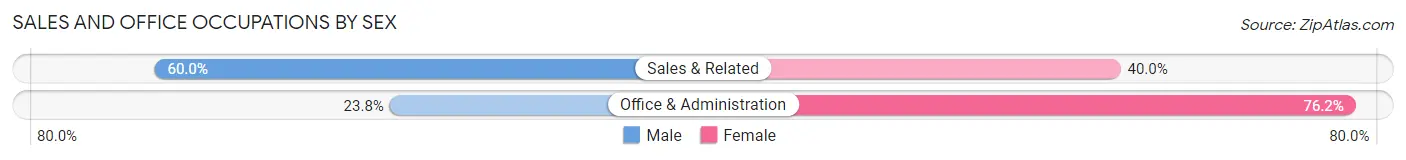
| Occupation | Male | Female |
| Sales & Related | 18 (60.0%) | 12 (40.0%) |
| Office & Administration | 41 (23.8%) | 131 (76.2%) |
| Total (Category) | 59 (29.2%) | 143 (70.8%) |
| Total (Overall) | 435 (45.8%) | 514 (54.2%) |
Natural Resources, Construction and Maintenance Occupations
The most common Natural Resources, Construction and Maintenance occupations in North Berwick are Installation, Maintenance & Repair (96 | 10.1%), and Construction & Extraction (47 | 5.0%).
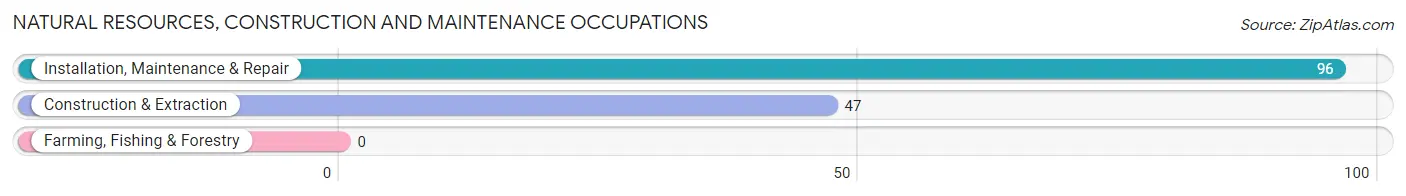
Natural Resources, Construction and Maintenance Occupations by Sex
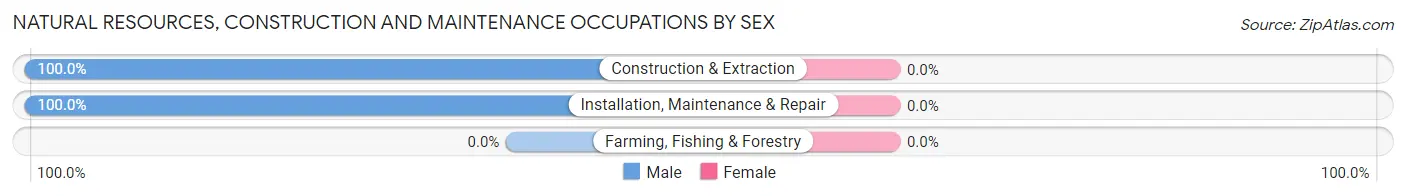
| Occupation | Male | Female |
| Farming, Fishing & Forestry | 0 (0.0%) | 0 (0.0%) |
| Construction & Extraction | 47 (100.0%) | 0 (0.0%) |
| Installation, Maintenance & Repair | 96 (100.0%) | 0 (0.0%) |
| Total (Category) | 143 (100.0%) | 0 (0.0%) |
| Total (Overall) | 435 (45.8%) | 514 (54.2%) |
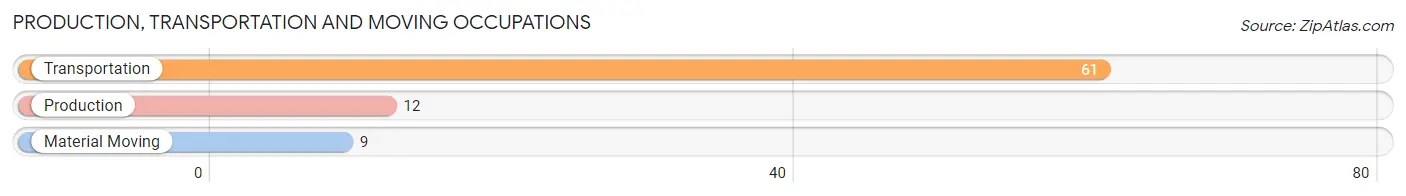
Production, Transportation and Moving Occupations
The most common Production, Transportation and Moving occupations in North Berwick are Transportation (61 | 6.4%), Production (12 | 1.3%), and Material Moving (9 | 0.9%).
Production, Transportation and Moving Occupations by Sex
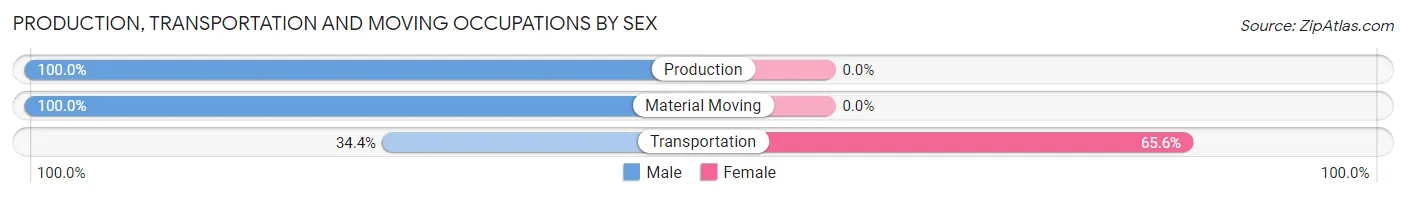
| Occupation | Male | Female |
| Production | 12 (100.0%) | 0 (0.0%) |
| Transportation | 21 (34.4%) | 40 (65.6%) |
| Material Moving | 9 (100.0%) | 0 (0.0%) |
| Total (Category) | 42 (51.2%) | 40 (48.8%) |
| Total (Overall) | 435 (45.8%) | 514 (54.2%) |
Employment Industries by Sex in North Berwick
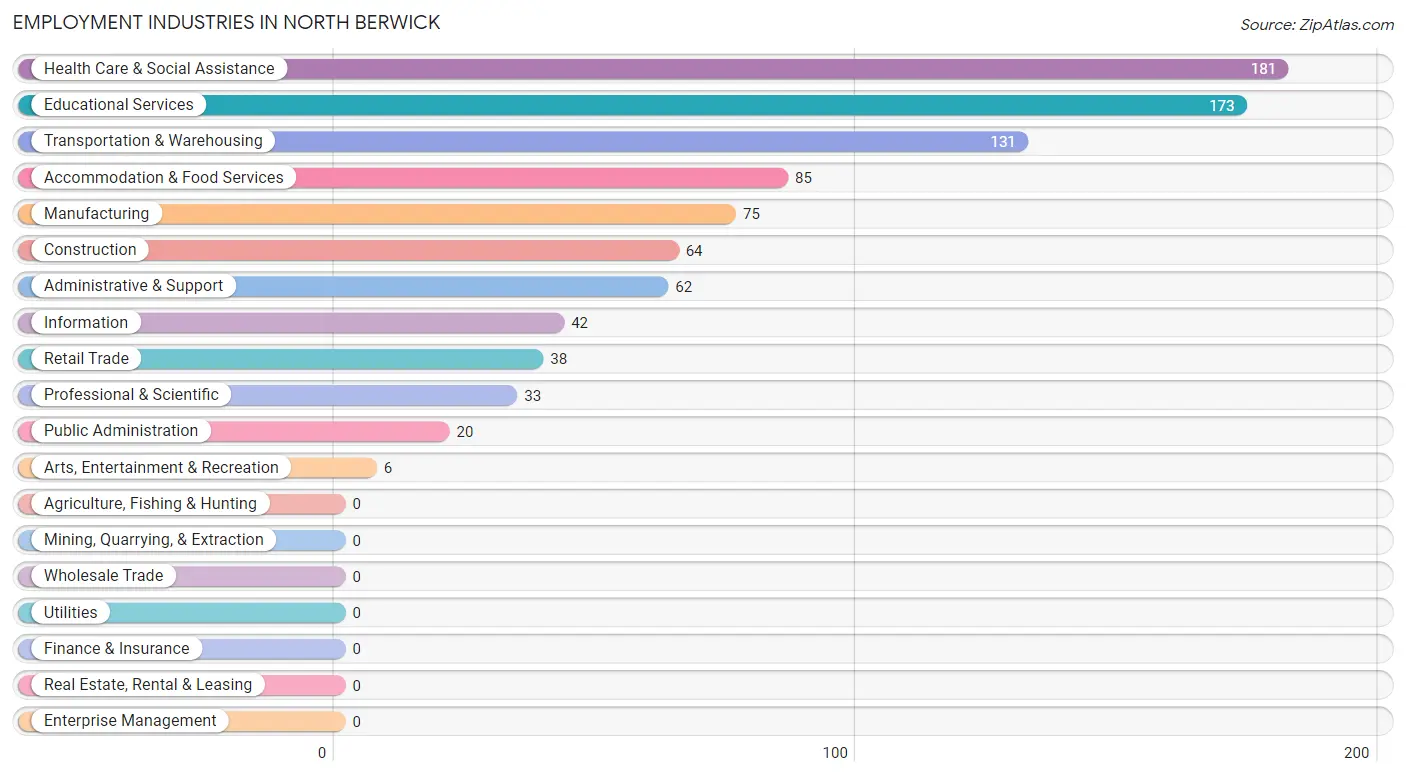
Employment Industries in North Berwick
The major employment industries in North Berwick include Health Care & Social Assistance (181 | 19.1%), Educational Services (173 | 18.2%), Transportation & Warehousing (131 | 13.8%), Accommodation & Food Services (85 | 9.0%), and Manufacturing (75 | 7.9%).
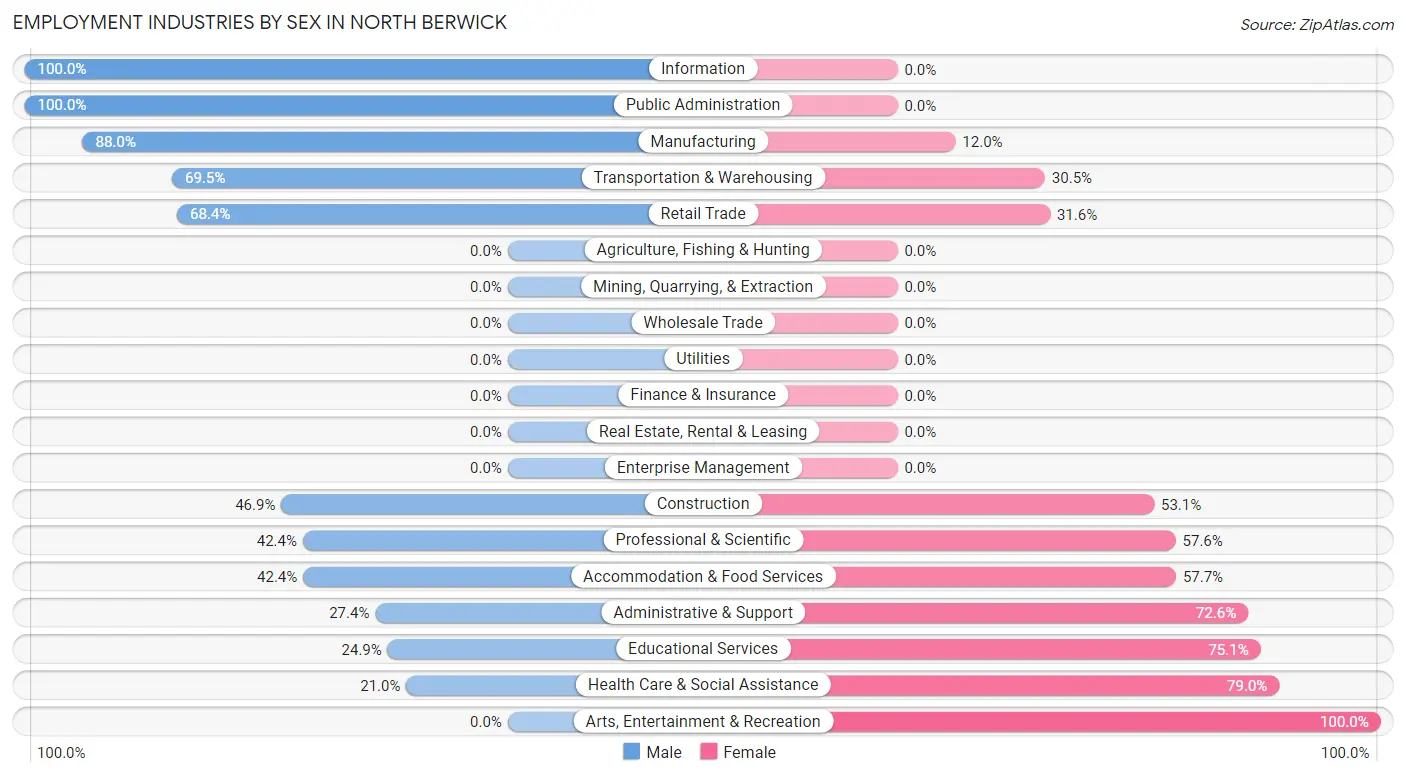
Employment Industries by Sex in North Berwick
The North Berwick industries that see more men than women are Information (100.0%), Public Administration (100.0%), and Manufacturing (88.0%), whereas the industries that tend to have a higher number of women are Arts, Entertainment & Recreation (100.0%), Health Care & Social Assistance (79.0%), and Educational Services (75.1%).
| Industry | Male | Female |
| Agriculture, Fishing & Hunting | 0 (0.0%) | 0 (0.0%) |
| Mining, Quarrying, & Extraction | 0 (0.0%) | 0 (0.0%) |
| Construction | 30 (46.9%) | 34 (53.1%) |
| Manufacturing | 66 (88.0%) | 9 (12.0%) |
| Wholesale Trade | 0 (0.0%) | 0 (0.0%) |
| Retail Trade | 26 (68.4%) | 12 (31.6%) |
| Transportation & Warehousing | 91 (69.5%) | 40 (30.5%) |
| Utilities | 0 (0.0%) | 0 (0.0%) |
| Information | 42 (100.0%) | 0 (0.0%) |
| Finance & Insurance | 0 (0.0%) | 0 (0.0%) |
| Real Estate, Rental & Leasing | 0 (0.0%) | 0 (0.0%) |
| Professional & Scientific | 14 (42.4%) | 19 (57.6%) |
| Enterprise Management | 0 (0.0%) | 0 (0.0%) |
| Administrative & Support | 17 (27.4%) | 45 (72.6%) |
| Educational Services | 43 (24.9%) | 130 (75.1%) |
| Health Care & Social Assistance | 38 (21.0%) | 143 (79.0%) |
| Arts, Entertainment & Recreation | 0 (0.0%) | 6 (100.0%) |
| Accommodation & Food Services | 36 (42.3%) | 49 (57.7%) |
| Public Administration | 20 (100.0%) | 0 (0.0%) |
| Total | 435 (45.8%) | 514 (54.2%) |
Education in North Berwick
School Enrollment in North Berwick
The most common levels of schooling among the 369 students in North Berwick are middle school (101 | 27.4%), high school (90 | 24.4%), and elementary school (70 | 19.0%).
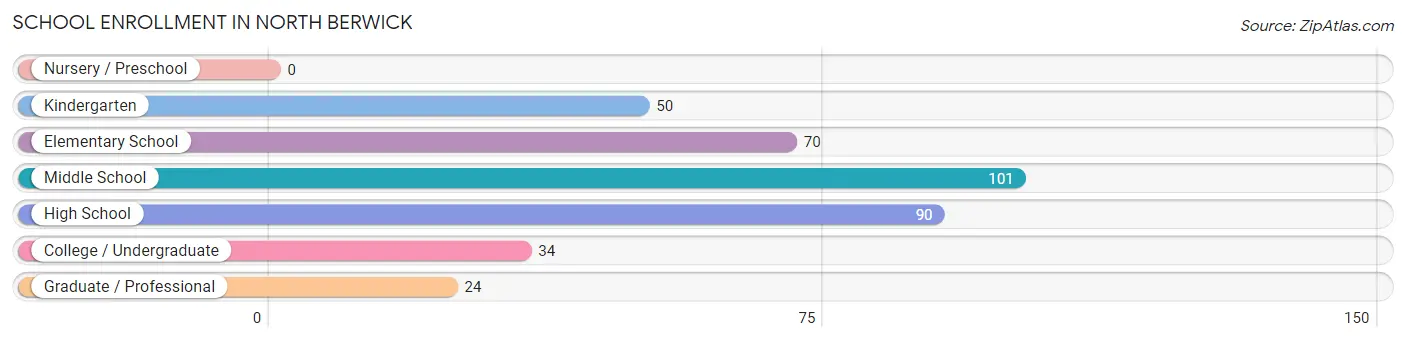
| School Level | # Students | % Students |
| Nursery / Preschool | 0 | 0.0% |
| Kindergarten | 50 | 13.6% |
| Elementary School | 70 | 19.0% |
| Middle School | 101 | 27.4% |
| High School | 90 | 24.4% |
| College / Undergraduate | 34 | 9.2% |
| Graduate / Professional | 24 | 6.5% |
| Total | 369 | 100.0% |
School Enrollment by Age by Funding Source in North Berwick
Out of a total of 369 students who are enrolled in schools in North Berwick, 99 (26.8%) attend a private institution, while the remaining 270 (73.2%) are enrolled in public schools. The age group of 20 to 24 year olds has the highest likelihood of being enrolled in private schools, with 19 (100.0% in the age bracket) enrolled. Conversely, the age group of 5 to 9 year old has the lowest likelihood of being enrolled in a private school, with 120 (100.0% in the age bracket) attending a public institution.
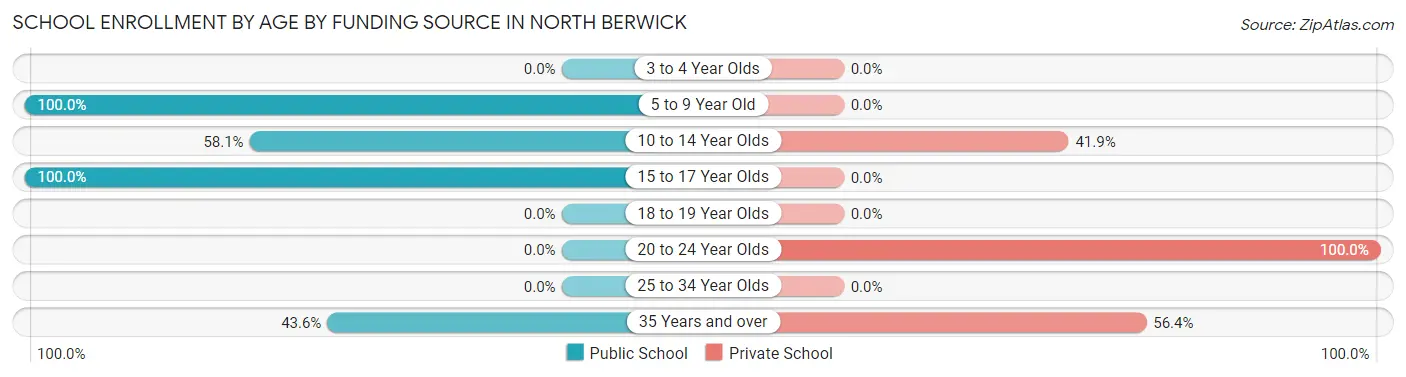
| Age Bracket | Public School | Private School |
| 3 to 4 Year Olds | 0 (0.0%) | 0 (0.0%) |
| 5 to 9 Year Old | 120 (100.0%) | 0 (0.0%) |
| 10 to 14 Year Olds | 68 (58.1%) | 49 (41.9%) |
| 15 to 17 Year Olds | 58 (100.0%) | 0 (0.0%) |
| 18 to 19 Year Olds | 0 (0.0%) | 0 (0.0%) |
| 20 to 24 Year Olds | 0 (0.0%) | 19 (100.0%) |
| 25 to 34 Year Olds | 0 (0.0%) | 0 (0.0%) |
| 35 Years and over | 24 (43.6%) | 31 (56.4%) |
| Total | 270 (73.2%) | 99 (26.8%) |
Educational Attainment by Field of Study in North Berwick
Arts & humanities (61 | 21.4%), bio, nature & agricultural (51 | 17.9%), science & technology (44 | 15.4%), social sciences (43 | 15.1%), and education (40 | 14.0%) are the most common fields of study among 285 individuals in North Berwick who have obtained a bachelor's degree or higher.
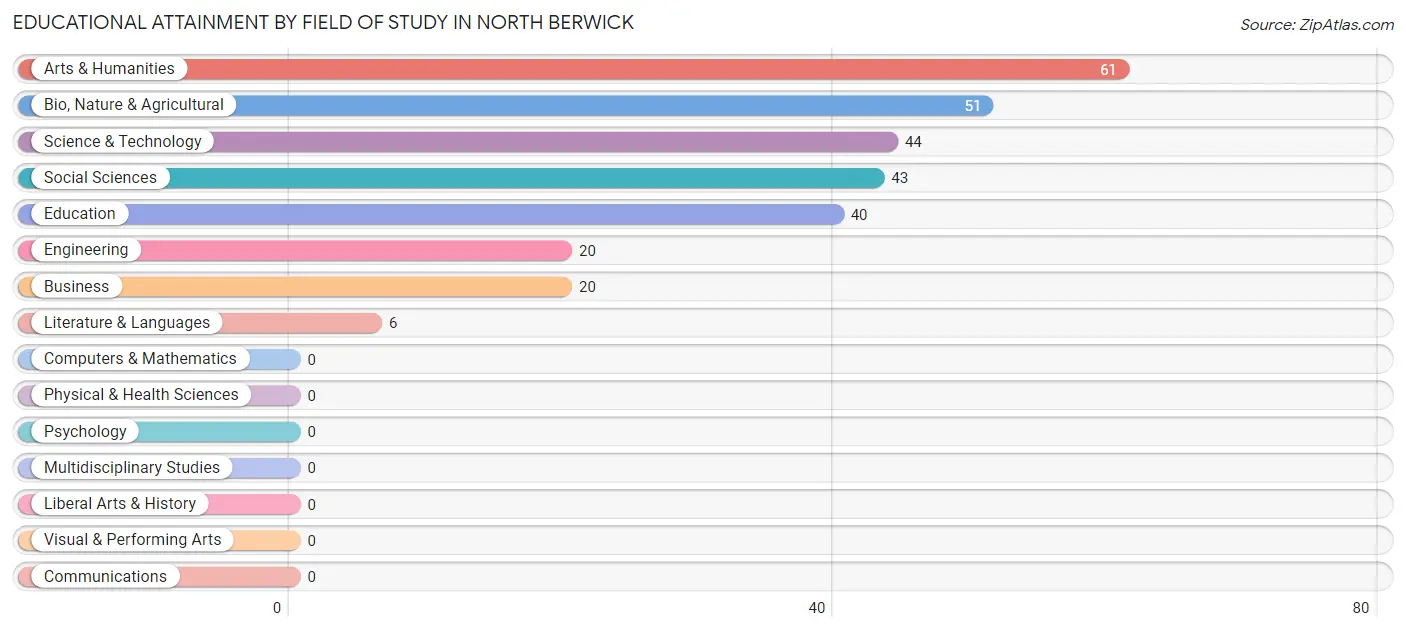
| Field of Study | # Graduates | % Graduates |
| Computers & Mathematics | 0 | 0.0% |
| Bio, Nature & Agricultural | 51 | 17.9% |
| Physical & Health Sciences | 0 | 0.0% |
| Psychology | 0 | 0.0% |
| Social Sciences | 43 | 15.1% |
| Engineering | 20 | 7.0% |
| Multidisciplinary Studies | 0 | 0.0% |
| Science & Technology | 44 | 15.4% |
| Business | 20 | 7.0% |
| Education | 40 | 14.0% |
| Literature & Languages | 6 | 2.1% |
| Liberal Arts & History | 0 | 0.0% |
| Visual & Performing Arts | 0 | 0.0% |
| Communications | 0 | 0.0% |
| Arts & Humanities | 61 | 21.4% |
| Total | 285 | 100.0% |
Transportation & Commute in North Berwick
Vehicle Availability by Sex in North Berwick
The most prevalent vehicle ownership categories in North Berwick are males with 2 vehicles (120, accounting for 27.6%) and females with 2 vehicles (50, making up 25.2%).
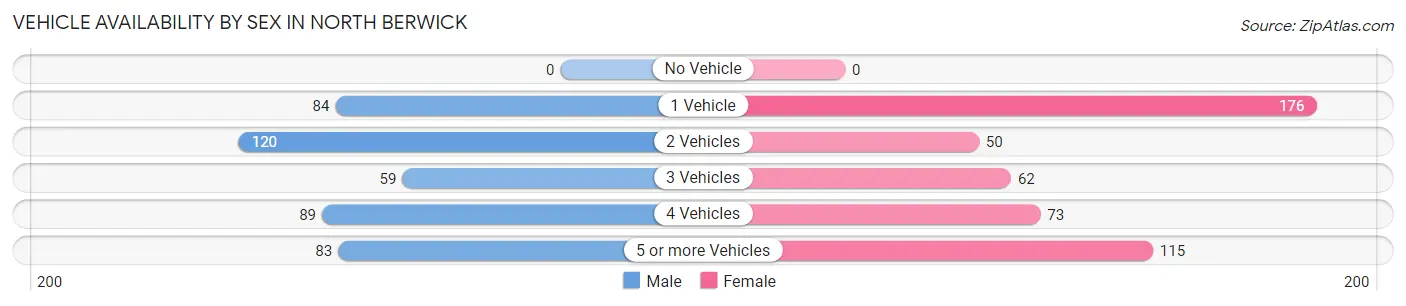
| Vehicles Available | Male | Female |
| No Vehicle | 0 (0.0%) | 0 (0.0%) |
| 1 Vehicle | 84 (19.3%) | 176 (37.0%) |
| 2 Vehicles | 120 (27.6%) | 50 (10.5%) |
| 3 Vehicles | 59 (13.6%) | 62 (13.0%) |
| 4 Vehicles | 89 (20.5%) | 73 (15.3%) |
| 5 or more Vehicles | 83 (19.1%) | 115 (24.2%) |
| Total | 435 (100.0%) | 476 (100.0%) |
Commute Time in North Berwick
The most frequently occuring commute durations in North Berwick are 30 to 34 minutes (107 commuters, 13.7%), 40 to 44 minutes (105 commuters, 13.4%), and 5 to 9 minutes (94 commuters, 12.0%).
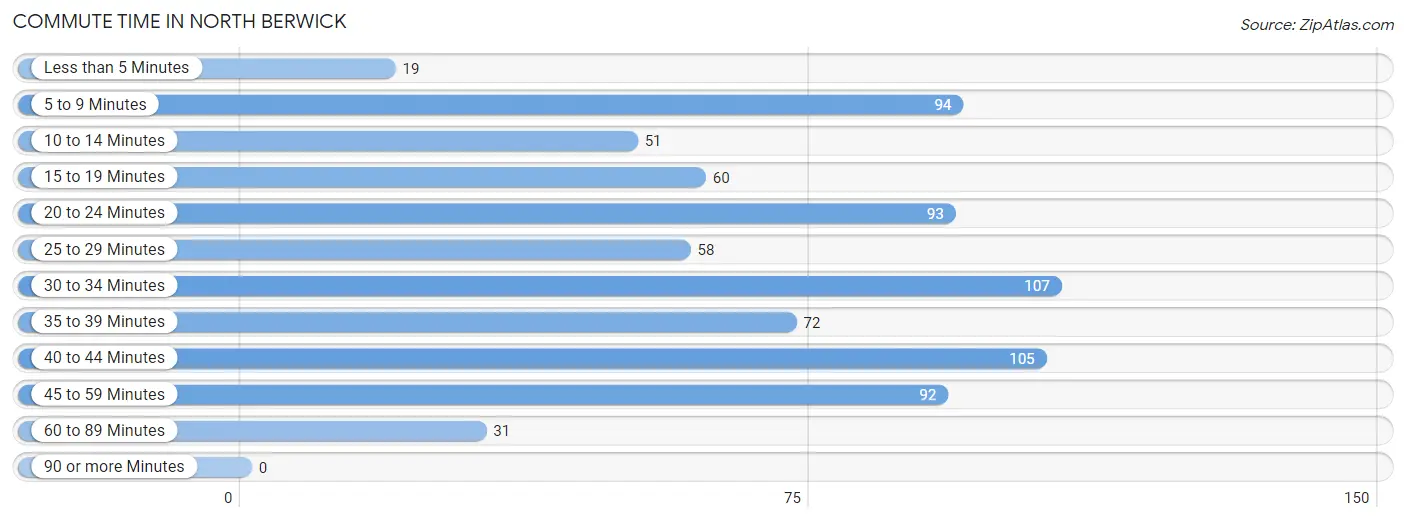
| Commute Time | # Commuters | % Commuters |
| Less than 5 Minutes | 19 | 2.4% |
| 5 to 9 Minutes | 94 | 12.0% |
| 10 to 14 Minutes | 51 | 6.5% |
| 15 to 19 Minutes | 60 | 7.7% |
| 20 to 24 Minutes | 93 | 11.9% |
| 25 to 29 Minutes | 58 | 7.4% |
| 30 to 34 Minutes | 107 | 13.7% |
| 35 to 39 Minutes | 72 | 9.2% |
| 40 to 44 Minutes | 105 | 13.4% |
| 45 to 59 Minutes | 92 | 11.8% |
| 60 to 89 Minutes | 31 | 4.0% |
| 90 or more Minutes | 0 | 0.0% |
Commute Time by Sex in North Berwick
The most common commute times in North Berwick are 30 to 34 minutes (85 commuters, 21.7%) for males and 20 to 24 minutes (84 commuters, 21.5%) for females.
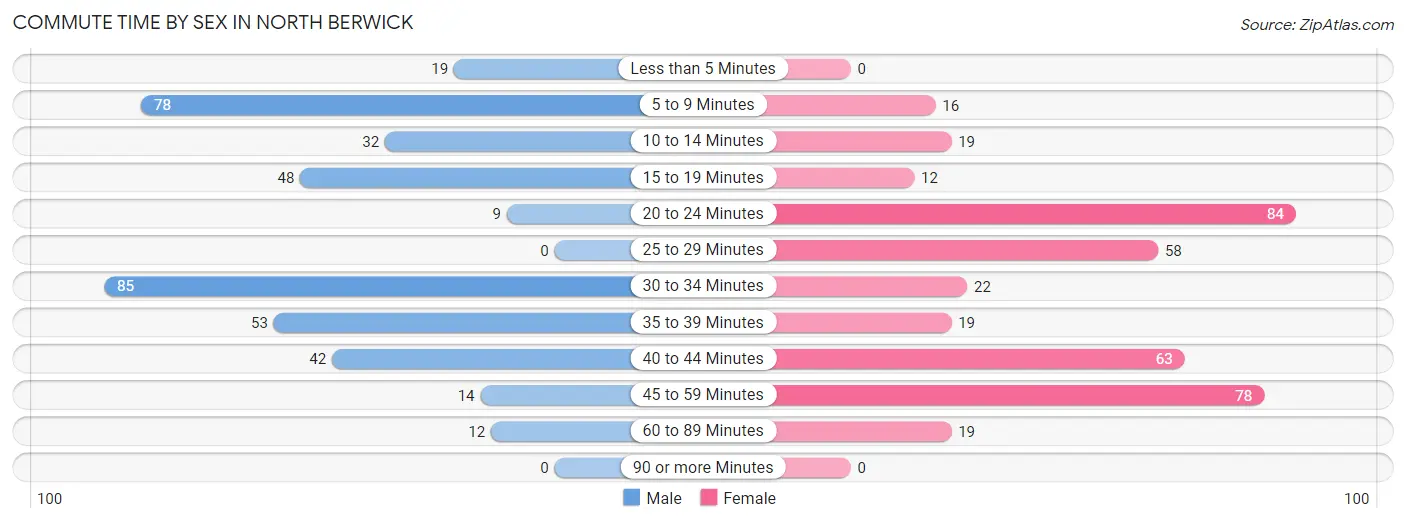
| Commute Time | Male | Female |
| Less than 5 Minutes | 19 (4.9%) | 0 (0.0%) |
| 5 to 9 Minutes | 78 (19.9%) | 16 (4.1%) |
| 10 to 14 Minutes | 32 (8.2%) | 19 (4.9%) |
| 15 to 19 Minutes | 48 (12.2%) | 12 (3.1%) |
| 20 to 24 Minutes | 9 (2.3%) | 84 (21.5%) |
| 25 to 29 Minutes | 0 (0.0%) | 58 (14.9%) |
| 30 to 34 Minutes | 85 (21.7%) | 22 (5.6%) |
| 35 to 39 Minutes | 53 (13.5%) | 19 (4.9%) |
| 40 to 44 Minutes | 42 (10.7%) | 63 (16.2%) |
| 45 to 59 Minutes | 14 (3.6%) | 78 (20.0%) |
| 60 to 89 Minutes | 12 (3.1%) | 19 (4.9%) |
| 90 or more Minutes | 0 (0.0%) | 0 (0.0%) |
Time of Departure to Work by Sex in North Berwick
The most frequent times of departure to work in North Berwick are 6:30 AM to 6:59 AM (73, 18.6%) for males and 6:30 AM to 6:59 AM (127, 32.6%) for females.
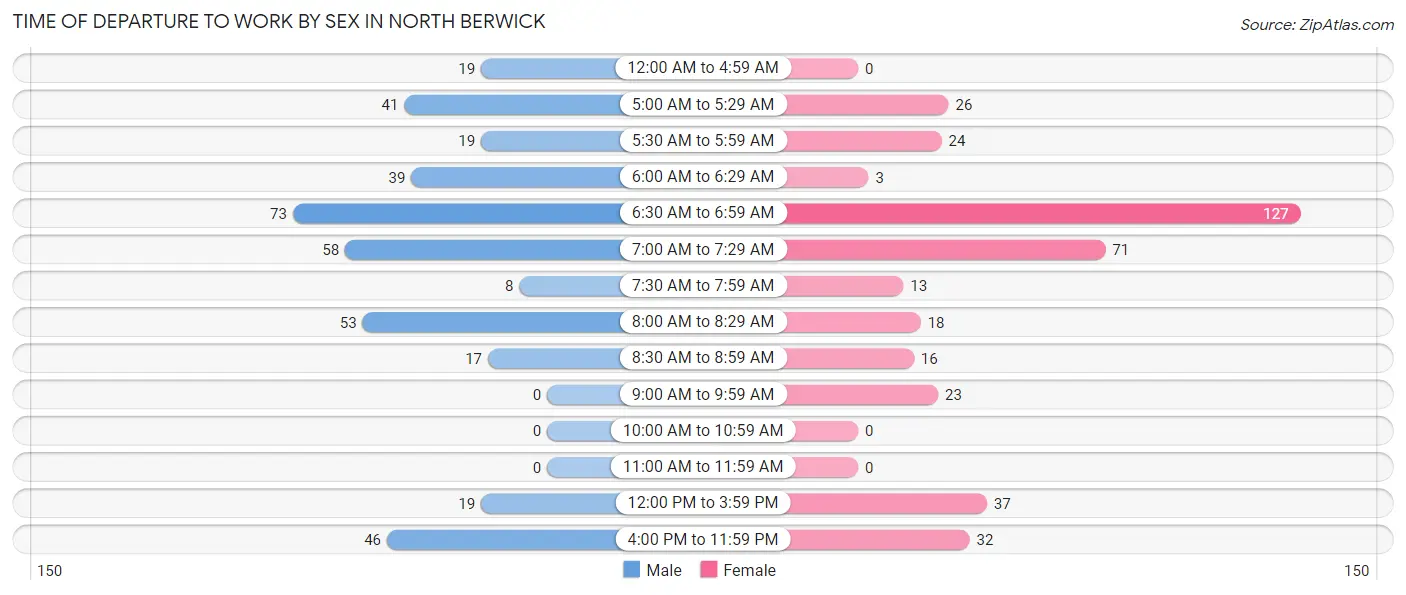
| Time of Departure | Male | Female |
| 12:00 AM to 4:59 AM | 19 (4.9%) | 0 (0.0%) |
| 5:00 AM to 5:29 AM | 41 (10.5%) | 26 (6.7%) |
| 5:30 AM to 5:59 AM | 19 (4.9%) | 24 (6.1%) |
| 6:00 AM to 6:29 AM | 39 (10.0%) | 3 (0.8%) |
| 6:30 AM to 6:59 AM | 73 (18.6%) | 127 (32.6%) |
| 7:00 AM to 7:29 AM | 58 (14.8%) | 71 (18.2%) |
| 7:30 AM to 7:59 AM | 8 (2.0%) | 13 (3.3%) |
| 8:00 AM to 8:29 AM | 53 (13.5%) | 18 (4.6%) |
| 8:30 AM to 8:59 AM | 17 (4.3%) | 16 (4.1%) |
| 9:00 AM to 9:59 AM | 0 (0.0%) | 23 (5.9%) |
| 10:00 AM to 10:59 AM | 0 (0.0%) | 0 (0.0%) |
| 11:00 AM to 11:59 AM | 0 (0.0%) | 0 (0.0%) |
| 12:00 PM to 3:59 PM | 19 (4.9%) | 37 (9.5%) |
| 4:00 PM to 11:59 PM | 46 (11.7%) | 32 (8.2%) |
| Total | 392 (100.0%) | 390 (100.0%) |
Housing Occupancy in North Berwick
Occupancy by Ownership in North Berwick
Of the total 785 dwellings in North Berwick, owner-occupied units account for 504 (64.2%), while renter-occupied units make up 281 (35.8%).
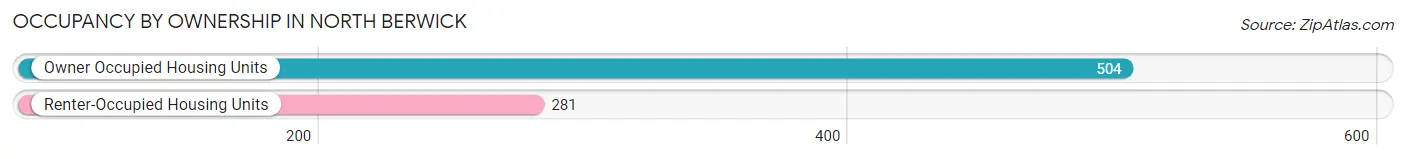
| Occupancy | # Housing Units | % Housing Units |
| Owner Occupied Housing Units | 504 | 64.2% |
| Renter-Occupied Housing Units | 281 | 35.8% |
| Total Occupied Housing Units | 785 | 100.0% |
Occupancy by Household Size in North Berwick
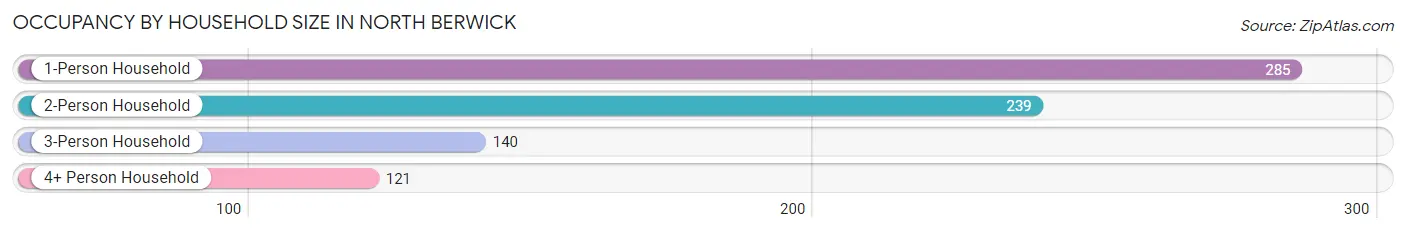
| Household Size | # Housing Units | % Housing Units |
| 1-Person Household | 285 | 36.3% |
| 2-Person Household | 239 | 30.4% |
| 3-Person Household | 140 | 17.8% |
| 4+ Person Household | 121 | 15.4% |
| Total Housing Units | 785 | 100.0% |
Occupancy by Ownership by Household Size in North Berwick
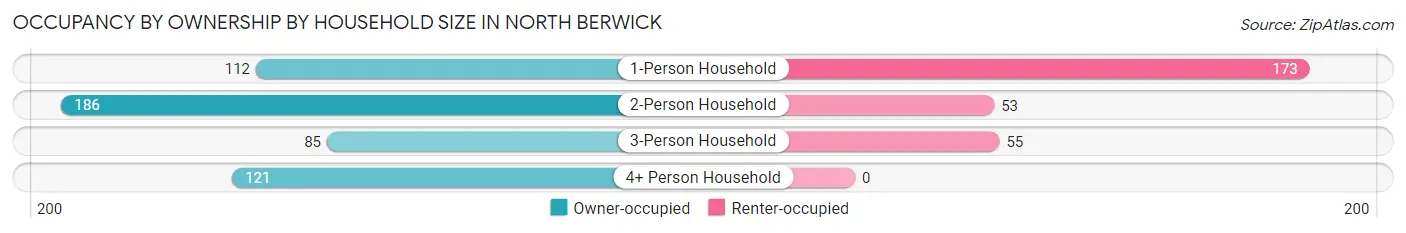
| Household Size | Owner-occupied | Renter-occupied |
| 1-Person Household | 112 (39.3%) | 173 (60.7%) |
| 2-Person Household | 186 (77.8%) | 53 (22.2%) |
| 3-Person Household | 85 (60.7%) | 55 (39.3%) |
| 4+ Person Household | 121 (100.0%) | 0 (0.0%) |
| Total Housing Units | 504 (64.2%) | 281 (35.8%) |
Occupancy by Educational Attainment in North Berwick
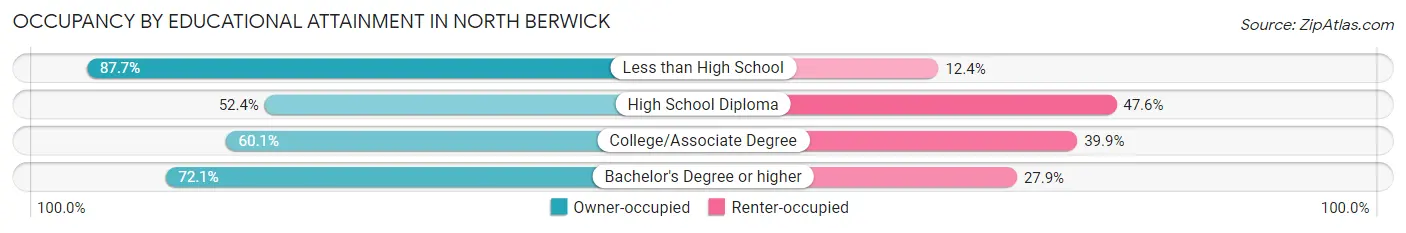
| Household Size | Owner-occupied | Renter-occupied |
| Less than High School | 71 (87.6%) | 10 (12.3%) |
| High School Diploma | 109 (52.4%) | 99 (47.6%) |
| College/Associate Degree | 169 (60.1%) | 112 (39.9%) |
| Bachelor's Degree or higher | 155 (72.1%) | 60 (27.9%) |
Occupancy by Age of Householder in North Berwick
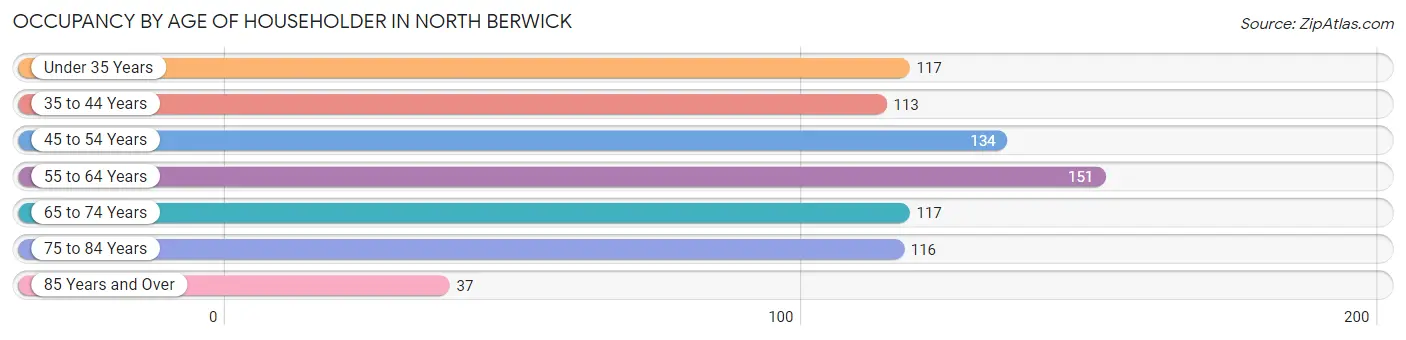
| Age Bracket | # Households | % Households |
| Under 35 Years | 117 | 14.9% |
| 35 to 44 Years | 113 | 14.4% |
| 45 to 54 Years | 134 | 17.1% |
| 55 to 64 Years | 151 | 19.2% |
| 65 to 74 Years | 117 | 14.9% |
| 75 to 84 Years | 116 | 14.8% |
| 85 Years and Over | 37 | 4.7% |
| Total | 785 | 100.0% |
Housing Finances in North Berwick
Median Income by Occupancy in North Berwick
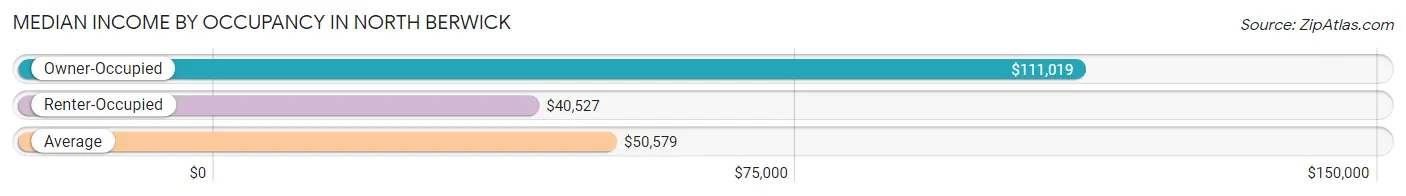
| Occupancy Type | # Households | Median Income |
| Owner-Occupied | 504 (64.2%) | $111,019 |
| Renter-Occupied | 281 (35.8%) | $40,527 |
| Average | 785 (100.0%) | $50,579 |
Occupancy by Householder Income Bracket in North Berwick
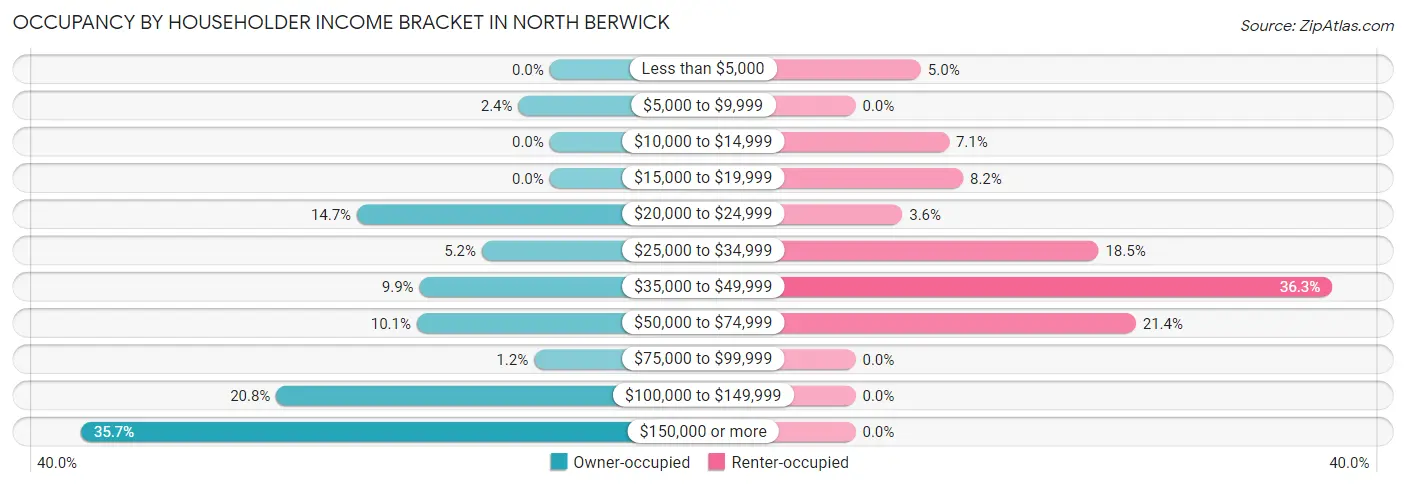
| Income Bracket | Owner-occupied | Renter-occupied |
| Less than $5,000 | 0 (0.0%) | 14 (5.0%) |
| $5,000 to $9,999 | 12 (2.4%) | 0 (0.0%) |
| $10,000 to $14,999 | 0 (0.0%) | 20 (7.1%) |
| $15,000 to $19,999 | 0 (0.0%) | 23 (8.2%) |
| $20,000 to $24,999 | 74 (14.7%) | 10 (3.6%) |
| $25,000 to $34,999 | 26 (5.2%) | 52 (18.5%) |
| $35,000 to $49,999 | 50 (9.9%) | 102 (36.3%) |
| $50,000 to $74,999 | 51 (10.1%) | 60 (21.3%) |
| $75,000 to $99,999 | 6 (1.2%) | 0 (0.0%) |
| $100,000 to $149,999 | 105 (20.8%) | 0 (0.0%) |
| $150,000 or more | 180 (35.7%) | 0 (0.0%) |
| Total | 504 (100.0%) | 281 (100.0%) |
Monthly Housing Cost Tiers in North Berwick
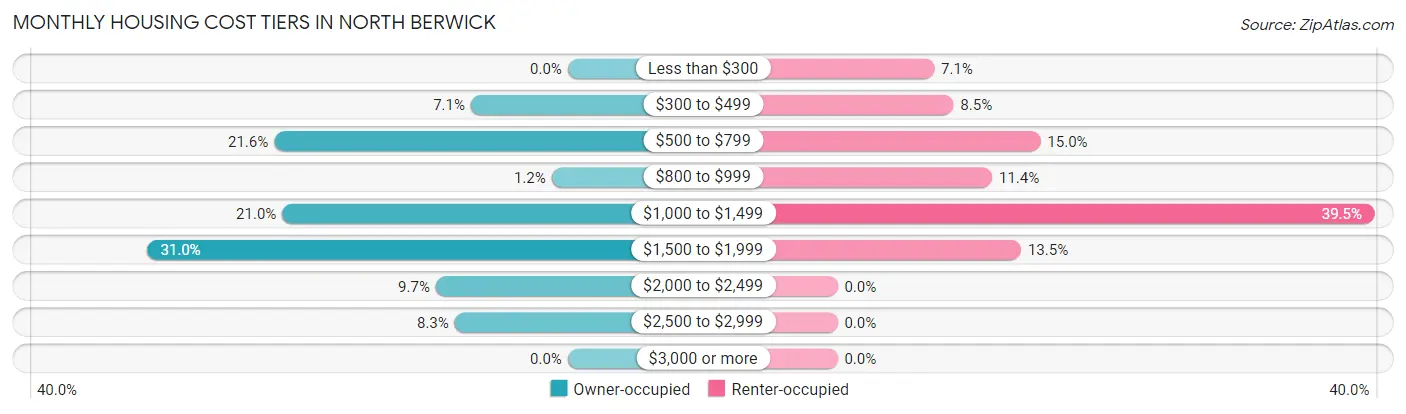
| Monthly Cost | Owner-occupied | Renter-occupied |
| Less than $300 | 0 (0.0%) | 20 (7.1%) |
| $300 to $499 | 36 (7.1%) | 24 (8.5%) |
| $500 to $799 | 109 (21.6%) | 42 (14.9%) |
| $800 to $999 | 6 (1.2%) | 32 (11.4%) |
| $1,000 to $1,499 | 106 (21.0%) | 111 (39.5%) |
| $1,500 to $1,999 | 156 (30.9%) | 38 (13.5%) |
| $2,000 to $2,499 | 49 (9.7%) | 0 (0.0%) |
| $2,500 to $2,999 | 42 (8.3%) | 0 (0.0%) |
| $3,000 or more | 0 (0.0%) | 0 (0.0%) |
| Total | 504 (100.0%) | 281 (100.0%) |
Physical Housing Characteristics in North Berwick
Housing Structures in North Berwick
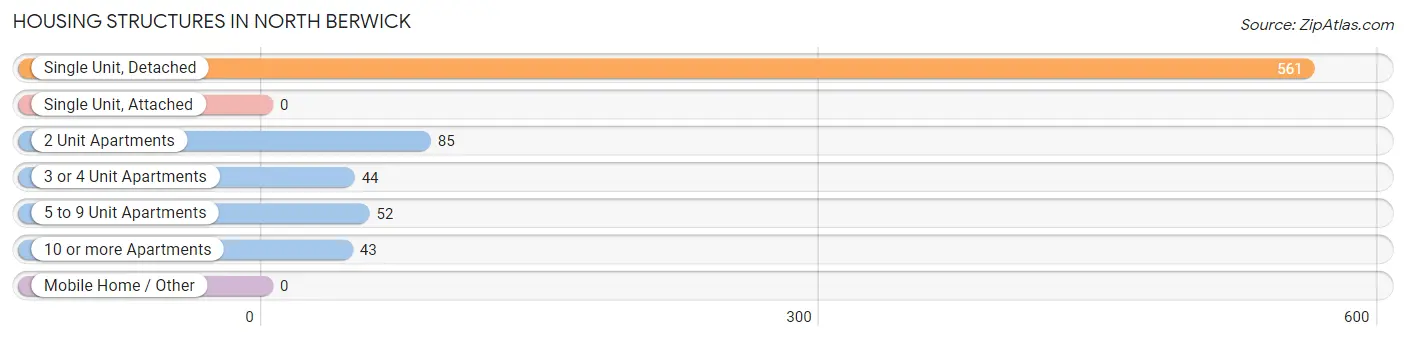
| Structure Type | # Housing Units | % Housing Units |
| Single Unit, Detached | 561 | 71.5% |
| Single Unit, Attached | 0 | 0.0% |
| 2 Unit Apartments | 85 | 10.8% |
| 3 or 4 Unit Apartments | 44 | 5.6% |
| 5 to 9 Unit Apartments | 52 | 6.6% |
| 10 or more Apartments | 43 | 5.5% |
| Mobile Home / Other | 0 | 0.0% |
| Total | 785 | 100.0% |
Housing Structures by Occupancy in North Berwick
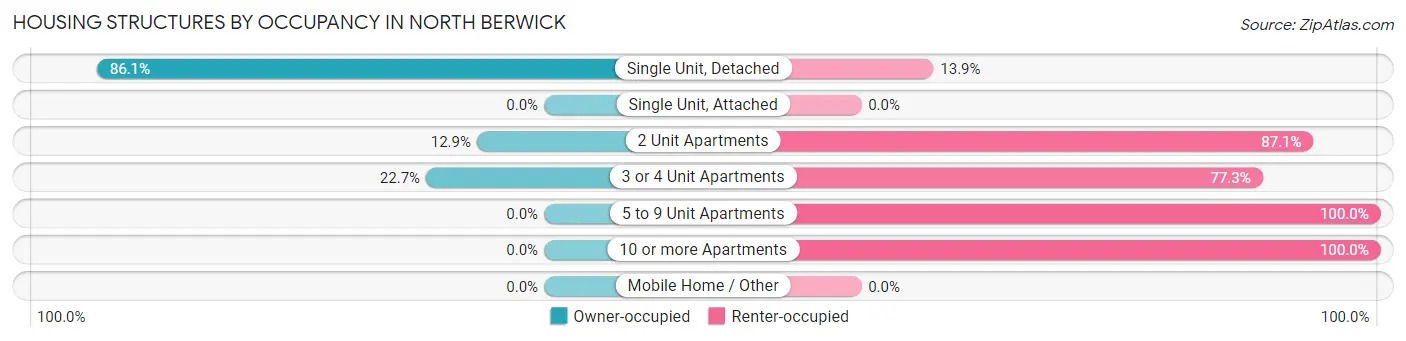
| Structure Type | Owner-occupied | Renter-occupied |
| Single Unit, Detached | 483 (86.1%) | 78 (13.9%) |
| Single Unit, Attached | 0 (0.0%) | 0 (0.0%) |
| 2 Unit Apartments | 11 (12.9%) | 74 (87.1%) |
| 3 or 4 Unit Apartments | 10 (22.7%) | 34 (77.3%) |
| 5 to 9 Unit Apartments | 0 (0.0%) | 52 (100.0%) |
| 10 or more Apartments | 0 (0.0%) | 43 (100.0%) |
| Mobile Home / Other | 0 (0.0%) | 0 (0.0%) |
| Total | 504 (64.2%) | 281 (35.8%) |
Housing Structures by Number of Rooms in North Berwick

| Number of Rooms | Owner-occupied | Renter-occupied |
| 1 Room | 0 (0.0%) | 41 (14.6%) |
| 2 or 3 Rooms | 11 (2.2%) | 105 (37.4%) |
| 4 or 5 Rooms | 62 (12.3%) | 98 (34.9%) |
| 6 or 7 Rooms | 261 (51.8%) | 37 (13.2%) |
| 8 or more Rooms | 170 (33.7%) | 0 (0.0%) |
| Total | 504 (100.0%) | 281 (100.0%) |
Housing Structure by Heating Type in North Berwick
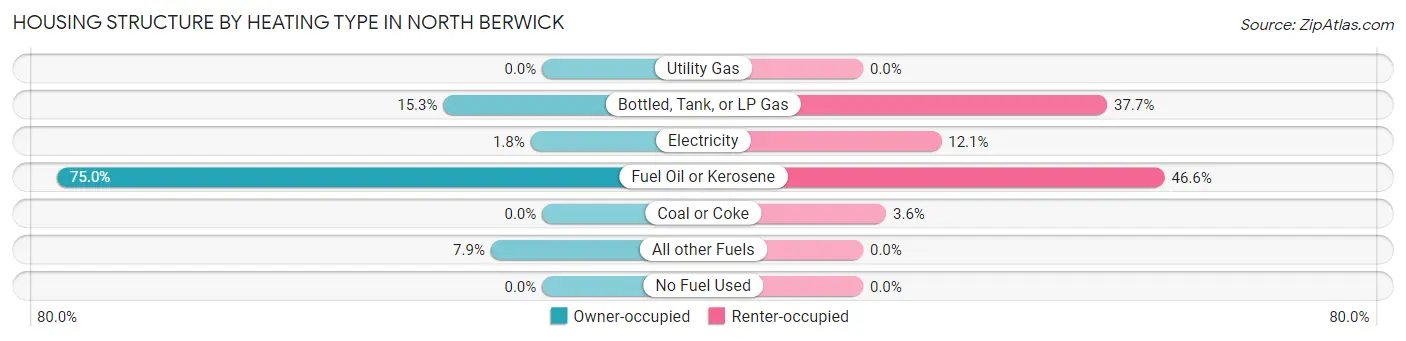
| Heating Type | Owner-occupied | Renter-occupied |
| Utility Gas | 0 (0.0%) | 0 (0.0%) |
| Bottled, Tank, or LP Gas | 77 (15.3%) | 106 (37.7%) |
| Electricity | 9 (1.8%) | 34 (12.1%) |
| Fuel Oil or Kerosene | 378 (75.0%) | 131 (46.6%) |
| Coal or Coke | 0 (0.0%) | 10 (3.6%) |
| All other Fuels | 40 (7.9%) | 0 (0.0%) |
| No Fuel Used | 0 (0.0%) | 0 (0.0%) |
| Total | 504 (100.0%) | 281 (100.0%) |
Household Vehicle Usage in North Berwick
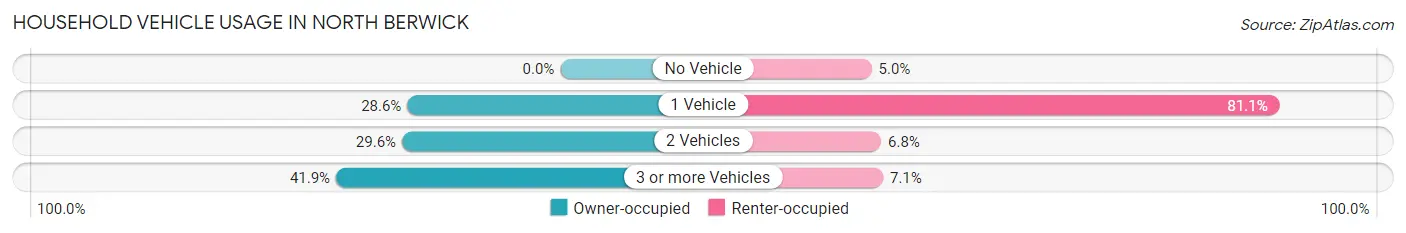
| Vehicles per Household | Owner-occupied | Renter-occupied |
| No Vehicle | 0 (0.0%) | 14 (5.0%) |
| 1 Vehicle | 144 (28.6%) | 228 (81.1%) |
| 2 Vehicles | 149 (29.6%) | 19 (6.8%) |
| 3 or more Vehicles | 211 (41.9%) | 20 (7.1%) |
| Total | 504 (100.0%) | 281 (100.0%) |
Real Estate & Mortgages in North Berwick
Real Estate and Mortgage Overview in North Berwick
| Characteristic | Without Mortgage | With Mortgage |
| Housing Units | 151 | 353 |
| Median Property Value | $183,000 | $317,700 |
| Median Household Income | - | - |
| Monthly Housing Costs | $540 | $0 |
| Real Estate Taxes | $1,829 | $0 |
Property Value by Mortgage Status in North Berwick
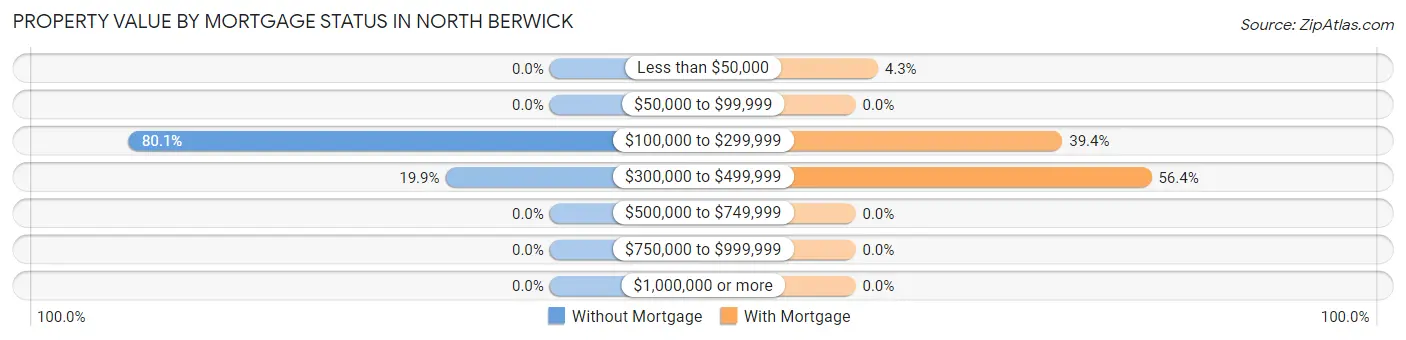
| Property Value | Without Mortgage | With Mortgage |
| Less than $50,000 | 0 (0.0%) | 15 (4.3%) |
| $50,000 to $99,999 | 0 (0.0%) | 0 (0.0%) |
| $100,000 to $299,999 | 121 (80.1%) | 139 (39.4%) |
| $300,000 to $499,999 | 30 (19.9%) | 199 (56.4%) |
| $500,000 to $749,999 | 0 (0.0%) | 0 (0.0%) |
| $750,000 to $999,999 | 0 (0.0%) | 0 (0.0%) |
| $1,000,000 or more | 0 (0.0%) | 0 (0.0%) |
| Total | 151 (100.0%) | 353 (100.0%) |
Household Income by Mortgage Status in North Berwick
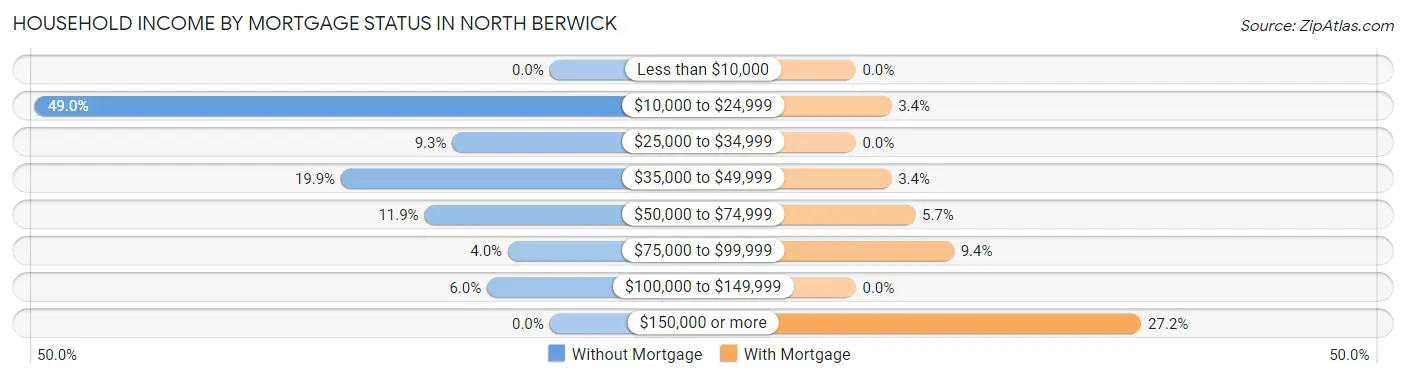
| Household Income | Without Mortgage | With Mortgage |
| Less than $10,000 | 0 (0.0%) | 0 (0.0%) |
| $10,000 to $24,999 | 74 (49.0%) | 12 (3.4%) |
| $25,000 to $34,999 | 14 (9.3%) | 0 (0.0%) |
| $35,000 to $49,999 | 30 (19.9%) | 12 (3.4%) |
| $50,000 to $74,999 | 18 (11.9%) | 20 (5.7%) |
| $75,000 to $99,999 | 6 (4.0%) | 33 (9.3%) |
| $100,000 to $149,999 | 9 (6.0%) | 0 (0.0%) |
| $150,000 or more | 0 (0.0%) | 96 (27.2%) |
| Total | 151 (100.0%) | 353 (100.0%) |
Property Value to Household Income Ratio in North Berwick
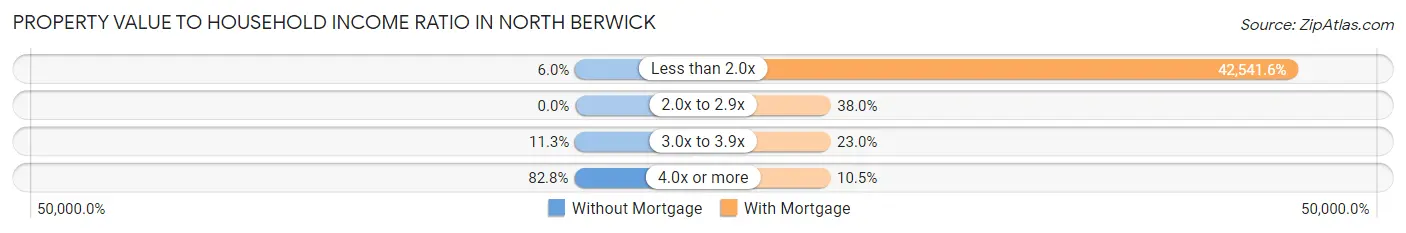
| Value-to-Income Ratio | Without Mortgage | With Mortgage |
| Less than 2.0x | 9 (6.0%) | 150,172 (42,541.6%) |
| 2.0x to 2.9x | 0 (0.0%) | 134 (38.0%) |
| 3.0x to 3.9x | 17 (11.3%) | 81 (23.0%) |
| 4.0x or more | 125 (82.8%) | 37 (10.5%) |
| Total | 151 (100.0%) | 353 (100.0%) |
Real Estate Taxes by Mortgage Status in North Berwick
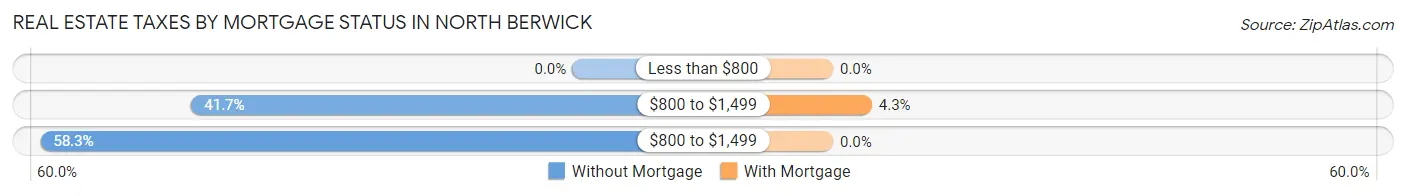
| Property Taxes | Without Mortgage | With Mortgage |
| Less than $800 | 0 (0.0%) | 0 (0.0%) |
| $800 to $1,499 | 63 (41.7%) | 15 (4.3%) |
| $800 to $1,499 | 88 (58.3%) | 0 (0.0%) |
| Total | 151 (100.0%) | 353 (100.0%) |
Health & Disability in North Berwick
Health Insurance Coverage by Age in North Berwick
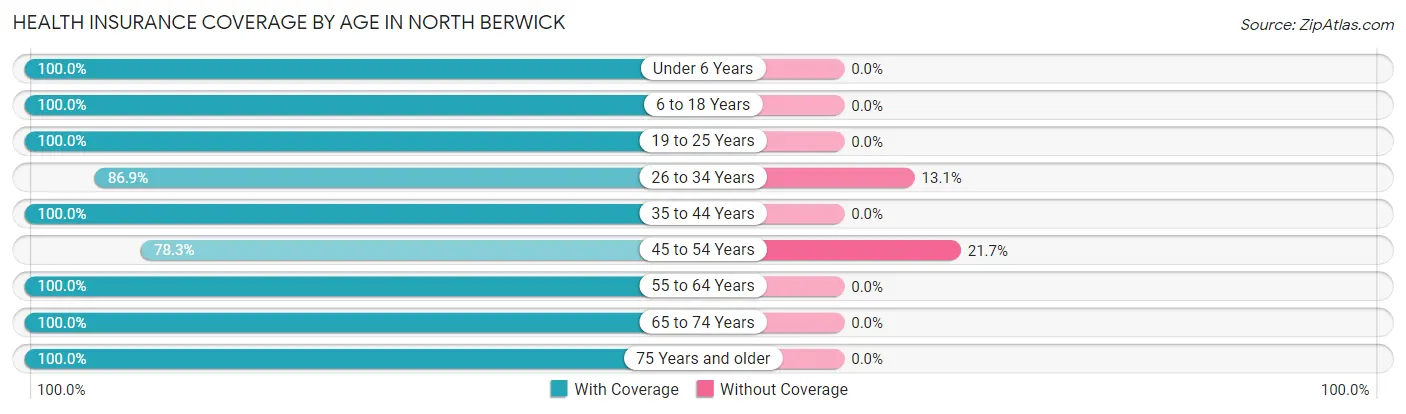
| Age Bracket | With Coverage | Without Coverage |
| Under 6 Years | 98 (100.0%) | 0 (0.0%) |
| 6 to 18 Years | 334 (100.0%) | 0 (0.0%) |
| 19 to 25 Years | 135 (100.0%) | 0 (0.0%) |
| 26 to 34 Years | 106 (86.9%) | 16 (13.1%) |
| 35 to 44 Years | 176 (100.0%) | 0 (0.0%) |
| 45 to 54 Years | 191 (78.3%) | 53 (21.7%) |
| 55 to 64 Years | 268 (100.0%) | 0 (0.0%) |
| 65 to 74 Years | 163 (100.0%) | 0 (0.0%) |
| 75 Years and older | 187 (100.0%) | 0 (0.0%) |
| Total | 1,658 (96.0%) | 69 (4.0%) |
Health Insurance Coverage by Citizenship Status in North Berwick
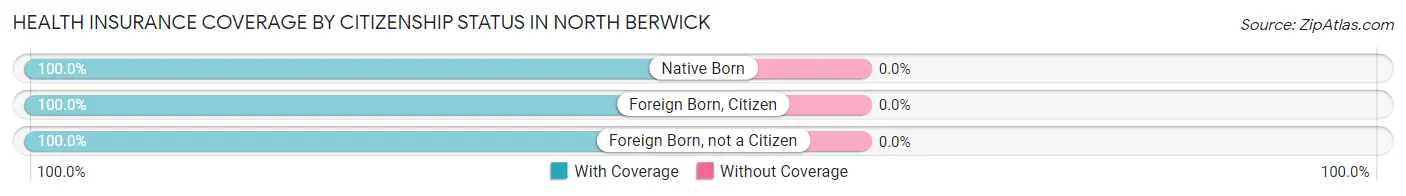
| Citizenship Status | With Coverage | Without Coverage |
| Native Born | 98 (100.0%) | 0 (0.0%) |
| Foreign Born, Citizen | 334 (100.0%) | 0 (0.0%) |
| Foreign Born, not a Citizen | 135 (100.0%) | 0 (0.0%) |
Health Insurance Coverage by Household Income in North Berwick
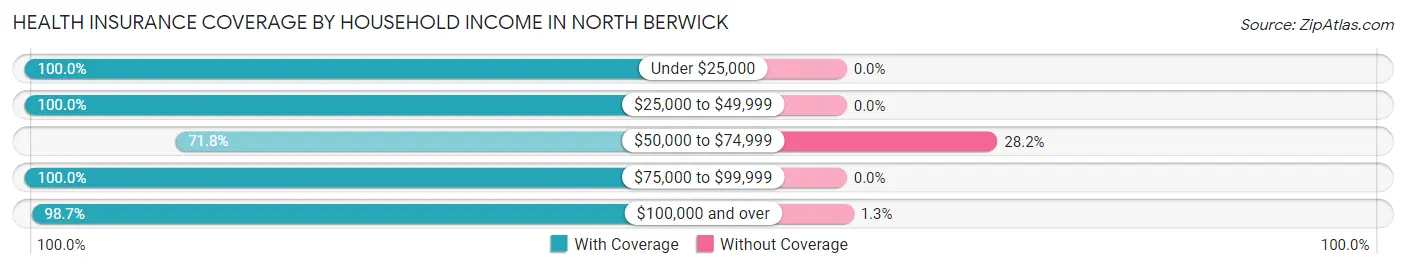
| Household Income | With Coverage | Without Coverage |
| Under $25,000 | 153 (100.0%) | 0 (0.0%) |
| $25,000 to $49,999 | 429 (100.0%) | 0 (0.0%) |
| $50,000 to $74,999 | 145 (71.8%) | 57 (28.2%) |
| $75,000 to $99,999 | 16 (100.0%) | 0 (0.0%) |
| $100,000 and over | 908 (98.7%) | 12 (1.3%) |
Public vs Private Health Insurance Coverage by Age in North Berwick
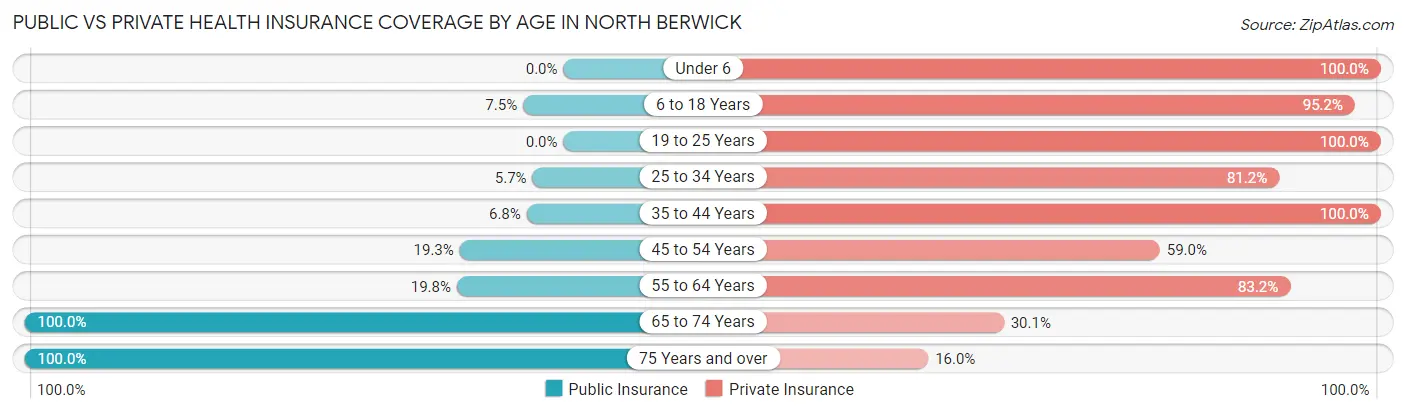
| Age Bracket | Public Insurance | Private Insurance |
| Under 6 | 0 (0.0%) | 98 (100.0%) |
| 6 to 18 Years | 25 (7.5%) | 318 (95.2%) |
| 19 to 25 Years | 0 (0.0%) | 135 (100.0%) |
| 25 to 34 Years | 7 (5.7%) | 99 (81.1%) |
| 35 to 44 Years | 12 (6.8%) | 176 (100.0%) |
| 45 to 54 Years | 47 (19.3%) | 144 (59.0%) |
| 55 to 64 Years | 53 (19.8%) | 223 (83.2%) |
| 65 to 74 Years | 163 (100.0%) | 49 (30.1%) |
| 75 Years and over | 187 (100.0%) | 30 (16.0%) |
| Total | 494 (28.6%) | 1,272 (73.7%) |
Disability Status by Sex by Age in North Berwick
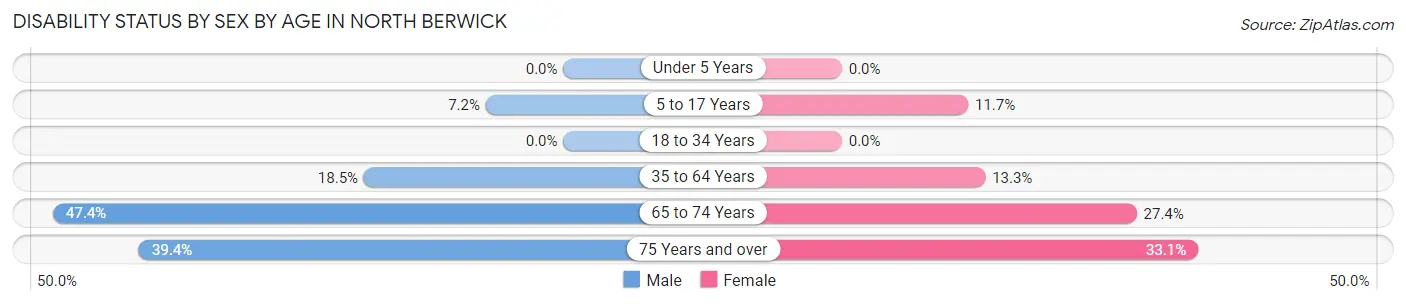
| Age Bracket | Male | Female |
| Under 5 Years | 0 (0.0%) | 0 (0.0%) |
| 5 to 17 Years | 9 (7.2%) | 28 (11.7%) |
| 18 to 34 Years | 0 (0.0%) | 0 (0.0%) |
| 35 to 64 Years | 62 (18.5%) | 47 (13.3%) |
| 65 to 74 Years | 27 (47.4%) | 29 (27.4%) |
| 75 Years and over | 26 (39.4%) | 40 (33.1%) |
Disability Class by Sex by Age in North Berwick
Disability Class: Hearing Difficulty
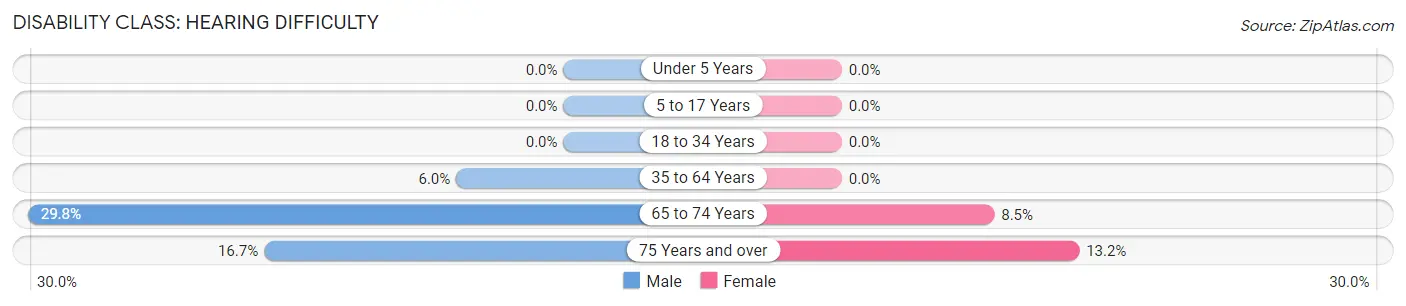
| Age Bracket | Male | Female |
| Under 5 Years | 0 (0.0%) | 0 (0.0%) |
| 5 to 17 Years | 0 (0.0%) | 0 (0.0%) |
| 18 to 34 Years | 0 (0.0%) | 0 (0.0%) |
| 35 to 64 Years | 20 (6.0%) | 0 (0.0%) |
| 65 to 74 Years | 17 (29.8%) | 9 (8.5%) |
| 75 Years and over | 11 (16.7%) | 16 (13.2%) |
Disability Class: Vision Difficulty
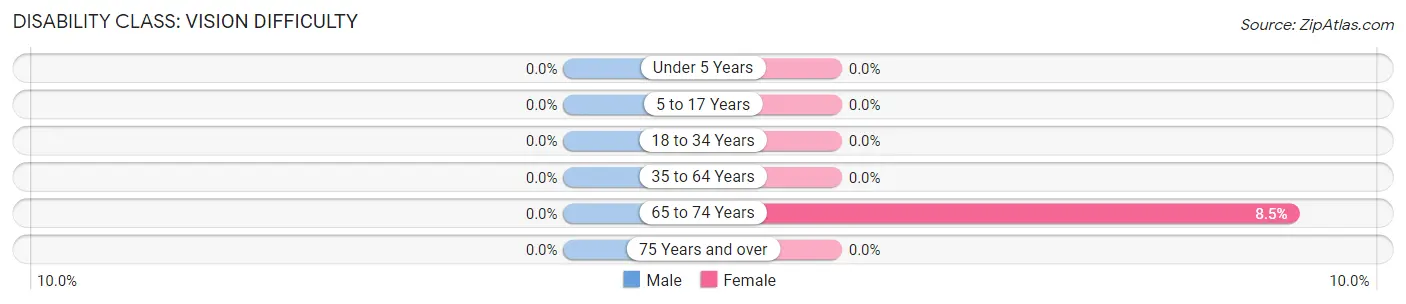
| Age Bracket | Male | Female |
| Under 5 Years | 0 (0.0%) | 0 (0.0%) |
| 5 to 17 Years | 0 (0.0%) | 0 (0.0%) |
| 18 to 34 Years | 0 (0.0%) | 0 (0.0%) |
| 35 to 64 Years | 0 (0.0%) | 0 (0.0%) |
| 65 to 74 Years | 0 (0.0%) | 9 (8.5%) |
| 75 Years and over | 0 (0.0%) | 0 (0.0%) |
Disability Class: Cognitive Difficulty
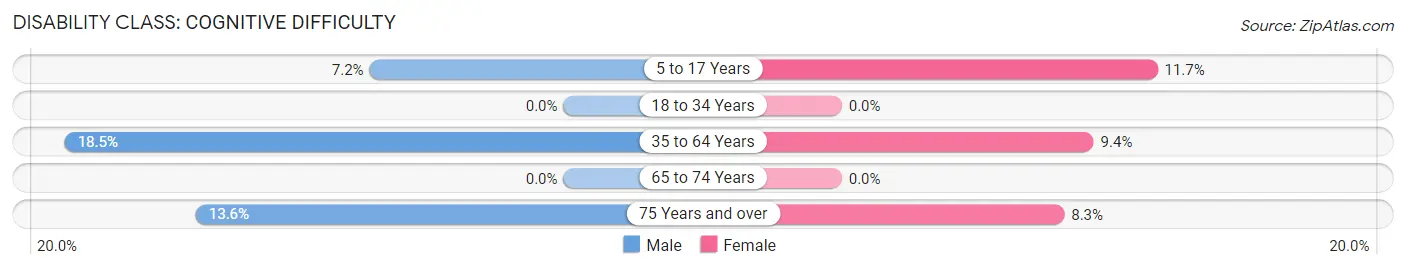
| Age Bracket | Male | Female |
| 5 to 17 Years | 9 (7.2%) | 28 (11.7%) |
| 18 to 34 Years | 0 (0.0%) | 0 (0.0%) |
| 35 to 64 Years | 62 (18.5%) | 33 (9.3%) |
| 65 to 74 Years | 0 (0.0%) | 0 (0.0%) |
| 75 Years and over | 9 (13.6%) | 10 (8.3%) |
Disability Class: Ambulatory Difficulty
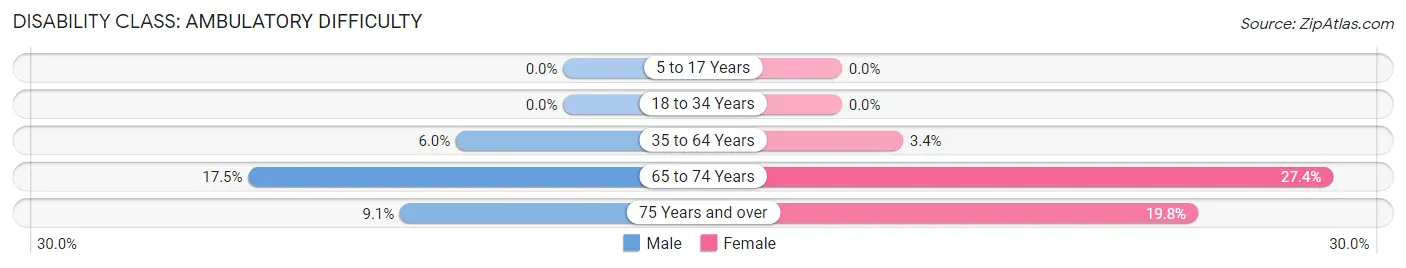
| Age Bracket | Male | Female |
| 5 to 17 Years | 0 (0.0%) | 0 (0.0%) |
| 18 to 34 Years | 0 (0.0%) | 0 (0.0%) |
| 35 to 64 Years | 20 (6.0%) | 12 (3.4%) |
| 65 to 74 Years | 10 (17.5%) | 29 (27.4%) |
| 75 Years and over | 6 (9.1%) | 24 (19.8%) |
Disability Class: Self-Care Difficulty
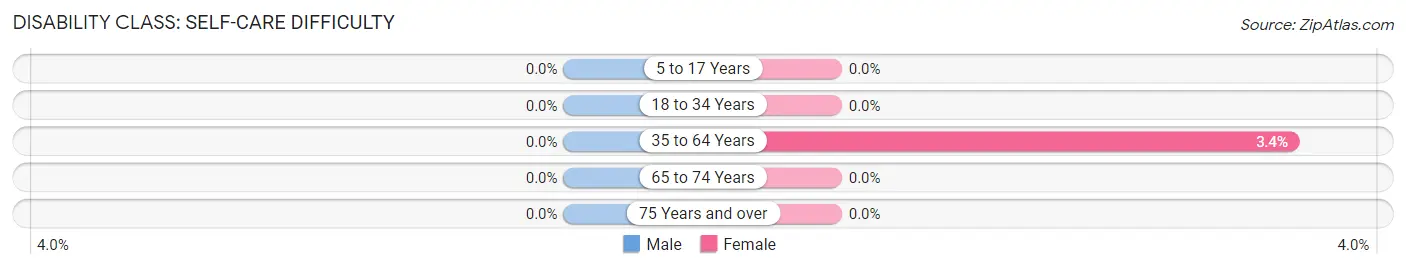
| Age Bracket | Male | Female |
| 5 to 17 Years | 0 (0.0%) | 0 (0.0%) |
| 18 to 34 Years | 0 (0.0%) | 0 (0.0%) |
| 35 to 64 Years | 0 (0.0%) | 12 (3.4%) |
| 65 to 74 Years | 0 (0.0%) | 0 (0.0%) |
| 75 Years and over | 0 (0.0%) | 0 (0.0%) |
Technology Access in North Berwick
Computing Device Access in North Berwick
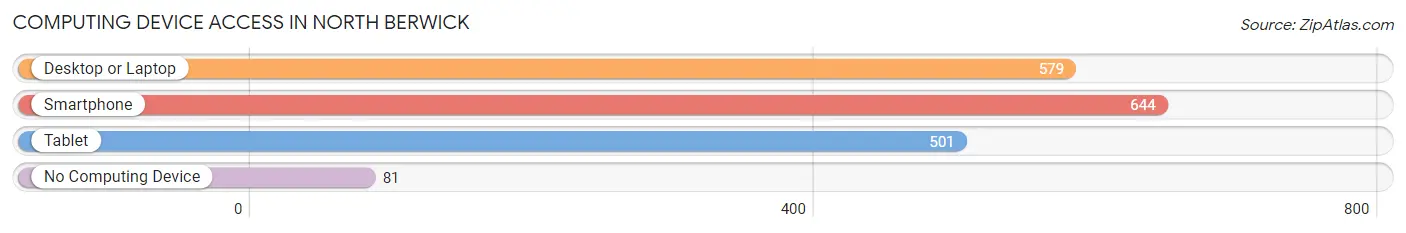
| Device Type | # Households | % Households |
| Desktop or Laptop | 579 | 73.8% |
| Smartphone | 644 | 82.0% |
| Tablet | 501 | 63.8% |
| No Computing Device | 81 | 10.3% |
| Total | 785 | 100.0% |
Internet Access in North Berwick
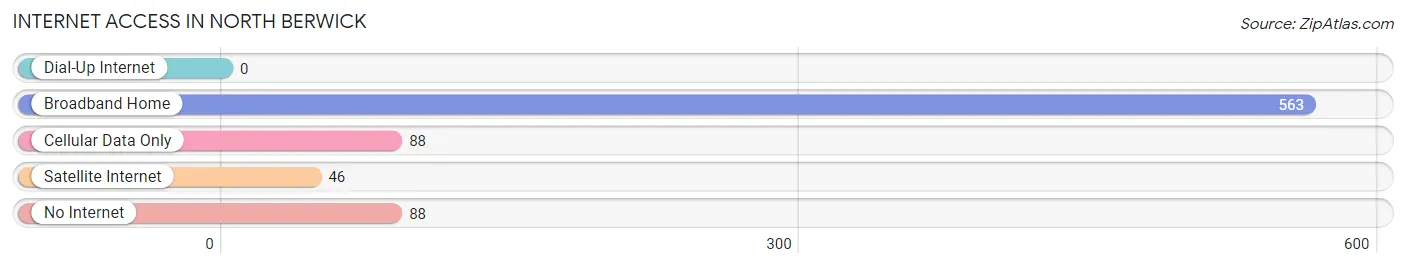
| Internet Type | # Households | % Households |
| Dial-Up Internet | 0 | 0.0% |
| Broadband Home | 563 | 71.7% |
| Cellular Data Only | 88 | 11.2% |
| Satellite Internet | 46 | 5.9% |
| No Internet | 88 | 11.2% |
| Total | 785 | 100.0% |
North Berwick Summary
Berwick, Maine is a small town located in York County, in the southern part of the state. It is situated on the Salmon Falls River, which forms the border between Maine and New Hampshire. The town was first settled in 1631 and incorporated in 1713. It is named after Berwick-upon-Tweed, a town in England.
History
The area that is now Berwick was first settled in 1631 by a group of English settlers from the Massachusetts Bay Colony. The town was originally part of Kittery, Maine, but was incorporated as its own town in 1713. The town was named after Berwick-upon-Tweed, a town in England.
In the late 1700s, Berwick was a major shipbuilding center. The town was home to several shipyards, and many of the ships built in Berwick were used in the War of 1812. The town was also home to several mills, including a grist mill, a saw mill, and a paper mill.
In the mid-1800s, Berwick was a major center for the production of woolen goods. The town was home to several woolen mills, and the products produced in Berwick were sold throughout the United States.
Geography
Berwick is located in York County, in the southern part of the state. It is situated on the Salmon Falls River, which forms the border between Maine and New Hampshire. The town is bordered by Lebanon to the north, South Berwick to the east, and Rollinsford, New Hampshire to the south.
The town has a total area of 16.2 square miles, of which 15.9 square miles is land and 0.3 square miles is water. The highest point in Berwick is the summit of Mount Agamenticus, which has an elevation of 692 feet.
Economy
Berwick’s economy is largely based on manufacturing and tourism. The town is home to several manufacturing companies, including a paper mill, a plastics factory, and a machine shop.
The town is also a popular tourist destination. The Salmon Falls River is a popular spot for fishing, canoeing, and kayaking. The town is also home to several historic sites, including the Berwick Historical Society Museum and the Berwick Town Hall.
Demographics
As of the 2010 census, Berwick had a population of 7,246. The racial makeup of the town was 94.3% White, 1.2% African American, 0.5% Native American, 0.7% Asian, 0.1% Pacific Islander, 1.2% from other races, and 2.0% from two or more races. Hispanic or Latino of any race were 2.7% of the population.
The median household income in Berwick was $50,945, and the median family income was $60,917. The per capita income for the town was $24,945. About 8.3% of families and 10.3% of the population were below the poverty line, including 14.2% of those under age 18 and 6.2% of those age 65 or over.
Common Questions
What is Per Capita Income in North Berwick?
Per Capita income in North Berwick is $46,189.
What is the Median Family Income in North Berwick?
Median Family Income in North Berwick is $102,273.
What is the Median Household income in North Berwick?
Median Household Income in North Berwick is $50,579.
What is Income or Wage Gap in North Berwick?
Income or Wage Gap in North Berwick is 49.4%.
Women in North Berwick earn 50.6 cents for every dollar earned by a man.
What is Inequality or Gini Index in North Berwick?
Inequality or Gini Index in North Berwick is 0.56.
What is the Total Population of North Berwick?
Total Population of North Berwick is 1,806.
What is the Total Male Population of North Berwick?
Total Male Population of North Berwick is 702.
What is the Total Female Population of North Berwick?
Total Female Population of North Berwick is 1,104.
What is the Ratio of Males per 100 Females in North Berwick?
There are 63.59 Males per 100 Females in North Berwick.
What is the Ratio of Females per 100 Males in North Berwick?
There are 157.26 Females per 100 Males in North Berwick.
What is the Median Population Age in North Berwick?
Median Population Age in North Berwick is 45.7 Years.
What is the Average Family Size in North Berwick
Average Family Size in North Berwick is 2.9 People.
What is the Average Household Size in North Berwick
Average Household Size in North Berwick is 2.2 People.
How Large is the Labor Force in North Berwick?
There are 955 People in the Labor Forcein in North Berwick.
What is the Percentage of People in the Labor Force in North Berwick?
65.8% of People are in the Labor Force in North Berwick.
What is the Unemployment Rate in North Berwick?
Unemployment Rate in North Berwick is 0.7%.