Mexico, ME Map & Demographics
Mexico Map
Mexico Overview
$23,280
PER CAPITA INCOME
$53,056
AVG FAMILY INCOME
$35,093
AVG HOUSEHOLD INCOME
41.8%
WAGE / INCOME GAP [ % ]
58.2¢/ $1
WAGE / INCOME GAP [ $ ]
0.41
INEQUALITY / GINI INDEX
1,833
TOTAL POPULATION
717
MALE POPULATION
1,116
FEMALE POPULATION
64.25
MALES / 100 FEMALES
155.65
FEMALES / 100 MALES
58.1
MEDIAN AGE
2.7
AVG FAMILY SIZE
2.1
AVG HOUSEHOLD SIZE
730
LABOR FORCE [ PEOPLE ]
47.3%
PERCENT IN LABOR FORCE
2.2%
UNEMPLOYMENT RATE
Mexico Zip Codes
Mexico Area Codes
Income in Mexico
Income Overview in Mexico
Per Capita Income in Mexico is $23,280, while median incomes of families and households are $53,056 and $35,093 respectively.
| Characteristic | Number | Measure |
| Per Capita Income | 1,833 | $23,280 |
| Median Family Income | 534 | $53,056 |
| Mean Family Income | 534 | $59,990 |
| Median Household Income | 856 | $35,093 |
| Mean Household Income | 856 | $49,936 |
| Income Deficit | 534 | $0 |
| Wage / Income Gap (%) | 1,833 | 41.83% |
| Wage / Income Gap ($) | 1,833 | 58.17¢ per $1 |
| Gini / Inequality Index | 1,833 | 0.41 |
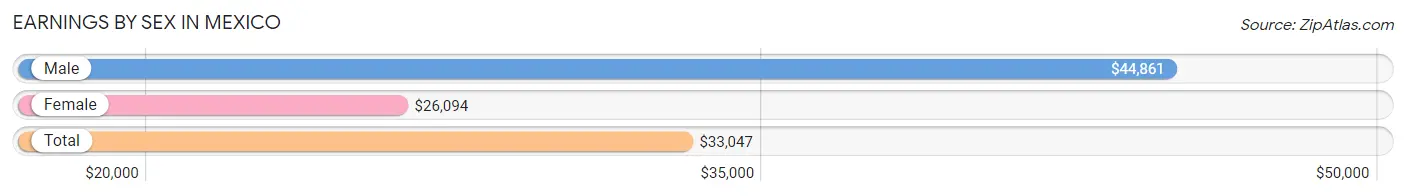
Earnings by Sex in Mexico
Average Earnings in Mexico are $33,047, $44,861 for men and $26,094 for women, a difference of 41.8%.
| Sex | Number | Average Earnings |
| Male | 384 (48.2%) | $44,861 |
| Female | 412 (51.8%) | $26,094 |
| Total | 796 (100.0%) | $33,047 |
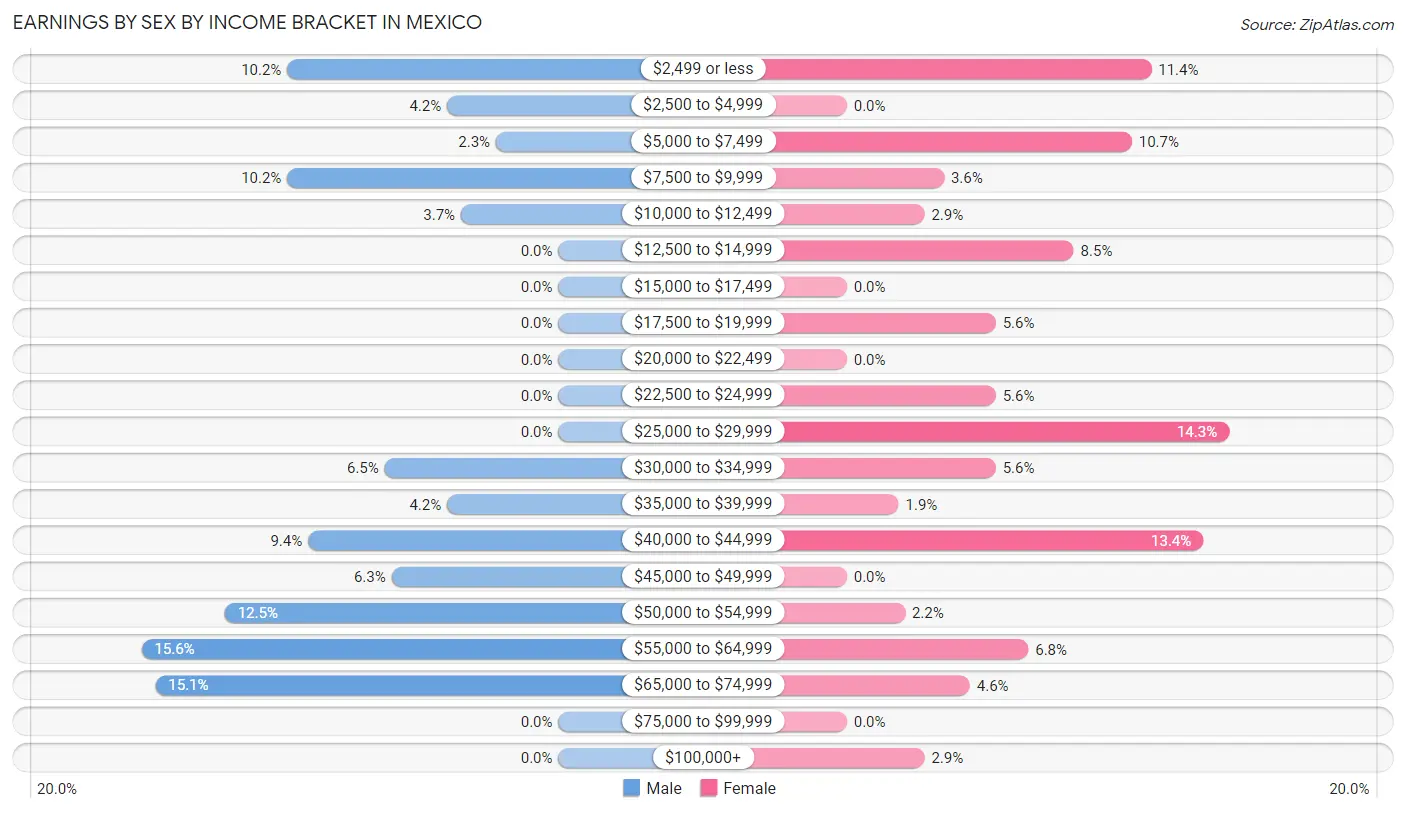
Earnings by Sex by Income Bracket in Mexico
The most common earnings brackets in Mexico are $55,000 to $64,999 for men (60 | 15.6%) and $25,000 to $29,999 for women (59 | 14.3%).
| Income | Male | Female |
| $2,499 or less | 39 (10.2%) | 47 (11.4%) |
| $2,500 to $4,999 | 16 (4.2%) | 0 (0.0%) |
| $5,000 to $7,499 | 9 (2.3%) | 44 (10.7%) |
| $7,500 to $9,999 | 39 (10.2%) | 15 (3.6%) |
| $10,000 to $12,499 | 14 (3.6%) | 12 (2.9%) |
| $12,500 to $14,999 | 0 (0.0%) | 35 (8.5%) |
| $15,000 to $17,499 | 0 (0.0%) | 0 (0.0%) |
| $17,500 to $19,999 | 0 (0.0%) | 23 (5.6%) |
| $20,000 to $22,499 | 0 (0.0%) | 0 (0.0%) |
| $22,500 to $24,999 | 0 (0.0%) | 23 (5.6%) |
| $25,000 to $29,999 | 0 (0.0%) | 59 (14.3%) |
| $30,000 to $34,999 | 25 (6.5%) | 23 (5.6%) |
| $35,000 to $39,999 | 16 (4.2%) | 8 (1.9%) |
| $40,000 to $44,999 | 36 (9.4%) | 55 (13.4%) |
| $45,000 to $49,999 | 24 (6.2%) | 0 (0.0%) |
| $50,000 to $54,999 | 48 (12.5%) | 9 (2.2%) |
| $55,000 to $64,999 | 60 (15.6%) | 28 (6.8%) |
| $65,000 to $74,999 | 58 (15.1%) | 19 (4.6%) |
| $75,000 to $99,999 | 0 (0.0%) | 0 (0.0%) |
| $100,000+ | 0 (0.0%) | 12 (2.9%) |
| Total | 384 (100.0%) | 412 (100.0%) |
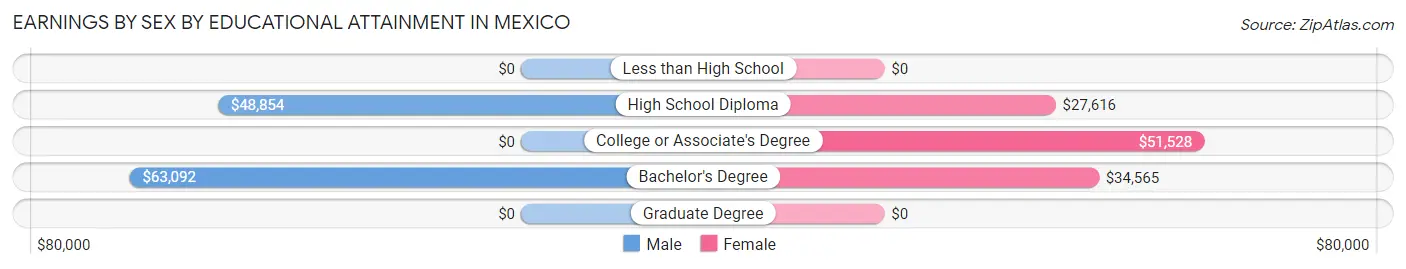
Earnings by Sex by Educational Attainment in Mexico
Average earnings in Mexico are $44,861 for men and $29,041 for women, a difference of 35.3%. Men with an educational attainment of bachelor's degree enjoy the highest average annual earnings of $63,092, while those with high school diploma education earn the least with $48,854. Women with an educational attainment of college or associate's degree earn the most with the average annual earnings of $51,528, while those with high school diploma education have the smallest earnings of $27,616.
| Educational Attainment | Male Income | Female Income |
| Less than High School | - | - |
| High School Diploma | $48,854 | $27,616 |
| College or Associate's Degree | - | - |
| Bachelor's Degree | $63,092 | $34,565 |
| Graduate Degree | - | - |
| Total | $44,861 | $29,041 |
Family Income in Mexico
Family Income Brackets in Mexico
According to the Mexico family income data, there are 129 families falling into the $50,000 to $74,999 income range, which is the most common income bracket and makes up 24.2% of all families.
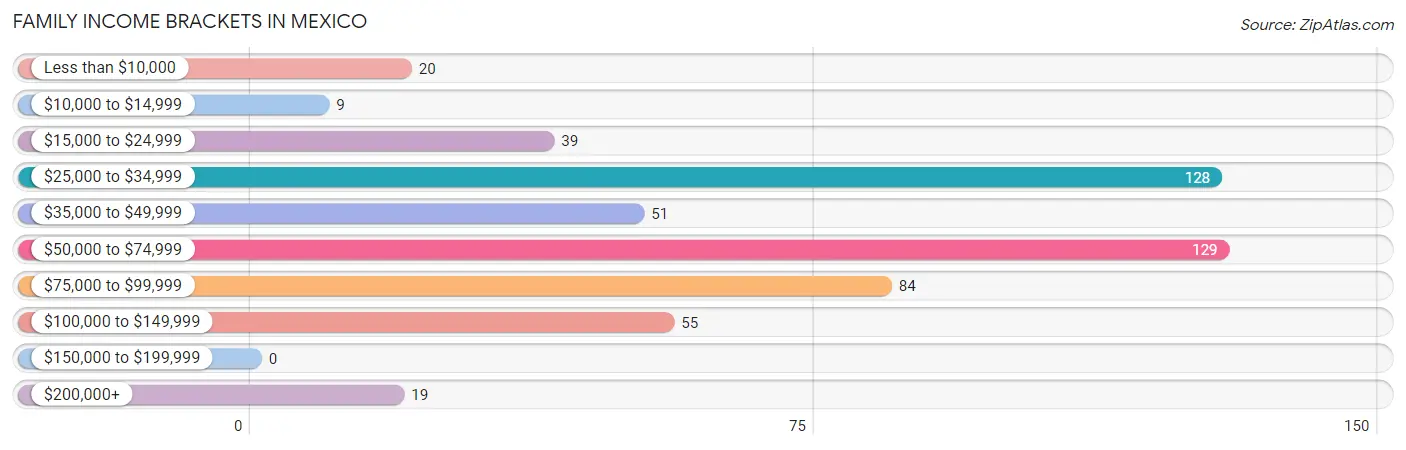
| Income Bracket | # Families | % Families |
| Less than $10,000 | 20 | 3.7% |
| $10,000 to $14,999 | 9 | 1.7% |
| $15,000 to $24,999 | 39 | 7.3% |
| $25,000 to $34,999 | 128 | 24.0% |
| $35,000 to $49,999 | 51 | 9.6% |
| $50,000 to $74,999 | 129 | 24.2% |
| $75,000 to $99,999 | 84 | 15.7% |
| $100,000 to $149,999 | 55 | 10.3% |
| $150,000 to $199,999 | 0 | 0.0% |
| $200,000+ | 19 | 3.6% |
Family Income by Famaliy Size in Mexico
4-person families (56 | 10.5%) account for the highest median family income in Mexico with $105,741 per family, while 4-person families (56 | 10.5%) have the highest median income of $26,435 per family member.
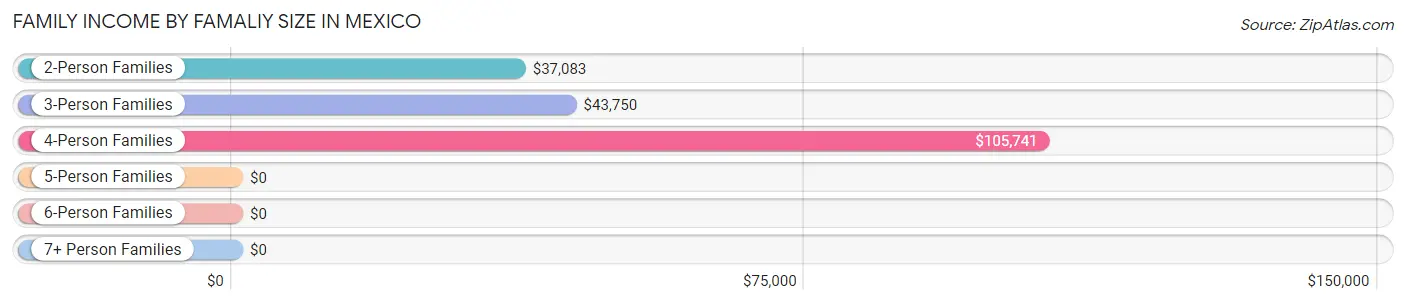
| Income Bracket | # Families | Median Income |
| 2-Person Families | 381 (71.4%) | $37,083 |
| 3-Person Families | 70 (13.1%) | $43,750 |
| 4-Person Families | 56 (10.5%) | $105,741 |
| 5-Person Families | 0 (0.0%) | $0 |
| 6-Person Families | 27 (5.1%) | $0 |
| 7+ Person Families | 0 (0.0%) | $0 |
| Total | 534 (100.0%) | $53,056 |
Family Income by Number of Earners in Mexico
The median family income in Mexico is $53,056, with families comprising 2 earners (138) having the highest median family income of $86,667, while families with no earners (155) have the lowest median family income of $31,267, accounting for 25.8% and 29.0% of families, respectively.
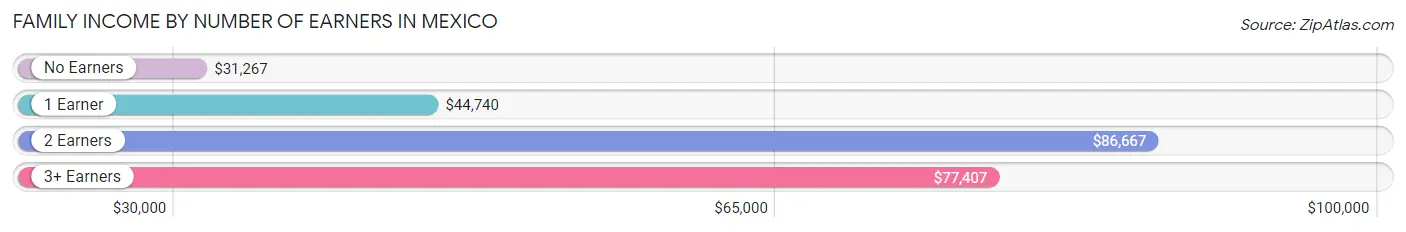
| Number of Earners | # Families | Median Income |
| No Earners | 155 (29.0%) | $31,267 |
| 1 Earner | 189 (35.4%) | $44,740 |
| 2 Earners | 138 (25.8%) | $86,667 |
| 3+ Earners | 52 (9.7%) | $77,407 |
| Total | 534 (100.0%) | $53,056 |
Household Income in Mexico
Household Income Brackets in Mexico
With 174 households falling in the category, the $15,000 to $24,999 income range is the most frequent in Mexico, accounting for 20.3% of all households.
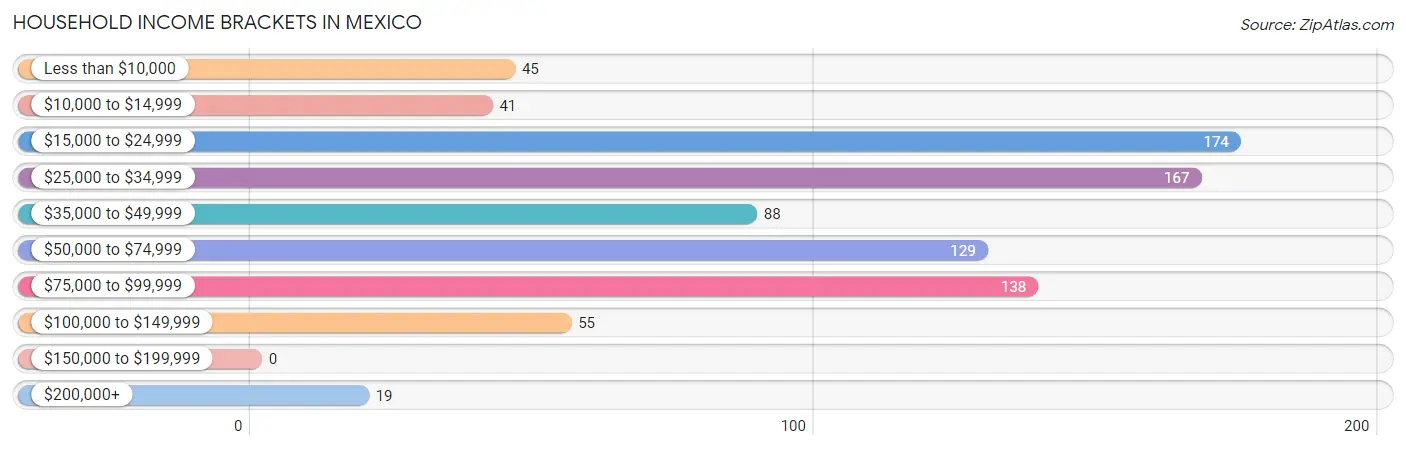
| Income Bracket | # Households | % Households |
| Less than $10,000 | 45 | 5.3% |
| $10,000 to $14,999 | 41 | 4.8% |
| $15,000 to $24,999 | 174 | 20.3% |
| $25,000 to $34,999 | 167 | 19.5% |
| $35,000 to $49,999 | 88 | 10.3% |
| $50,000 to $74,999 | 129 | 15.1% |
| $75,000 to $99,999 | 138 | 16.1% |
| $100,000 to $149,999 | 55 | 6.4% |
| $150,000 to $199,999 | 0 | 0.0% |
| $200,000+ | 19 | 2.2% |
Household Income by Householder Age in Mexico
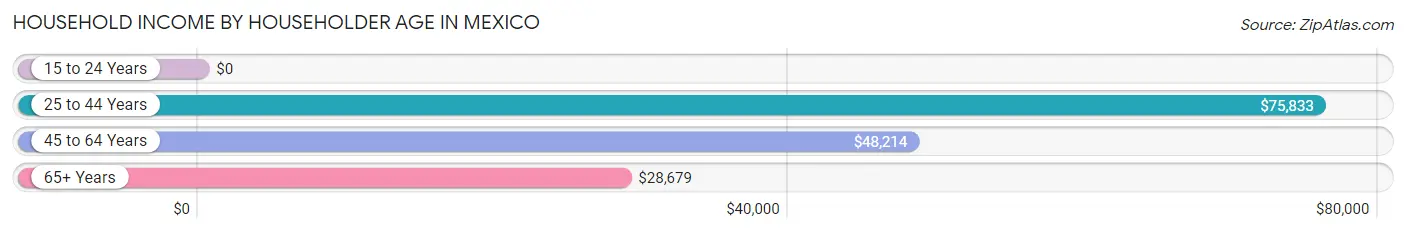
The median household income in Mexico is $35,093, with the highest median household income of $75,833 found in the 25 to 44 years age bracket for the primary householder. A total of 224 households (26.2%) fall into this category.
| Income Bracket | # Households | Median Income |
| 15 to 24 Years | 0 (0.0%) | $0 |
| 25 to 44 Years | 224 (26.2%) | $75,833 |
| 45 to 64 Years | 288 (33.6%) | $48,214 |
| 65+ Years | 344 (40.2%) | $28,679 |
| Total | 856 (100.0%) | $35,093 |
Poverty in Mexico
Income Below Poverty by Sex and Age in Mexico
With 14.3% poverty level for males and 12.9% for females among the residents of Mexico, 25 to 34 year old males and 6 to 11 year old females are the most vulnerable to poverty, with 23 males (45.1%) and 52 females (23.3%) in their respective age groups living below the poverty level.
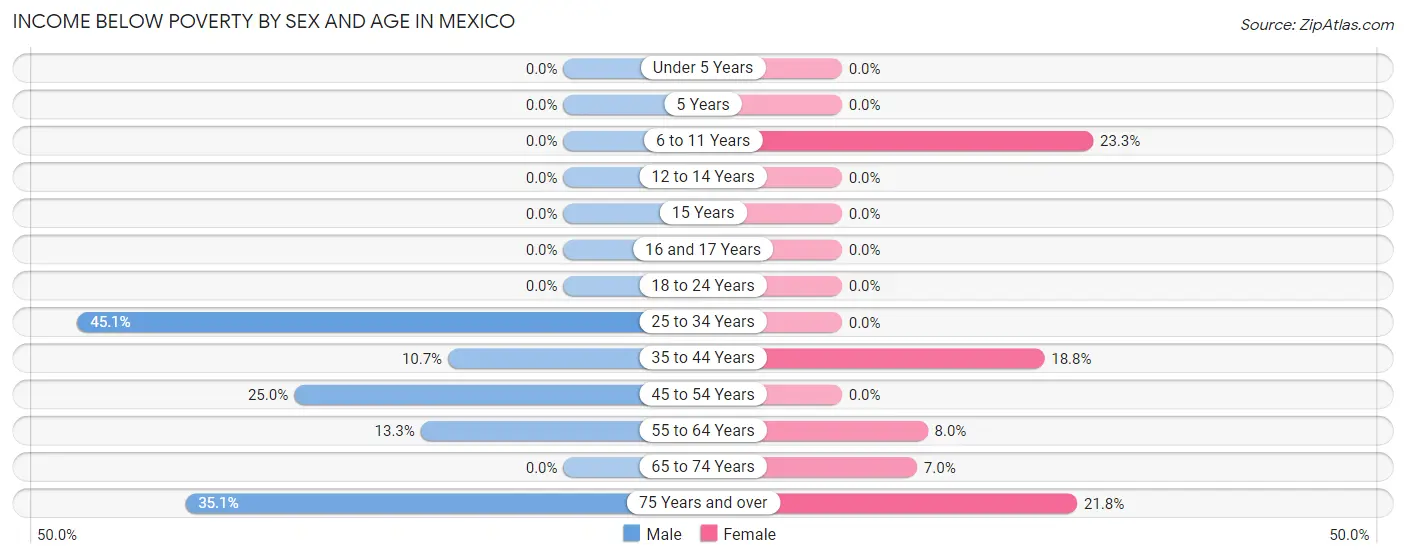
| Age Bracket | Male | Female |
| Under 5 Years | 0 (0.0%) | 0 (0.0%) |
| 5 Years | 0 (0.0%) | 0 (0.0%) |
| 6 to 11 Years | 0 (0.0%) | 52 (23.3%) |
| 12 to 14 Years | 0 (0.0%) | 0 (0.0%) |
| 15 Years | 0 (0.0%) | 0 (0.0%) |
| 16 and 17 Years | 0 (0.0%) | 0 (0.0%) |
| 18 to 24 Years | 0 (0.0%) | 0 (0.0%) |
| 25 to 34 Years | 23 (45.1%) | 0 (0.0%) |
| 35 to 44 Years | 18 (10.7%) | 31 (18.8%) |
| 45 to 54 Years | 9 (25.0%) | 0 (0.0%) |
| 55 to 64 Years | 31 (13.3%) | 16 (8.0%) |
| 65 to 74 Years | 0 (0.0%) | 14 (7.0%) |
| 75 Years and over | 20 (35.1%) | 31 (21.8%) |
| Total | 101 (14.3%) | 144 (12.9%) |
Income Above Poverty by Sex and Age in Mexico
According to the poverty statistics in Mexico, males aged 15 years and females aged under 5 years are the age groups that are most secure financially, with 100.0% of males and 100.0% of females in these age groups living above the poverty line.
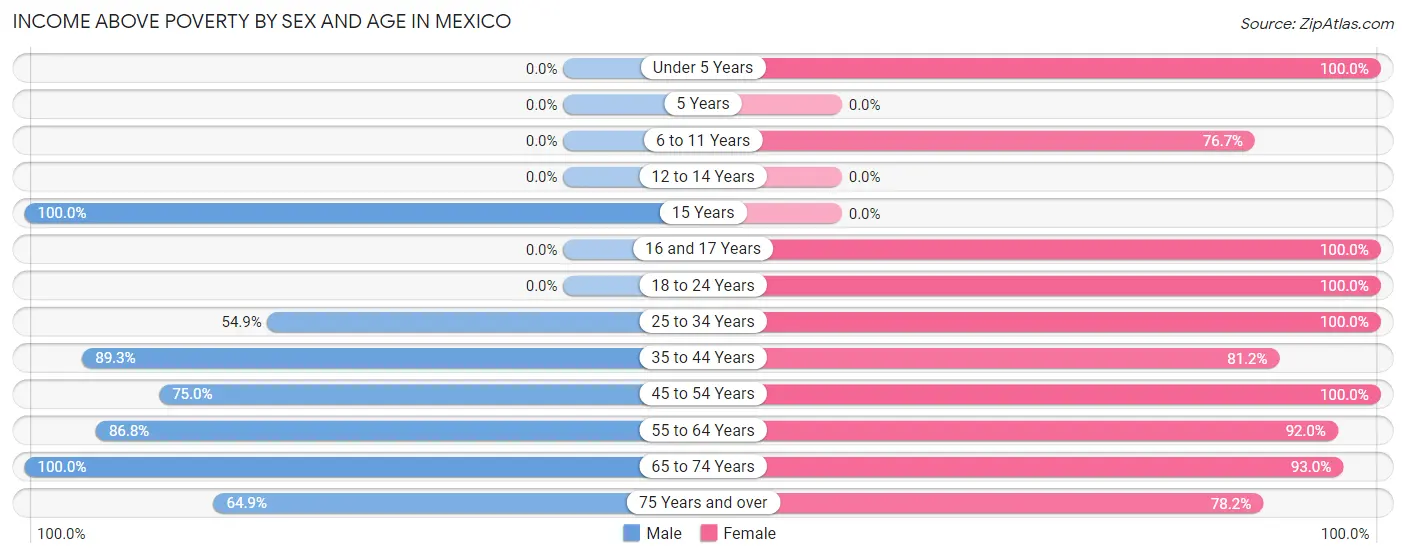
| Age Bracket | Male | Female |
| Under 5 Years | 0 (0.0%) | 24 (100.0%) |
| 5 Years | 0 (0.0%) | 0 (0.0%) |
| 6 to 11 Years | 0 (0.0%) | 171 (76.7%) |
| 12 to 14 Years | 0 (0.0%) | 0 (0.0%) |
| 15 Years | 32 (100.0%) | 0 (0.0%) |
| 16 and 17 Years | 0 (0.0%) | 66 (100.0%) |
| 18 to 24 Years | 0 (0.0%) | 15 (100.0%) |
| 25 to 34 Years | 28 (54.9%) | 28 (100.0%) |
| 35 to 44 Years | 150 (89.3%) | 134 (81.2%) |
| 45 to 54 Years | 27 (75.0%) | 51 (100.0%) |
| 55 to 64 Years | 203 (86.8%) | 185 (92.0%) |
| 65 to 74 Years | 129 (100.0%) | 187 (93.0%) |
| 75 Years and over | 37 (64.9%) | 111 (78.2%) |
| Total | 606 (85.7%) | 972 (87.1%) |
Income Below Poverty Among Married-Couple Families in Mexico
The poverty statistics for married-couple families in Mexico show that 9.2% or 45 of the total 490 families live below the poverty line. Families with no children have the highest poverty rate of 12.1%, comprising of 45 families. On the other hand, families with 1 or 2 children have the lowest poverty rate of 0.0%, which includes 0 families.
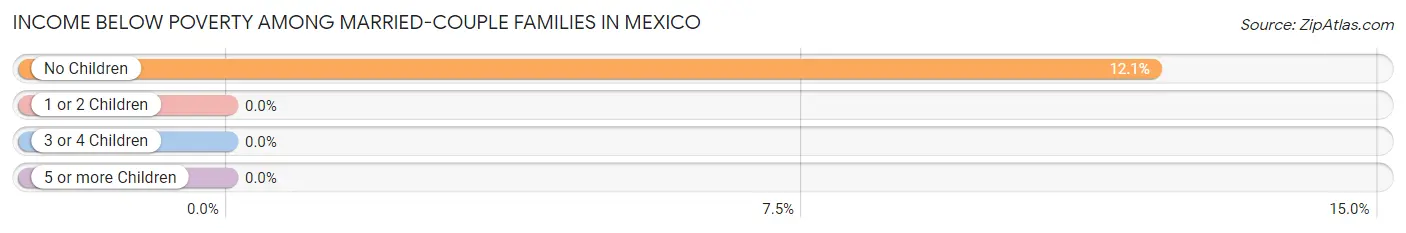
| Children | Above Poverty | Below Poverty |
| No Children | 328 (87.9%) | 45 (12.1%) |
| 1 or 2 Children | 90 (100.0%) | 0 (0.0%) |
| 3 or 4 Children | 27 (100.0%) | 0 (0.0%) |
| 5 or more Children | 0 (0.0%) | 0 (0.0%) |
| Total | 445 (90.8%) | 45 (9.2%) |
Income Below Poverty Among Single-Parent Households in Mexico
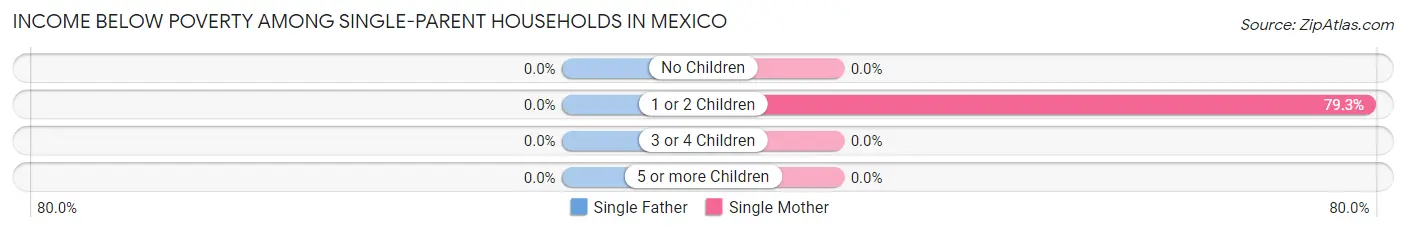
| Children | Single Father | Single Mother |
| No Children | 0 (0.0%) | 0 (0.0%) |
| 1 or 2 Children | 0 (0.0%) | 23 (79.3%) |
| 3 or 4 Children | 0 (0.0%) | 0 (0.0%) |
| 5 or more Children | 0 (0.0%) | 0 (0.0%) |
| Total | 0 (0.0%) | 23 (52.3%) |
Income Below Poverty Among Married-Couple vs Single-Parent Households in Mexico
The poverty data for Mexico shows that 45 of the married-couple family households (9.2%) and 23 of the single-parent households (52.3%) are living below the poverty level. Within the married-couple family households, those with no children have the highest poverty rate, with 45 households (12.1%) falling below the poverty line. Among the single-parent households, those with 1 or 2 children have the highest poverty rate, with 23 household (79.3%) living below poverty.
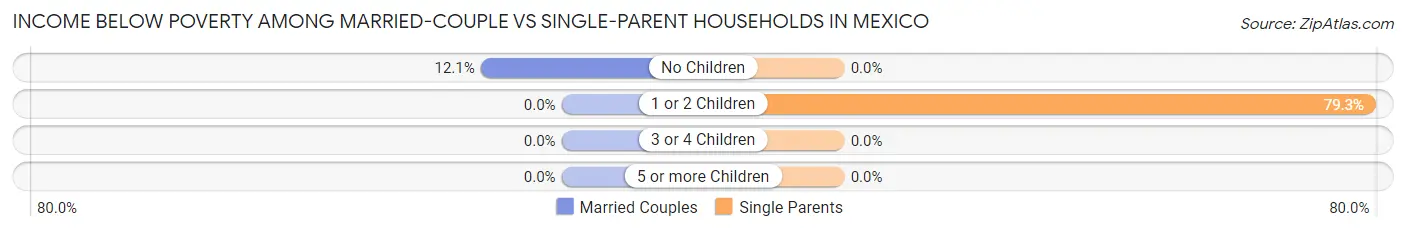
| Children | Married-Couple Families | Single-Parent Households |
| No Children | 45 (12.1%) | 0 (0.0%) |
| 1 or 2 Children | 0 (0.0%) | 23 (79.3%) |
| 3 or 4 Children | 0 (0.0%) | 0 (0.0%) |
| 5 or more Children | 0 (0.0%) | 0 (0.0%) |
| Total | 45 (9.2%) | 23 (52.3%) |
Race in Mexico
The most populous races in Mexico are White / Caucasian (1,806 | 98.5%), Hispanic or Latino (64 | 3.5%), and Two or more Races (27 | 1.5%).
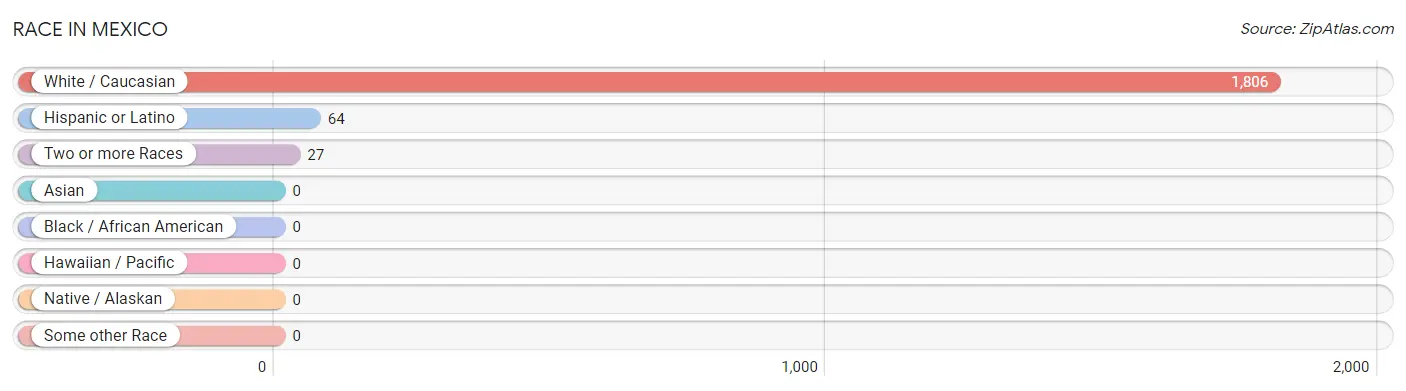
| Race | # Population | % Population |
| Asian | 0 | 0.0% |
| Black / African American | 0 | 0.0% |
| Hawaiian / Pacific | 0 | 0.0% |
| Hispanic or Latino | 64 | 3.5% |
| Native / Alaskan | 0 | 0.0% |
| White / Caucasian | 1,806 | 98.5% |
| Two or more Races | 27 | 1.5% |
| Some other Race | 0 | 0.0% |
| Total | 1,833 | 100.0% |
Ancestry in Mexico
The most populous ancestries reported in Mexico are English (415 | 22.6%), French (390 | 21.3%), French Canadian (224 | 12.2%), Italian (190 | 10.4%), and American (173 | 9.4%), together accounting for 76.0% of all Mexico residents.
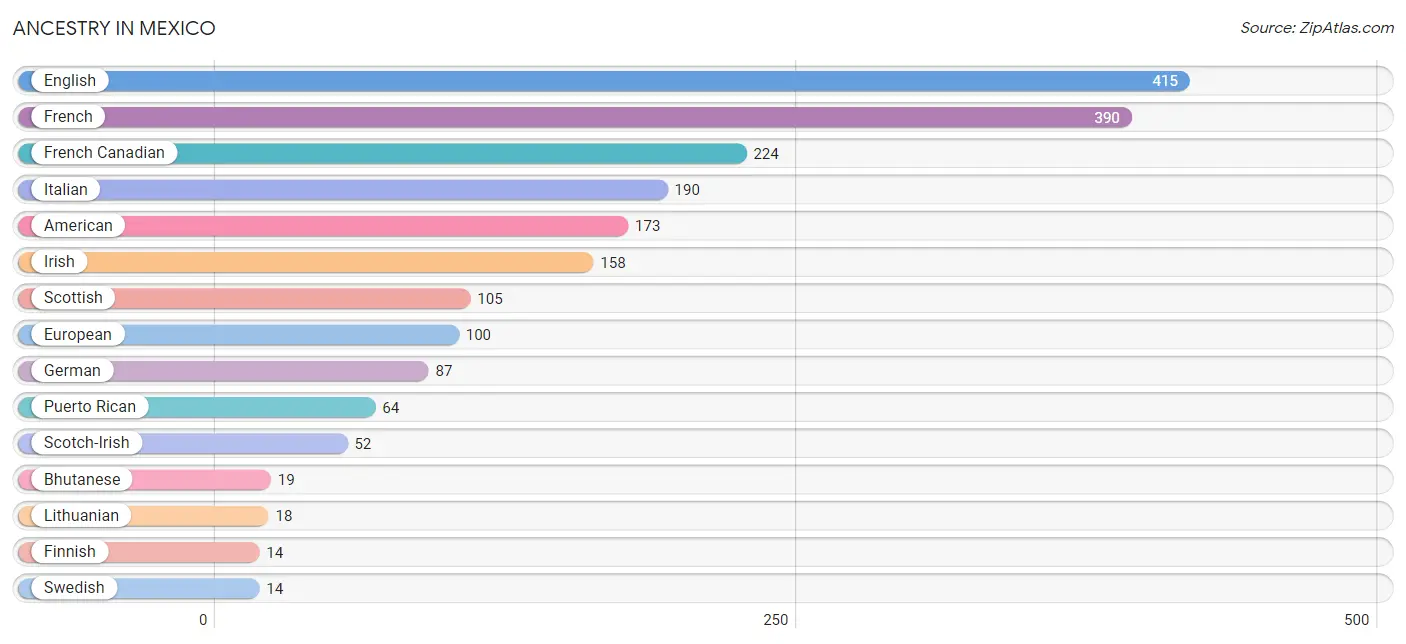
| Ancestry | # Population | % Population |
| American | 173 | 9.4% |
| Bhutanese | 19 | 1.0% |
| English | 415 | 22.6% |
| European | 100 | 5.5% |
| Finnish | 14 | 0.8% |
| French | 390 | 21.3% |
| French Canadian | 224 | 12.2% |
| German | 87 | 4.8% |
| Irish | 158 | 8.6% |
| Italian | 190 | 10.4% |
| Lithuanian | 18 | 1.0% |
| Portuguese | 8 | 0.4% |
| Puerto Rican | 64 | 3.5% |
| Scotch-Irish | 52 | 2.8% |
| Scottish | 105 | 5.7% |
| Swedish | 14 | 0.8% |
| Ukrainian | 7 | 0.4% |
| Welsh | 11 | 0.6% | View All 18 Rows |
Immigrants in Mexico
The most numerous immigrant groups reported in Mexico came from , and Canada (33 | 1.8%), together accounting for 1.8% of all Mexico residents.

| Immigration Origin | # Population | % Population |
| Canada | 33 | 1.8% | View All 1 Rows |
Sex and Age in Mexico
Sex and Age in Mexico
The most populous age groups in Mexico are 60 to 64 Years (203 | 28.3%) for men and 65 to 69 Years (170 | 15.2%) for women.
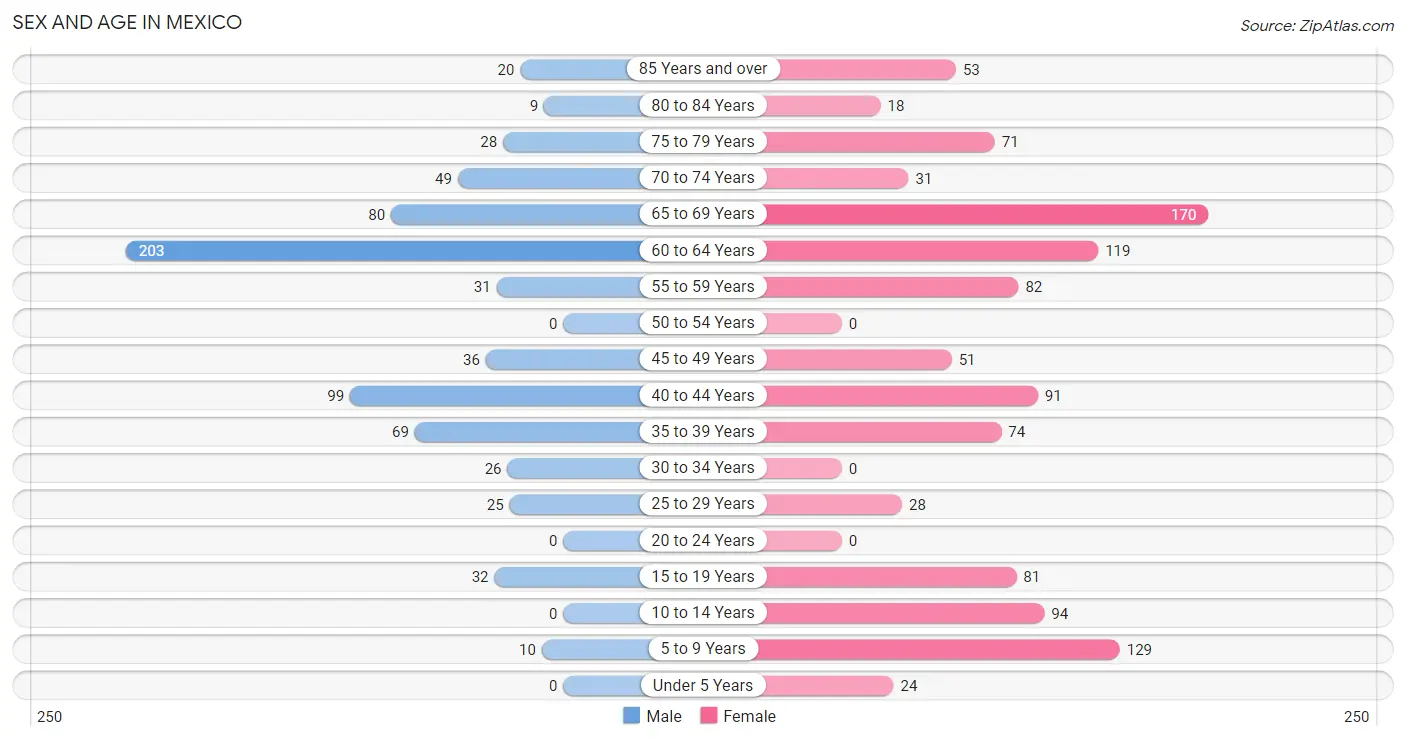
| Age Bracket | Male | Female |
| Under 5 Years | 0 (0.0%) | 24 (2.1%) |
| 5 to 9 Years | 10 (1.4%) | 129 (11.6%) |
| 10 to 14 Years | 0 (0.0%) | 94 (8.4%) |
| 15 to 19 Years | 32 (4.5%) | 81 (7.3%) |
| 20 to 24 Years | 0 (0.0%) | 0 (0.0%) |
| 25 to 29 Years | 25 (3.5%) | 28 (2.5%) |
| 30 to 34 Years | 26 (3.6%) | 0 (0.0%) |
| 35 to 39 Years | 69 (9.6%) | 74 (6.6%) |
| 40 to 44 Years | 99 (13.8%) | 91 (8.2%) |
| 45 to 49 Years | 36 (5.0%) | 51 (4.6%) |
| 50 to 54 Years | 0 (0.0%) | 0 (0.0%) |
| 55 to 59 Years | 31 (4.3%) | 82 (7.3%) |
| 60 to 64 Years | 203 (28.3%) | 119 (10.7%) |
| 65 to 69 Years | 80 (11.2%) | 170 (15.2%) |
| 70 to 74 Years | 49 (6.8%) | 31 (2.8%) |
| 75 to 79 Years | 28 (3.9%) | 71 (6.4%) |
| 80 to 84 Years | 9 (1.3%) | 18 (1.6%) |
| 85 Years and over | 20 (2.8%) | 53 (4.8%) |
| Total | 717 (100.0%) | 1,116 (100.0%) |
Families and Households in Mexico
Median Family Size in Mexico
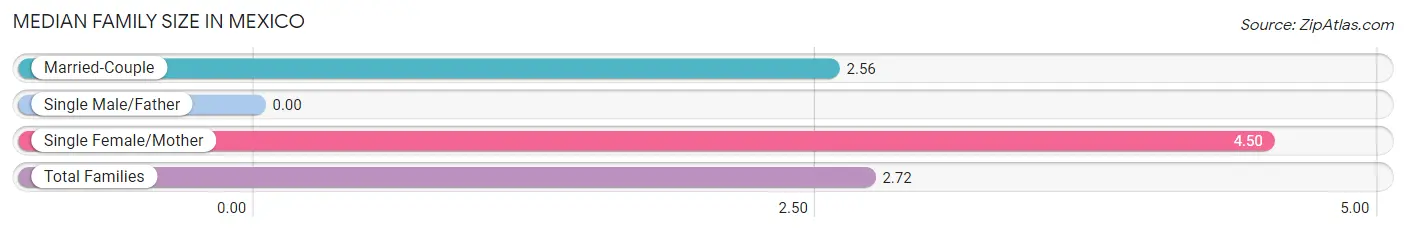
| Family Type | # Families | Family Size |
| Married-Couple | 490 (91.8%) | 2.56 |
| Single Male/Father | 0 (0.0%) | - |
| Single Female/Mother | 44 (8.2%) | 4.50 |
| Total Families | 534 (100.0%) | 2.72 |
Median Household Size in Mexico
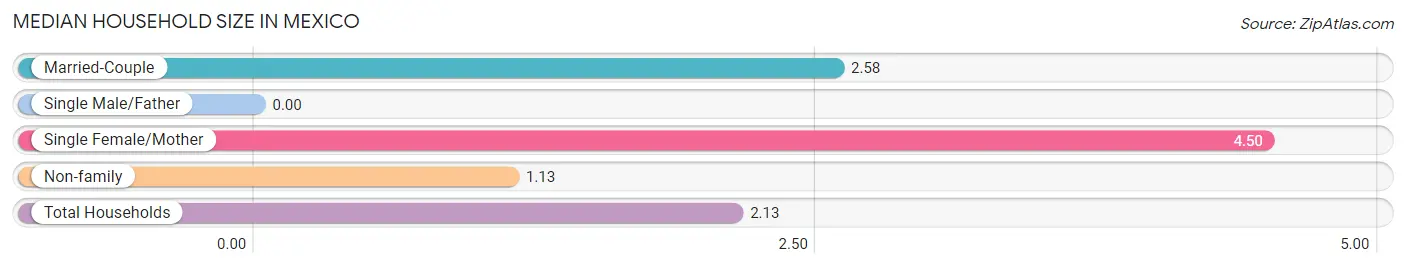
| Household Type | # Households | Household Size |
| Married-Couple | 490 (57.2%) | 2.58 |
| Single Male/Father | 0 (0.0%) | - |
| Single Female/Mother | 44 (5.1%) | 4.50 |
| Non-family | 322 (37.6%) | 1.13 |
| Total Households | 856 (100.0%) | 2.13 |
Household Size by Marriage Status in Mexico
Out of a total of 856 households in Mexico, 534 (62.4%) are family households, while 322 (37.6%) are nonfamily households. The most numerous type of family households are 2-person households, comprising 369, and the most common type of nonfamily households are 1-person households, comprising 268.
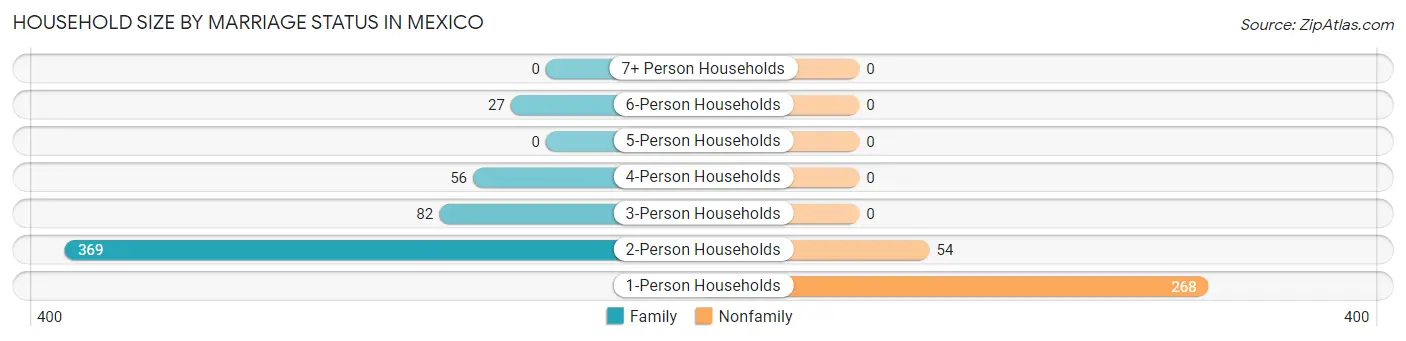
| Household Size | Family Households | Nonfamily Households |
| 1-Person Households | - | 268 (31.3%) |
| 2-Person Households | 369 (43.1%) | 54 (6.3%) |
| 3-Person Households | 82 (9.6%) | 0 (0.0%) |
| 4-Person Households | 56 (6.5%) | 0 (0.0%) |
| 5-Person Households | 0 (0.0%) | 0 (0.0%) |
| 6-Person Households | 27 (3.2%) | 0 (0.0%) |
| 7+ Person Households | 0 (0.0%) | 0 (0.0%) |
| Total | 534 (62.4%) | 322 (37.6%) |
Female Fertility in Mexico
Fertility by Age in Mexico
| Age Bracket | Women with Births | Births / 1,000 Women |
| 15 to 19 years | 0 (0.0%) | 0.0 |
| 20 to 34 years | 0 (0.0%) | 0.0 |
| 35 to 50 years | 0 (0.0%) | 0.0 |
| Total | 0 (0.0%) | 0.0 |
Fertility by Age by Marriage Status in Mexico
| Age Bracket | Married | Unmarried |
| 15 to 19 years | 0 (0.0%) | 0 (0.0%) |
| 20 to 34 years | 0 (0.0%) | 0 (0.0%) |
| 35 to 50 years | 0 (0.0%) | 0 (0.0%) |
| Total | 0 (0.0%) | 0 (0.0%) |
Fertility by Education in Mexico
| Educational Attainment | Women with Births | Births / 1,000 Women |
| Less than High School | 0 (0.0%) | 0.0 |
| High School Diploma | 0 (0.0%) | 0.0 |
| College or Associate's Degree | 0 (0.0%) | 0.0 |
| Bachelor's Degree | 0 (0.0%) | 0.0 |
| Graduate Degree | 0 (0.0%) | 0.0 |
| Total | 0 (0.0%) | 0.0 |
Fertility by Education by Marriage Status in Mexico
| Educational Attainment | Married | Unmarried |
| Less than High School | 0 (0.0%) | 0 (0.0%) |
| High School Diploma | 0 (0.0%) | 0 (0.0%) |
| College or Associate's Degree | 0 (0.0%) | 0 (0.0%) |
| Bachelor's Degree | 0 (0.0%) | 0 (0.0%) |
| Graduate Degree | 0 (0.0%) | 0 (0.0%) |
| Total | 0 (0.0%) | 0 (0.0%) |
Employment Characteristics in Mexico
Employment by Class of Employer in Mexico
Among the 705 employed individuals in Mexico, private company employees (510 | 72.3%), not-for-profit organizations (91 | 12.9%), and self-employed (not incorporated) (56 | 7.9%) make up the most common classes of employment.
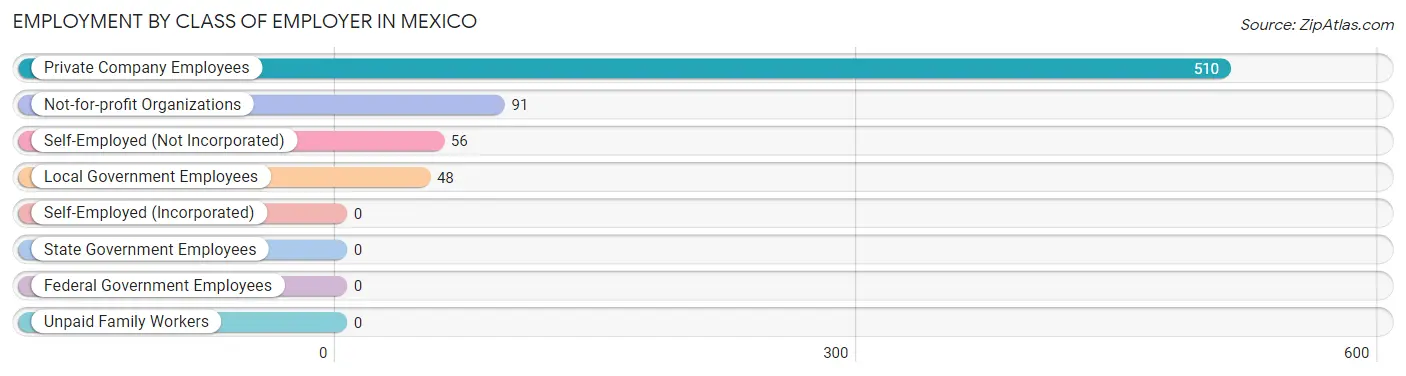
| Employer Class | # Employees | % Employees |
| Private Company Employees | 510 | 72.3% |
| Self-Employed (Incorporated) | 0 | 0.0% |
| Self-Employed (Not Incorporated) | 56 | 7.9% |
| Not-for-profit Organizations | 91 | 12.9% |
| Local Government Employees | 48 | 6.8% |
| State Government Employees | 0 | 0.0% |
| Federal Government Employees | 0 | 0.0% |
| Unpaid Family Workers | 0 | 0.0% |
| Total | 705 | 100.0% |
Employment Status by Age in Mexico
According to the labor force statistics for Mexico, out of the total population over 16 years of age (1,544), 47.3% or 730 individuals are in the labor force, with 2.2% or 16 of them unemployed. The age group with the highest labor force participation rate is 25 to 29 years, with 100.0% or 53 individuals in the labor force. Within the labor force, the 35 to 44 years age range has the highest percentage of unemployed individuals, with 5.4% or 16 of them being unemployed.
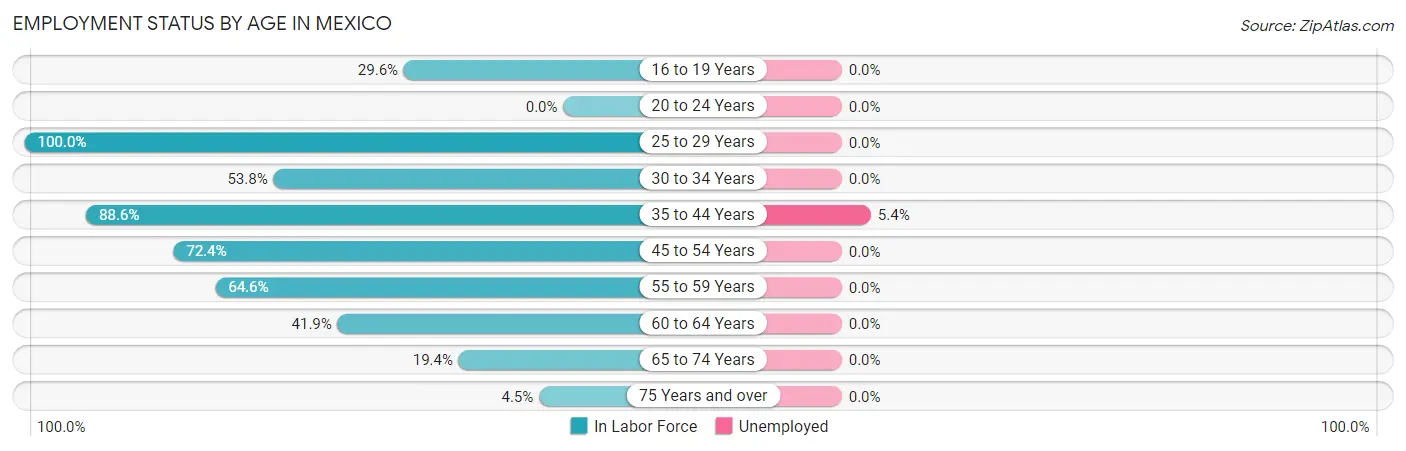
| Age Bracket | In Labor Force | Unemployed |
| 16 to 19 Years | 24 (29.6%) | 0 (0.0%) |
| 20 to 24 Years | 0 (0.0%) | 0 (0.0%) |
| 25 to 29 Years | 53 (100.0%) | 0 (0.0%) |
| 30 to 34 Years | 14 (53.8%) | 0 (0.0%) |
| 35 to 44 Years | 295 (88.6%) | 16 (5.4%) |
| 45 to 54 Years | 63 (72.4%) | 0 (0.0%) |
| 55 to 59 Years | 73 (64.6%) | 0 (0.0%) |
| 60 to 64 Years | 135 (41.9%) | 0 (0.0%) |
| 65 to 74 Years | 64 (19.4%) | 0 (0.0%) |
| 75 Years and over | 9 (4.5%) | 0 (0.0%) |
| Total | 730 (47.3%) | 16 (2.2%) |
Employment Status by Educational Attainment in Mexico
According to labor force statistics for Mexico, 67.8% of individuals (633) out of the total population between 25 and 64 years of age (934) are in the labor force, with 2.5% or 16 of them being unemployed. The group with the highest labor force participation rate are those with the educational attainment of less than high school, with 100.0% or 51 individuals in the labor force. Within the labor force, individuals with college / associate degree education have the highest percentage of unemployment, with 7.9% or 16 of them being unemployed.
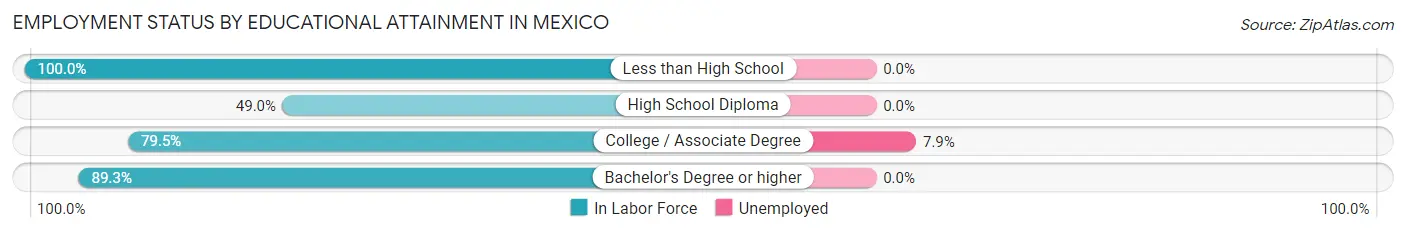
| Educational Attainment | In Labor Force | Unemployed |
| Less than High School | 51 (100.0%) | 0 (0.0%) |
| High School Diploma | 221 (49.0%) | 0 (0.0%) |
| College / Associate Degree | 202 (79.5%) | 20 (7.9%) |
| Bachelor's Degree or higher | 159 (89.3%) | 0 (0.0%) |
| Total | 633 (67.8%) | 23 (2.5%) |
Employment Occupations by Sex in Mexico
Management, Business, Science and Arts Occupations
The most common Management, Business, Science and Arts occupations in Mexico are Community & Social Service (66 | 9.2%), Education, Arts & Media (39 | 5.5%), Business & Financial (37 | 5.2%), Management (28 | 3.9%), and Arts, Media & Entertainment (27 | 3.8%).
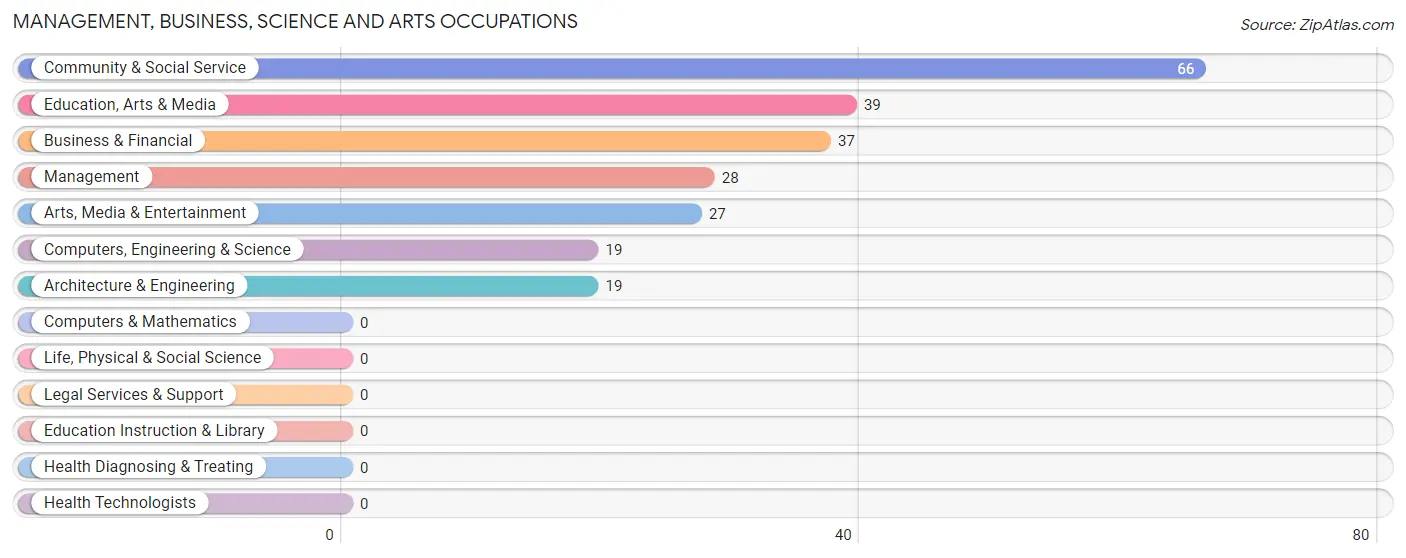
Management, Business, Science and Arts Occupations by Sex
Within the Management, Business, Science and Arts occupations in Mexico, the most male-oriented occupations are Education, Arts & Media (100.0%), Community & Social Service (59.1%), and Business & Financial (37.8%), while the most female-oriented occupations are Management (100.0%), Computers, Engineering & Science (100.0%), and Architecture & Engineering (100.0%).
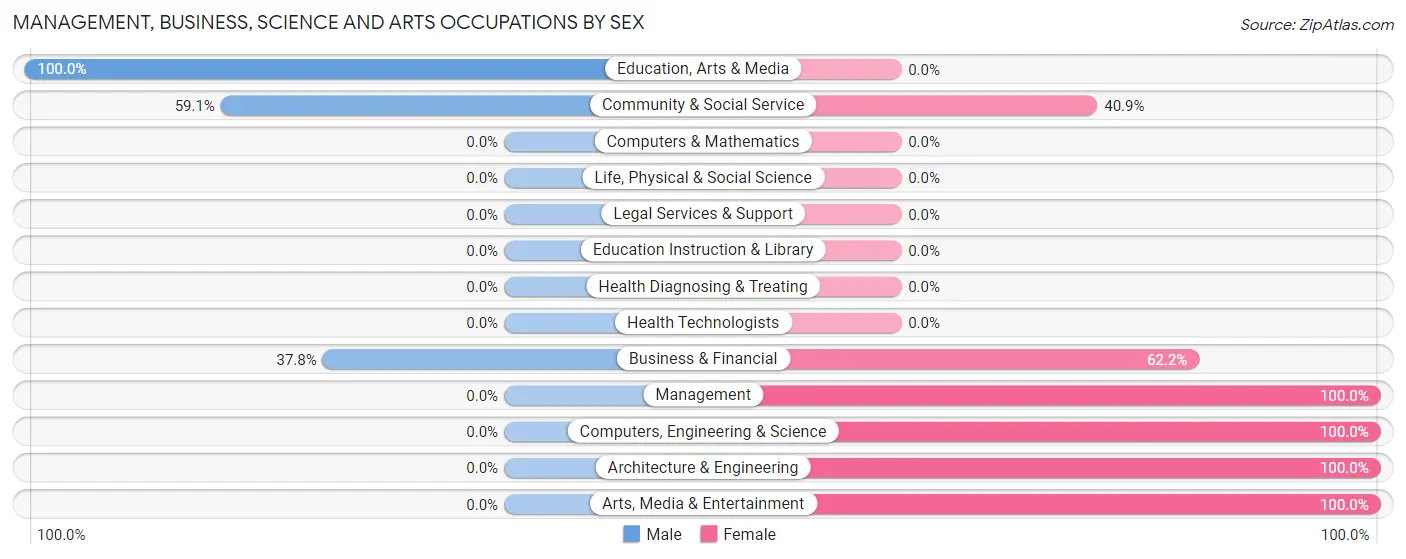
| Occupation | Male | Female |
| Management | 0 (0.0%) | 28 (100.0%) |
| Business & Financial | 14 (37.8%) | 23 (62.2%) |
| Computers, Engineering & Science | 0 (0.0%) | 19 (100.0%) |
| Computers & Mathematics | 0 (0.0%) | 0 (0.0%) |
| Architecture & Engineering | 0 (0.0%) | 19 (100.0%) |
| Life, Physical & Social Science | 0 (0.0%) | 0 (0.0%) |
| Community & Social Service | 39 (59.1%) | 27 (40.9%) |
| Education, Arts & Media | 39 (100.0%) | 0 (0.0%) |
| Legal Services & Support | 0 (0.0%) | 0 (0.0%) |
| Education Instruction & Library | 0 (0.0%) | 0 (0.0%) |
| Arts, Media & Entertainment | 0 (0.0%) | 27 (100.0%) |
| Health Diagnosing & Treating | 0 (0.0%) | 0 (0.0%) |
| Health Technologists | 0 (0.0%) | 0 (0.0%) |
| Total (Category) | 53 (35.3%) | 97 (64.7%) |
| Total (Overall) | 349 (48.9%) | 365 (51.1%) |
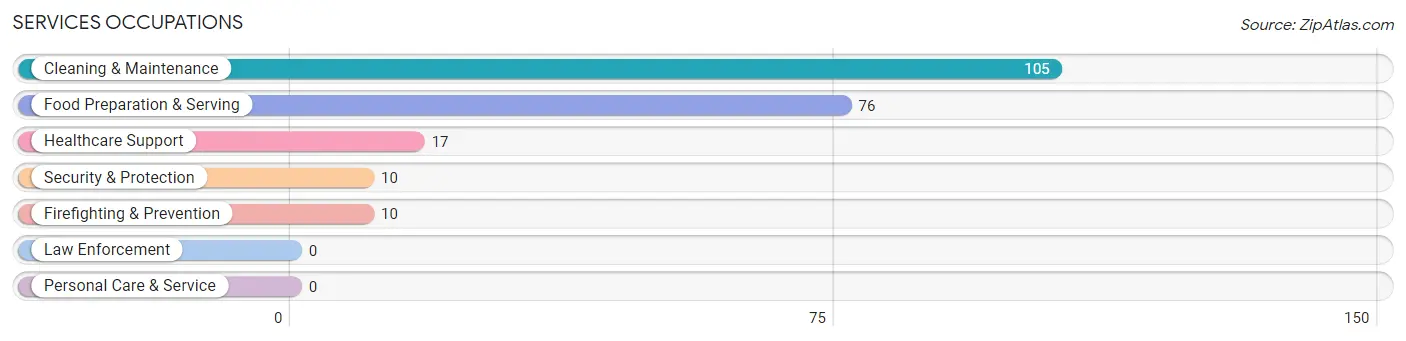
Services Occupations
The most common Services occupations in Mexico are Cleaning & Maintenance (105 | 14.7%), Food Preparation & Serving (76 | 10.6%), Healthcare Support (17 | 2.4%), Security & Protection (10 | 1.4%), and Firefighting & Prevention (10 | 1.4%).
Services Occupations by Sex
Within the Services occupations in Mexico, the most male-oriented occupations are Security & Protection (100.0%), Firefighting & Prevention (100.0%), and Food Preparation & Serving (32.9%), while the most female-oriented occupations are Healthcare Support (100.0%), Cleaning & Maintenance (78.1%), and Food Preparation & Serving (67.1%).
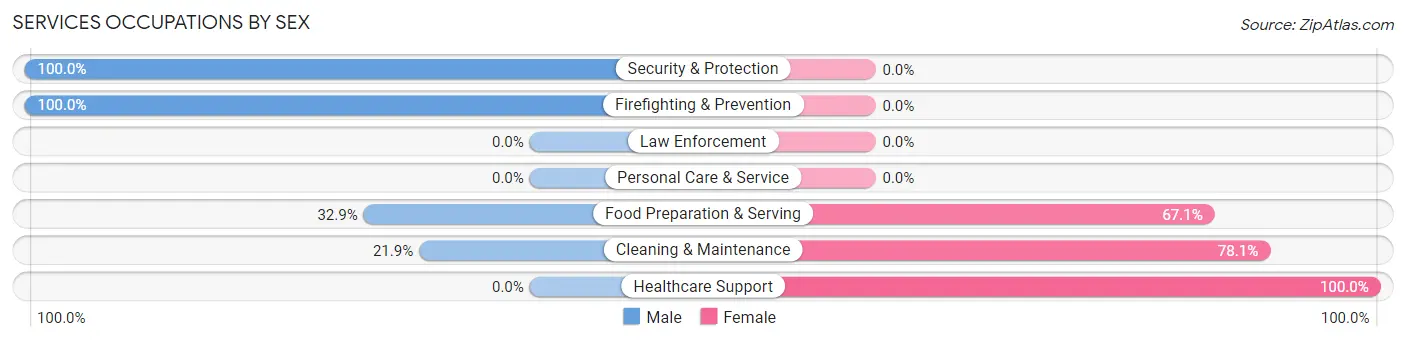
| Occupation | Male | Female |
| Healthcare Support | 0 (0.0%) | 17 (100.0%) |
| Security & Protection | 10 (100.0%) | 0 (0.0%) |
| Firefighting & Prevention | 10 (100.0%) | 0 (0.0%) |
| Law Enforcement | 0 (0.0%) | 0 (0.0%) |
| Food Preparation & Serving | 25 (32.9%) | 51 (67.1%) |
| Cleaning & Maintenance | 23 (21.9%) | 82 (78.1%) |
| Personal Care & Service | 0 (0.0%) | 0 (0.0%) |
| Total (Category) | 58 (27.9%) | 150 (72.1%) |
| Total (Overall) | 349 (48.9%) | 365 (51.1%) |
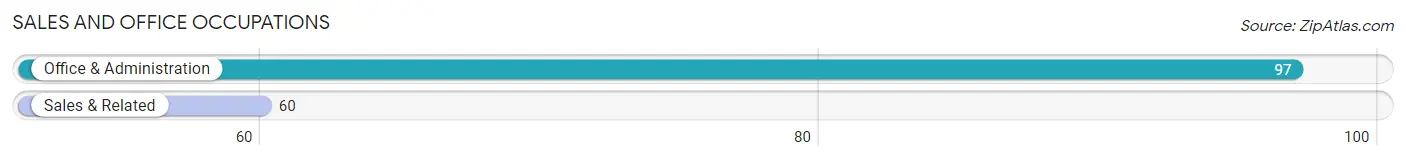
Sales and Office Occupations
The most common Sales and Office occupations in Mexico are Office & Administration (97 | 13.6%), and Sales & Related (60 | 8.4%).
Sales and Office Occupations by Sex

| Occupation | Male | Female |
| Sales & Related | 39 (65.0%) | 21 (35.0%) |
| Office & Administration | 0 (0.0%) | 97 (100.0%) |
| Total (Category) | 39 (24.8%) | 118 (75.2%) |
| Total (Overall) | 349 (48.9%) | 365 (51.1%) |
Natural Resources, Construction and Maintenance Occupations
The most common Natural Resources, Construction and Maintenance occupations in Mexico are Construction & Extraction (85 | 11.9%), and Installation, Maintenance & Repair (52 | 7.3%).
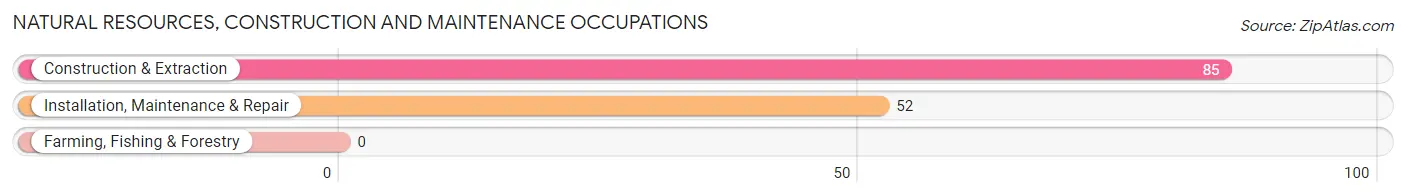
Natural Resources, Construction and Maintenance Occupations by Sex
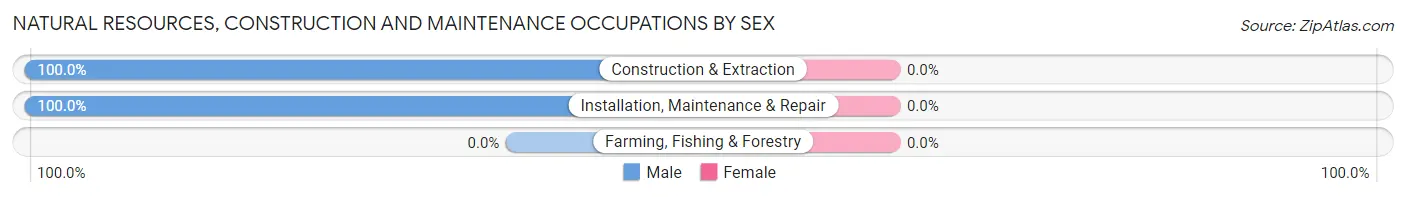
| Occupation | Male | Female |
| Farming, Fishing & Forestry | 0 (0.0%) | 0 (0.0%) |
| Construction & Extraction | 85 (100.0%) | 0 (0.0%) |
| Installation, Maintenance & Repair | 52 (100.0%) | 0 (0.0%) |
| Total (Category) | 137 (100.0%) | 0 (0.0%) |
| Total (Overall) | 349 (48.9%) | 365 (51.1%) |
Production, Transportation and Moving Occupations
The most common Production, Transportation and Moving occupations in Mexico are Transportation (27 | 3.8%), Production (25 | 3.5%), and Material Moving (10 | 1.4%).
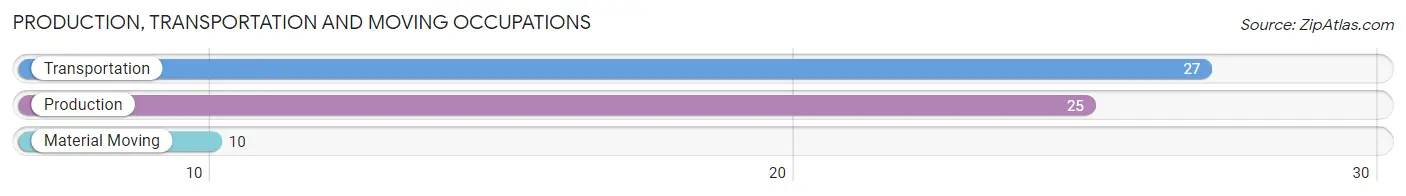
Production, Transportation and Moving Occupations by Sex
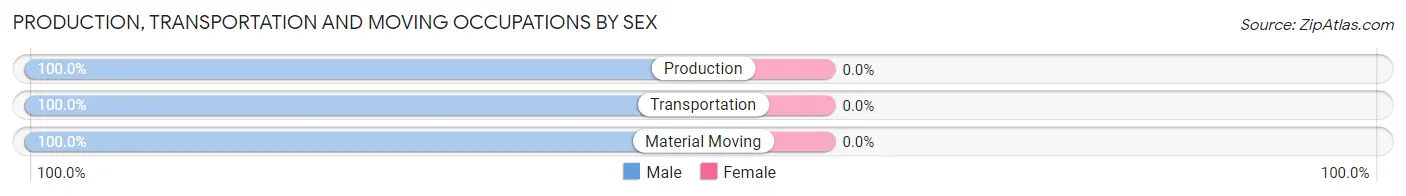
| Occupation | Male | Female |
| Production | 25 (100.0%) | 0 (0.0%) |
| Transportation | 27 (100.0%) | 0 (0.0%) |
| Material Moving | 10 (100.0%) | 0 (0.0%) |
| Total (Category) | 62 (100.0%) | 0 (0.0%) |
| Total (Overall) | 349 (48.9%) | 365 (51.1%) |
Employment Industries by Sex in Mexico
Employment Industries in Mexico
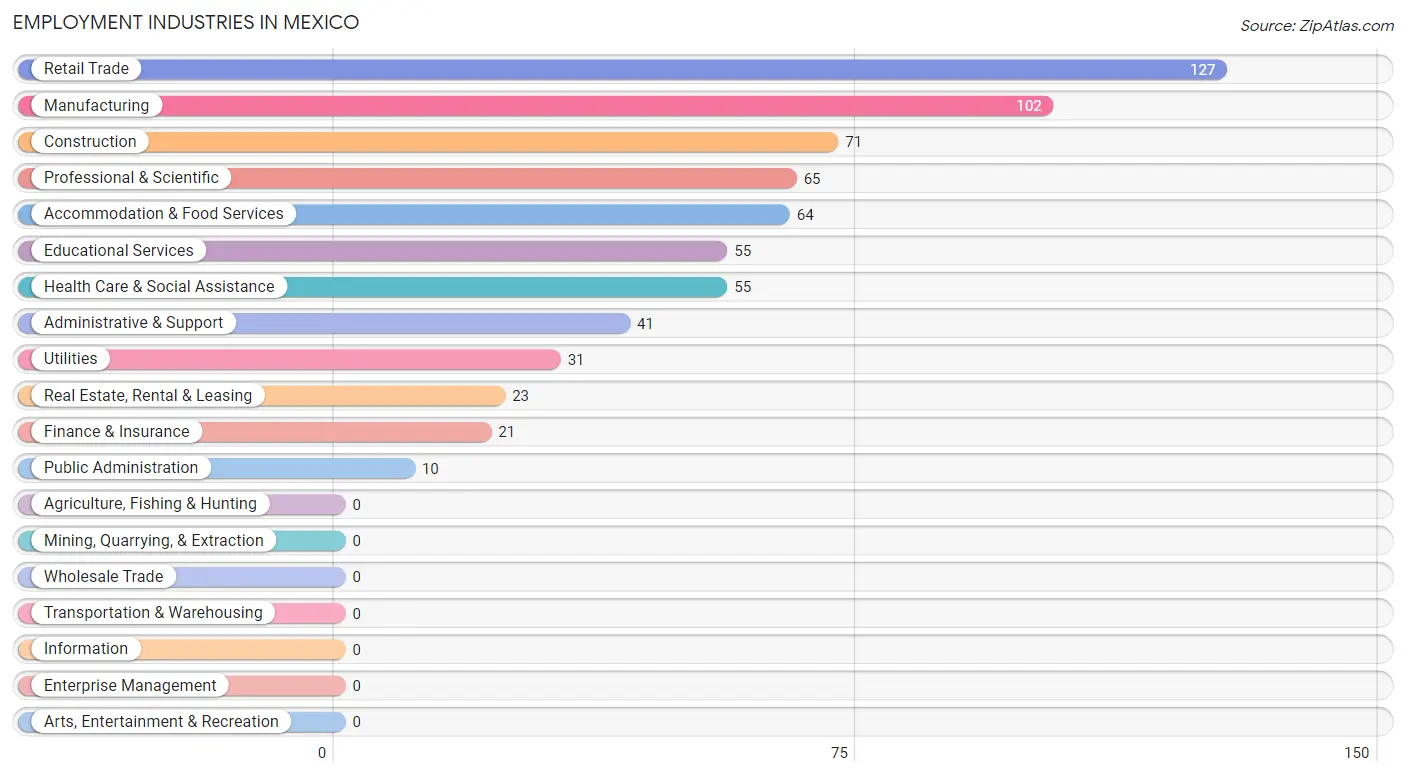
The major employment industries in Mexico include Retail Trade (127 | 17.8%), Manufacturing (102 | 14.3%), Construction (71 | 9.9%), Professional & Scientific (65 | 9.1%), and Accommodation & Food Services (64 | 9.0%).
Employment Industries by Sex in Mexico
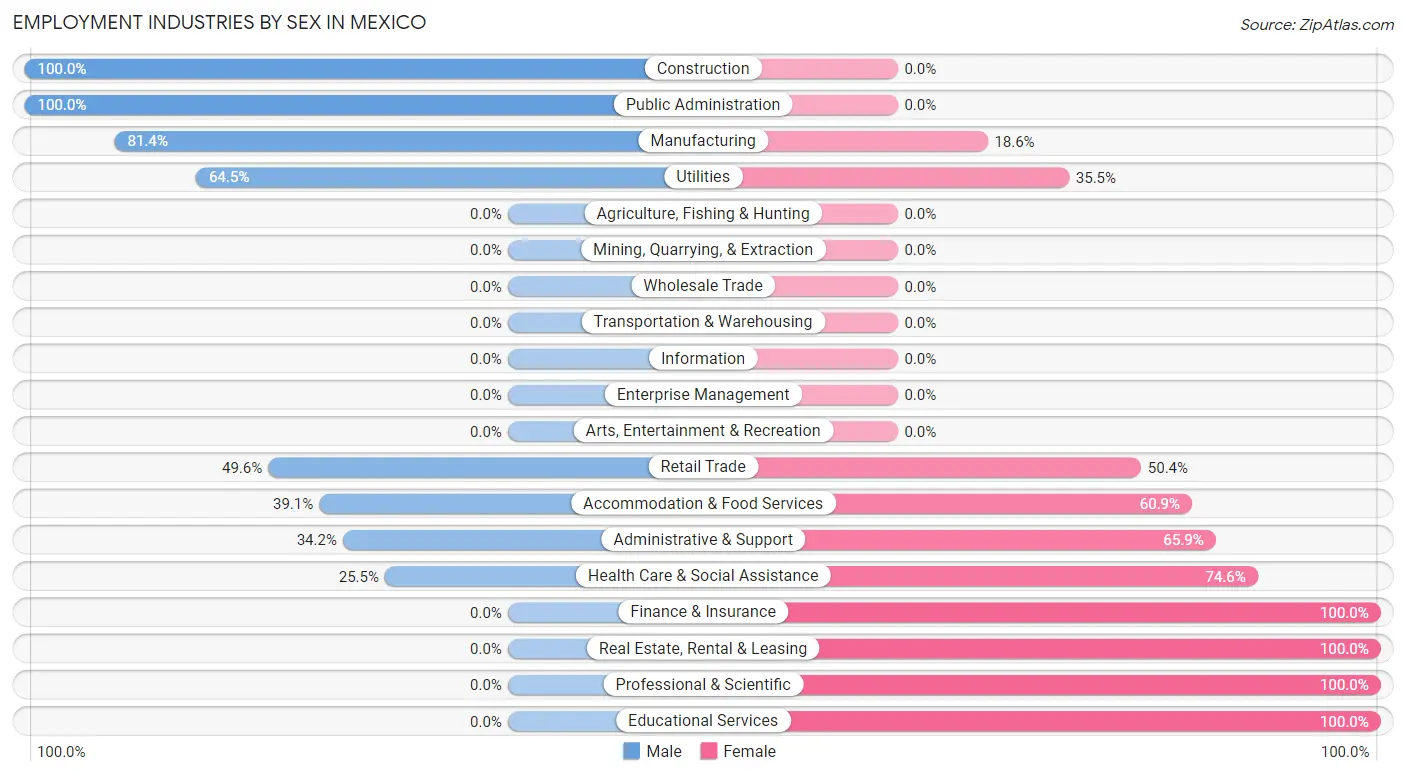
The Mexico industries that see more men than women are Construction (100.0%), Public Administration (100.0%), and Manufacturing (81.4%), whereas the industries that tend to have a higher number of women are Finance & Insurance (100.0%), Real Estate, Rental & Leasing (100.0%), and Professional & Scientific (100.0%).
| Industry | Male | Female |
| Agriculture, Fishing & Hunting | 0 (0.0%) | 0 (0.0%) |
| Mining, Quarrying, & Extraction | 0 (0.0%) | 0 (0.0%) |
| Construction | 71 (100.0%) | 0 (0.0%) |
| Manufacturing | 83 (81.4%) | 19 (18.6%) |
| Wholesale Trade | 0 (0.0%) | 0 (0.0%) |
| Retail Trade | 63 (49.6%) | 64 (50.4%) |
| Transportation & Warehousing | 0 (0.0%) | 0 (0.0%) |
| Utilities | 20 (64.5%) | 11 (35.5%) |
| Information | 0 (0.0%) | 0 (0.0%) |
| Finance & Insurance | 0 (0.0%) | 21 (100.0%) |
| Real Estate, Rental & Leasing | 0 (0.0%) | 23 (100.0%) |
| Professional & Scientific | 0 (0.0%) | 65 (100.0%) |
| Enterprise Management | 0 (0.0%) | 0 (0.0%) |
| Administrative & Support | 14 (34.2%) | 27 (65.8%) |
| Educational Services | 0 (0.0%) | 55 (100.0%) |
| Health Care & Social Assistance | 14 (25.5%) | 41 (74.6%) |
| Arts, Entertainment & Recreation | 0 (0.0%) | 0 (0.0%) |
| Accommodation & Food Services | 25 (39.1%) | 39 (60.9%) |
| Public Administration | 10 (100.0%) | 0 (0.0%) |
| Total | 349 (48.9%) | 365 (51.1%) |
Education in Mexico
School Enrollment in Mexico
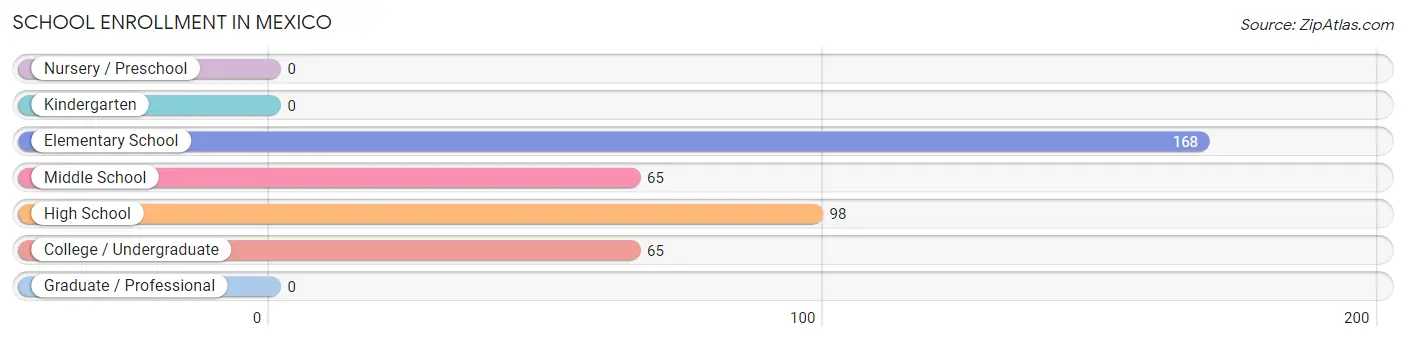
The most common levels of schooling among the 396 students in Mexico are elementary school (168 | 42.4%), high school (98 | 24.7%), and middle school (65 | 16.4%).
| School Level | # Students | % Students |
| Nursery / Preschool | 0 | 0.0% |
| Kindergarten | 0 | 0.0% |
| Elementary School | 168 | 42.4% |
| Middle School | 65 | 16.4% |
| High School | 98 | 24.7% |
| College / Undergraduate | 65 | 16.4% |
| Graduate / Professional | 0 | 0.0% |
| Total | 396 | 100.0% |
School Enrollment by Age by Funding Source in Mexico
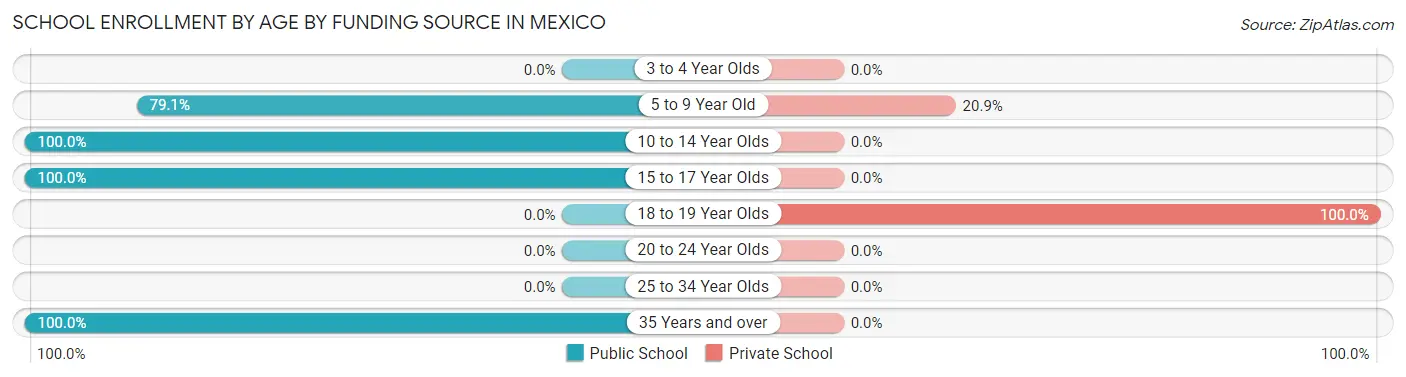
Out of a total of 396 students who are enrolled in schools in Mexico, 44 (11.1%) attend a private institution, while the remaining 352 (88.9%) are enrolled in public schools. The age group of 18 to 19 year olds has the highest likelihood of being enrolled in private schools, with 15 (100.0% in the age bracket) enrolled. Conversely, the age group of 10 to 14 year olds has the lowest likelihood of being enrolled in a private school, with 94 (100.0% in the age bracket) attending a public institution.
| Age Bracket | Public School | Private School |
| 3 to 4 Year Olds | 0 (0.0%) | 0 (0.0%) |
| 5 to 9 Year Old | 110 (79.1%) | 29 (20.9%) |
| 10 to 14 Year Olds | 94 (100.0%) | 0 (0.0%) |
| 15 to 17 Year Olds | 98 (100.0%) | 0 (0.0%) |
| 18 to 19 Year Olds | 0 (0.0%) | 15 (100.0%) |
| 20 to 24 Year Olds | 0 (0.0%) | 0 (0.0%) |
| 25 to 34 Year Olds | 0 (0.0%) | 0 (0.0%) |
| 35 Years and over | 50 (100.0%) | 0 (0.0%) |
| Total | 352 (88.9%) | 44 (11.1%) |
Educational Attainment by Field of Study in Mexico
Education (50 | 21.5%), psychology (47 | 20.2%), communications (42 | 18.0%), science & technology (32 | 13.7%), and social sciences (14 | 6.0%) are the most common fields of study among 233 individuals in Mexico who have obtained a bachelor's degree or higher.
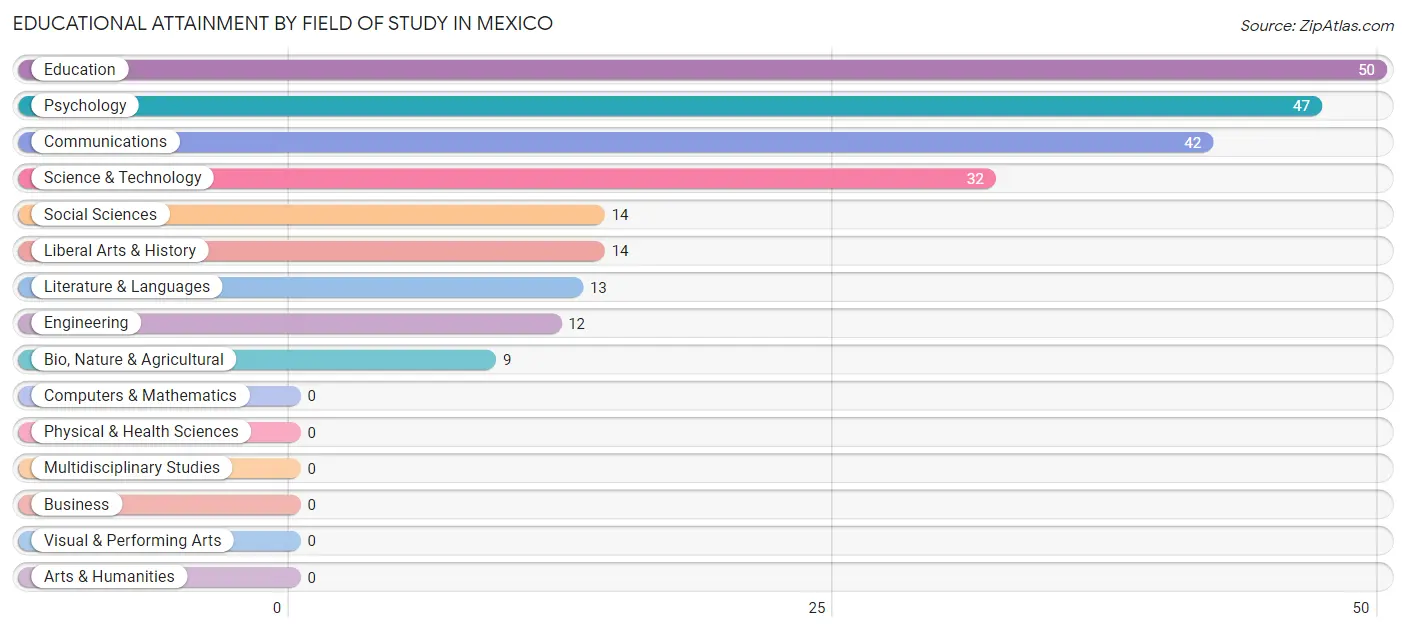
| Field of Study | # Graduates | % Graduates |
| Computers & Mathematics | 0 | 0.0% |
| Bio, Nature & Agricultural | 9 | 3.9% |
| Physical & Health Sciences | 0 | 0.0% |
| Psychology | 47 | 20.2% |
| Social Sciences | 14 | 6.0% |
| Engineering | 12 | 5.1% |
| Multidisciplinary Studies | 0 | 0.0% |
| Science & Technology | 32 | 13.7% |
| Business | 0 | 0.0% |
| Education | 50 | 21.5% |
| Literature & Languages | 13 | 5.6% |
| Liberal Arts & History | 14 | 6.0% |
| Visual & Performing Arts | 0 | 0.0% |
| Communications | 42 | 18.0% |
| Arts & Humanities | 0 | 0.0% |
| Total | 233 | 100.0% |
Transportation & Commute in Mexico
Vehicle Availability by Sex in Mexico
The most prevalent vehicle ownership categories in Mexico are males with 2 vehicles (119, accounting for 35.0%) and females with 2 vehicles (159, making up 33.4%).
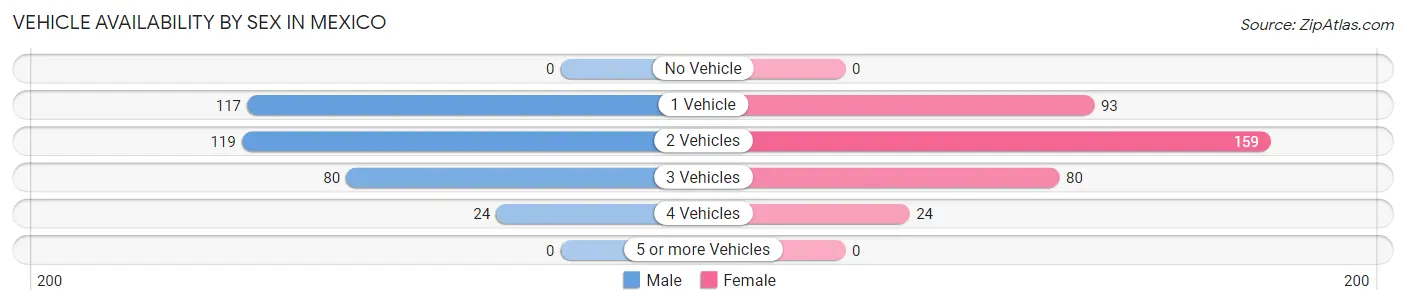
| Vehicles Available | Male | Female |
| No Vehicle | 0 (0.0%) | 0 (0.0%) |
| 1 Vehicle | 117 (34.4%) | 93 (26.1%) |
| 2 Vehicles | 119 (35.0%) | 159 (44.7%) |
| 3 Vehicles | 80 (23.5%) | 80 (22.5%) |
| 4 Vehicles | 24 (7.1%) | 24 (6.7%) |
| 5 or more Vehicles | 0 (0.0%) | 0 (0.0%) |
| Total | 340 (100.0%) | 356 (100.0%) |
Commute Time in Mexico
The most frequently occuring commute durations in Mexico are 5 to 9 minutes (249 commuters, 36.7%), 10 to 14 minutes (115 commuters, 17.0%), and less than 5 minutes (86 commuters, 12.7%).
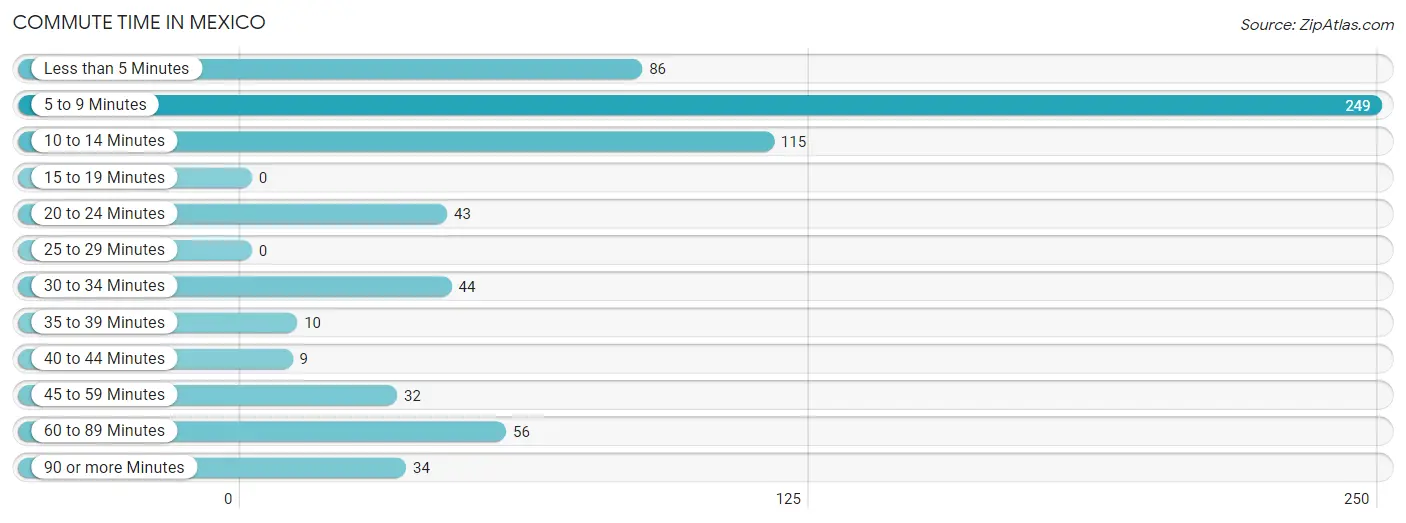
| Commute Time | # Commuters | % Commuters |
| Less than 5 Minutes | 86 | 12.7% |
| 5 to 9 Minutes | 249 | 36.7% |
| 10 to 14 Minutes | 115 | 17.0% |
| 15 to 19 Minutes | 0 | 0.0% |
| 20 to 24 Minutes | 43 | 6.3% |
| 25 to 29 Minutes | 0 | 0.0% |
| 30 to 34 Minutes | 44 | 6.5% |
| 35 to 39 Minutes | 10 | 1.5% |
| 40 to 44 Minutes | 9 | 1.3% |
| 45 to 59 Minutes | 32 | 4.7% |
| 60 to 89 Minutes | 56 | 8.3% |
| 90 or more Minutes | 34 | 5.0% |
Commute Time by Sex in Mexico
The most common commute times in Mexico are 5 to 9 minutes (132 commuters, 41.0%) for males and 5 to 9 minutes (117 commuters, 32.9%) for females.
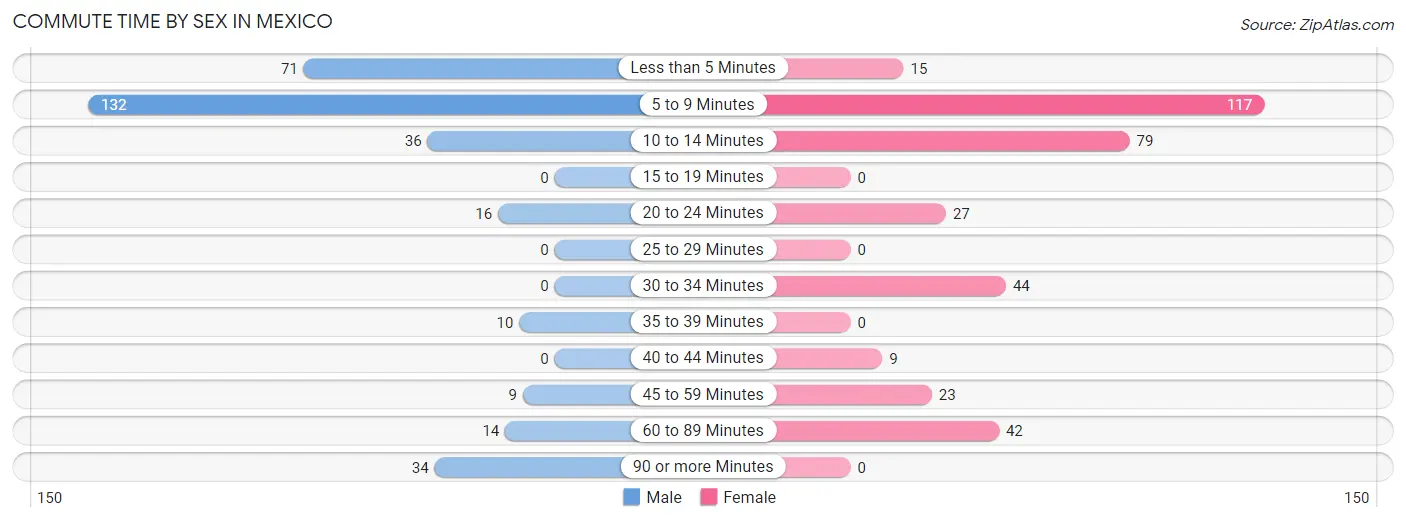
| Commute Time | Male | Female |
| Less than 5 Minutes | 71 (22.1%) | 15 (4.2%) |
| 5 to 9 Minutes | 132 (41.0%) | 117 (32.9%) |
| 10 to 14 Minutes | 36 (11.2%) | 79 (22.2%) |
| 15 to 19 Minutes | 0 (0.0%) | 0 (0.0%) |
| 20 to 24 Minutes | 16 (5.0%) | 27 (7.6%) |
| 25 to 29 Minutes | 0 (0.0%) | 0 (0.0%) |
| 30 to 34 Minutes | 0 (0.0%) | 44 (12.4%) |
| 35 to 39 Minutes | 10 (3.1%) | 0 (0.0%) |
| 40 to 44 Minutes | 0 (0.0%) | 9 (2.5%) |
| 45 to 59 Minutes | 9 (2.8%) | 23 (6.5%) |
| 60 to 89 Minutes | 14 (4.3%) | 42 (11.8%) |
| 90 or more Minutes | 34 (10.6%) | 0 (0.0%) |
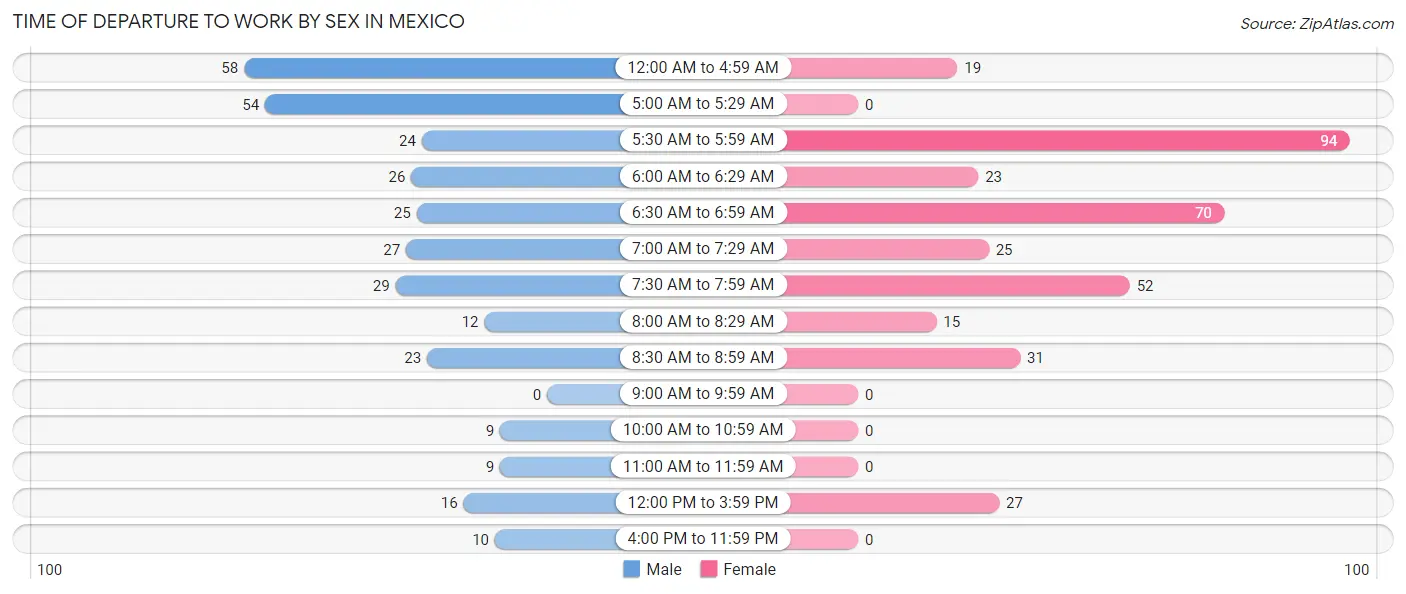
Time of Departure to Work by Sex in Mexico
The most frequent times of departure to work in Mexico are 12:00 AM to 4:59 AM (58, 18.0%) for males and 5:30 AM to 5:59 AM (94, 26.4%) for females.
| Time of Departure | Male | Female |
| 12:00 AM to 4:59 AM | 58 (18.0%) | 19 (5.3%) |
| 5:00 AM to 5:29 AM | 54 (16.8%) | 0 (0.0%) |
| 5:30 AM to 5:59 AM | 24 (7.4%) | 94 (26.4%) |
| 6:00 AM to 6:29 AM | 26 (8.1%) | 23 (6.5%) |
| 6:30 AM to 6:59 AM | 25 (7.8%) | 70 (19.7%) |
| 7:00 AM to 7:29 AM | 27 (8.4%) | 25 (7.0%) |
| 7:30 AM to 7:59 AM | 29 (9.0%) | 52 (14.6%) |
| 8:00 AM to 8:29 AM | 12 (3.7%) | 15 (4.2%) |
| 8:30 AM to 8:59 AM | 23 (7.1%) | 31 (8.7%) |
| 9:00 AM to 9:59 AM | 0 (0.0%) | 0 (0.0%) |
| 10:00 AM to 10:59 AM | 9 (2.8%) | 0 (0.0%) |
| 11:00 AM to 11:59 AM | 9 (2.8%) | 0 (0.0%) |
| 12:00 PM to 3:59 PM | 16 (5.0%) | 27 (7.6%) |
| 4:00 PM to 11:59 PM | 10 (3.1%) | 0 (0.0%) |
| Total | 322 (100.0%) | 356 (100.0%) |
Housing Occupancy in Mexico
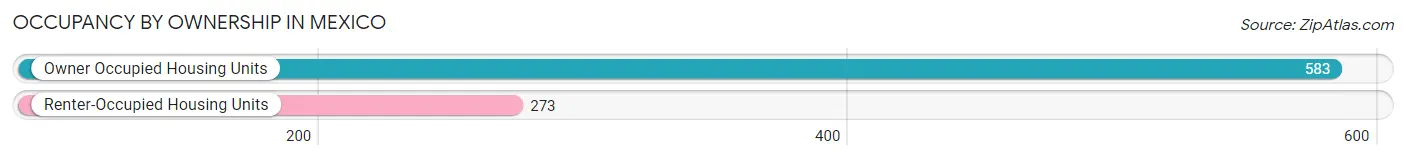
Occupancy by Ownership in Mexico
Of the total 856 dwellings in Mexico, owner-occupied units account for 583 (68.1%), while renter-occupied units make up 273 (31.9%).
| Occupancy | # Housing Units | % Housing Units |
| Owner Occupied Housing Units | 583 | 68.1% |
| Renter-Occupied Housing Units | 273 | 31.9% |
| Total Occupied Housing Units | 856 | 100.0% |
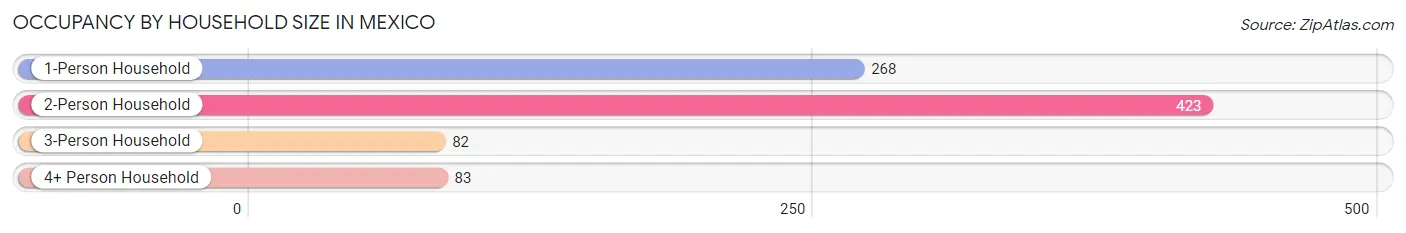
Occupancy by Household Size in Mexico
| Household Size | # Housing Units | % Housing Units |
| 1-Person Household | 268 | 31.3% |
| 2-Person Household | 423 | 49.4% |
| 3-Person Household | 82 | 9.6% |
| 4+ Person Household | 83 | 9.7% |
| Total Housing Units | 856 | 100.0% |
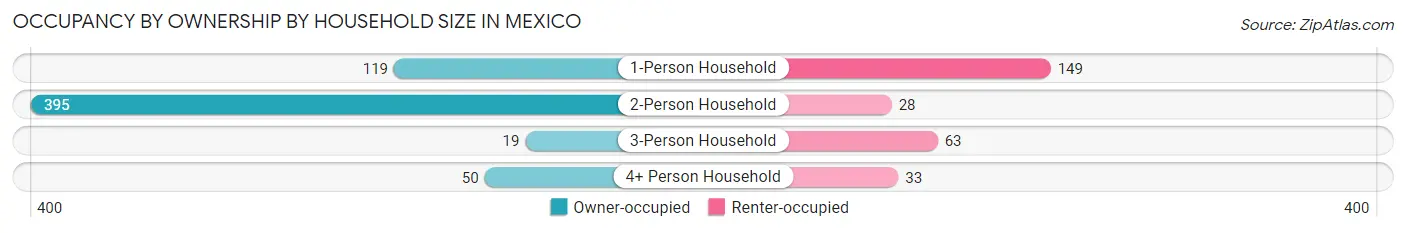
Occupancy by Ownership by Household Size in Mexico
| Household Size | Owner-occupied | Renter-occupied |
| 1-Person Household | 119 (44.4%) | 149 (55.6%) |
| 2-Person Household | 395 (93.4%) | 28 (6.6%) |
| 3-Person Household | 19 (23.2%) | 63 (76.8%) |
| 4+ Person Household | 50 (60.2%) | 33 (39.8%) |
| Total Housing Units | 583 (68.1%) | 273 (31.9%) |
Occupancy by Educational Attainment in Mexico
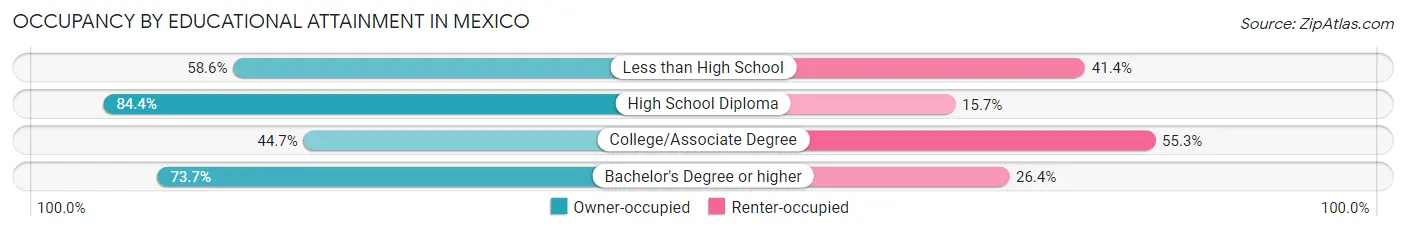
| Household Size | Owner-occupied | Renter-occupied |
| Less than High School | 34 (58.6%) | 24 (41.4%) |
| High School Diploma | 318 (84.4%) | 59 (15.7%) |
| College/Associate Degree | 122 (44.7%) | 151 (55.3%) |
| Bachelor's Degree or higher | 109 (73.7%) | 39 (26.4%) |
Occupancy by Age of Householder in Mexico
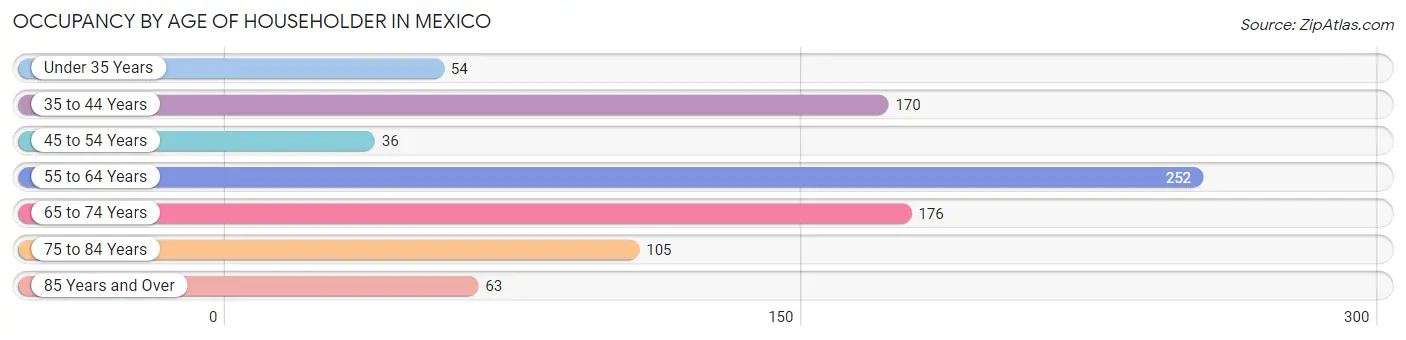
| Age Bracket | # Households | % Households |
| Under 35 Years | 54 | 6.3% |
| 35 to 44 Years | 170 | 19.9% |
| 45 to 54 Years | 36 | 4.2% |
| 55 to 64 Years | 252 | 29.4% |
| 65 to 74 Years | 176 | 20.6% |
| 75 to 84 Years | 105 | 12.3% |
| 85 Years and Over | 63 | 7.4% |
| Total | 856 | 100.0% |
Housing Finances in Mexico
Median Income by Occupancy in Mexico
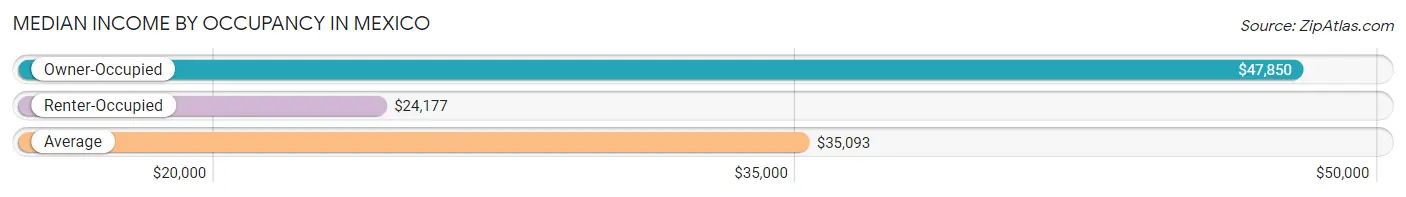
| Occupancy Type | # Households | Median Income |
| Owner-Occupied | 583 (68.1%) | $47,850 |
| Renter-Occupied | 273 (31.9%) | $24,177 |
| Average | 856 (100.0%) | $35,093 |
Occupancy by Householder Income Bracket in Mexico
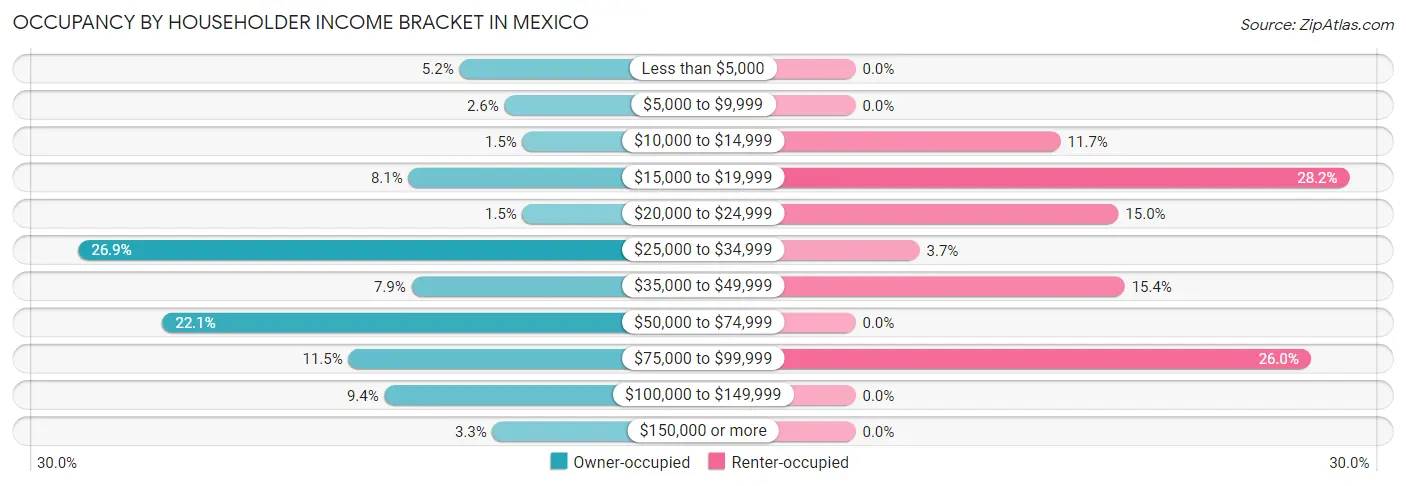
| Income Bracket | Owner-occupied | Renter-occupied |
| Less than $5,000 | 30 (5.1%) | 0 (0.0%) |
| $5,000 to $9,999 | 15 (2.6%) | 0 (0.0%) |
| $10,000 to $14,999 | 9 (1.5%) | 32 (11.7%) |
| $15,000 to $19,999 | 47 (8.1%) | 77 (28.2%) |
| $20,000 to $24,999 | 9 (1.5%) | 41 (15.0%) |
| $25,000 to $34,999 | 157 (26.9%) | 10 (3.7%) |
| $35,000 to $49,999 | 46 (7.9%) | 42 (15.4%) |
| $50,000 to $74,999 | 129 (22.1%) | 0 (0.0%) |
| $75,000 to $99,999 | 67 (11.5%) | 71 (26.0%) |
| $100,000 to $149,999 | 55 (9.4%) | 0 (0.0%) |
| $150,000 or more | 19 (3.3%) | 0 (0.0%) |
| Total | 583 (100.0%) | 273 (100.0%) |
Monthly Housing Cost Tiers in Mexico
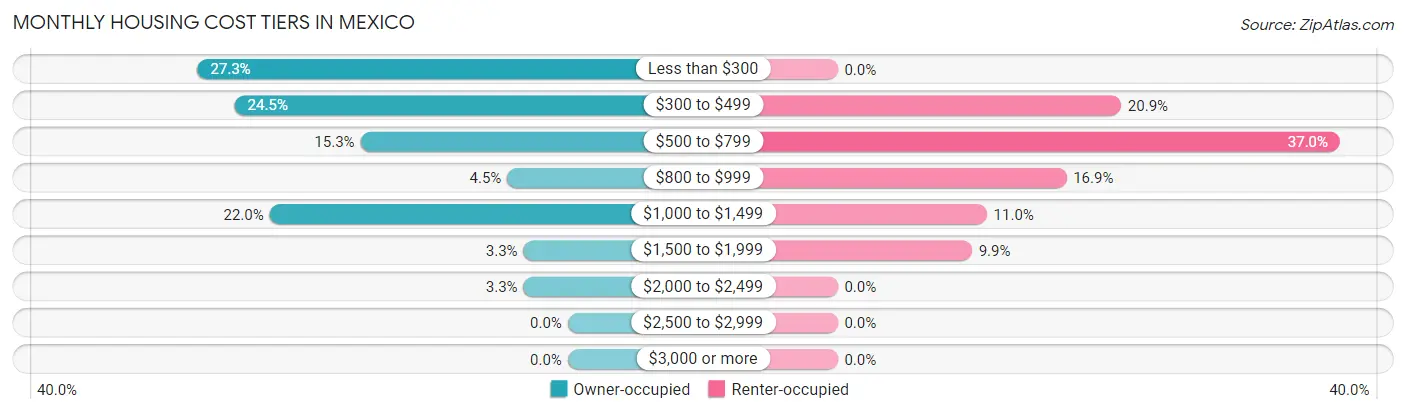
| Monthly Cost | Owner-occupied | Renter-occupied |
| Less than $300 | 159 (27.3%) | 0 (0.0%) |
| $300 to $499 | 143 (24.5%) | 57 (20.9%) |
| $500 to $799 | 89 (15.3%) | 101 (37.0%) |
| $800 to $999 | 26 (4.5%) | 46 (16.9%) |
| $1,000 to $1,499 | 128 (22.0%) | 30 (11.0%) |
| $1,500 to $1,999 | 19 (3.3%) | 27 (9.9%) |
| $2,000 to $2,499 | 19 (3.3%) | 0 (0.0%) |
| $2,500 to $2,999 | 0 (0.0%) | 0 (0.0%) |
| $3,000 or more | 0 (0.0%) | 0 (0.0%) |
| Total | 583 (100.0%) | 273 (100.0%) |
Physical Housing Characteristics in Mexico
Housing Structures in Mexico
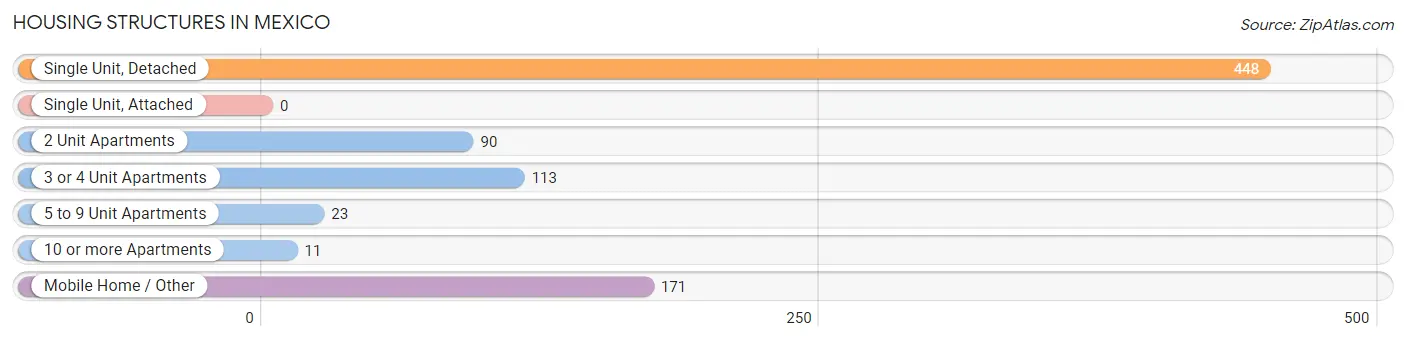
| Structure Type | # Housing Units | % Housing Units |
| Single Unit, Detached | 448 | 52.3% |
| Single Unit, Attached | 0 | 0.0% |
| 2 Unit Apartments | 90 | 10.5% |
| 3 or 4 Unit Apartments | 113 | 13.2% |
| 5 to 9 Unit Apartments | 23 | 2.7% |
| 10 or more Apartments | 11 | 1.3% |
| Mobile Home / Other | 171 | 20.0% |
| Total | 856 | 100.0% |
Housing Structures by Occupancy in Mexico
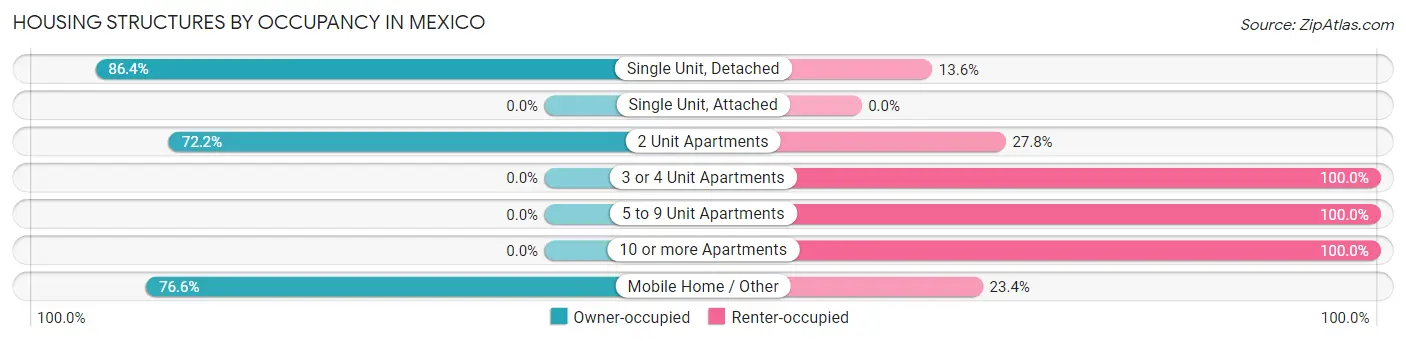
| Structure Type | Owner-occupied | Renter-occupied |
| Single Unit, Detached | 387 (86.4%) | 61 (13.6%) |
| Single Unit, Attached | 0 (0.0%) | 0 (0.0%) |
| 2 Unit Apartments | 65 (72.2%) | 25 (27.8%) |
| 3 or 4 Unit Apartments | 0 (0.0%) | 113 (100.0%) |
| 5 to 9 Unit Apartments | 0 (0.0%) | 23 (100.0%) |
| 10 or more Apartments | 0 (0.0%) | 11 (100.0%) |
| Mobile Home / Other | 131 (76.6%) | 40 (23.4%) |
| Total | 583 (68.1%) | 273 (31.9%) |
Housing Structures by Number of Rooms in Mexico
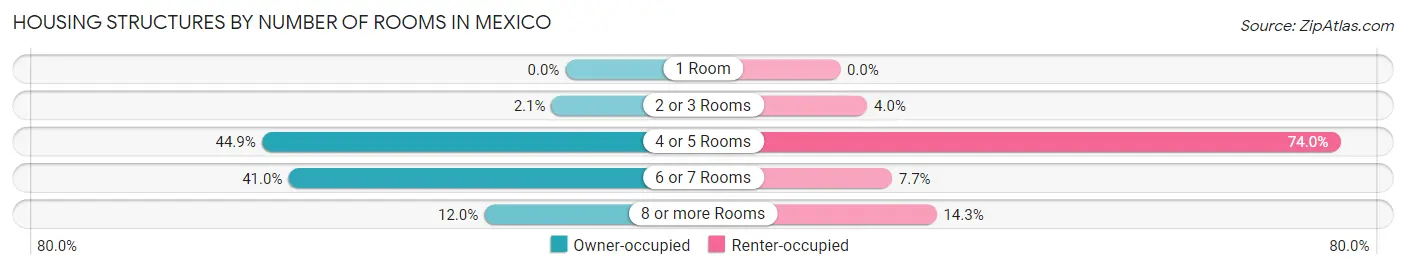
| Number of Rooms | Owner-occupied | Renter-occupied |
| 1 Room | 0 (0.0%) | 0 (0.0%) |
| 2 or 3 Rooms | 12 (2.1%) | 11 (4.0%) |
| 4 or 5 Rooms | 262 (44.9%) | 202 (74.0%) |
| 6 or 7 Rooms | 239 (41.0%) | 21 (7.7%) |
| 8 or more Rooms | 70 (12.0%) | 39 (14.3%) |
| Total | 583 (100.0%) | 273 (100.0%) |
Housing Structure by Heating Type in Mexico
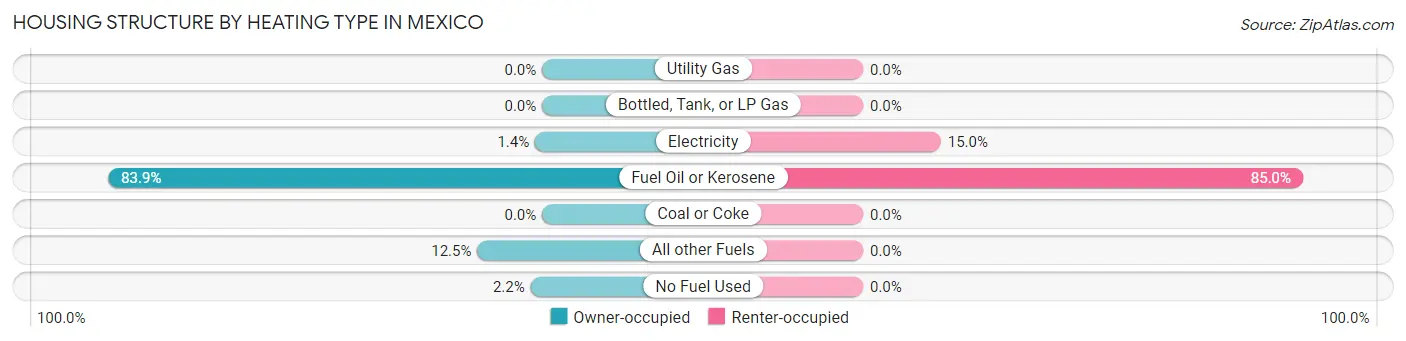
| Heating Type | Owner-occupied | Renter-occupied |
| Utility Gas | 0 (0.0%) | 0 (0.0%) |
| Bottled, Tank, or LP Gas | 0 (0.0%) | 0 (0.0%) |
| Electricity | 8 (1.4%) | 41 (15.0%) |
| Fuel Oil or Kerosene | 489 (83.9%) | 232 (85.0%) |
| Coal or Coke | 0 (0.0%) | 0 (0.0%) |
| All other Fuels | 73 (12.5%) | 0 (0.0%) |
| No Fuel Used | 13 (2.2%) | 0 (0.0%) |
| Total | 583 (100.0%) | 273 (100.0%) |
Household Vehicle Usage in Mexico
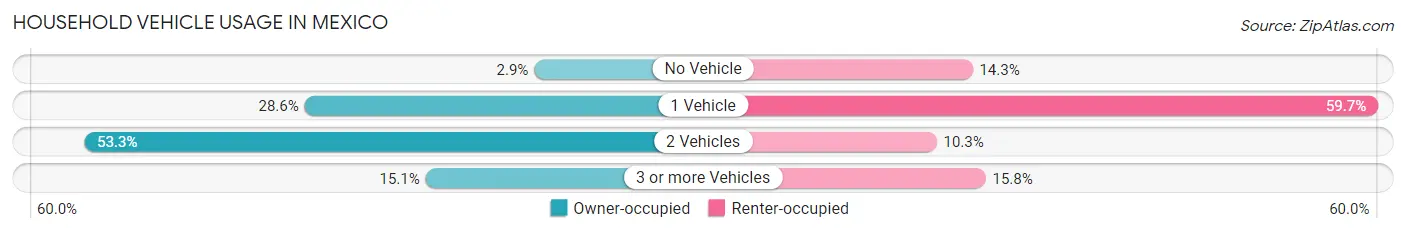
| Vehicles per Household | Owner-occupied | Renter-occupied |
| No Vehicle | 17 (2.9%) | 39 (14.3%) |
| 1 Vehicle | 167 (28.6%) | 163 (59.7%) |
| 2 Vehicles | 311 (53.3%) | 28 (10.3%) |
| 3 or more Vehicles | 88 (15.1%) | 43 (15.8%) |
| Total | 583 (100.0%) | 273 (100.0%) |
Real Estate & Mortgages in Mexico
Real Estate and Mortgage Overview in Mexico
| Characteristic | Without Mortgage | With Mortgage |
| Housing Units | 401 | 182 |
| Median Property Value | $86,800 | $110,900 |
| Median Household Income | $31,740 | $19 |
| Monthly Housing Costs | $403 | $0 |
| Real Estate Taxes | $2,004 | $0 |
Property Value by Mortgage Status in Mexico
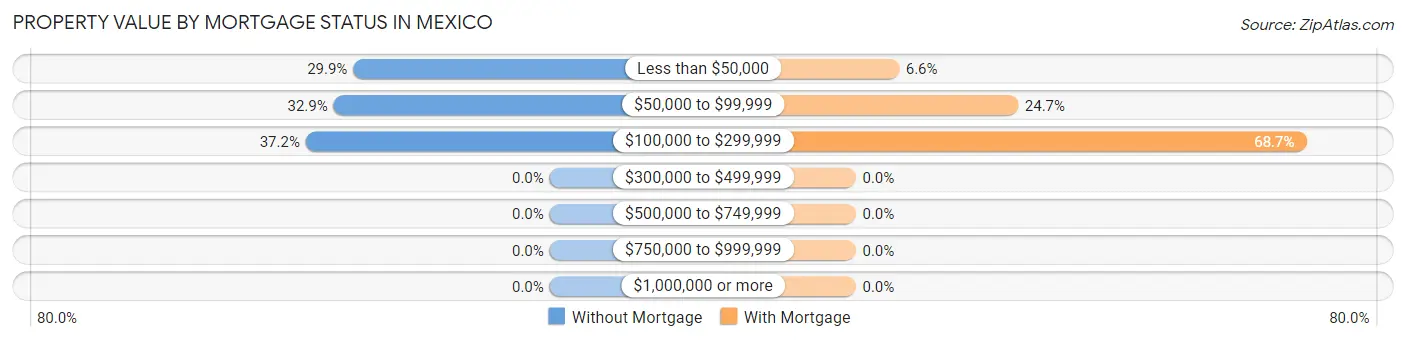
| Property Value | Without Mortgage | With Mortgage |
| Less than $50,000 | 120 (29.9%) | 12 (6.6%) |
| $50,000 to $99,999 | 132 (32.9%) | 45 (24.7%) |
| $100,000 to $299,999 | 149 (37.2%) | 125 (68.7%) |
| $300,000 to $499,999 | 0 (0.0%) | 0 (0.0%) |
| $500,000 to $749,999 | 0 (0.0%) | 0 (0.0%) |
| $750,000 to $999,999 | 0 (0.0%) | 0 (0.0%) |
| $1,000,000 or more | 0 (0.0%) | 0 (0.0%) |
| Total | 401 (100.0%) | 182 (100.0%) |
Household Income by Mortgage Status in Mexico
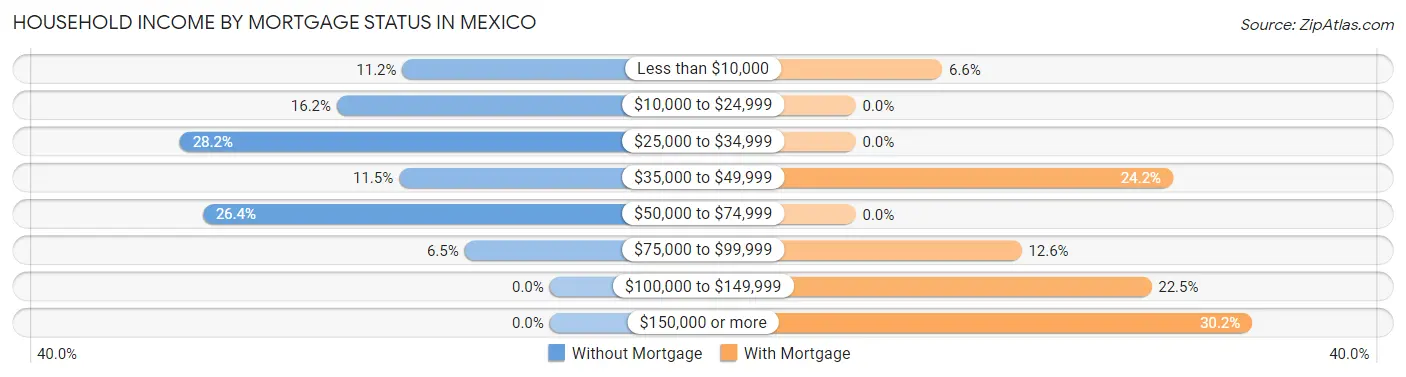
| Household Income | Without Mortgage | With Mortgage |
| Less than $10,000 | 45 (11.2%) | 12 (6.6%) |
| $10,000 to $24,999 | 65 (16.2%) | 0 (0.0%) |
| $25,000 to $34,999 | 113 (28.2%) | 0 (0.0%) |
| $35,000 to $49,999 | 46 (11.5%) | 44 (24.2%) |
| $50,000 to $74,999 | 106 (26.4%) | 0 (0.0%) |
| $75,000 to $99,999 | 26 (6.5%) | 23 (12.6%) |
| $100,000 to $149,999 | 0 (0.0%) | 41 (22.5%) |
| $150,000 or more | 0 (0.0%) | 55 (30.2%) |
| Total | 401 (100.0%) | 182 (100.0%) |
Property Value to Household Income Ratio in Mexico
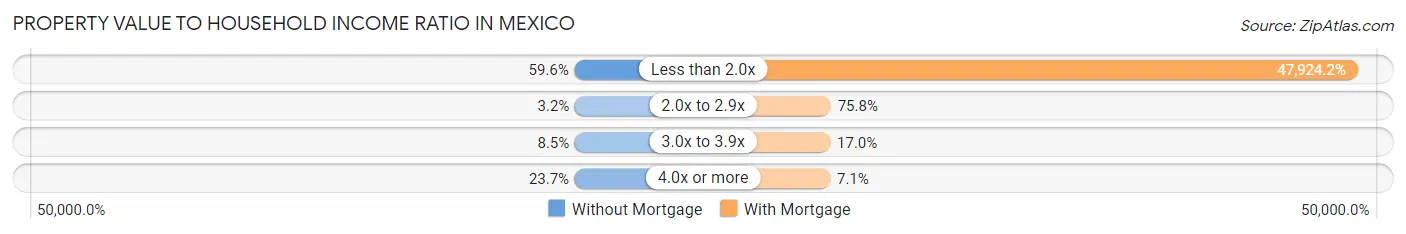
| Value-to-Income Ratio | Without Mortgage | With Mortgage |
| Less than 2.0x | 239 (59.6%) | 87,222 (47,924.2%) |
| 2.0x to 2.9x | 13 (3.2%) | 138 (75.8%) |
| 3.0x to 3.9x | 34 (8.5%) | 31 (17.0%) |
| 4.0x or more | 95 (23.7%) | 13 (7.1%) |
| Total | 401 (100.0%) | 182 (100.0%) |
Real Estate Taxes by Mortgage Status in Mexico
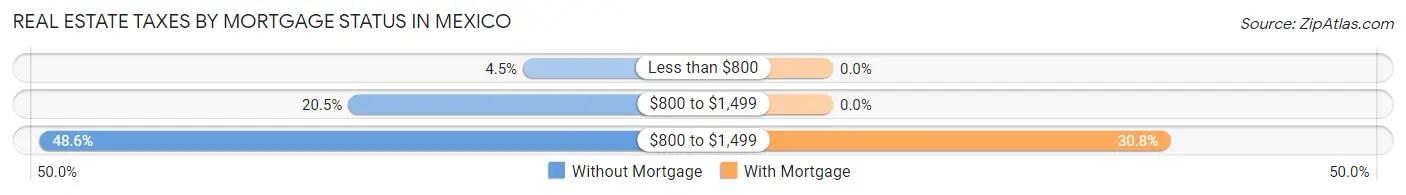
| Property Taxes | Without Mortgage | With Mortgage |
| Less than $800 | 18 (4.5%) | 0 (0.0%) |
| $800 to $1,499 | 82 (20.4%) | 0 (0.0%) |
| $800 to $1,499 | 195 (48.6%) | 56 (30.8%) |
| Total | 401 (100.0%) | 182 (100.0%) |
Health & Disability in Mexico
Health Insurance Coverage by Age in Mexico
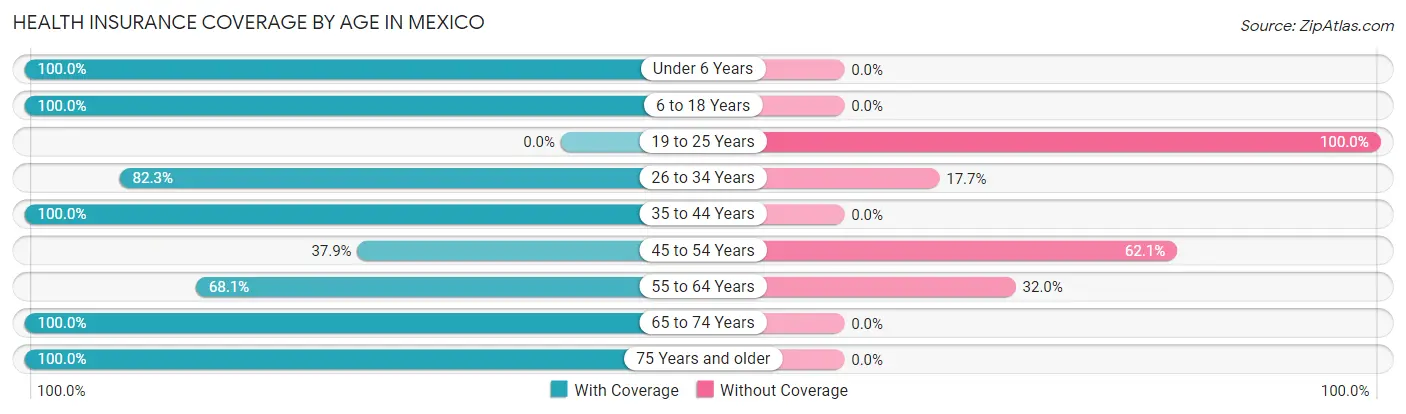
| Age Bracket | With Coverage | Without Coverage |
| Under 6 Years | 24 (100.0%) | 0 (0.0%) |
| 6 to 18 Years | 331 (100.0%) | 0 (0.0%) |
| 19 to 25 Years | 0 (0.0%) | 15 (100.0%) |
| 26 to 34 Years | 65 (82.3%) | 14 (17.7%) |
| 35 to 44 Years | 333 (100.0%) | 0 (0.0%) |
| 45 to 54 Years | 33 (37.9%) | 54 (62.1%) |
| 55 to 64 Years | 296 (68.0%) | 139 (32.0%) |
| 65 to 74 Years | 330 (100.0%) | 0 (0.0%) |
| 75 Years and older | 199 (100.0%) | 0 (0.0%) |
| Total | 1,611 (87.9%) | 222 (12.1%) |
Health Insurance Coverage by Citizenship Status in Mexico
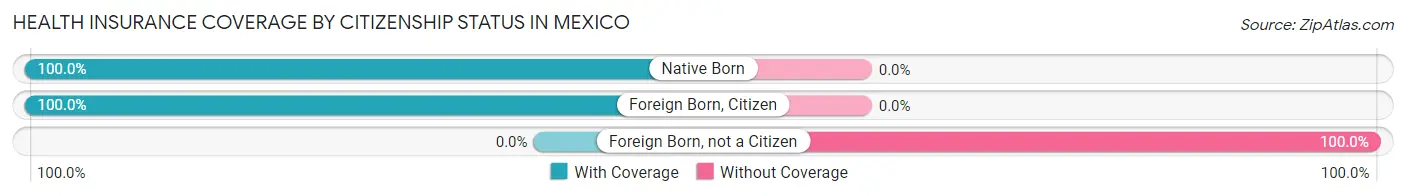
| Citizenship Status | With Coverage | Without Coverage |
| Native Born | 24 (100.0%) | 0 (0.0%) |
| Foreign Born, Citizen | 331 (100.0%) | 0 (0.0%) |
| Foreign Born, not a Citizen | 0 (0.0%) | 15 (100.0%) |
Health Insurance Coverage by Household Income in Mexico
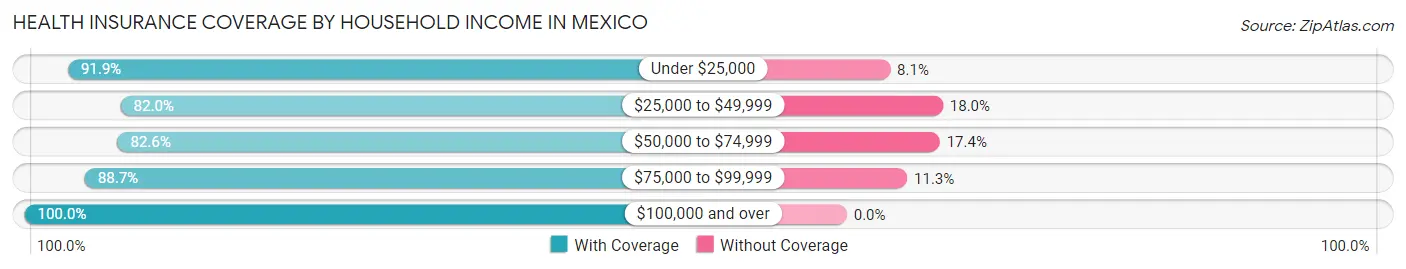
| Household Income | With Coverage | Without Coverage |
| Under $25,000 | 328 (91.9%) | 29 (8.1%) |
| $25,000 to $49,999 | 401 (82.0%) | 88 (18.0%) |
| $50,000 to $74,999 | 242 (82.6%) | 51 (17.4%) |
| $75,000 to $99,999 | 424 (88.7%) | 54 (11.3%) |
| $100,000 and over | 207 (100.0%) | 0 (0.0%) |
Public vs Private Health Insurance Coverage by Age in Mexico
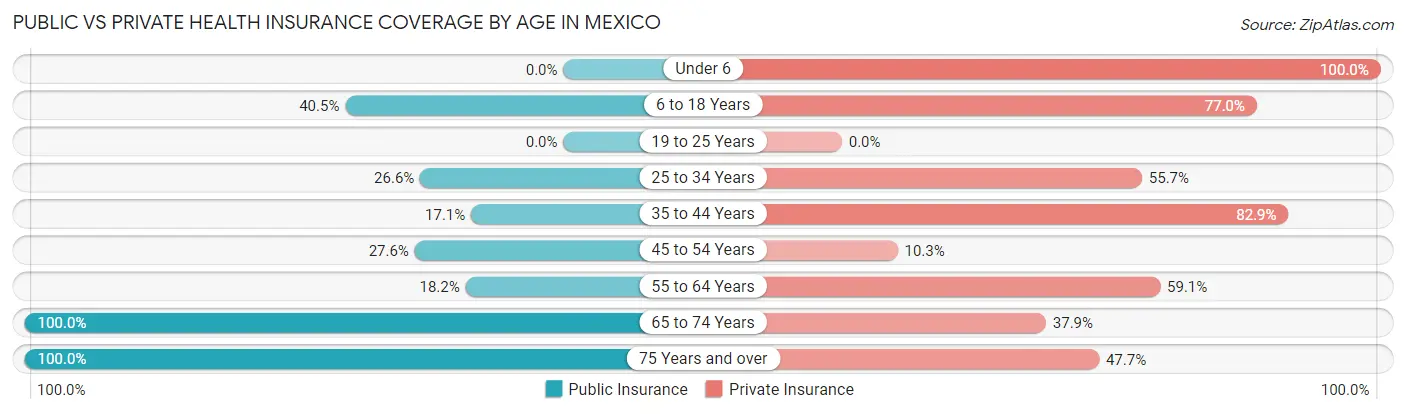
| Age Bracket | Public Insurance | Private Insurance |
| Under 6 | 0 (0.0%) | 24 (100.0%) |
| 6 to 18 Years | 134 (40.5%) | 255 (77.0%) |
| 19 to 25 Years | 0 (0.0%) | 0 (0.0%) |
| 25 to 34 Years | 21 (26.6%) | 44 (55.7%) |
| 35 to 44 Years | 57 (17.1%) | 276 (82.9%) |
| 45 to 54 Years | 24 (27.6%) | 9 (10.3%) |
| 55 to 64 Years | 79 (18.2%) | 257 (59.1%) |
| 65 to 74 Years | 330 (100.0%) | 125 (37.9%) |
| 75 Years and over | 199 (100.0%) | 95 (47.7%) |
| Total | 844 (46.0%) | 1,085 (59.2%) |
Disability Status by Sex by Age in Mexico
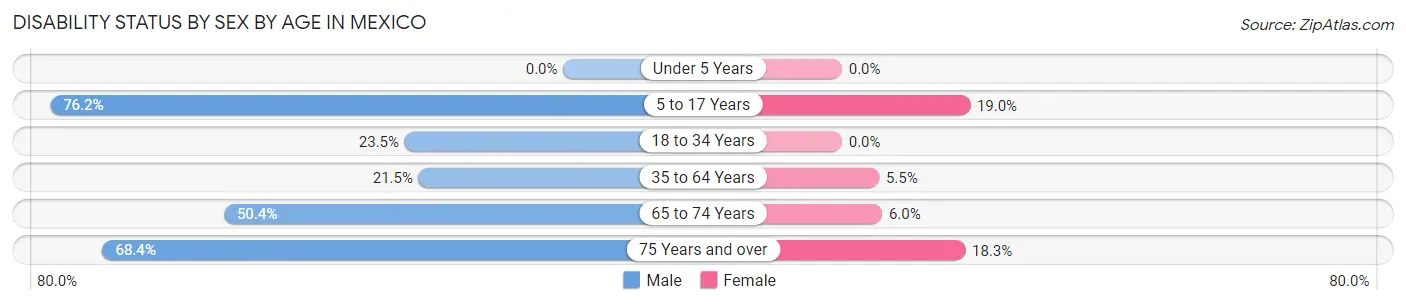
| Age Bracket | Male | Female |
| Under 5 Years | 0 (0.0%) | 0 (0.0%) |
| 5 to 17 Years | 32 (76.2%) | 55 (19.0%) |
| 18 to 34 Years | 12 (23.5%) | 0 (0.0%) |
| 35 to 64 Years | 94 (21.5%) | 23 (5.5%) |
| 65 to 74 Years | 65 (50.4%) | 12 (6.0%) |
| 75 Years and over | 39 (68.4%) | 26 (18.3%) |
Disability Class by Sex by Age in Mexico
Disability Class: Hearing Difficulty
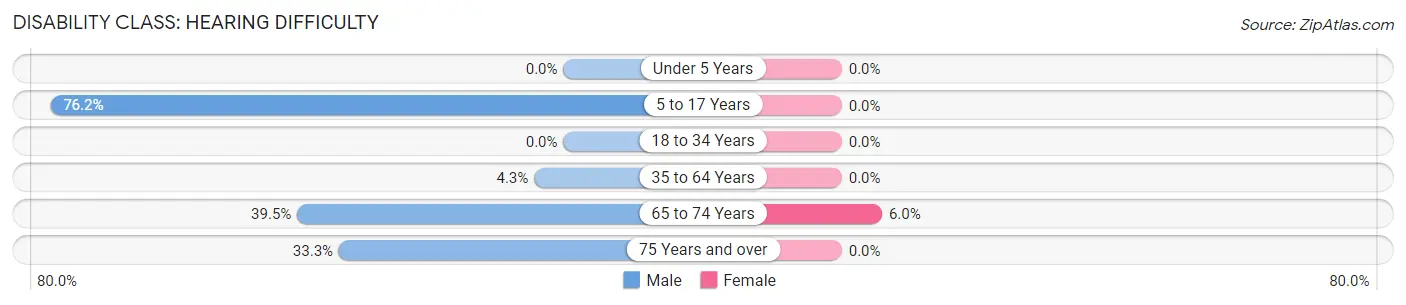
| Age Bracket | Male | Female |
| Under 5 Years | 0 (0.0%) | 0 (0.0%) |
| 5 to 17 Years | 32 (76.2%) | 0 (0.0%) |
| 18 to 34 Years | 0 (0.0%) | 0 (0.0%) |
| 35 to 64 Years | 19 (4.3%) | 0 (0.0%) |
| 65 to 74 Years | 51 (39.5%) | 12 (6.0%) |
| 75 Years and over | 19 (33.3%) | 0 (0.0%) |
Disability Class: Vision Difficulty
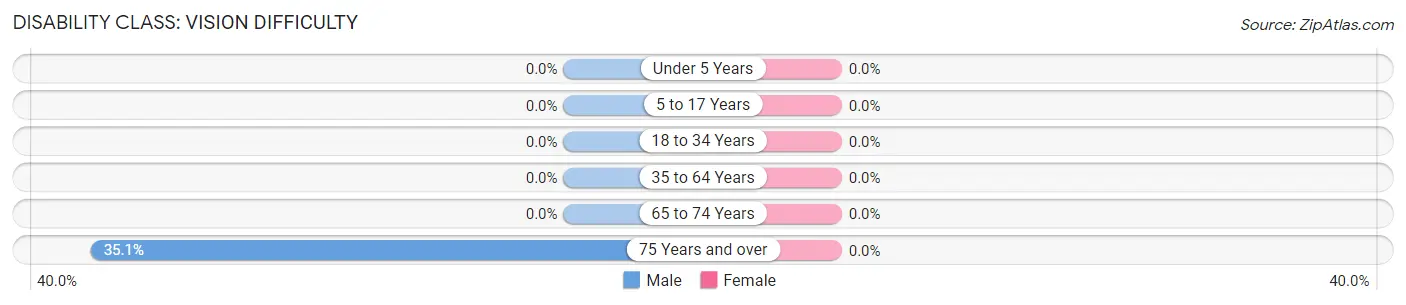
| Age Bracket | Male | Female |
| Under 5 Years | 0 (0.0%) | 0 (0.0%) |
| 5 to 17 Years | 0 (0.0%) | 0 (0.0%) |
| 18 to 34 Years | 0 (0.0%) | 0 (0.0%) |
| 35 to 64 Years | 0 (0.0%) | 0 (0.0%) |
| 65 to 74 Years | 0 (0.0%) | 0 (0.0%) |
| 75 Years and over | 20 (35.1%) | 0 (0.0%) |
Disability Class: Cognitive Difficulty
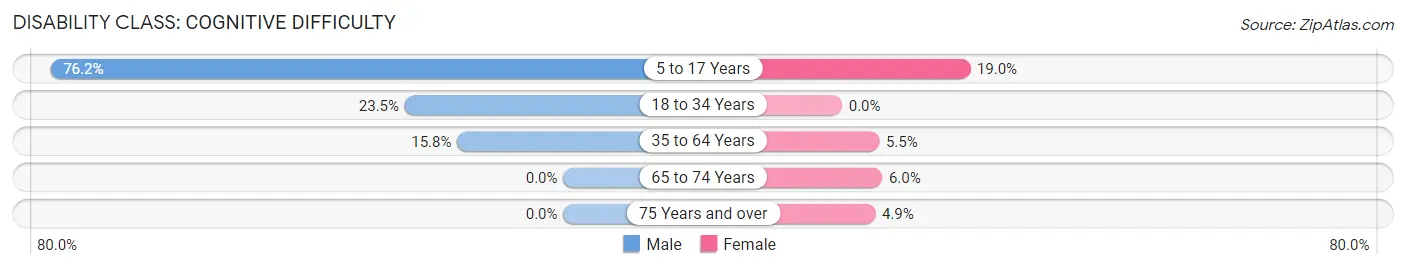
| Age Bracket | Male | Female |
| 5 to 17 Years | 32 (76.2%) | 55 (19.0%) |
| 18 to 34 Years | 12 (23.5%) | 0 (0.0%) |
| 35 to 64 Years | 69 (15.8%) | 23 (5.5%) |
| 65 to 74 Years | 0 (0.0%) | 12 (6.0%) |
| 75 Years and over | 0 (0.0%) | 7 (4.9%) |
Disability Class: Ambulatory Difficulty
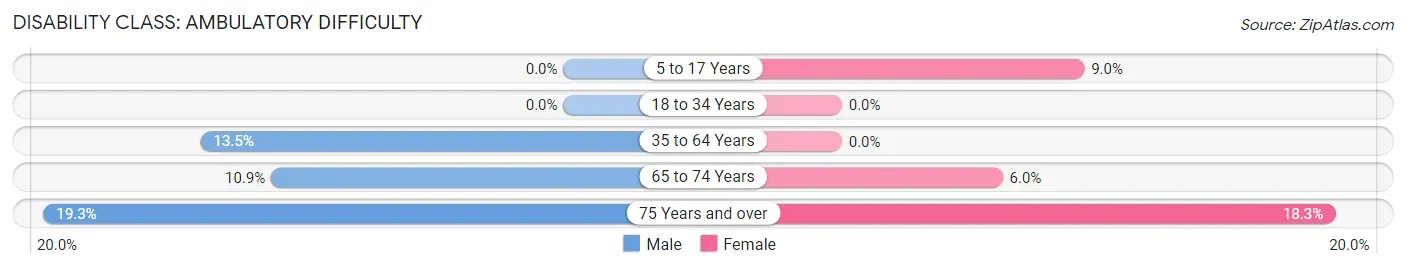
| Age Bracket | Male | Female |
| 5 to 17 Years | 0 (0.0%) | 26 (9.0%) |
| 18 to 34 Years | 0 (0.0%) | 0 (0.0%) |
| 35 to 64 Years | 59 (13.5%) | 0 (0.0%) |
| 65 to 74 Years | 14 (10.8%) | 12 (6.0%) |
| 75 Years and over | 11 (19.3%) | 26 (18.3%) |
Disability Class: Self-Care Difficulty
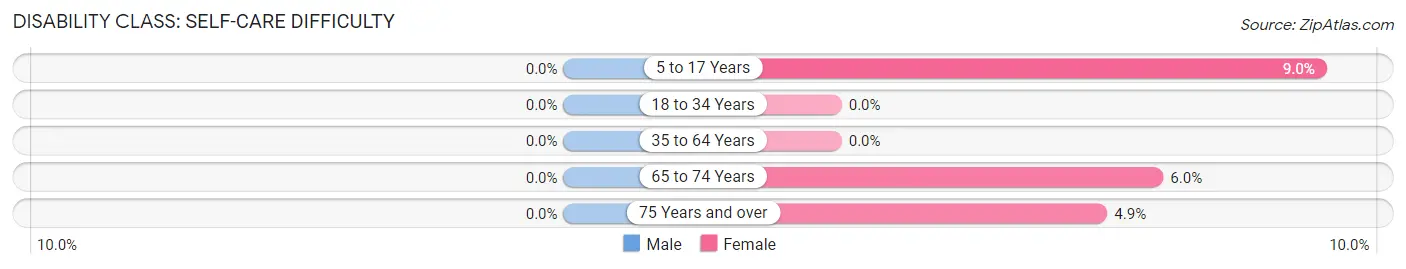
| Age Bracket | Male | Female |
| 5 to 17 Years | 0 (0.0%) | 26 (9.0%) |
| 18 to 34 Years | 0 (0.0%) | 0 (0.0%) |
| 35 to 64 Years | 0 (0.0%) | 0 (0.0%) |
| 65 to 74 Years | 0 (0.0%) | 12 (6.0%) |
| 75 Years and over | 0 (0.0%) | 7 (4.9%) |
Technology Access in Mexico
Computing Device Access in Mexico
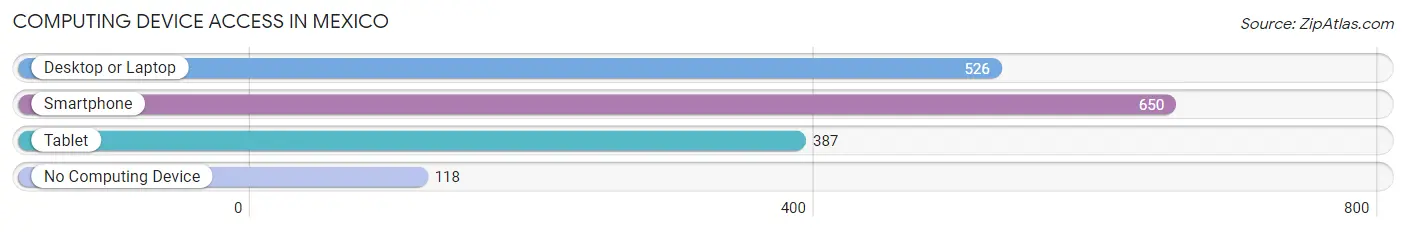
| Device Type | # Households | % Households |
| Desktop or Laptop | 526 | 61.5% |
| Smartphone | 650 | 75.9% |
| Tablet | 387 | 45.2% |
| No Computing Device | 118 | 13.8% |
| Total | 856 | 100.0% |
Internet Access in Mexico
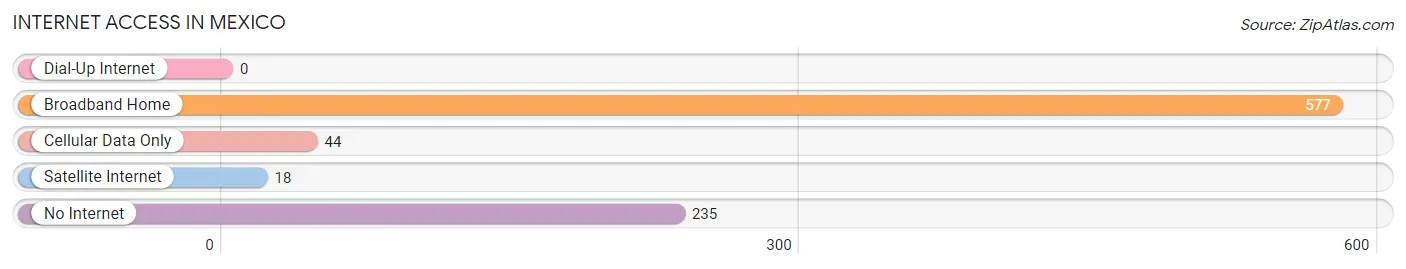
| Internet Type | # Households | % Households |
| Dial-Up Internet | 0 | 0.0% |
| Broadband Home | 577 | 67.4% |
| Cellular Data Only | 44 | 5.1% |
| Satellite Internet | 18 | 2.1% |
| No Internet | 235 | 27.5% |
| Total | 856 | 100.0% |
Mexico Summary
Mexico is a country located in North America, bordered by the United States to the north, Guatemala and Belize to the south, and the Pacific Ocean to the west. It is the fifth-largest country in the Americas by total area and the 13th-largest independent nation in the world. With an estimated population of over 120 million people, Mexico is the 11th most populous country and the most populous Spanish-speaking country in the world.
History
The history of Mexico dates back to the early civilizations of the Olmec, Maya, and Aztec. The first known settlers of Mexico were the Olmecs, who lived in the area from 1200 BC to 400 BC. The Olmecs were followed by the Maya, who established their own civilization in the Yucatan Peninsula and the highlands of Guatemala and Chiapas. The Maya civilization flourished until the arrival of the Spanish in the 16th century.
The Aztecs were the last of the great Mesoamerican civilizations, and their empire reached its peak in the 15th century. The Aztecs were conquered by the Spanish in 1521, and Mexico became a Spanish colony. Mexico gained its independence from Spain in 1821, and the country has since gone through a series of political and economic changes.
Geography
Mexico is located in the southern part of North America, bordered by the United States to the north, Guatemala and Belize to the south, and the Pacific Ocean to the west. It is the fifth-largest country in the Americas by total area and the 13th-largest independent nation in the world.
Mexico is divided into 31 states and one federal district. The country is divided into three main geographic regions: the northern desert region, the central highlands, and the southern lowlands. The northern desert region is characterized by dry, hot climates and sparse vegetation. The central highlands are home to the country’s largest cities, including Mexico City, and are characterized by temperate climates and lush vegetation. The southern lowlands are characterized by tropical climates and dense vegetation.
Economy
Mexico has a mixed economy that is based on both private and public sectors. The country is a member of the G20 and the OECD, and is one of the world’s largest economies. Mexico is the 15th largest economy in the world, with a GDP of $1.2 trillion in 2019.
The Mexican economy is heavily reliant on exports, with the United States being its largest trading partner. Mexico is a major exporter of oil, manufactured goods, and agricultural products. The country is also a major producer of silver, copper, and other minerals.
Demographics
Mexico has an estimated population of over 120 million people, making it the 11th most populous country in the world. The majority of the population is of mixed European and indigenous descent, with a small percentage of African and Asian descent. The official language of Mexico is Spanish, and the majority of the population is Roman Catholic.
Mexico is a diverse and multicultural country, with a wide variety of ethnic and linguistic groups. The largest ethnic group is the Mestizo, which makes up around 60% of the population. Other major ethnic groups include the indigenous peoples, the Afro-Mexicans, and the Asian-Mexicans.
Conclusion
Mexico is a diverse and vibrant country with a rich history and culture. It is the fifth-largest country in the Americas by total area and the 13th-largest independent nation in the world. With an estimated population of over 120 million people, Mexico is the 11th most populous country and the most populous Spanish-speaking country in the world. The country has a mixed economy that is based on both private and public sectors, and is a major exporter of oil, manufactured goods, and agricultural products. Mexico is a diverse and multicultural country, with a wide variety of ethnic and linguistic groups.
Common Questions
What is Per Capita Income in Mexico?
Per Capita income in Mexico is $23,280.
What is the Median Family Income in Mexico?
Median Family Income in Mexico is $53,056.
What is the Median Household income in Mexico?
Median Household Income in Mexico is $35,093.
What is Income or Wage Gap in Mexico?
Income or Wage Gap in Mexico is 41.8%.
Women in Mexico earn 58.2 cents for every dollar earned by a man.
What is Inequality or Gini Index in Mexico?
Inequality or Gini Index in Mexico is 0.41.
What is the Total Population of Mexico?
Total Population of Mexico is 1,833.
What is the Total Male Population of Mexico?
Total Male Population of Mexico is 717.
What is the Total Female Population of Mexico?
Total Female Population of Mexico is 1,116.
What is the Ratio of Males per 100 Females in Mexico?
There are 64.25 Males per 100 Females in Mexico.
What is the Ratio of Females per 100 Males in Mexico?
There are 155.65 Females per 100 Males in Mexico.
What is the Median Population Age in Mexico?
Median Population Age in Mexico is 58.1 Years.
What is the Average Family Size in Mexico
Average Family Size in Mexico is 2.7 People.
What is the Average Household Size in Mexico
Average Household Size in Mexico is 2.1 People.
How Large is the Labor Force in Mexico?
There are 730 People in the Labor Forcein in Mexico.
What is the Percentage of People in the Labor Force in Mexico?
47.3% of People are in the Labor Force in Mexico.
What is the Unemployment Rate in Mexico?
Unemployment Rate in Mexico is 2.2%.