Pittsfield, ME Map & Demographics
Pittsfield Map
Pittsfield Overview
$23,728
PER CAPITA INCOME
$56,119
AVG FAMILY INCOME
$42,292
AVG HOUSEHOLD INCOME
56.0%
WAGE / INCOME GAP [ % ]
44.0¢/ $1
WAGE / INCOME GAP [ $ ]
0.48
INEQUALITY / GINI INDEX
3,148
TOTAL POPULATION
1,459
MALE POPULATION
1,689
FEMALE POPULATION
86.38
MALES / 100 FEMALES
115.76
FEMALES / 100 MALES
33.9
MEDIAN AGE
3.1
AVG FAMILY SIZE
2.4
AVG HOUSEHOLD SIZE
1,318
LABOR FORCE [ PEOPLE ]
55.8%
PERCENT IN LABOR FORCE
1.6%
UNEMPLOYMENT RATE
Pittsfield Zip Codes
Pittsfield Area Codes
Income in Pittsfield
Income Overview in Pittsfield
Per Capita Income in Pittsfield is $23,728, while median incomes of families and households are $56,119 and $42,292 respectively.
| Characteristic | Number | Measure |
| Per Capita Income | 3,148 | $23,728 |
| Median Family Income | 756 | $56,119 |
| Mean Family Income | 756 | $68,132 |
| Median Household Income | 1,242 | $42,292 |
| Mean Household Income | 1,242 | $58,136 |
| Income Deficit | 756 | $0 |
| Wage / Income Gap (%) | 3,148 | 55.98% |
| Wage / Income Gap ($) | 3,148 | 44.02¢ per $1 |
| Gini / Inequality Index | 3,148 | 0.48 |
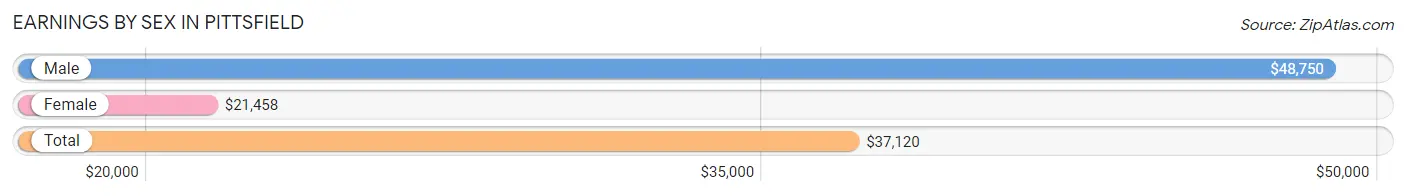
Earnings by Sex in Pittsfield
Average Earnings in Pittsfield are $37,120, $48,750 for men and $21,458 for women, a difference of 56.0%.
| Sex | Number | Average Earnings |
| Male | 651 (46.9%) | $48,750 |
| Female | 736 (53.1%) | $21,458 |
| Total | 1,387 (100.0%) | $37,120 |
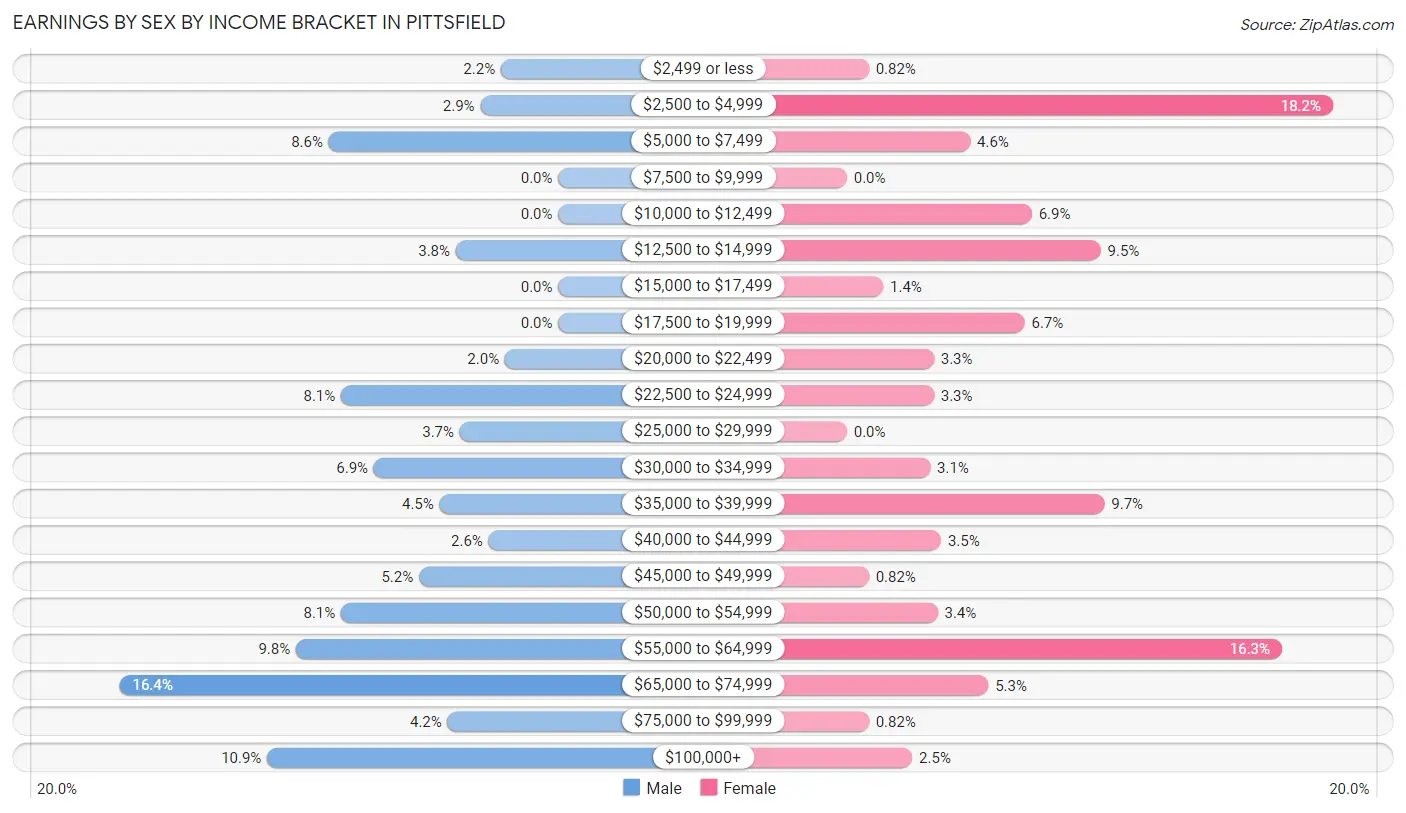
Earnings by Sex by Income Bracket in Pittsfield
The most common earnings brackets in Pittsfield are $65,000 to $74,999 for men (107 | 16.4%) and $2,500 to $4,999 for women (134 | 18.2%).
| Income | Male | Female |
| $2,499 or less | 14 (2.1%) | 6 (0.8%) |
| $2,500 to $4,999 | 19 (2.9%) | 134 (18.2%) |
| $5,000 to $7,499 | 56 (8.6%) | 34 (4.6%) |
| $7,500 to $9,999 | 0 (0.0%) | 0 (0.0%) |
| $10,000 to $12,499 | 0 (0.0%) | 51 (6.9%) |
| $12,500 to $14,999 | 25 (3.8%) | 70 (9.5%) |
| $15,000 to $17,499 | 0 (0.0%) | 10 (1.4%) |
| $17,500 to $19,999 | 0 (0.0%) | 49 (6.7%) |
| $20,000 to $22,499 | 13 (2.0%) | 24 (3.3%) |
| $22,500 to $24,999 | 53 (8.1%) | 24 (3.3%) |
| $25,000 to $29,999 | 24 (3.7%) | 0 (0.0%) |
| $30,000 to $34,999 | 45 (6.9%) | 23 (3.1%) |
| $35,000 to $39,999 | 29 (4.4%) | 71 (9.7%) |
| $40,000 to $44,999 | 17 (2.6%) | 26 (3.5%) |
| $45,000 to $49,999 | 34 (5.2%) | 6 (0.8%) |
| $50,000 to $54,999 | 53 (8.1%) | 25 (3.4%) |
| $55,000 to $64,999 | 64 (9.8%) | 120 (16.3%) |
| $65,000 to $74,999 | 107 (16.4%) | 39 (5.3%) |
| $75,000 to $99,999 | 27 (4.2%) | 6 (0.8%) |
| $100,000+ | 71 (10.9%) | 18 (2.5%) |
| Total | 651 (100.0%) | 736 (100.0%) |
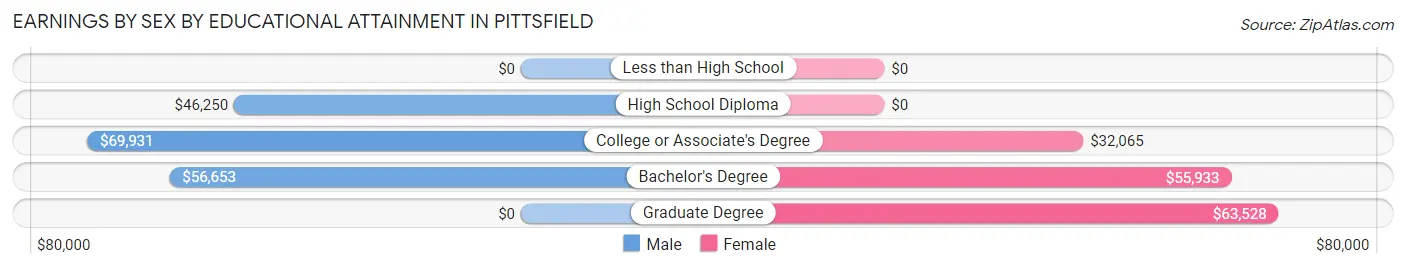
Earnings by Sex by Educational Attainment in Pittsfield
Average earnings in Pittsfield are $52,038 for men and $31,793 for women, a difference of 38.9%. Men with an educational attainment of college or associate's degree enjoy the highest average annual earnings of $69,931, while those with high school diploma education earn the least with $46,250. Women with an educational attainment of graduate degree earn the most with the average annual earnings of $63,528, while those with college or associate's degree education have the smallest earnings of $32,065.
| Educational Attainment | Male Income | Female Income |
| Less than High School | - | - |
| High School Diploma | $46,250 | $0 |
| College or Associate's Degree | $69,931 | $32,065 |
| Bachelor's Degree | $56,653 | $55,933 |
| Graduate Degree | - | - |
| Total | $52,038 | $31,793 |
Family Income in Pittsfield
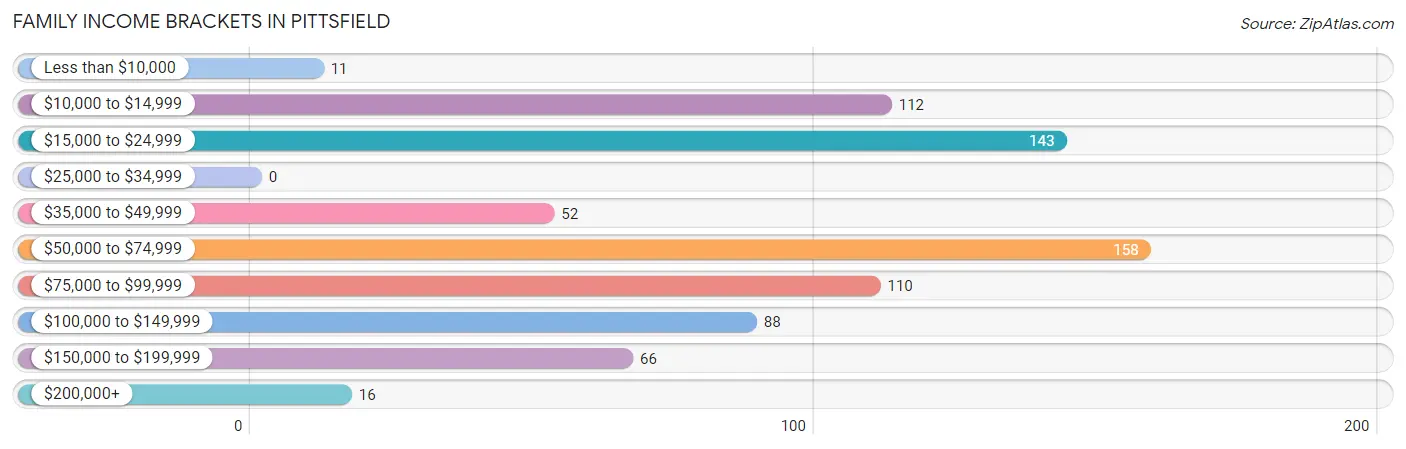
Family Income Brackets in Pittsfield
According to the Pittsfield family income data, there are 158 families falling into the $50,000 to $74,999 income range, which is the most common income bracket and makes up 20.9% of all families.
| Income Bracket | # Families | % Families |
| Less than $10,000 | 11 | 1.5% |
| $10,000 to $14,999 | 112 | 14.8% |
| $15,000 to $24,999 | 143 | 18.9% |
| $25,000 to $34,999 | 0 | 0.0% |
| $35,000 to $49,999 | 52 | 6.9% |
| $50,000 to $74,999 | 158 | 20.9% |
| $75,000 to $99,999 | 110 | 14.6% |
| $100,000 to $149,999 | 88 | 11.6% |
| $150,000 to $199,999 | 66 | 8.7% |
| $200,000+ | 16 | 2.1% |
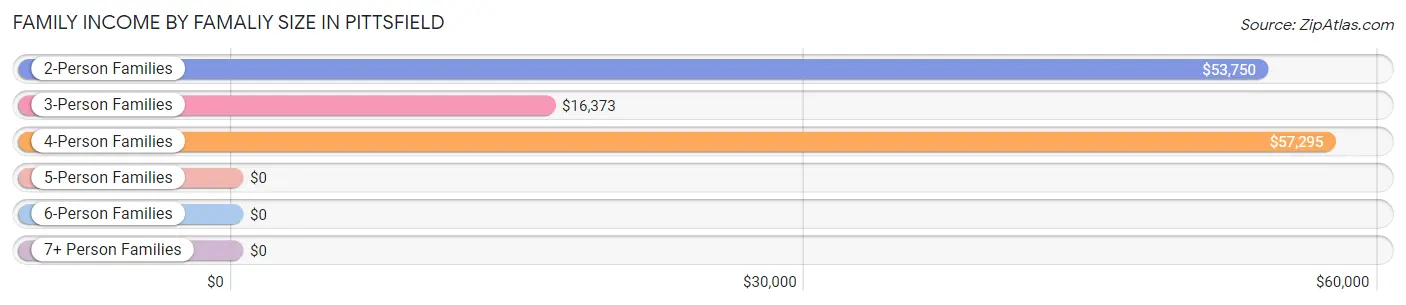
Family Income by Famaliy Size in Pittsfield
4-person families (123 | 16.3%) account for the highest median family income in Pittsfield with $57,295 per family, while 2-person families (306 | 40.5%) have the highest median income of $26,875 per family member.
| Income Bracket | # Families | Median Income |
| 2-Person Families | 306 (40.5%) | $53,750 |
| 3-Person Families | 248 (32.8%) | $16,373 |
| 4-Person Families | 123 (16.3%) | $57,295 |
| 5-Person Families | 31 (4.1%) | $0 |
| 6-Person Families | 37 (4.9%) | $0 |
| 7+ Person Families | 11 (1.5%) | $0 |
| Total | 756 (100.0%) | $56,119 |
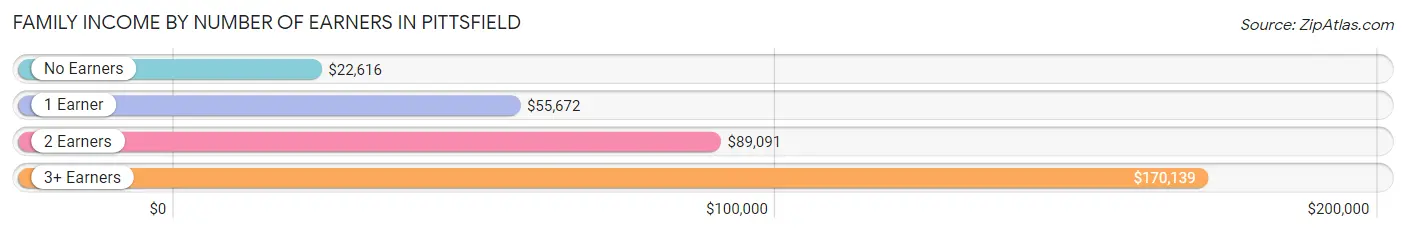
Family Income by Number of Earners in Pittsfield
The median family income in Pittsfield is $56,119, with families comprising 3+ earners (83) having the highest median family income of $170,139, while families with no earners (191) have the lowest median family income of $22,616, accounting for 11.0% and 25.3% of families, respectively.
| Number of Earners | # Families | Median Income |
| No Earners | 191 (25.3%) | $22,616 |
| 1 Earner | 276 (36.5%) | $55,672 |
| 2 Earners | 206 (27.3%) | $89,091 |
| 3+ Earners | 83 (11.0%) | $170,139 |
| Total | 756 (100.0%) | $56,119 |
Household Income in Pittsfield
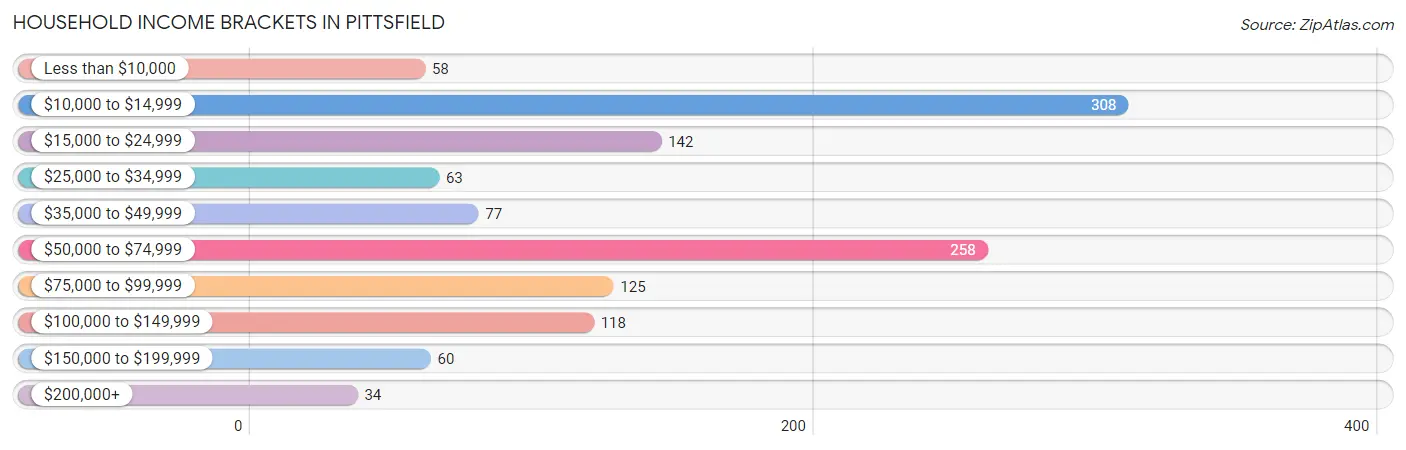
Household Income Brackets in Pittsfield
With 308 households falling in the category, the $10,000 to $14,999 income range is the most frequent in Pittsfield, accounting for 24.8% of all households. In contrast, only 34 households (2.7%) fall into the $200,000+ income bracket, making it the least populous group.
| Income Bracket | # Households | % Households |
| Less than $10,000 | 58 | 4.7% |
| $10,000 to $14,999 | 308 | 24.8% |
| $15,000 to $24,999 | 142 | 11.4% |
| $25,000 to $34,999 | 63 | 5.1% |
| $35,000 to $49,999 | 77 | 6.2% |
| $50,000 to $74,999 | 258 | 20.8% |
| $75,000 to $99,999 | 125 | 10.1% |
| $100,000 to $149,999 | 118 | 9.5% |
| $150,000 to $199,999 | 60 | 4.8% |
| $200,000+ | 34 | 2.7% |
Household Income by Householder Age in Pittsfield
The median household income in Pittsfield is $42,292, with the highest median household income of $57,108 found in the 25 to 44 years age bracket for the primary householder. A total of 451 households (36.3%) fall into this category.
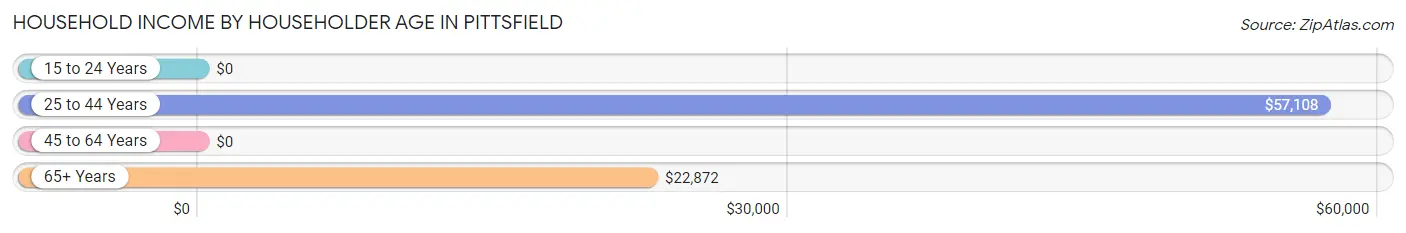
| Income Bracket | # Households | Median Income |
| 15 to 24 Years | 0 (0.0%) | $0 |
| 25 to 44 Years | 451 (36.3%) | $57,108 |
| 45 to 64 Years | 457 (36.8%) | $0 |
| 65+ Years | 334 (26.9%) | $22,872 |
| Total | 1,242 (100.0%) | $42,292 |
Poverty in Pittsfield
Income Below Poverty by Sex and Age in Pittsfield
With 22.2% poverty level for males and 32.1% for females among the residents of Pittsfield, 16 and 17 year old males and 35 to 44 year old females are the most vulnerable to poverty, with 29 males (65.9%) and 131 females (68.6%) in their respective age groups living below the poverty level.
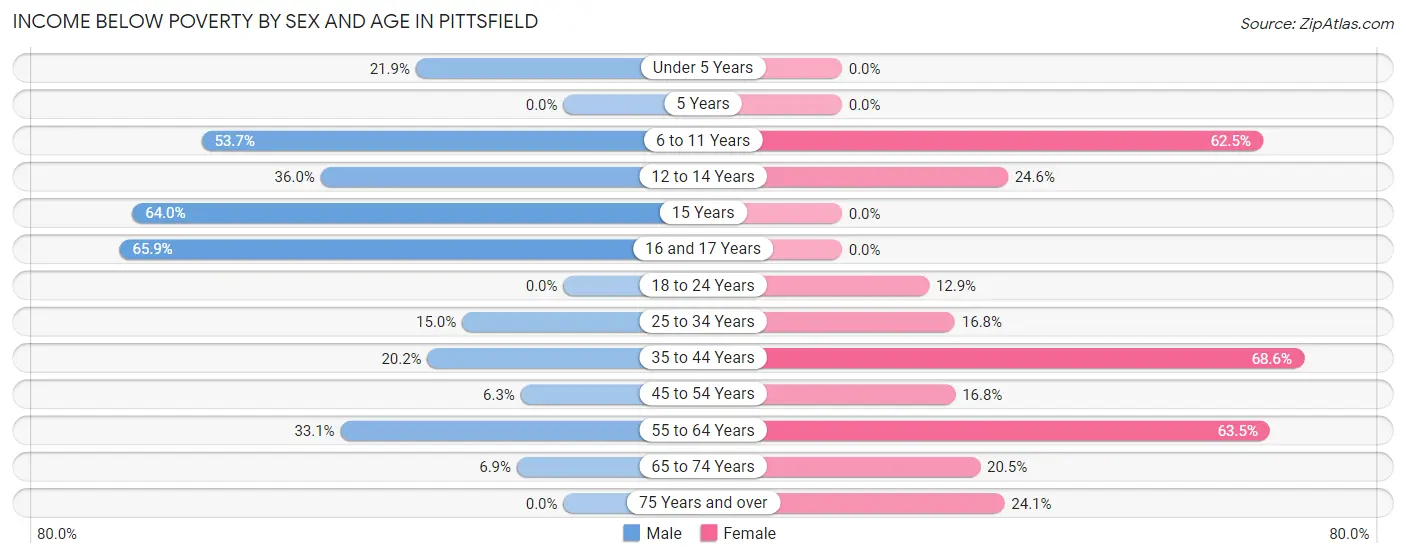
| Age Bracket | Male | Female |
| Under 5 Years | 32 (21.9%) | 0 (0.0%) |
| 5 Years | 0 (0.0%) | 0 (0.0%) |
| 6 to 11 Years | 72 (53.7%) | 90 (62.5%) |
| 12 to 14 Years | 40 (36.0%) | 17 (24.6%) |
| 15 Years | 16 (64.0%) | 0 (0.0%) |
| 16 and 17 Years | 29 (65.9%) | 0 (0.0%) |
| 18 to 24 Years | 0 (0.0%) | 11 (12.9%) |
| 25 to 34 Years | 43 (15.0%) | 45 (16.8%) |
| 35 to 44 Years | 23 (20.2%) | 131 (68.6%) |
| 45 to 54 Years | 9 (6.3%) | 33 (16.8%) |
| 55 to 64 Years | 48 (33.1%) | 115 (63.5%) |
| 65 to 74 Years | 4 (6.9%) | 39 (20.5%) |
| 75 Years and over | 0 (0.0%) | 35 (24.1%) |
| Total | 316 (22.2%) | 516 (32.1%) |
Income Above Poverty by Sex and Age in Pittsfield
According to the poverty statistics in Pittsfield, males aged 5 years and females aged under 5 years are the age groups that are most secure financially, with 100.0% of males and 100.0% of females in these age groups living above the poverty line.
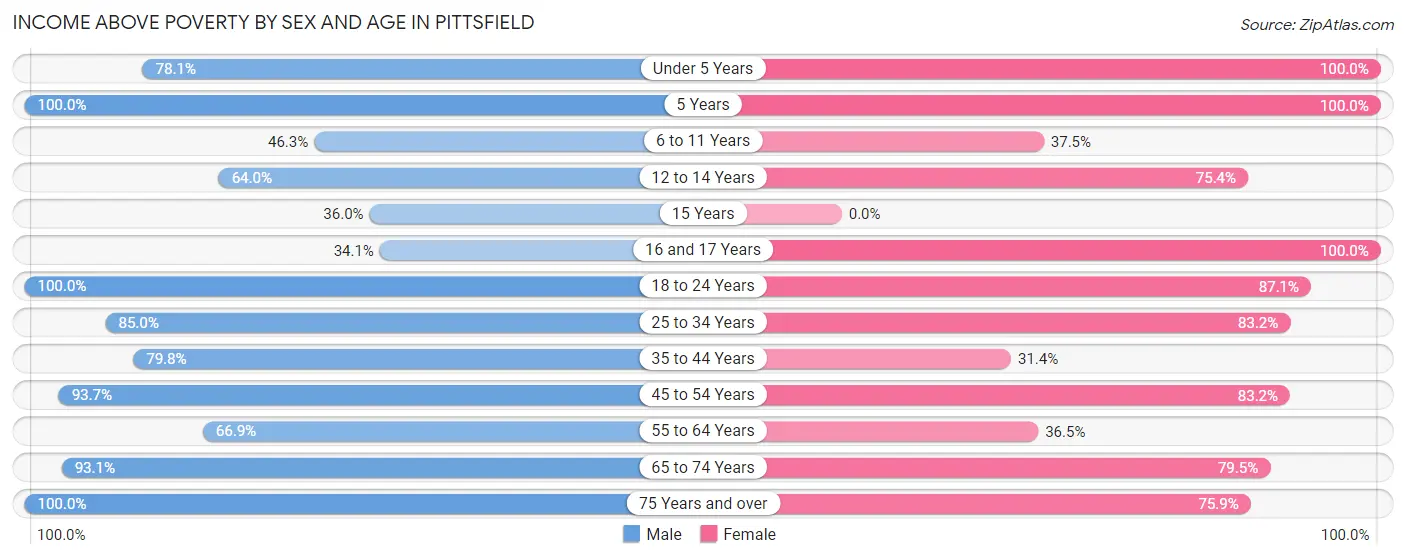
| Age Bracket | Male | Female |
| Under 5 Years | 114 (78.1%) | 70 (100.0%) |
| 5 Years | 12 (100.0%) | 63 (100.0%) |
| 6 to 11 Years | 62 (46.3%) | 54 (37.5%) |
| 12 to 14 Years | 71 (64.0%) | 52 (75.4%) |
| 15 Years | 9 (36.0%) | 0 (0.0%) |
| 16 and 17 Years | 15 (34.1%) | 6 (100.0%) |
| 18 to 24 Years | 66 (100.0%) | 74 (87.1%) |
| 25 to 34 Years | 243 (85.0%) | 223 (83.2%) |
| 35 to 44 Years | 91 (79.8%) | 60 (31.4%) |
| 45 to 54 Years | 133 (93.7%) | 163 (83.2%) |
| 55 to 64 Years | 97 (66.9%) | 66 (36.5%) |
| 65 to 74 Years | 54 (93.1%) | 151 (79.5%) |
| 75 Years and over | 138 (100.0%) | 110 (75.9%) |
| Total | 1,105 (77.8%) | 1,092 (67.9%) |
Income Below Poverty Among Married-Couple Families in Pittsfield
The poverty statistics for married-couple families in Pittsfield show that 6.0% or 27 of the total 452 families live below the poverty line. Families with no children have the highest poverty rate of 8.5%, comprising of 27 families. On the other hand, families with 1 or 2 children have the lowest poverty rate of 0.0%, which includes 0 families.
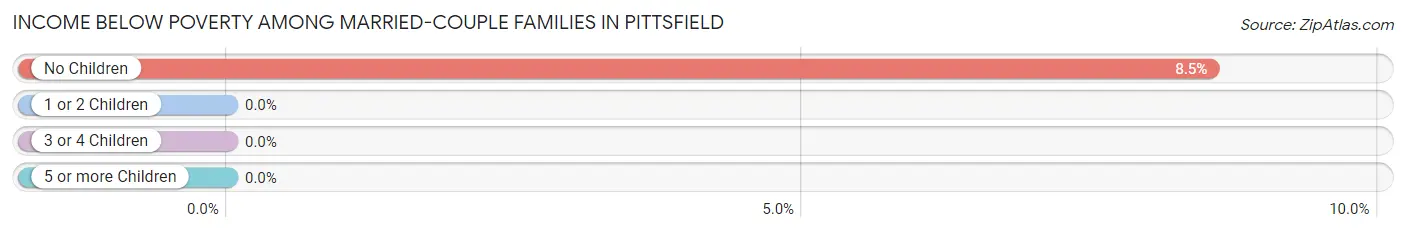
| Children | Above Poverty | Below Poverty |
| No Children | 289 (91.5%) | 27 (8.5%) |
| 1 or 2 Children | 96 (100.0%) | 0 (0.0%) |
| 3 or 4 Children | 40 (100.0%) | 0 (0.0%) |
| 5 or more Children | 0 (0.0%) | 0 (0.0%) |
| Total | 425 (94.0%) | 27 (6.0%) |
Income Below Poverty Among Single-Parent Households in Pittsfield
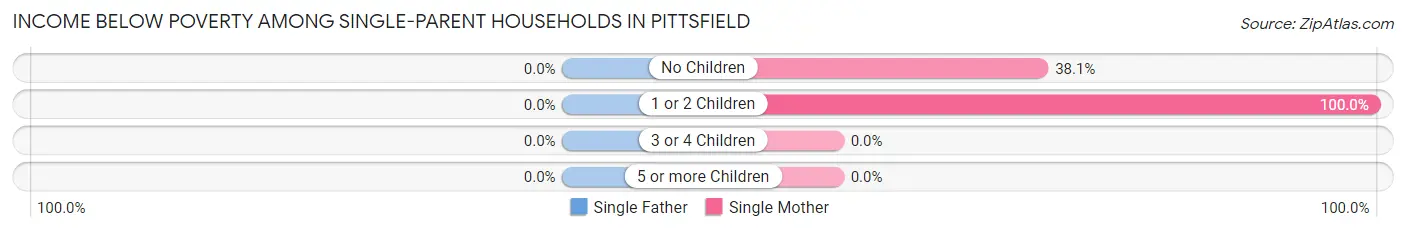
| Children | Single Father | Single Mother |
| No Children | 0 (0.0%) | 8 (38.1%) |
| 1 or 2 Children | 0 (0.0%) | 162 (100.0%) |
| 3 or 4 Children | 0 (0.0%) | 0 (0.0%) |
| 5 or more Children | 0 (0.0%) | 0 (0.0%) |
| Total | 0 (0.0%) | 170 (68.0%) |
Income Below Poverty Among Married-Couple vs Single-Parent Households in Pittsfield
The poverty data for Pittsfield shows that 27 of the married-couple family households (6.0%) and 170 of the single-parent households (55.9%) are living below the poverty level. Within the married-couple family households, those with no children have the highest poverty rate, with 27 households (8.5%) falling below the poverty line. Among the single-parent households, those with 1 or 2 children have the highest poverty rate, with 162 household (93.6%) living below poverty.
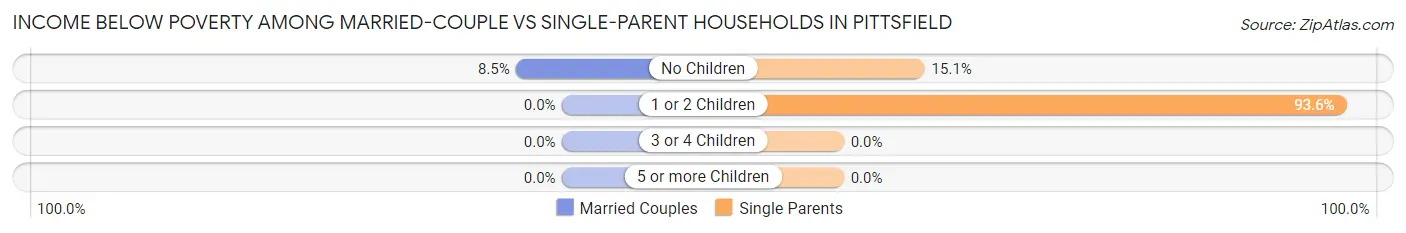
| Children | Married-Couple Families | Single-Parent Households |
| No Children | 27 (8.5%) | 8 (15.1%) |
| 1 or 2 Children | 0 (0.0%) | 162 (93.6%) |
| 3 or 4 Children | 0 (0.0%) | 0 (0.0%) |
| 5 or more Children | 0 (0.0%) | 0 (0.0%) |
| Total | 27 (6.0%) | 170 (55.9%) |
Race in Pittsfield
The most populous races in Pittsfield are White / Caucasian (2,908 | 92.4%), Two or more Races (174 | 5.5%), and Hispanic or Latino (148 | 4.7%).
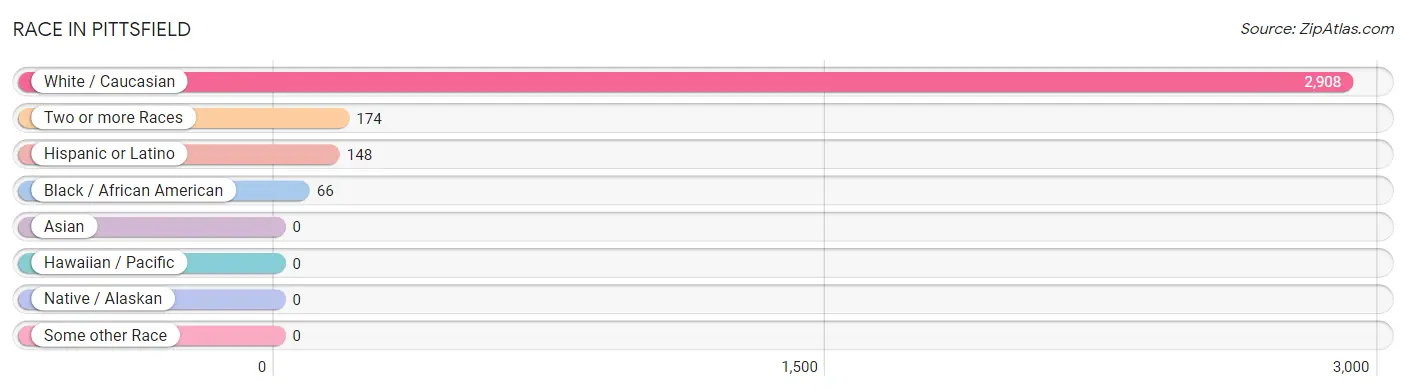
| Race | # Population | % Population |
| Asian | 0 | 0.0% |
| Black / African American | 66 | 2.1% |
| Hawaiian / Pacific | 0 | 0.0% |
| Hispanic or Latino | 148 | 4.7% |
| Native / Alaskan | 0 | 0.0% |
| White / Caucasian | 2,908 | 92.4% |
| Two or more Races | 174 | 5.5% |
| Some other Race | 0 | 0.0% |
| Total | 3,148 | 100.0% |
Ancestry in Pittsfield
The most populous ancestries reported in Pittsfield are English (781 | 24.8%), French (462 | 14.7%), Irish (399 | 12.7%), German (219 | 7.0%), and Polish (172 | 5.5%), together accounting for 64.6% of all Pittsfield residents.
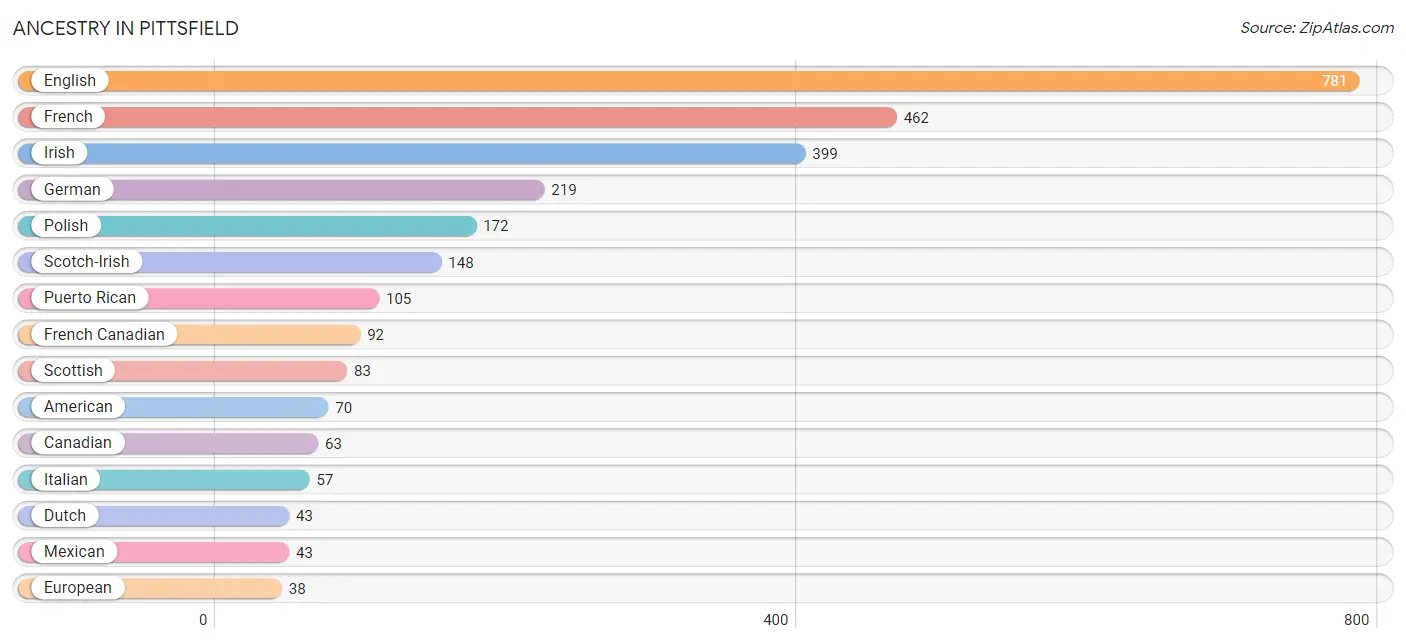
| Ancestry | # Population | % Population |
| African | 9 | 0.3% |
| American | 70 | 2.2% |
| Arab | 7 | 0.2% |
| Canadian | 63 | 2.0% |
| Dutch | 43 | 1.4% |
| English | 781 | 24.8% |
| European | 38 | 1.2% |
| Finnish | 9 | 0.3% |
| French | 462 | 14.7% |
| French Canadian | 92 | 2.9% |
| German | 219 | 7.0% |
| Irish | 399 | 12.7% |
| Italian | 57 | 1.8% |
| Lebanese | 7 | 0.2% |
| Mexican | 43 | 1.4% |
| Polish | 172 | 5.5% |
| Portuguese | 21 | 0.7% |
| Puerto Rican | 105 | 3.3% |
| Scotch-Irish | 148 | 4.7% |
| Scottish | 83 | 2.6% |
| Subsaharan African | 9 | 0.3% | View All 21 Rows |
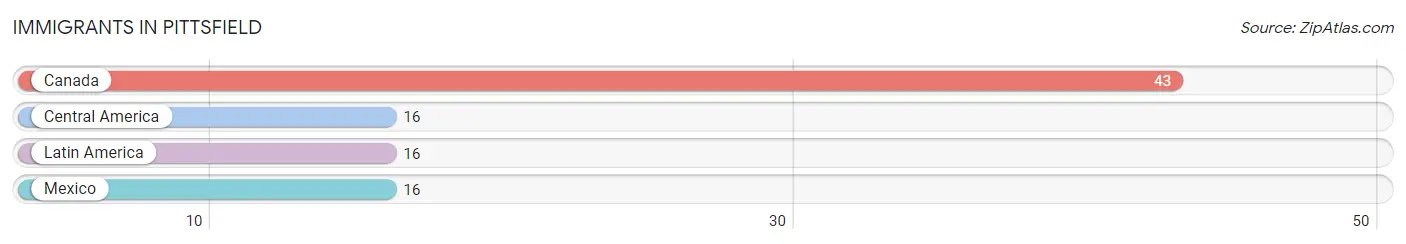
Immigrants in Pittsfield
The most numerous immigrant groups reported in Pittsfield came from Canada (43 | 1.4%), Central America (16 | 0.5%), Latin America (16 | 0.5%), and Mexico (16 | 0.5%), together accounting for 2.9% of all Pittsfield residents.
| Immigration Origin | # Population | % Population |
| Canada | 43 | 1.4% |
| Central America | 16 | 0.5% |
| Latin America | 16 | 0.5% |
| Mexico | 16 | 0.5% | View All 4 Rows |
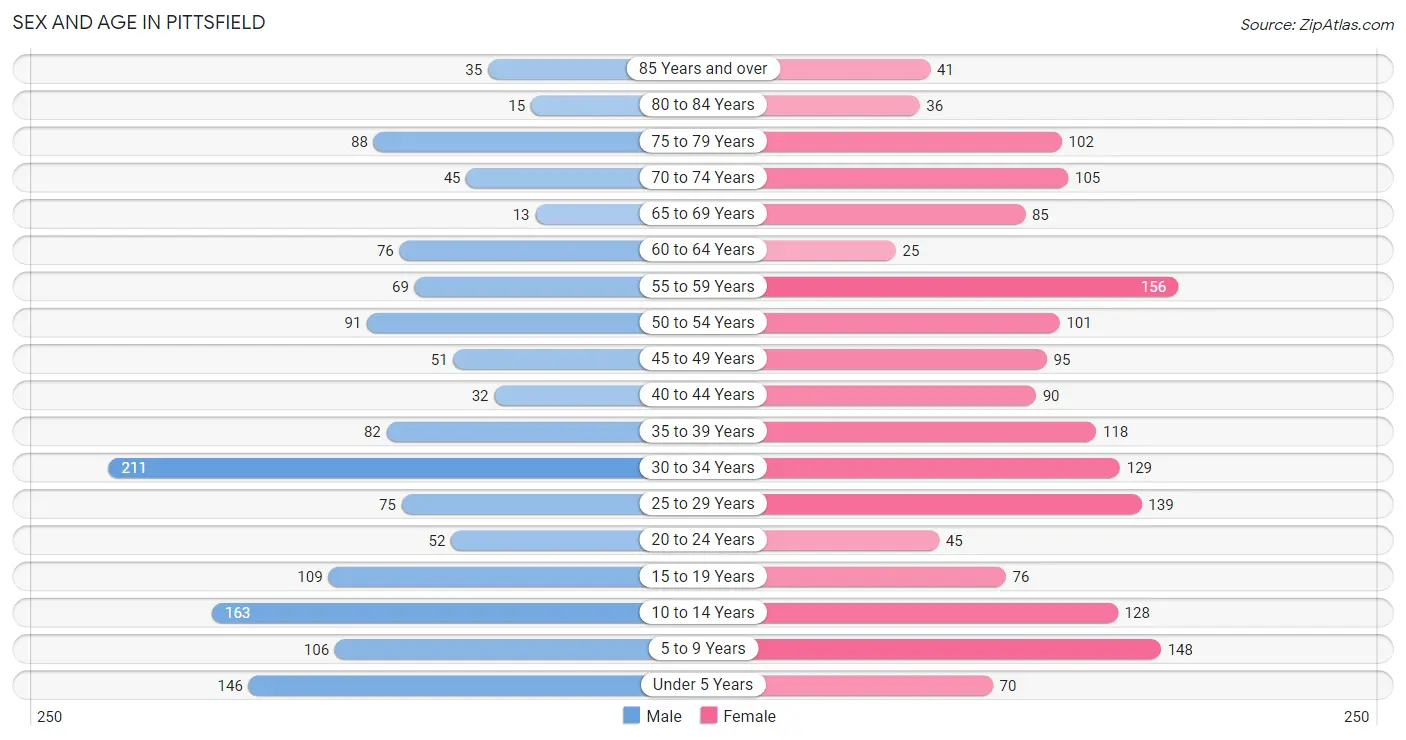
Sex and Age in Pittsfield
Sex and Age in Pittsfield
The most populous age groups in Pittsfield are 30 to 34 Years (211 | 14.5%) for men and 55 to 59 Years (156 | 9.2%) for women.
| Age Bracket | Male | Female |
| Under 5 Years | 146 (10.0%) | 70 (4.1%) |
| 5 to 9 Years | 106 (7.3%) | 148 (8.8%) |
| 10 to 14 Years | 163 (11.2%) | 128 (7.6%) |
| 15 to 19 Years | 109 (7.5%) | 76 (4.5%) |
| 20 to 24 Years | 52 (3.6%) | 45 (2.7%) |
| 25 to 29 Years | 75 (5.1%) | 139 (8.2%) |
| 30 to 34 Years | 211 (14.5%) | 129 (7.6%) |
| 35 to 39 Years | 82 (5.6%) | 118 (7.0%) |
| 40 to 44 Years | 32 (2.2%) | 90 (5.3%) |
| 45 to 49 Years | 51 (3.5%) | 95 (5.6%) |
| 50 to 54 Years | 91 (6.2%) | 101 (6.0%) |
| 55 to 59 Years | 69 (4.7%) | 156 (9.2%) |
| 60 to 64 Years | 76 (5.2%) | 25 (1.5%) |
| 65 to 69 Years | 13 (0.9%) | 85 (5.0%) |
| 70 to 74 Years | 45 (3.1%) | 105 (6.2%) |
| 75 to 79 Years | 88 (6.0%) | 102 (6.0%) |
| 80 to 84 Years | 15 (1.0%) | 36 (2.1%) |
| 85 Years and over | 35 (2.4%) | 41 (2.4%) |
| Total | 1,459 (100.0%) | 1,689 (100.0%) |
Families and Households in Pittsfield
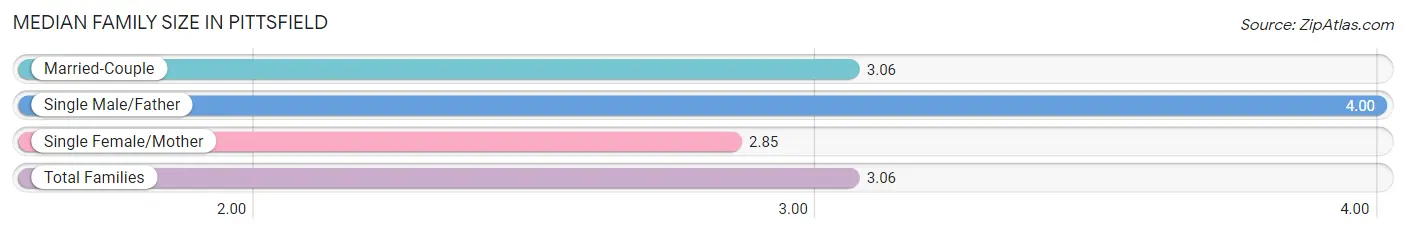
Median Family Size in Pittsfield
The median family size in Pittsfield is 3.06 persons per family, with single male/father families (54 | 7.1%) accounting for the largest median family size of 4 persons per family. On the other hand, single female/mother families (250 | 33.1%) represent the smallest median family size with 2.85 persons per family.
| Family Type | # Families | Family Size |
| Married-Couple | 452 (59.8%) | 3.06 |
| Single Male/Father | 54 (7.1%) | 4.00 |
| Single Female/Mother | 250 (33.1%) | 2.85 |
| Total Families | 756 (100.0%) | 3.06 |
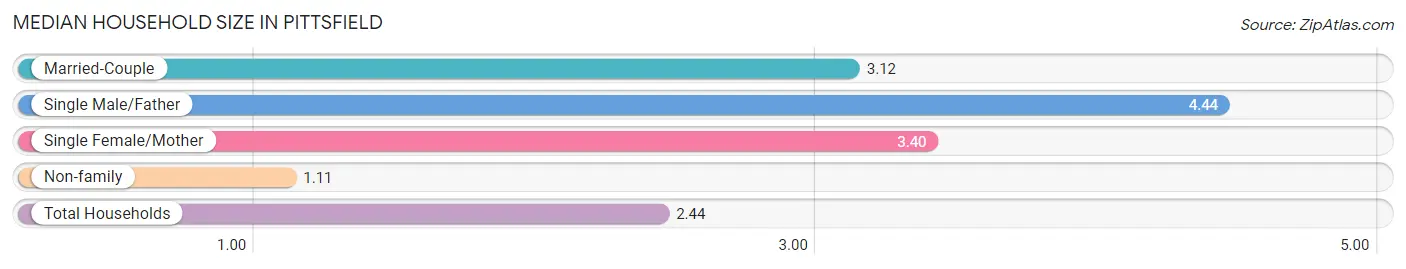
Median Household Size in Pittsfield
The median household size in Pittsfield is 2.44 persons per household, with single male/father households (54 | 4.3%) accounting for the largest median household size of 4.44 persons per household. non-family households (486 | 39.1%) represent the smallest median household size with 1.11 persons per household.
| Household Type | # Households | Household Size |
| Married-Couple | 452 (36.4%) | 3.12 |
| Single Male/Father | 54 (4.3%) | 4.44 |
| Single Female/Mother | 250 (20.1%) | 3.40 |
| Non-family | 486 (39.1%) | 1.11 |
| Total Households | 1,242 (100.0%) | 2.44 |
Household Size by Marriage Status in Pittsfield
Out of a total of 1,242 households in Pittsfield, 756 (60.9%) are family households, while 486 (39.1%) are nonfamily households. The most numerous type of family households are 2-person households, comprising 293, and the most common type of nonfamily households are 1-person households, comprising 438.
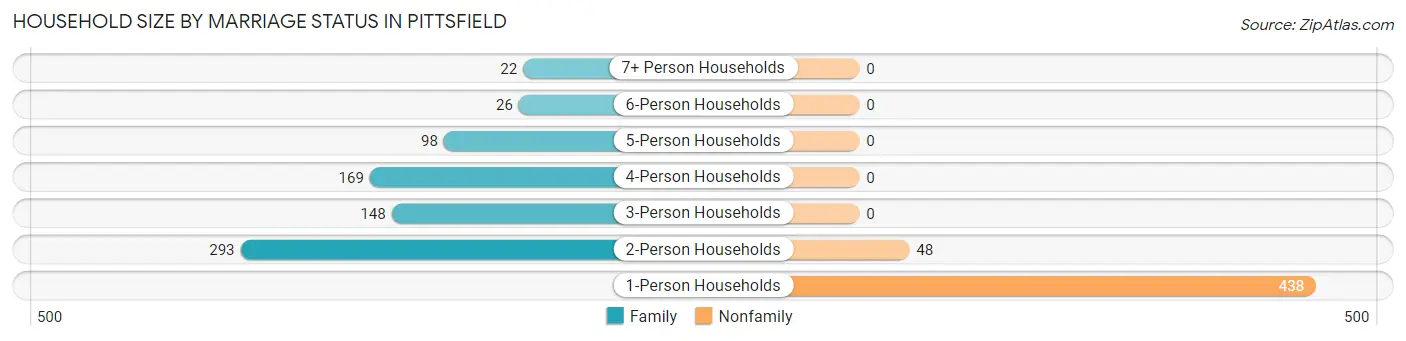
| Household Size | Family Households | Nonfamily Households |
| 1-Person Households | - | 438 (35.3%) |
| 2-Person Households | 293 (23.6%) | 48 (3.9%) |
| 3-Person Households | 148 (11.9%) | 0 (0.0%) |
| 4-Person Households | 169 (13.6%) | 0 (0.0%) |
| 5-Person Households | 98 (7.9%) | 0 (0.0%) |
| 6-Person Households | 26 (2.1%) | 0 (0.0%) |
| 7+ Person Households | 22 (1.8%) | 0 (0.0%) |
| Total | 756 (60.9%) | 486 (39.1%) |
Female Fertility in Pittsfield
Fertility by Age in Pittsfield
Average fertility rate in Pittsfield is 74.0 births per 1,000 women. Women in the age bracket of 20 to 34 years have the highest fertility rate with 83.0 births per 1,000 women. Women in the age bracket of 35 to 50 years acount for 51.8% of all women with births.
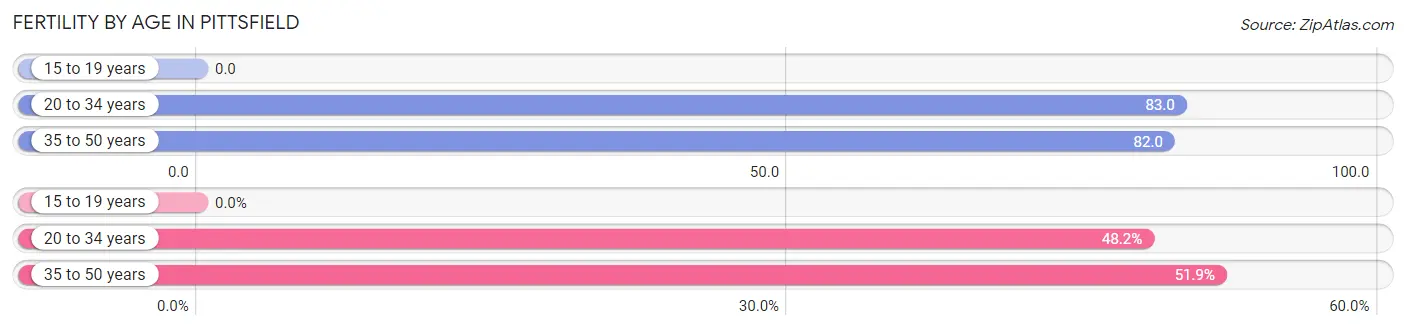
| Age Bracket | Women with Births | Births / 1,000 Women |
| 15 to 19 years | 0 (0.0%) | 0.0 |
| 20 to 34 years | 26 (48.1%) | 83.0 |
| 35 to 50 years | 28 (51.8%) | 82.0 |
| Total | 54 (100.0%) | 74.0 |
Fertility by Age by Marriage Status in Pittsfield
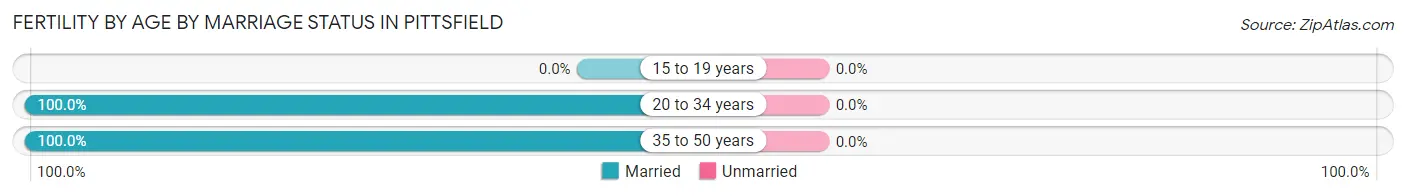
| Age Bracket | Married | Unmarried |
| 15 to 19 years | 0 (0.0%) | 0 (0.0%) |
| 20 to 34 years | 26 (100.0%) | 0 (0.0%) |
| 35 to 50 years | 28 (100.0%) | 0 (0.0%) |
| Total | 54 (100.0%) | 0 (0.0%) |
Fertility by Education in Pittsfield
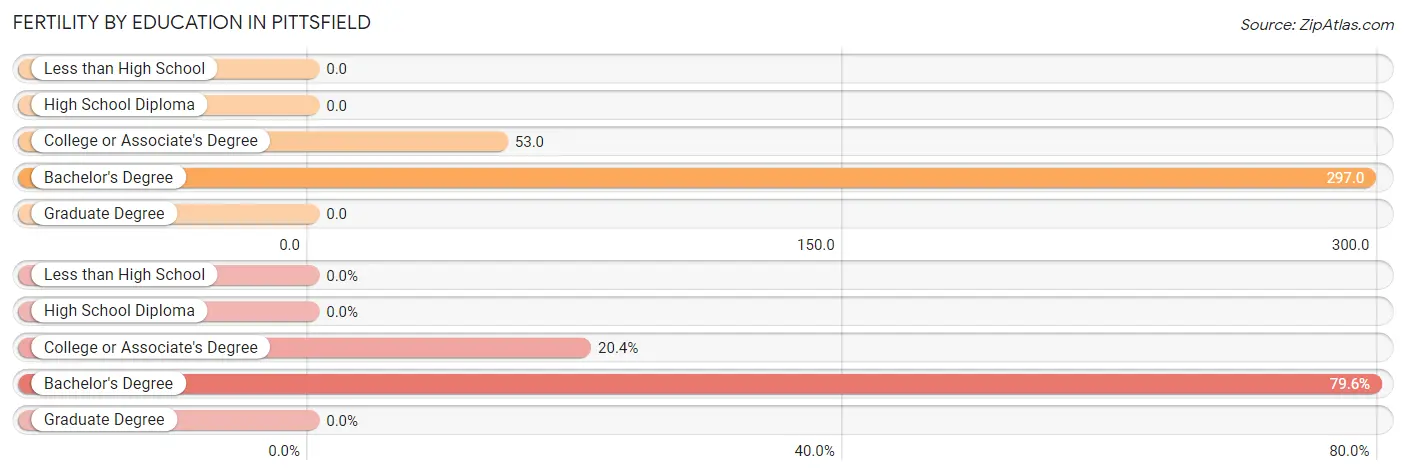
| Educational Attainment | Women with Births | Births / 1,000 Women |
| Less than High School | 0 (0.0%) | 0.0 |
| High School Diploma | 0 (0.0%) | 0.0 |
| College or Associate's Degree | 11 (20.4%) | 53.0 |
| Bachelor's Degree | 43 (79.6%) | 297.0 |
| Graduate Degree | 0 (0.0%) | 0.0 |
| Total | 54 (100.0%) | 74.0 |
Fertility by Education by Marriage Status in Pittsfield
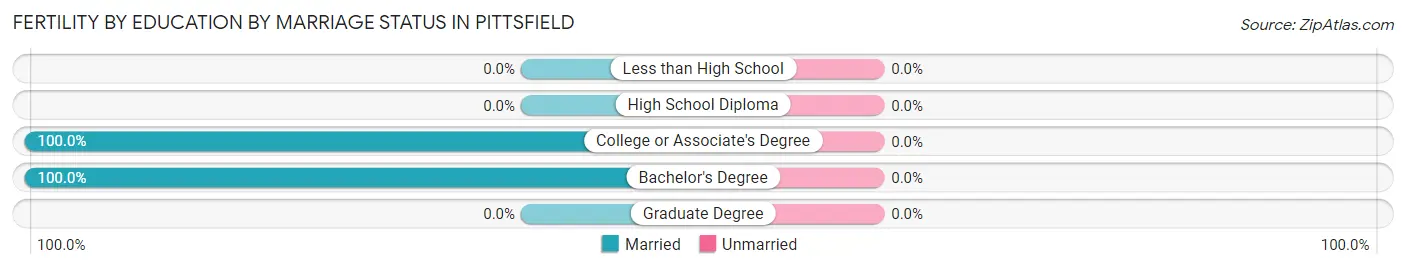
| Educational Attainment | Married | Unmarried |
| Less than High School | 0 (0.0%) | 0 (0.0%) |
| High School Diploma | 0 (0.0%) | 0 (0.0%) |
| College or Associate's Degree | 11 (100.0%) | 0 (0.0%) |
| Bachelor's Degree | 43 (100.0%) | 0 (0.0%) |
| Graduate Degree | 0 (0.0%) | 0 (0.0%) |
| Total | 54 (100.0%) | 0 (0.0%) |
Employment Characteristics in Pittsfield
Employment by Class of Employer in Pittsfield
Among the 1,270 employed individuals in Pittsfield, private company employees (814 | 64.1%), not-for-profit organizations (208 | 16.4%), and local government employees (91 | 7.2%) make up the most common classes of employment.
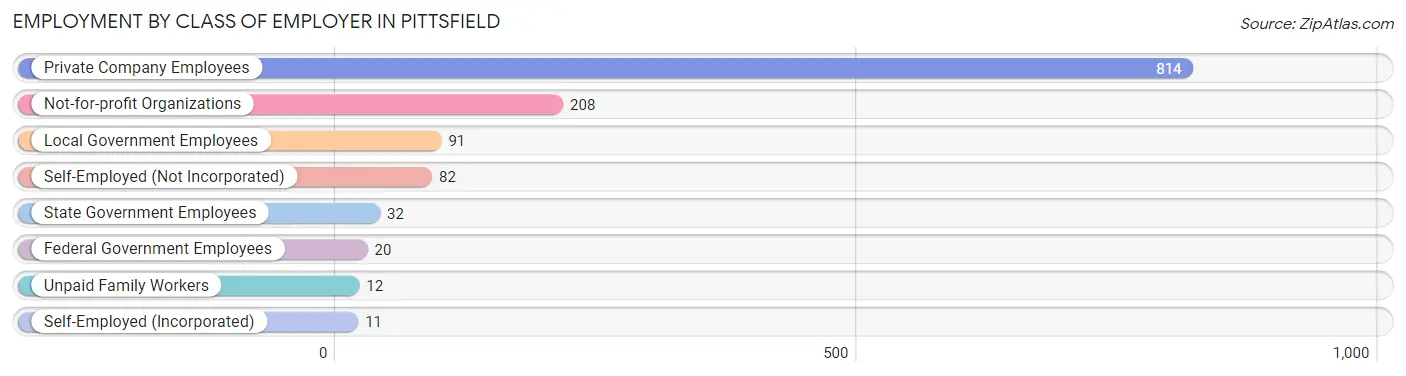
| Employer Class | # Employees | % Employees |
| Private Company Employees | 814 | 64.1% |
| Self-Employed (Incorporated) | 11 | 0.9% |
| Self-Employed (Not Incorporated) | 82 | 6.5% |
| Not-for-profit Organizations | 208 | 16.4% |
| Local Government Employees | 91 | 7.2% |
| State Government Employees | 32 | 2.5% |
| Federal Government Employees | 20 | 1.6% |
| Unpaid Family Workers | 12 | 0.9% |
| Total | 1,270 | 100.0% |
Employment Status by Age in Pittsfield
According to the labor force statistics for Pittsfield, out of the total population over 16 years of age (2,362), 55.8% or 1,318 individuals are in the labor force, with 1.6% or 21 of them unemployed. The age group with the highest labor force participation rate is 25 to 29 years, with 88.8% or 190 individuals in the labor force. Within the labor force, the 16 to 19 years age range has the highest percentage of unemployed individuals, with 24.2% or 16 of them being unemployed.
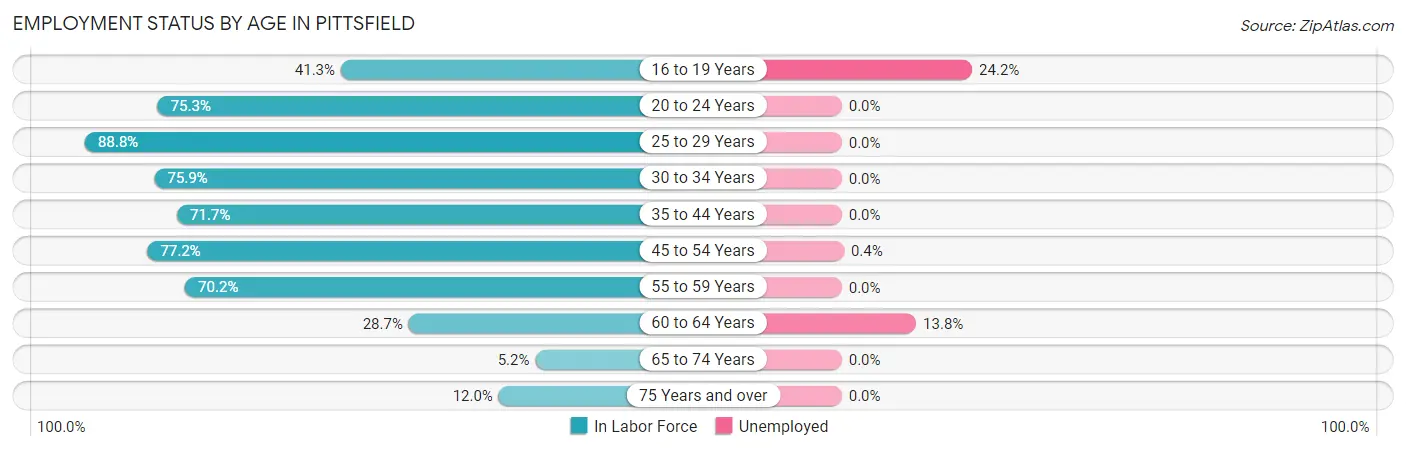
| Age Bracket | In Labor Force | Unemployed |
| 16 to 19 Years | 66 (41.3%) | 16 (24.2%) |
| 20 to 24 Years | 73 (75.3%) | 0 (0.0%) |
| 25 to 29 Years | 190 (88.8%) | 0 (0.0%) |
| 30 to 34 Years | 258 (75.9%) | 0 (0.0%) |
| 35 to 44 Years | 231 (71.7%) | 0 (0.0%) |
| 45 to 54 Years | 261 (77.2%) | 1 (0.4%) |
| 55 to 59 Years | 158 (70.2%) | 0 (0.0%) |
| 60 to 64 Years | 29 (28.7%) | 4 (13.8%) |
| 65 to 74 Years | 13 (5.2%) | 0 (0.0%) |
| 75 Years and over | 38 (12.0%) | 0 (0.0%) |
| Total | 1,318 (55.8%) | 21 (1.6%) |
Employment Status by Educational Attainment in Pittsfield
According to labor force statistics for Pittsfield, 73.2% of individuals (1,127) out of the total population between 25 and 64 years of age (1,540) are in the labor force, with 0.5% or 6 of them being unemployed. The group with the highest labor force participation rate are those with the educational attainment of bachelor's degree or higher, with 85.1% or 389 individuals in the labor force. Within the labor force, individuals with less than high school education have the highest percentage of unemployment, with 1.8% or 1 of them being unemployed.
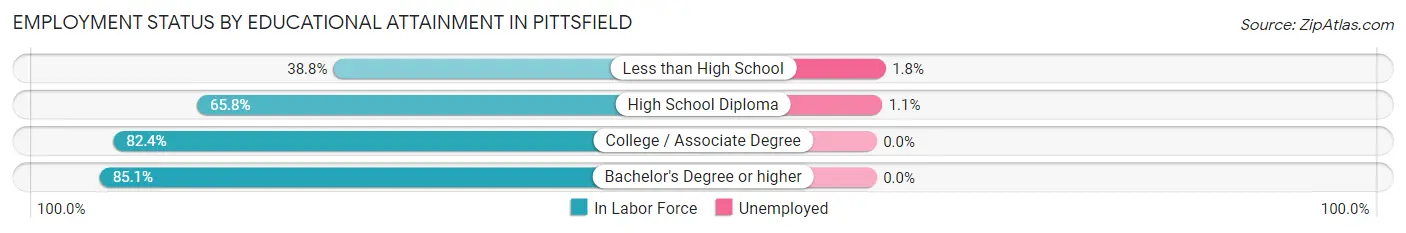
| Educational Attainment | In Labor Force | Unemployed |
| Less than High School | 57 (38.8%) | 3 (1.8%) |
| High School Diploma | 358 (65.8%) | 6 (1.1%) |
| College / Associate Degree | 323 (82.4%) | 0 (0.0%) |
| Bachelor's Degree or higher | 389 (85.1%) | 0 (0.0%) |
| Total | 1,127 (73.2%) | 8 (0.5%) |
Employment Occupations by Sex in Pittsfield
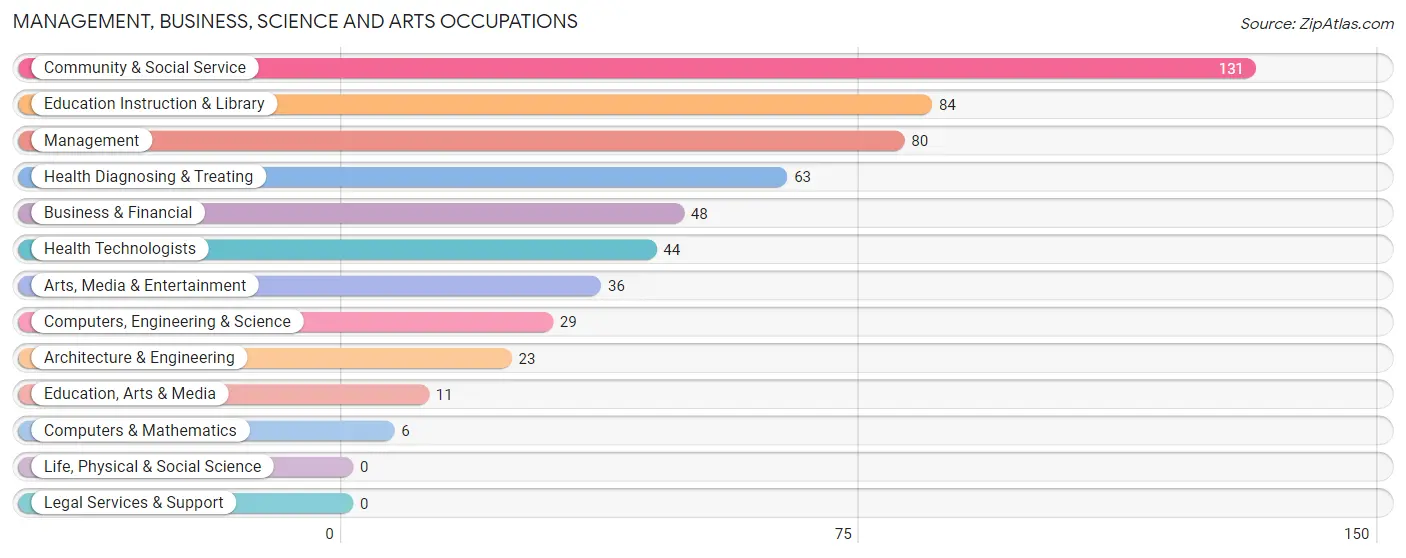
Management, Business, Science and Arts Occupations
The most common Management, Business, Science and Arts occupations in Pittsfield are Community & Social Service (131 | 10.3%), Education Instruction & Library (84 | 6.6%), Management (80 | 6.3%), Health Diagnosing & Treating (63 | 5.0%), and Business & Financial (48 | 3.8%).
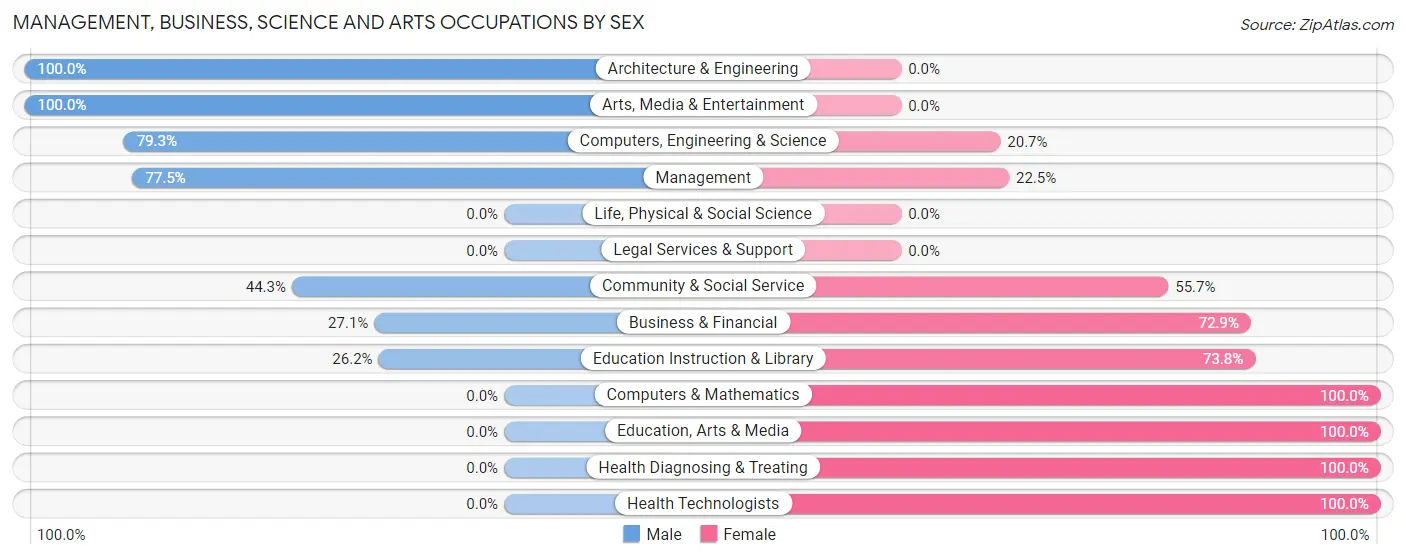
Management, Business, Science and Arts Occupations by Sex
Within the Management, Business, Science and Arts occupations in Pittsfield, the most male-oriented occupations are Architecture & Engineering (100.0%), Arts, Media & Entertainment (100.0%), and Computers, Engineering & Science (79.3%), while the most female-oriented occupations are Computers & Mathematics (100.0%), Education, Arts & Media (100.0%), and Health Diagnosing & Treating (100.0%).
| Occupation | Male | Female |
| Management | 62 (77.5%) | 18 (22.5%) |
| Business & Financial | 13 (27.1%) | 35 (72.9%) |
| Computers, Engineering & Science | 23 (79.3%) | 6 (20.7%) |
| Computers & Mathematics | 0 (0.0%) | 6 (100.0%) |
| Architecture & Engineering | 23 (100.0%) | 0 (0.0%) |
| Life, Physical & Social Science | 0 (0.0%) | 0 (0.0%) |
| Community & Social Service | 58 (44.3%) | 73 (55.7%) |
| Education, Arts & Media | 0 (0.0%) | 11 (100.0%) |
| Legal Services & Support | 0 (0.0%) | 0 (0.0%) |
| Education Instruction & Library | 22 (26.2%) | 62 (73.8%) |
| Arts, Media & Entertainment | 36 (100.0%) | 0 (0.0%) |
| Health Diagnosing & Treating | 0 (0.0%) | 63 (100.0%) |
| Health Technologists | 0 (0.0%) | 44 (100.0%) |
| Total (Category) | 156 (44.4%) | 195 (55.6%) |
| Total (Overall) | 553 (43.7%) | 713 (56.3%) |
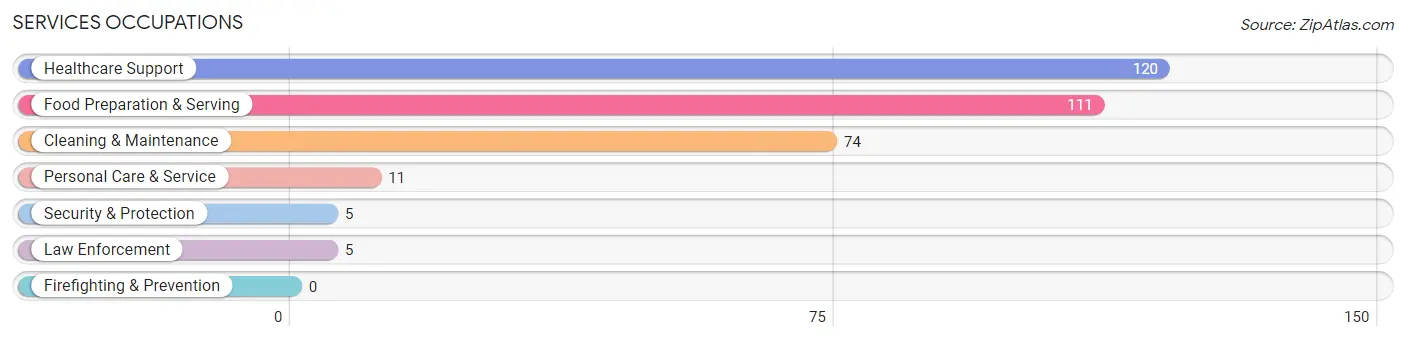
Services Occupations
The most common Services occupations in Pittsfield are Healthcare Support (120 | 9.5%), Food Preparation & Serving (111 | 8.8%), Cleaning & Maintenance (74 | 5.9%), Personal Care & Service (11 | 0.9%), and Security & Protection (5 | 0.4%).
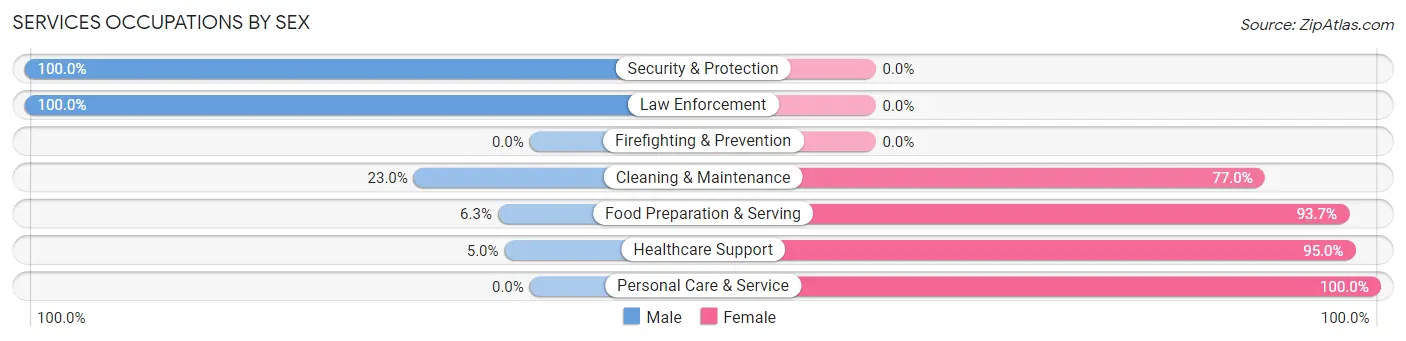
Services Occupations by Sex
Within the Services occupations in Pittsfield, the most male-oriented occupations are Security & Protection (100.0%), Law Enforcement (100.0%), and Cleaning & Maintenance (23.0%), while the most female-oriented occupations are Personal Care & Service (100.0%), Healthcare Support (95.0%), and Food Preparation & Serving (93.7%).
| Occupation | Male | Female |
| Healthcare Support | 6 (5.0%) | 114 (95.0%) |
| Security & Protection | 5 (100.0%) | 0 (0.0%) |
| Firefighting & Prevention | 0 (0.0%) | 0 (0.0%) |
| Law Enforcement | 5 (100.0%) | 0 (0.0%) |
| Food Preparation & Serving | 7 (6.3%) | 104 (93.7%) |
| Cleaning & Maintenance | 17 (23.0%) | 57 (77.0%) |
| Personal Care & Service | 0 (0.0%) | 11 (100.0%) |
| Total (Category) | 35 (10.9%) | 286 (89.1%) |
| Total (Overall) | 553 (43.7%) | 713 (56.3%) |
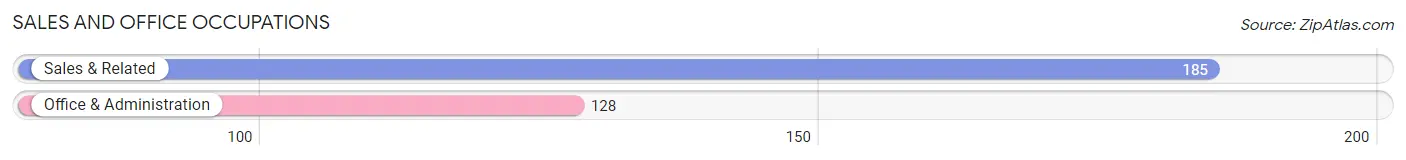
Sales and Office Occupations
The most common Sales and Office occupations in Pittsfield are Sales & Related (185 | 14.6%), and Office & Administration (128 | 10.1%).
Sales and Office Occupations by Sex
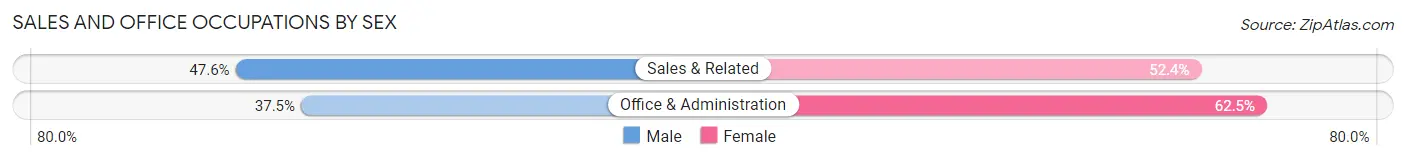
| Occupation | Male | Female |
| Sales & Related | 88 (47.6%) | 97 (52.4%) |
| Office & Administration | 48 (37.5%) | 80 (62.5%) |
| Total (Category) | 136 (43.4%) | 177 (56.6%) |
| Total (Overall) | 553 (43.7%) | 713 (56.3%) |
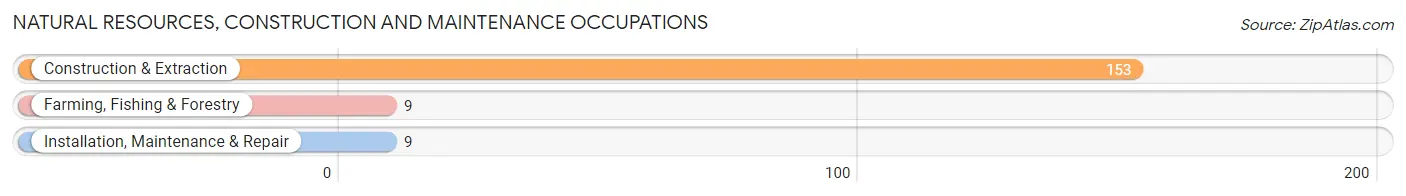
Natural Resources, Construction and Maintenance Occupations
The most common Natural Resources, Construction and Maintenance occupations in Pittsfield are Construction & Extraction (153 | 12.1%), Farming, Fishing & Forestry (9 | 0.7%), and Installation, Maintenance & Repair (9 | 0.7%).
Natural Resources, Construction and Maintenance Occupations by Sex
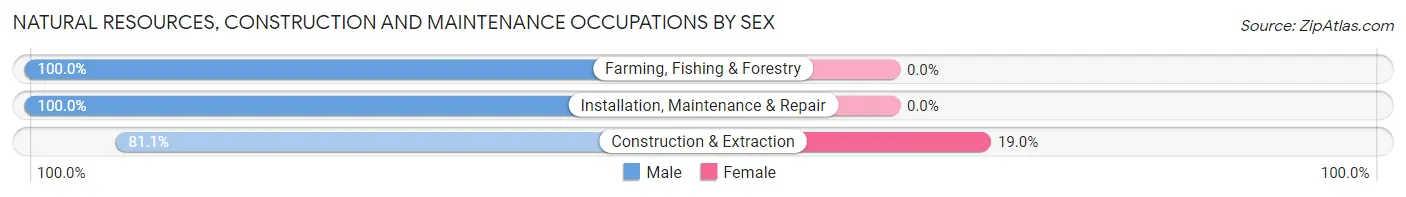
| Occupation | Male | Female |
| Farming, Fishing & Forestry | 9 (100.0%) | 0 (0.0%) |
| Construction & Extraction | 124 (81.0%) | 29 (19.0%) |
| Installation, Maintenance & Repair | 9 (100.0%) | 0 (0.0%) |
| Total (Category) | 142 (83.0%) | 29 (17.0%) |
| Total (Overall) | 553 (43.7%) | 713 (56.3%) |
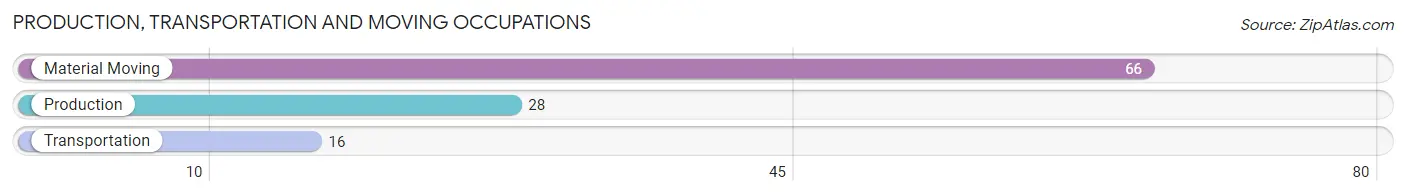
Production, Transportation and Moving Occupations
The most common Production, Transportation and Moving occupations in Pittsfield are Material Moving (66 | 5.2%), Production (28 | 2.2%), and Transportation (16 | 1.3%).
Production, Transportation and Moving Occupations by Sex
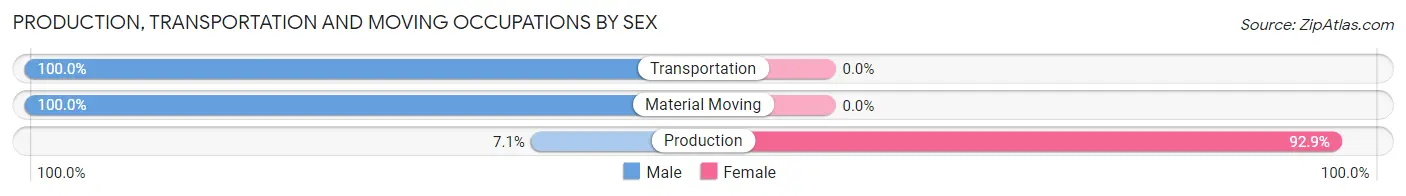
| Occupation | Male | Female |
| Production | 2 (7.1%) | 26 (92.9%) |
| Transportation | 16 (100.0%) | 0 (0.0%) |
| Material Moving | 66 (100.0%) | 0 (0.0%) |
| Total (Category) | 84 (76.4%) | 26 (23.6%) |
| Total (Overall) | 553 (43.7%) | 713 (56.3%) |
Employment Industries by Sex in Pittsfield
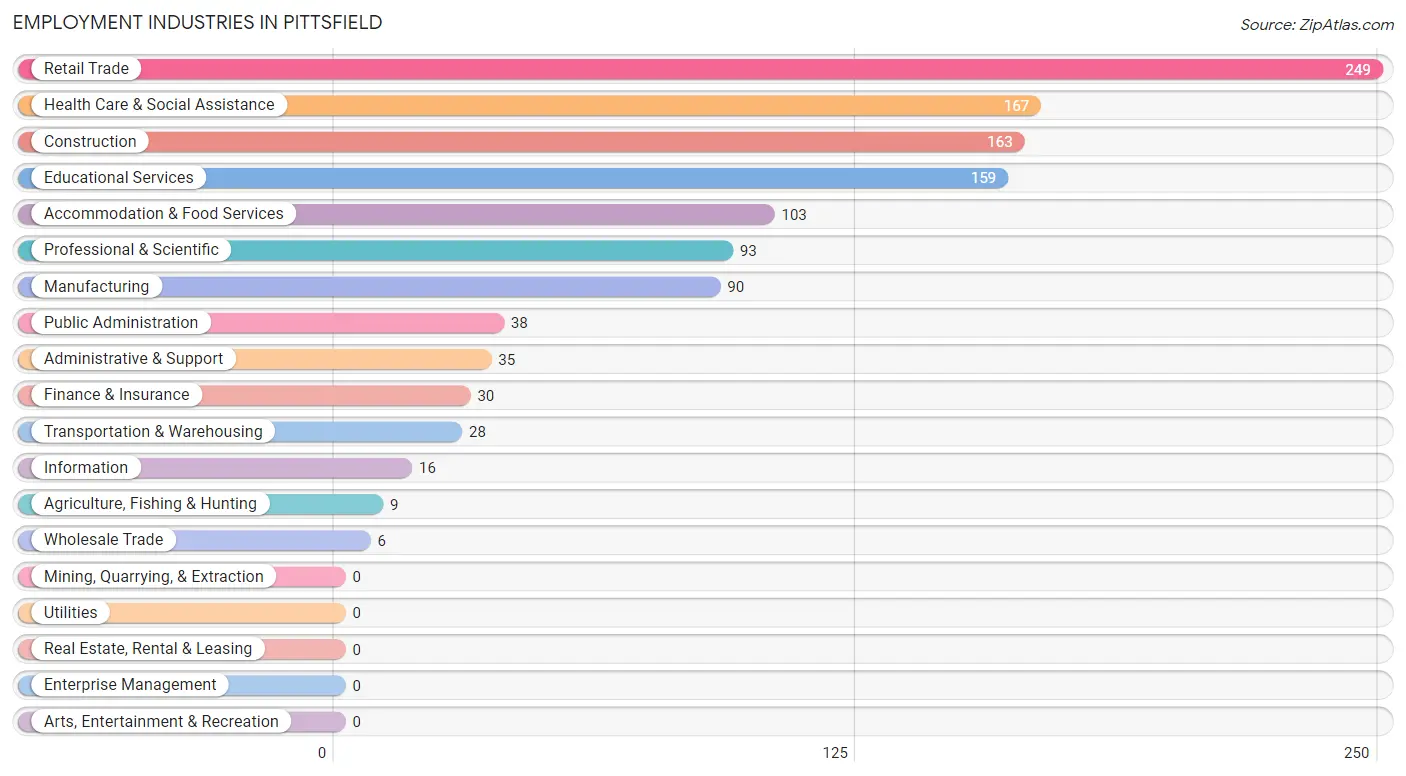
Employment Industries in Pittsfield
The major employment industries in Pittsfield include Retail Trade (249 | 19.7%), Health Care & Social Assistance (167 | 13.2%), Construction (163 | 12.9%), Educational Services (159 | 12.6%), and Accommodation & Food Services (103 | 8.1%).
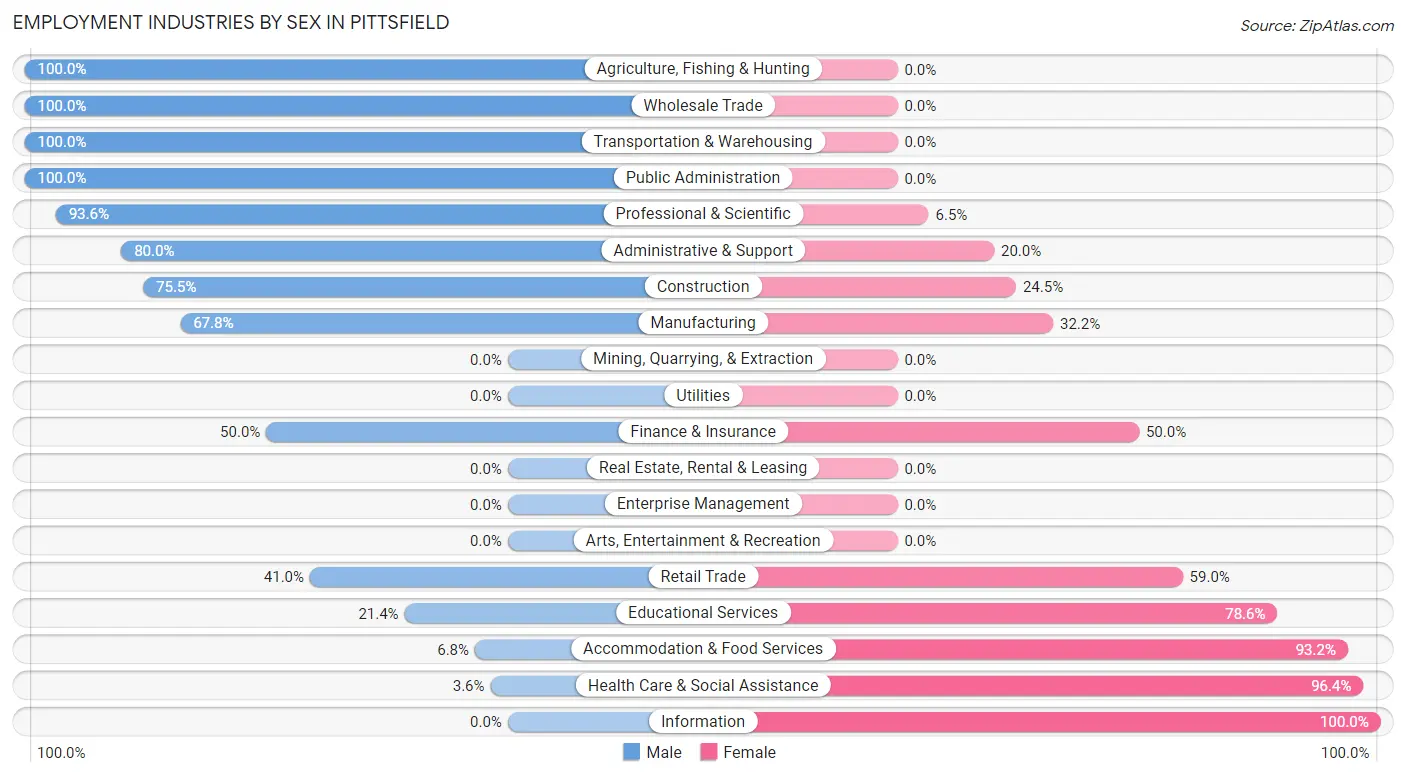
Employment Industries by Sex in Pittsfield
The Pittsfield industries that see more men than women are Agriculture, Fishing & Hunting (100.0%), Wholesale Trade (100.0%), and Transportation & Warehousing (100.0%), whereas the industries that tend to have a higher number of women are Information (100.0%), Health Care & Social Assistance (96.4%), and Accommodation & Food Services (93.2%).
| Industry | Male | Female |
| Agriculture, Fishing & Hunting | 9 (100.0%) | 0 (0.0%) |
| Mining, Quarrying, & Extraction | 0 (0.0%) | 0 (0.0%) |
| Construction | 123 (75.5%) | 40 (24.5%) |
| Manufacturing | 61 (67.8%) | 29 (32.2%) |
| Wholesale Trade | 6 (100.0%) | 0 (0.0%) |
| Retail Trade | 102 (41.0%) | 147 (59.0%) |
| Transportation & Warehousing | 28 (100.0%) | 0 (0.0%) |
| Utilities | 0 (0.0%) | 0 (0.0%) |
| Information | 0 (0.0%) | 16 (100.0%) |
| Finance & Insurance | 15 (50.0%) | 15 (50.0%) |
| Real Estate, Rental & Leasing | 0 (0.0%) | 0 (0.0%) |
| Professional & Scientific | 87 (93.5%) | 6 (6.5%) |
| Enterprise Management | 0 (0.0%) | 0 (0.0%) |
| Administrative & Support | 28 (80.0%) | 7 (20.0%) |
| Educational Services | 34 (21.4%) | 125 (78.6%) |
| Health Care & Social Assistance | 6 (3.6%) | 161 (96.4%) |
| Arts, Entertainment & Recreation | 0 (0.0%) | 0 (0.0%) |
| Accommodation & Food Services | 7 (6.8%) | 96 (93.2%) |
| Public Administration | 38 (100.0%) | 0 (0.0%) |
| Total | 553 (43.7%) | 713 (56.3%) |
Education in Pittsfield
School Enrollment in Pittsfield
The most common levels of schooling among the 915 students in Pittsfield are middle school (250 | 27.3%), college / undergraduate (180 | 19.7%), and elementary school (132 | 14.4%).
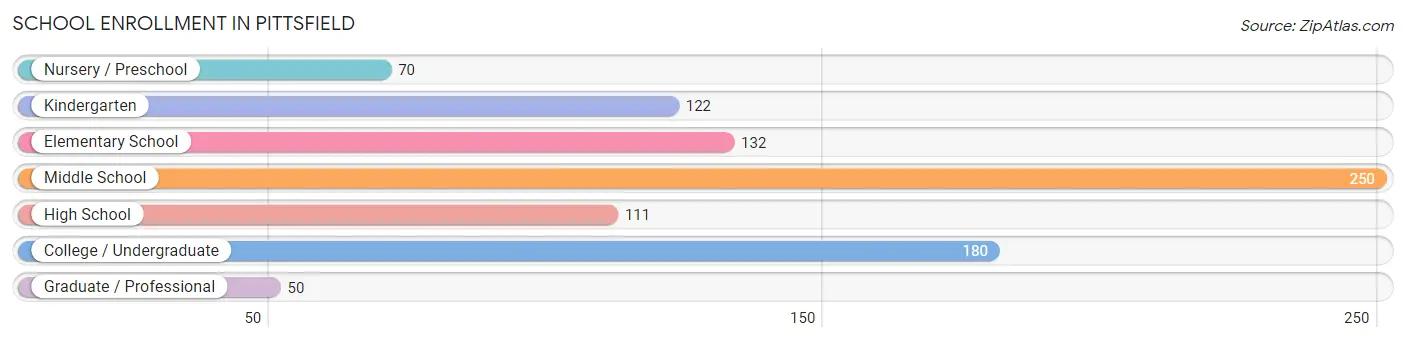
| School Level | # Students | % Students |
| Nursery / Preschool | 70 | 7.6% |
| Kindergarten | 122 | 13.3% |
| Elementary School | 132 | 14.4% |
| Middle School | 250 | 27.3% |
| High School | 111 | 12.1% |
| College / Undergraduate | 180 | 19.7% |
| Graduate / Professional | 50 | 5.5% |
| Total | 915 | 100.0% |
School Enrollment by Age by Funding Source in Pittsfield
Out of a total of 915 students who are enrolled in schools in Pittsfield, 70 (7.7%) attend a private institution, while the remaining 845 (92.3%) are enrolled in public schools. The age group of 20 to 24 year olds has the highest likelihood of being enrolled in private schools, with 16 (45.7% in the age bracket) enrolled. Conversely, the age group of 5 to 9 year old has the lowest likelihood of being enrolled in a private school, with 254 (100.0% in the age bracket) attending a public institution.
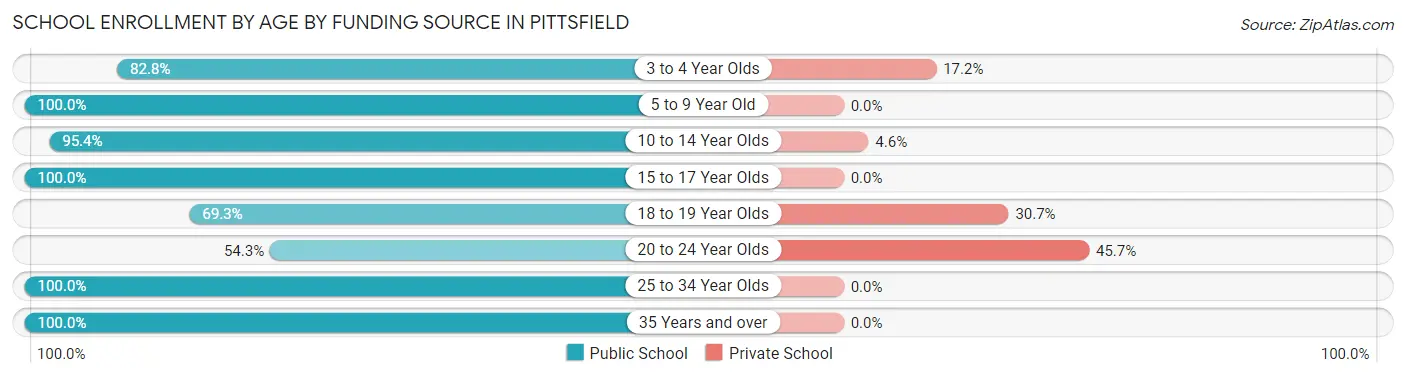
| Age Bracket | Public School | Private School |
| 3 to 4 Year Olds | 48 (82.8%) | 10 (17.2%) |
| 5 to 9 Year Old | 254 (100.0%) | 0 (0.0%) |
| 10 to 14 Year Olds | 269 (95.4%) | 13 (4.6%) |
| 15 to 17 Year Olds | 84 (100.0%) | 0 (0.0%) |
| 18 to 19 Year Olds | 70 (69.3%) | 31 (30.7%) |
| 20 to 24 Year Olds | 19 (54.3%) | 16 (45.7%) |
| 25 to 34 Year Olds | 91 (100.0%) | 0 (0.0%) |
| 35 Years and over | 10 (100.0%) | 0 (0.0%) |
| Total | 845 (92.3%) | 70 (7.7%) |
Educational Attainment by Field of Study in Pittsfield
Business (116 | 19.5%), engineering (92 | 15.5%), bio, nature & agricultural (84 | 14.1%), science & technology (57 | 9.6%), and education (50 | 8.4%) are the most common fields of study among 594 individuals in Pittsfield who have obtained a bachelor's degree or higher.
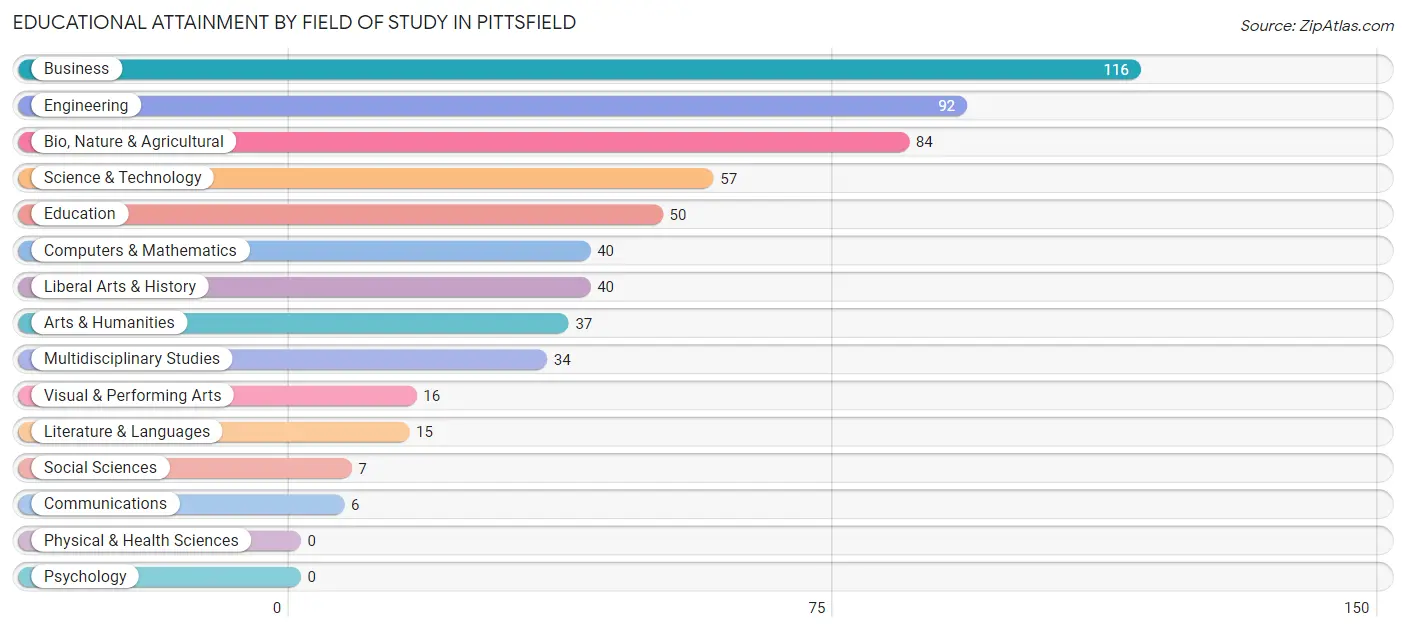
| Field of Study | # Graduates | % Graduates |
| Computers & Mathematics | 40 | 6.7% |
| Bio, Nature & Agricultural | 84 | 14.1% |
| Physical & Health Sciences | 0 | 0.0% |
| Psychology | 0 | 0.0% |
| Social Sciences | 7 | 1.2% |
| Engineering | 92 | 15.5% |
| Multidisciplinary Studies | 34 | 5.7% |
| Science & Technology | 57 | 9.6% |
| Business | 116 | 19.5% |
| Education | 50 | 8.4% |
| Literature & Languages | 15 | 2.5% |
| Liberal Arts & History | 40 | 6.7% |
| Visual & Performing Arts | 16 | 2.7% |
| Communications | 6 | 1.0% |
| Arts & Humanities | 37 | 6.2% |
| Total | 594 | 100.0% |
Transportation & Commute in Pittsfield
Vehicle Availability by Sex in Pittsfield
The most prevalent vehicle ownership categories in Pittsfield are males with 2 vehicles (280, accounting for 48.0%) and females with 2 vehicles (285, making up 41.7%).
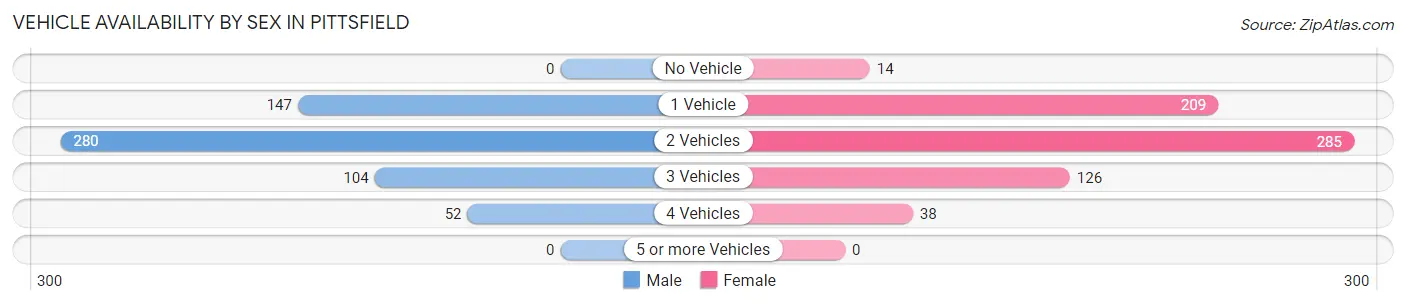
| Vehicles Available | Male | Female |
| No Vehicle | 0 (0.0%) | 14 (2.1%) |
| 1 Vehicle | 147 (25.2%) | 209 (31.1%) |
| 2 Vehicles | 280 (48.0%) | 285 (42.4%) |
| 3 Vehicles | 104 (17.8%) | 126 (18.8%) |
| 4 Vehicles | 52 (8.9%) | 38 (5.7%) |
| 5 or more Vehicles | 0 (0.0%) | 0 (0.0%) |
| Total | 583 (100.0%) | 672 (100.0%) |
Commute Time in Pittsfield
The most frequently occuring commute durations in Pittsfield are 5 to 9 minutes (170 commuters, 15.6%), 20 to 24 minutes (155 commuters, 14.2%), and 30 to 34 minutes (126 commuters, 11.6%).
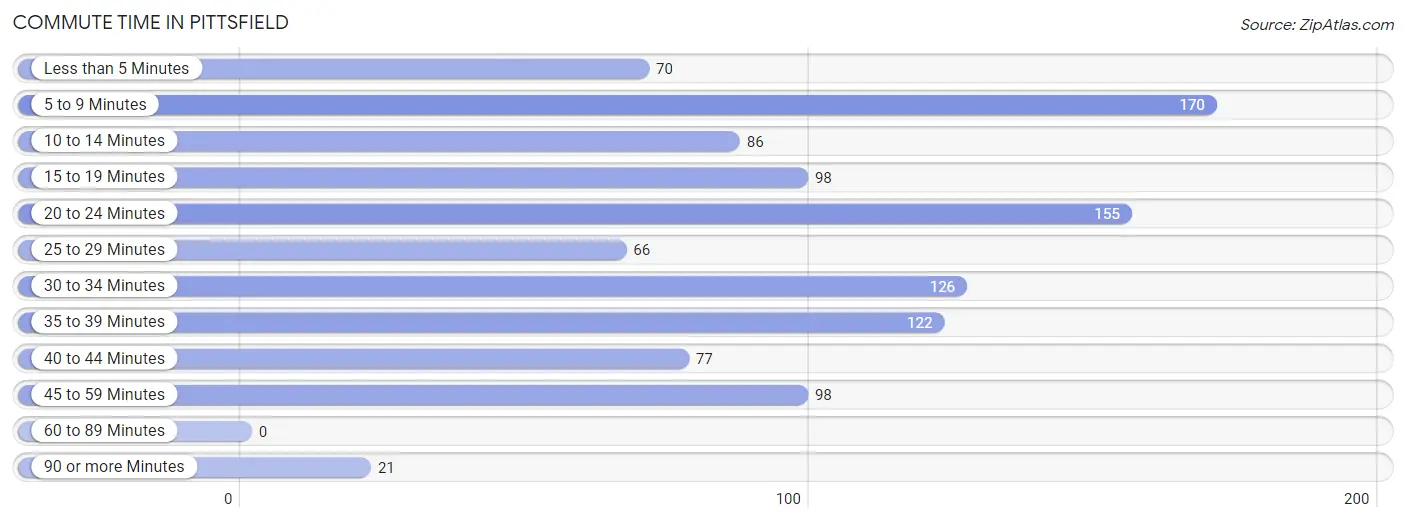
| Commute Time | # Commuters | % Commuters |
| Less than 5 Minutes | 70 | 6.4% |
| 5 to 9 Minutes | 170 | 15.6% |
| 10 to 14 Minutes | 86 | 7.9% |
| 15 to 19 Minutes | 98 | 9.0% |
| 20 to 24 Minutes | 155 | 14.2% |
| 25 to 29 Minutes | 66 | 6.1% |
| 30 to 34 Minutes | 126 | 11.6% |
| 35 to 39 Minutes | 122 | 11.2% |
| 40 to 44 Minutes | 77 | 7.1% |
| 45 to 59 Minutes | 98 | 9.0% |
| 60 to 89 Minutes | 0 | 0.0% |
| 90 or more Minutes | 21 | 1.9% |
Commute Time by Sex in Pittsfield
The most common commute times in Pittsfield are 5 to 9 minutes (87 commuters, 15.1%) for males and 20 to 24 minutes (108 commuters, 21.0%) for females.
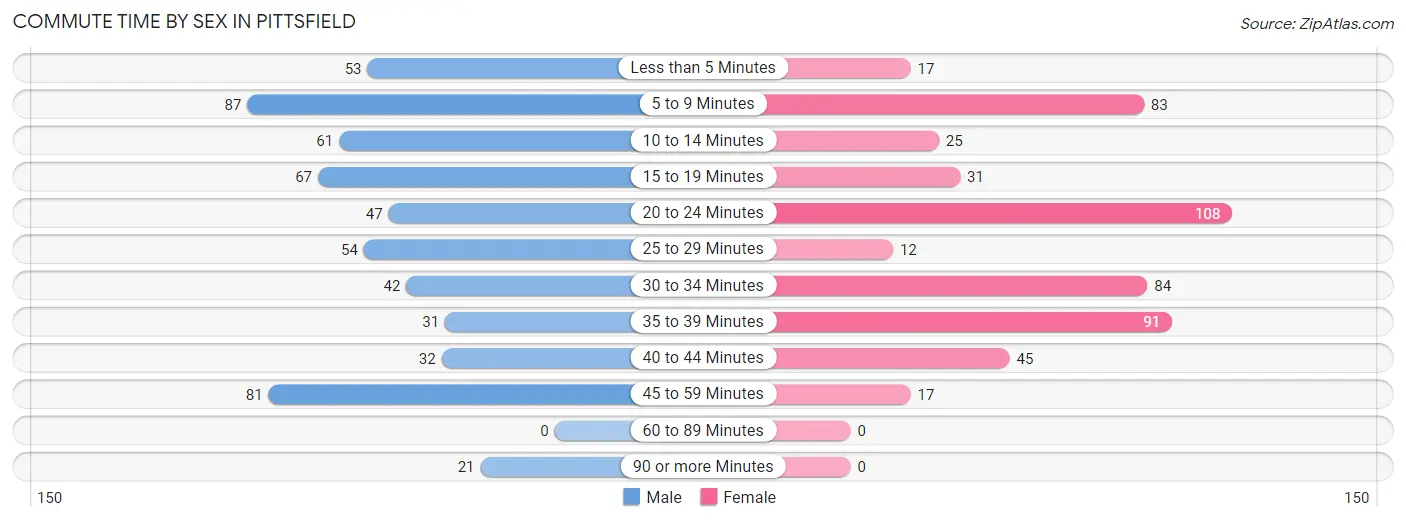
| Commute Time | Male | Female |
| Less than 5 Minutes | 53 (9.2%) | 17 (3.3%) |
| 5 to 9 Minutes | 87 (15.1%) | 83 (16.2%) |
| 10 to 14 Minutes | 61 (10.6%) | 25 (4.9%) |
| 15 to 19 Minutes | 67 (11.6%) | 31 (6.0%) |
| 20 to 24 Minutes | 47 (8.2%) | 108 (21.0%) |
| 25 to 29 Minutes | 54 (9.4%) | 12 (2.3%) |
| 30 to 34 Minutes | 42 (7.3%) | 84 (16.4%) |
| 35 to 39 Minutes | 31 (5.4%) | 91 (17.7%) |
| 40 to 44 Minutes | 32 (5.6%) | 45 (8.8%) |
| 45 to 59 Minutes | 81 (14.1%) | 17 (3.3%) |
| 60 to 89 Minutes | 0 (0.0%) | 0 (0.0%) |
| 90 or more Minutes | 21 (3.6%) | 0 (0.0%) |
Time of Departure to Work by Sex in Pittsfield
The most frequent times of departure to work in Pittsfield are 6:30 AM to 6:59 AM (154, 26.7%) for males and 7:00 AM to 7:29 AM (139, 27.1%) for females.
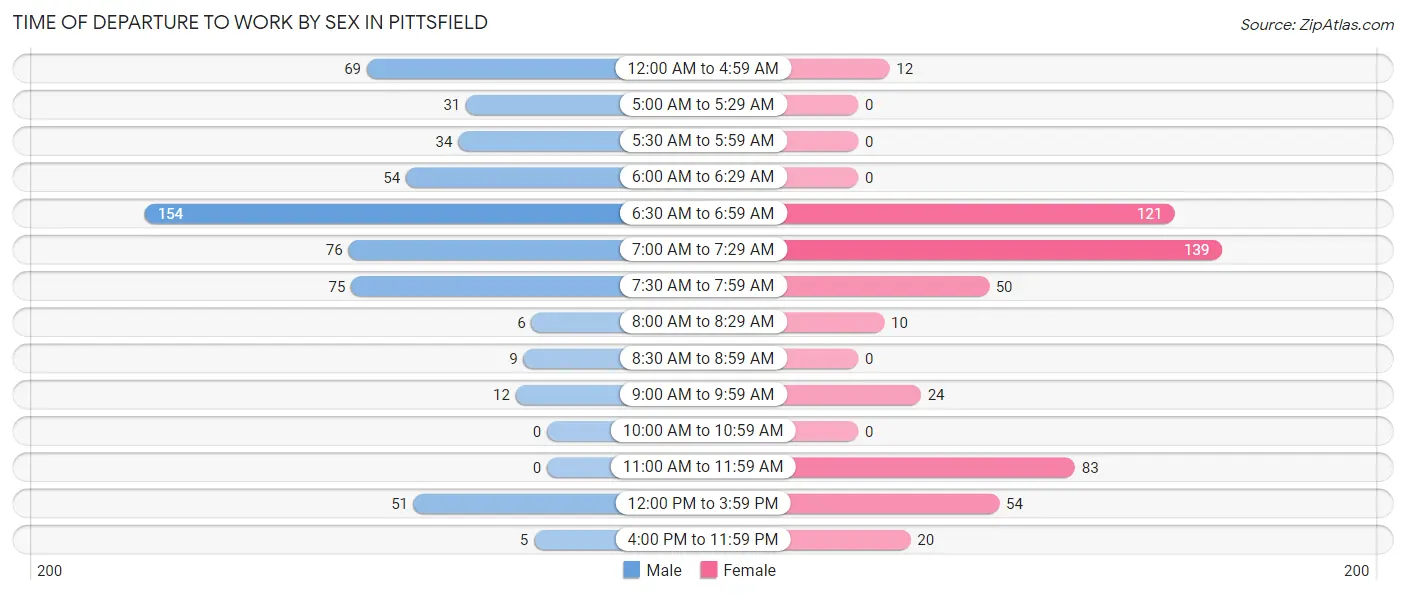
| Time of Departure | Male | Female |
| 12:00 AM to 4:59 AM | 69 (12.0%) | 12 (2.3%) |
| 5:00 AM to 5:29 AM | 31 (5.4%) | 0 (0.0%) |
| 5:30 AM to 5:59 AM | 34 (5.9%) | 0 (0.0%) |
| 6:00 AM to 6:29 AM | 54 (9.4%) | 0 (0.0%) |
| 6:30 AM to 6:59 AM | 154 (26.7%) | 121 (23.6%) |
| 7:00 AM to 7:29 AM | 76 (13.2%) | 139 (27.1%) |
| 7:30 AM to 7:59 AM | 75 (13.0%) | 50 (9.8%) |
| 8:00 AM to 8:29 AM | 6 (1.0%) | 10 (1.9%) |
| 8:30 AM to 8:59 AM | 9 (1.6%) | 0 (0.0%) |
| 9:00 AM to 9:59 AM | 12 (2.1%) | 24 (4.7%) |
| 10:00 AM to 10:59 AM | 0 (0.0%) | 0 (0.0%) |
| 11:00 AM to 11:59 AM | 0 (0.0%) | 83 (16.2%) |
| 12:00 PM to 3:59 PM | 51 (8.8%) | 54 (10.5%) |
| 4:00 PM to 11:59 PM | 5 (0.9%) | 20 (3.9%) |
| Total | 576 (100.0%) | 513 (100.0%) |
Housing Occupancy in Pittsfield
Occupancy by Ownership in Pittsfield
Of the total 1,242 dwellings in Pittsfield, owner-occupied units account for 804 (64.7%), while renter-occupied units make up 438 (35.3%).
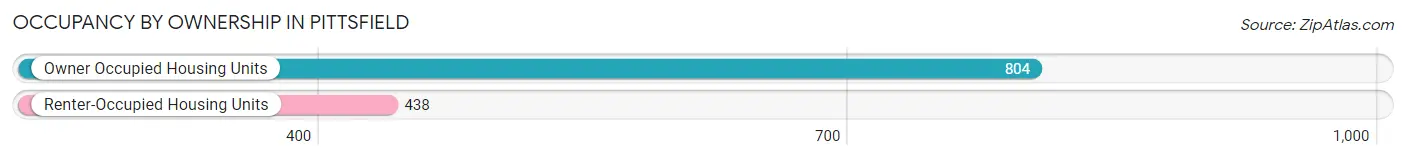
| Occupancy | # Housing Units | % Housing Units |
| Owner Occupied Housing Units | 804 | 64.7% |
| Renter-Occupied Housing Units | 438 | 35.3% |
| Total Occupied Housing Units | 1,242 | 100.0% |
Occupancy by Household Size in Pittsfield
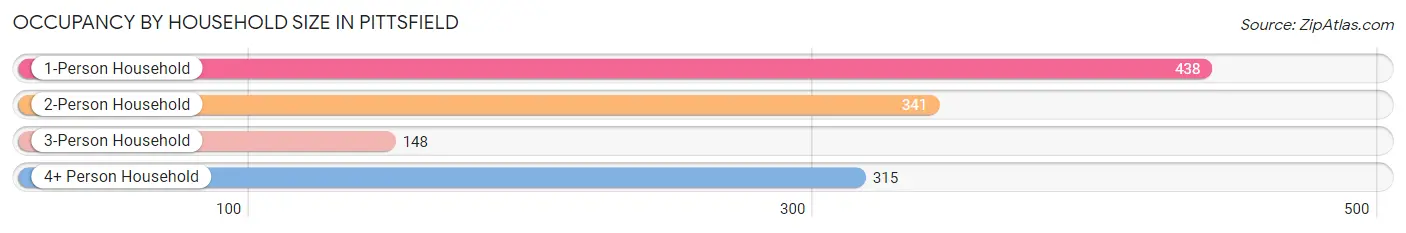
| Household Size | # Housing Units | % Housing Units |
| 1-Person Household | 438 | 35.3% |
| 2-Person Household | 341 | 27.5% |
| 3-Person Household | 148 | 11.9% |
| 4+ Person Household | 315 | 25.4% |
| Total Housing Units | 1,242 | 100.0% |
Occupancy by Ownership by Household Size in Pittsfield
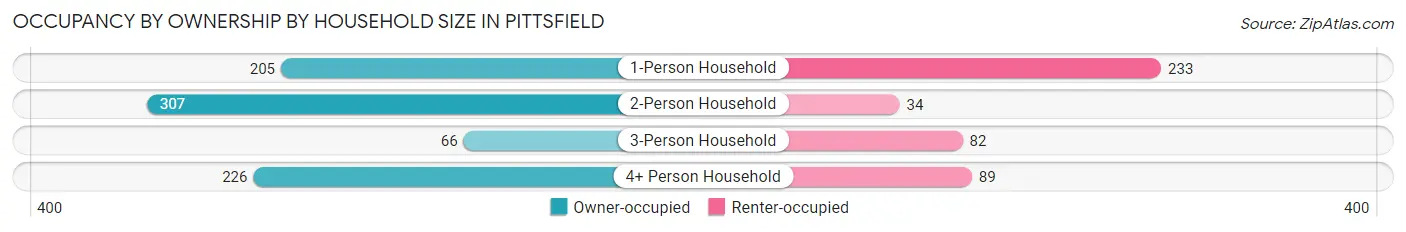
| Household Size | Owner-occupied | Renter-occupied |
| 1-Person Household | 205 (46.8%) | 233 (53.2%) |
| 2-Person Household | 307 (90.0%) | 34 (10.0%) |
| 3-Person Household | 66 (44.6%) | 82 (55.4%) |
| 4+ Person Household | 226 (71.8%) | 89 (28.2%) |
| Total Housing Units | 804 (64.7%) | 438 (35.3%) |
Occupancy by Educational Attainment in Pittsfield
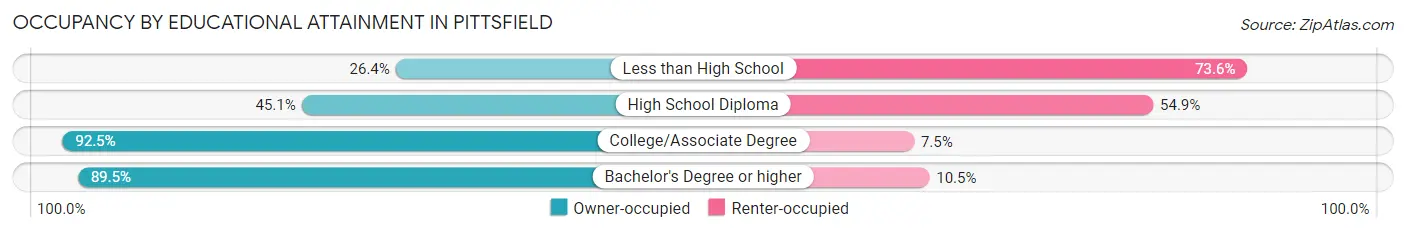
| Household Size | Owner-occupied | Renter-occupied |
| Less than High School | 46 (26.4%) | 128 (73.6%) |
| High School Diploma | 211 (45.1%) | 257 (54.9%) |
| College/Associate Degree | 309 (92.5%) | 25 (7.5%) |
| Bachelor's Degree or higher | 238 (89.5%) | 28 (10.5%) |
Occupancy by Age of Householder in Pittsfield
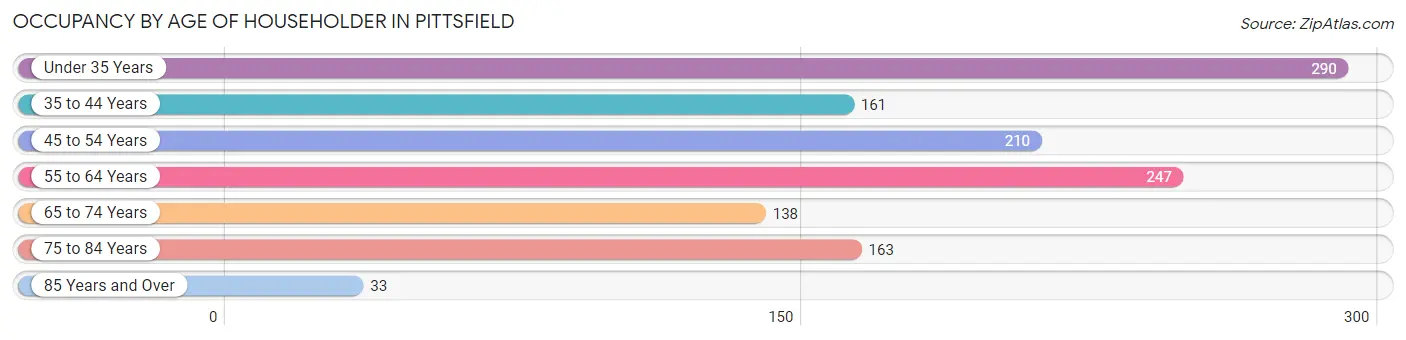
| Age Bracket | # Households | % Households |
| Under 35 Years | 290 | 23.4% |
| 35 to 44 Years | 161 | 13.0% |
| 45 to 54 Years | 210 | 16.9% |
| 55 to 64 Years | 247 | 19.9% |
| 65 to 74 Years | 138 | 11.1% |
| 75 to 84 Years | 163 | 13.1% |
| 85 Years and Over | 33 | 2.7% |
| Total | 1,242 | 100.0% |
Housing Finances in Pittsfield
Median Income by Occupancy in Pittsfield
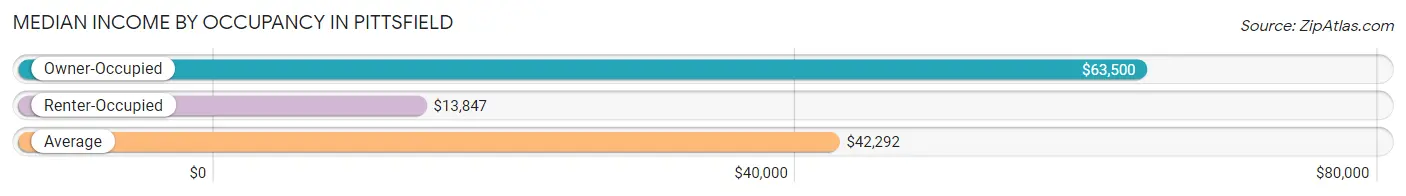
| Occupancy Type | # Households | Median Income |
| Owner-Occupied | 804 (64.7%) | $63,500 |
| Renter-Occupied | 438 (35.3%) | $13,847 |
| Average | 1,242 (100.0%) | $42,292 |
Occupancy by Householder Income Bracket in Pittsfield
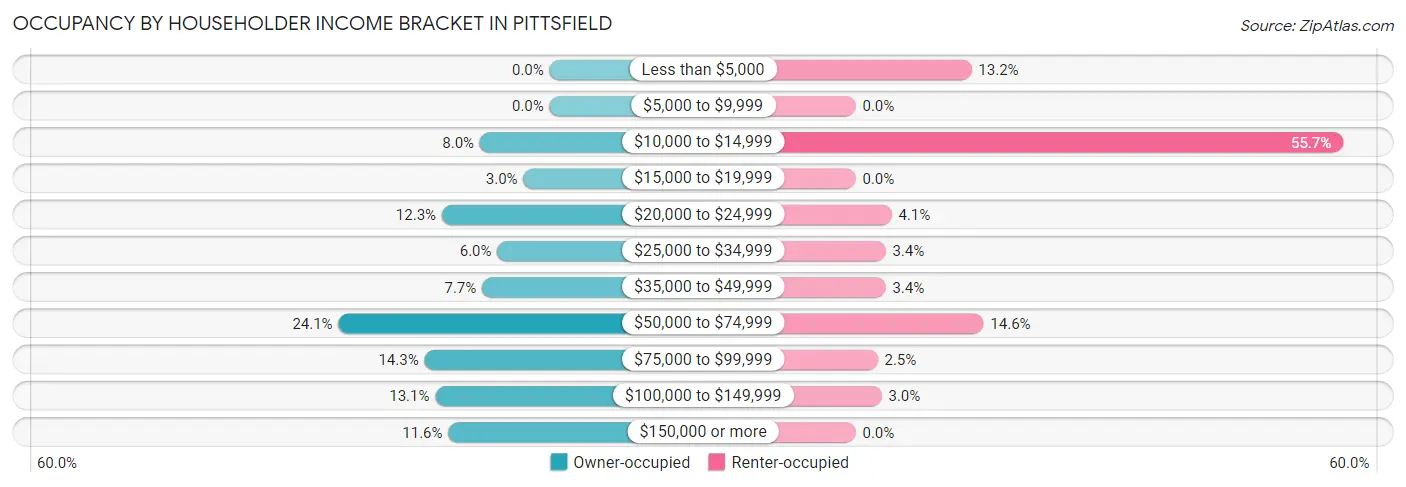
| Income Bracket | Owner-occupied | Renter-occupied |
| Less than $5,000 | 0 (0.0%) | 58 (13.2%) |
| $5,000 to $9,999 | 0 (0.0%) | 0 (0.0%) |
| $10,000 to $14,999 | 64 (8.0%) | 244 (55.7%) |
| $15,000 to $19,999 | 24 (3.0%) | 0 (0.0%) |
| $20,000 to $24,999 | 99 (12.3%) | 18 (4.1%) |
| $25,000 to $34,999 | 48 (6.0%) | 15 (3.4%) |
| $35,000 to $49,999 | 62 (7.7%) | 15 (3.4%) |
| $50,000 to $74,999 | 194 (24.1%) | 64 (14.6%) |
| $75,000 to $99,999 | 115 (14.3%) | 11 (2.5%) |
| $100,000 to $149,999 | 105 (13.1%) | 13 (3.0%) |
| $150,000 or more | 93 (11.6%) | 0 (0.0%) |
| Total | 804 (100.0%) | 438 (100.0%) |
Monthly Housing Cost Tiers in Pittsfield
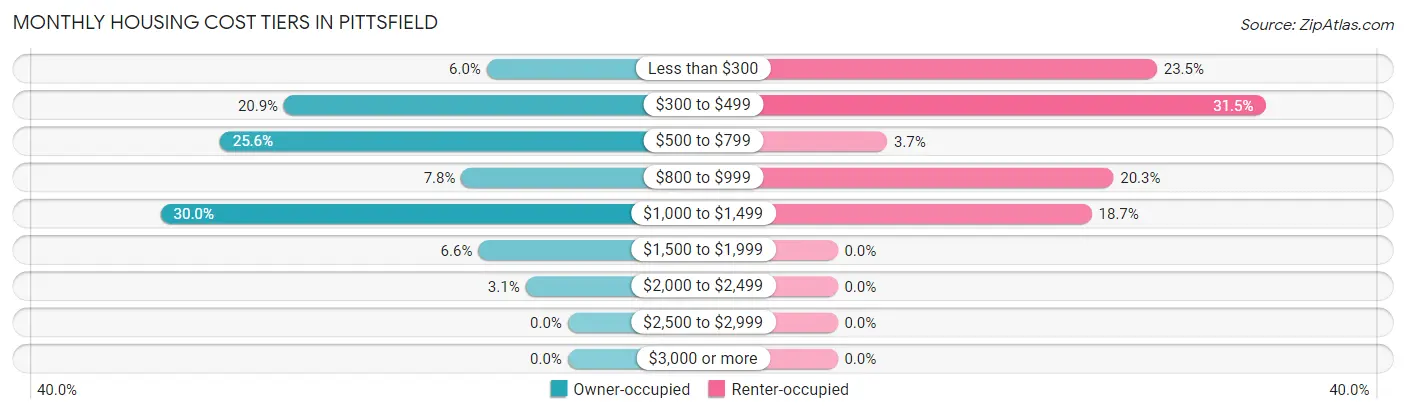
| Monthly Cost | Owner-occupied | Renter-occupied |
| Less than $300 | 48 (6.0%) | 103 (23.5%) |
| $300 to $499 | 168 (20.9%) | 138 (31.5%) |
| $500 to $799 | 206 (25.6%) | 16 (3.6%) |
| $800 to $999 | 63 (7.8%) | 89 (20.3%) |
| $1,000 to $1,499 | 241 (30.0%) | 82 (18.7%) |
| $1,500 to $1,999 | 53 (6.6%) | 0 (0.0%) |
| $2,000 to $2,499 | 25 (3.1%) | 0 (0.0%) |
| $2,500 to $2,999 | 0 (0.0%) | 0 (0.0%) |
| $3,000 or more | 0 (0.0%) | 0 (0.0%) |
| Total | 804 (100.0%) | 438 (100.0%) |
Physical Housing Characteristics in Pittsfield
Housing Structures in Pittsfield
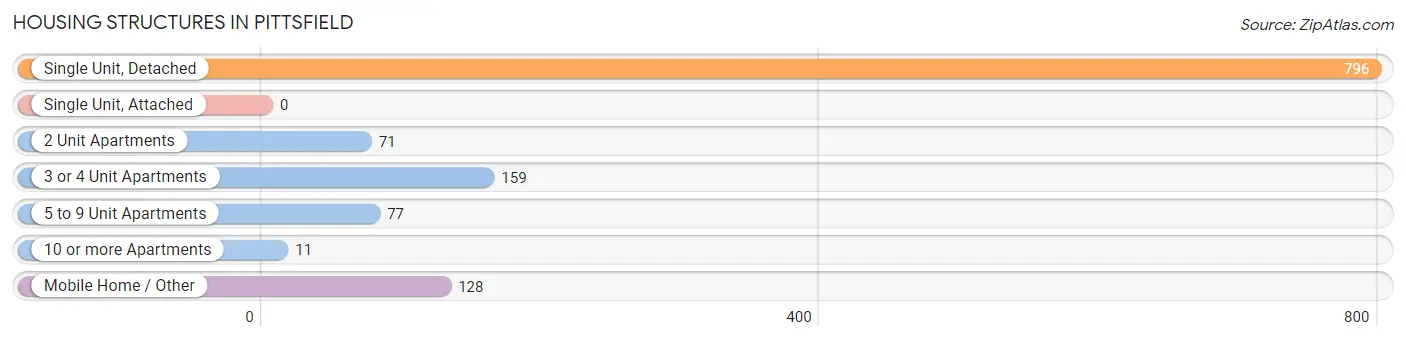
| Structure Type | # Housing Units | % Housing Units |
| Single Unit, Detached | 796 | 64.1% |
| Single Unit, Attached | 0 | 0.0% |
| 2 Unit Apartments | 71 | 5.7% |
| 3 or 4 Unit Apartments | 159 | 12.8% |
| 5 to 9 Unit Apartments | 77 | 6.2% |
| 10 or more Apartments | 11 | 0.9% |
| Mobile Home / Other | 128 | 10.3% |
| Total | 1,242 | 100.0% |
Housing Structures by Occupancy in Pittsfield
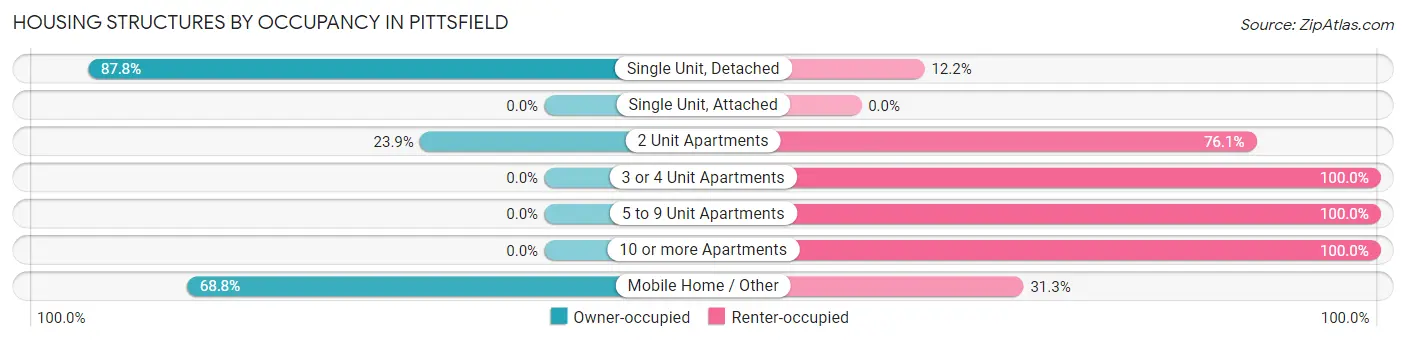
| Structure Type | Owner-occupied | Renter-occupied |
| Single Unit, Detached | 699 (87.8%) | 97 (12.2%) |
| Single Unit, Attached | 0 (0.0%) | 0 (0.0%) |
| 2 Unit Apartments | 17 (23.9%) | 54 (76.1%) |
| 3 or 4 Unit Apartments | 0 (0.0%) | 159 (100.0%) |
| 5 to 9 Unit Apartments | 0 (0.0%) | 77 (100.0%) |
| 10 or more Apartments | 0 (0.0%) | 11 (100.0%) |
| Mobile Home / Other | 88 (68.8%) | 40 (31.2%) |
| Total | 804 (64.7%) | 438 (35.3%) |
Housing Structures by Number of Rooms in Pittsfield
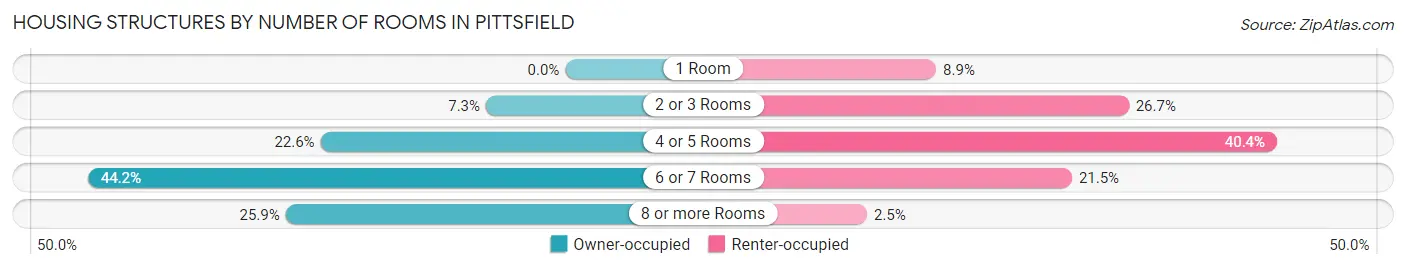
| Number of Rooms | Owner-occupied | Renter-occupied |
| 1 Room | 0 (0.0%) | 39 (8.9%) |
| 2 or 3 Rooms | 59 (7.3%) | 117 (26.7%) |
| 4 or 5 Rooms | 182 (22.6%) | 177 (40.4%) |
| 6 or 7 Rooms | 355 (44.2%) | 94 (21.5%) |
| 8 or more Rooms | 208 (25.9%) | 11 (2.5%) |
| Total | 804 (100.0%) | 438 (100.0%) |
Housing Structure by Heating Type in Pittsfield
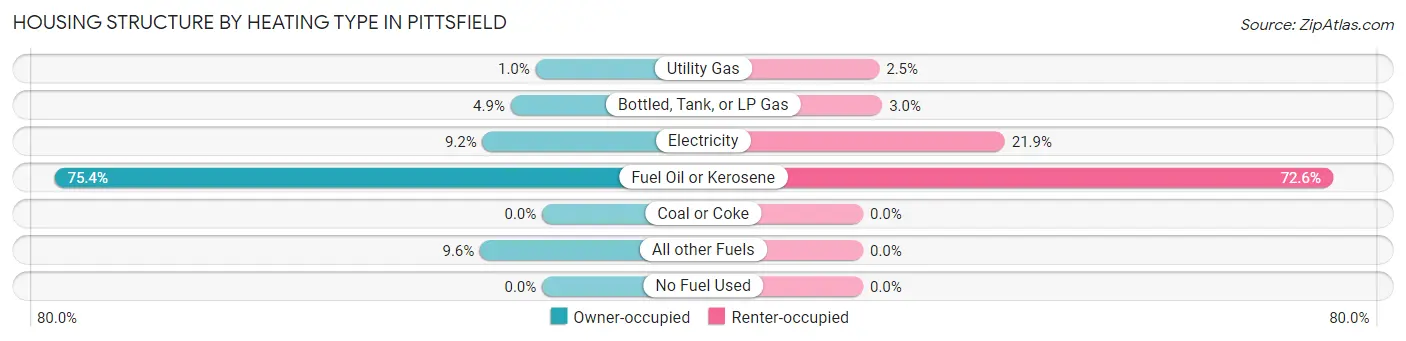
| Heating Type | Owner-occupied | Renter-occupied |
| Utility Gas | 8 (1.0%) | 11 (2.5%) |
| Bottled, Tank, or LP Gas | 39 (4.9%) | 13 (3.0%) |
| Electricity | 74 (9.2%) | 96 (21.9%) |
| Fuel Oil or Kerosene | 606 (75.4%) | 318 (72.6%) |
| Coal or Coke | 0 (0.0%) | 0 (0.0%) |
| All other Fuels | 77 (9.6%) | 0 (0.0%) |
| No Fuel Used | 0 (0.0%) | 0 (0.0%) |
| Total | 804 (100.0%) | 438 (100.0%) |
Household Vehicle Usage in Pittsfield
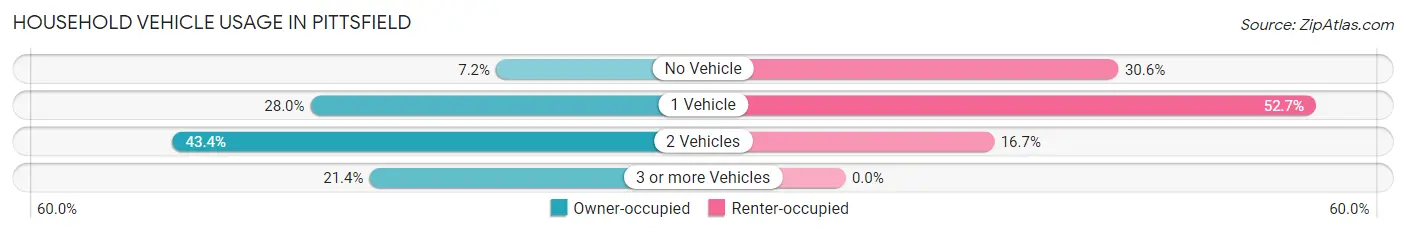
| Vehicles per Household | Owner-occupied | Renter-occupied |
| No Vehicle | 58 (7.2%) | 134 (30.6%) |
| 1 Vehicle | 225 (28.0%) | 231 (52.7%) |
| 2 Vehicles | 349 (43.4%) | 73 (16.7%) |
| 3 or more Vehicles | 172 (21.4%) | 0 (0.0%) |
| Total | 804 (100.0%) | 438 (100.0%) |
Real Estate & Mortgages in Pittsfield
Real Estate and Mortgage Overview in Pittsfield
| Characteristic | Without Mortgage | With Mortgage |
| Housing Units | 335 | 469 |
| Median Property Value | $120,300 | $137,800 |
| Median Household Income | $56,660 | $67 |
| Monthly Housing Costs | $463 | $0 |
| Real Estate Taxes | $1,640 | $24 |
Property Value by Mortgage Status in Pittsfield
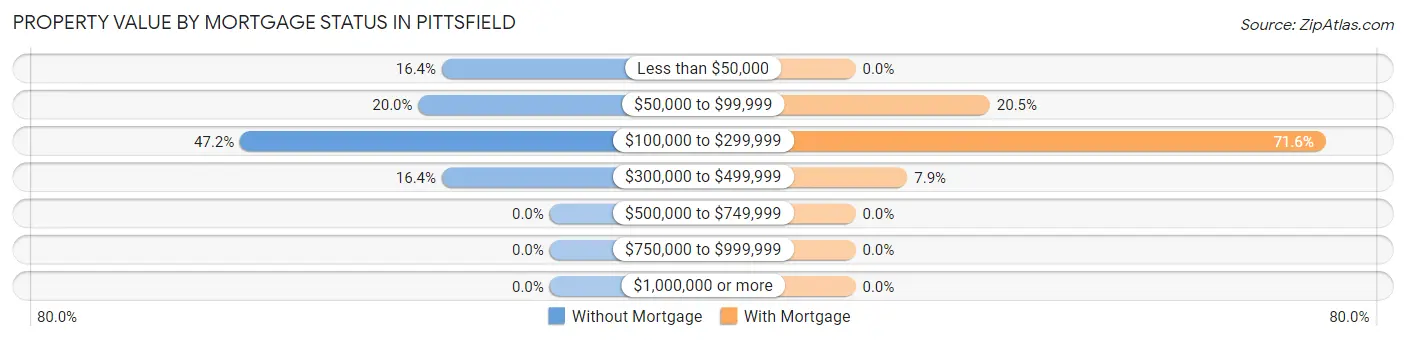
| Property Value | Without Mortgage | With Mortgage |
| Less than $50,000 | 55 (16.4%) | 0 (0.0%) |
| $50,000 to $99,999 | 67 (20.0%) | 96 (20.5%) |
| $100,000 to $299,999 | 158 (47.2%) | 336 (71.6%) |
| $300,000 to $499,999 | 55 (16.4%) | 37 (7.9%) |
| $500,000 to $749,999 | 0 (0.0%) | 0 (0.0%) |
| $750,000 to $999,999 | 0 (0.0%) | 0 (0.0%) |
| $1,000,000 or more | 0 (0.0%) | 0 (0.0%) |
| Total | 335 (100.0%) | 469 (100.0%) |
Household Income by Mortgage Status in Pittsfield
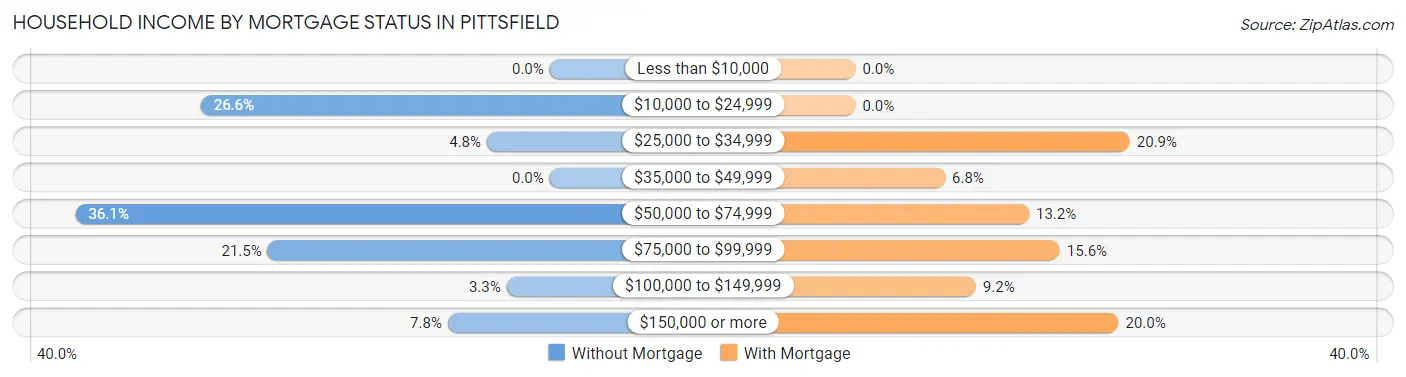
| Household Income | Without Mortgage | With Mortgage |
| Less than $10,000 | 0 (0.0%) | 0 (0.0%) |
| $10,000 to $24,999 | 89 (26.6%) | 0 (0.0%) |
| $25,000 to $34,999 | 16 (4.8%) | 98 (20.9%) |
| $35,000 to $49,999 | 0 (0.0%) | 32 (6.8%) |
| $50,000 to $74,999 | 121 (36.1%) | 62 (13.2%) |
| $75,000 to $99,999 | 72 (21.5%) | 73 (15.6%) |
| $100,000 to $149,999 | 11 (3.3%) | 43 (9.2%) |
| $150,000 or more | 26 (7.8%) | 94 (20.0%) |
| Total | 335 (100.0%) | 469 (100.0%) |
Property Value to Household Income Ratio in Pittsfield
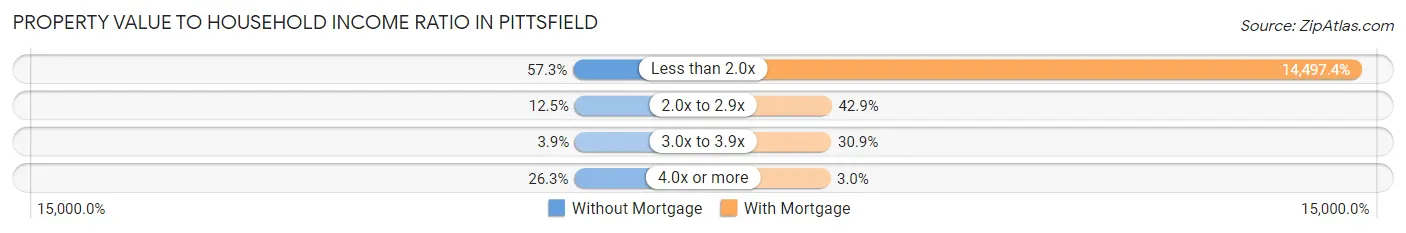
| Value-to-Income Ratio | Without Mortgage | With Mortgage |
| Less than 2.0x | 192 (57.3%) | 67,993 (14,497.4%) |
| 2.0x to 2.9x | 42 (12.5%) | 201 (42.9%) |
| 3.0x to 3.9x | 13 (3.9%) | 145 (30.9%) |
| 4.0x or more | 88 (26.3%) | 14 (3.0%) |
| Total | 335 (100.0%) | 469 (100.0%) |
Real Estate Taxes by Mortgage Status in Pittsfield
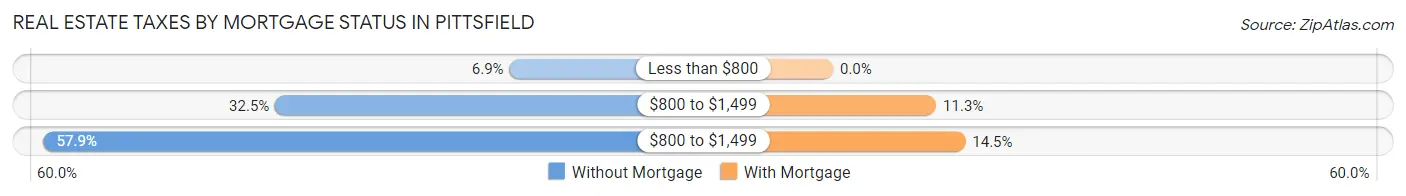
| Property Taxes | Without Mortgage | With Mortgage |
| Less than $800 | 23 (6.9%) | 0 (0.0%) |
| $800 to $1,499 | 109 (32.5%) | 53 (11.3%) |
| $800 to $1,499 | 194 (57.9%) | 68 (14.5%) |
| Total | 335 (100.0%) | 469 (100.0%) |
Health & Disability in Pittsfield
Health Insurance Coverage by Age in Pittsfield
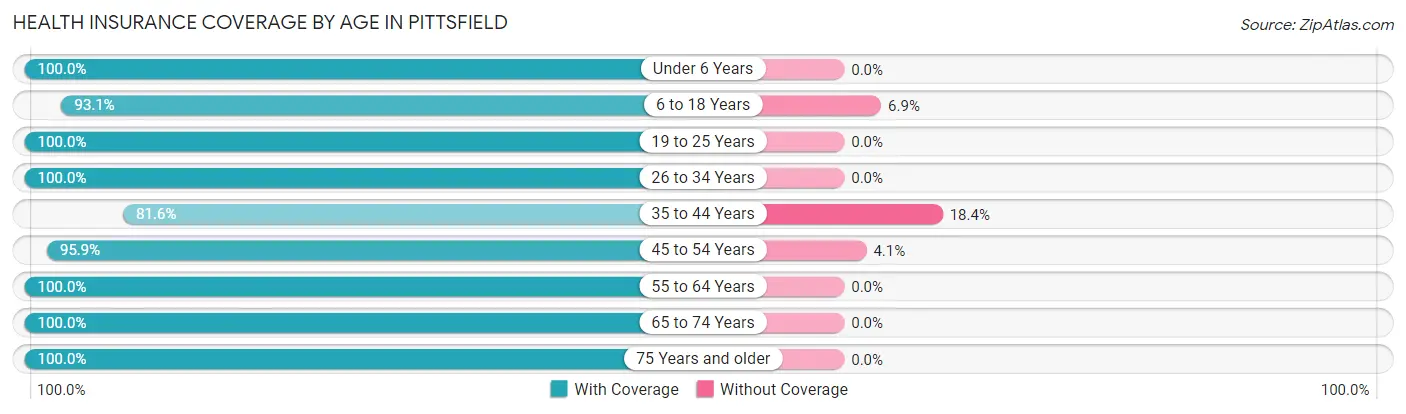
| Age Bracket | With Coverage | Without Coverage |
| Under 6 Years | 291 (100.0%) | 0 (0.0%) |
| 6 to 18 Years | 569 (93.1%) | 42 (6.9%) |
| 19 to 25 Years | 151 (100.0%) | 0 (0.0%) |
| 26 to 34 Years | 514 (100.0%) | 0 (0.0%) |
| 35 to 44 Years | 249 (81.6%) | 56 (18.4%) |
| 45 to 54 Years | 324 (95.9%) | 14 (4.1%) |
| 55 to 64 Years | 326 (100.0%) | 0 (0.0%) |
| 65 to 74 Years | 248 (100.0%) | 0 (0.0%) |
| 75 Years and older | 283 (100.0%) | 0 (0.0%) |
| Total | 2,955 (96.4%) | 112 (3.6%) |
Health Insurance Coverage by Citizenship Status in Pittsfield
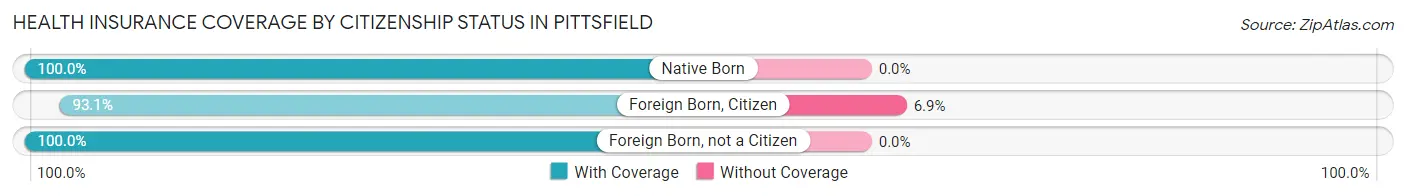
| Citizenship Status | With Coverage | Without Coverage |
| Native Born | 291 (100.0%) | 0 (0.0%) |
| Foreign Born, Citizen | 569 (93.1%) | 42 (6.9%) |
| Foreign Born, not a Citizen | 151 (100.0%) | 0 (0.0%) |
Health Insurance Coverage by Household Income in Pittsfield
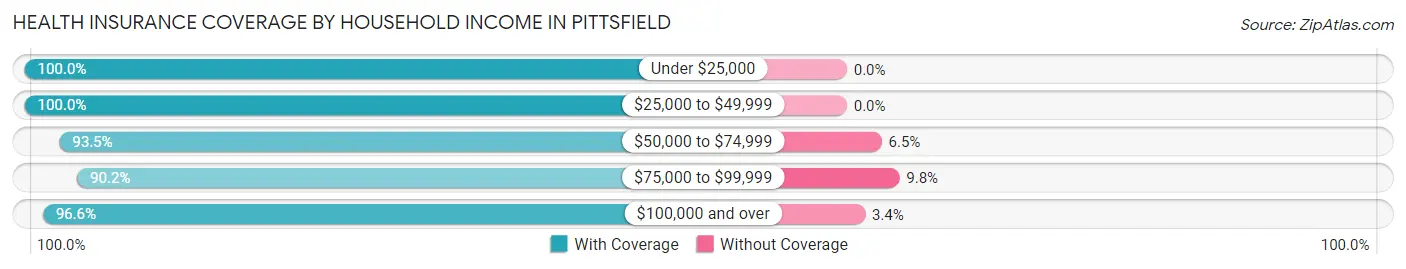
| Household Income | With Coverage | Without Coverage |
| Under $25,000 | 856 (100.0%) | 0 (0.0%) |
| $25,000 to $49,999 | 341 (100.0%) | 0 (0.0%) |
| $50,000 to $74,999 | 659 (93.5%) | 46 (6.5%) |
| $75,000 to $99,999 | 385 (90.2%) | 42 (9.8%) |
| $100,000 and over | 654 (96.6%) | 23 (3.4%) |
Public vs Private Health Insurance Coverage by Age in Pittsfield
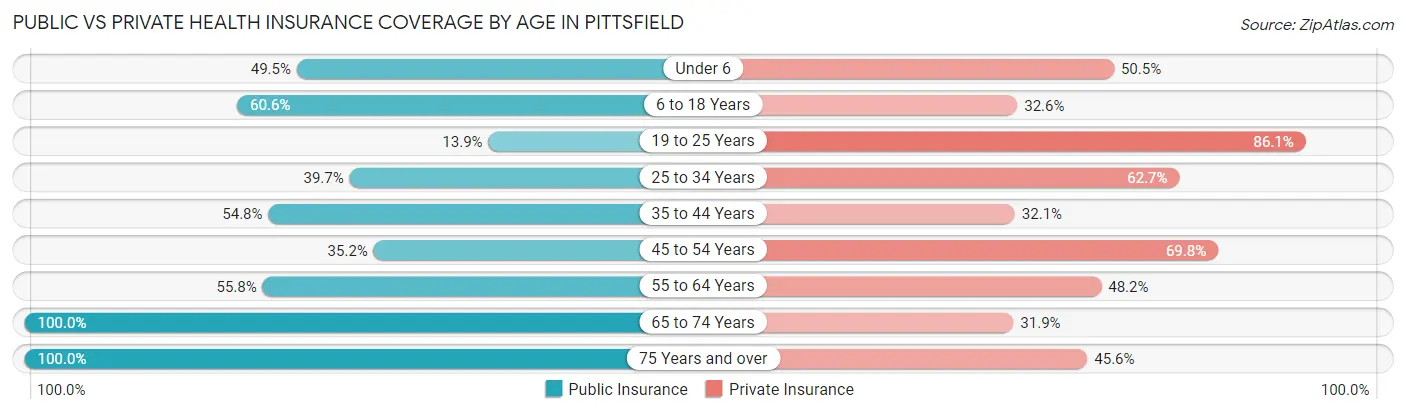
| Age Bracket | Public Insurance | Private Insurance |
| Under 6 | 144 (49.5%) | 147 (50.5%) |
| 6 to 18 Years | 370 (60.6%) | 199 (32.6%) |
| 19 to 25 Years | 21 (13.9%) | 130 (86.1%) |
| 25 to 34 Years | 204 (39.7%) | 322 (62.6%) |
| 35 to 44 Years | 167 (54.7%) | 98 (32.1%) |
| 45 to 54 Years | 119 (35.2%) | 236 (69.8%) |
| 55 to 64 Years | 182 (55.8%) | 157 (48.2%) |
| 65 to 74 Years | 248 (100.0%) | 79 (31.9%) |
| 75 Years and over | 283 (100.0%) | 129 (45.6%) |
| Total | 1,738 (56.7%) | 1,497 (48.8%) |
Disability Status by Sex by Age in Pittsfield
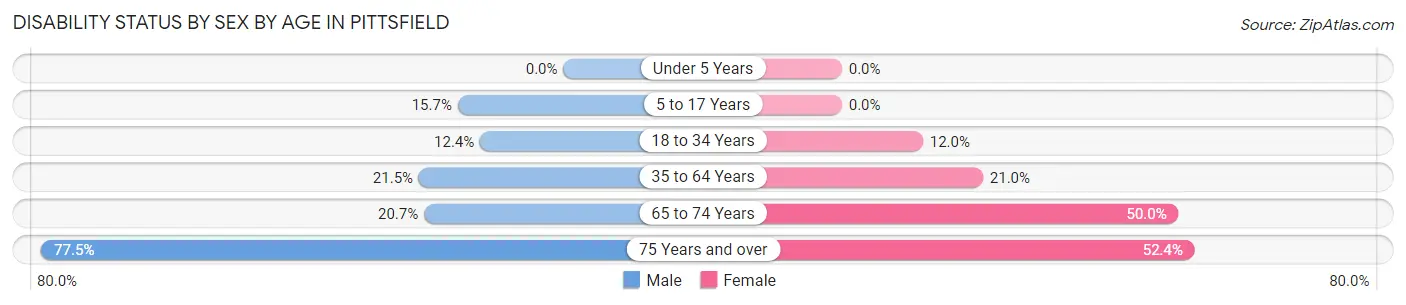
| Age Bracket | Male | Female |
| Under 5 Years | 0 (0.0%) | 0 (0.0%) |
| 5 to 17 Years | 53 (15.7%) | 0 (0.0%) |
| 18 to 34 Years | 43 (12.4%) | 45 (12.0%) |
| 35 to 64 Years | 86 (21.4%) | 119 (20.9%) |
| 65 to 74 Years | 12 (20.7%) | 95 (50.0%) |
| 75 Years and over | 107 (77.5%) | 76 (52.4%) |
Disability Class by Sex by Age in Pittsfield
Disability Class: Hearing Difficulty
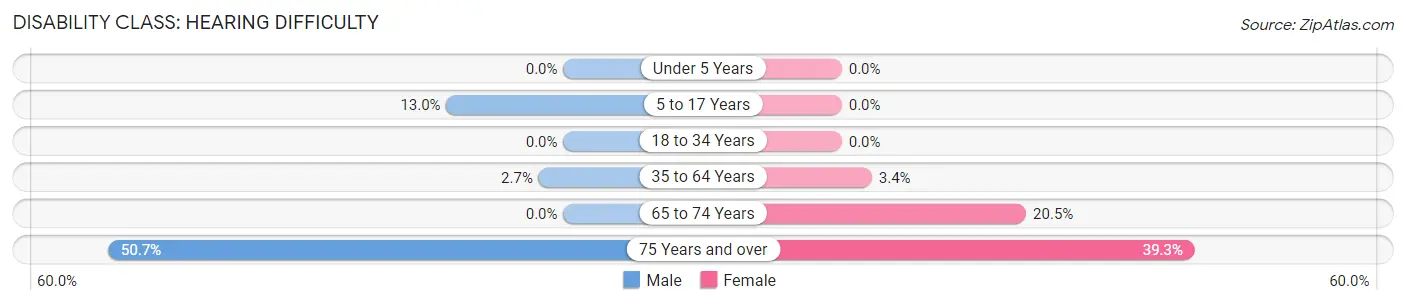
| Age Bracket | Male | Female |
| Under 5 Years | 0 (0.0%) | 0 (0.0%) |
| 5 to 17 Years | 44 (13.0%) | 0 (0.0%) |
| 18 to 34 Years | 0 (0.0%) | 0 (0.0%) |
| 35 to 64 Years | 11 (2.7%) | 19 (3.4%) |
| 65 to 74 Years | 0 (0.0%) | 39 (20.5%) |
| 75 Years and over | 70 (50.7%) | 57 (39.3%) |
Disability Class: Vision Difficulty
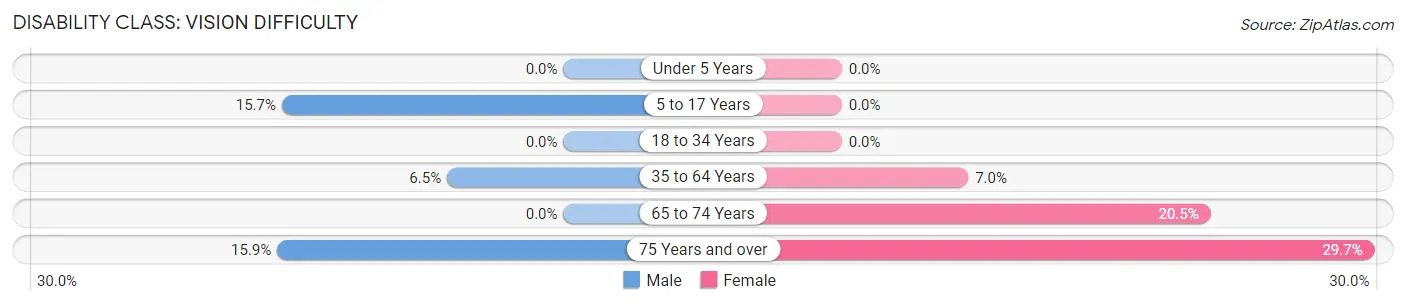
| Age Bracket | Male | Female |
| Under 5 Years | 0 (0.0%) | 0 (0.0%) |
| 5 to 17 Years | 53 (15.7%) | 0 (0.0%) |
| 18 to 34 Years | 0 (0.0%) | 0 (0.0%) |
| 35 to 64 Years | 26 (6.5%) | 40 (7.0%) |
| 65 to 74 Years | 0 (0.0%) | 39 (20.5%) |
| 75 Years and over | 22 (15.9%) | 43 (29.7%) |
Disability Class: Cognitive Difficulty
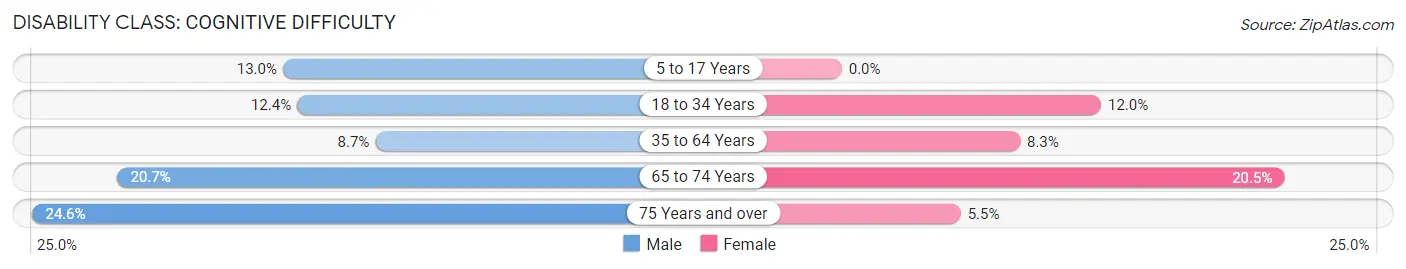
| Age Bracket | Male | Female |
| 5 to 17 Years | 44 (13.0%) | 0 (0.0%) |
| 18 to 34 Years | 43 (12.4%) | 45 (12.0%) |
| 35 to 64 Years | 35 (8.7%) | 47 (8.3%) |
| 65 to 74 Years | 12 (20.7%) | 39 (20.5%) |
| 75 Years and over | 34 (24.6%) | 8 (5.5%) |
Disability Class: Ambulatory Difficulty
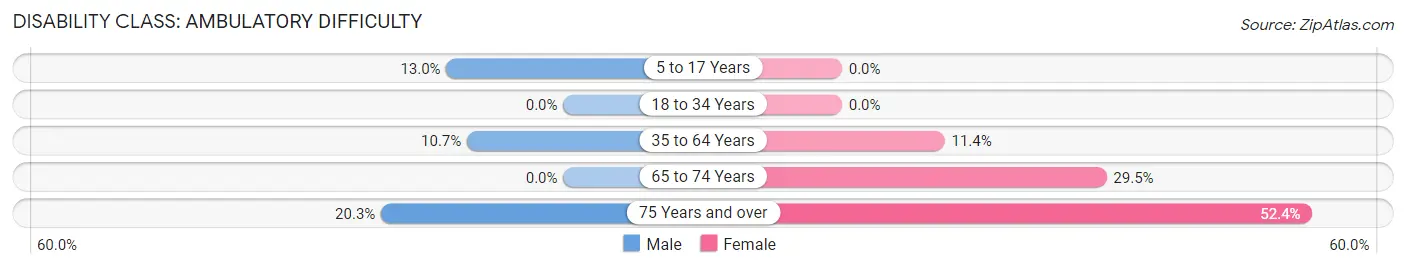
| Age Bracket | Male | Female |
| 5 to 17 Years | 44 (13.0%) | 0 (0.0%) |
| 18 to 34 Years | 0 (0.0%) | 0 (0.0%) |
| 35 to 64 Years | 43 (10.7%) | 65 (11.4%) |
| 65 to 74 Years | 0 (0.0%) | 56 (29.5%) |
| 75 Years and over | 28 (20.3%) | 76 (52.4%) |
Disability Class: Self-Care Difficulty
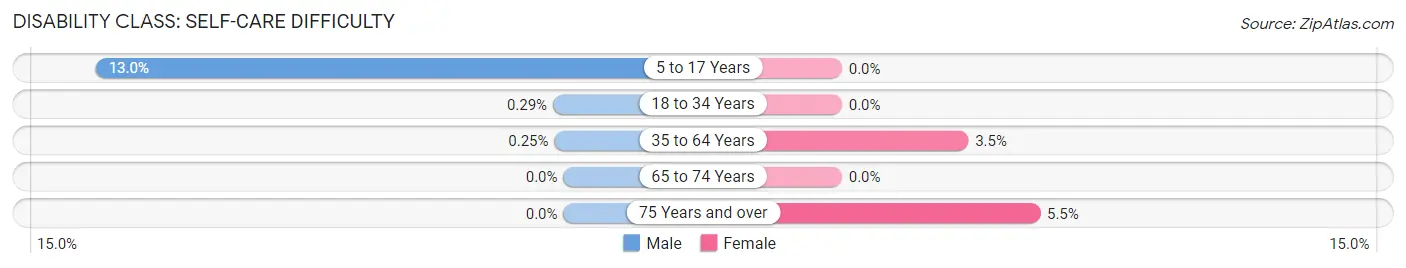
| Age Bracket | Male | Female |
| 5 to 17 Years | 44 (13.0%) | 0 (0.0%) |
| 18 to 34 Years | 1 (0.3%) | 0 (0.0%) |
| 35 to 64 Years | 1 (0.3%) | 20 (3.5%) |
| 65 to 74 Years | 0 (0.0%) | 0 (0.0%) |
| 75 Years and over | 0 (0.0%) | 8 (5.5%) |
Technology Access in Pittsfield
Computing Device Access in Pittsfield
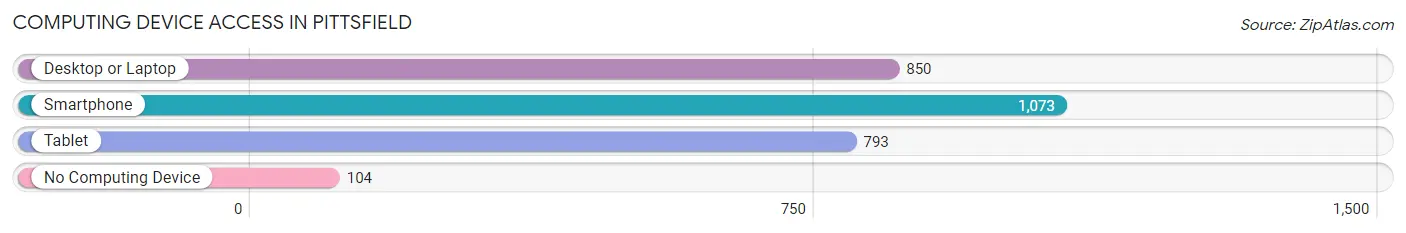
| Device Type | # Households | % Households |
| Desktop or Laptop | 850 | 68.4% |
| Smartphone | 1,073 | 86.4% |
| Tablet | 793 | 63.8% |
| No Computing Device | 104 | 8.4% |
| Total | 1,242 | 100.0% |
Internet Access in Pittsfield
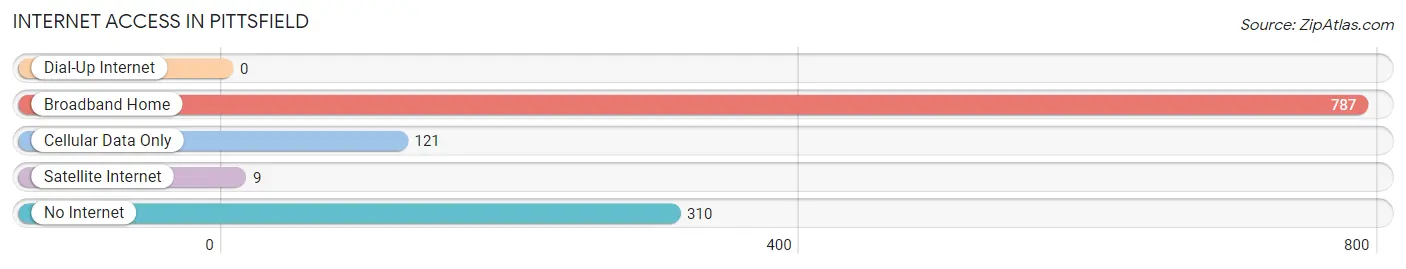
| Internet Type | # Households | % Households |
| Dial-Up Internet | 0 | 0.0% |
| Broadband Home | 787 | 63.4% |
| Cellular Data Only | 121 | 9.7% |
| Satellite Internet | 9 | 0.7% |
| No Internet | 310 | 25.0% |
| Total | 1,242 | 100.0% |
Pittsfield Summary
Pittsfield, Maine is a small town located in the heart of Somerset County. It is situated on the Sebasticook River, which is a tributary of the Kennebec River. The town was first settled in 1794 and incorporated in 1814. The population of Pittsfield was 4,215 at the 2010 census.
History
Pittsfield was first settled in 1794 by a group of settlers from Pittsfield, Massachusetts. The town was named after the Massachusetts town, which was named after William Pitt, the 1st Earl of Chatham. The town was incorporated in 1814.
In the early 19th century, Pittsfield was a thriving agricultural community. The town was known for its production of potatoes, hay, and other crops. The town also had several mills, including a sawmill, gristmill, and a woolen mill.
In the late 19th century, Pittsfield began to experience an economic decline. The town's population decreased as people moved away in search of better economic opportunities. The town's economy was further weakened by the Great Depression.
In the mid-20th century, Pittsfield began to experience an economic revival. The town's population began to increase as people moved back to the area. The town's economy was bolstered by the opening of a paper mill in the 1950s. The mill provided jobs for many of the town's residents.
Geography
Pittsfield is located in the heart of Somerset County. The town is situated on the Sebasticook River, which is a tributary of the Kennebec River. The town is bordered by the towns of Hartland to the north, Detroit to the east, Burnham to the south, and Palmyra to the west.
The town has a total area of 24.2 square miles, of which 24.1 square miles is land and 0.1 square miles is water. The town is located in a rural area and is surrounded by rolling hills and forests.
Economy
Pittsfield's economy is largely based on agriculture and manufacturing. The town is home to several farms, which produce potatoes, hay, and other crops. The town also has several manufacturing companies, including a paper mill and a wood products company.
The town is also home to several businesses, including restaurants, retail stores, and service providers. The town also has several small businesses, including a brewery, a winery, and a distillery.
Demographics
As of the 2010 census, the population of Pittsfield was 4,215. The town has a population density of 174.3 people per square mile. The median age of the town's population is 43.7 years.
The town's population is predominantly white (97.2%). The town also has a small African American population (0.7%) and a small Hispanic population (1.1%). The town's median household income is $41,944. The town's poverty rate is 11.3%.
Common Questions
What is Per Capita Income in Pittsfield?
Per Capita income in Pittsfield is $23,728.
What is the Median Family Income in Pittsfield?
Median Family Income in Pittsfield is $56,119.
What is the Median Household income in Pittsfield?
Median Household Income in Pittsfield is $42,292.
What is Income or Wage Gap in Pittsfield?
Income or Wage Gap in Pittsfield is 56.0%.
Women in Pittsfield earn 44.0 cents for every dollar earned by a man.
What is Inequality or Gini Index in Pittsfield?
Inequality or Gini Index in Pittsfield is 0.48.
What is the Total Population of Pittsfield?
Total Population of Pittsfield is 3,148.
What is the Total Male Population of Pittsfield?
Total Male Population of Pittsfield is 1,459.
What is the Total Female Population of Pittsfield?
Total Female Population of Pittsfield is 1,689.
What is the Ratio of Males per 100 Females in Pittsfield?
There are 86.38 Males per 100 Females in Pittsfield.
What is the Ratio of Females per 100 Males in Pittsfield?
There are 115.76 Females per 100 Males in Pittsfield.
What is the Median Population Age in Pittsfield?
Median Population Age in Pittsfield is 33.9 Years.
What is the Average Family Size in Pittsfield
Average Family Size in Pittsfield is 3.1 People.
What is the Average Household Size in Pittsfield
Average Household Size in Pittsfield is 2.4 People.
How Large is the Labor Force in Pittsfield?
There are 1,318 People in the Labor Forcein in Pittsfield.
What is the Percentage of People in the Labor Force in Pittsfield?
55.8% of People are in the Labor Force in Pittsfield.
What is the Unemployment Rate in Pittsfield?
Unemployment Rate in Pittsfield is 1.6%.