Limestone, ME Map & Demographics
Limestone Map
Limestone Overview
$20,497
PER CAPITA INCOME
$37,708
AVG FAMILY INCOME
$36,023
AVG HOUSEHOLD INCOME
10.0%
WAGE / INCOME GAP [ % ]
90.0¢/ $1
WAGE / INCOME GAP [ $ ]
$3,935
FAMILY INCOME DEFICIT
0.42
INEQUALITY / GINI INDEX
1,165
TOTAL POPULATION
577
MALE POPULATION
588
FEMALE POPULATION
98.13
MALES / 100 FEMALES
101.91
FEMALES / 100 MALES
43.9
MEDIAN AGE
2.5
AVG FAMILY SIZE
2.0
AVG HOUSEHOLD SIZE
412
LABOR FORCE [ PEOPLE ]
42.5%
PERCENT IN LABOR FORCE
2.4%
UNEMPLOYMENT RATE
Limestone Zip Codes
Limestone Area Codes
Income in Limestone
Income Overview in Limestone
Per Capita Income in Limestone is $20,497, while median incomes of families and households are $37,708 and $36,023 respectively.
| Characteristic | Number | Measure |
| Per Capita Income | 1,165 | $20,497 |
| Median Family Income | 305 | $37,708 |
| Mean Family Income | 305 | $58,393 |
| Median Household Income | 473 | $36,023 |
| Mean Household Income | 473 | $49,081 |
| Income Deficit | 305 | $3,935 |
| Wage / Income Gap (%) | 1,165 | 10.05% |
| Wage / Income Gap ($) | 1,165 | 89.95¢ per $1 |
| Gini / Inequality Index | 1,165 | 0.42 |
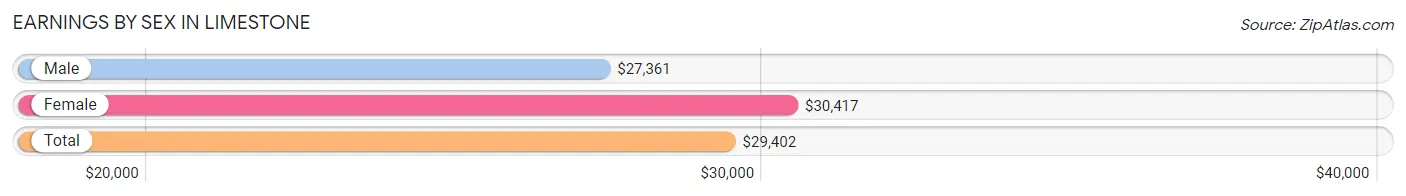
Earnings by Sex in Limestone
Average Earnings in Limestone are $29,402, $27,361 for men and $30,417 for women, a difference of 10.1%.
| Sex | Number | Average Earnings |
| Male | 234 (49.9%) | $27,361 |
| Female | 235 (50.1%) | $30,417 |
| Total | 469 (100.0%) | $29,402 |
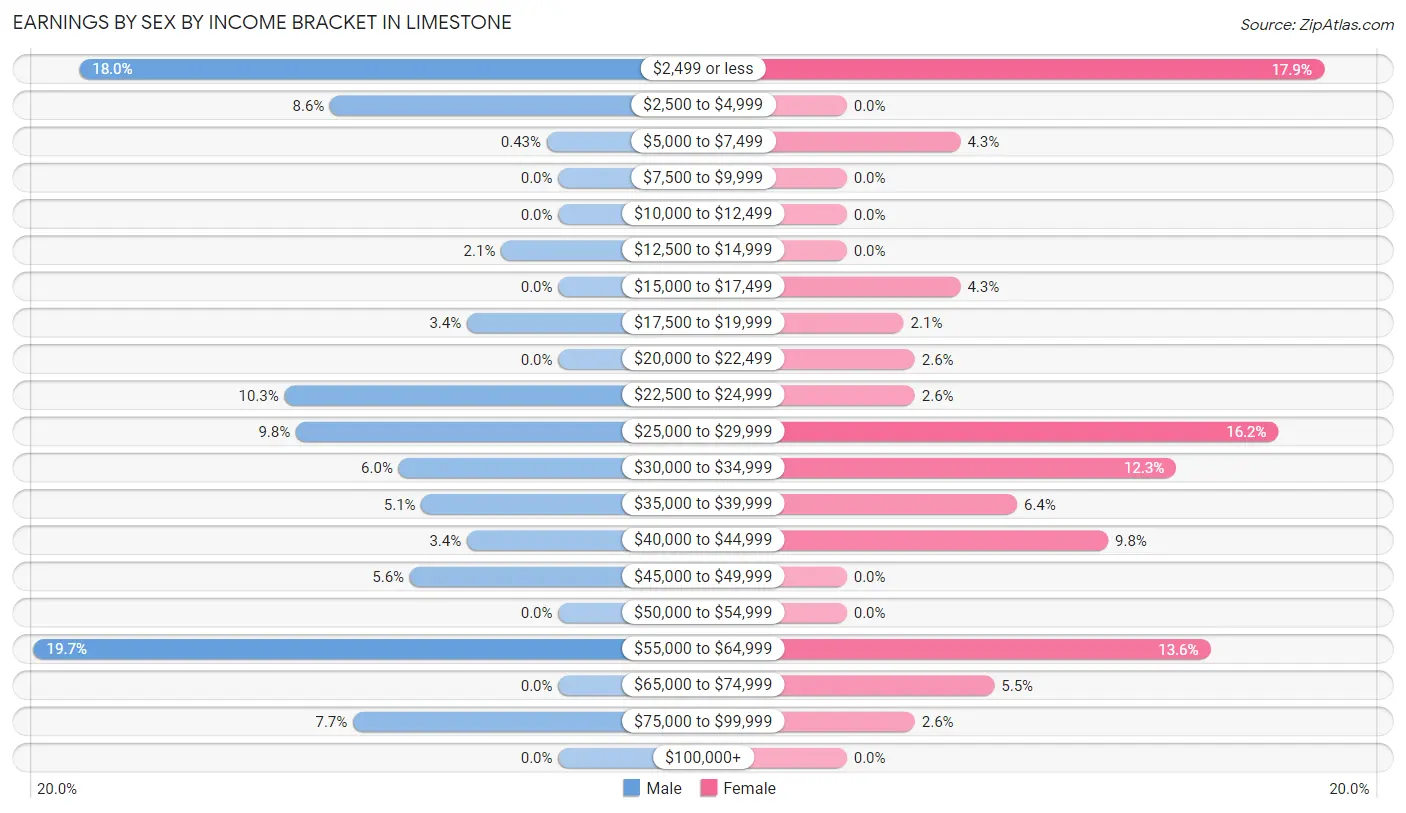
Earnings by Sex by Income Bracket in Limestone
The most common earnings brackets in Limestone are $55,000 to $64,999 for men (46 | 19.7%) and $2,499 or less for women (42 | 17.9%).
| Income | Male | Female |
| $2,499 or less | 42 (17.9%) | 42 (17.9%) |
| $2,500 to $4,999 | 20 (8.6%) | 0 (0.0%) |
| $5,000 to $7,499 | 1 (0.4%) | 10 (4.3%) |
| $7,500 to $9,999 | 0 (0.0%) | 0 (0.0%) |
| $10,000 to $12,499 | 0 (0.0%) | 0 (0.0%) |
| $12,500 to $14,999 | 5 (2.1%) | 0 (0.0%) |
| $15,000 to $17,499 | 0 (0.0%) | 10 (4.3%) |
| $17,500 to $19,999 | 8 (3.4%) | 5 (2.1%) |
| $20,000 to $22,499 | 0 (0.0%) | 6 (2.5%) |
| $22,500 to $24,999 | 24 (10.3%) | 6 (2.5%) |
| $25,000 to $29,999 | 23 (9.8%) | 38 (16.2%) |
| $30,000 to $34,999 | 14 (6.0%) | 29 (12.3%) |
| $35,000 to $39,999 | 12 (5.1%) | 15 (6.4%) |
| $40,000 to $44,999 | 8 (3.4%) | 23 (9.8%) |
| $45,000 to $49,999 | 13 (5.6%) | 0 (0.0%) |
| $50,000 to $54,999 | 0 (0.0%) | 0 (0.0%) |
| $55,000 to $64,999 | 46 (19.7%) | 32 (13.6%) |
| $65,000 to $74,999 | 0 (0.0%) | 13 (5.5%) |
| $75,000 to $99,999 | 18 (7.7%) | 6 (2.5%) |
| $100,000+ | 0 (0.0%) | 0 (0.0%) |
| Total | 234 (100.0%) | 235 (100.0%) |
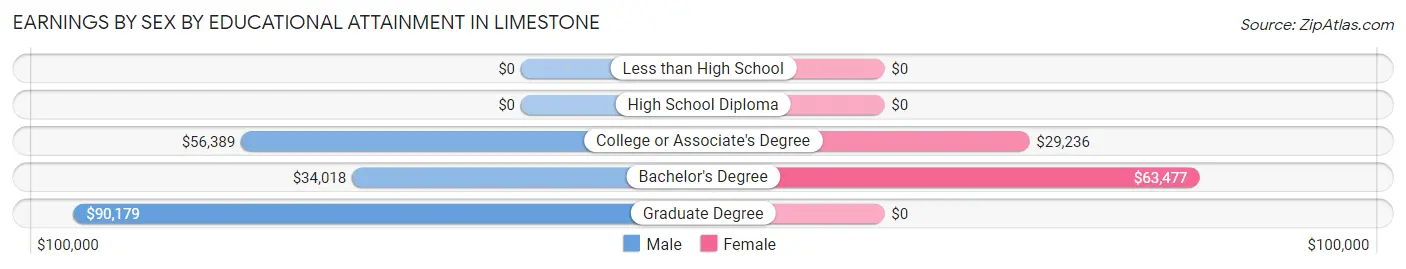
Earnings by Sex by Educational Attainment in Limestone
Average earnings in Limestone are $35,972 for men and $34,087 for women, a difference of 5.2%. Men with an educational attainment of graduate degree enjoy the highest average annual earnings of $90,179, while those with bachelor's degree education earn the least with $34,018. Women with an educational attainment of bachelor's degree earn the most with the average annual earnings of $63,477, while those with college or associate's degree education have the smallest earnings of $29,236.
| Educational Attainment | Male Income | Female Income |
| Less than High School | - | - |
| High School Diploma | - | - |
| College or Associate's Degree | $56,389 | $29,236 |
| Bachelor's Degree | $34,018 | $63,477 |
| Graduate Degree | $90,179 | $0 |
| Total | $35,972 | $34,087 |
Family Income in Limestone
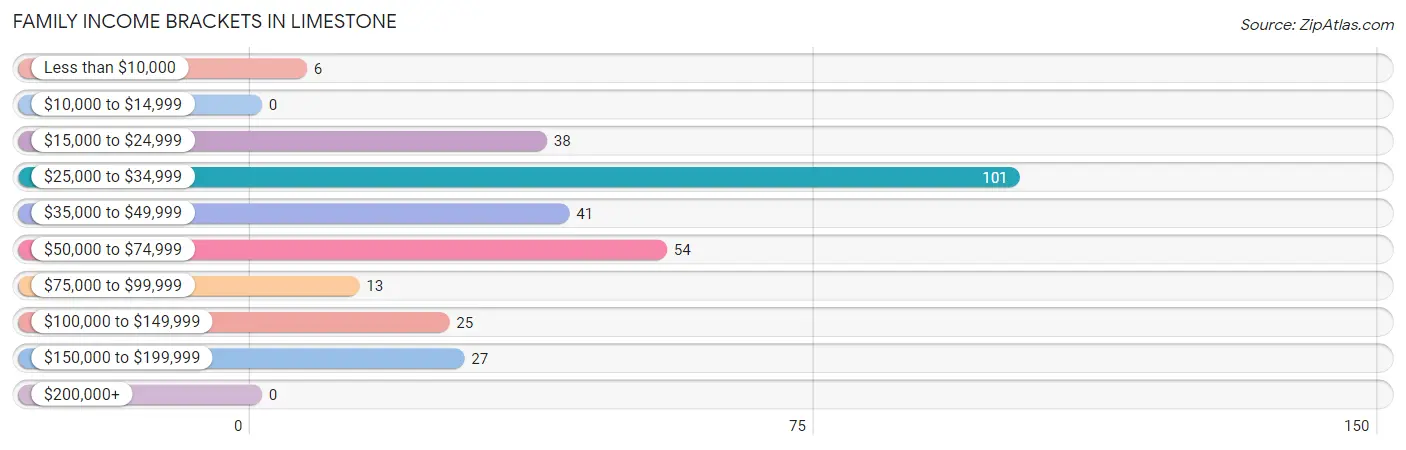
Family Income Brackets in Limestone
According to the Limestone family income data, there are 101 families falling into the $25,000 to $34,999 income range, which is the most common income bracket and makes up 33.1% of all families.
| Income Bracket | # Families | % Families |
| Less than $10,000 | 6 | 2.0% |
| $10,000 to $14,999 | 0 | 0.0% |
| $15,000 to $24,999 | 38 | 12.5% |
| $25,000 to $34,999 | 101 | 33.1% |
| $35,000 to $49,999 | 41 | 13.4% |
| $50,000 to $74,999 | 54 | 17.7% |
| $75,000 to $99,999 | 13 | 4.3% |
| $100,000 to $149,999 | 25 | 8.2% |
| $150,000 to $199,999 | 27 | 8.9% |
| $200,000+ | 0 | 0.0% |
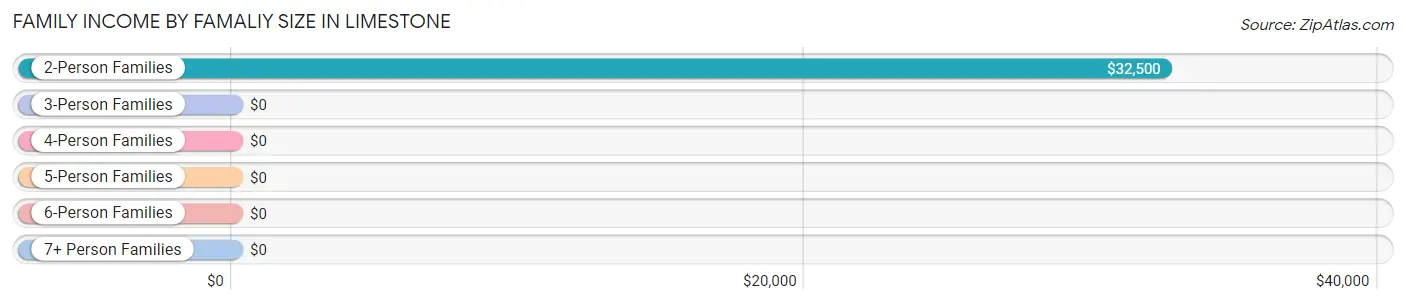
Family Income by Famaliy Size in Limestone
2-person families (228 | 74.8%) account for the highest median family income in Limestone with $32,500 per family, while 2-person families (228 | 74.8%) have the highest median income of $16,250 per family member.
| Income Bracket | # Families | Median Income |
| 2-Person Families | 228 (74.8%) | $32,500 |
| 3-Person Families | 10 (3.3%) | $0 |
| 4-Person Families | 61 (20.0%) | $0 |
| 5-Person Families | 3 (1.0%) | $0 |
| 6-Person Families | 3 (1.0%) | $0 |
| 7+ Person Families | 0 (0.0%) | $0 |
| Total | 305 (100.0%) | $37,708 |
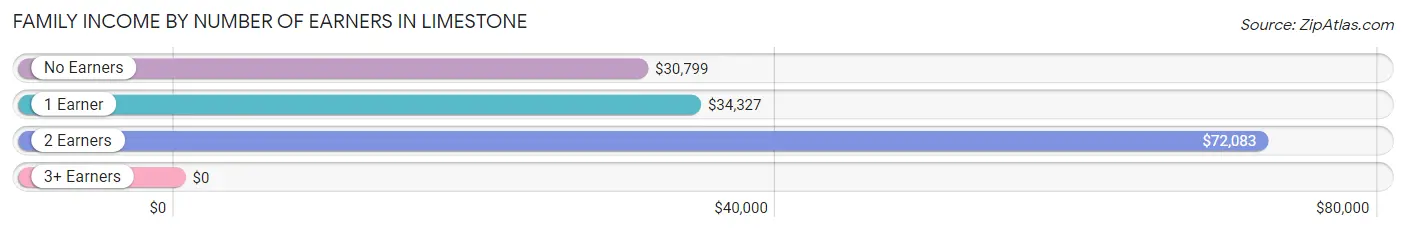
Family Income by Number of Earners in Limestone
| Number of Earners | # Families | Median Income |
| No Earners | 117 (38.4%) | $30,799 |
| 1 Earner | 100 (32.8%) | $34,327 |
| 2 Earners | 58 (19.0%) | $72,083 |
| 3+ Earners | 30 (9.8%) | $0 |
| Total | 305 (100.0%) | $37,708 |
Household Income in Limestone
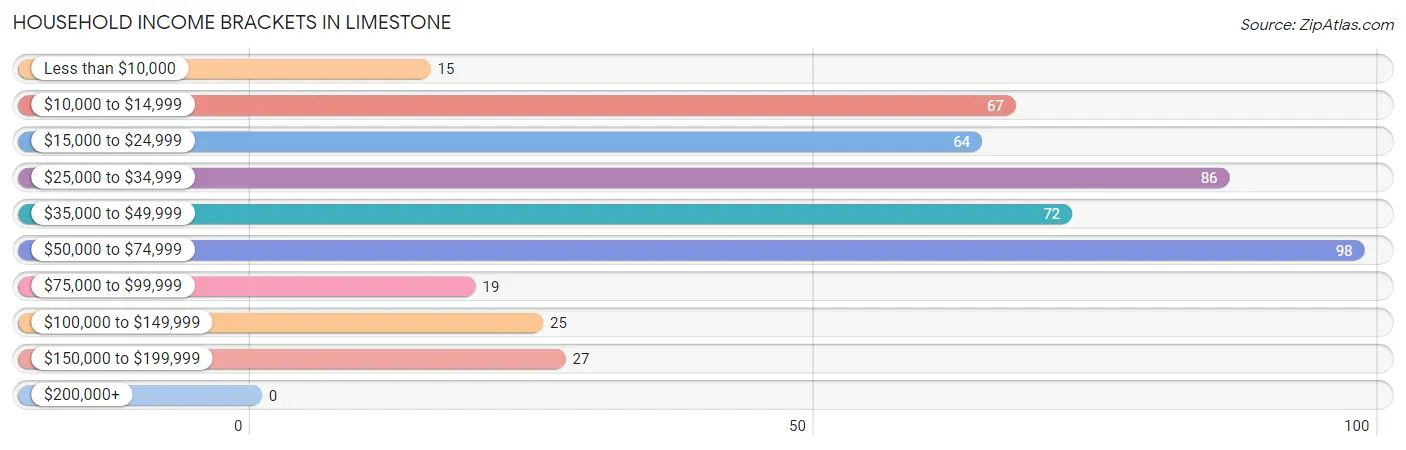
Household Income Brackets in Limestone
With 98 households falling in the category, the $50,000 to $74,999 income range is the most frequent in Limestone, accounting for 20.7% of all households.
| Income Bracket | # Households | % Households |
| Less than $10,000 | 15 | 3.2% |
| $10,000 to $14,999 | 67 | 14.2% |
| $15,000 to $24,999 | 64 | 13.5% |
| $25,000 to $34,999 | 86 | 18.2% |
| $35,000 to $49,999 | 72 | 15.2% |
| $50,000 to $74,999 | 98 | 20.7% |
| $75,000 to $99,999 | 19 | 4.0% |
| $100,000 to $149,999 | 25 | 5.3% |
| $150,000 to $199,999 | 27 | 5.7% |
| $200,000+ | 0 | 0.0% |
Household Income by Householder Age in Limestone
The median household income in Limestone is $36,023, with the highest median household income of $48,194 found in the 45 to 64 years age bracket for the primary householder. A total of 227 households (48.0%) fall into this category.
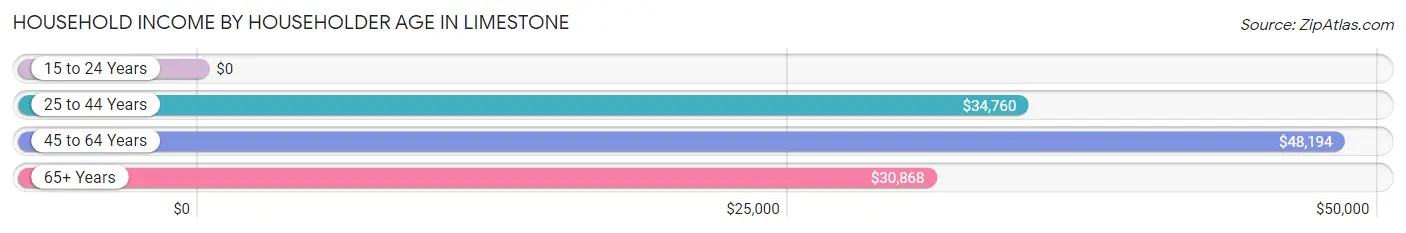
| Income Bracket | # Households | Median Income |
| 15 to 24 Years | 0 (0.0%) | $0 |
| 25 to 44 Years | 99 (20.9%) | $34,760 |
| 45 to 64 Years | 227 (48.0%) | $48,194 |
| 65+ Years | 147 (31.1%) | $30,868 |
| Total | 473 (100.0%) | $36,023 |
Poverty in Limestone
Income Below Poverty by Sex and Age in Limestone
With 18.1% poverty level for males and 18.9% for females among the residents of Limestone, 25 to 34 year old males and 55 to 64 year old females are the most vulnerable to poverty, with 30 males (62.5%) and 66 females (43.7%) in their respective age groups living below the poverty level.
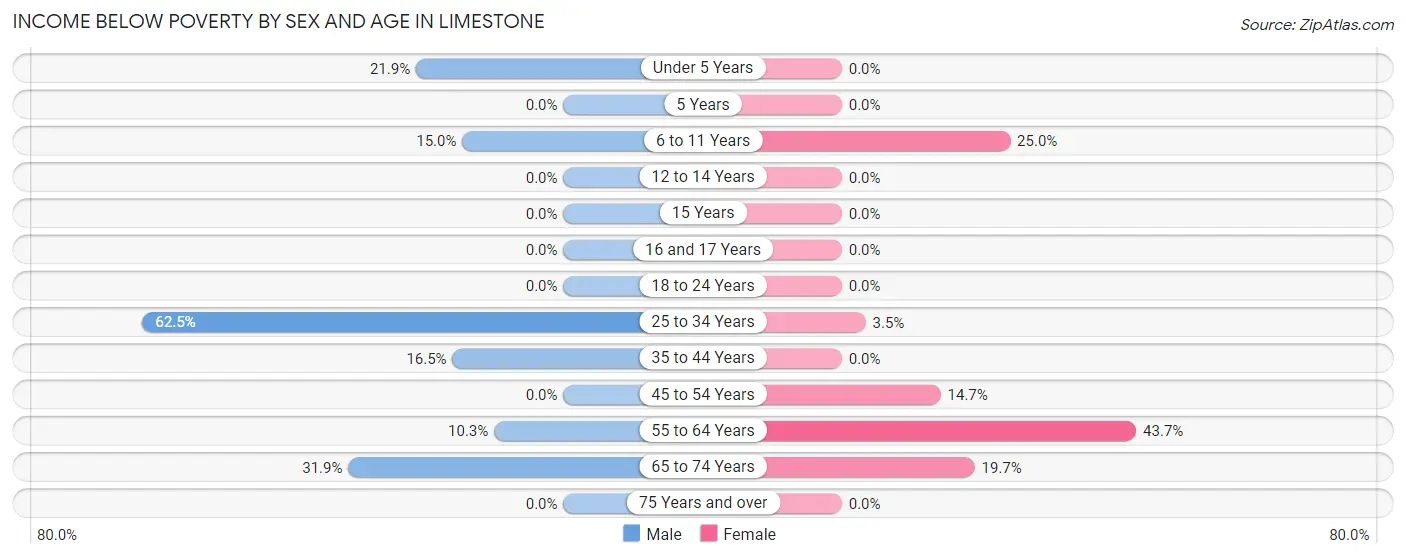
| Age Bracket | Male | Female |
| Under 5 Years | 7 (21.9%) | 0 (0.0%) |
| 5 Years | 0 (0.0%) | 0 (0.0%) |
| 6 to 11 Years | 3 (15.0%) | 4 (25.0%) |
| 12 to 14 Years | 0 (0.0%) | 0 (0.0%) |
| 15 Years | 0 (0.0%) | 0 (0.0%) |
| 16 and 17 Years | 0 (0.0%) | 0 (0.0%) |
| 18 to 24 Years | 0 (0.0%) | 0 (0.0%) |
| 25 to 34 Years | 30 (62.5%) | 3 (3.5%) |
| 35 to 44 Years | 14 (16.5%) | 0 (0.0%) |
| 45 to 54 Years | 0 (0.0%) | 11 (14.7%) |
| 55 to 64 Years | 11 (10.3%) | 66 (43.7%) |
| 65 to 74 Years | 23 (31.9%) | 14 (19.7%) |
| 75 Years and over | 0 (0.0%) | 0 (0.0%) |
| Total | 88 (18.1%) | 98 (18.9%) |
Income Above Poverty by Sex and Age in Limestone
According to the poverty statistics in Limestone, males aged 12 to 14 years and females aged under 5 years are the age groups that are most secure financially, with 100.0% of males and 100.0% of females in these age groups living above the poverty line.
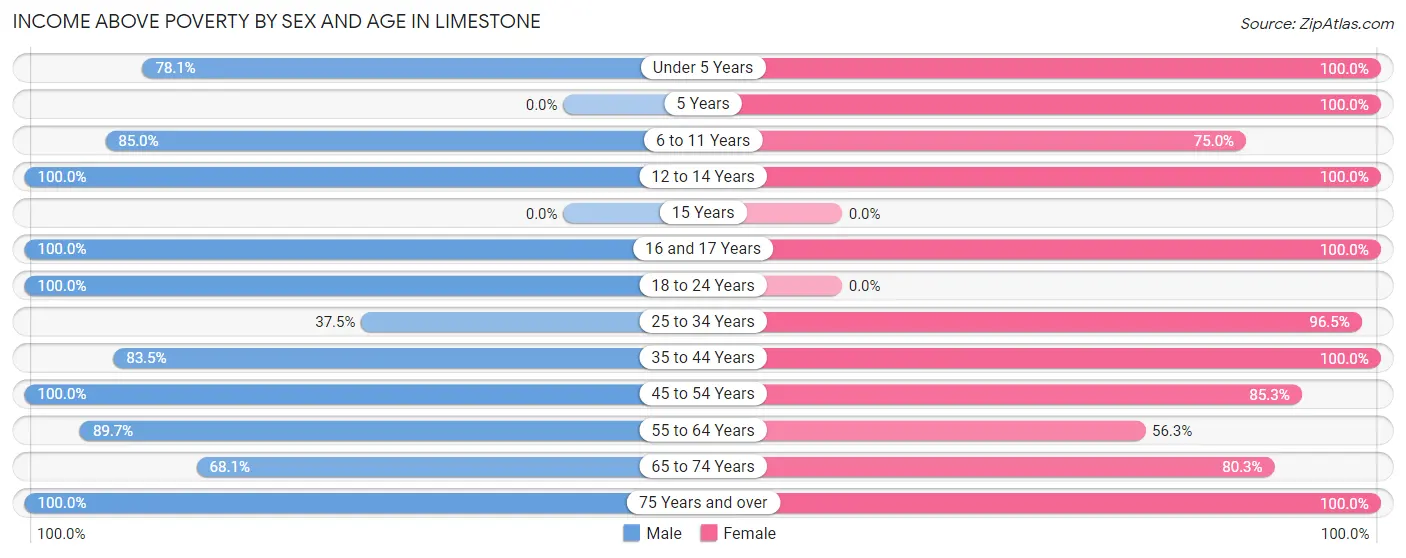
| Age Bracket | Male | Female |
| Under 5 Years | 25 (78.1%) | 32 (100.0%) |
| 5 Years | 0 (0.0%) | 45 (100.0%) |
| 6 to 11 Years | 17 (85.0%) | 12 (75.0%) |
| 12 to 14 Years | 13 (100.0%) | 4 (100.0%) |
| 15 Years | 0 (0.0%) | 0 (0.0%) |
| 16 and 17 Years | 15 (100.0%) | 3 (100.0%) |
| 18 to 24 Years | 24 (100.0%) | 0 (0.0%) |
| 25 to 34 Years | 18 (37.5%) | 82 (96.5%) |
| 35 to 44 Years | 71 (83.5%) | 10 (100.0%) |
| 45 to 54 Years | 45 (100.0%) | 64 (85.3%) |
| 55 to 64 Years | 96 (89.7%) | 85 (56.3%) |
| 65 to 74 Years | 49 (68.1%) | 57 (80.3%) |
| 75 Years and over | 25 (100.0%) | 28 (100.0%) |
| Total | 398 (81.9%) | 422 (81.1%) |
Income Below Poverty Among Married-Couple Families in Limestone
The poverty statistics for married-couple families in Limestone show that 11.8% or 26 of the total 221 families live below the poverty line. Families with 3 or 4 children have the highest poverty rate of 50.0%, comprising of 3 families. On the other hand, families with 1 or 2 children have the lowest poverty rate of 0.0%, which includes 0 families.
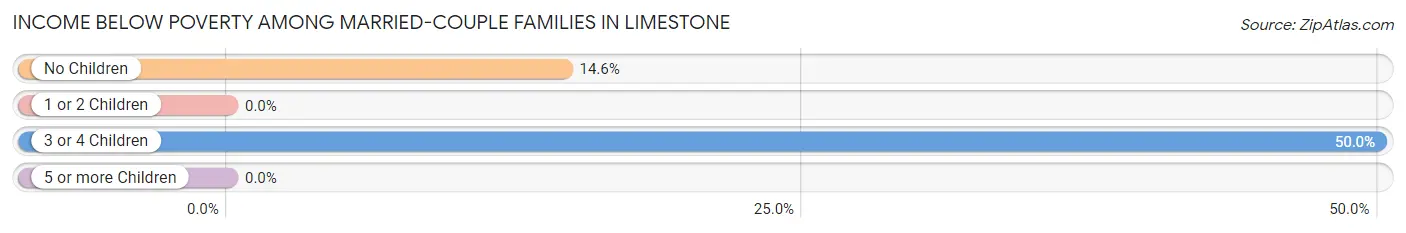
| Children | Above Poverty | Below Poverty |
| No Children | 135 (85.4%) | 23 (14.6%) |
| 1 or 2 Children | 57 (100.0%) | 0 (0.0%) |
| 3 or 4 Children | 3 (50.0%) | 3 (50.0%) |
| 5 or more Children | 0 (0.0%) | 0 (0.0%) |
| Total | 195 (88.2%) | 26 (11.8%) |
Income Below Poverty Among Single-Parent Households in Limestone
| Children | Single Father | Single Mother |
| No Children | 0 (0.0%) | 0 (0.0%) |
| 1 or 2 Children | 0 (0.0%) | 0 (0.0%) |
| 3 or 4 Children | 0 (0.0%) | 0 (0.0%) |
| 5 or more Children | 0 (0.0%) | 0 (0.0%) |
| Total | 0 (0.0%) | 0 (0.0%) |
Income Below Poverty Among Married-Couple vs Single-Parent Households in Limestone
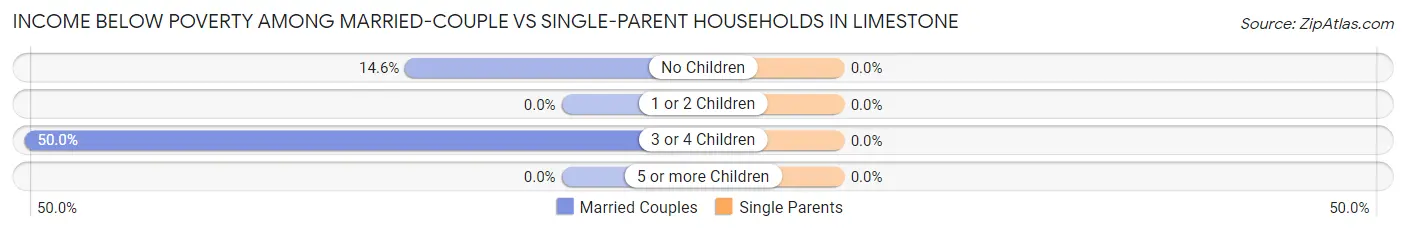
| Children | Married-Couple Families | Single-Parent Households |
| No Children | 23 (14.6%) | 0 (0.0%) |
| 1 or 2 Children | 0 (0.0%) | 0 (0.0%) |
| 3 or 4 Children | 3 (50.0%) | 0 (0.0%) |
| 5 or more Children | 0 (0.0%) | 0 (0.0%) |
| Total | 26 (11.8%) | 0 (0.0%) |
Race in Limestone
The most populous races in Limestone are White / Caucasian (1,077 | 92.4%), Native / Alaskan (58 | 5.0%), and Asian (12 | 1.0%).
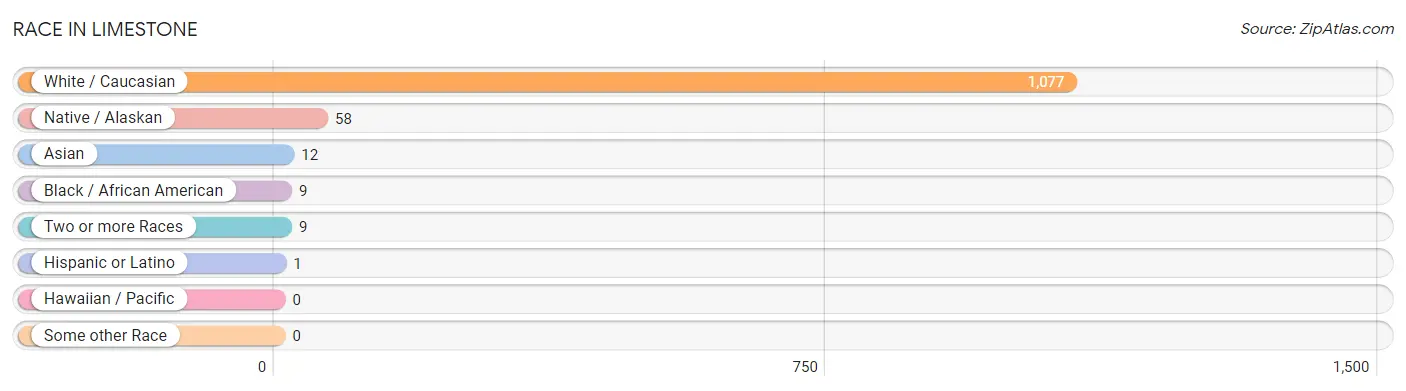
| Race | # Population | % Population |
| Asian | 12 | 1.0% |
| Black / African American | 9 | 0.8% |
| Hawaiian / Pacific | 0 | 0.0% |
| Hispanic or Latino | 1 | 0.1% |
| Native / Alaskan | 58 | 5.0% |
| White / Caucasian | 1,077 | 92.4% |
| Two or more Races | 9 | 0.8% |
| Some other Race | 0 | 0.0% |
| Total | 1,165 | 100.0% |
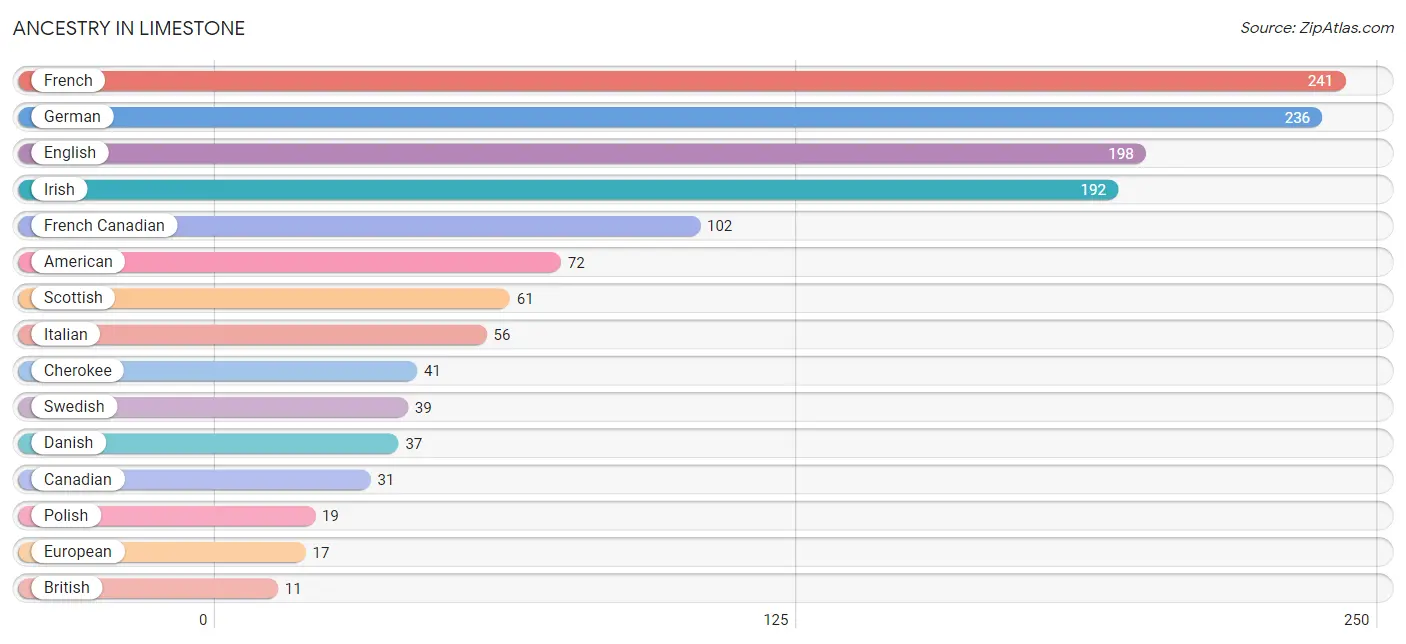
Ancestry in Limestone
The most populous ancestries reported in Limestone are French (241 | 20.7%), German (236 | 20.3%), English (198 | 17.0%), Irish (192 | 16.5%), and French Canadian (102 | 8.8%), together accounting for 83.2% of all Limestone residents.
| Ancestry | # Population | % Population |
| American | 72 | 6.2% |
| Arab | 1 | 0.1% |
| British | 11 | 0.9% |
| Burmese | 6 | 0.5% |
| Cambodian | 2 | 0.2% |
| Canadian | 31 | 2.7% |
| Cherokee | 41 | 3.5% |
| Czechoslovakian | 1 | 0.1% |
| Danish | 37 | 3.2% |
| Dutch | 7 | 0.6% |
| English | 198 | 17.0% |
| Estonian | 2 | 0.2% |
| European | 17 | 1.5% |
| Finnish | 3 | 0.3% |
| French | 241 | 20.7% |
| French Canadian | 102 | 8.8% |
| German | 236 | 20.3% |
| Indian (Asian) | 5 | 0.4% |
| Irish | 192 | 16.5% |
| Israeli | 1 | 0.1% |
| Italian | 56 | 4.8% |
| Lithuanian | 3 | 0.3% |
| Northern European | 1 | 0.1% |
| Polish | 19 | 1.6% |
| Puerto Rican | 1 | 0.1% |
| Russian | 2 | 0.2% |
| Scandinavian | 1 | 0.1% |
| Scotch-Irish | 6 | 0.5% |
| Scottish | 61 | 5.2% |
| Slovak | 5 | 0.4% |
| Subsaharan African | 1 | 0.1% |
| Sudanese | 1 | 0.1% |
| Swedish | 39 | 3.4% |
| Thai | 1 | 0.1% | View All 34 Rows |
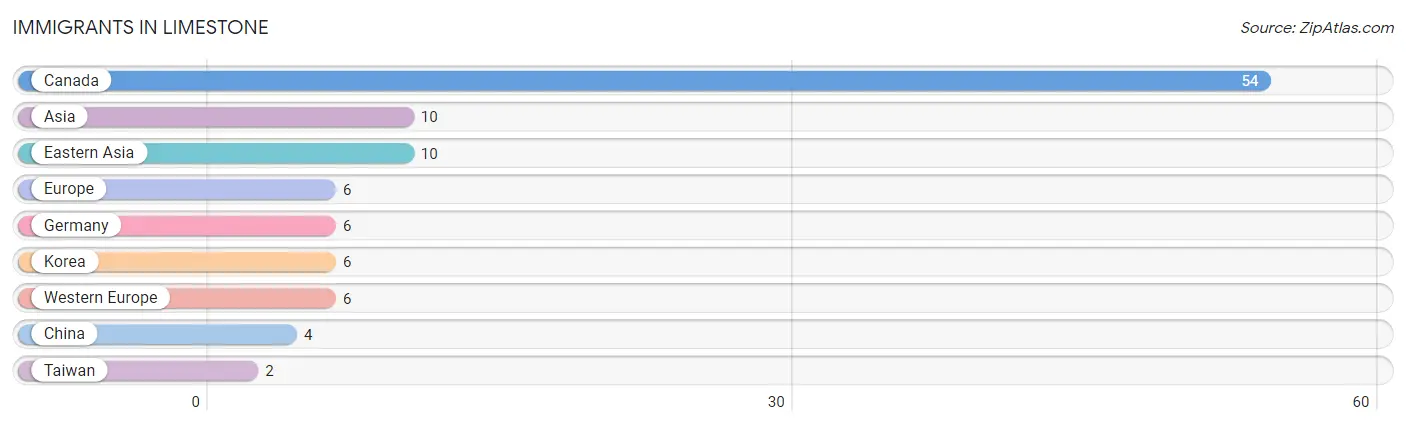
Immigrants in Limestone
The most numerous immigrant groups reported in Limestone came from Canada (54 | 4.6%), Asia (10 | 0.9%), Eastern Asia (10 | 0.9%), Europe (6 | 0.5%), and Germany (6 | 0.5%), together accounting for 7.4% of all Limestone residents.
| Immigration Origin | # Population | % Population |
| Asia | 10 | 0.9% |
| Canada | 54 | 4.6% |
| China | 4 | 0.3% |
| Eastern Asia | 10 | 0.9% |
| Europe | 6 | 0.5% |
| Germany | 6 | 0.5% |
| Korea | 6 | 0.5% |
| Taiwan | 2 | 0.2% |
| Western Europe | 6 | 0.5% | View All 9 Rows |
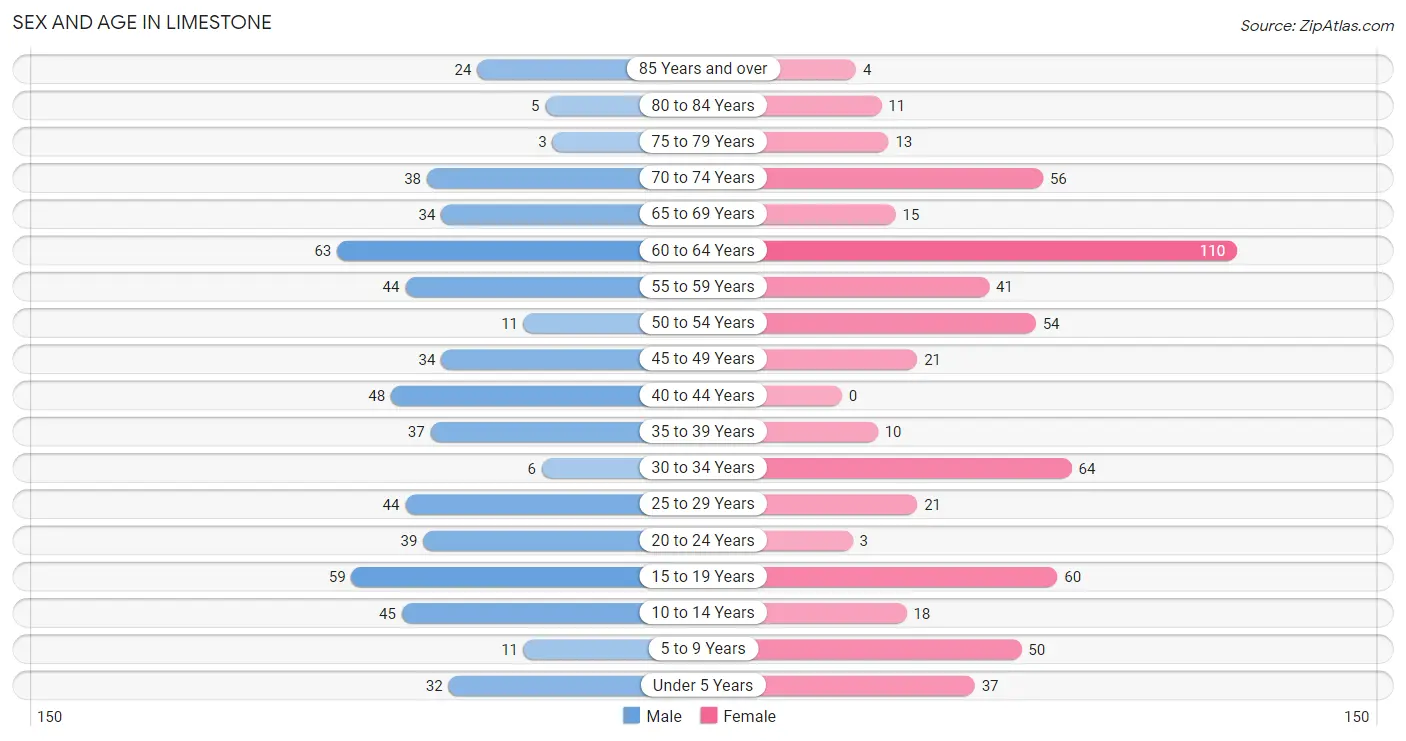
Sex and Age in Limestone
Sex and Age in Limestone
The most populous age groups in Limestone are 60 to 64 Years (63 | 10.9%) for men and 60 to 64 Years (110 | 18.7%) for women.
| Age Bracket | Male | Female |
| Under 5 Years | 32 (5.6%) | 37 (6.3%) |
| 5 to 9 Years | 11 (1.9%) | 50 (8.5%) |
| 10 to 14 Years | 45 (7.8%) | 18 (3.1%) |
| 15 to 19 Years | 59 (10.2%) | 60 (10.2%) |
| 20 to 24 Years | 39 (6.8%) | 3 (0.5%) |
| 25 to 29 Years | 44 (7.6%) | 21 (3.6%) |
| 30 to 34 Years | 6 (1.0%) | 64 (10.9%) |
| 35 to 39 Years | 37 (6.4%) | 10 (1.7%) |
| 40 to 44 Years | 48 (8.3%) | 0 (0.0%) |
| 45 to 49 Years | 34 (5.9%) | 21 (3.6%) |
| 50 to 54 Years | 11 (1.9%) | 54 (9.2%) |
| 55 to 59 Years | 44 (7.6%) | 41 (7.0%) |
| 60 to 64 Years | 63 (10.9%) | 110 (18.7%) |
| 65 to 69 Years | 34 (5.9%) | 15 (2.5%) |
| 70 to 74 Years | 38 (6.6%) | 56 (9.5%) |
| 75 to 79 Years | 3 (0.5%) | 13 (2.2%) |
| 80 to 84 Years | 5 (0.9%) | 11 (1.9%) |
| 85 Years and over | 24 (4.2%) | 4 (0.7%) |
| Total | 577 (100.0%) | 588 (100.0%) |
Families and Households in Limestone
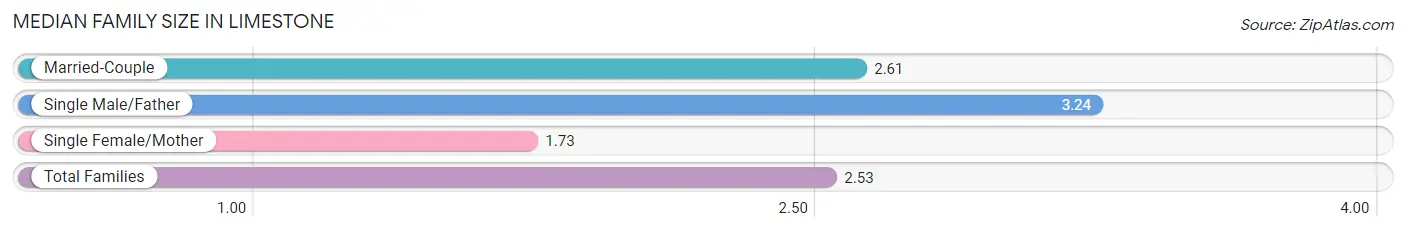
Median Family Size in Limestone
The median family size in Limestone is 2.53 persons per family, with single male/father families (33 | 10.8%) accounting for the largest median family size of 3.24 persons per family. On the other hand, single female/mother families (51 | 16.7%) represent the smallest median family size with 1.73 persons per family.
| Family Type | # Families | Family Size |
| Married-Couple | 221 (72.5%) | 2.61 |
| Single Male/Father | 33 (10.8%) | 3.24 |
| Single Female/Mother | 51 (16.7%) | 1.73 |
| Total Families | 305 (100.0%) | 2.53 |
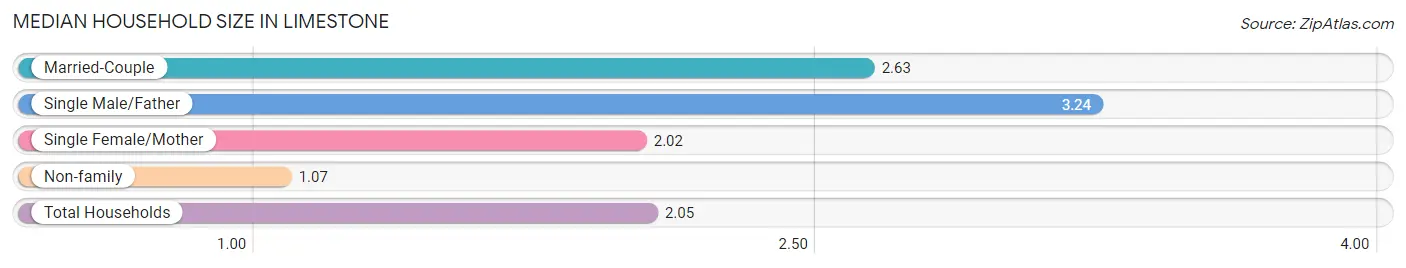
Median Household Size in Limestone
The median household size in Limestone is 2.05 persons per household, with single male/father households (33 | 7.0%) accounting for the largest median household size of 3.24 persons per household. non-family households (168 | 35.5%) represent the smallest median household size with 1.07 persons per household.
| Household Type | # Households | Household Size |
| Married-Couple | 221 (46.7%) | 2.63 |
| Single Male/Father | 33 (7.0%) | 3.24 |
| Single Female/Mother | 51 (10.8%) | 2.02 |
| Non-family | 168 (35.5%) | 1.07 |
| Total Households | 473 (100.0%) | 2.05 |
Household Size by Marriage Status in Limestone
Out of a total of 473 households in Limestone, 305 (64.5%) are family households, while 168 (35.5%) are nonfamily households. The most numerous type of family households are 2-person households, comprising 213, and the most common type of nonfamily households are 1-person households, comprising 157.
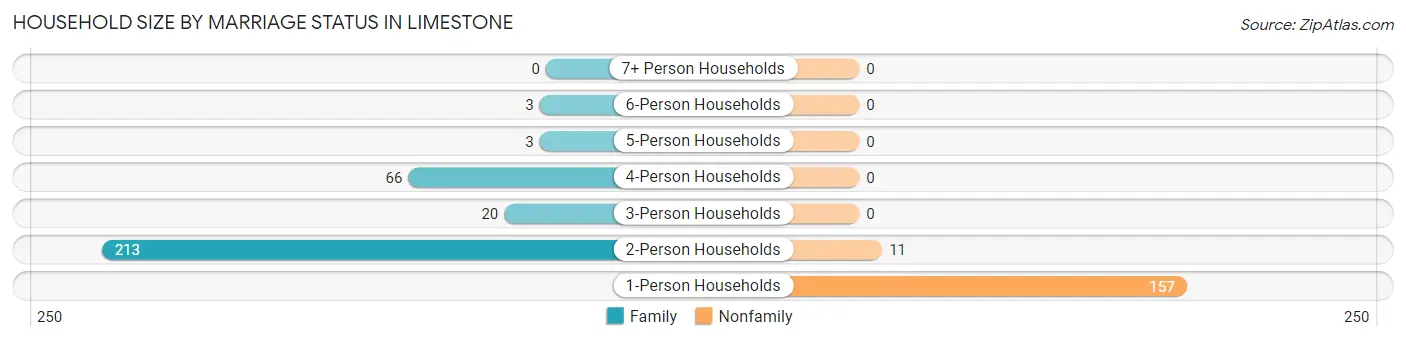
| Household Size | Family Households | Nonfamily Households |
| 1-Person Households | - | 157 (33.2%) |
| 2-Person Households | 213 (45.0%) | 11 (2.3%) |
| 3-Person Households | 20 (4.2%) | 0 (0.0%) |
| 4-Person Households | 66 (14.0%) | 0 (0.0%) |
| 5-Person Households | 3 (0.6%) | 0 (0.0%) |
| 6-Person Households | 3 (0.6%) | 0 (0.0%) |
| 7+ Person Households | 0 (0.0%) | 0 (0.0%) |
| Total | 305 (64.5%) | 168 (35.5%) |
Female Fertility in Limestone
Fertility by Age in Limestone
Average fertility rate in Limestone is 41.0 births per 1,000 women. Women in the age bracket of 35 to 50 years have the highest fertility rate with 81.0 births per 1,000 women. Women in the age bracket of 35 to 50 years acount for 66.7% of all women with births.
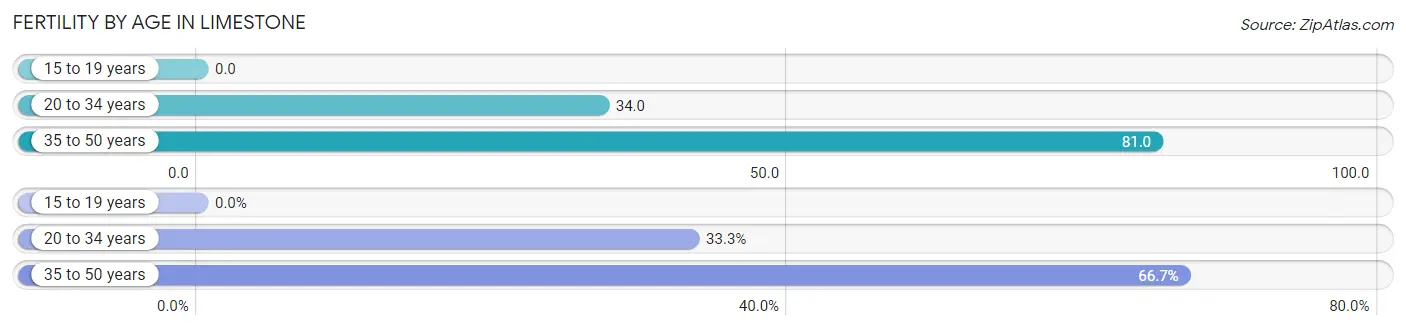
| Age Bracket | Women with Births | Births / 1,000 Women |
| 15 to 19 years | 0 (0.0%) | 0.0 |
| 20 to 34 years | 3 (33.3%) | 34.0 |
| 35 to 50 years | 6 (66.7%) | 81.0 |
| Total | 9 (100.0%) | 41.0 |
Fertility by Age by Marriage Status in Limestone
33.3% of women with births (9) in Limestone are married. The highest percentage of unmarried women with births falls into 35 to 50 years age bracket with 100.0% of them unmarried at the time of birth, while the lowest percentage of unmarried women with births belong to 20 to 34 years age bracket with 0.0% of them unmarried.
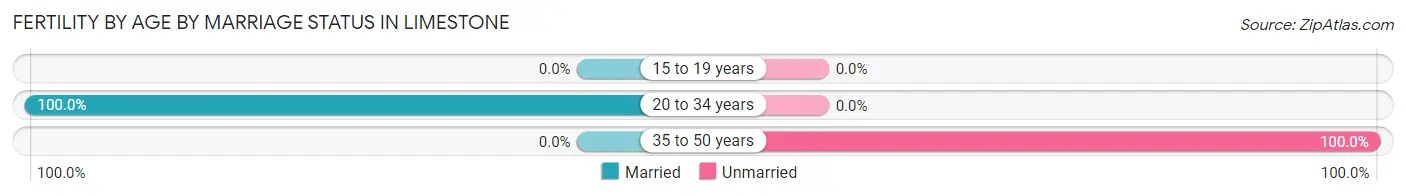
| Age Bracket | Married | Unmarried |
| 15 to 19 years | 0 (0.0%) | 0 (0.0%) |
| 20 to 34 years | 3 (100.0%) | 0 (0.0%) |
| 35 to 50 years | 0 (0.0%) | 6 (100.0%) |
| Total | 3 (33.3%) | 6 (66.7%) |
Fertility by Education in Limestone
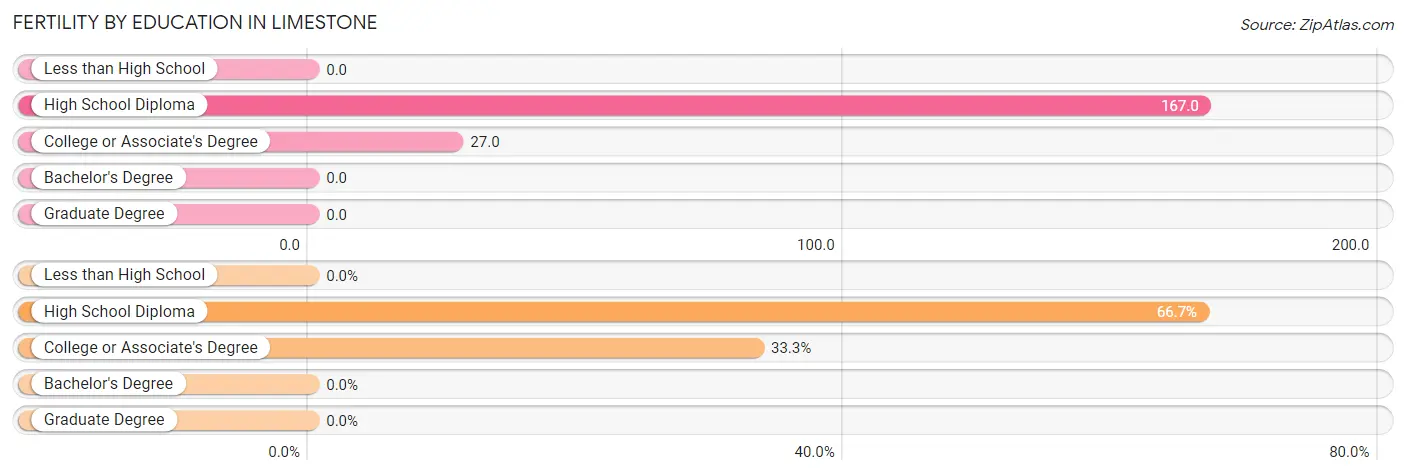
| Educational Attainment | Women with Births | Births / 1,000 Women |
| Less than High School | 0 (0.0%) | 0.0 |
| High School Diploma | 6 (66.7%) | 167.0 |
| College or Associate's Degree | 3 (33.3%) | 27.0 |
| Bachelor's Degree | 0 (0.0%) | 0.0 |
| Graduate Degree | 0 (0.0%) | 0.0 |
| Total | 9 (100.0%) | 41.0 |
Fertility by Education by Marriage Status in Limestone
66.7% of women with births in Limestone are unmarried. Women with the educational attainment of college or associate's degree are most likely to be married with 100.0% of them married at childbirth, while women with the educational attainment of high school diploma are least likely to be married with 100.0% of them unmarried at childbirth.
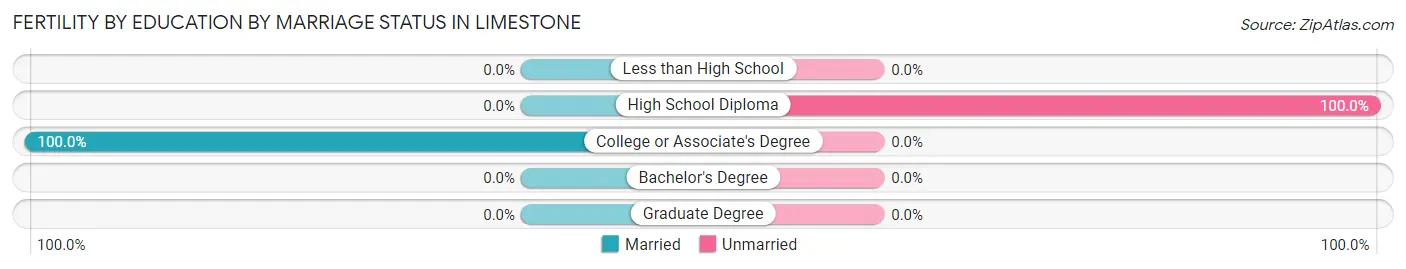
| Educational Attainment | Married | Unmarried |
| Less than High School | 0 (0.0%) | 0 (0.0%) |
| High School Diploma | 0 (0.0%) | 6 (100.0%) |
| College or Associate's Degree | 3 (100.0%) | 0 (0.0%) |
| Bachelor's Degree | 0 (0.0%) | 0 (0.0%) |
| Graduate Degree | 0 (0.0%) | 0 (0.0%) |
| Total | 3 (33.3%) | 6 (66.7%) |
Employment Characteristics in Limestone
Employment by Class of Employer in Limestone
Among the 397 employed individuals in Limestone, private company employees (130 | 32.8%), not-for-profit organizations (123 | 31.0%), and federal government employees (52 | 13.1%) make up the most common classes of employment.
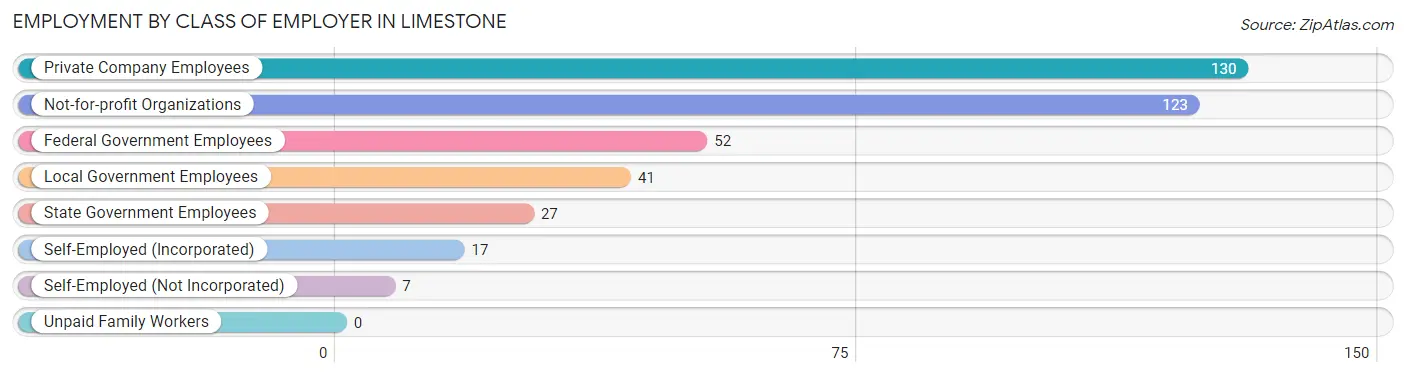
| Employer Class | # Employees | % Employees |
| Private Company Employees | 130 | 32.8% |
| Self-Employed (Incorporated) | 17 | 4.3% |
| Self-Employed (Not Incorporated) | 7 | 1.8% |
| Not-for-profit Organizations | 123 | 31.0% |
| Local Government Employees | 41 | 10.3% |
| State Government Employees | 27 | 6.8% |
| Federal Government Employees | 52 | 13.1% |
| Unpaid Family Workers | 0 | 0.0% |
| Total | 397 | 100.0% |
Employment Status by Age in Limestone
According to the labor force statistics for Limestone, out of the total population over 16 years of age (970), 42.5% or 412 individuals are in the labor force, with 2.4% or 10 of them unemployed. The age group with the highest labor force participation rate is 30 to 34 years, with 95.7% or 67 individuals in the labor force. Within the labor force, the 35 to 44 years age range has the highest percentage of unemployed individuals, with 17.9% or 10 of them being unemployed.
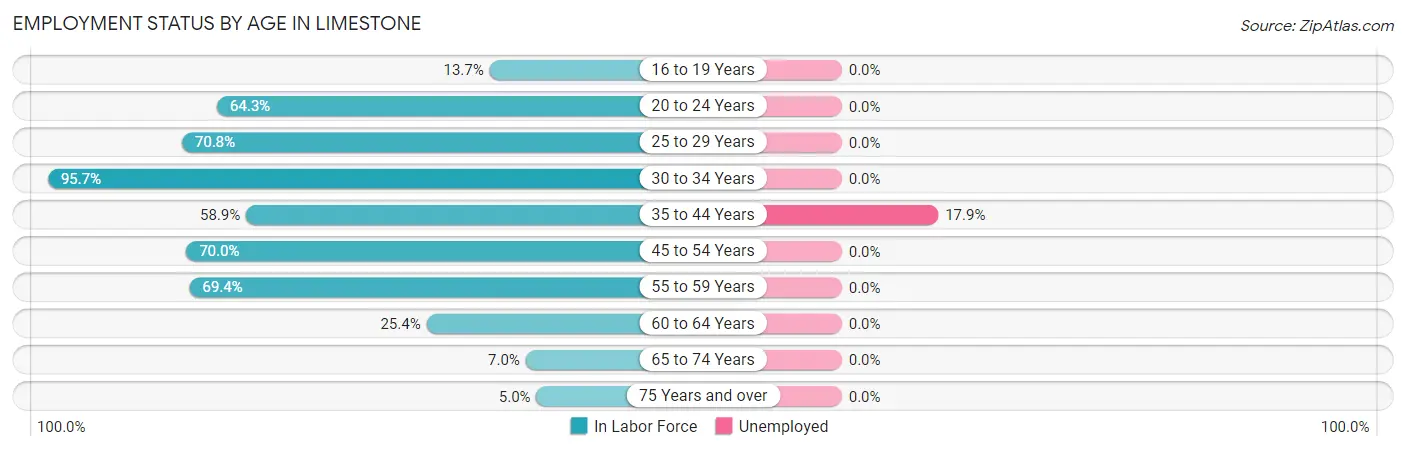
| Age Bracket | In Labor Force | Unemployed |
| 16 to 19 Years | 16 (13.7%) | 0 (0.0%) |
| 20 to 24 Years | 27 (64.3%) | 0 (0.0%) |
| 25 to 29 Years | 46 (70.8%) | 0 (0.0%) |
| 30 to 34 Years | 67 (95.7%) | 0 (0.0%) |
| 35 to 44 Years | 56 (58.9%) | 10 (17.9%) |
| 45 to 54 Years | 84 (70.0%) | 0 (0.0%) |
| 55 to 59 Years | 59 (69.4%) | 0 (0.0%) |
| 60 to 64 Years | 44 (25.4%) | 0 (0.0%) |
| 65 to 74 Years | 10 (7.0%) | 0 (0.0%) |
| 75 Years and over | 3 (5.0%) | 0 (0.0%) |
| Total | 412 (42.5%) | 10 (2.4%) |
Employment Status by Educational Attainment in Limestone
According to labor force statistics for Limestone, 58.6% of individuals (356) out of the total population between 25 and 64 years of age (608) are in the labor force, with 2.8% or 10 of them being unemployed. The group with the highest labor force participation rate are those with the educational attainment of bachelor's degree or higher, with 85.0% or 96 individuals in the labor force. Within the labor force, individuals with high school diploma education have the highest percentage of unemployment, with 14.7% or 10 of them being unemployed.
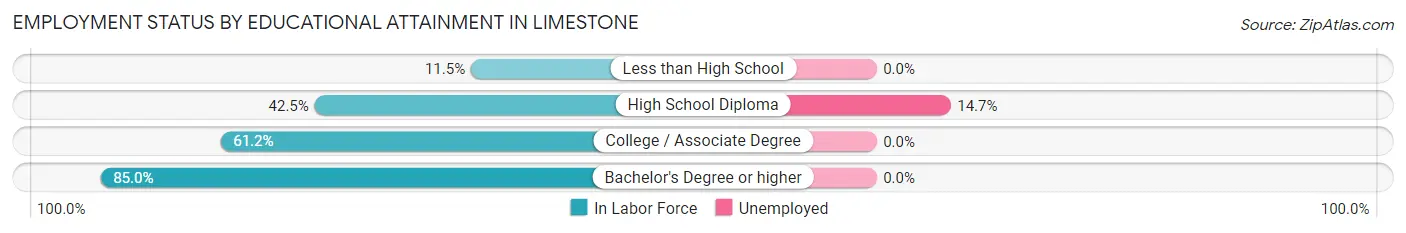
| Educational Attainment | In Labor Force | Unemployed |
| Less than High School | 3 (11.5%) | 0 (0.0%) |
| High School Diploma | 68 (42.5%) | 24 (14.7%) |
| College / Associate Degree | 189 (61.2%) | 0 (0.0%) |
| Bachelor's Degree or higher | 96 (85.0%) | 0 (0.0%) |
| Total | 356 (58.6%) | 17 (2.8%) |
Employment Occupations by Sex in Limestone
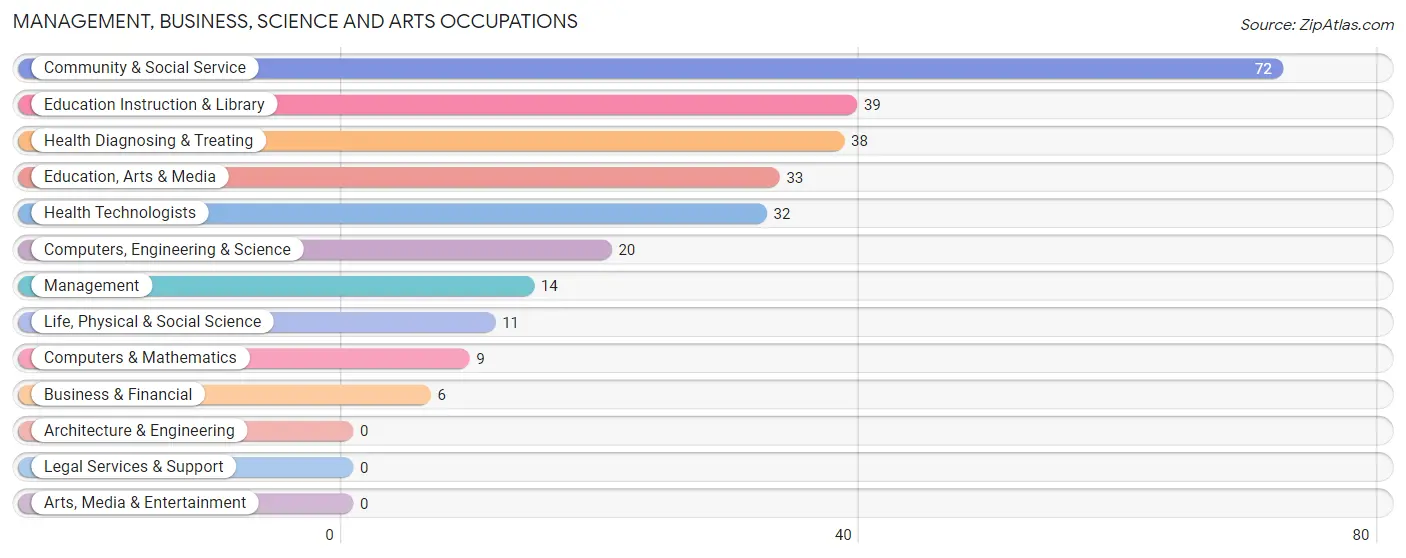
Management, Business, Science and Arts Occupations
The most common Management, Business, Science and Arts occupations in Limestone are Community & Social Service (72 | 17.9%), Education Instruction & Library (39 | 9.7%), Health Diagnosing & Treating (38 | 9.5%), Education, Arts & Media (33 | 8.2%), and Health Technologists (32 | 8.0%).
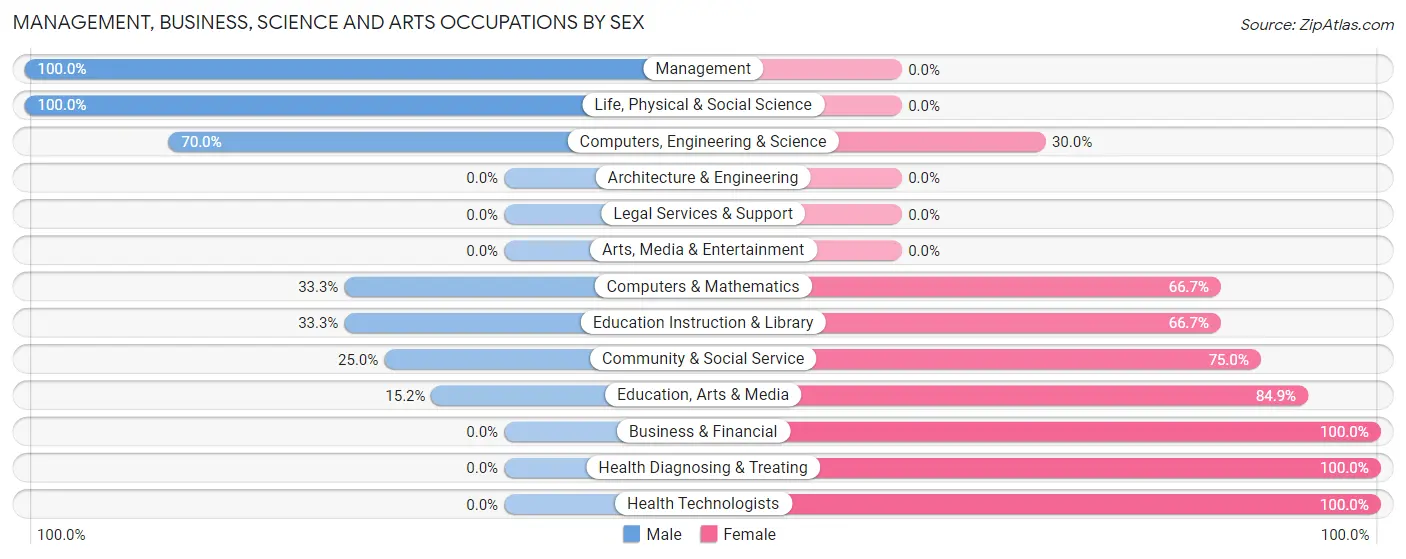
Management, Business, Science and Arts Occupations by Sex
Within the Management, Business, Science and Arts occupations in Limestone, the most male-oriented occupations are Management (100.0%), Life, Physical & Social Science (100.0%), and Computers, Engineering & Science (70.0%), while the most female-oriented occupations are Business & Financial (100.0%), Health Diagnosing & Treating (100.0%), and Health Technologists (100.0%).
| Occupation | Male | Female |
| Management | 14 (100.0%) | 0 (0.0%) |
| Business & Financial | 0 (0.0%) | 6 (100.0%) |
| Computers, Engineering & Science | 14 (70.0%) | 6 (30.0%) |
| Computers & Mathematics | 3 (33.3%) | 6 (66.7%) |
| Architecture & Engineering | 0 (0.0%) | 0 (0.0%) |
| Life, Physical & Social Science | 11 (100.0%) | 0 (0.0%) |
| Community & Social Service | 18 (25.0%) | 54 (75.0%) |
| Education, Arts & Media | 5 (15.1%) | 28 (84.9%) |
| Legal Services & Support | 0 (0.0%) | 0 (0.0%) |
| Education Instruction & Library | 13 (33.3%) | 26 (66.7%) |
| Arts, Media & Entertainment | 0 (0.0%) | 0 (0.0%) |
| Health Diagnosing & Treating | 0 (0.0%) | 38 (100.0%) |
| Health Technologists | 0 (0.0%) | 32 (100.0%) |
| Total (Category) | 46 (30.7%) | 104 (69.3%) |
| Total (Overall) | 191 (47.5%) | 211 (52.5%) |
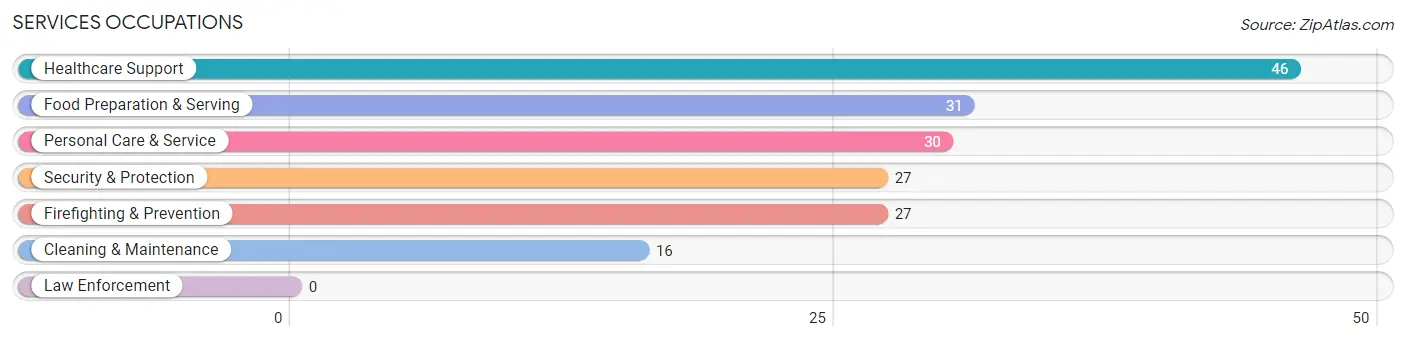
Services Occupations
The most common Services occupations in Limestone are Healthcare Support (46 | 11.4%), Food Preparation & Serving (31 | 7.7%), Personal Care & Service (30 | 7.5%), Security & Protection (27 | 6.7%), and Firefighting & Prevention (27 | 6.7%).
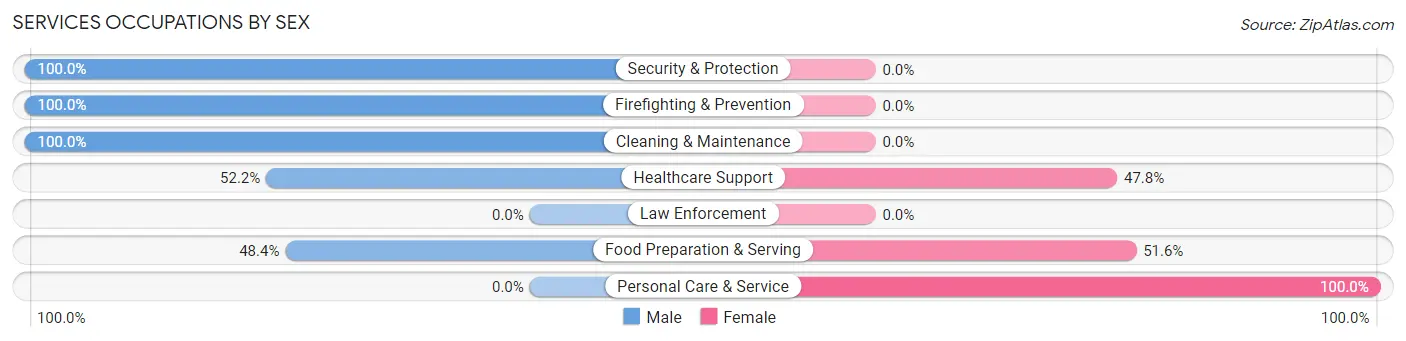
Services Occupations by Sex
Within the Services occupations in Limestone, the most male-oriented occupations are Security & Protection (100.0%), Firefighting & Prevention (100.0%), and Cleaning & Maintenance (100.0%), while the most female-oriented occupations are Personal Care & Service (100.0%), Food Preparation & Serving (51.6%), and Healthcare Support (47.8%).
| Occupation | Male | Female |
| Healthcare Support | 24 (52.2%) | 22 (47.8%) |
| Security & Protection | 27 (100.0%) | 0 (0.0%) |
| Firefighting & Prevention | 27 (100.0%) | 0 (0.0%) |
| Law Enforcement | 0 (0.0%) | 0 (0.0%) |
| Food Preparation & Serving | 15 (48.4%) | 16 (51.6%) |
| Cleaning & Maintenance | 16 (100.0%) | 0 (0.0%) |
| Personal Care & Service | 0 (0.0%) | 30 (100.0%) |
| Total (Category) | 82 (54.7%) | 68 (45.3%) |
| Total (Overall) | 191 (47.5%) | 211 (52.5%) |
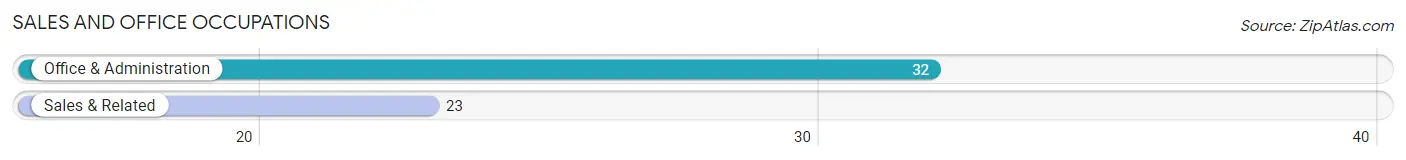
Sales and Office Occupations
The most common Sales and Office occupations in Limestone are Office & Administration (32 | 8.0%), and Sales & Related (23 | 5.7%).
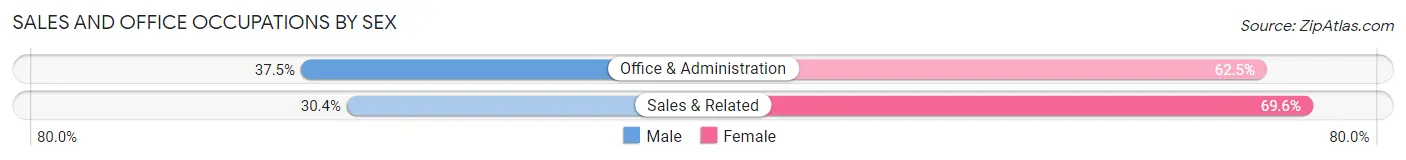
Sales and Office Occupations by Sex
| Occupation | Male | Female |
| Sales & Related | 7 (30.4%) | 16 (69.6%) |
| Office & Administration | 12 (37.5%) | 20 (62.5%) |
| Total (Category) | 19 (34.5%) | 36 (65.4%) |
| Total (Overall) | 191 (47.5%) | 211 (52.5%) |
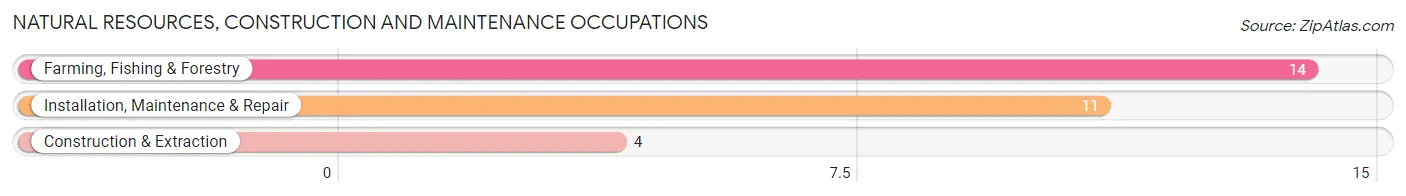
Natural Resources, Construction and Maintenance Occupations
The most common Natural Resources, Construction and Maintenance occupations in Limestone are Farming, Fishing & Forestry (14 | 3.5%), Installation, Maintenance & Repair (11 | 2.7%), and Construction & Extraction (4 | 1.0%).
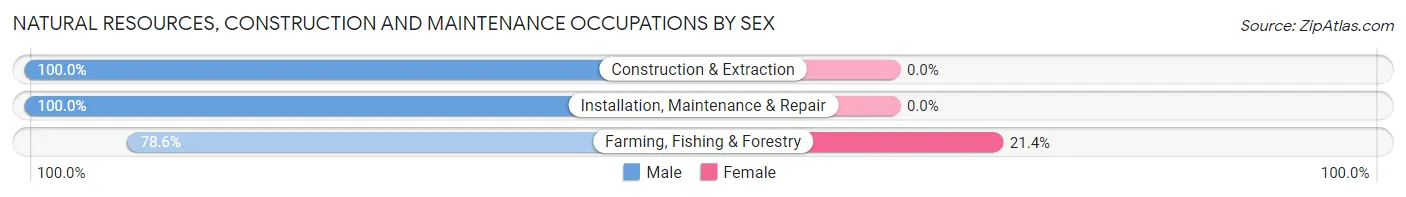
Natural Resources, Construction and Maintenance Occupations by Sex
| Occupation | Male | Female |
| Farming, Fishing & Forestry | 11 (78.6%) | 3 (21.4%) |
| Construction & Extraction | 4 (100.0%) | 0 (0.0%) |
| Installation, Maintenance & Repair | 11 (100.0%) | 0 (0.0%) |
| Total (Category) | 26 (89.7%) | 3 (10.3%) |
| Total (Overall) | 191 (47.5%) | 211 (52.5%) |
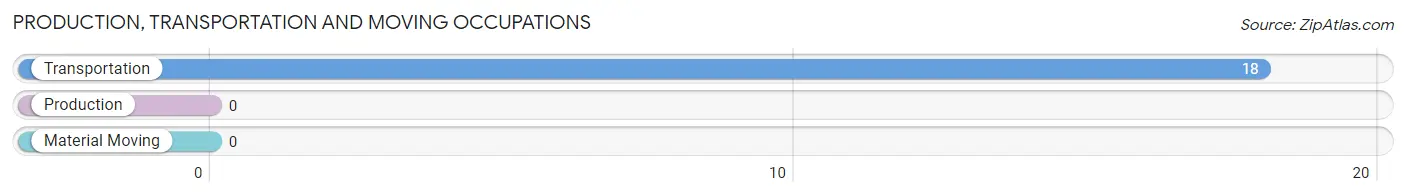
Production, Transportation and Moving Occupations
The most common Production, Transportation and Moving occupations in Limestone are , and Transportation (18 | 4.5%).
Production, Transportation and Moving Occupations by Sex
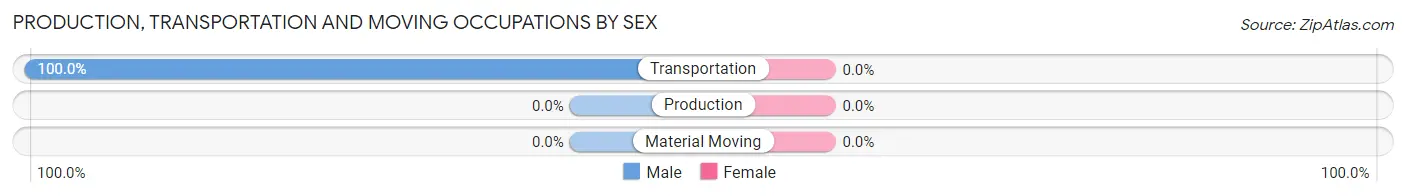
| Occupation | Male | Female |
| Production | 0 (0.0%) | 0 (0.0%) |
| Transportation | 18 (100.0%) | 0 (0.0%) |
| Material Moving | 0 (0.0%) | 0 (0.0%) |
| Total (Category) | 18 (100.0%) | 0 (0.0%) |
| Total (Overall) | 191 (47.5%) | 211 (52.5%) |
Employment Industries by Sex in Limestone
Employment Industries in Limestone
The major employment industries in Limestone include Health Care & Social Assistance (147 | 36.6%), Public Administration (77 | 19.2%), Accommodation & Food Services (60 | 14.9%), Educational Services (48 | 11.9%), and Construction (18 | 4.5%).
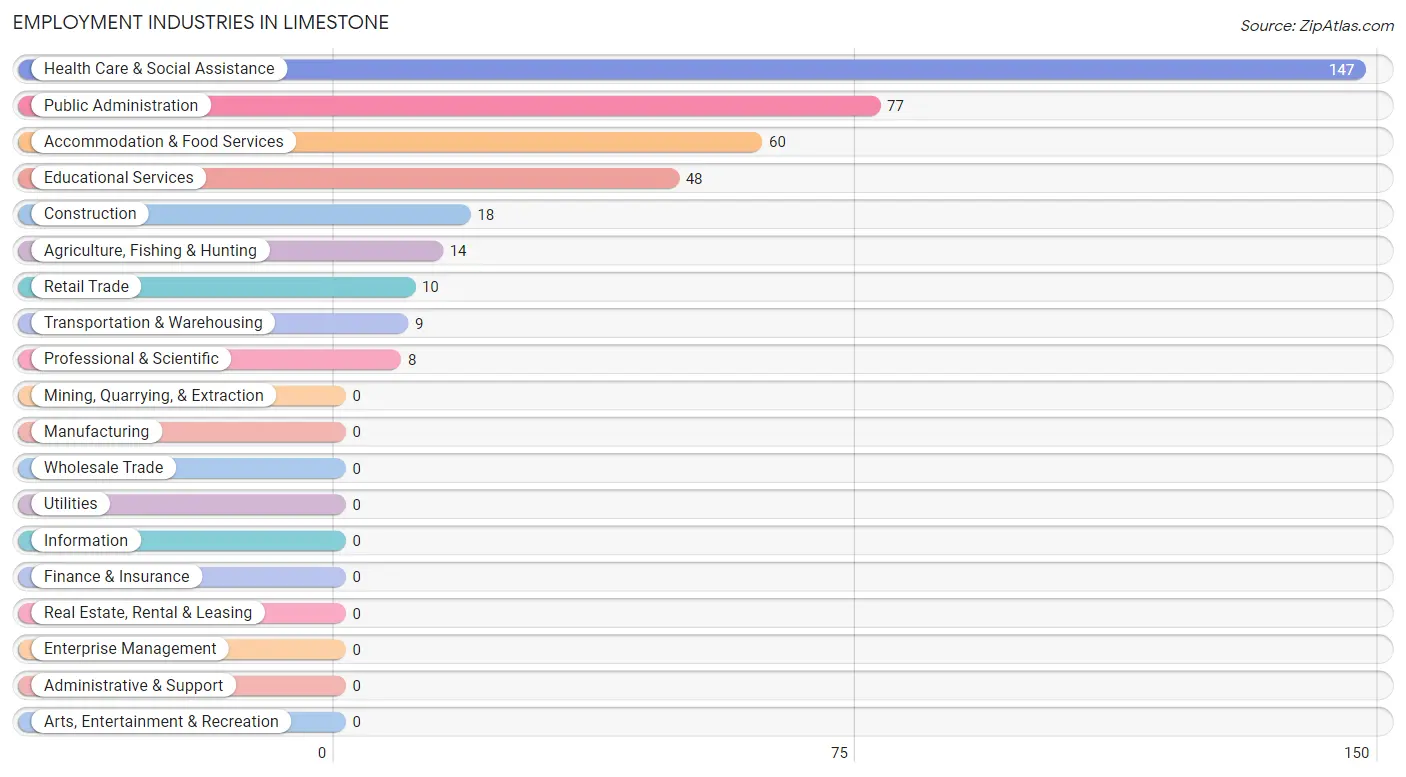
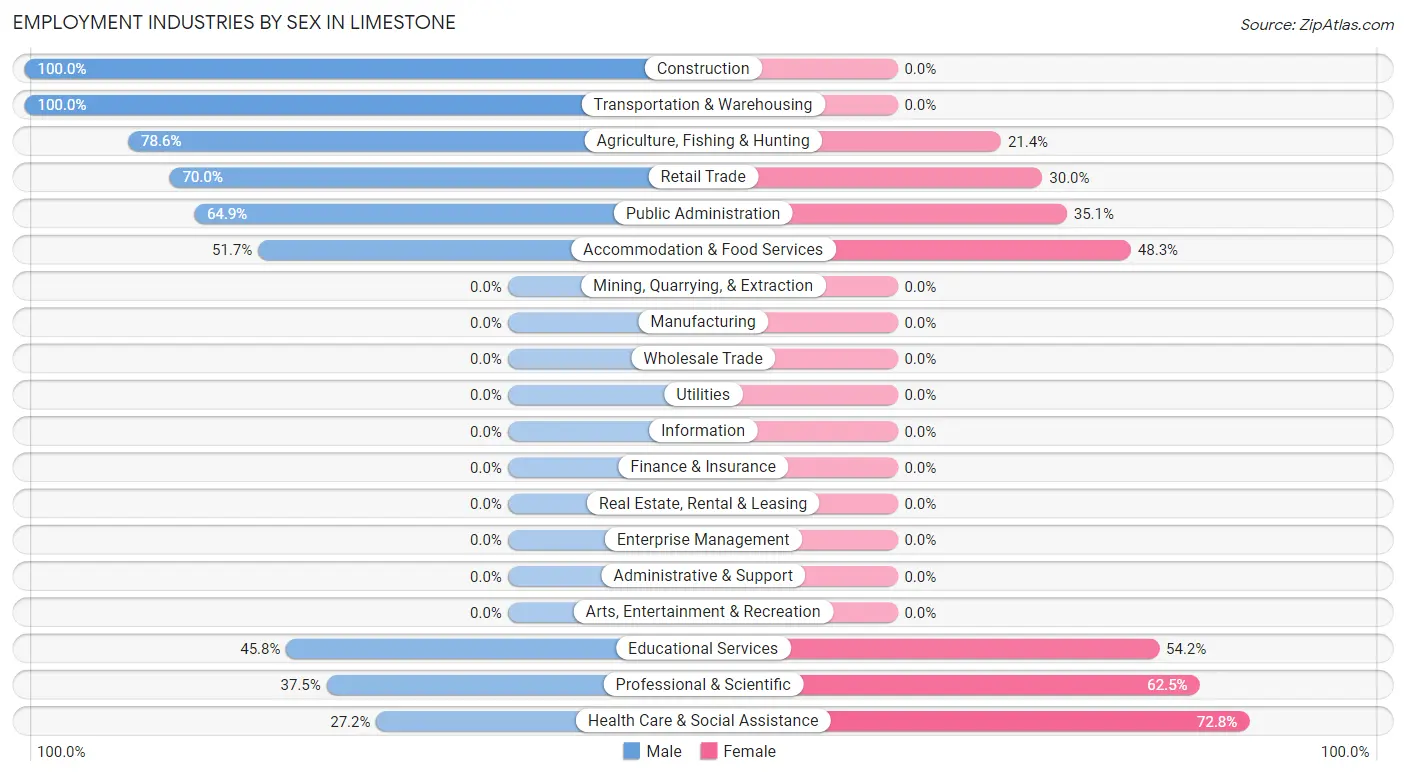
Employment Industries by Sex in Limestone
The Limestone industries that see more men than women are Construction (100.0%), Transportation & Warehousing (100.0%), and Agriculture, Fishing & Hunting (78.6%), whereas the industries that tend to have a higher number of women are Health Care & Social Assistance (72.8%), Professional & Scientific (62.5%), and Educational Services (54.2%).
| Industry | Male | Female |
| Agriculture, Fishing & Hunting | 11 (78.6%) | 3 (21.4%) |
| Mining, Quarrying, & Extraction | 0 (0.0%) | 0 (0.0%) |
| Construction | 18 (100.0%) | 0 (0.0%) |
| Manufacturing | 0 (0.0%) | 0 (0.0%) |
| Wholesale Trade | 0 (0.0%) | 0 (0.0%) |
| Retail Trade | 7 (70.0%) | 3 (30.0%) |
| Transportation & Warehousing | 9 (100.0%) | 0 (0.0%) |
| Utilities | 0 (0.0%) | 0 (0.0%) |
| Information | 0 (0.0%) | 0 (0.0%) |
| Finance & Insurance | 0 (0.0%) | 0 (0.0%) |
| Real Estate, Rental & Leasing | 0 (0.0%) | 0 (0.0%) |
| Professional & Scientific | 3 (37.5%) | 5 (62.5%) |
| Enterprise Management | 0 (0.0%) | 0 (0.0%) |
| Administrative & Support | 0 (0.0%) | 0 (0.0%) |
| Educational Services | 22 (45.8%) | 26 (54.2%) |
| Health Care & Social Assistance | 40 (27.2%) | 107 (72.8%) |
| Arts, Entertainment & Recreation | 0 (0.0%) | 0 (0.0%) |
| Accommodation & Food Services | 31 (51.7%) | 29 (48.3%) |
| Public Administration | 50 (64.9%) | 27 (35.1%) |
| Total | 191 (47.5%) | 211 (52.5%) |
Education in Limestone
School Enrollment in Limestone
The most common levels of schooling among the 364 students in Limestone are college / undergraduate (216 | 59.3%), kindergarten (50 | 13.7%), and middle school (40 | 11.0%).
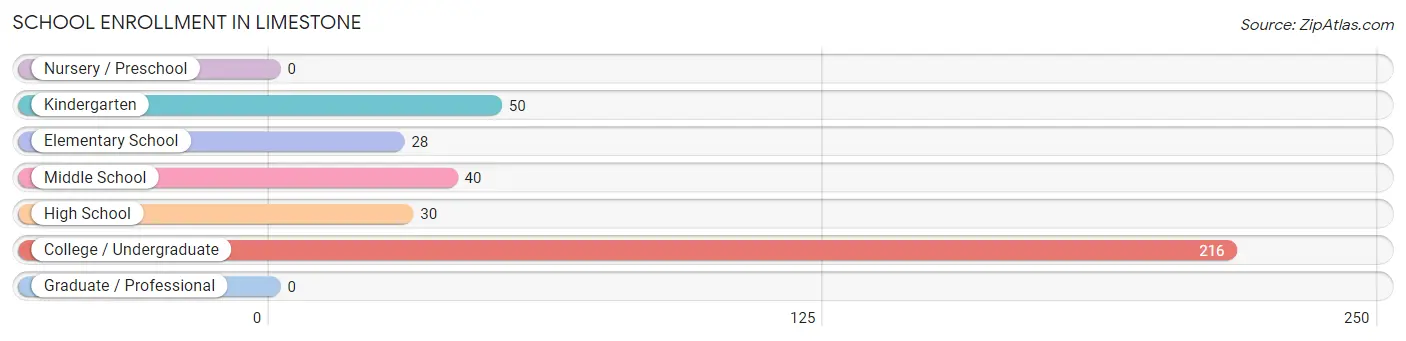
| School Level | # Students | % Students |
| Nursery / Preschool | 0 | 0.0% |
| Kindergarten | 50 | 13.7% |
| Elementary School | 28 | 7.7% |
| Middle School | 40 | 11.0% |
| High School | 30 | 8.2% |
| College / Undergraduate | 216 | 59.3% |
| Graduate / Professional | 0 | 0.0% |
| Total | 364 | 100.0% |
School Enrollment by Age by Funding Source in Limestone
Out of a total of 364 students who are enrolled in schools in Limestone, 85 (23.4%) attend a private institution, while the remaining 279 (76.6%) are enrolled in public schools. The age group of 35 years and over has the highest likelihood of being enrolled in private schools, with 44 (59.5% in the age bracket) enrolled. Conversely, the age group of 5 to 9 year old has the lowest likelihood of being enrolled in a private school, with 61 (100.0% in the age bracket) attending a public institution.
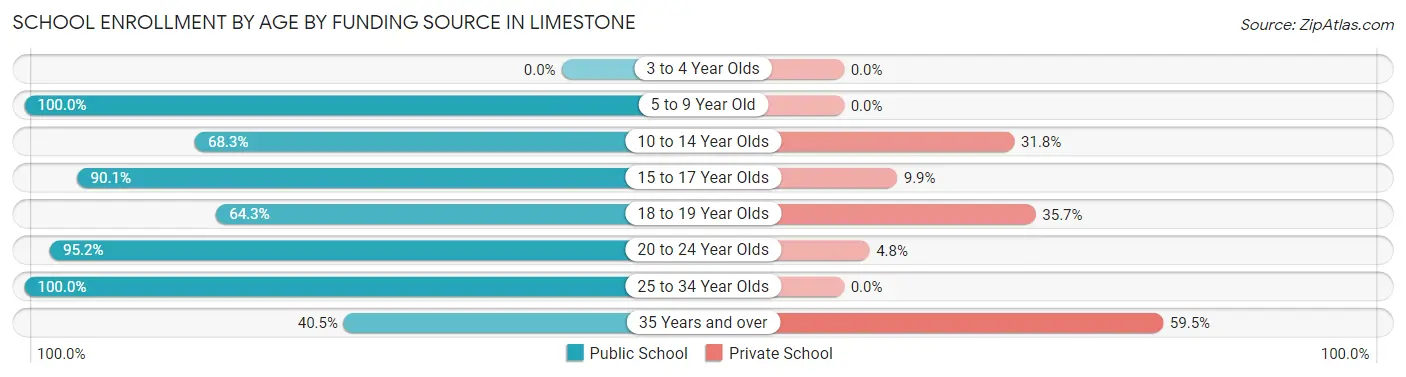
| Age Bracket | Public School | Private School |
| 3 to 4 Year Olds | 0 (0.0%) | 0 (0.0%) |
| 5 to 9 Year Old | 61 (100.0%) | 0 (0.0%) |
| 10 to 14 Year Olds | 43 (68.2%) | 20 (31.8%) |
| 15 to 17 Year Olds | 82 (90.1%) | 9 (9.9%) |
| 18 to 19 Year Olds | 18 (64.3%) | 10 (35.7%) |
| 20 to 24 Year Olds | 40 (95.2%) | 2 (4.8%) |
| 25 to 34 Year Olds | 5 (100.0%) | 0 (0.0%) |
| 35 Years and over | 30 (40.5%) | 44 (59.5%) |
| Total | 279 (76.6%) | 85 (23.4%) |
Educational Attainment by Field of Study in Limestone
Science & technology (43 | 28.3%), education (35 | 23.0%), bio, nature & agricultural (17 | 11.2%), business (15 | 9.9%), and social sciences (10 | 6.6%) are the most common fields of study among 152 individuals in Limestone who have obtained a bachelor's degree or higher.
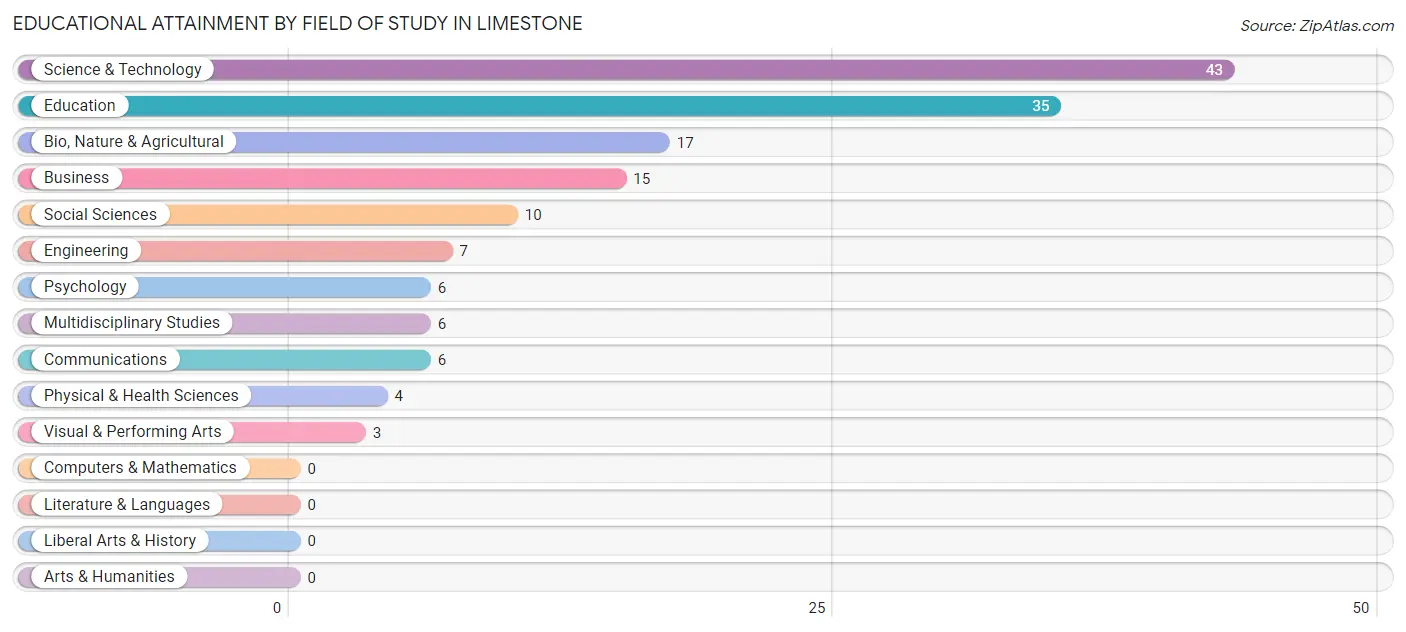
| Field of Study | # Graduates | % Graduates |
| Computers & Mathematics | 0 | 0.0% |
| Bio, Nature & Agricultural | 17 | 11.2% |
| Physical & Health Sciences | 4 | 2.6% |
| Psychology | 6 | 4.0% |
| Social Sciences | 10 | 6.6% |
| Engineering | 7 | 4.6% |
| Multidisciplinary Studies | 6 | 4.0% |
| Science & Technology | 43 | 28.3% |
| Business | 15 | 9.9% |
| Education | 35 | 23.0% |
| Literature & Languages | 0 | 0.0% |
| Liberal Arts & History | 0 | 0.0% |
| Visual & Performing Arts | 3 | 2.0% |
| Communications | 6 | 4.0% |
| Arts & Humanities | 0 | 0.0% |
| Total | 152 | 100.0% |
Transportation & Commute in Limestone
Vehicle Availability by Sex in Limestone
The most prevalent vehicle ownership categories in Limestone are males with 2 vehicles (83, accounting for 48.0%) and females with 2 vehicles (87, making up 43.7%).
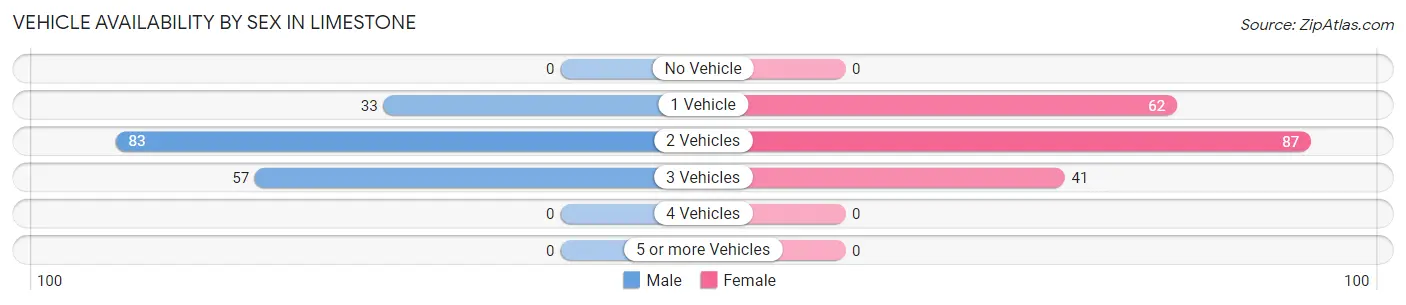
| Vehicles Available | Male | Female |
| No Vehicle | 0 (0.0%) | 0 (0.0%) |
| 1 Vehicle | 33 (19.1%) | 62 (32.6%) |
| 2 Vehicles | 83 (48.0%) | 87 (45.8%) |
| 3 Vehicles | 57 (33.0%) | 41 (21.6%) |
| 4 Vehicles | 0 (0.0%) | 0 (0.0%) |
| 5 or more Vehicles | 0 (0.0%) | 0 (0.0%) |
| Total | 173 (100.0%) | 190 (100.0%) |
Commute Time in Limestone
The most frequently occuring commute durations in Limestone are 10 to 14 minutes (88 commuters, 23.5%), 30 to 34 minutes (88 commuters, 23.5%), and 20 to 24 minutes (67 commuters, 17.9%).
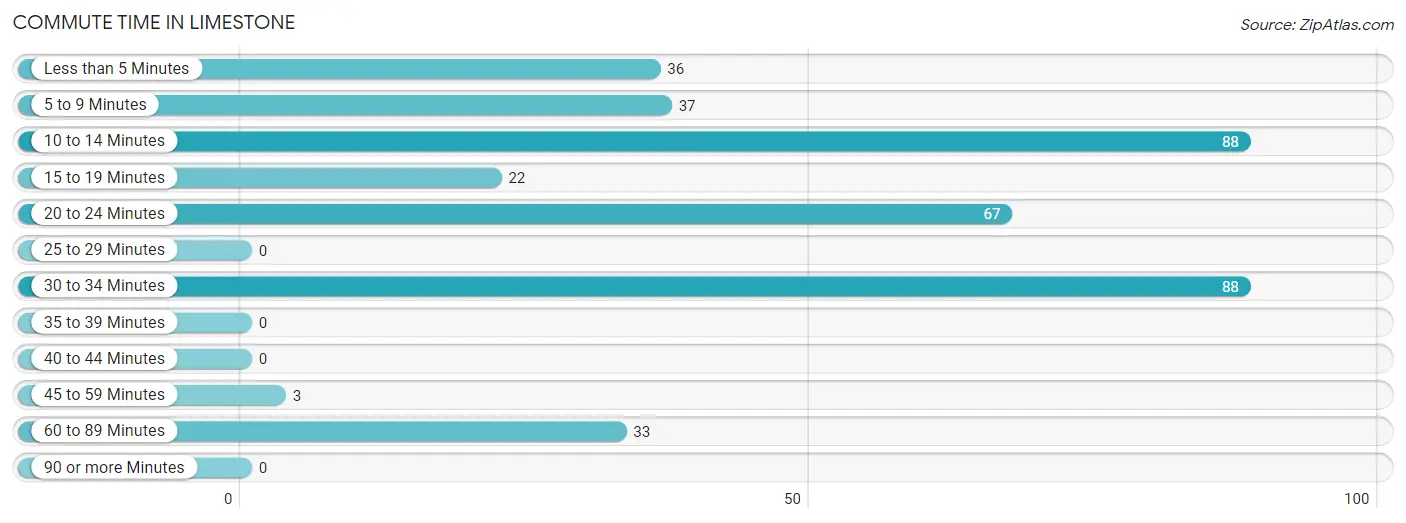
| Commute Time | # Commuters | % Commuters |
| Less than 5 Minutes | 36 | 9.6% |
| 5 to 9 Minutes | 37 | 9.9% |
| 10 to 14 Minutes | 88 | 23.5% |
| 15 to 19 Minutes | 22 | 5.9% |
| 20 to 24 Minutes | 67 | 17.9% |
| 25 to 29 Minutes | 0 | 0.0% |
| 30 to 34 Minutes | 88 | 23.5% |
| 35 to 39 Minutes | 0 | 0.0% |
| 40 to 44 Minutes | 0 | 0.0% |
| 45 to 59 Minutes | 3 | 0.8% |
| 60 to 89 Minutes | 33 | 8.8% |
| 90 or more Minutes | 0 | 0.0% |
Commute Time by Sex in Limestone
The most common commute times in Limestone are 10 to 14 minutes (57 commuters, 31.8%) for males and 20 to 24 minutes (43 commuters, 22.1%) for females.
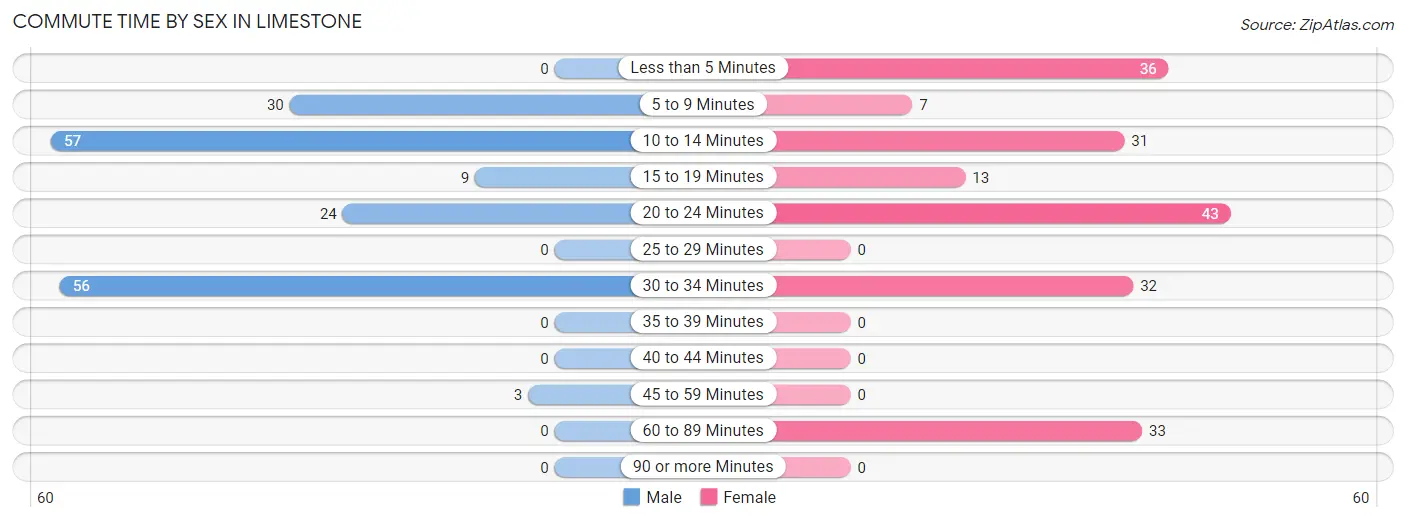
| Commute Time | Male | Female |
| Less than 5 Minutes | 0 (0.0%) | 36 (18.5%) |
| 5 to 9 Minutes | 30 (16.8%) | 7 (3.6%) |
| 10 to 14 Minutes | 57 (31.8%) | 31 (15.9%) |
| 15 to 19 Minutes | 9 (5.0%) | 13 (6.7%) |
| 20 to 24 Minutes | 24 (13.4%) | 43 (22.1%) |
| 25 to 29 Minutes | 0 (0.0%) | 0 (0.0%) |
| 30 to 34 Minutes | 56 (31.3%) | 32 (16.4%) |
| 35 to 39 Minutes | 0 (0.0%) | 0 (0.0%) |
| 40 to 44 Minutes | 0 (0.0%) | 0 (0.0%) |
| 45 to 59 Minutes | 3 (1.7%) | 0 (0.0%) |
| 60 to 89 Minutes | 0 (0.0%) | 33 (16.9%) |
| 90 or more Minutes | 0 (0.0%) | 0 (0.0%) |
Time of Departure to Work by Sex in Limestone
The most frequent times of departure to work in Limestone are 6:00 AM to 6:29 AM (55, 30.7%) for males and 7:00 AM to 7:29 AM (113, 58.0%) for females.
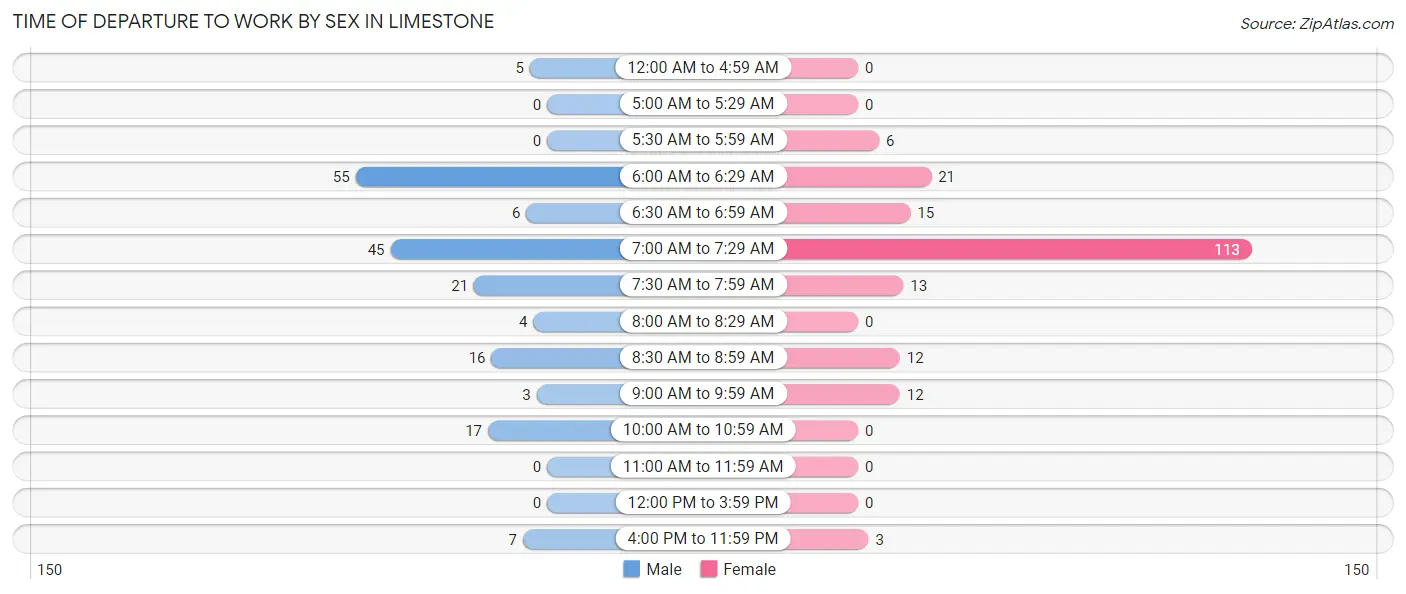
| Time of Departure | Male | Female |
| 12:00 AM to 4:59 AM | 5 (2.8%) | 0 (0.0%) |
| 5:00 AM to 5:29 AM | 0 (0.0%) | 0 (0.0%) |
| 5:30 AM to 5:59 AM | 0 (0.0%) | 6 (3.1%) |
| 6:00 AM to 6:29 AM | 55 (30.7%) | 21 (10.8%) |
| 6:30 AM to 6:59 AM | 6 (3.4%) | 15 (7.7%) |
| 7:00 AM to 7:29 AM | 45 (25.1%) | 113 (58.0%) |
| 7:30 AM to 7:59 AM | 21 (11.7%) | 13 (6.7%) |
| 8:00 AM to 8:29 AM | 4 (2.2%) | 0 (0.0%) |
| 8:30 AM to 8:59 AM | 16 (8.9%) | 12 (6.1%) |
| 9:00 AM to 9:59 AM | 3 (1.7%) | 12 (6.1%) |
| 10:00 AM to 10:59 AM | 17 (9.5%) | 0 (0.0%) |
| 11:00 AM to 11:59 AM | 0 (0.0%) | 0 (0.0%) |
| 12:00 PM to 3:59 PM | 0 (0.0%) | 0 (0.0%) |
| 4:00 PM to 11:59 PM | 7 (3.9%) | 3 (1.5%) |
| Total | 179 (100.0%) | 195 (100.0%) |
Housing Occupancy in Limestone
Occupancy by Ownership in Limestone
Of the total 473 dwellings in Limestone, owner-occupied units account for 291 (61.5%), while renter-occupied units make up 182 (38.5%).
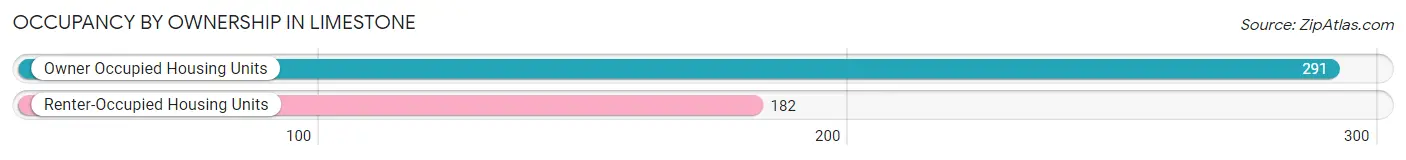
| Occupancy | # Housing Units | % Housing Units |
| Owner Occupied Housing Units | 291 | 61.5% |
| Renter-Occupied Housing Units | 182 | 38.5% |
| Total Occupied Housing Units | 473 | 100.0% |
Occupancy by Household Size in Limestone
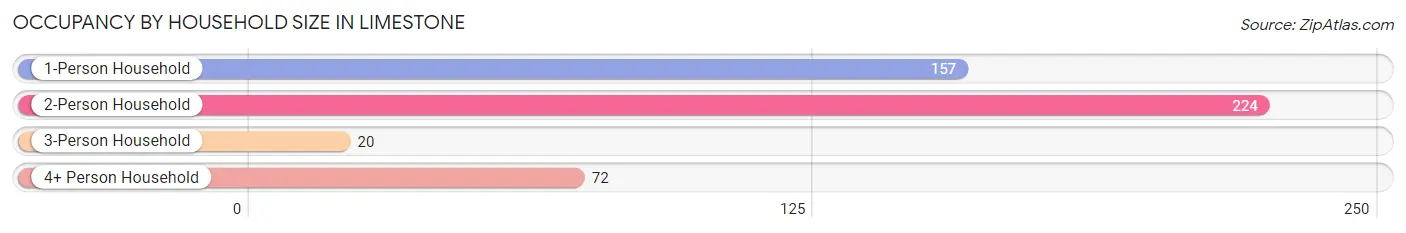
| Household Size | # Housing Units | % Housing Units |
| 1-Person Household | 157 | 33.2% |
| 2-Person Household | 224 | 47.4% |
| 3-Person Household | 20 | 4.2% |
| 4+ Person Household | 72 | 15.2% |
| Total Housing Units | 473 | 100.0% |
Occupancy by Ownership by Household Size in Limestone
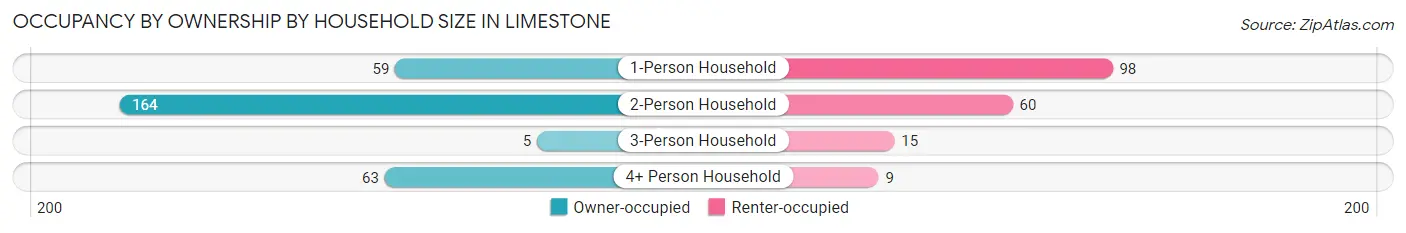
| Household Size | Owner-occupied | Renter-occupied |
| 1-Person Household | 59 (37.6%) | 98 (62.4%) |
| 2-Person Household | 164 (73.2%) | 60 (26.8%) |
| 3-Person Household | 5 (25.0%) | 15 (75.0%) |
| 4+ Person Household | 63 (87.5%) | 9 (12.5%) |
| Total Housing Units | 291 (61.5%) | 182 (38.5%) |
Occupancy by Educational Attainment in Limestone
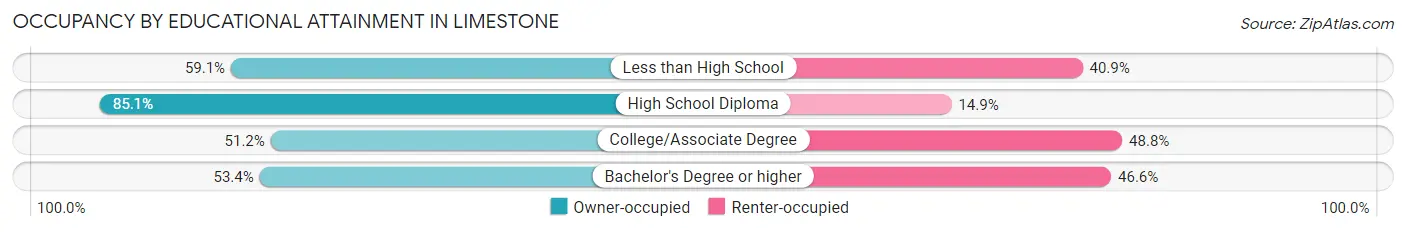
| Household Size | Owner-occupied | Renter-occupied |
| Less than High School | 13 (59.1%) | 9 (40.9%) |
| High School Diploma | 114 (85.1%) | 20 (14.9%) |
| College/Associate Degree | 125 (51.2%) | 119 (48.8%) |
| Bachelor's Degree or higher | 39 (53.4%) | 34 (46.6%) |
Occupancy by Age of Householder in Limestone
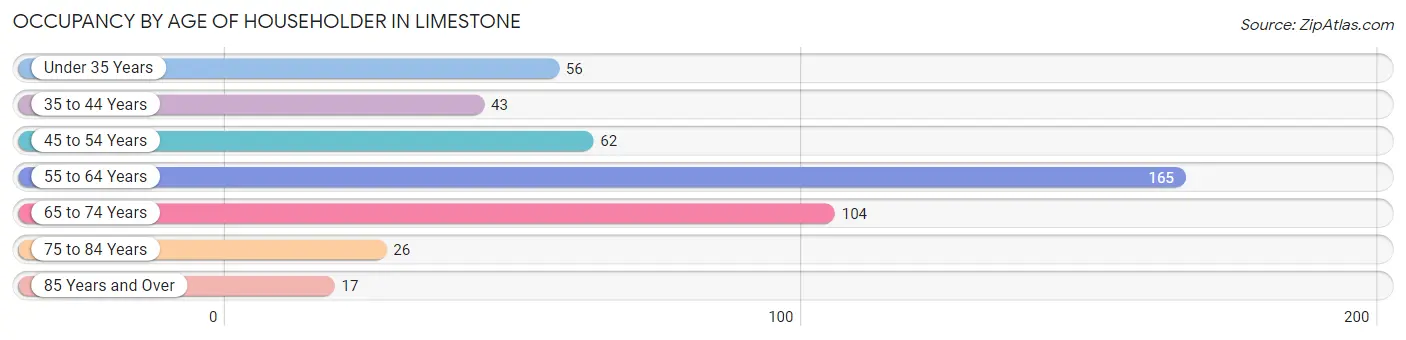
| Age Bracket | # Households | % Households |
| Under 35 Years | 56 | 11.8% |
| 35 to 44 Years | 43 | 9.1% |
| 45 to 54 Years | 62 | 13.1% |
| 55 to 64 Years | 165 | 34.9% |
| 65 to 74 Years | 104 | 22.0% |
| 75 to 84 Years | 26 | 5.5% |
| 85 Years and Over | 17 | 3.6% |
| Total | 473 | 100.0% |
Housing Finances in Limestone
Median Income by Occupancy in Limestone
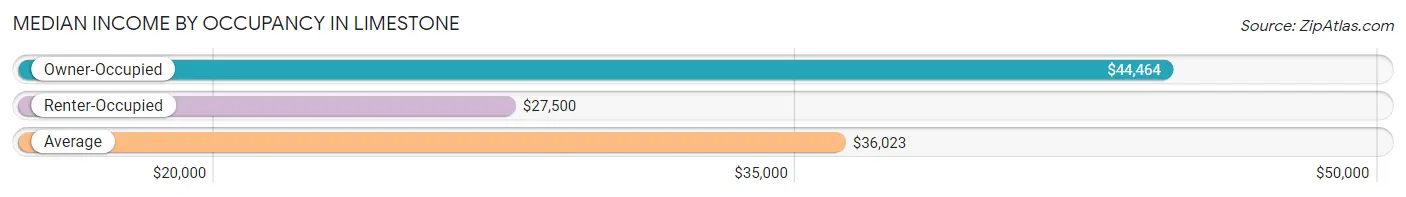
| Occupancy Type | # Households | Median Income |
| Owner-Occupied | 291 (61.5%) | $44,464 |
| Renter-Occupied | 182 (38.5%) | $27,500 |
| Average | 473 (100.0%) | $36,023 |
Occupancy by Householder Income Bracket in Limestone
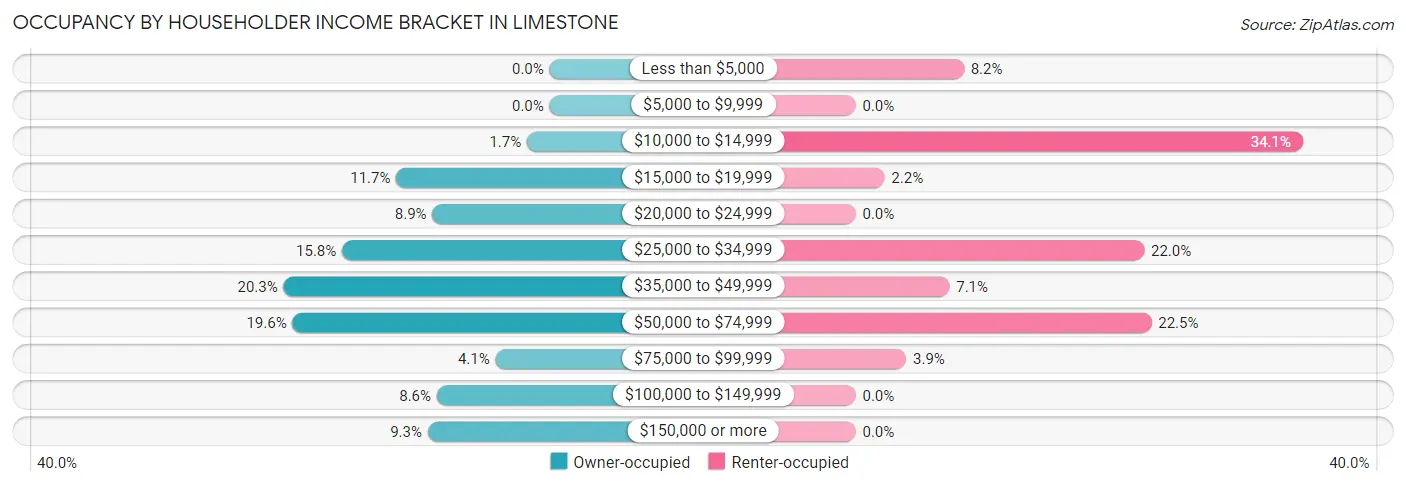
| Income Bracket | Owner-occupied | Renter-occupied |
| Less than $5,000 | 0 (0.0%) | 15 (8.2%) |
| $5,000 to $9,999 | 0 (0.0%) | 0 (0.0%) |
| $10,000 to $14,999 | 5 (1.7%) | 62 (34.1%) |
| $15,000 to $19,999 | 34 (11.7%) | 4 (2.2%) |
| $20,000 to $24,999 | 26 (8.9%) | 0 (0.0%) |
| $25,000 to $34,999 | 46 (15.8%) | 40 (22.0%) |
| $35,000 to $49,999 | 59 (20.3%) | 13 (7.1%) |
| $50,000 to $74,999 | 57 (19.6%) | 41 (22.5%) |
| $75,000 to $99,999 | 12 (4.1%) | 7 (3.8%) |
| $100,000 to $149,999 | 25 (8.6%) | 0 (0.0%) |
| $150,000 or more | 27 (9.3%) | 0 (0.0%) |
| Total | 291 (100.0%) | 182 (100.0%) |
Monthly Housing Cost Tiers in Limestone
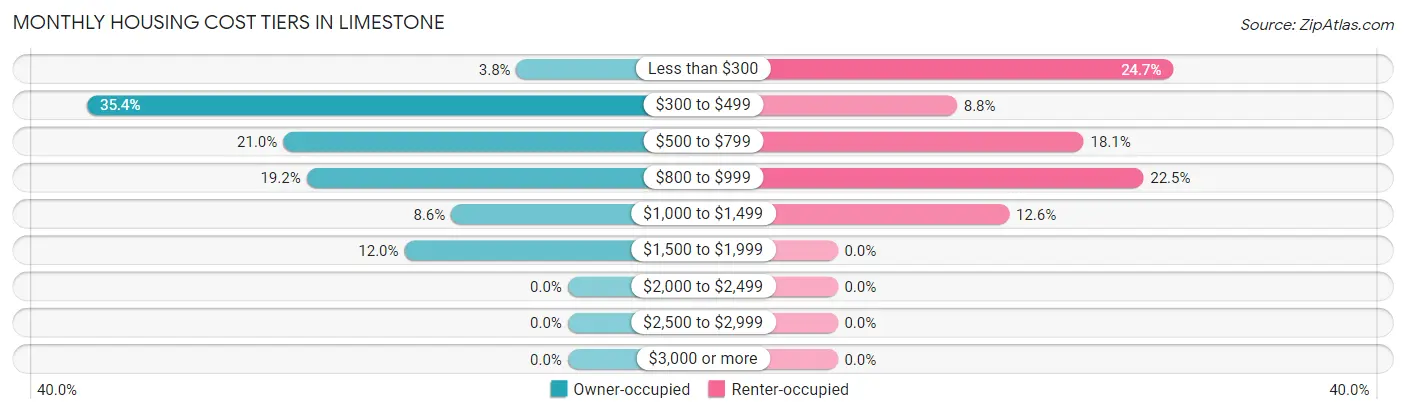
| Monthly Cost | Owner-occupied | Renter-occupied |
| Less than $300 | 11 (3.8%) | 45 (24.7%) |
| $300 to $499 | 103 (35.4%) | 16 (8.8%) |
| $500 to $799 | 61 (21.0%) | 33 (18.1%) |
| $800 to $999 | 56 (19.2%) | 41 (22.5%) |
| $1,000 to $1,499 | 25 (8.6%) | 23 (12.6%) |
| $1,500 to $1,999 | 35 (12.0%) | 0 (0.0%) |
| $2,000 to $2,499 | 0 (0.0%) | 0 (0.0%) |
| $2,500 to $2,999 | 0 (0.0%) | 0 (0.0%) |
| $3,000 or more | 0 (0.0%) | 0 (0.0%) |
| Total | 291 (100.0%) | 182 (100.0%) |
Physical Housing Characteristics in Limestone
Housing Structures in Limestone
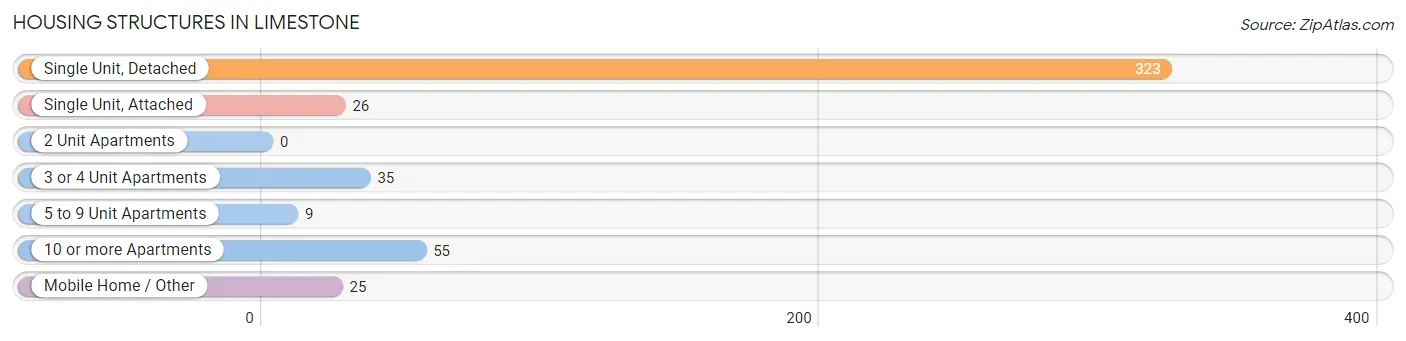
| Structure Type | # Housing Units | % Housing Units |
| Single Unit, Detached | 323 | 68.3% |
| Single Unit, Attached | 26 | 5.5% |
| 2 Unit Apartments | 0 | 0.0% |
| 3 or 4 Unit Apartments | 35 | 7.4% |
| 5 to 9 Unit Apartments | 9 | 1.9% |
| 10 or more Apartments | 55 | 11.6% |
| Mobile Home / Other | 25 | 5.3% |
| Total | 473 | 100.0% |
Housing Structures by Occupancy in Limestone
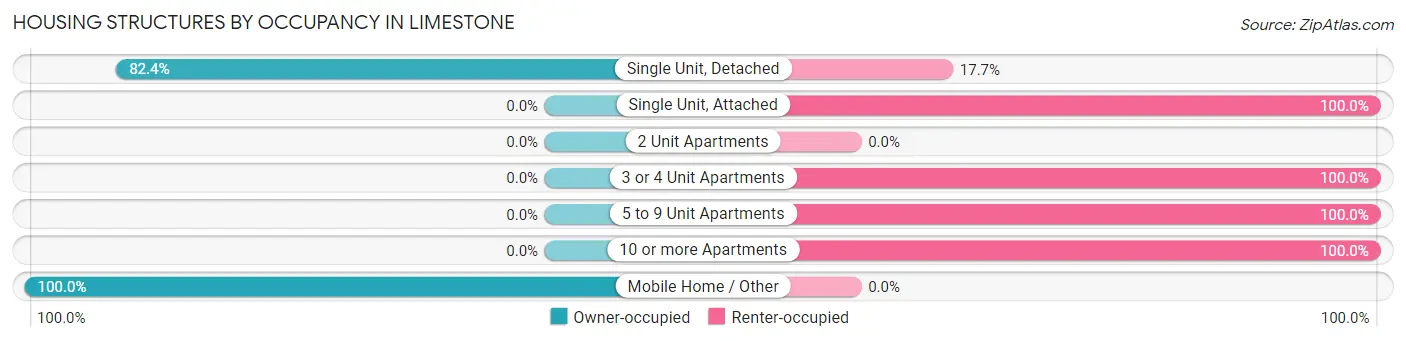
| Structure Type | Owner-occupied | Renter-occupied |
| Single Unit, Detached | 266 (82.4%) | 57 (17.6%) |
| Single Unit, Attached | 0 (0.0%) | 26 (100.0%) |
| 2 Unit Apartments | 0 (0.0%) | 0 (0.0%) |
| 3 or 4 Unit Apartments | 0 (0.0%) | 35 (100.0%) |
| 5 to 9 Unit Apartments | 0 (0.0%) | 9 (100.0%) |
| 10 or more Apartments | 0 (0.0%) | 55 (100.0%) |
| Mobile Home / Other | 25 (100.0%) | 0 (0.0%) |
| Total | 291 (61.5%) | 182 (38.5%) |
Housing Structures by Number of Rooms in Limestone
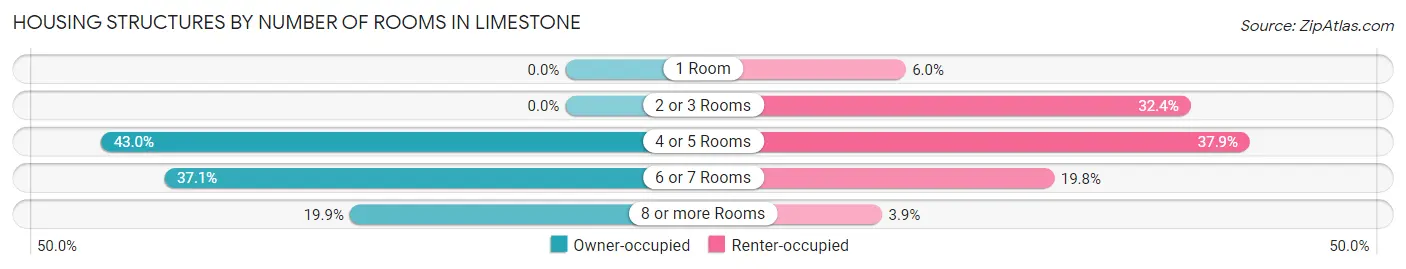
| Number of Rooms | Owner-occupied | Renter-occupied |
| 1 Room | 0 (0.0%) | 11 (6.0%) |
| 2 or 3 Rooms | 0 (0.0%) | 59 (32.4%) |
| 4 or 5 Rooms | 125 (43.0%) | 69 (37.9%) |
| 6 or 7 Rooms | 108 (37.1%) | 36 (19.8%) |
| 8 or more Rooms | 58 (19.9%) | 7 (3.8%) |
| Total | 291 (100.0%) | 182 (100.0%) |
Housing Structure by Heating Type in Limestone
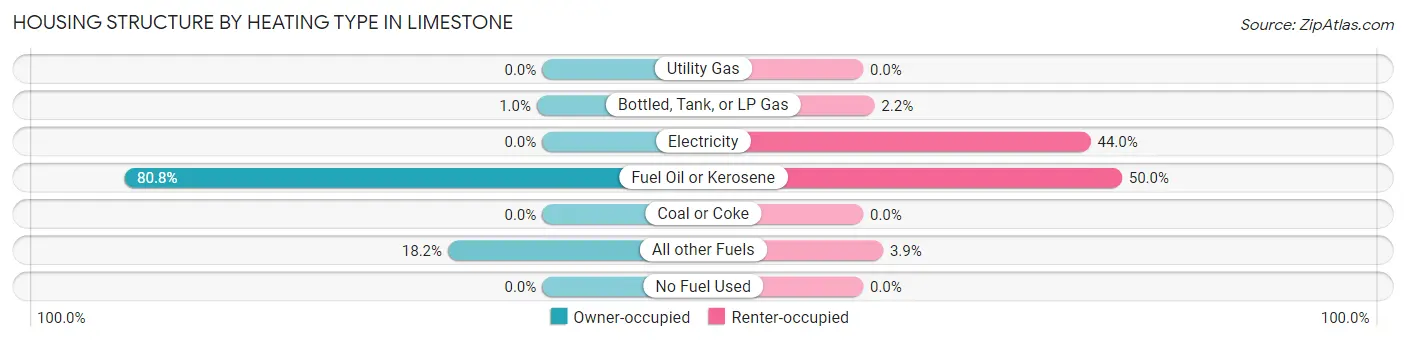
| Heating Type | Owner-occupied | Renter-occupied |
| Utility Gas | 0 (0.0%) | 0 (0.0%) |
| Bottled, Tank, or LP Gas | 3 (1.0%) | 4 (2.2%) |
| Electricity | 0 (0.0%) | 80 (44.0%) |
| Fuel Oil or Kerosene | 235 (80.8%) | 91 (50.0%) |
| Coal or Coke | 0 (0.0%) | 0 (0.0%) |
| All other Fuels | 53 (18.2%) | 7 (3.8%) |
| No Fuel Used | 0 (0.0%) | 0 (0.0%) |
| Total | 291 (100.0%) | 182 (100.0%) |
Household Vehicle Usage in Limestone
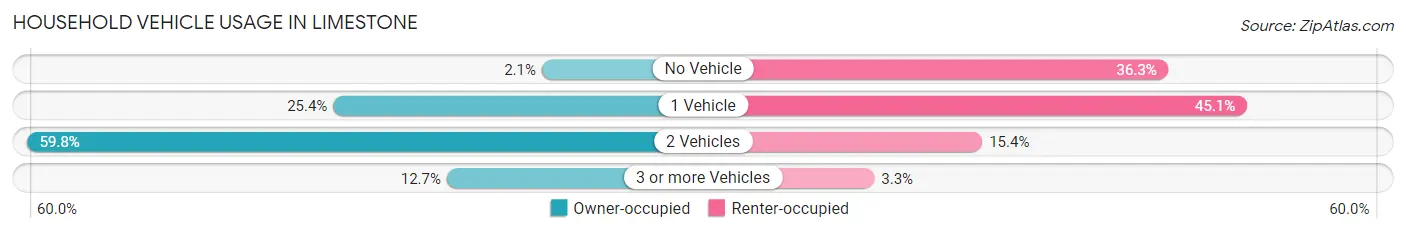
| Vehicles per Household | Owner-occupied | Renter-occupied |
| No Vehicle | 6 (2.1%) | 66 (36.3%) |
| 1 Vehicle | 74 (25.4%) | 82 (45.1%) |
| 2 Vehicles | 174 (59.8%) | 28 (15.4%) |
| 3 or more Vehicles | 37 (12.7%) | 6 (3.3%) |
| Total | 291 (100.0%) | 182 (100.0%) |
Real Estate & Mortgages in Limestone
Real Estate and Mortgage Overview in Limestone
| Characteristic | Without Mortgage | With Mortgage |
| Housing Units | 163 | 128 |
| Median Property Value | $73,900 | $93,600 |
| Median Household Income | $31,994 | $27 |
| Monthly Housing Costs | $465 | $0 |
| Real Estate Taxes | $1,204 | $0 |
Property Value by Mortgage Status in Limestone
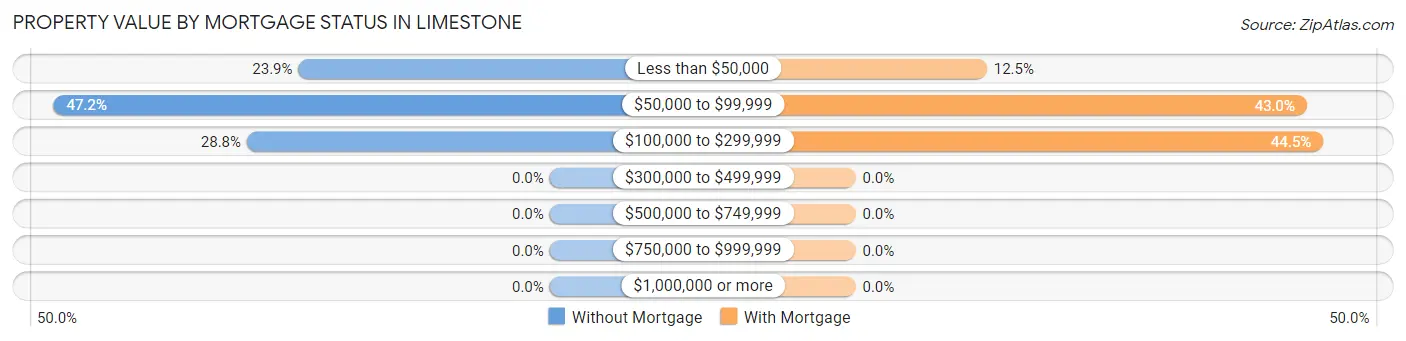
| Property Value | Without Mortgage | With Mortgage |
| Less than $50,000 | 39 (23.9%) | 16 (12.5%) |
| $50,000 to $99,999 | 77 (47.2%) | 55 (43.0%) |
| $100,000 to $299,999 | 47 (28.8%) | 57 (44.5%) |
| $300,000 to $499,999 | 0 (0.0%) | 0 (0.0%) |
| $500,000 to $749,999 | 0 (0.0%) | 0 (0.0%) |
| $750,000 to $999,999 | 0 (0.0%) | 0 (0.0%) |
| $1,000,000 or more | 0 (0.0%) | 0 (0.0%) |
| Total | 163 (100.0%) | 128 (100.0%) |
Household Income by Mortgage Status in Limestone
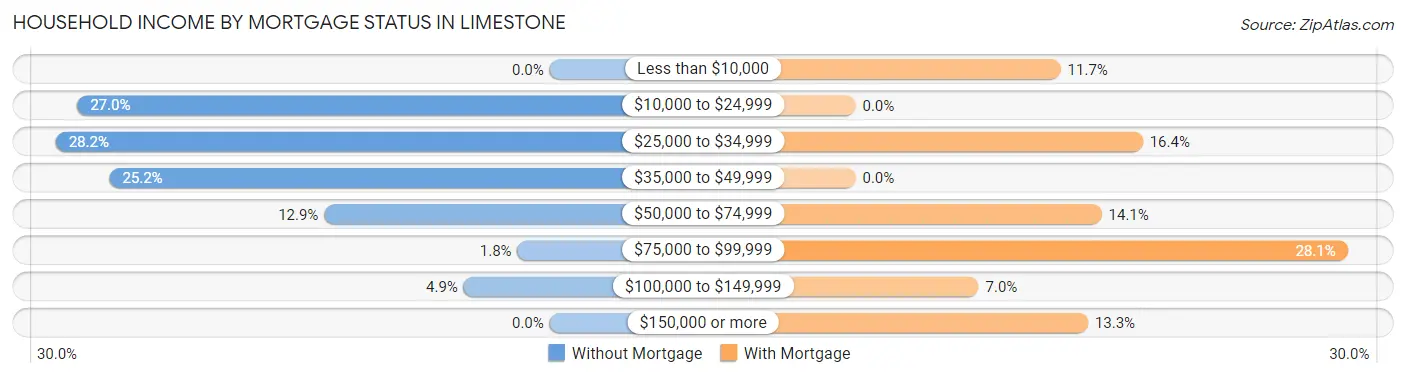
| Household Income | Without Mortgage | With Mortgage |
| Less than $10,000 | 0 (0.0%) | 15 (11.7%) |
| $10,000 to $24,999 | 44 (27.0%) | 0 (0.0%) |
| $25,000 to $34,999 | 46 (28.2%) | 21 (16.4%) |
| $35,000 to $49,999 | 41 (25.2%) | 0 (0.0%) |
| $50,000 to $74,999 | 21 (12.9%) | 18 (14.1%) |
| $75,000 to $99,999 | 3 (1.8%) | 36 (28.1%) |
| $100,000 to $149,999 | 8 (4.9%) | 9 (7.0%) |
| $150,000 or more | 0 (0.0%) | 17 (13.3%) |
| Total | 163 (100.0%) | 128 (100.0%) |
Property Value to Household Income Ratio in Limestone
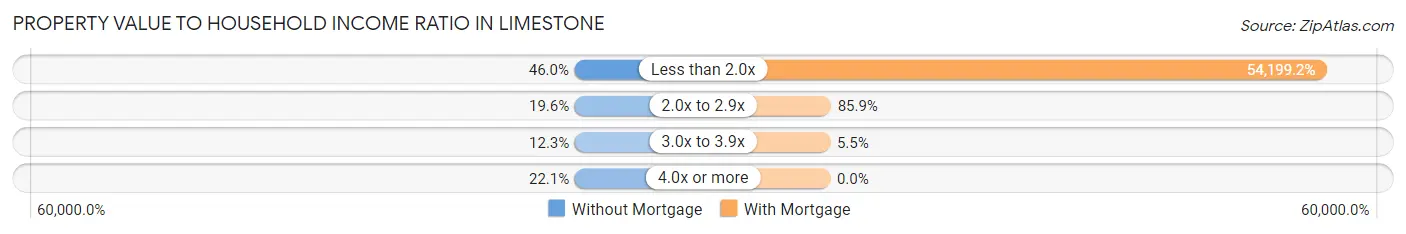
| Value-to-Income Ratio | Without Mortgage | With Mortgage |
| Less than 2.0x | 75 (46.0%) | 69,375 (54,199.2%) |
| 2.0x to 2.9x | 32 (19.6%) | 110 (85.9%) |
| 3.0x to 3.9x | 20 (12.3%) | 7 (5.5%) |
| 4.0x or more | 36 (22.1%) | 0 (0.0%) |
| Total | 163 (100.0%) | 128 (100.0%) |
Real Estate Taxes by Mortgage Status in Limestone
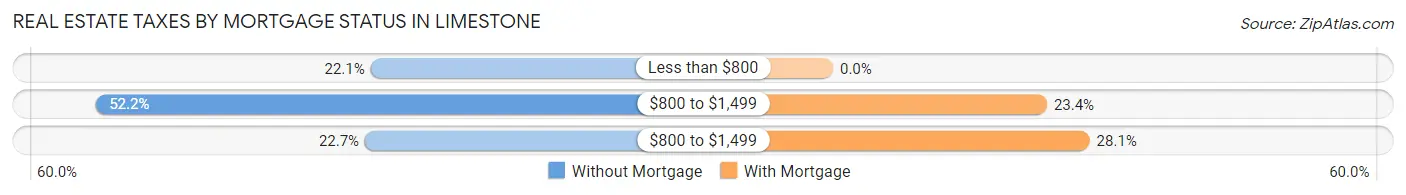
| Property Taxes | Without Mortgage | With Mortgage |
| Less than $800 | 36 (22.1%) | 0 (0.0%) |
| $800 to $1,499 | 85 (52.1%) | 30 (23.4%) |
| $800 to $1,499 | 37 (22.7%) | 36 (28.1%) |
| Total | 163 (100.0%) | 128 (100.0%) |
Health & Disability in Limestone
Health Insurance Coverage by Age in Limestone
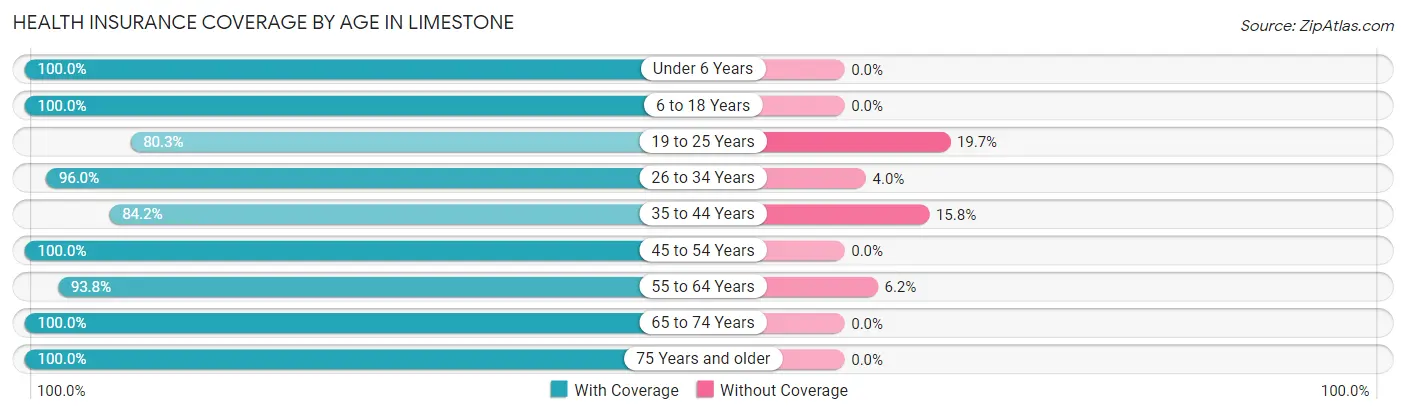
| Age Bracket | With Coverage | Without Coverage |
| Under 6 Years | 114 (100.0%) | 0 (0.0%) |
| 6 to 18 Years | 151 (100.0%) | 0 (0.0%) |
| 19 to 25 Years | 53 (80.3%) | 13 (19.7%) |
| 26 to 34 Years | 121 (96.0%) | 5 (4.0%) |
| 35 to 44 Years | 80 (84.2%) | 15 (15.8%) |
| 45 to 54 Years | 120 (100.0%) | 0 (0.0%) |
| 55 to 64 Years | 242 (93.8%) | 16 (6.2%) |
| 65 to 74 Years | 143 (100.0%) | 0 (0.0%) |
| 75 Years and older | 53 (100.0%) | 0 (0.0%) |
| Total | 1,077 (95.7%) | 49 (4.3%) |
Health Insurance Coverage by Citizenship Status in Limestone
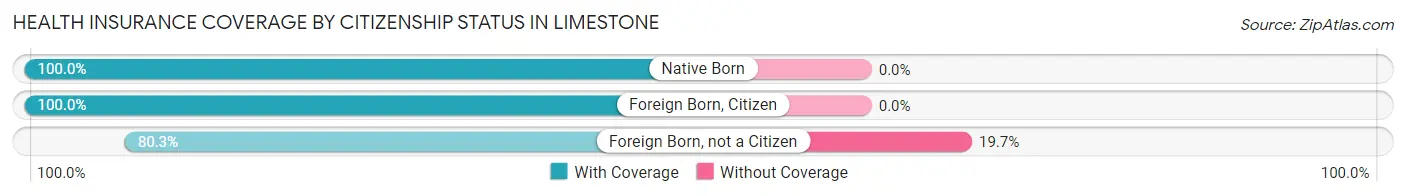
| Citizenship Status | With Coverage | Without Coverage |
| Native Born | 114 (100.0%) | 0 (0.0%) |
| Foreign Born, Citizen | 151 (100.0%) | 0 (0.0%) |
| Foreign Born, not a Citizen | 53 (80.3%) | 13 (19.7%) |
Health Insurance Coverage by Household Income in Limestone
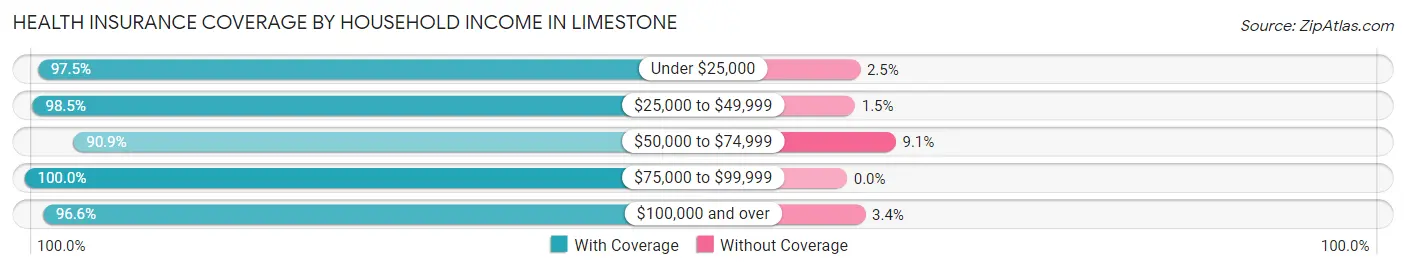
| Household Income | With Coverage | Without Coverage |
| Under $25,000 | 198 (97.5%) | 5 (2.5%) |
| $25,000 to $49,999 | 329 (98.5%) | 5 (1.5%) |
| $50,000 to $74,999 | 199 (90.9%) | 20 (9.1%) |
| $75,000 to $99,999 | 40 (100.0%) | 0 (0.0%) |
| $100,000 and over | 169 (96.6%) | 6 (3.4%) |
Public vs Private Health Insurance Coverage by Age in Limestone
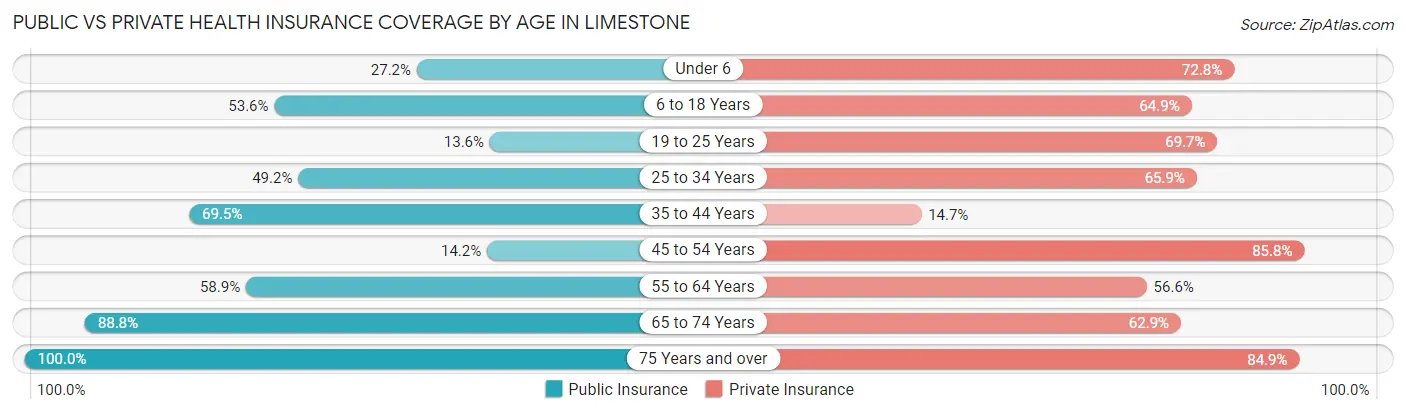
| Age Bracket | Public Insurance | Private Insurance |
| Under 6 | 31 (27.2%) | 83 (72.8%) |
| 6 to 18 Years | 81 (53.6%) | 98 (64.9%) |
| 19 to 25 Years | 9 (13.6%) | 46 (69.7%) |
| 25 to 34 Years | 62 (49.2%) | 83 (65.9%) |
| 35 to 44 Years | 66 (69.5%) | 14 (14.7%) |
| 45 to 54 Years | 17 (14.2%) | 103 (85.8%) |
| 55 to 64 Years | 152 (58.9%) | 146 (56.6%) |
| 65 to 74 Years | 127 (88.8%) | 90 (62.9%) |
| 75 Years and over | 53 (100.0%) | 45 (84.9%) |
| Total | 598 (53.1%) | 708 (62.9%) |
Disability Status by Sex by Age in Limestone
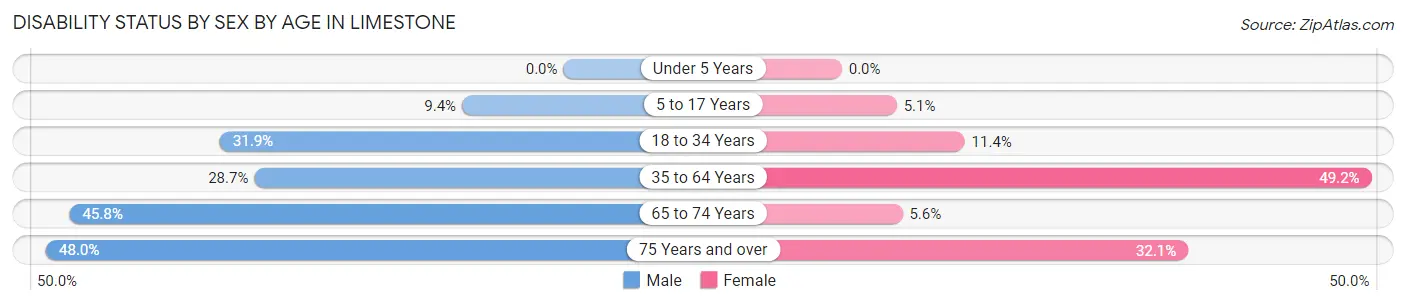
| Age Bracket | Male | Female |
| Under 5 Years | 0 (0.0%) | 0 (0.0%) |
| 5 to 17 Years | 8 (9.4%) | 5 (5.1%) |
| 18 to 34 Years | 29 (31.9%) | 13 (11.4%) |
| 35 to 64 Years | 68 (28.7%) | 116 (49.1%) |
| 65 to 74 Years | 33 (45.8%) | 4 (5.6%) |
| 75 Years and over | 12 (48.0%) | 9 (32.1%) |
Disability Class by Sex by Age in Limestone
Disability Class: Hearing Difficulty
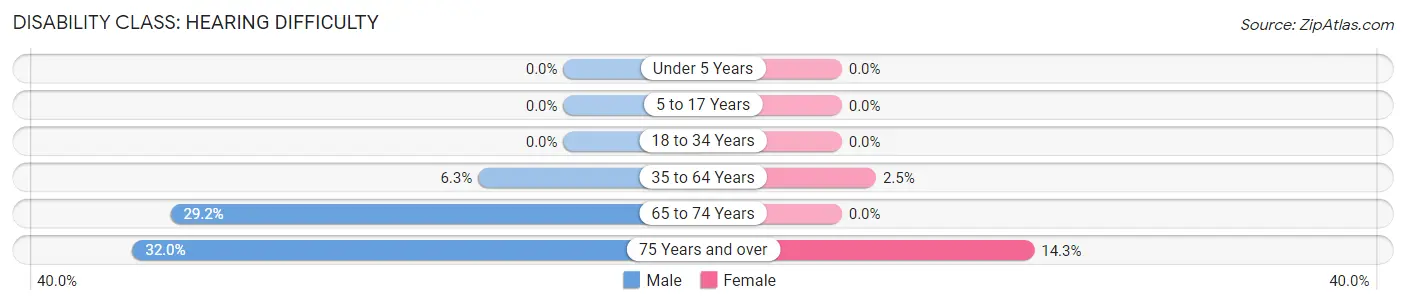
| Age Bracket | Male | Female |
| Under 5 Years | 0 (0.0%) | 0 (0.0%) |
| 5 to 17 Years | 0 (0.0%) | 0 (0.0%) |
| 18 to 34 Years | 0 (0.0%) | 0 (0.0%) |
| 35 to 64 Years | 15 (6.3%) | 6 (2.5%) |
| 65 to 74 Years | 21 (29.2%) | 0 (0.0%) |
| 75 Years and over | 8 (32.0%) | 4 (14.3%) |
Disability Class: Vision Difficulty
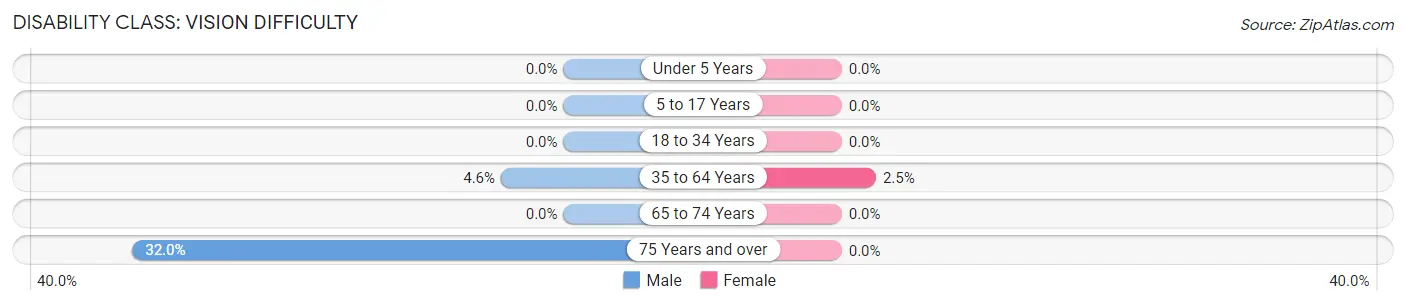
| Age Bracket | Male | Female |
| Under 5 Years | 0 (0.0%) | 0 (0.0%) |
| 5 to 17 Years | 0 (0.0%) | 0 (0.0%) |
| 18 to 34 Years | 0 (0.0%) | 0 (0.0%) |
| 35 to 64 Years | 11 (4.6%) | 6 (2.5%) |
| 65 to 74 Years | 0 (0.0%) | 0 (0.0%) |
| 75 Years and over | 8 (32.0%) | 0 (0.0%) |
Disability Class: Cognitive Difficulty
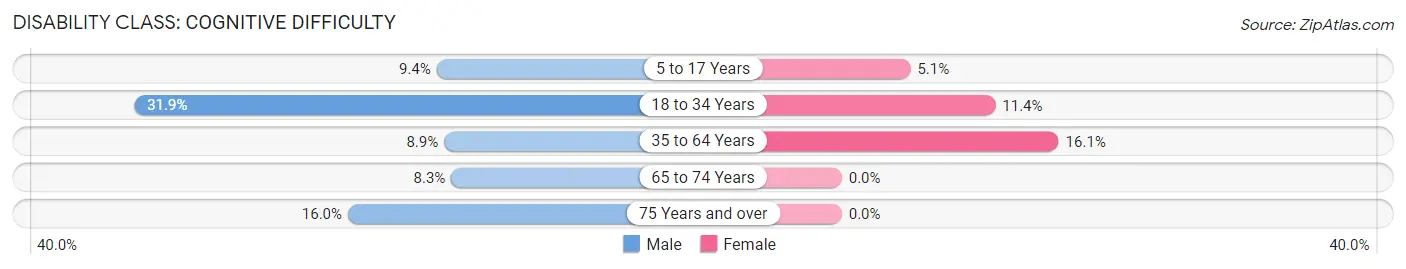
| Age Bracket | Male | Female |
| 5 to 17 Years | 8 (9.4%) | 5 (5.1%) |
| 18 to 34 Years | 29 (31.9%) | 13 (11.4%) |
| 35 to 64 Years | 21 (8.9%) | 38 (16.1%) |
| 65 to 74 Years | 6 (8.3%) | 0 (0.0%) |
| 75 Years and over | 4 (16.0%) | 0 (0.0%) |
Disability Class: Ambulatory Difficulty
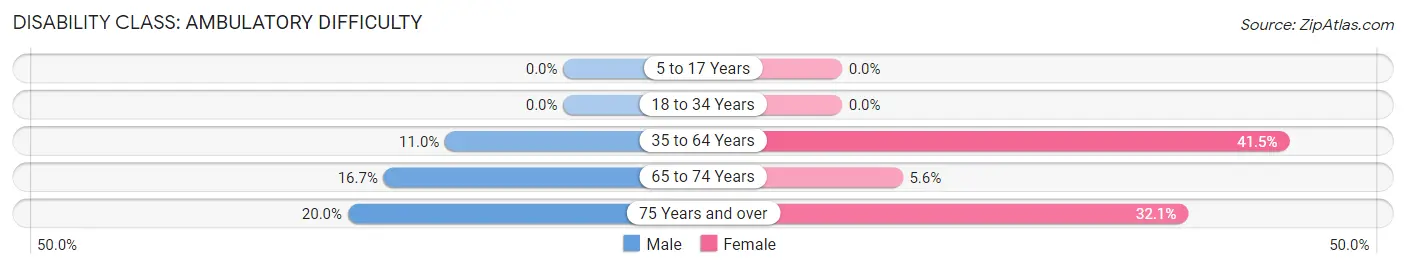
| Age Bracket | Male | Female |
| 5 to 17 Years | 0 (0.0%) | 0 (0.0%) |
| 18 to 34 Years | 0 (0.0%) | 0 (0.0%) |
| 35 to 64 Years | 26 (11.0%) | 98 (41.5%) |
| 65 to 74 Years | 12 (16.7%) | 4 (5.6%) |
| 75 Years and over | 5 (20.0%) | 9 (32.1%) |
Disability Class: Self-Care Difficulty
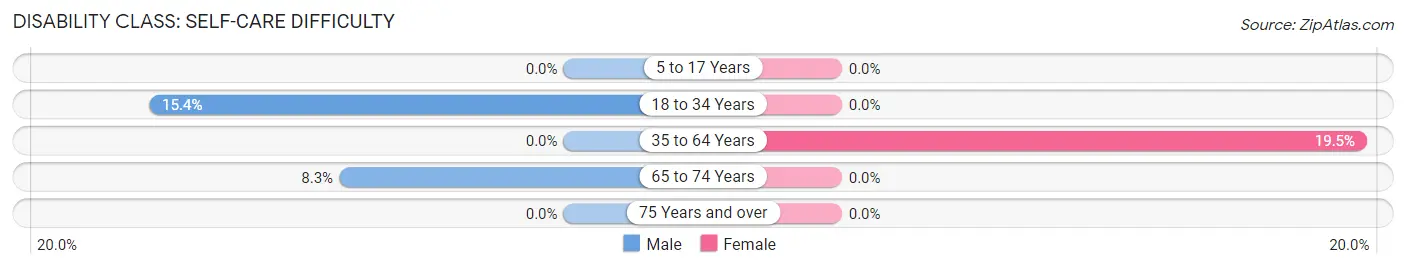
| Age Bracket | Male | Female |
| 5 to 17 Years | 0 (0.0%) | 0 (0.0%) |
| 18 to 34 Years | 14 (15.4%) | 0 (0.0%) |
| 35 to 64 Years | 0 (0.0%) | 46 (19.5%) |
| 65 to 74 Years | 6 (8.3%) | 0 (0.0%) |
| 75 Years and over | 0 (0.0%) | 0 (0.0%) |
Technology Access in Limestone
Computing Device Access in Limestone
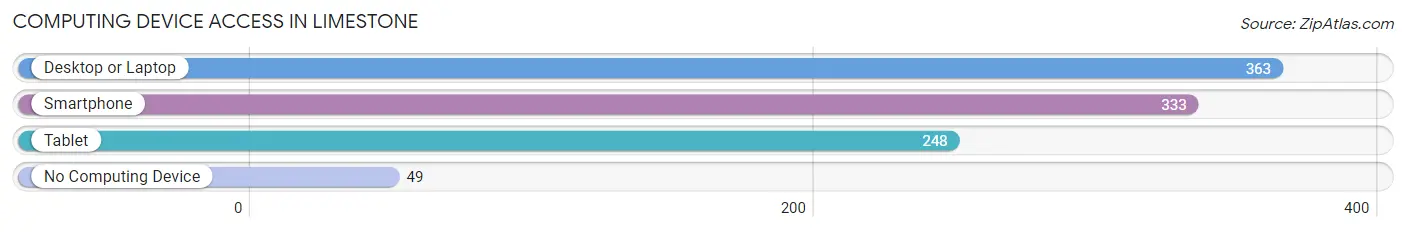
| Device Type | # Households | % Households |
| Desktop or Laptop | 363 | 76.7% |
| Smartphone | 333 | 70.4% |
| Tablet | 248 | 52.4% |
| No Computing Device | 49 | 10.4% |
| Total | 473 | 100.0% |
Internet Access in Limestone
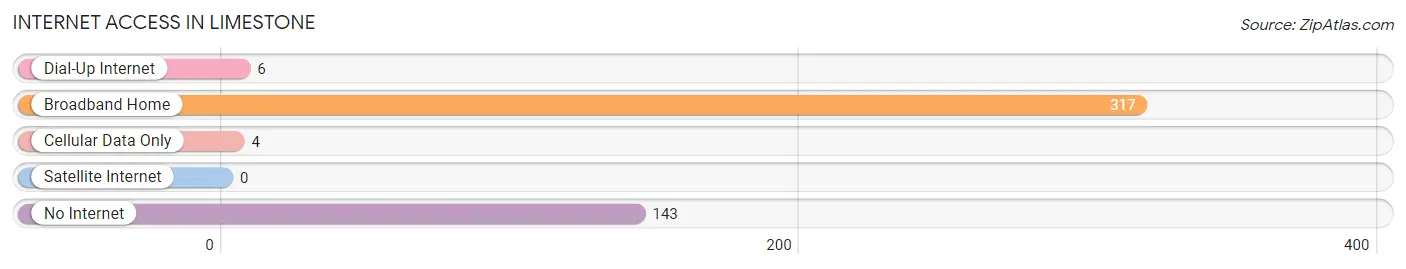
| Internet Type | # Households | % Households |
| Dial-Up Internet | 6 | 1.3% |
| Broadband Home | 317 | 67.0% |
| Cellular Data Only | 4 | 0.9% |
| Satellite Internet | 0 | 0.0% |
| No Internet | 143 | 30.2% |
| Total | 473 | 100.0% |
Limestone Summary
Limestone, Maine is a small town located in Aroostook County, in the northernmost part of the state. It is situated on the Canadian border, and is the northernmost town in the United States. The town was incorporated in 1869, and has a population of 1,741 as of the 2010 census.
Geography
Limestone is located at 46°59'N 67°59'W, and is situated on the Canadian border. It is bordered by the towns of Caswell to the north, Caribou to the east, and Stockholm to the south. The town is located in the St. John Valley, and is part of the Aroostook Valley region. The town is situated on the Aroostook River, and is surrounded by rolling hills and forests. The town is located in a rural area, and is home to many farms and small businesses.
History
The area that is now Limestone was first settled in the early 1800s by French-Canadian immigrants. The town was originally known as “St. John’s”, and was part of the larger township of Caribou. In 1869, the town was incorporated as “Limestone”, and was named after the limestone deposits that were found in the area.
The town was an important stop on the Bangor and Aroostook Railroad, which ran through the town from 1891 to 2003. The railroad was an important part of the town’s economy, and provided jobs for many of the town’s residents.
In the early 1900s, the town was home to a large limestone quarry, which provided the town with its name. The quarry was in operation until the 1950s, and provided the town with much of its economic activity.
Economy
Limestone’s economy is largely based on agriculture and tourism. The town is home to many farms, which produce potatoes, hay, and other crops. The town is also home to several small businesses, including a lumber mill, a sawmill, and a furniture factory.
The town is also a popular tourist destination, and is home to several attractions, including the Limestone Historical Society Museum, the Limestone Public Library, and the Limestone Country Club. The town is also home to several outdoor recreation areas, including the Aroostook State Park, the Limestone Hills Trail, and the Limestone Lakes.
Demographics
As of the 2010 census, the population of Limestone was 1,741. The racial makeup of the town was 97.3% White, 0.3% African American, 0.2% Native American, 0.2% Asian, 0.1% Pacific Islander, 0.7% from other races, and 1.2% from two or more races. Hispanic or Latino of any race were 1.2% of the population.
The median household income in Limestone was $37,917, and the median family income was $45,938. The per capita income for the town was $18,945. About 11.2% of families and 14.2% of the population were below the poverty line, including 18.2% of those under age 18 and 8.2% of those age 65 or over.
Limestone is a small town with a rich history and a vibrant economy. The town is home to many farms and small businesses, and is a popular tourist destination. The town is also home to many outdoor recreation areas, and is a great place to live and work.
Common Questions
What is Per Capita Income in Limestone?
Per Capita income in Limestone is $20,497.
What is the Median Family Income in Limestone?
Median Family Income in Limestone is $37,708.
What is the Median Household income in Limestone?
Median Household Income in Limestone is $36,023.
What is Income or Wage Gap in Limestone?
Income or Wage Gap in Limestone is 10.0%.
Women in Limestone earn 90.0 cents for every dollar earned by a man.
What is Family Income Deficit in Limestone?
Family Income Deficit in Limestone is $3,935.
Families that are below poverty line in Limestone earn $3,935 less on average than the poverty threshold level.
What is Inequality or Gini Index in Limestone?
Inequality or Gini Index in Limestone is 0.42.
What is the Total Population of Limestone?
Total Population of Limestone is 1,165.
What is the Total Male Population of Limestone?
Total Male Population of Limestone is 577.
What is the Total Female Population of Limestone?
Total Female Population of Limestone is 588.
What is the Ratio of Males per 100 Females in Limestone?
There are 98.13 Males per 100 Females in Limestone.
What is the Ratio of Females per 100 Males in Limestone?
There are 101.91 Females per 100 Males in Limestone.
What is the Median Population Age in Limestone?
Median Population Age in Limestone is 43.9 Years.
What is the Average Family Size in Limestone
Average Family Size in Limestone is 2.5 People.
What is the Average Household Size in Limestone
Average Household Size in Limestone is 2.0 People.
How Large is the Labor Force in Limestone?
There are 412 People in the Labor Forcein in Limestone.
What is the Percentage of People in the Labor Force in Limestone?
42.5% of People are in the Labor Force in Limestone.
What is the Unemployment Rate in Limestone?
Unemployment Rate in Limestone is 2.4%.