York Harbor, ME Map & Demographics
York Harbor Map
York Harbor Overview
$43,862
PER CAPITA INCOME
$126,023
AVG FAMILY INCOME
$89,647
AVG HOUSEHOLD INCOME
78.9%
WAGE / INCOME GAP [ % ]
21.1¢/ $1
WAGE / INCOME GAP [ $ ]
0.46
INEQUALITY / GINI INDEX
3,640
TOTAL POPULATION
1,409
MALE POPULATION
2,231
FEMALE POPULATION
63.16
MALES / 100 FEMALES
158.34
FEMALES / 100 MALES
40.7
MEDIAN AGE
3.6
AVG FAMILY SIZE
2.8
AVG HOUSEHOLD SIZE
1,504
LABOR FORCE [ PEOPLE ]
52.0%
PERCENT IN LABOR FORCE
0.7%
UNEMPLOYMENT RATE
York Harbor Zip Codes
York Harbor Area Codes
Income in York Harbor
Income Overview in York Harbor
Per Capita Income in York Harbor is $43,862, while median incomes of families and households are $126,023 and $89,647 respectively.
| Characteristic | Number | Measure |
| Per Capita Income | 3,640 | $43,862 |
| Median Family Income | 745 | $126,023 |
| Mean Family Income | 745 | $161,176 |
| Median Household Income | 1,291 | $89,647 |
| Mean Household Income | 1,291 | $118,926 |
| Income Deficit | 745 | $0 |
| Wage / Income Gap (%) | 3,640 | 78.88% |
| Wage / Income Gap ($) | 3,640 | 21.12¢ per $1 |
| Gini / Inequality Index | 3,640 | 0.46 |
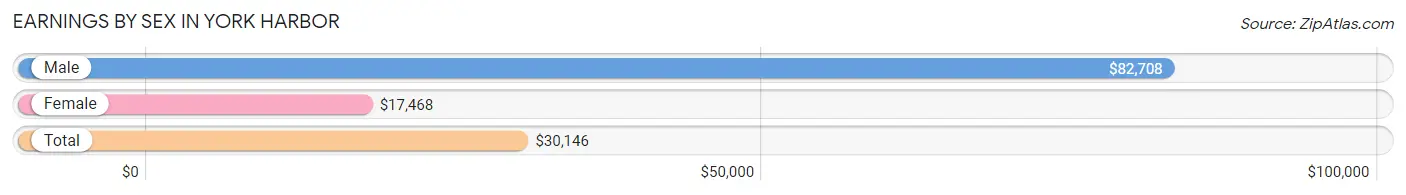
Earnings by Sex in York Harbor
Average Earnings in York Harbor are $30,146, $82,708 for men and $17,468 for women, a difference of 78.9%.
| Sex | Number | Average Earnings |
| Male | 692 (42.3%) | $82,708 |
| Female | 945 (57.7%) | $17,468 |
| Total | 1,637 (100.0%) | $30,146 |
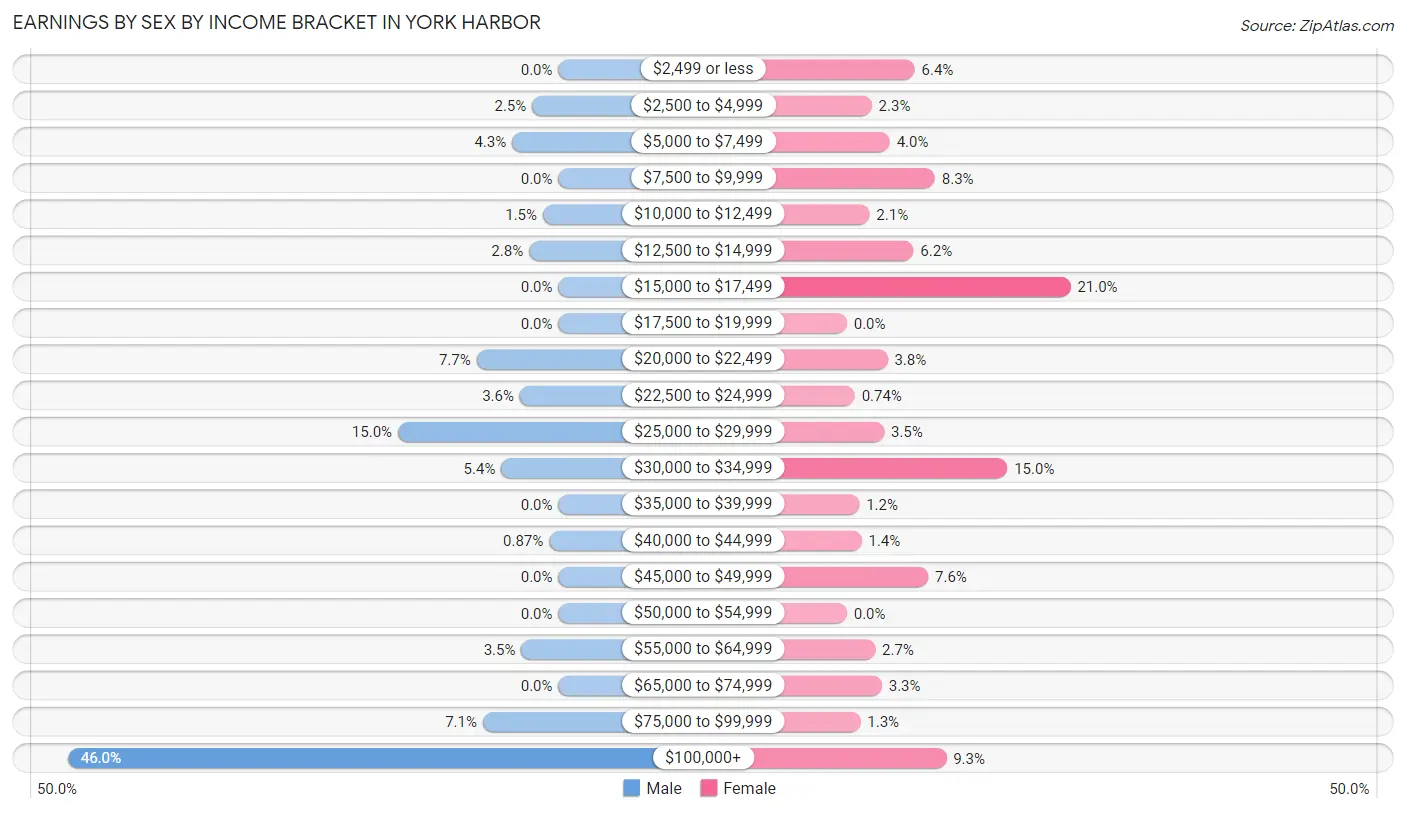
Earnings by Sex by Income Bracket in York Harbor
The most common earnings brackets in York Harbor are $100,000+ for men (318 | 46.0%) and $15,000 to $17,499 for women (198 | 20.9%).
| Income | Male | Female |
| $2,499 or less | 0 (0.0%) | 60 (6.4%) |
| $2,500 to $4,999 | 17 (2.5%) | 22 (2.3%) |
| $5,000 to $7,499 | 30 (4.3%) | 38 (4.0%) |
| $7,500 to $9,999 | 0 (0.0%) | 78 (8.3%) |
| $10,000 to $12,499 | 10 (1.5%) | 20 (2.1%) |
| $12,500 to $14,999 | 19 (2.8%) | 59 (6.2%) |
| $15,000 to $17,499 | 0 (0.0%) | 198 (20.9%) |
| $17,500 to $19,999 | 0 (0.0%) | 0 (0.0%) |
| $20,000 to $22,499 | 53 (7.7%) | 36 (3.8%) |
| $22,500 to $24,999 | 25 (3.6%) | 7 (0.7%) |
| $25,000 to $29,999 | 104 (15.0%) | 33 (3.5%) |
| $30,000 to $34,999 | 37 (5.3%) | 142 (15.0%) |
| $35,000 to $39,999 | 0 (0.0%) | 11 (1.2%) |
| $40,000 to $44,999 | 6 (0.9%) | 13 (1.4%) |
| $45,000 to $49,999 | 0 (0.0%) | 72 (7.6%) |
| $50,000 to $54,999 | 0 (0.0%) | 0 (0.0%) |
| $55,000 to $64,999 | 24 (3.5%) | 25 (2.6%) |
| $65,000 to $74,999 | 0 (0.0%) | 31 (3.3%) |
| $75,000 to $99,999 | 49 (7.1%) | 12 (1.3%) |
| $100,000+ | 318 (46.0%) | 88 (9.3%) |
| Total | 692 (100.0%) | 945 (100.0%) |
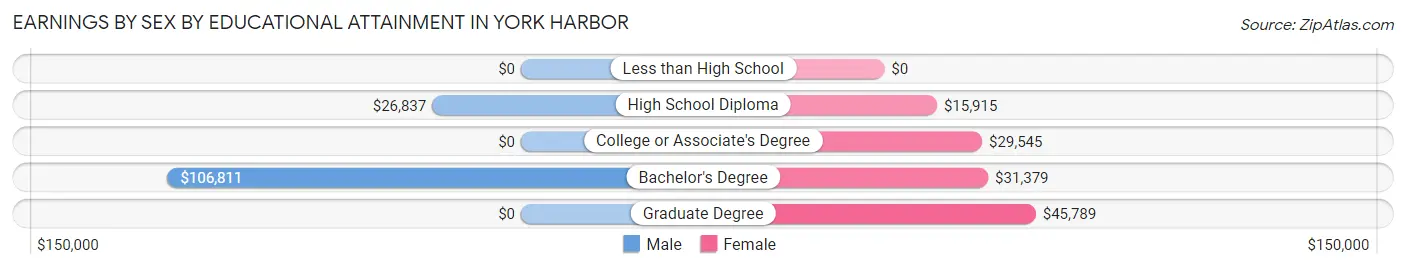
Earnings by Sex by Educational Attainment in York Harbor
Average earnings in York Harbor are $90,882 for men and $24,464 for women, a difference of 73.1%. Men with an educational attainment of bachelor's degree enjoy the highest average annual earnings of $106,811, while those with high school diploma education earn the least with $26,837. Women with an educational attainment of graduate degree earn the most with the average annual earnings of $45,789, while those with high school diploma education have the smallest earnings of $15,915.
| Educational Attainment | Male Income | Female Income |
| Less than High School | - | - |
| High School Diploma | $26,837 | $15,915 |
| College or Associate's Degree | - | - |
| Bachelor's Degree | $106,811 | $31,379 |
| Graduate Degree | - | - |
| Total | $90,882 | $24,464 |
Family Income in York Harbor
Family Income Brackets in York Harbor
According to the York Harbor family income data, there are 272 families falling into the $100,000 to $149,999 income range, which is the most common income bracket and makes up 36.5% of all families.
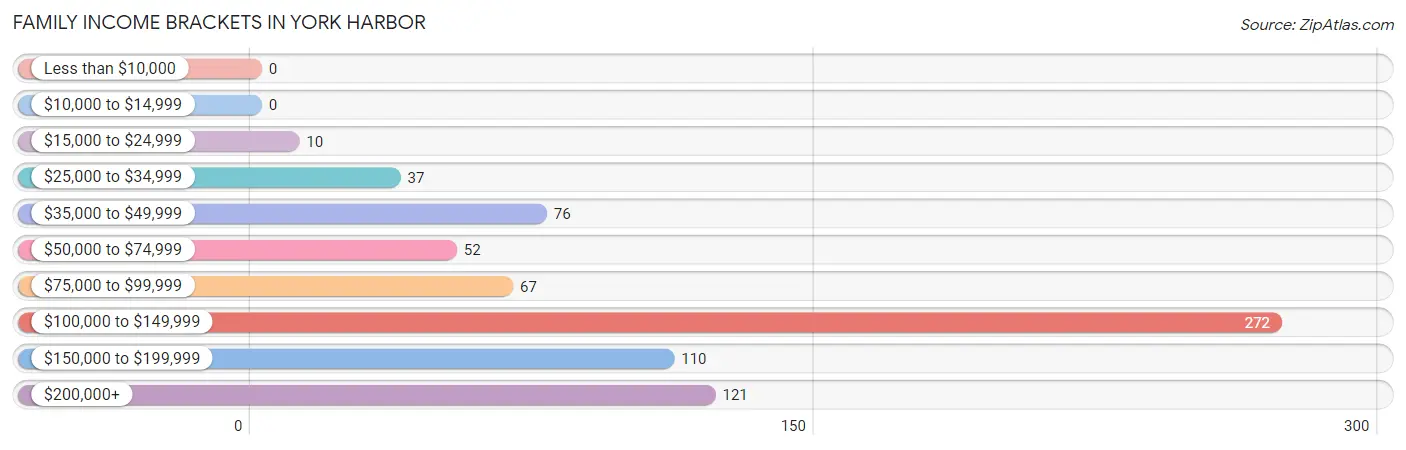
| Income Bracket | # Families | % Families |
| Less than $10,000 | 0 | 0.0% |
| $10,000 to $14,999 | 0 | 0.0% |
| $15,000 to $24,999 | 10 | 1.3% |
| $25,000 to $34,999 | 37 | 5.0% |
| $35,000 to $49,999 | 76 | 10.2% |
| $50,000 to $74,999 | 52 | 7.0% |
| $75,000 to $99,999 | 67 | 9.0% |
| $100,000 to $149,999 | 272 | 36.5% |
| $150,000 to $199,999 | 110 | 14.8% |
| $200,000+ | 121 | 16.2% |
Family Income by Famaliy Size in York Harbor
4-person families (178 | 23.9%) account for the highest median family income in York Harbor with $109,261 per family, while 2-person families (357 | 47.9%) have the highest median income of $45,875 per family member.
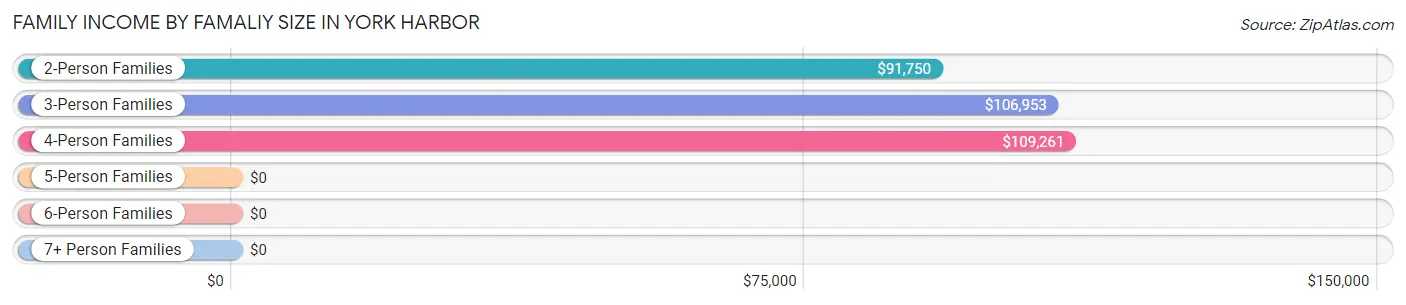
| Income Bracket | # Families | Median Income |
| 2-Person Families | 357 (47.9%) | $91,750 |
| 3-Person Families | 71 (9.5%) | $106,953 |
| 4-Person Families | 178 (23.9%) | $109,261 |
| 5-Person Families | 0 (0.0%) | $0 |
| 6-Person Families | 139 (18.7%) | $0 |
| 7+ Person Families | 0 (0.0%) | $0 |
| Total | 745 (100.0%) | $126,023 |
Family Income by Number of Earners in York Harbor
The median family income in York Harbor is $126,023, with families comprising 1 earner (206) having the highest median family income of $148,913, while families with no earners (154) have the lowest median family income of $67,596, accounting for 27.7% and 20.7% of families, respectively.
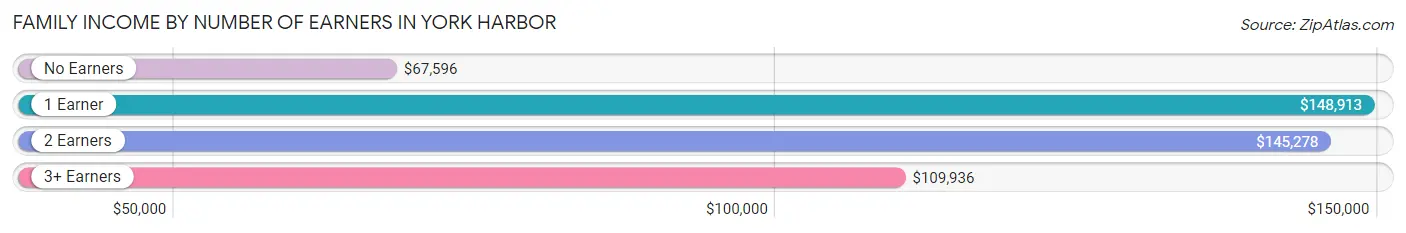
| Number of Earners | # Families | Median Income |
| No Earners | 154 (20.7%) | $67,596 |
| 1 Earner | 206 (27.7%) | $148,913 |
| 2 Earners | 270 (36.2%) | $145,278 |
| 3+ Earners | 115 (15.4%) | $109,936 |
| Total | 745 (100.0%) | $126,023 |
Household Income in York Harbor
Household Income Brackets in York Harbor
With 383 households falling in the category, the $100,000 to $149,999 income range is the most frequent in York Harbor, accounting for 29.7% of all households. In contrast, only 10 households (0.8%) fall into the $10,000 to $14,999 income bracket, making it the least populous group.
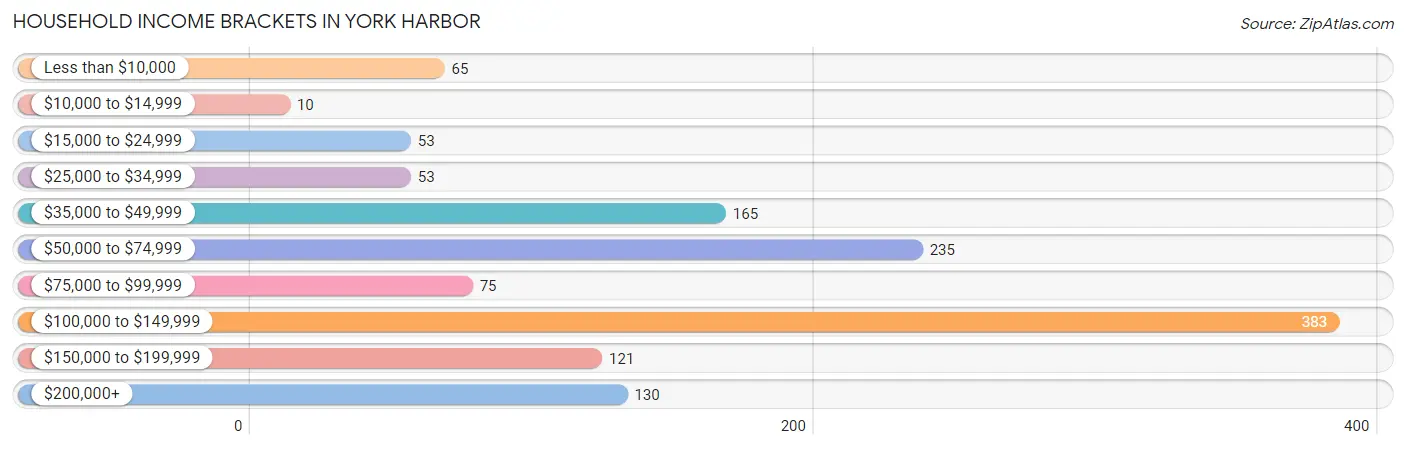
| Income Bracket | # Households | % Households |
| Less than $10,000 | 65 | 5.0% |
| $10,000 to $14,999 | 10 | 0.8% |
| $15,000 to $24,999 | 53 | 4.1% |
| $25,000 to $34,999 | 53 | 4.1% |
| $35,000 to $49,999 | 165 | 12.8% |
| $50,000 to $74,999 | 235 | 18.2% |
| $75,000 to $99,999 | 75 | 5.8% |
| $100,000 to $149,999 | 383 | 29.7% |
| $150,000 to $199,999 | 121 | 9.4% |
| $200,000+ | 130 | 10.1% |
Household Income by Householder Age in York Harbor
The median household income in York Harbor is $89,647, with the highest median household income of $106,904 found in the 45 to 64 years age bracket for the primary householder. A total of 359 households (27.8%) fall into this category.
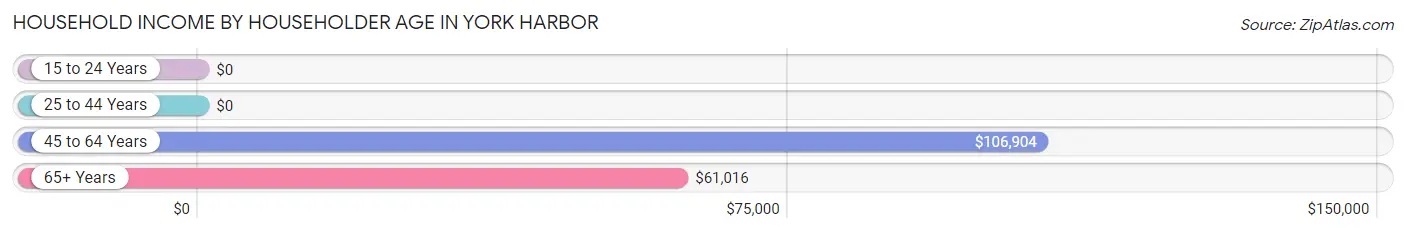
| Income Bracket | # Households | Median Income |
| 15 to 24 Years | 0 (0.0%) | $0 |
| 25 to 44 Years | 353 (27.3%) | $0 |
| 45 to 64 Years | 359 (27.8%) | $106,904 |
| 65+ Years | 579 (44.9%) | $61,016 |
| Total | 1,291 (100.0%) | $89,647 |
Poverty in York Harbor
Income Below Poverty by Sex and Age in York Harbor
With 0.7% poverty level for males and 9.9% for females among the residents of York Harbor, 25 to 34 year old males and 25 to 34 year old females are the most vulnerable to poverty, with 10 males (10.1%) and 143 females (28.0%) in their respective age groups living below the poverty level.
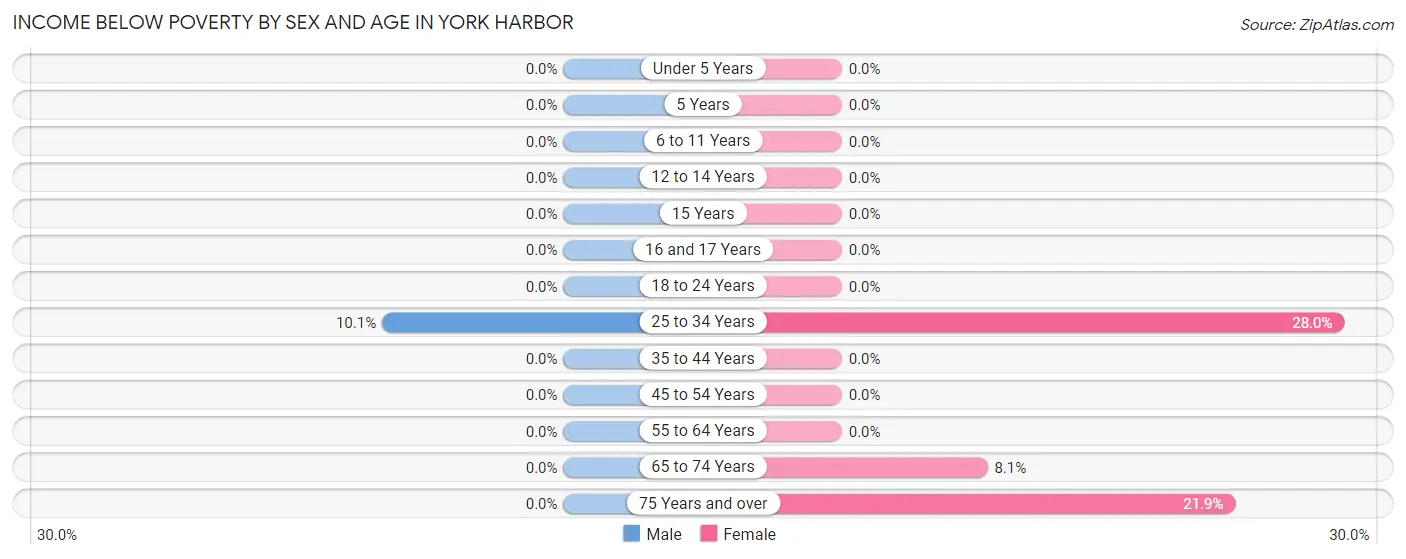
| Age Bracket | Male | Female |
| Under 5 Years | 0 (0.0%) | 0 (0.0%) |
| 5 Years | 0 (0.0%) | 0 (0.0%) |
| 6 to 11 Years | 0 (0.0%) | 0 (0.0%) |
| 12 to 14 Years | 0 (0.0%) | 0 (0.0%) |
| 15 Years | 0 (0.0%) | 0 (0.0%) |
| 16 and 17 Years | 0 (0.0%) | 0 (0.0%) |
| 18 to 24 Years | 0 (0.0%) | 0 (0.0%) |
| 25 to 34 Years | 10 (10.1%) | 143 (28.0%) |
| 35 to 44 Years | 0 (0.0%) | 0 (0.0%) |
| 45 to 54 Years | 0 (0.0%) | 0 (0.0%) |
| 55 to 64 Years | 0 (0.0%) | 0 (0.0%) |
| 65 to 74 Years | 0 (0.0%) | 21 (8.1%) |
| 75 Years and over | 0 (0.0%) | 55 (21.9%) |
| Total | 10 (0.7%) | 219 (9.9%) |
Income Above Poverty by Sex and Age in York Harbor
According to the poverty statistics in York Harbor, males aged under 5 years and females aged under 5 years are the age groups that are most secure financially, with 100.0% of males and 100.0% of females in these age groups living above the poverty line.
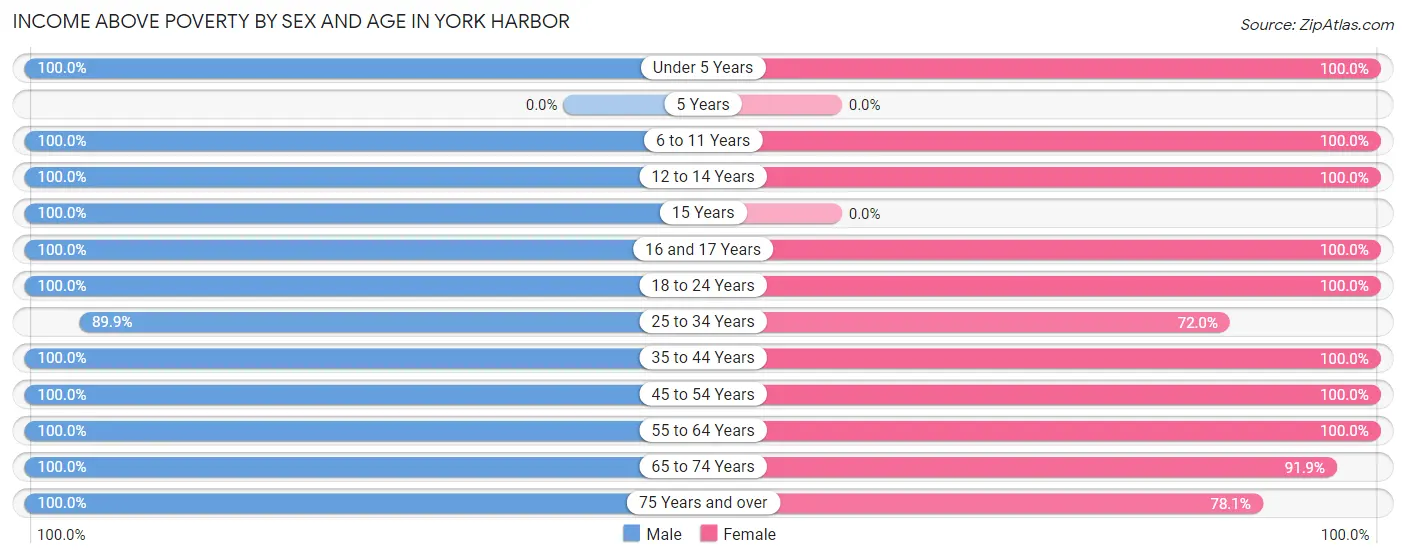
| Age Bracket | Male | Female |
| Under 5 Years | 27 (100.0%) | 143 (100.0%) |
| 5 Years | 0 (0.0%) | 0 (0.0%) |
| 6 to 11 Years | 41 (100.0%) | 172 (100.0%) |
| 12 to 14 Years | 200 (100.0%) | 156 (100.0%) |
| 15 Years | 9 (100.0%) | 0 (0.0%) |
| 16 and 17 Years | 43 (100.0%) | 20 (100.0%) |
| 18 to 24 Years | 48 (100.0%) | 78 (100.0%) |
| 25 to 34 Years | 89 (89.9%) | 368 (72.0%) |
| 35 to 44 Years | 219 (100.0%) | 286 (100.0%) |
| 45 to 54 Years | 170 (100.0%) | 109 (100.0%) |
| 55 to 64 Years | 185 (100.0%) | 233 (100.0%) |
| 65 to 74 Years | 218 (100.0%) | 238 (91.9%) |
| 75 Years and over | 150 (100.0%) | 196 (78.1%) |
| Total | 1,399 (99.3%) | 1,999 (90.1%) |
Income Below Poverty Among Married-Couple Families in York Harbor
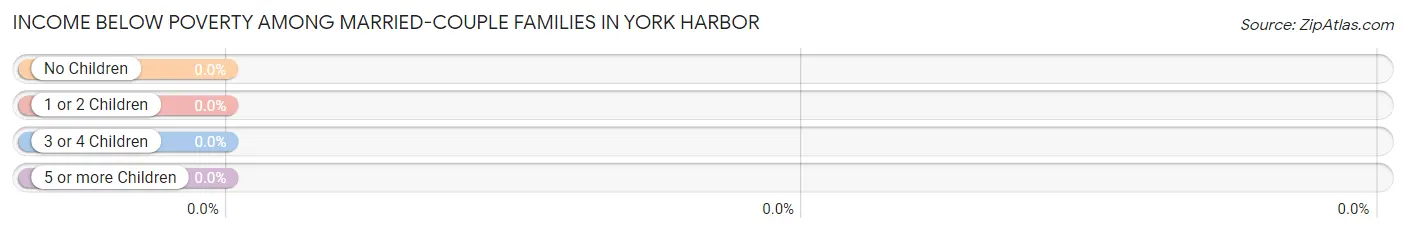
| Children | Above Poverty | Below Poverty |
| No Children | 482 (100.0%) | 0 (0.0%) |
| 1 or 2 Children | 101 (100.0%) | 0 (0.0%) |
| 3 or 4 Children | 139 (100.0%) | 0 (0.0%) |
| 5 or more Children | 0 (0.0%) | 0 (0.0%) |
| Total | 722 (100.0%) | 0 (0.0%) |
Income Below Poverty Among Single-Parent Households in York Harbor
| Children | Single Father | Single Mother |
| No Children | 0 (0.0%) | 0 (0.0%) |
| 1 or 2 Children | 0 (0.0%) | 0 (0.0%) |
| 3 or 4 Children | 0 (0.0%) | 0 (0.0%) |
| 5 or more Children | 0 (0.0%) | 0 (0.0%) |
| Total | 0 (0.0%) | 0 (0.0%) |
Income Below Poverty Among Married-Couple vs Single-Parent Households in York Harbor
| Children | Married-Couple Families | Single-Parent Households |
| No Children | 0 (0.0%) | 0 (0.0%) |
| 1 or 2 Children | 0 (0.0%) | 0 (0.0%) |
| 3 or 4 Children | 0 (0.0%) | 0 (0.0%) |
| 5 or more Children | 0 (0.0%) | 0 (0.0%) |
| Total | 0 (0.0%) | 0 (0.0%) |
Race in York Harbor
The most populous races in York Harbor are White / Caucasian (3,537 | 97.2%), Two or more Races (65 | 1.8%), and Asian (20 | 0.5%).
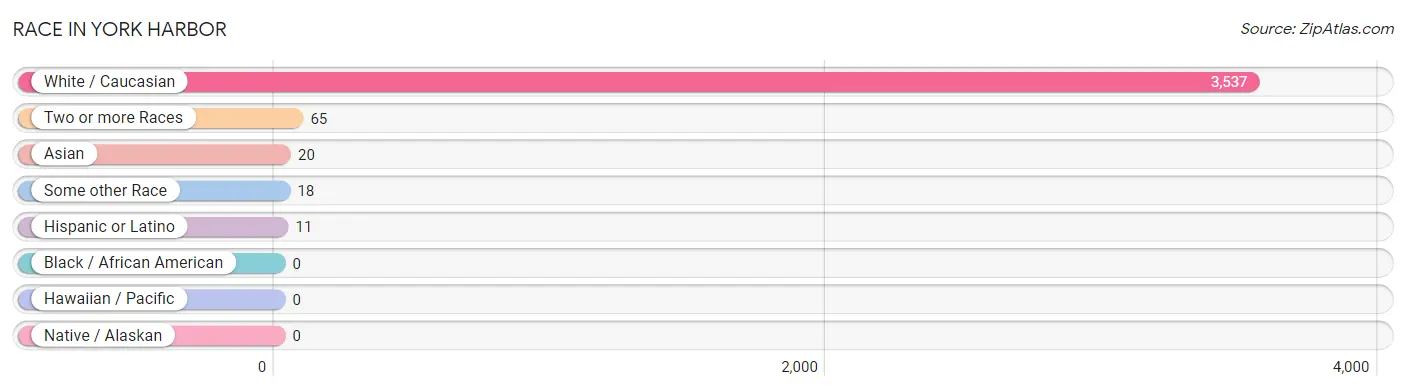
| Race | # Population | % Population |
| Asian | 20 | 0.5% |
| Black / African American | 0 | 0.0% |
| Hawaiian / Pacific | 0 | 0.0% |
| Hispanic or Latino | 11 | 0.3% |
| Native / Alaskan | 0 | 0.0% |
| White / Caucasian | 3,537 | 97.2% |
| Two or more Races | 65 | 1.8% |
| Some other Race | 18 | 0.5% |
| Total | 3,640 | 100.0% |
Ancestry in York Harbor
The most populous ancestries reported in York Harbor are Irish (1,652 | 45.4%), English (1,234 | 33.9%), German (328 | 9.0%), Norwegian (249 | 6.8%), and Polish (181 | 5.0%), together accounting for 100.1% of all York Harbor residents.
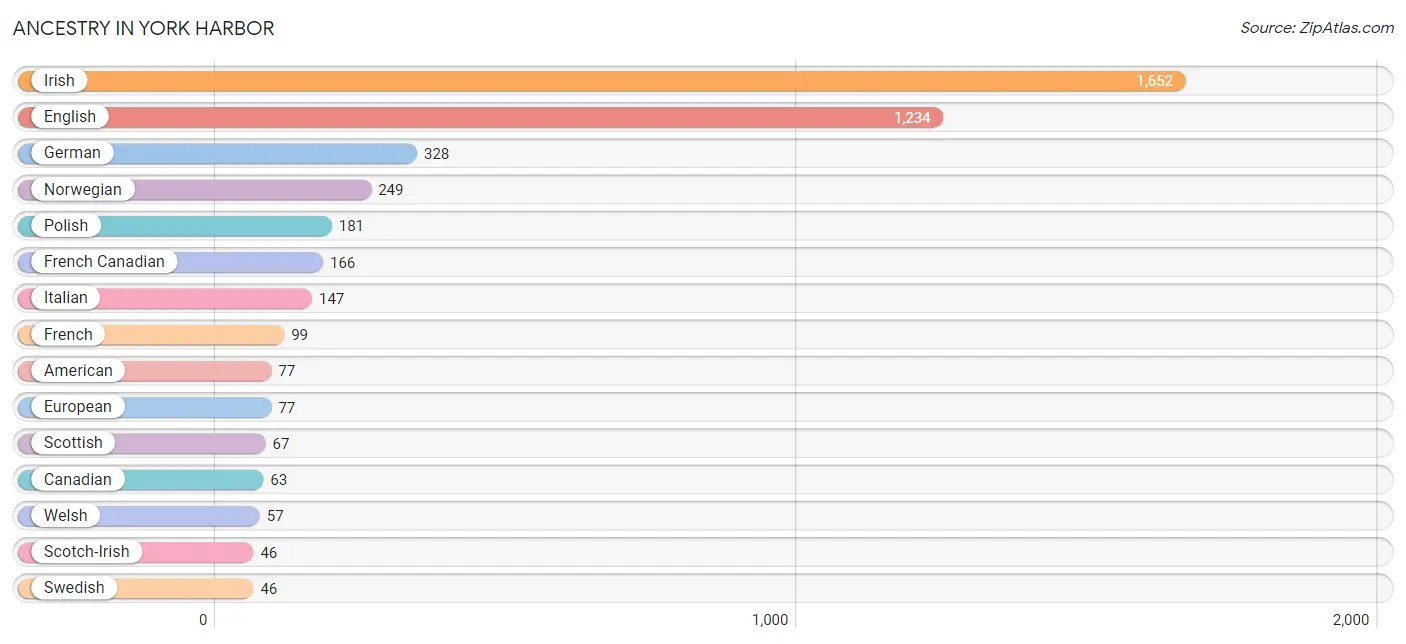
| Ancestry | # Population | % Population |
| American | 77 | 2.1% |
| Austrian | 1 | 0.0% |
| Belgian | 5 | 0.1% |
| Brazilian | 18 | 0.5% |
| British | 20 | 0.5% |
| Canadian | 63 | 1.7% |
| Central American | 11 | 0.3% |
| Czechoslovakian | 13 | 0.4% |
| Dutch | 27 | 0.7% |
| Eastern European | 6 | 0.2% |
| English | 1,234 | 33.9% |
| European | 77 | 2.1% |
| Finnish | 12 | 0.3% |
| French | 99 | 2.7% |
| French Canadian | 166 | 4.6% |
| German | 328 | 9.0% |
| Indian (Asian) | 20 | 0.5% |
| Irish | 1,652 | 45.4% |
| Italian | 147 | 4.0% |
| Korean | 39 | 1.1% |
| Lithuanian | 9 | 0.3% |
| Norwegian | 249 | 6.8% |
| Panamanian | 11 | 0.3% |
| Polish | 181 | 5.0% |
| Russian | 13 | 0.4% |
| Scandinavian | 14 | 0.4% |
| Scotch-Irish | 46 | 1.3% |
| Scottish | 67 | 1.8% |
| Swedish | 46 | 1.3% |
| Welsh | 57 | 1.6% | View All 30 Rows |
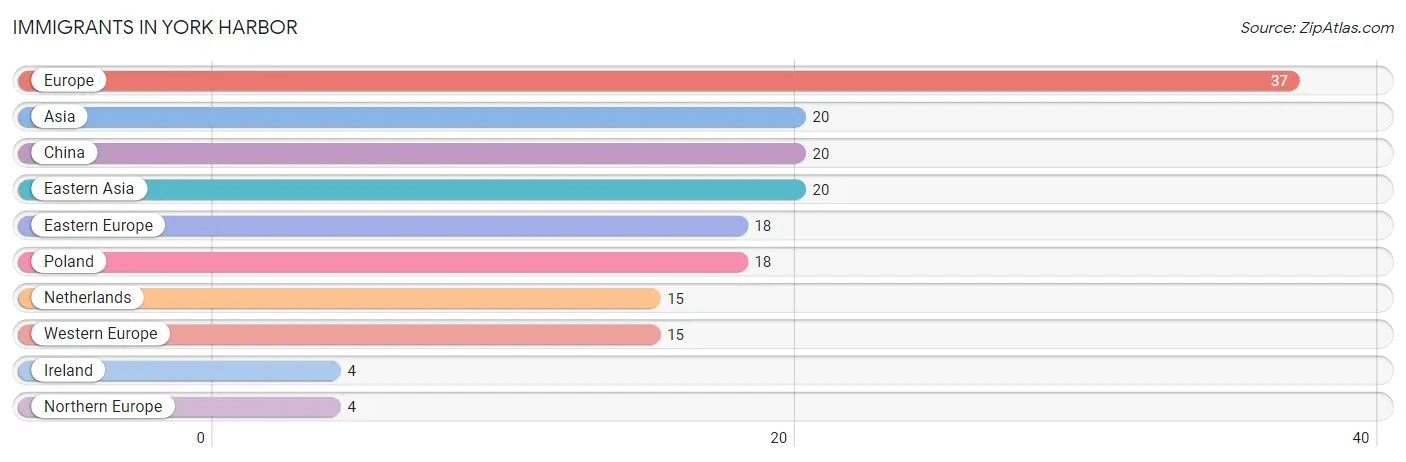
Immigrants in York Harbor
The most numerous immigrant groups reported in York Harbor came from Europe (37 | 1.0%), Asia (20 | 0.5%), China (20 | 0.5%), Eastern Asia (20 | 0.5%), and Eastern Europe (18 | 0.5%), together accounting for 3.2% of all York Harbor residents.
| Immigration Origin | # Population | % Population |
| Asia | 20 | 0.5% |
| China | 20 | 0.5% |
| Eastern Asia | 20 | 0.5% |
| Eastern Europe | 18 | 0.5% |
| Europe | 37 | 1.0% |
| Ireland | 4 | 0.1% |
| Netherlands | 15 | 0.4% |
| Northern Europe | 4 | 0.1% |
| Poland | 18 | 0.5% |
| Western Europe | 15 | 0.4% | View All 10 Rows |
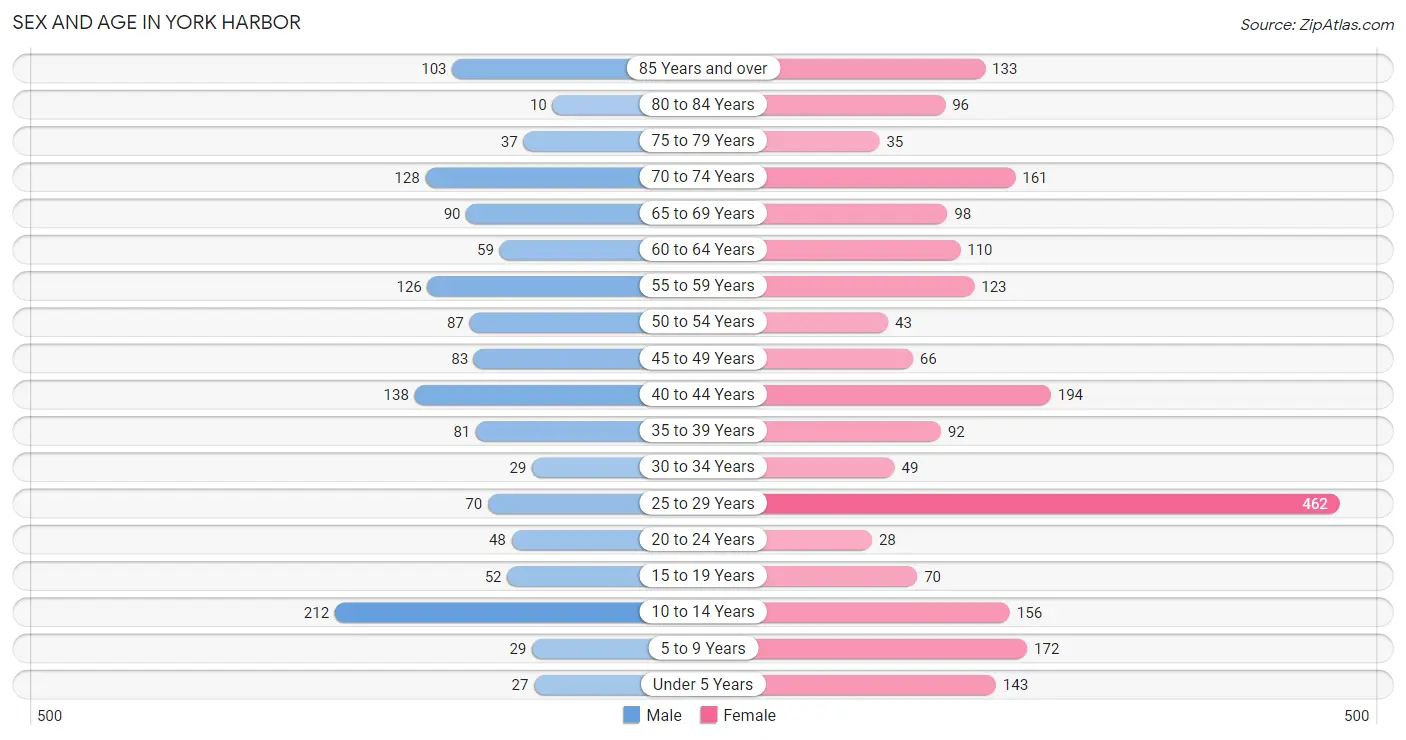
Sex and Age in York Harbor
Sex and Age in York Harbor
The most populous age groups in York Harbor are 10 to 14 Years (212 | 15.0%) for men and 25 to 29 Years (462 | 20.7%) for women.
| Age Bracket | Male | Female |
| Under 5 Years | 27 (1.9%) | 143 (6.4%) |
| 5 to 9 Years | 29 (2.1%) | 172 (7.7%) |
| 10 to 14 Years | 212 (15.0%) | 156 (7.0%) |
| 15 to 19 Years | 52 (3.7%) | 70 (3.1%) |
| 20 to 24 Years | 48 (3.4%) | 28 (1.3%) |
| 25 to 29 Years | 70 (5.0%) | 462 (20.7%) |
| 30 to 34 Years | 29 (2.1%) | 49 (2.2%) |
| 35 to 39 Years | 81 (5.8%) | 92 (4.1%) |
| 40 to 44 Years | 138 (9.8%) | 194 (8.7%) |
| 45 to 49 Years | 83 (5.9%) | 66 (3.0%) |
| 50 to 54 Years | 87 (6.2%) | 43 (1.9%) |
| 55 to 59 Years | 126 (8.9%) | 123 (5.5%) |
| 60 to 64 Years | 59 (4.2%) | 110 (4.9%) |
| 65 to 69 Years | 90 (6.4%) | 98 (4.4%) |
| 70 to 74 Years | 128 (9.1%) | 161 (7.2%) |
| 75 to 79 Years | 37 (2.6%) | 35 (1.6%) |
| 80 to 84 Years | 10 (0.7%) | 96 (4.3%) |
| 85 Years and over | 103 (7.3%) | 133 (6.0%) |
| Total | 1,409 (100.0%) | 2,231 (100.0%) |
Families and Households in York Harbor
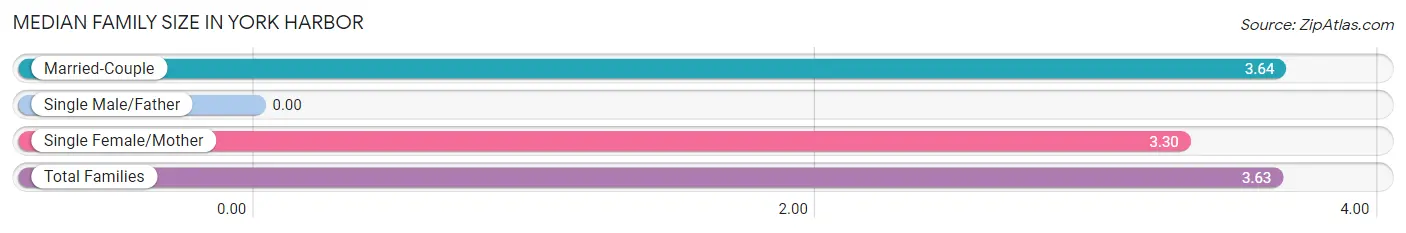
Median Family Size in York Harbor
| Family Type | # Families | Family Size |
| Married-Couple | 722 (96.9%) | 3.64 |
| Single Male/Father | 0 (0.0%) | - |
| Single Female/Mother | 23 (3.1%) | 3.30 |
| Total Families | 745 (100.0%) | 3.63 |
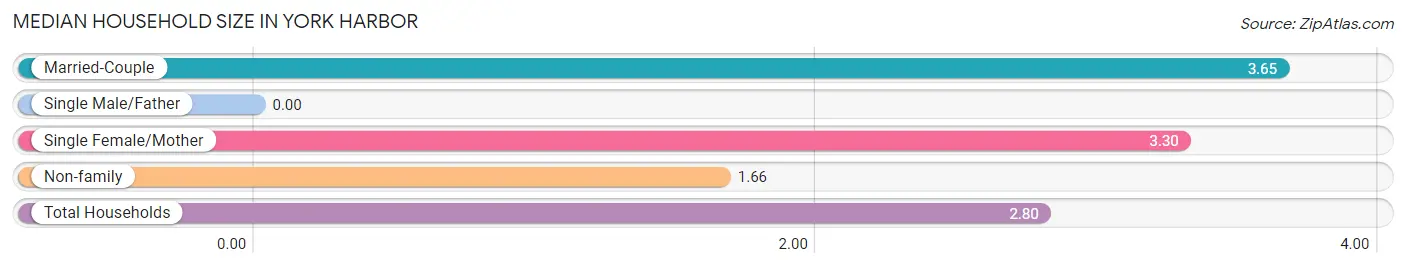
Median Household Size in York Harbor
| Household Type | # Households | Household Size |
| Married-Couple | 722 (55.9%) | 3.65 |
| Single Male/Father | 0 (0.0%) | - |
| Single Female/Mother | 23 (1.8%) | 3.30 |
| Non-family | 546 (42.3%) | 1.66 |
| Total Households | 1,291 (100.0%) | 2.80 |
Household Size by Marriage Status in York Harbor
Out of a total of 1,291 households in York Harbor, 745 (57.7%) are family households, while 546 (42.3%) are nonfamily households. The most numerous type of family households are 2-person households, comprising 354, and the most common type of nonfamily households are 1-person households, comprising 387.
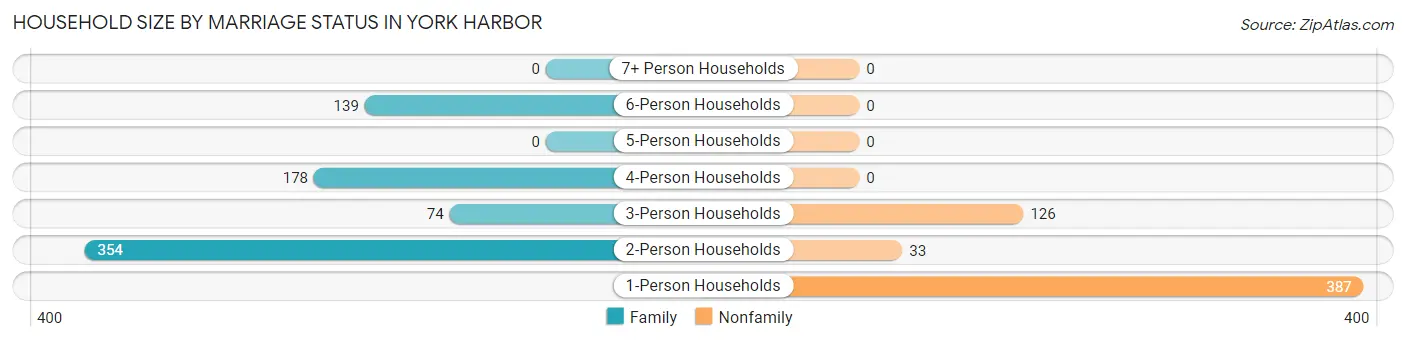
| Household Size | Family Households | Nonfamily Households |
| 1-Person Households | - | 387 (30.0%) |
| 2-Person Households | 354 (27.4%) | 33 (2.6%) |
| 3-Person Households | 74 (5.7%) | 126 (9.8%) |
| 4-Person Households | 178 (13.8%) | 0 (0.0%) |
| 5-Person Households | 0 (0.0%) | 0 (0.0%) |
| 6-Person Households | 139 (10.8%) | 0 (0.0%) |
| 7+ Person Households | 0 (0.0%) | 0 (0.0%) |
| Total | 745 (57.7%) | 546 (42.3%) |
Female Fertility in York Harbor
Fertility by Age in York Harbor
| Age Bracket | Women with Births | Births / 1,000 Women |
| 15 to 19 years | 0 (0.0%) | 0.0 |
| 20 to 34 years | 0 (0.0%) | 0.0 |
| 35 to 50 years | 0 (0.0%) | 0.0 |
| Total | 0 (0.0%) | 0.0 |
Fertility by Age by Marriage Status in York Harbor
| Age Bracket | Married | Unmarried |
| 15 to 19 years | 0 (0.0%) | 0 (0.0%) |
| 20 to 34 years | 0 (0.0%) | 0 (0.0%) |
| 35 to 50 years | 0 (0.0%) | 0 (0.0%) |
| Total | 0 (0.0%) | 0 (0.0%) |
Fertility by Education in York Harbor
| Educational Attainment | Women with Births | Births / 1,000 Women |
| Less than High School | 0 (0.0%) | 0.0 |
| High School Diploma | 0 (0.0%) | 0.0 |
| College or Associate's Degree | 0 (0.0%) | 0.0 |
| Bachelor's Degree | 0 (0.0%) | 0.0 |
| Graduate Degree | 0 (0.0%) | 0.0 |
| Total | 0 (0.0%) | 0.0 |
Fertility by Education by Marriage Status in York Harbor
| Educational Attainment | Married | Unmarried |
| Less than High School | 0 (0.0%) | 0 (0.0%) |
| High School Diploma | 0 (0.0%) | 0 (0.0%) |
| College or Associate's Degree | 0 (0.0%) | 0 (0.0%) |
| Bachelor's Degree | 0 (0.0%) | 0 (0.0%) |
| Graduate Degree | 0 (0.0%) | 0 (0.0%) |
| Total | 0 (0.0%) | 0 (0.0%) |
Employment Characteristics in York Harbor
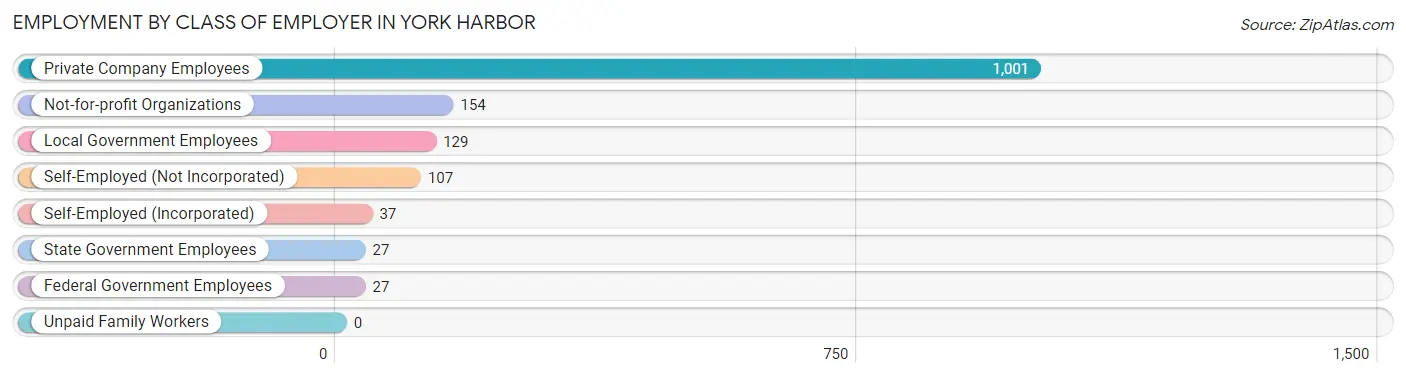
Employment by Class of Employer in York Harbor
Among the 1,482 employed individuals in York Harbor, private company employees (1,001 | 67.5%), not-for-profit organizations (154 | 10.4%), and local government employees (129 | 8.7%) make up the most common classes of employment.
| Employer Class | # Employees | % Employees |
| Private Company Employees | 1,001 | 67.5% |
| Self-Employed (Incorporated) | 37 | 2.5% |
| Self-Employed (Not Incorporated) | 107 | 7.2% |
| Not-for-profit Organizations | 154 | 10.4% |
| Local Government Employees | 129 | 8.7% |
| State Government Employees | 27 | 1.8% |
| Federal Government Employees | 27 | 1.8% |
| Unpaid Family Workers | 0 | 0.0% |
| Total | 1,482 | 100.0% |
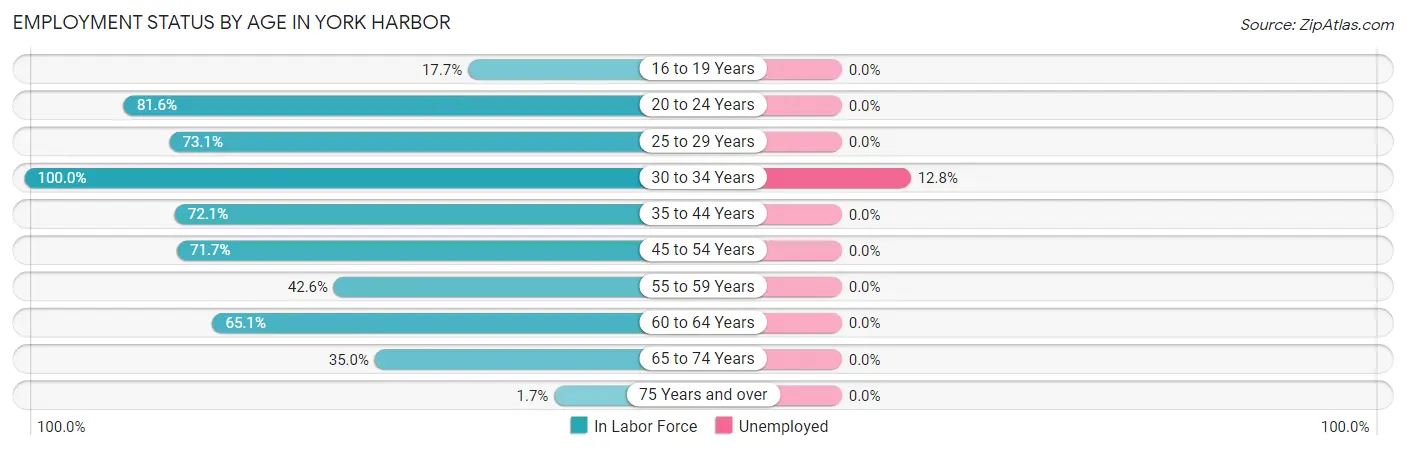
Employment Status by Age in York Harbor
According to the labor force statistics for York Harbor, out of the total population over 16 years of age (2,892), 52.0% or 1,504 individuals are in the labor force, with 0.7% or 11 of them unemployed. The age group with the highest labor force participation rate is 30 to 34 years, with 100.0% or 78 individuals in the labor force. Within the labor force, the 30 to 34 years age range has the highest percentage of unemployed individuals, with 12.8% or 10 of them being unemployed.
| Age Bracket | In Labor Force | Unemployed |
| 16 to 19 Years | 20 (17.7%) | 0 (0.0%) |
| 20 to 24 Years | 62 (81.6%) | 0 (0.0%) |
| 25 to 29 Years | 389 (73.1%) | 0 (0.0%) |
| 30 to 34 Years | 78 (100.0%) | 10 (12.8%) |
| 35 to 44 Years | 364 (72.1%) | 0 (0.0%) |
| 45 to 54 Years | 200 (71.7%) | 0 (0.0%) |
| 55 to 59 Years | 106 (42.6%) | 0 (0.0%) |
| 60 to 64 Years | 110 (65.1%) | 0 (0.0%) |
| 65 to 74 Years | 167 (35.0%) | 0 (0.0%) |
| 75 Years and over | 7 (1.7%) | 0 (0.0%) |
| Total | 1,504 (52.0%) | 11 (0.7%) |
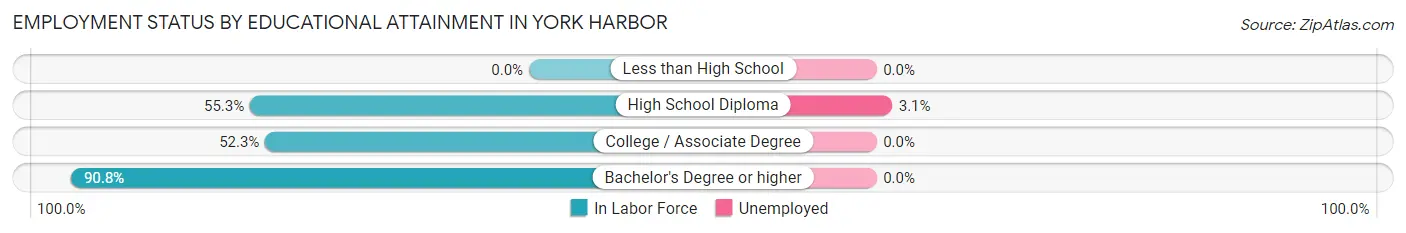
Employment Status by Educational Attainment in York Harbor
According to labor force statistics for York Harbor, 68.8% of individuals (1,247) out of the total population between 25 and 64 years of age (1,812) are in the labor force, with 0.8% or 10 of them being unemployed. The group with the highest labor force participation rate are those with the educational attainment of bachelor's degree or higher, with 90.8% or 665 individuals in the labor force. Within the labor force, individuals with high school diploma education have the highest percentage of unemployment, with 3.1% or 10 of them being unemployed.
| Educational Attainment | In Labor Force | Unemployed |
| Less than High School | 0 (0.0%) | 0 (0.0%) |
| High School Diploma | 318 (55.3%) | 18 (3.1%) |
| College / Associate Degree | 264 (52.3%) | 0 (0.0%) |
| Bachelor's Degree or higher | 665 (90.8%) | 0 (0.0%) |
| Total | 1,247 (68.8%) | 14 (0.8%) |
Employment Occupations by Sex in York Harbor
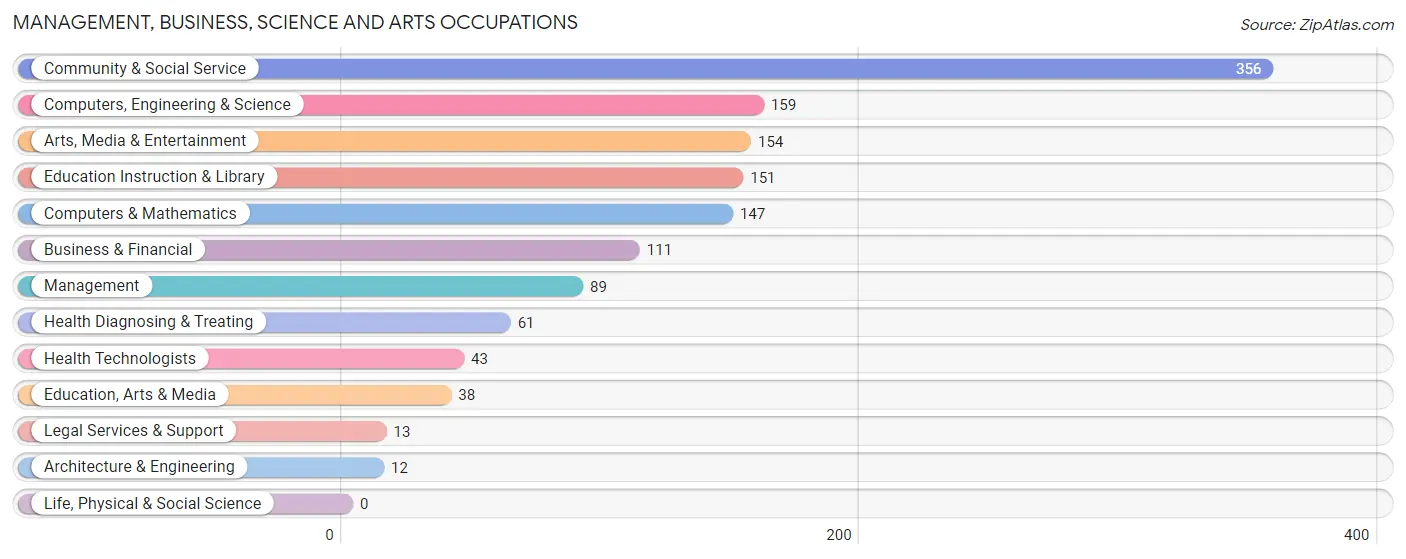
Management, Business, Science and Arts Occupations
The most common Management, Business, Science and Arts occupations in York Harbor are Community & Social Service (356 | 23.8%), Computers, Engineering & Science (159 | 10.6%), Arts, Media & Entertainment (154 | 10.3%), Education Instruction & Library (151 | 10.1%), and Computers & Mathematics (147 | 9.9%).
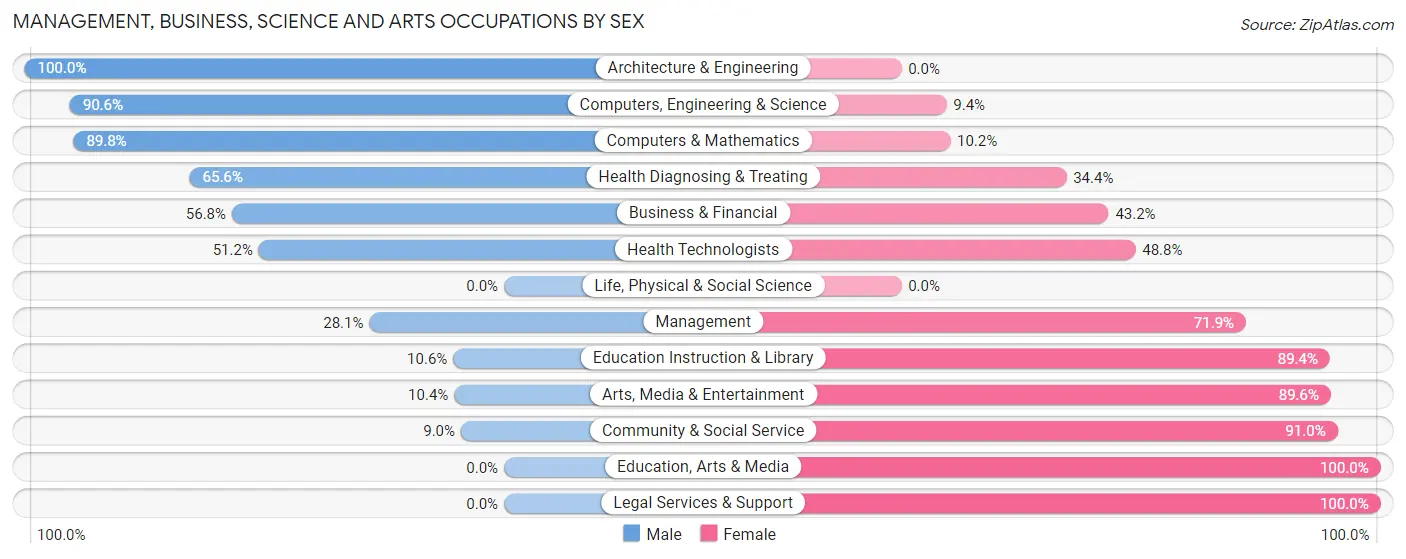
Management, Business, Science and Arts Occupations by Sex
Within the Management, Business, Science and Arts occupations in York Harbor, the most male-oriented occupations are Architecture & Engineering (100.0%), Computers, Engineering & Science (90.6%), and Computers & Mathematics (89.8%), while the most female-oriented occupations are Education, Arts & Media (100.0%), Legal Services & Support (100.0%), and Community & Social Service (91.0%).
| Occupation | Male | Female |
| Management | 25 (28.1%) | 64 (71.9%) |
| Business & Financial | 63 (56.8%) | 48 (43.2%) |
| Computers, Engineering & Science | 144 (90.6%) | 15 (9.4%) |
| Computers & Mathematics | 132 (89.8%) | 15 (10.2%) |
| Architecture & Engineering | 12 (100.0%) | 0 (0.0%) |
| Life, Physical & Social Science | 0 (0.0%) | 0 (0.0%) |
| Community & Social Service | 32 (9.0%) | 324 (91.0%) |
| Education, Arts & Media | 0 (0.0%) | 38 (100.0%) |
| Legal Services & Support | 0 (0.0%) | 13 (100.0%) |
| Education Instruction & Library | 16 (10.6%) | 135 (89.4%) |
| Arts, Media & Entertainment | 16 (10.4%) | 138 (89.6%) |
| Health Diagnosing & Treating | 40 (65.6%) | 21 (34.4%) |
| Health Technologists | 22 (51.2%) | 21 (48.8%) |
| Total (Category) | 304 (39.2%) | 472 (60.8%) |
| Total (Overall) | 608 (40.7%) | 885 (59.3%) |
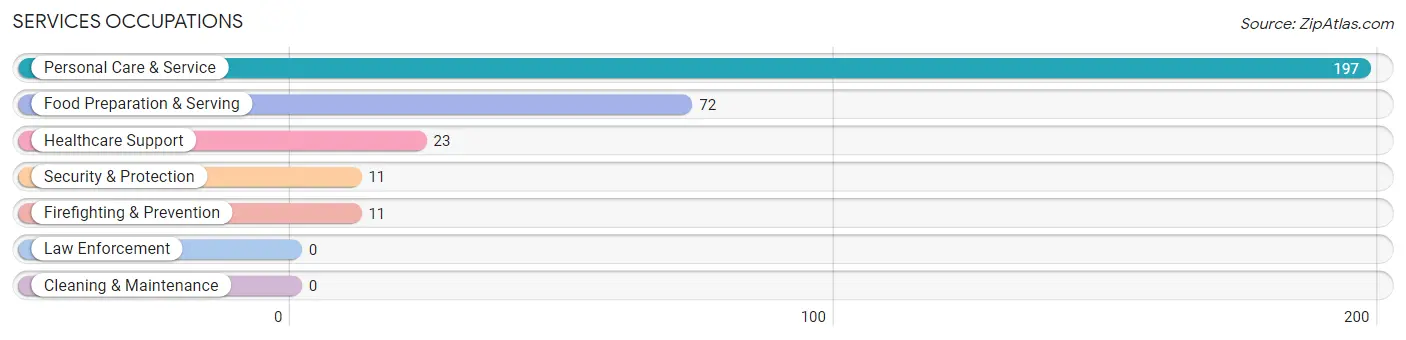
Services Occupations
The most common Services occupations in York Harbor are Personal Care & Service (197 | 13.2%), Food Preparation & Serving (72 | 4.8%), Healthcare Support (23 | 1.5%), Security & Protection (11 | 0.7%), and Firefighting & Prevention (11 | 0.7%).
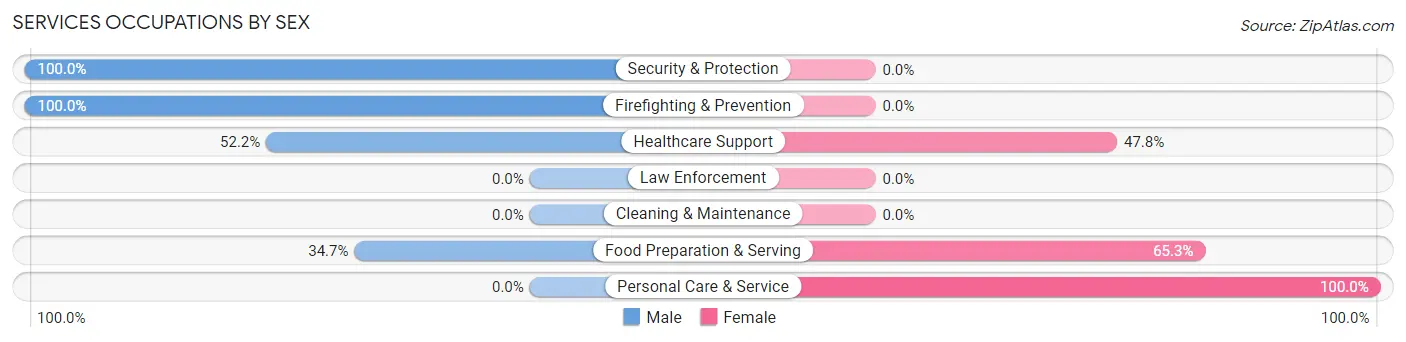
Services Occupations by Sex
Within the Services occupations in York Harbor, the most male-oriented occupations are Security & Protection (100.0%), Firefighting & Prevention (100.0%), and Healthcare Support (52.2%), while the most female-oriented occupations are Personal Care & Service (100.0%), Food Preparation & Serving (65.3%), and Healthcare Support (47.8%).
| Occupation | Male | Female |
| Healthcare Support | 12 (52.2%) | 11 (47.8%) |
| Security & Protection | 11 (100.0%) | 0 (0.0%) |
| Firefighting & Prevention | 11 (100.0%) | 0 (0.0%) |
| Law Enforcement | 0 (0.0%) | 0 (0.0%) |
| Food Preparation & Serving | 25 (34.7%) | 47 (65.3%) |
| Cleaning & Maintenance | 0 (0.0%) | 0 (0.0%) |
| Personal Care & Service | 0 (0.0%) | 197 (100.0%) |
| Total (Category) | 48 (15.8%) | 255 (84.2%) |
| Total (Overall) | 608 (40.7%) | 885 (59.3%) |
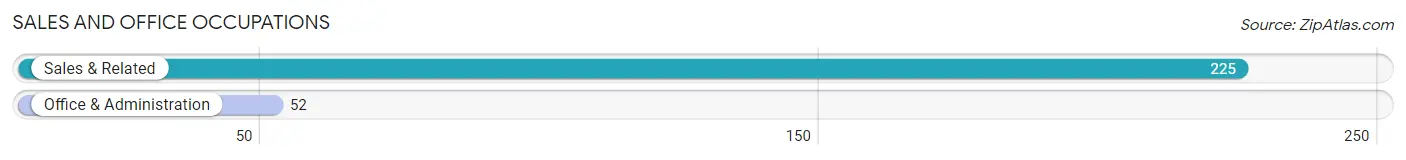
Sales and Office Occupations
The most common Sales and Office occupations in York Harbor are Sales & Related (225 | 15.1%), and Office & Administration (52 | 3.5%).
Sales and Office Occupations by Sex
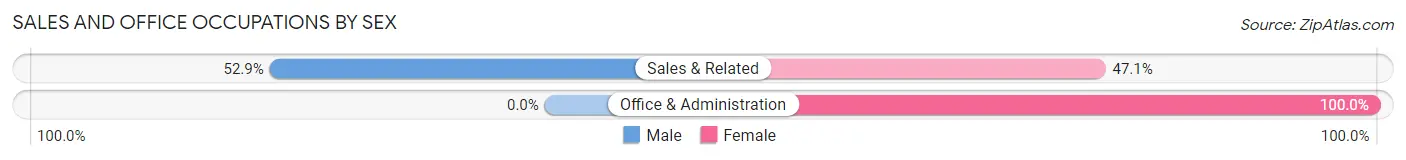
| Occupation | Male | Female |
| Sales & Related | 119 (52.9%) | 106 (47.1%) |
| Office & Administration | 0 (0.0%) | 52 (100.0%) |
| Total (Category) | 119 (43.0%) | 158 (57.0%) |
| Total (Overall) | 608 (40.7%) | 885 (59.3%) |
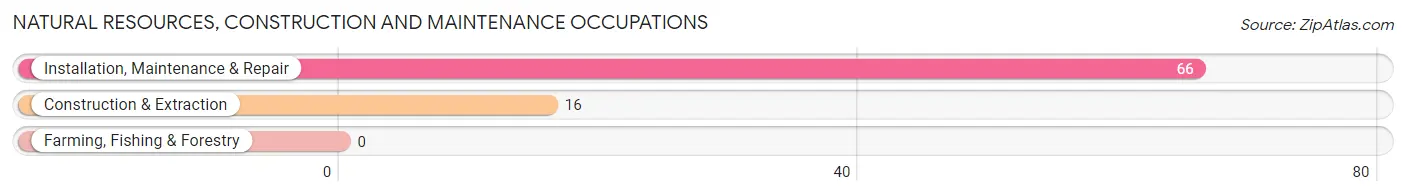
Natural Resources, Construction and Maintenance Occupations
The most common Natural Resources, Construction and Maintenance occupations in York Harbor are Installation, Maintenance & Repair (66 | 4.4%), and Construction & Extraction (16 | 1.1%).
Natural Resources, Construction and Maintenance Occupations by Sex
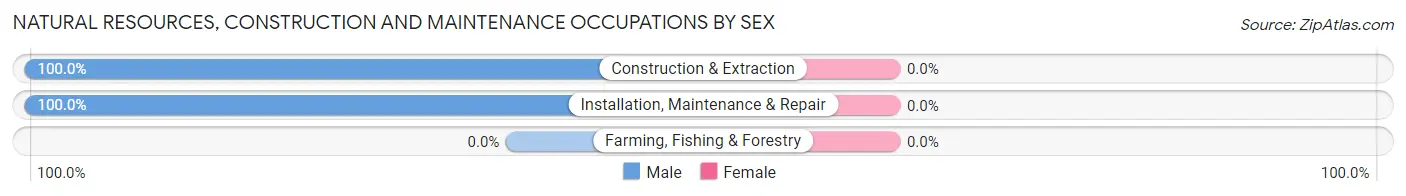
| Occupation | Male | Female |
| Farming, Fishing & Forestry | 0 (0.0%) | 0 (0.0%) |
| Construction & Extraction | 16 (100.0%) | 0 (0.0%) |
| Installation, Maintenance & Repair | 66 (100.0%) | 0 (0.0%) |
| Total (Category) | 82 (100.0%) | 0 (0.0%) |
| Total (Overall) | 608 (40.7%) | 885 (59.3%) |
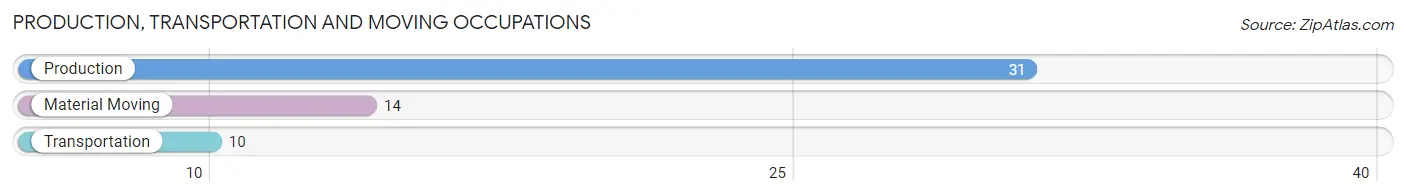
Production, Transportation and Moving Occupations
The most common Production, Transportation and Moving occupations in York Harbor are Production (31 | 2.1%), Material Moving (14 | 0.9%), and Transportation (10 | 0.7%).
Production, Transportation and Moving Occupations by Sex
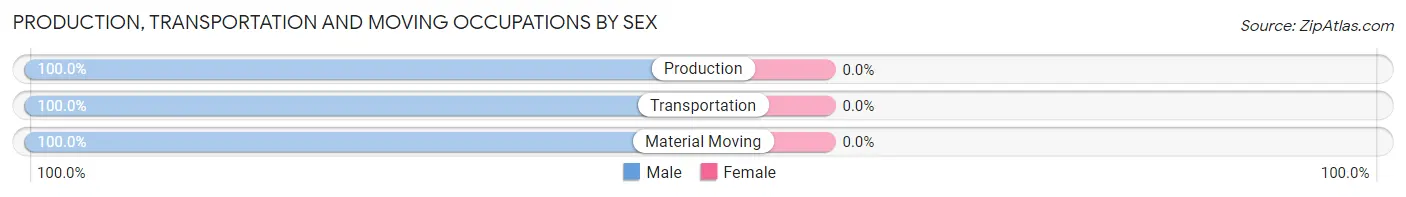
| Occupation | Male | Female |
| Production | 31 (100.0%) | 0 (0.0%) |
| Transportation | 10 (100.0%) | 0 (0.0%) |
| Material Moving | 14 (100.0%) | 0 (0.0%) |
| Total (Category) | 55 (100.0%) | 0 (0.0%) |
| Total (Overall) | 608 (40.7%) | 885 (59.3%) |
Employment Industries by Sex in York Harbor
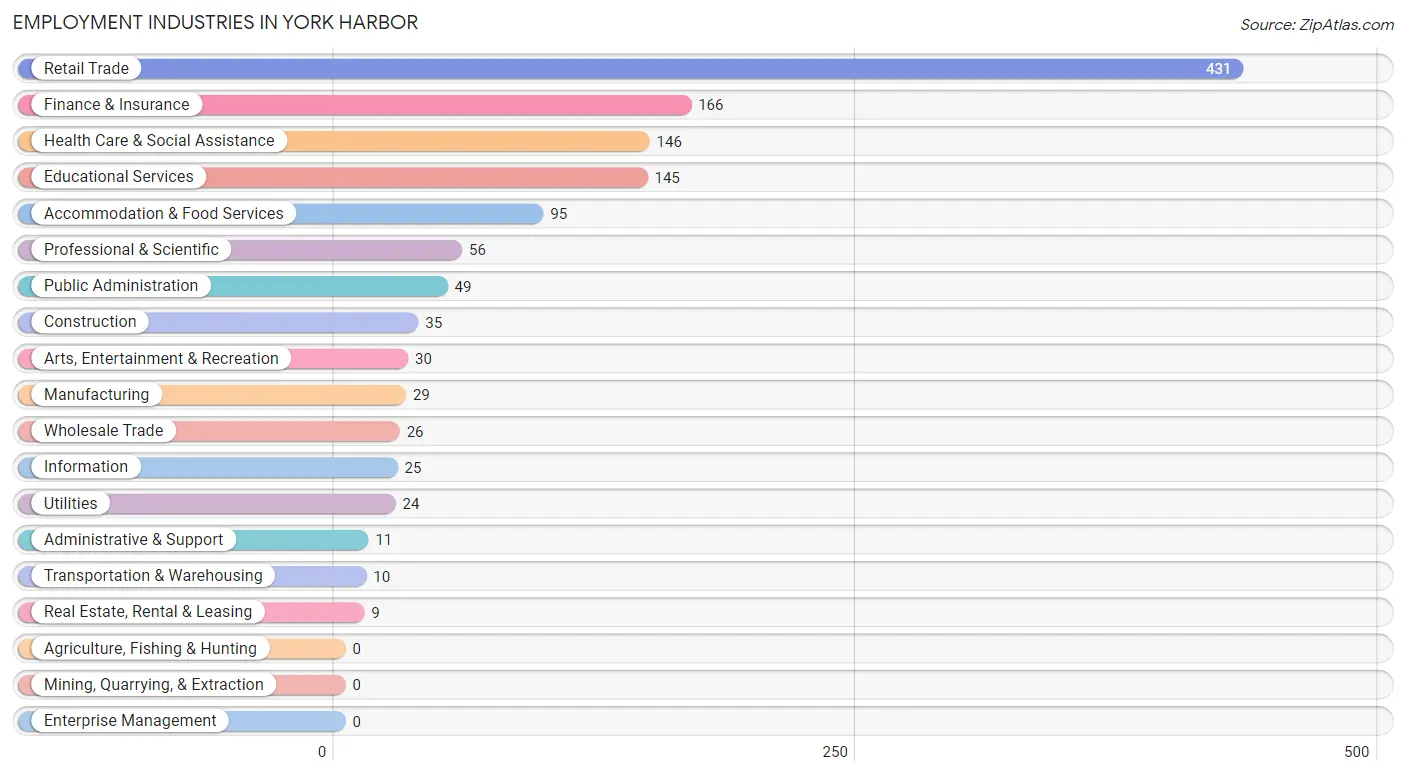
Employment Industries in York Harbor
The major employment industries in York Harbor include Retail Trade (431 | 28.9%), Finance & Insurance (166 | 11.1%), Health Care & Social Assistance (146 | 9.8%), Educational Services (145 | 9.7%), and Accommodation & Food Services (95 | 6.4%).
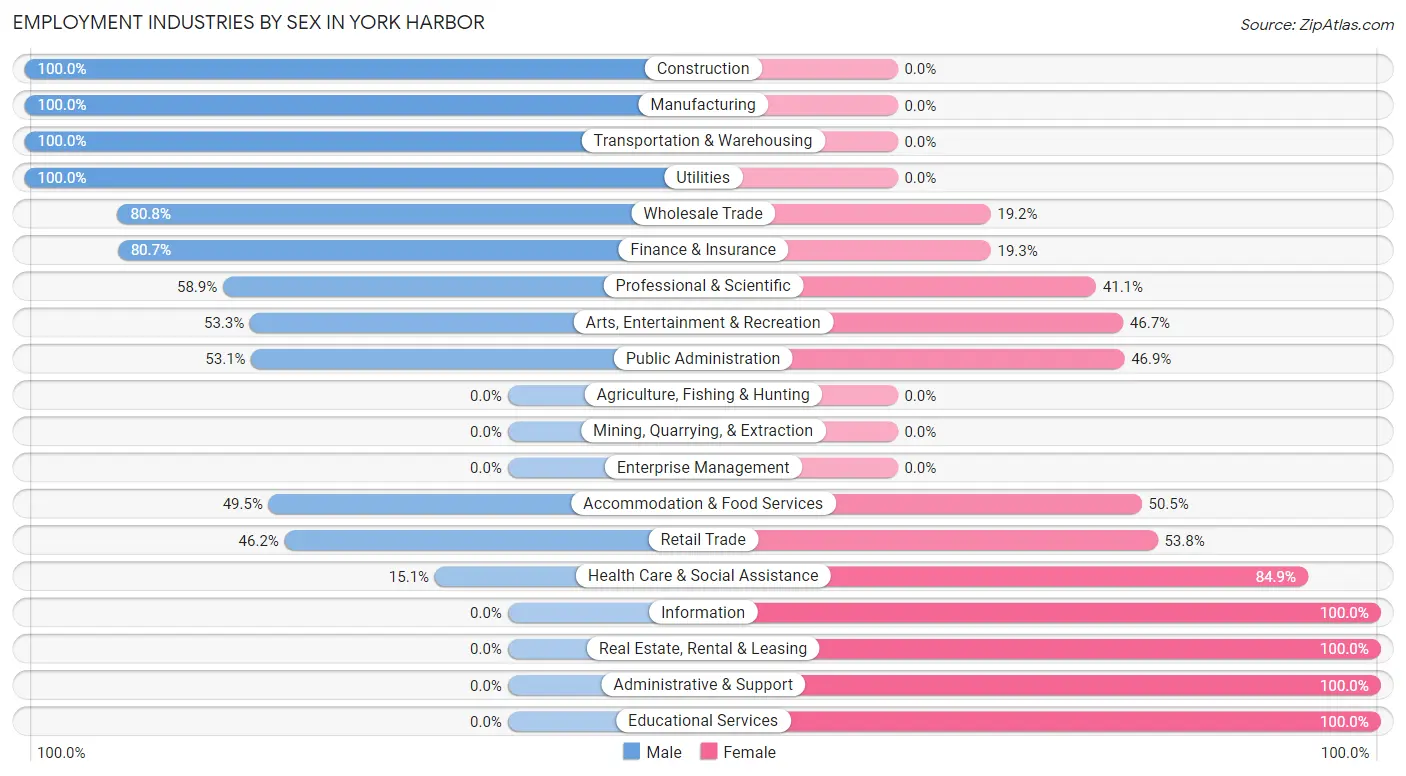
Employment Industries by Sex in York Harbor
The York Harbor industries that see more men than women are Construction (100.0%), Manufacturing (100.0%), and Transportation & Warehousing (100.0%), whereas the industries that tend to have a higher number of women are Information (100.0%), Real Estate, Rental & Leasing (100.0%), and Administrative & Support (100.0%).
| Industry | Male | Female |
| Agriculture, Fishing & Hunting | 0 (0.0%) | 0 (0.0%) |
| Mining, Quarrying, & Extraction | 0 (0.0%) | 0 (0.0%) |
| Construction | 35 (100.0%) | 0 (0.0%) |
| Manufacturing | 29 (100.0%) | 0 (0.0%) |
| Wholesale Trade | 21 (80.8%) | 5 (19.2%) |
| Retail Trade | 199 (46.2%) | 232 (53.8%) |
| Transportation & Warehousing | 10 (100.0%) | 0 (0.0%) |
| Utilities | 24 (100.0%) | 0 (0.0%) |
| Information | 0 (0.0%) | 25 (100.0%) |
| Finance & Insurance | 134 (80.7%) | 32 (19.3%) |
| Real Estate, Rental & Leasing | 0 (0.0%) | 9 (100.0%) |
| Professional & Scientific | 33 (58.9%) | 23 (41.1%) |
| Enterprise Management | 0 (0.0%) | 0 (0.0%) |
| Administrative & Support | 0 (0.0%) | 11 (100.0%) |
| Educational Services | 0 (0.0%) | 145 (100.0%) |
| Health Care & Social Assistance | 22 (15.1%) | 124 (84.9%) |
| Arts, Entertainment & Recreation | 16 (53.3%) | 14 (46.7%) |
| Accommodation & Food Services | 47 (49.5%) | 48 (50.5%) |
| Public Administration | 26 (53.1%) | 23 (46.9%) |
| Total | 608 (40.7%) | 885 (59.3%) |
Education in York Harbor
School Enrollment in York Harbor
The most common levels of schooling among the 690 students in York Harbor are middle school (356 | 51.6%), elementary school (205 | 29.7%), and high school (67 | 9.7%).
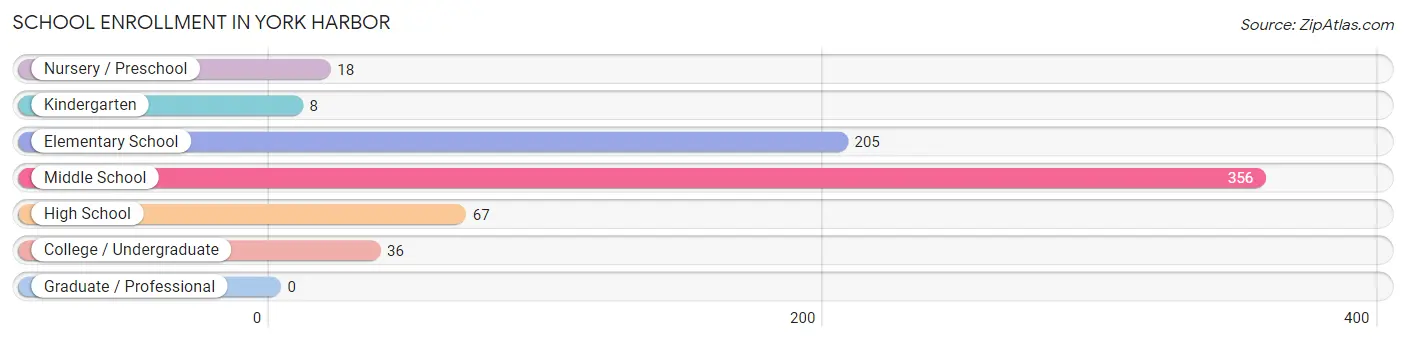
| School Level | # Students | % Students |
| Nursery / Preschool | 18 | 2.6% |
| Kindergarten | 8 | 1.2% |
| Elementary School | 205 | 29.7% |
| Middle School | 356 | 51.6% |
| High School | 67 | 9.7% |
| College / Undergraduate | 36 | 5.2% |
| Graduate / Professional | 0 | 0.0% |
| Total | 690 | 100.0% |
School Enrollment by Age by Funding Source in York Harbor
Out of a total of 690 students who are enrolled in schools in York Harbor, 92 (13.3%) attend a private institution, while the remaining 598 (86.7%) are enrolled in public schools. The age group of 20 to 24 year olds has the highest likelihood of being enrolled in private schools, with 36 (100.0% in the age bracket) enrolled. Conversely, the age group of 3 to 4 year olds has the lowest likelihood of being enrolled in a private school, with 18 (100.0% in the age bracket) attending a public institution.
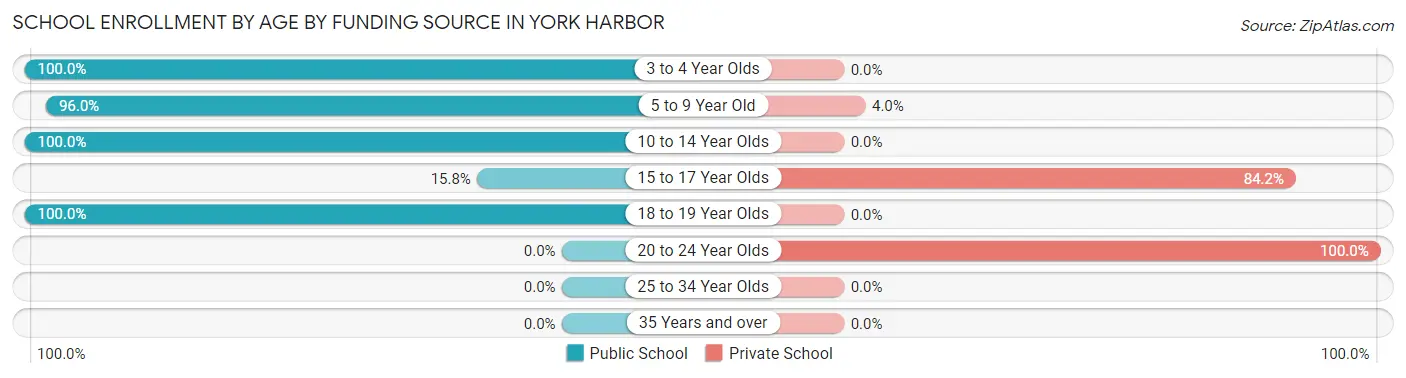
| Age Bracket | Public School | Private School |
| 3 to 4 Year Olds | 18 (100.0%) | 0 (0.0%) |
| 5 to 9 Year Old | 193 (96.0%) | 8 (4.0%) |
| 10 to 14 Year Olds | 368 (100.0%) | 0 (0.0%) |
| 15 to 17 Year Olds | 9 (15.8%) | 48 (84.2%) |
| 18 to 19 Year Olds | 10 (100.0%) | 0 (0.0%) |
| 20 to 24 Year Olds | 0 (0.0%) | 36 (100.0%) |
| 25 to 34 Year Olds | 0 (0.0%) | 0 (0.0%) |
| 35 Years and over | 0 (0.0%) | 0 (0.0%) |
| Total | 598 (86.7%) | 92 (13.3%) |
Educational Attainment by Field of Study in York Harbor
Business (295 | 23.3%), visual & performing arts (204 | 16.1%), education (139 | 11.0%), liberal arts & history (125 | 9.9%), and social sciences (98 | 7.7%) are the most common fields of study among 1,269 individuals in York Harbor who have obtained a bachelor's degree or higher.
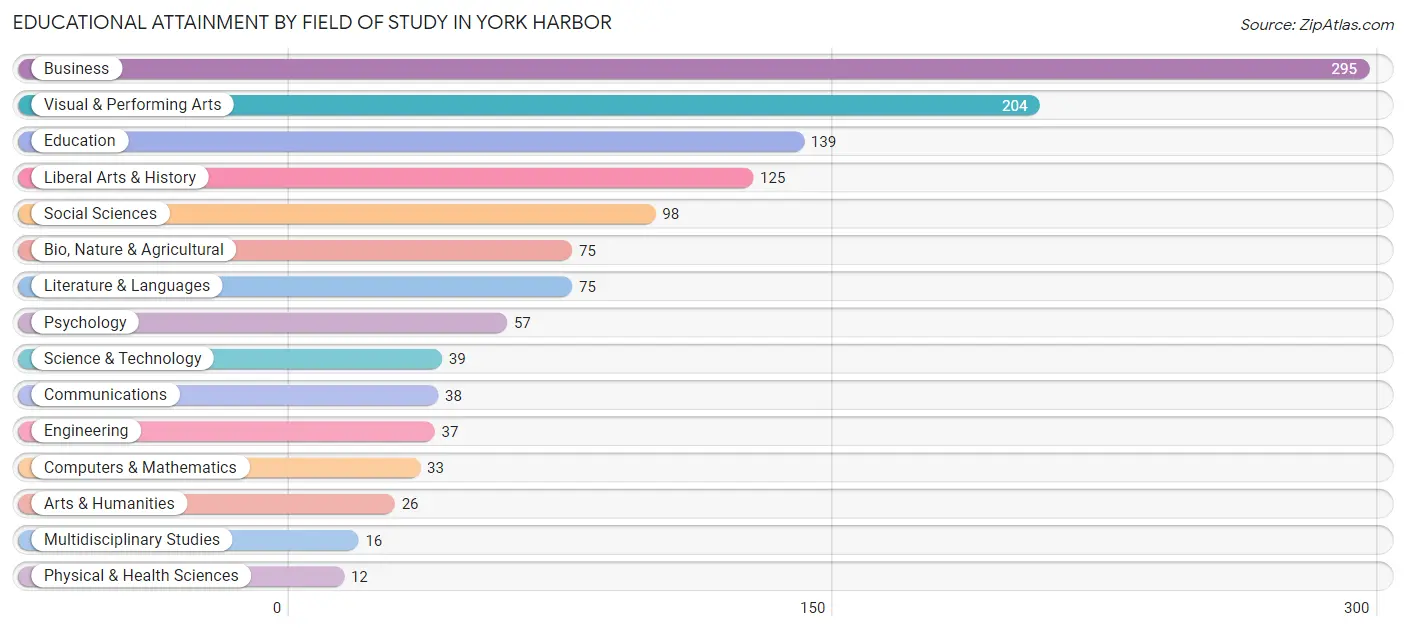
| Field of Study | # Graduates | % Graduates |
| Computers & Mathematics | 33 | 2.6% |
| Bio, Nature & Agricultural | 75 | 5.9% |
| Physical & Health Sciences | 12 | 0.9% |
| Psychology | 57 | 4.5% |
| Social Sciences | 98 | 7.7% |
| Engineering | 37 | 2.9% |
| Multidisciplinary Studies | 16 | 1.3% |
| Science & Technology | 39 | 3.1% |
| Business | 295 | 23.3% |
| Education | 139 | 11.0% |
| Literature & Languages | 75 | 5.9% |
| Liberal Arts & History | 125 | 9.9% |
| Visual & Performing Arts | 204 | 16.1% |
| Communications | 38 | 3.0% |
| Arts & Humanities | 26 | 2.1% |
| Total | 1,269 | 100.0% |
Transportation & Commute in York Harbor
Vehicle Availability by Sex in York Harbor
The most prevalent vehicle ownership categories in York Harbor are males with 2 vehicles (340, accounting for 55.9%) and females with 2 vehicles (246, making up 39.0%).
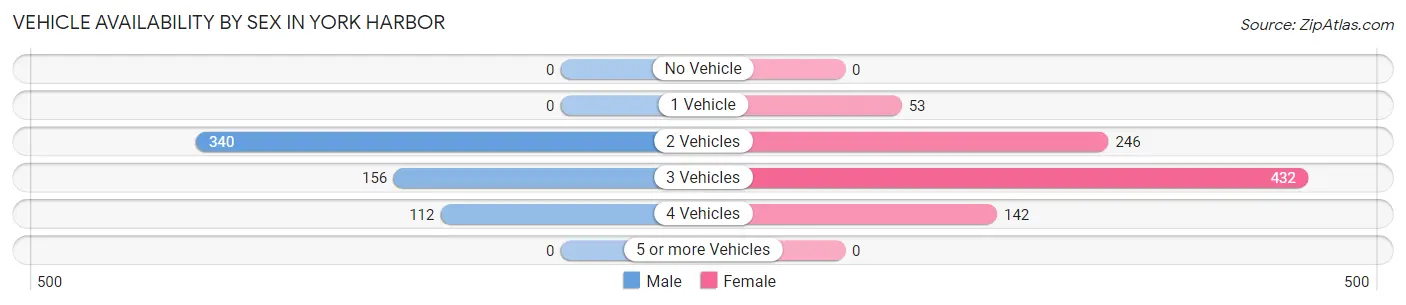
| Vehicles Available | Male | Female |
| No Vehicle | 0 (0.0%) | 0 (0.0%) |
| 1 Vehicle | 0 (0.0%) | 53 (6.1%) |
| 2 Vehicles | 340 (55.9%) | 246 (28.2%) |
| 3 Vehicles | 156 (25.7%) | 432 (49.5%) |
| 4 Vehicles | 112 (18.4%) | 142 (16.3%) |
| 5 or more Vehicles | 0 (0.0%) | 0 (0.0%) |
| Total | 608 (100.0%) | 873 (100.0%) |
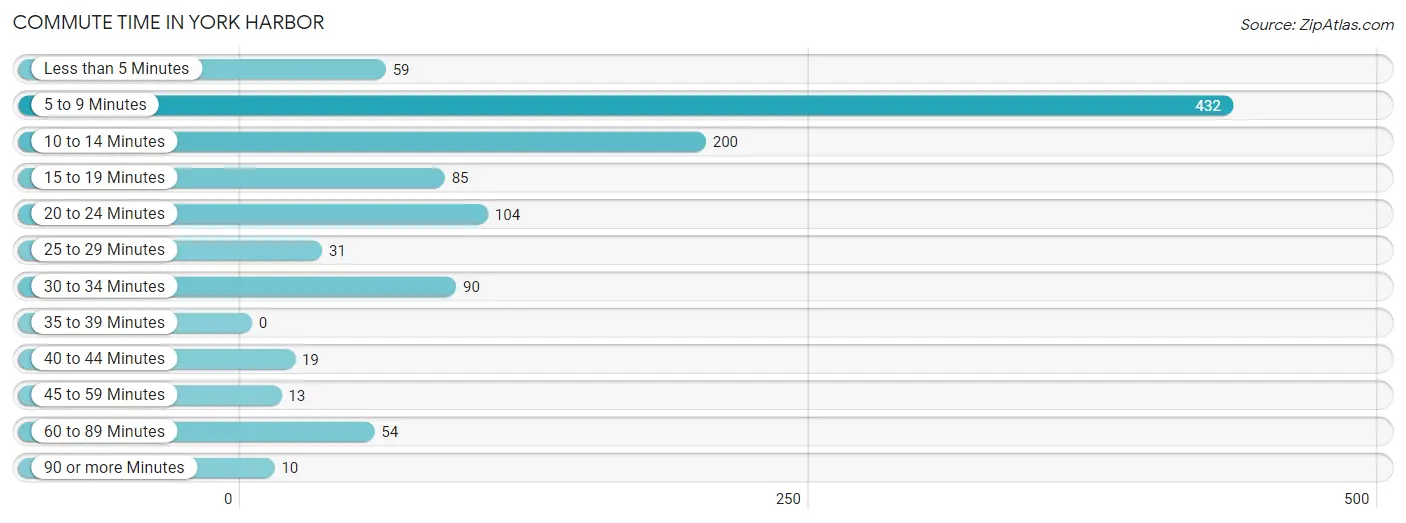
Commute Time in York Harbor
The most frequently occuring commute durations in York Harbor are 5 to 9 minutes (432 commuters, 39.4%), 10 to 14 minutes (200 commuters, 18.2%), and 20 to 24 minutes (104 commuters, 9.5%).
| Commute Time | # Commuters | % Commuters |
| Less than 5 Minutes | 59 | 5.4% |
| 5 to 9 Minutes | 432 | 39.4% |
| 10 to 14 Minutes | 200 | 18.2% |
| 15 to 19 Minutes | 85 | 7.7% |
| 20 to 24 Minutes | 104 | 9.5% |
| 25 to 29 Minutes | 31 | 2.8% |
| 30 to 34 Minutes | 90 | 8.2% |
| 35 to 39 Minutes | 0 | 0.0% |
| 40 to 44 Minutes | 19 | 1.7% |
| 45 to 59 Minutes | 13 | 1.2% |
| 60 to 89 Minutes | 54 | 4.9% |
| 90 or more Minutes | 10 | 0.9% |
Commute Time by Sex in York Harbor
The most common commute times in York Harbor are 20 to 24 minutes (94 commuters, 28.2%) for males and 5 to 9 minutes (405 commuters, 53.0%) for females.
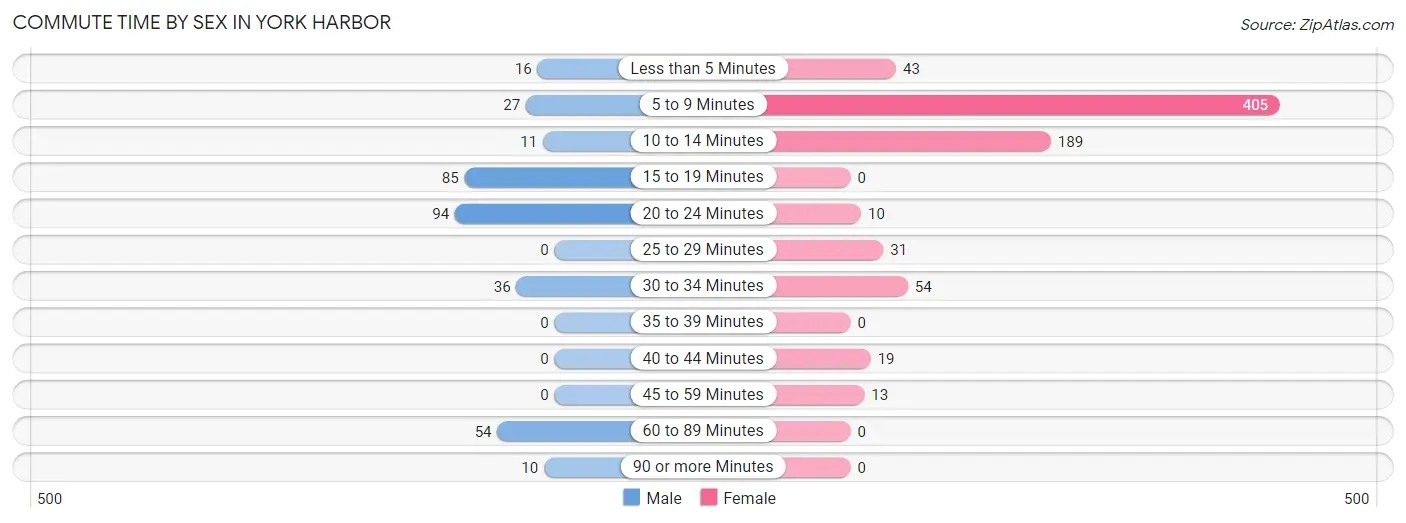
| Commute Time | Male | Female |
| Less than 5 Minutes | 16 (4.8%) | 43 (5.6%) |
| 5 to 9 Minutes | 27 (8.1%) | 405 (53.0%) |
| 10 to 14 Minutes | 11 (3.3%) | 189 (24.7%) |
| 15 to 19 Minutes | 85 (25.5%) | 0 (0.0%) |
| 20 to 24 Minutes | 94 (28.2%) | 10 (1.3%) |
| 25 to 29 Minutes | 0 (0.0%) | 31 (4.1%) |
| 30 to 34 Minutes | 36 (10.8%) | 54 (7.1%) |
| 35 to 39 Minutes | 0 (0.0%) | 0 (0.0%) |
| 40 to 44 Minutes | 0 (0.0%) | 19 (2.5%) |
| 45 to 59 Minutes | 0 (0.0%) | 13 (1.7%) |
| 60 to 89 Minutes | 54 (16.2%) | 0 (0.0%) |
| 90 or more Minutes | 10 (3.0%) | 0 (0.0%) |
Time of Departure to Work by Sex in York Harbor
The most frequent times of departure to work in York Harbor are 7:30 AM to 7:59 AM (106, 31.8%) for males and 9:00 AM to 9:59 AM (362, 47.4%) for females.
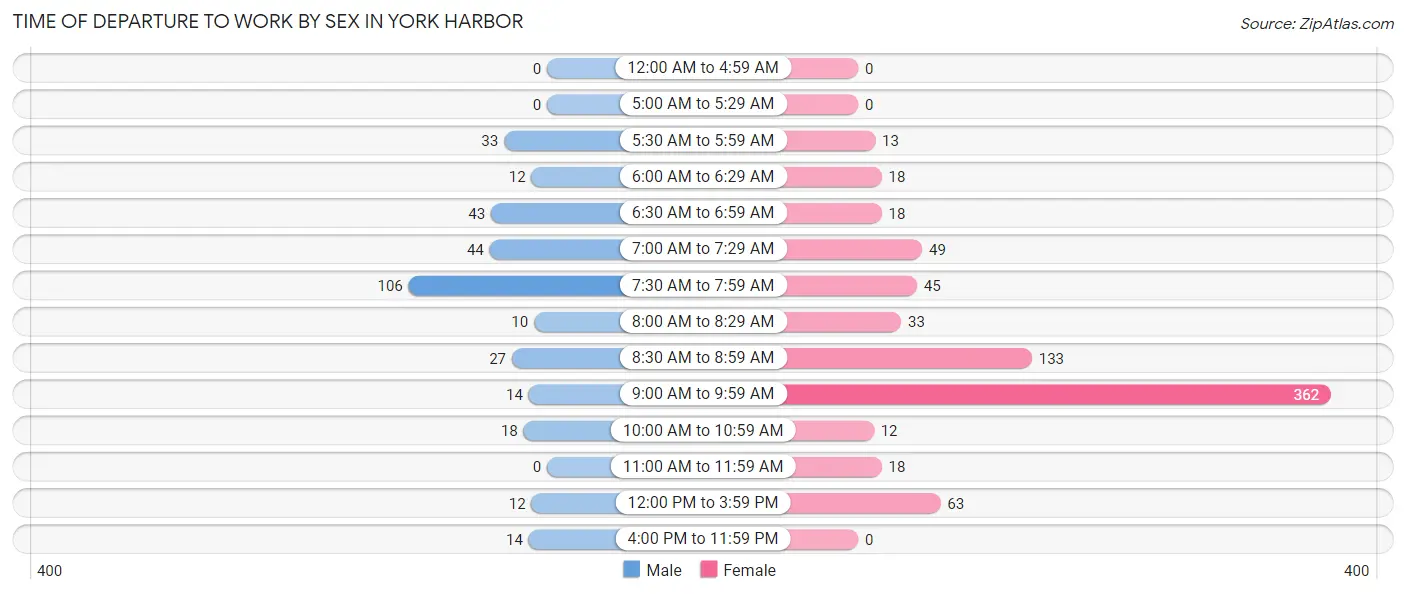
| Time of Departure | Male | Female |
| 12:00 AM to 4:59 AM | 0 (0.0%) | 0 (0.0%) |
| 5:00 AM to 5:29 AM | 0 (0.0%) | 0 (0.0%) |
| 5:30 AM to 5:59 AM | 33 (9.9%) | 13 (1.7%) |
| 6:00 AM to 6:29 AM | 12 (3.6%) | 18 (2.4%) |
| 6:30 AM to 6:59 AM | 43 (12.9%) | 18 (2.4%) |
| 7:00 AM to 7:29 AM | 44 (13.2%) | 49 (6.4%) |
| 7:30 AM to 7:59 AM | 106 (31.8%) | 45 (5.9%) |
| 8:00 AM to 8:29 AM | 10 (3.0%) | 33 (4.3%) |
| 8:30 AM to 8:59 AM | 27 (8.1%) | 133 (17.4%) |
| 9:00 AM to 9:59 AM | 14 (4.2%) | 362 (47.4%) |
| 10:00 AM to 10:59 AM | 18 (5.4%) | 12 (1.6%) |
| 11:00 AM to 11:59 AM | 0 (0.0%) | 18 (2.4%) |
| 12:00 PM to 3:59 PM | 12 (3.6%) | 63 (8.3%) |
| 4:00 PM to 11:59 PM | 14 (4.2%) | 0 (0.0%) |
| Total | 333 (100.0%) | 764 (100.0%) |
Housing Occupancy in York Harbor
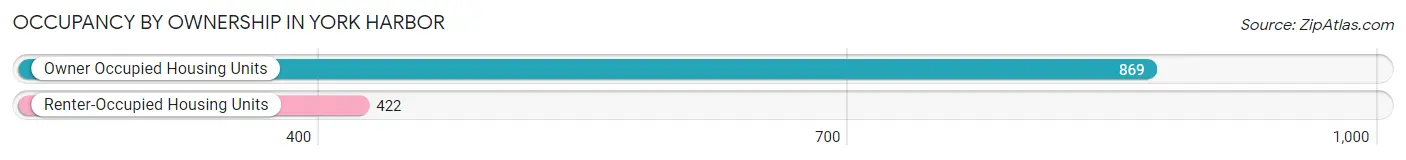
Occupancy by Ownership in York Harbor
Of the total 1,291 dwellings in York Harbor, owner-occupied units account for 869 (67.3%), while renter-occupied units make up 422 (32.7%).
| Occupancy | # Housing Units | % Housing Units |
| Owner Occupied Housing Units | 869 | 67.3% |
| Renter-Occupied Housing Units | 422 | 32.7% |
| Total Occupied Housing Units | 1,291 | 100.0% |
Occupancy by Household Size in York Harbor
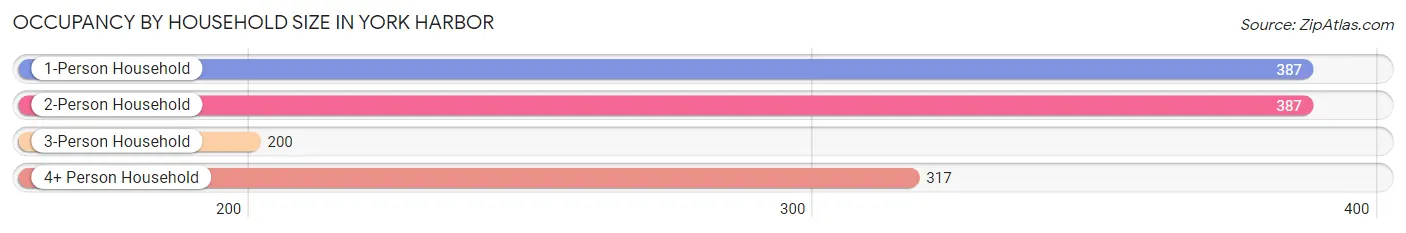
| Household Size | # Housing Units | % Housing Units |
| 1-Person Household | 387 | 30.0% |
| 2-Person Household | 387 | 30.0% |
| 3-Person Household | 200 | 15.5% |
| 4+ Person Household | 317 | 24.5% |
| Total Housing Units | 1,291 | 100.0% |
Occupancy by Ownership by Household Size in York Harbor
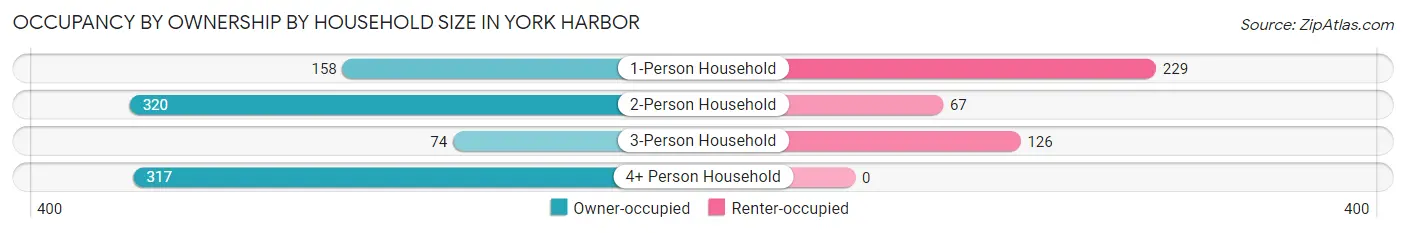
| Household Size | Owner-occupied | Renter-occupied |
| 1-Person Household | 158 (40.8%) | 229 (59.2%) |
| 2-Person Household | 320 (82.7%) | 67 (17.3%) |
| 3-Person Household | 74 (37.0%) | 126 (63.0%) |
| 4+ Person Household | 317 (100.0%) | 0 (0.0%) |
| Total Housing Units | 869 (67.3%) | 422 (32.7%) |
Occupancy by Educational Attainment in York Harbor
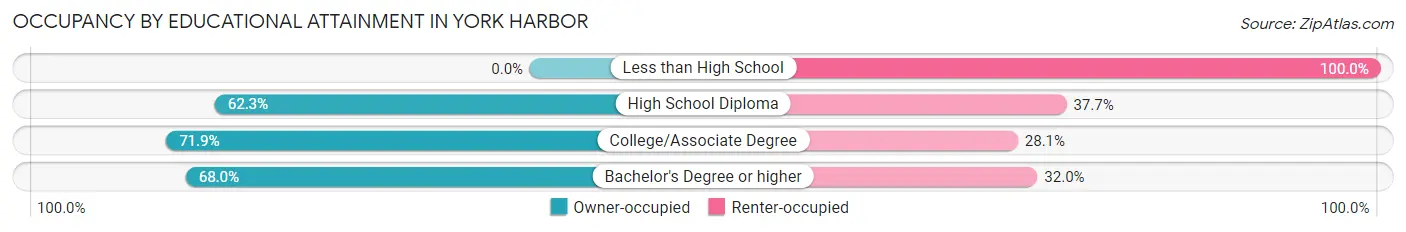
| Household Size | Owner-occupied | Renter-occupied |
| Less than High School | 0 (0.0%) | 9 (100.0%) |
| High School Diploma | 170 (62.3%) | 103 (37.7%) |
| College/Associate Degree | 233 (71.9%) | 91 (28.1%) |
| Bachelor's Degree or higher | 466 (68.0%) | 219 (32.0%) |
Occupancy by Age of Householder in York Harbor
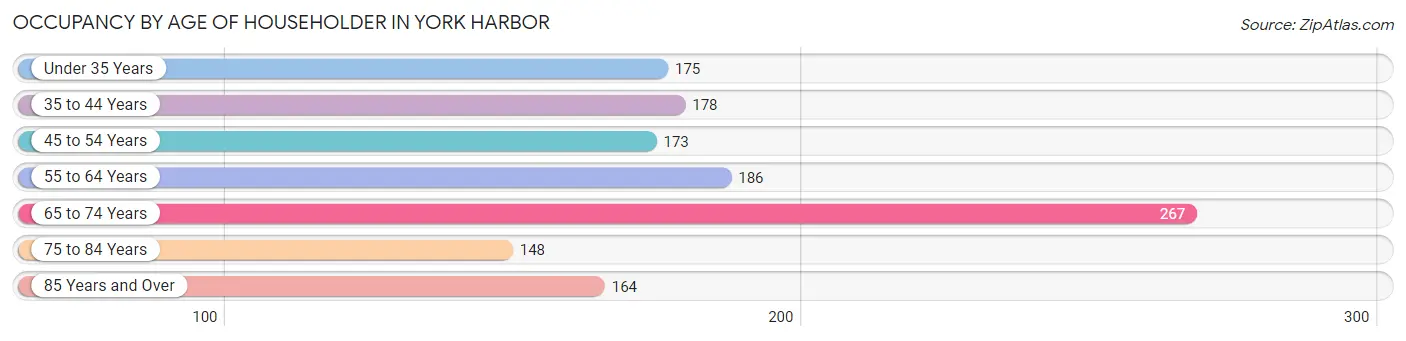
| Age Bracket | # Households | % Households |
| Under 35 Years | 175 | 13.6% |
| 35 to 44 Years | 178 | 13.8% |
| 45 to 54 Years | 173 | 13.4% |
| 55 to 64 Years | 186 | 14.4% |
| 65 to 74 Years | 267 | 20.7% |
| 75 to 84 Years | 148 | 11.5% |
| 85 Years and Over | 164 | 12.7% |
| Total | 1,291 | 100.0% |
Housing Finances in York Harbor
Median Income by Occupancy in York Harbor
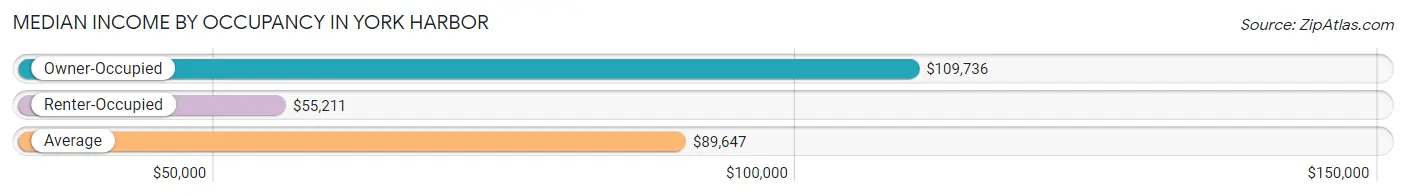
| Occupancy Type | # Households | Median Income |
| Owner-Occupied | 869 (67.3%) | $109,736 |
| Renter-Occupied | 422 (32.7%) | $55,211 |
| Average | 1,291 (100.0%) | $89,647 |
Occupancy by Householder Income Bracket in York Harbor
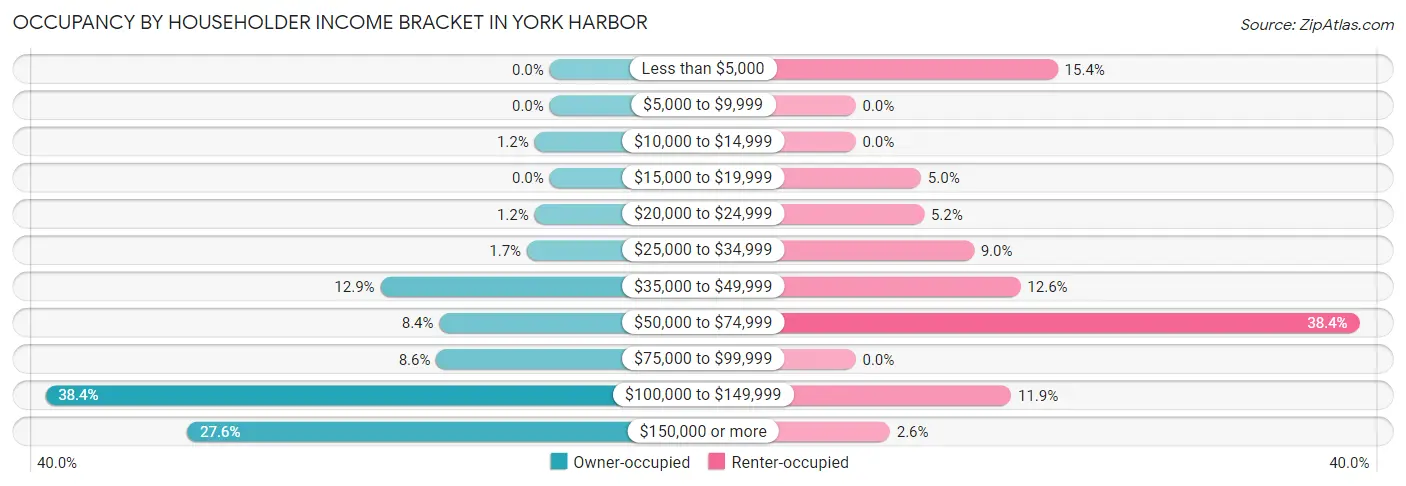
| Income Bracket | Owner-occupied | Renter-occupied |
| Less than $5,000 | 0 (0.0%) | 65 (15.4%) |
| $5,000 to $9,999 | 0 (0.0%) | 0 (0.0%) |
| $10,000 to $14,999 | 10 (1.1%) | 0 (0.0%) |
| $15,000 to $19,999 | 0 (0.0%) | 21 (5.0%) |
| $20,000 to $24,999 | 10 (1.1%) | 22 (5.2%) |
| $25,000 to $34,999 | 15 (1.7%) | 38 (9.0%) |
| $35,000 to $49,999 | 112 (12.9%) | 53 (12.6%) |
| $50,000 to $74,999 | 73 (8.4%) | 162 (38.4%) |
| $75,000 to $99,999 | 75 (8.6%) | 0 (0.0%) |
| $100,000 to $149,999 | 334 (38.4%) | 50 (11.8%) |
| $150,000 or more | 240 (27.6%) | 11 (2.6%) |
| Total | 869 (100.0%) | 422 (100.0%) |
Monthly Housing Cost Tiers in York Harbor
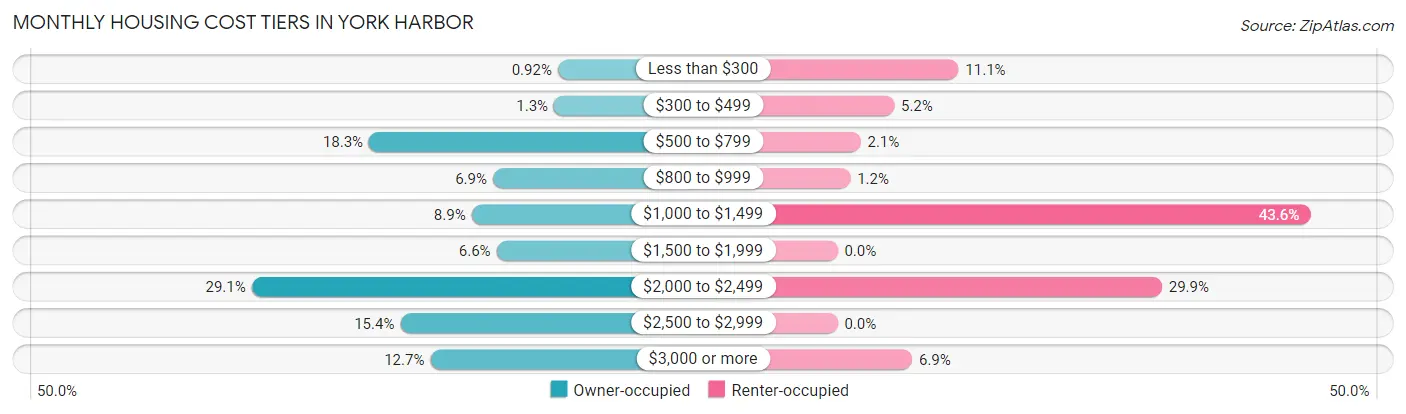
| Monthly Cost | Owner-occupied | Renter-occupied |
| Less than $300 | 8 (0.9%) | 47 (11.1%) |
| $300 to $499 | 11 (1.3%) | 22 (5.2%) |
| $500 to $799 | 159 (18.3%) | 9 (2.1%) |
| $800 to $999 | 60 (6.9%) | 5 (1.2%) |
| $1,000 to $1,499 | 77 (8.9%) | 184 (43.6%) |
| $1,500 to $1,999 | 57 (6.6%) | 0 (0.0%) |
| $2,000 to $2,499 | 253 (29.1%) | 126 (29.9%) |
| $2,500 to $2,999 | 134 (15.4%) | 0 (0.0%) |
| $3,000 or more | 110 (12.7%) | 29 (6.9%) |
| Total | 869 (100.0%) | 422 (100.0%) |
Physical Housing Characteristics in York Harbor
Housing Structures in York Harbor
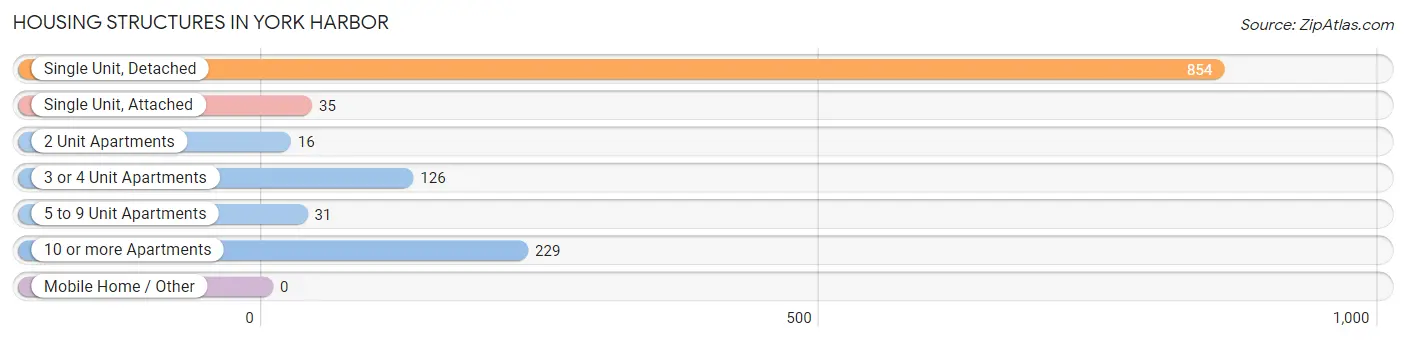
| Structure Type | # Housing Units | % Housing Units |
| Single Unit, Detached | 854 | 66.1% |
| Single Unit, Attached | 35 | 2.7% |
| 2 Unit Apartments | 16 | 1.2% |
| 3 or 4 Unit Apartments | 126 | 9.8% |
| 5 to 9 Unit Apartments | 31 | 2.4% |
| 10 or more Apartments | 229 | 17.7% |
| Mobile Home / Other | 0 | 0.0% |
| Total | 1,291 | 100.0% |
Housing Structures by Occupancy in York Harbor
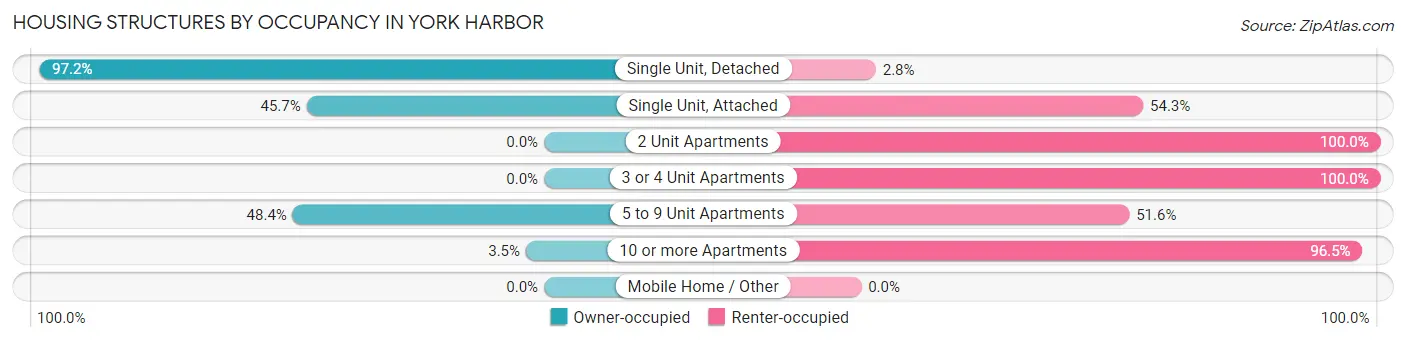
| Structure Type | Owner-occupied | Renter-occupied |
| Single Unit, Detached | 830 (97.2%) | 24 (2.8%) |
| Single Unit, Attached | 16 (45.7%) | 19 (54.3%) |
| 2 Unit Apartments | 0 (0.0%) | 16 (100.0%) |
| 3 or 4 Unit Apartments | 0 (0.0%) | 126 (100.0%) |
| 5 to 9 Unit Apartments | 15 (48.4%) | 16 (51.6%) |
| 10 or more Apartments | 8 (3.5%) | 221 (96.5%) |
| Mobile Home / Other | 0 (0.0%) | 0 (0.0%) |
| Total | 869 (67.3%) | 422 (32.7%) |
Housing Structures by Number of Rooms in York Harbor
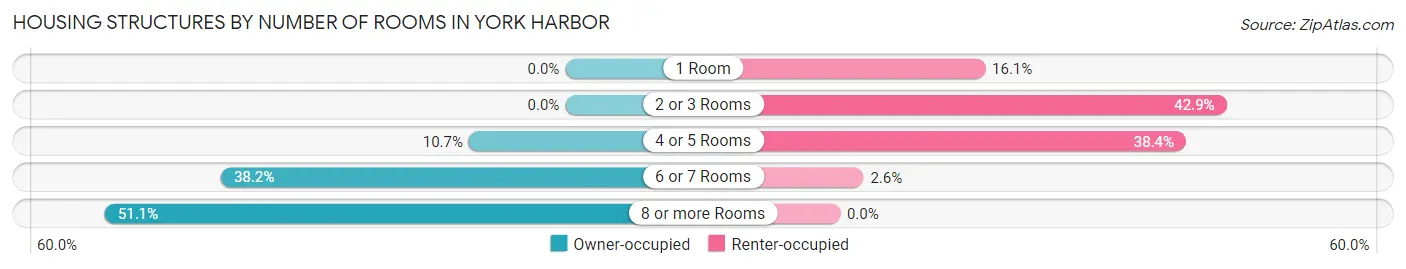
| Number of Rooms | Owner-occupied | Renter-occupied |
| 1 Room | 0 (0.0%) | 68 (16.1%) |
| 2 or 3 Rooms | 0 (0.0%) | 181 (42.9%) |
| 4 or 5 Rooms | 93 (10.7%) | 162 (38.4%) |
| 6 or 7 Rooms | 332 (38.2%) | 11 (2.6%) |
| 8 or more Rooms | 444 (51.1%) | 0 (0.0%) |
| Total | 869 (100.0%) | 422 (100.0%) |
Housing Structure by Heating Type in York Harbor
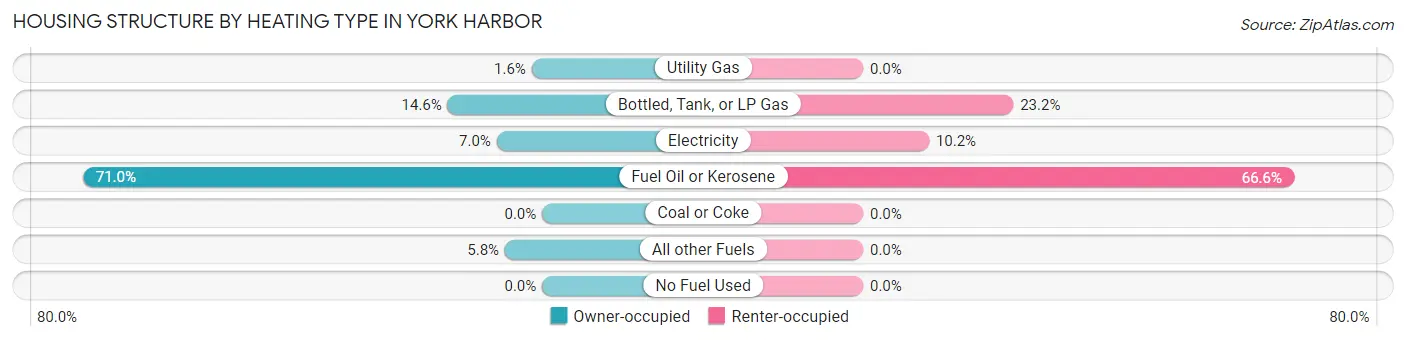
| Heating Type | Owner-occupied | Renter-occupied |
| Utility Gas | 14 (1.6%) | 0 (0.0%) |
| Bottled, Tank, or LP Gas | 127 (14.6%) | 98 (23.2%) |
| Electricity | 61 (7.0%) | 43 (10.2%) |
| Fuel Oil or Kerosene | 617 (71.0%) | 281 (66.6%) |
| Coal or Coke | 0 (0.0%) | 0 (0.0%) |
| All other Fuels | 50 (5.8%) | 0 (0.0%) |
| No Fuel Used | 0 (0.0%) | 0 (0.0%) |
| Total | 869 (100.0%) | 422 (100.0%) |
Household Vehicle Usage in York Harbor
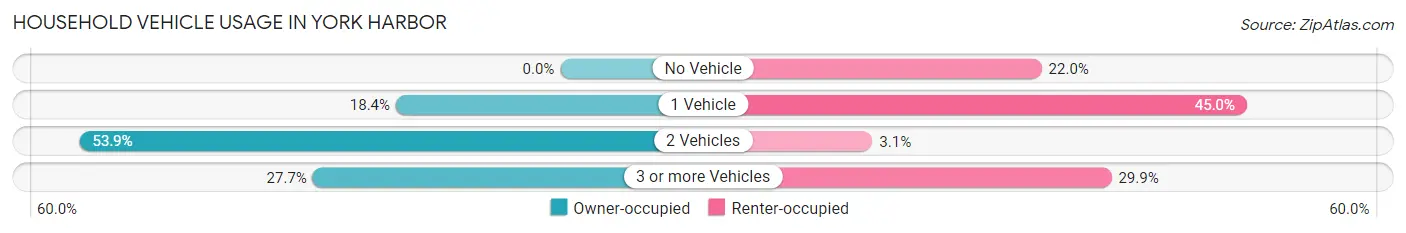
| Vehicles per Household | Owner-occupied | Renter-occupied |
| No Vehicle | 0 (0.0%) | 93 (22.0%) |
| 1 Vehicle | 160 (18.4%) | 190 (45.0%) |
| 2 Vehicles | 468 (53.9%) | 13 (3.1%) |
| 3 or more Vehicles | 241 (27.7%) | 126 (29.9%) |
| Total | 869 (100.0%) | 422 (100.0%) |
Real Estate & Mortgages in York Harbor
Real Estate and Mortgage Overview in York Harbor
| Characteristic | Without Mortgage | With Mortgage |
| Housing Units | 300 | 569 |
| Median Property Value | $523,600 | $524,200 |
| Median Household Income | $102,955 | $152 |
| Monthly Housing Costs | $780 | $110 |
| Real Estate Taxes | $4,515 | $0 |
Property Value by Mortgage Status in York Harbor
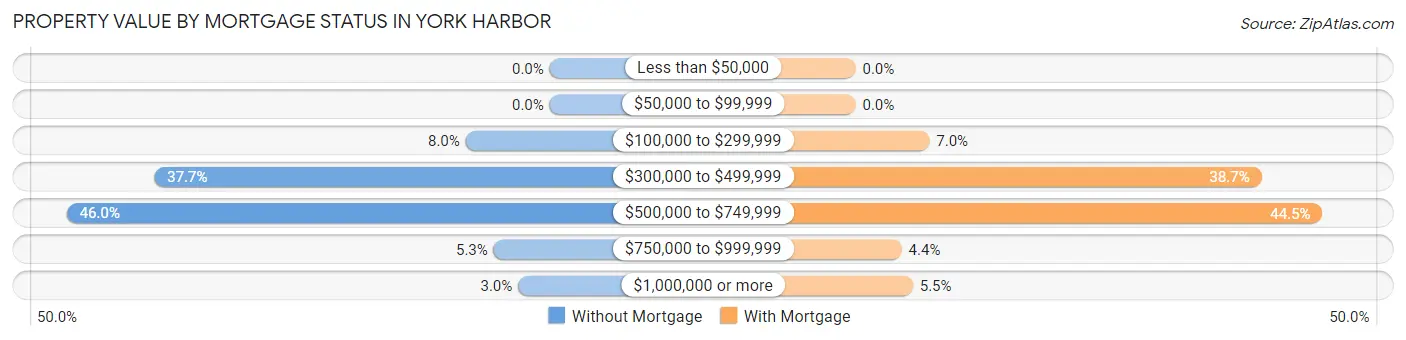
| Property Value | Without Mortgage | With Mortgage |
| Less than $50,000 | 0 (0.0%) | 0 (0.0%) |
| $50,000 to $99,999 | 0 (0.0%) | 0 (0.0%) |
| $100,000 to $299,999 | 24 (8.0%) | 40 (7.0%) |
| $300,000 to $499,999 | 113 (37.7%) | 220 (38.7%) |
| $500,000 to $749,999 | 138 (46.0%) | 253 (44.5%) |
| $750,000 to $999,999 | 16 (5.3%) | 25 (4.4%) |
| $1,000,000 or more | 9 (3.0%) | 31 (5.4%) |
| Total | 300 (100.0%) | 569 (100.0%) |
Household Income by Mortgage Status in York Harbor
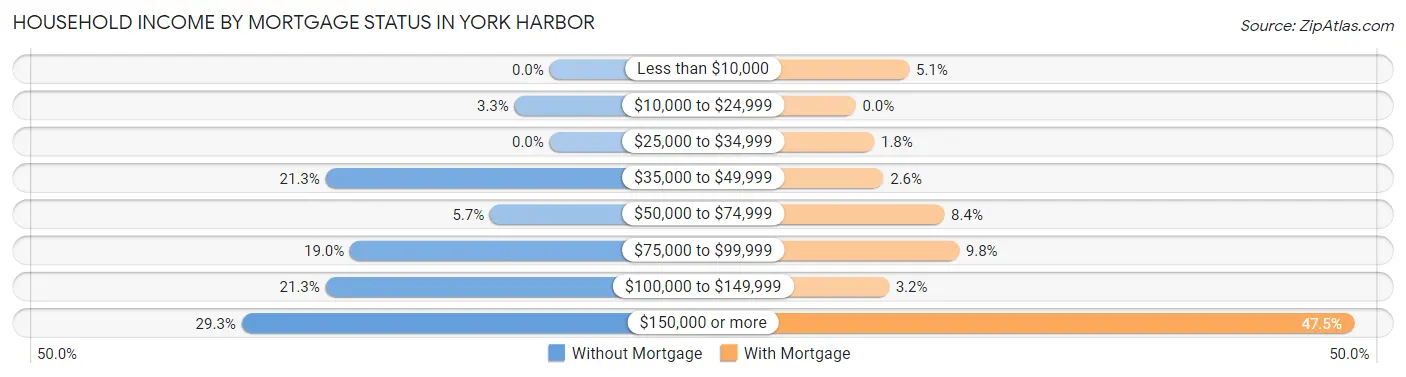
| Household Income | Without Mortgage | With Mortgage |
| Less than $10,000 | 0 (0.0%) | 29 (5.1%) |
| $10,000 to $24,999 | 10 (3.3%) | 0 (0.0%) |
| $25,000 to $34,999 | 0 (0.0%) | 10 (1.8%) |
| $35,000 to $49,999 | 64 (21.3%) | 15 (2.6%) |
| $50,000 to $74,999 | 17 (5.7%) | 48 (8.4%) |
| $75,000 to $99,999 | 57 (19.0%) | 56 (9.8%) |
| $100,000 to $149,999 | 64 (21.3%) | 18 (3.2%) |
| $150,000 or more | 88 (29.3%) | 270 (47.4%) |
| Total | 300 (100.0%) | 569 (100.0%) |
Property Value to Household Income Ratio in York Harbor
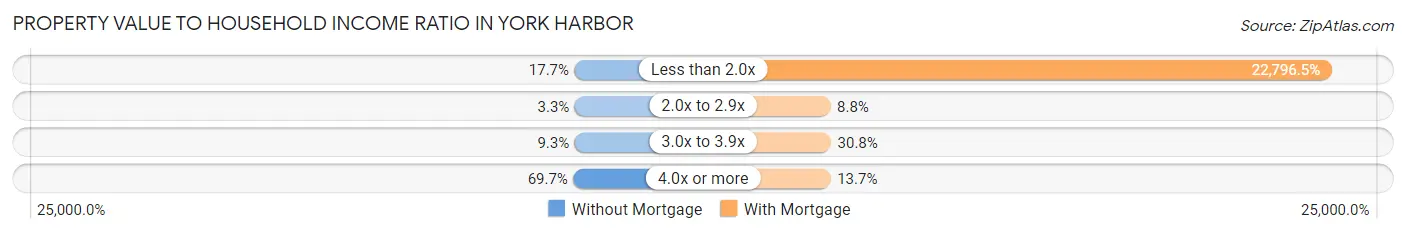
| Value-to-Income Ratio | Without Mortgage | With Mortgage |
| Less than 2.0x | 53 (17.7%) | 129,712 (22,796.5%) |
| 2.0x to 2.9x | 10 (3.3%) | 50 (8.8%) |
| 3.0x to 3.9x | 28 (9.3%) | 175 (30.8%) |
| 4.0x or more | 209 (69.7%) | 78 (13.7%) |
| Total | 300 (100.0%) | 569 (100.0%) |
Real Estate Taxes by Mortgage Status in York Harbor
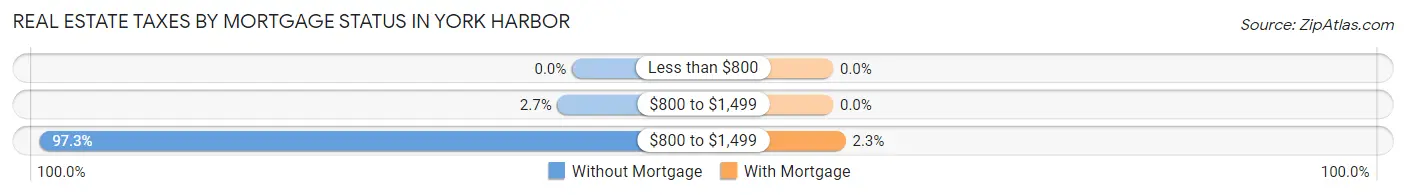
| Property Taxes | Without Mortgage | With Mortgage |
| Less than $800 | 0 (0.0%) | 0 (0.0%) |
| $800 to $1,499 | 8 (2.7%) | 0 (0.0%) |
| $800 to $1,499 | 292 (97.3%) | 13 (2.3%) |
| Total | 300 (100.0%) | 569 (100.0%) |
Health & Disability in York Harbor
Health Insurance Coverage by Age in York Harbor
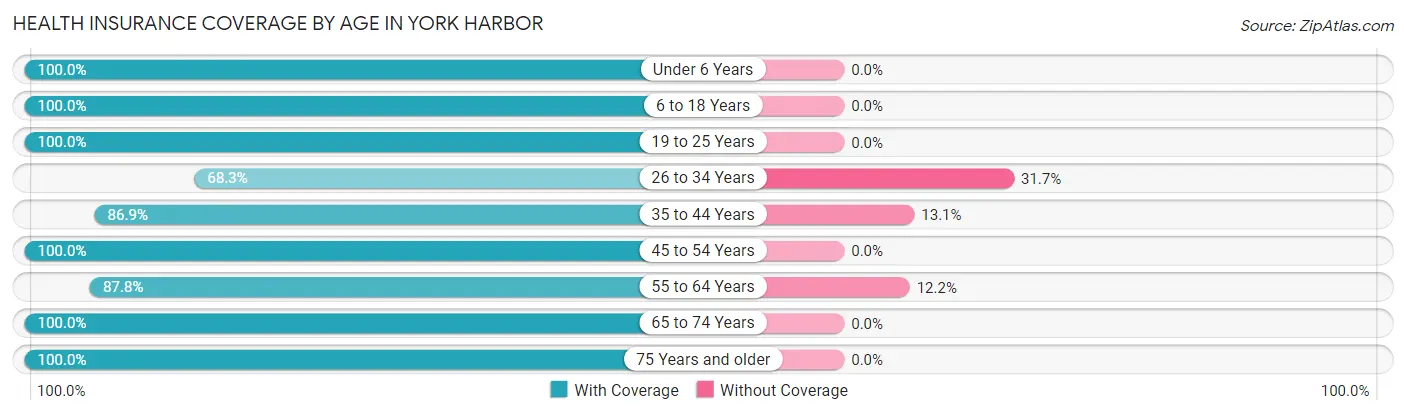
| Age Bracket | With Coverage | Without Coverage |
| Under 6 Years | 170 (100.0%) | 0 (0.0%) |
| 6 to 18 Years | 651 (100.0%) | 0 (0.0%) |
| 19 to 25 Years | 328 (100.0%) | 0 (0.0%) |
| 26 to 34 Years | 272 (68.3%) | 126 (31.7%) |
| 35 to 44 Years | 439 (86.9%) | 66 (13.1%) |
| 45 to 54 Years | 279 (100.0%) | 0 (0.0%) |
| 55 to 64 Years | 367 (87.8%) | 51 (12.2%) |
| 65 to 74 Years | 477 (100.0%) | 0 (0.0%) |
| 75 Years and older | 401 (100.0%) | 0 (0.0%) |
| Total | 3,384 (93.3%) | 243 (6.7%) |
Health Insurance Coverage by Citizenship Status in York Harbor
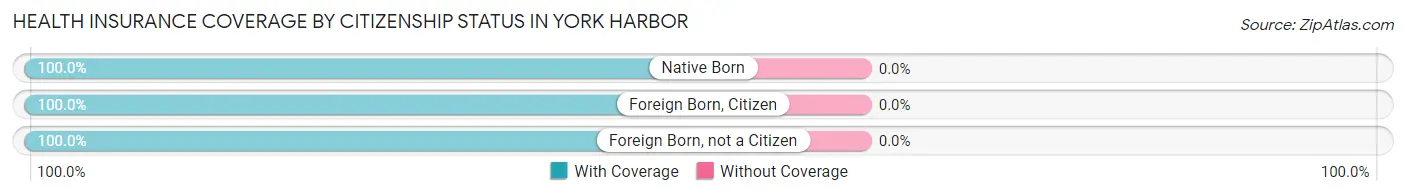
| Citizenship Status | With Coverage | Without Coverage |
| Native Born | 170 (100.0%) | 0 (0.0%) |
| Foreign Born, Citizen | 651 (100.0%) | 0 (0.0%) |
| Foreign Born, not a Citizen | 328 (100.0%) | 0 (0.0%) |
Health Insurance Coverage by Household Income in York Harbor
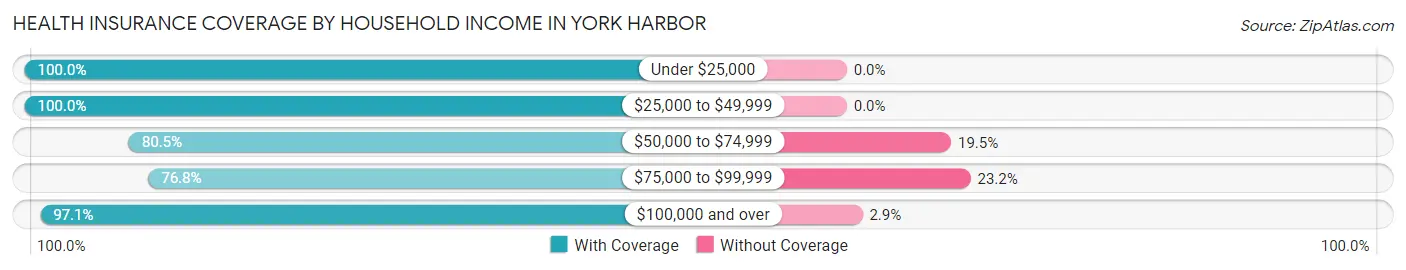
| Household Income | With Coverage | Without Coverage |
| Under $25,000 | 148 (100.0%) | 0 (0.0%) |
| $25,000 to $49,999 | 348 (100.0%) | 0 (0.0%) |
| $50,000 to $74,999 | 519 (80.5%) | 126 (19.5%) |
| $75,000 to $99,999 | 169 (76.8%) | 51 (23.2%) |
| $100,000 and over | 2,187 (97.1%) | 66 (2.9%) |
Public vs Private Health Insurance Coverage by Age in York Harbor
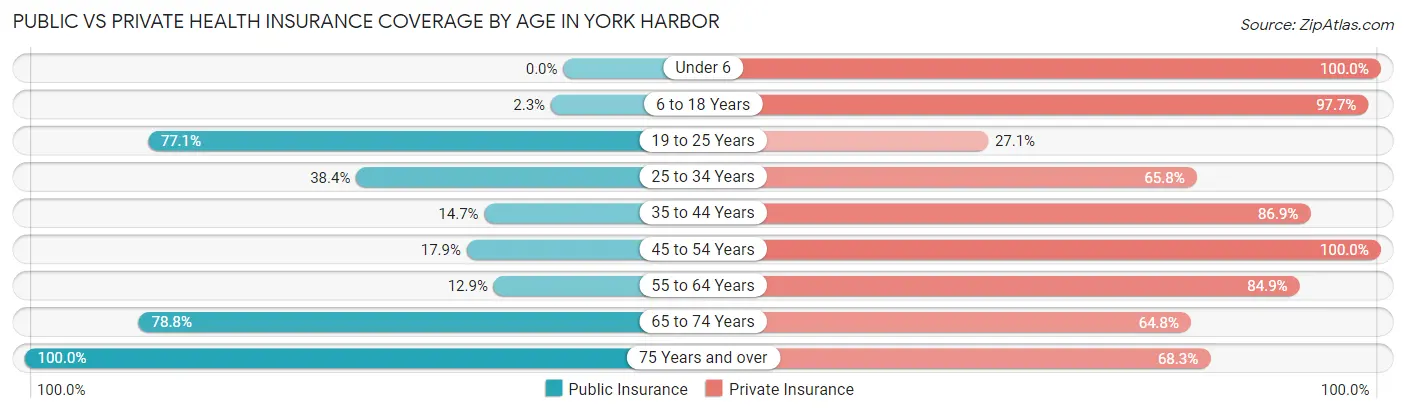
| Age Bracket | Public Insurance | Private Insurance |
| Under 6 | 0 (0.0%) | 170 (100.0%) |
| 6 to 18 Years | 15 (2.3%) | 636 (97.7%) |
| 19 to 25 Years | 253 (77.1%) | 89 (27.1%) |
| 25 to 34 Years | 153 (38.4%) | 262 (65.8%) |
| 35 to 44 Years | 74 (14.6%) | 439 (86.9%) |
| 45 to 54 Years | 50 (17.9%) | 279 (100.0%) |
| 55 to 64 Years | 54 (12.9%) | 355 (84.9%) |
| 65 to 74 Years | 376 (78.8%) | 309 (64.8%) |
| 75 Years and over | 401 (100.0%) | 274 (68.3%) |
| Total | 1,376 (37.9%) | 2,813 (77.6%) |
Disability Status by Sex by Age in York Harbor
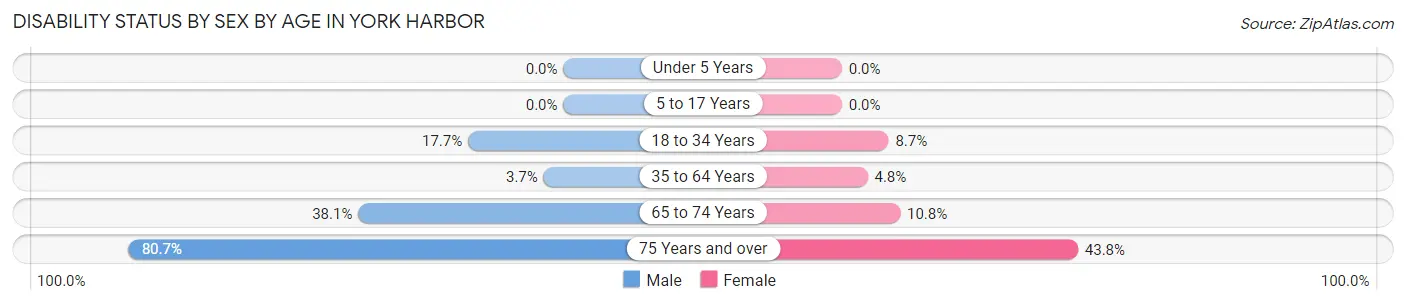
| Age Bracket | Male | Female |
| Under 5 Years | 0 (0.0%) | 0 (0.0%) |
| 5 to 17 Years | 0 (0.0%) | 0 (0.0%) |
| 18 to 34 Years | 26 (17.7%) | 51 (8.7%) |
| 35 to 64 Years | 21 (3.7%) | 30 (4.8%) |
| 65 to 74 Years | 83 (38.1%) | 28 (10.8%) |
| 75 Years and over | 121 (80.7%) | 110 (43.8%) |
Disability Class by Sex by Age in York Harbor
Disability Class: Hearing Difficulty
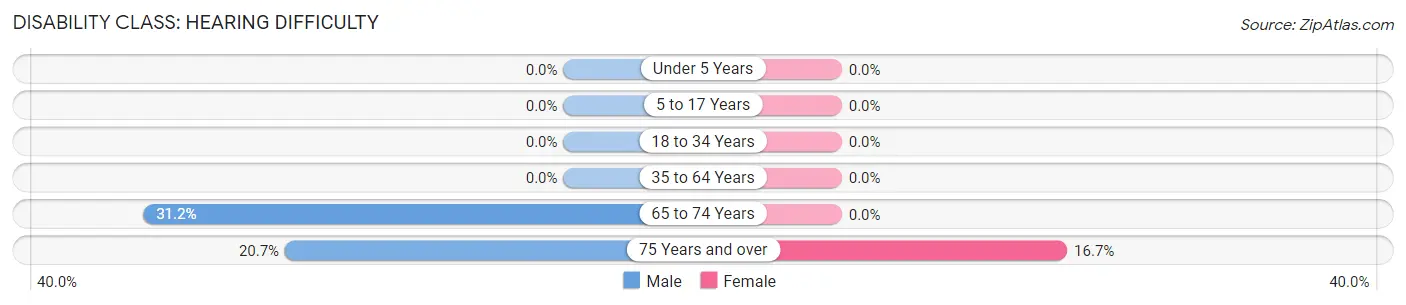
| Age Bracket | Male | Female |
| Under 5 Years | 0 (0.0%) | 0 (0.0%) |
| 5 to 17 Years | 0 (0.0%) | 0 (0.0%) |
| 18 to 34 Years | 0 (0.0%) | 0 (0.0%) |
| 35 to 64 Years | 0 (0.0%) | 0 (0.0%) |
| 65 to 74 Years | 68 (31.2%) | 0 (0.0%) |
| 75 Years and over | 31 (20.7%) | 42 (16.7%) |
Disability Class: Vision Difficulty
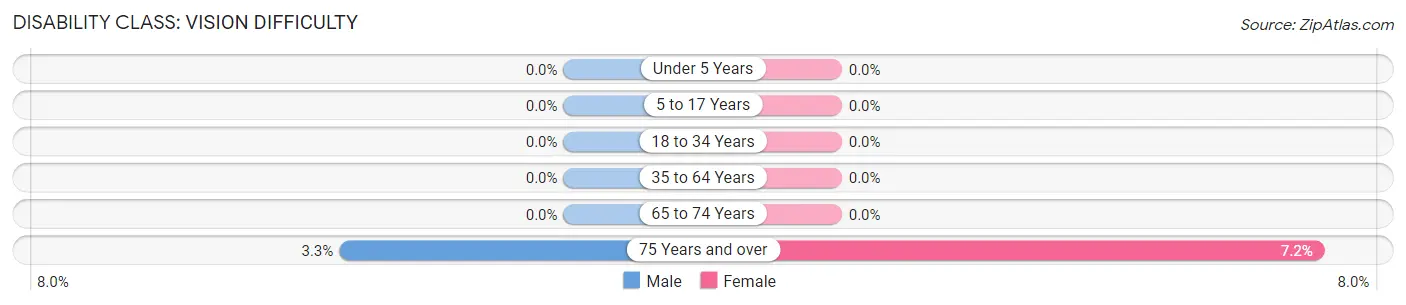
| Age Bracket | Male | Female |
| Under 5 Years | 0 (0.0%) | 0 (0.0%) |
| 5 to 17 Years | 0 (0.0%) | 0 (0.0%) |
| 18 to 34 Years | 0 (0.0%) | 0 (0.0%) |
| 35 to 64 Years | 0 (0.0%) | 0 (0.0%) |
| 65 to 74 Years | 0 (0.0%) | 0 (0.0%) |
| 75 Years and over | 5 (3.3%) | 18 (7.2%) |
Disability Class: Cognitive Difficulty
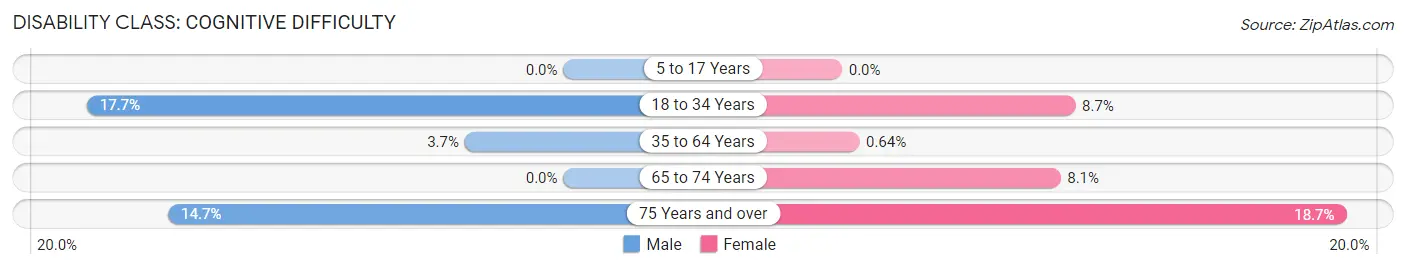
| Age Bracket | Male | Female |
| 5 to 17 Years | 0 (0.0%) | 0 (0.0%) |
| 18 to 34 Years | 26 (17.7%) | 51 (8.7%) |
| 35 to 64 Years | 21 (3.7%) | 4 (0.6%) |
| 65 to 74 Years | 0 (0.0%) | 21 (8.1%) |
| 75 Years and over | 22 (14.7%) | 47 (18.7%) |
Disability Class: Ambulatory Difficulty
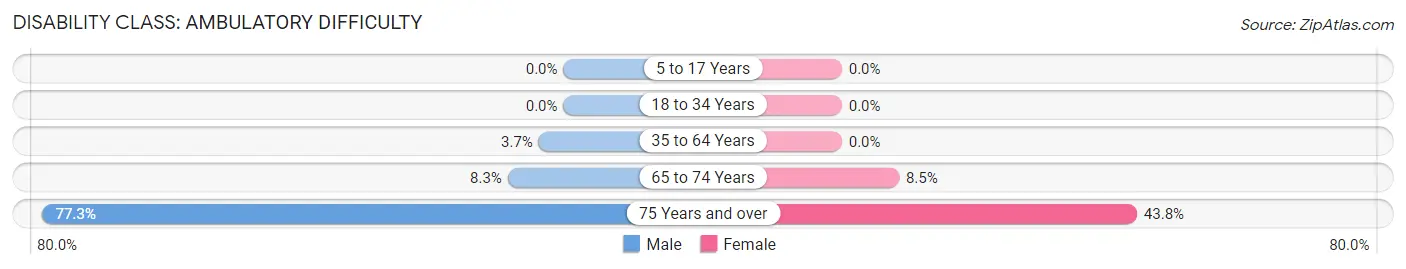
| Age Bracket | Male | Female |
| 5 to 17 Years | 0 (0.0%) | 0 (0.0%) |
| 18 to 34 Years | 0 (0.0%) | 0 (0.0%) |
| 35 to 64 Years | 21 (3.7%) | 0 (0.0%) |
| 65 to 74 Years | 18 (8.3%) | 22 (8.5%) |
| 75 Years and over | 116 (77.3%) | 110 (43.8%) |
Disability Class: Self-Care Difficulty
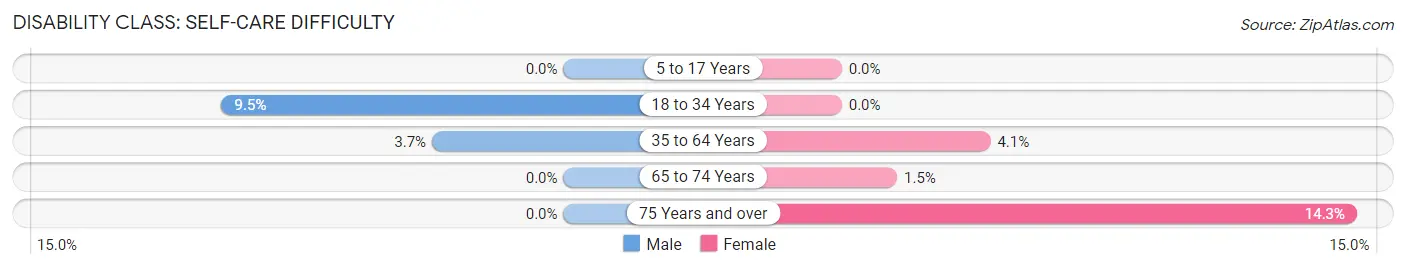
| Age Bracket | Male | Female |
| 5 to 17 Years | 0 (0.0%) | 0 (0.0%) |
| 18 to 34 Years | 14 (9.5%) | 0 (0.0%) |
| 35 to 64 Years | 21 (3.7%) | 26 (4.1%) |
| 65 to 74 Years | 0 (0.0%) | 4 (1.5%) |
| 75 Years and over | 0 (0.0%) | 36 (14.3%) |
Technology Access in York Harbor
Computing Device Access in York Harbor
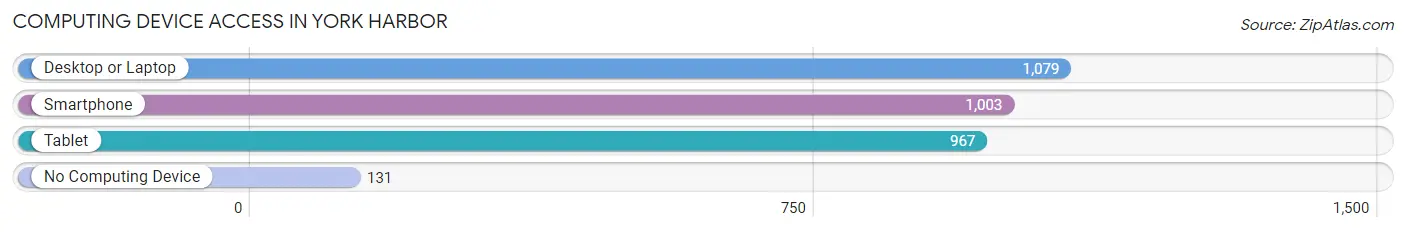
| Device Type | # Households | % Households |
| Desktop or Laptop | 1,079 | 83.6% |
| Smartphone | 1,003 | 77.7% |
| Tablet | 967 | 74.9% |
| No Computing Device | 131 | 10.2% |
| Total | 1,291 | 100.0% |
Internet Access in York Harbor
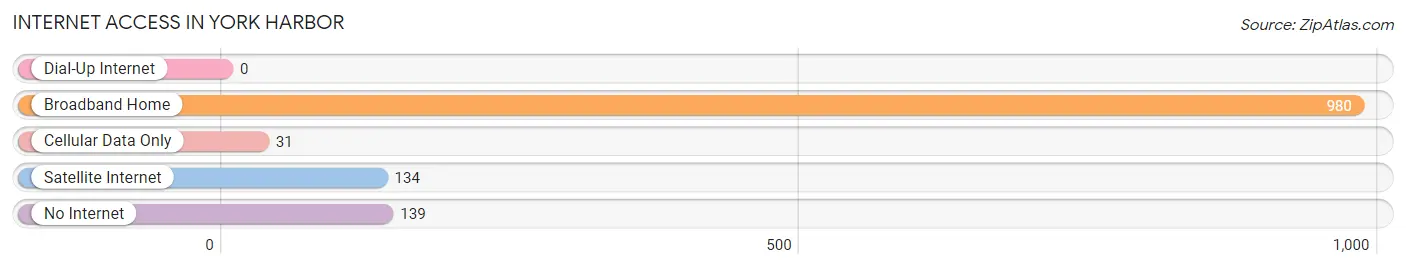
| Internet Type | # Households | % Households |
| Dial-Up Internet | 0 | 0.0% |
| Broadband Home | 980 | 75.9% |
| Cellular Data Only | 31 | 2.4% |
| Satellite Internet | 134 | 10.4% |
| No Internet | 139 | 10.8% |
| Total | 1,291 | 100.0% |
York Harbor Summary
History
The history of Portland Harbor, Maine dates back to the 1600s when the area was first explored by Europeans. The first settlers arrived in 1632 and the area was incorporated as a town in 1658. The harbor was an important port for the shipping of lumber, fish, and other goods. During the Revolutionary War, the harbor was used by the Continental Navy and was the site of a major battle in 1775.
In the 19th century, Portland Harbor became an important port for the shipping of coal, oil, and other goods. The harbor was also used as a base for the U.S. Navy during the Civil War. In the late 19th century, the harbor was the site of a major shipbuilding industry.
In the 20th century, Portland Harbor continued to be an important port for the shipping of goods. The harbor was also used as a base for the U.S. Navy during World War II. After the war, the harbor was used for commercial shipping and recreational activities.
Geography
Portland Harbor is located in Cumberland County, Maine, on the eastern side of Casco Bay. The harbor is approximately 4 miles long and 2 miles wide. The harbor is surrounded by the cities of Portland, South Portland, and Falmouth. The harbor is connected to the Atlantic Ocean by the Fore River.
The harbor is home to several islands, including Peaks Island, Great Diamond Island, and Long Island. The harbor is also home to several lighthouses, including the Portland Head Light, the Spring Point Ledge Light, and the Ram Island Ledge Light.
Economy
The economy of Portland Harbor is largely based on shipping and tourism. The harbor is home to several commercial shipping companies, including the Portland-Montreal Steamship Company and the Portland-Boston Steamship Company. The harbor is also home to several recreational marinas, including the Portland Yacht Club and the Portland Marina.
The harbor is also home to several tourist attractions, including the Portland Observatory, the Portland Head Light, and the Maine Narrow Gauge Railroad. The harbor is also home to several restaurants, bars, and shops.
Demographics
As of the 2010 census, the population of Portland Harbor was 8,817. The median age was 38.7 years, and the median household income was $50,817. The racial makeup of the harbor was 87.3% White, 5.2% African American, 0.7% Native American, 2.2% Asian, 0.1% Pacific Islander, and 4.5% from other races.
Conclusion
Portland Harbor, Maine is a historic port city with a rich history and a vibrant economy. The harbor is home to several commercial shipping companies, recreational marinas, and tourist attractions. The harbor is also home to a diverse population with a median age of 38.7 years and a median household income of $50,817. Portland Harbor is an important part of the state of Maine and continues to be an important port for the shipping of goods and recreational activities.
Common Questions
What is Per Capita Income in York Harbor?
Per Capita income in York Harbor is $43,862.
What is the Median Family Income in York Harbor?
Median Family Income in York Harbor is $126,023.
What is the Median Household income in York Harbor?
Median Household Income in York Harbor is $89,647.
What is Income or Wage Gap in York Harbor?
Income or Wage Gap in York Harbor is 78.9%.
Women in York Harbor earn 21.1 cents for every dollar earned by a man.
What is Inequality or Gini Index in York Harbor?
Inequality or Gini Index in York Harbor is 0.46.
What is the Total Population of York Harbor?
Total Population of York Harbor is 3,640.
What is the Total Male Population of York Harbor?
Total Male Population of York Harbor is 1,409.
What is the Total Female Population of York Harbor?
Total Female Population of York Harbor is 2,231.
What is the Ratio of Males per 100 Females in York Harbor?
There are 63.16 Males per 100 Females in York Harbor.
What is the Ratio of Females per 100 Males in York Harbor?
There are 158.34 Females per 100 Males in York Harbor.
What is the Median Population Age in York Harbor?
Median Population Age in York Harbor is 40.7 Years.
What is the Average Family Size in York Harbor
Average Family Size in York Harbor is 3.6 People.
What is the Average Household Size in York Harbor
Average Household Size in York Harbor is 2.8 People.
How Large is the Labor Force in York Harbor?
There are 1,504 People in the Labor Forcein in York Harbor.
What is the Percentage of People in the Labor Force in York Harbor?
52.0% of People are in the Labor Force in York Harbor.
What is the Unemployment Rate in York Harbor?
Unemployment Rate in York Harbor is 0.7%.