Bridgton, ME Map & Demographics
Bridgton Map
Bridgton Overview
$26,952
PER CAPITA INCOME
$66,357
AVG FAMILY INCOME
$56,475
AVG HOUSEHOLD INCOME
67.8%
WAGE / INCOME GAP [ % ]
32.2¢/ $1
WAGE / INCOME GAP [ $ ]
0.34
INEQUALITY / GINI INDEX
1,514
TOTAL POPULATION
800
MALE POPULATION
714
FEMALE POPULATION
112.04
MALES / 100 FEMALES
89.25
FEMALES / 100 MALES
47.2
MEDIAN AGE
2.7
AVG FAMILY SIZE
2.3
AVG HOUSEHOLD SIZE
642
LABOR FORCE [ PEOPLE ]
47.9%
PERCENT IN LABOR FORCE
8.4%
UNEMPLOYMENT RATE
Bridgton Zip Codes
Bridgton Area Codes
Income in Bridgton
Income Overview in Bridgton
Per Capita Income in Bridgton is $26,952, while median incomes of families and households are $66,357 and $56,475 respectively.
| Characteristic | Number | Measure |
| Per Capita Income | 1,514 | $26,952 |
| Median Family Income | 370 | $66,357 |
| Mean Family Income | 370 | $70,886 |
| Median Household Income | 616 | $56,475 |
| Mean Household Income | 616 | $63,212 |
| Income Deficit | 370 | $0 |
| Wage / Income Gap (%) | 1,514 | 67.84% |
| Wage / Income Gap ($) | 1,514 | 32.16¢ per $1 |
| Gini / Inequality Index | 1,514 | 0.34 |
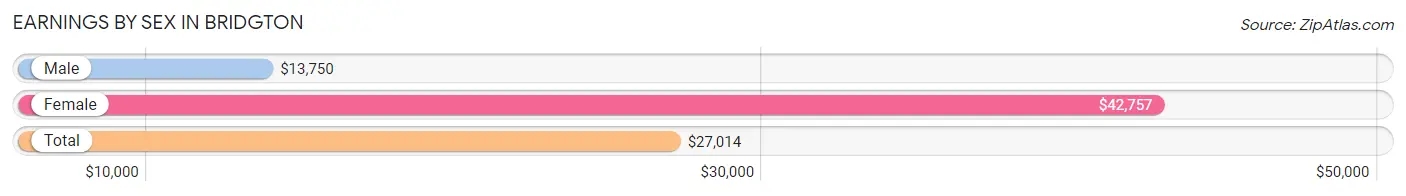
Earnings by Sex in Bridgton
Average Earnings in Bridgton are $27,014, $13,750 for men and $42,757 for women, a difference of 67.8%.
| Sex | Number | Average Earnings |
| Male | 501 (61.6%) | $13,750 |
| Female | 313 (38.5%) | $42,757 |
| Total | 814 (100.0%) | $27,014 |
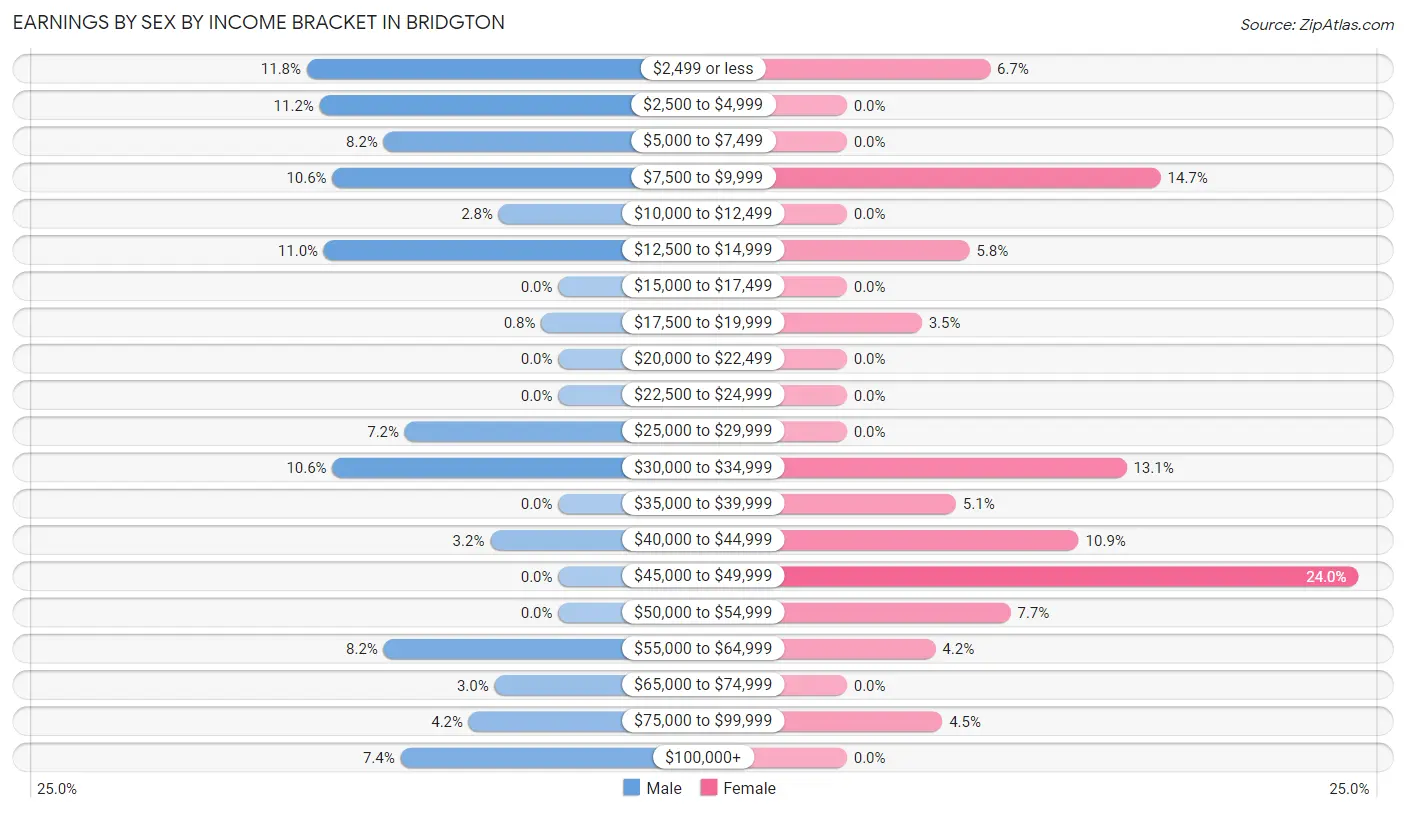
Earnings by Sex by Income Bracket in Bridgton
The most common earnings brackets in Bridgton are $2,499 or less for men (59 | 11.8%) and $45,000 to $49,999 for women (75 | 24.0%).
| Income | Male | Female |
| $2,499 or less | 59 (11.8%) | 21 (6.7%) |
| $2,500 to $4,999 | 56 (11.2%) | 0 (0.0%) |
| $5,000 to $7,499 | 41 (8.2%) | 0 (0.0%) |
| $7,500 to $9,999 | 53 (10.6%) | 46 (14.7%) |
| $10,000 to $12,499 | 14 (2.8%) | 0 (0.0%) |
| $12,500 to $14,999 | 55 (11.0%) | 18 (5.8%) |
| $15,000 to $17,499 | 0 (0.0%) | 0 (0.0%) |
| $17,500 to $19,999 | 4 (0.8%) | 11 (3.5%) |
| $20,000 to $22,499 | 0 (0.0%) | 0 (0.0%) |
| $22,500 to $24,999 | 0 (0.0%) | 0 (0.0%) |
| $25,000 to $29,999 | 36 (7.2%) | 0 (0.0%) |
| $30,000 to $34,999 | 53 (10.6%) | 41 (13.1%) |
| $35,000 to $39,999 | 0 (0.0%) | 16 (5.1%) |
| $40,000 to $44,999 | 16 (3.2%) | 34 (10.9%) |
| $45,000 to $49,999 | 0 (0.0%) | 75 (24.0%) |
| $50,000 to $54,999 | 0 (0.0%) | 24 (7.7%) |
| $55,000 to $64,999 | 41 (8.2%) | 13 (4.2%) |
| $65,000 to $74,999 | 15 (3.0%) | 0 (0.0%) |
| $75,000 to $99,999 | 21 (4.2%) | 14 (4.5%) |
| $100,000+ | 37 (7.4%) | 0 (0.0%) |
| Total | 501 (100.0%) | 313 (100.0%) |
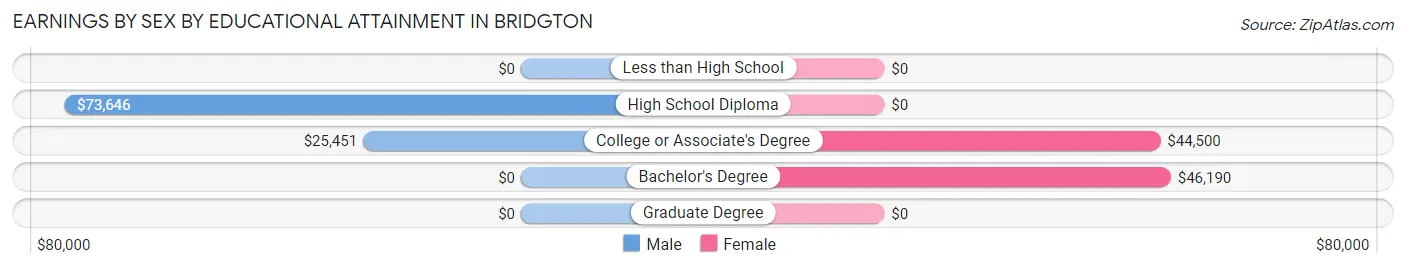
Earnings by Sex by Educational Attainment in Bridgton
Average earnings in Bridgton are $32,273 for men and $44,743 for women, a difference of 27.9%. Men with an educational attainment of high school diploma enjoy the highest average annual earnings of $73,646, while those with college or associate's degree education earn the least with $25,451. Women with an educational attainment of bachelor's degree earn the most with the average annual earnings of $46,190, while those with college or associate's degree education have the smallest earnings of $44,500.
| Educational Attainment | Male Income | Female Income |
| Less than High School | - | - |
| High School Diploma | $73,646 | $0 |
| College or Associate's Degree | $25,451 | $44,500 |
| Bachelor's Degree | - | - |
| Graduate Degree | - | - |
| Total | $32,273 | $44,743 |
Family Income in Bridgton
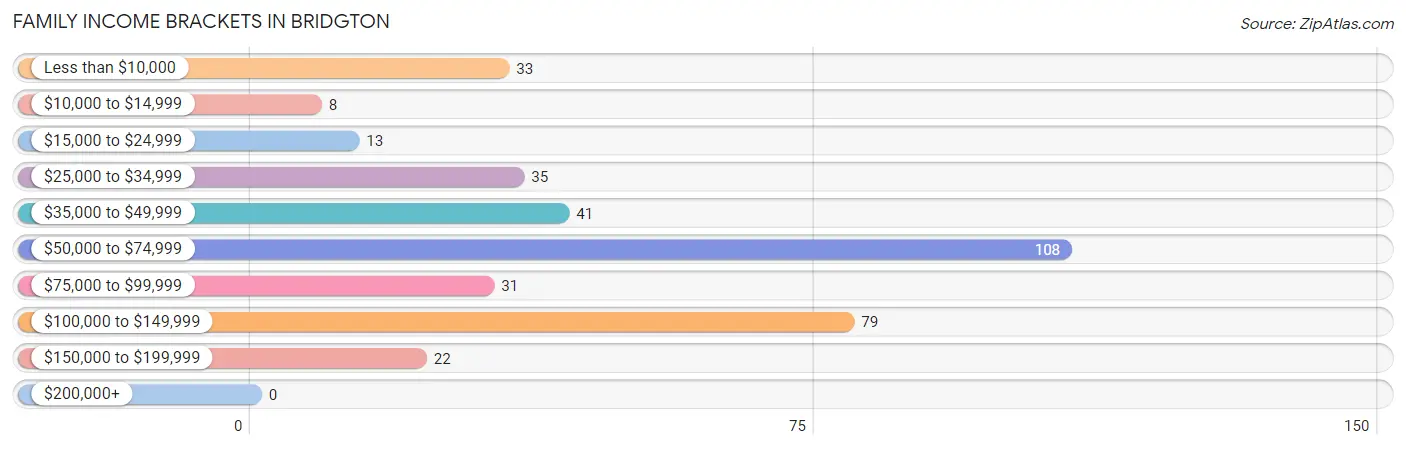
Family Income Brackets in Bridgton
According to the Bridgton family income data, there are 108 families falling into the $50,000 to $74,999 income range, which is the most common income bracket and makes up 29.2% of all families.
| Income Bracket | # Families | % Families |
| Less than $10,000 | 33 | 8.9% |
| $10,000 to $14,999 | 8 | 2.2% |
| $15,000 to $24,999 | 13 | 3.5% |
| $25,000 to $34,999 | 35 | 9.5% |
| $35,000 to $49,999 | 41 | 11.1% |
| $50,000 to $74,999 | 108 | 29.2% |
| $75,000 to $99,999 | 31 | 8.4% |
| $100,000 to $149,999 | 79 | 21.4% |
| $150,000 to $199,999 | 22 | 5.9% |
| $200,000+ | 0 | 0.0% |
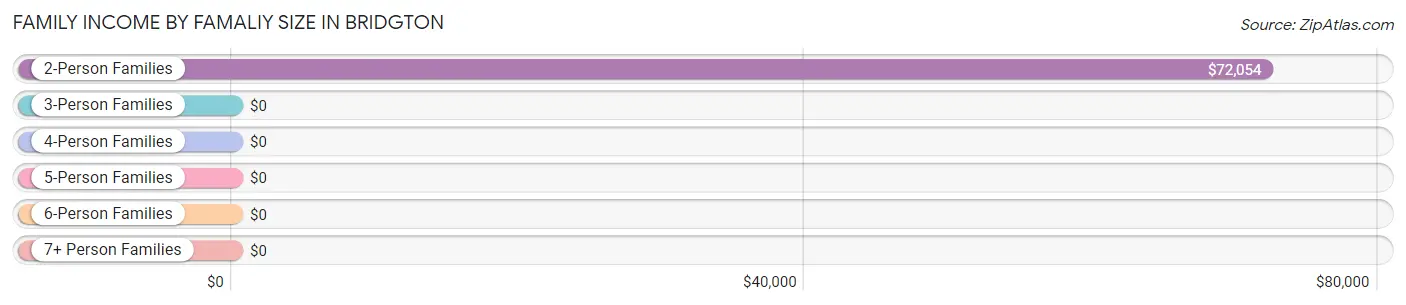
Family Income by Famaliy Size in Bridgton
2-person families (217 | 58.7%) account for the highest median family income in Bridgton with $72,054 per family, while 2-person families (217 | 58.7%) have the highest median income of $36,027 per family member.
| Income Bracket | # Families | Median Income |
| 2-Person Families | 217 (58.7%) | $72,054 |
| 3-Person Families | 93 (25.1%) | $0 |
| 4-Person Families | 43 (11.6%) | $0 |
| 5-Person Families | 17 (4.6%) | $0 |
| 6-Person Families | 0 (0.0%) | $0 |
| 7+ Person Families | 0 (0.0%) | $0 |
| Total | 370 (100.0%) | $66,357 |
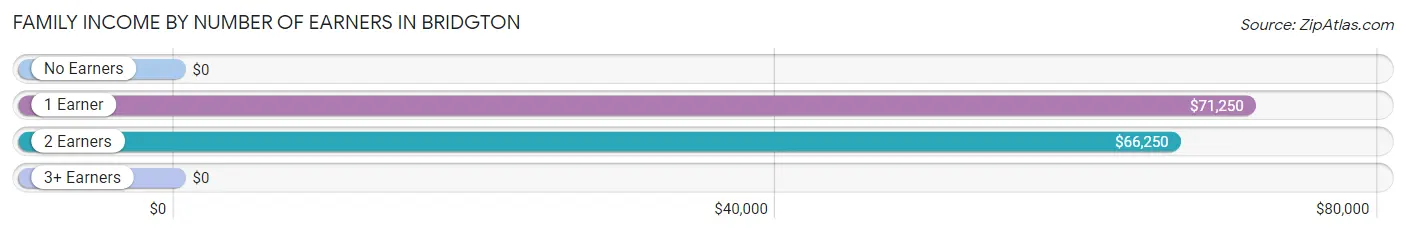
Family Income by Number of Earners in Bridgton
| Number of Earners | # Families | Median Income |
| No Earners | 86 (23.2%) | $0 |
| 1 Earner | 158 (42.7%) | $71,250 |
| 2 Earners | 101 (27.3%) | $66,250 |
| 3+ Earners | 25 (6.8%) | $0 |
| Total | 370 (100.0%) | $66,357 |
Household Income in Bridgton
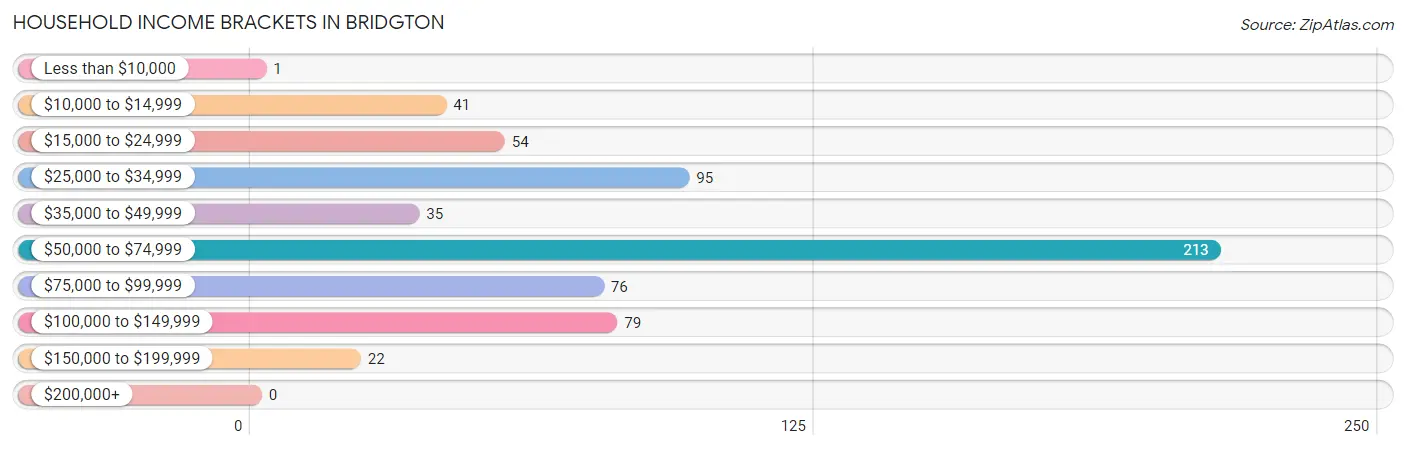
Household Income Brackets in Bridgton
With 213 households falling in the category, the $50,000 to $74,999 income range is the most frequent in Bridgton, accounting for 34.6% of all households.
| Income Bracket | # Households | % Households |
| Less than $10,000 | 1 | 0.2% |
| $10,000 to $14,999 | 41 | 6.7% |
| $15,000 to $24,999 | 54 | 8.8% |
| $25,000 to $34,999 | 95 | 15.4% |
| $35,000 to $49,999 | 35 | 5.7% |
| $50,000 to $74,999 | 213 | 34.6% |
| $75,000 to $99,999 | 76 | 12.3% |
| $100,000 to $149,999 | 79 | 12.8% |
| $150,000 to $199,999 | 22 | 3.6% |
| $200,000+ | 0 | 0.0% |
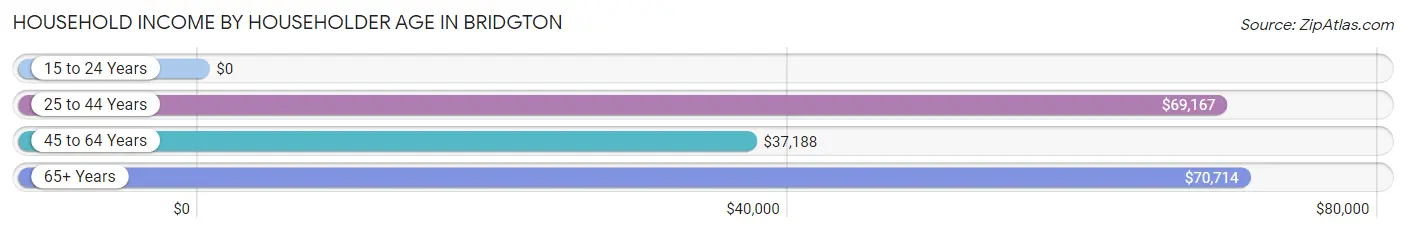
Household Income by Householder Age in Bridgton
The median household income in Bridgton is $56,475, with the highest median household income of $70,714 found in the 65+ years age bracket for the primary householder. A total of 234 households (38.0%) fall into this category.
| Income Bracket | # Households | Median Income |
| 15 to 24 Years | 0 (0.0%) | $0 |
| 25 to 44 Years | 116 (18.8%) | $69,167 |
| 45 to 64 Years | 266 (43.2%) | $37,188 |
| 65+ Years | 234 (38.0%) | $70,714 |
| Total | 616 (100.0%) | $56,475 |
Poverty in Bridgton
Income Below Poverty by Sex and Age in Bridgton
With 29.4% poverty level for males and 29.1% for females among the residents of Bridgton, 15 year old males and 12 to 14 year old females are the most vulnerable to poverty, with 19 males (100.0%) and 33 females (100.0%) in their respective age groups living below the poverty level.
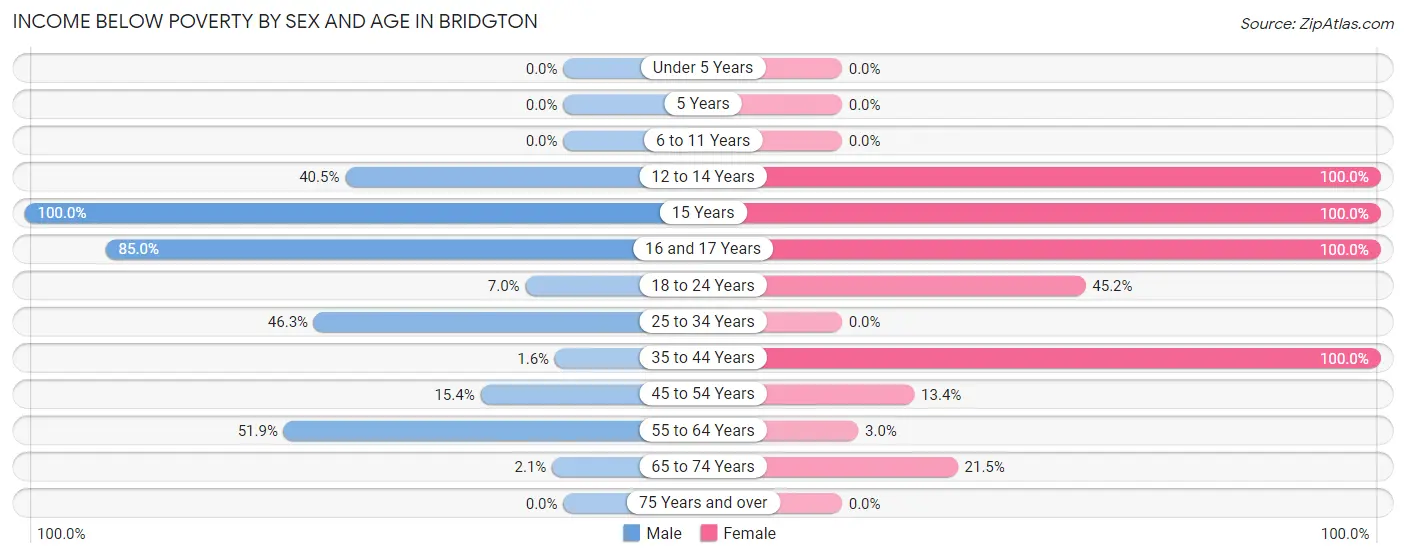
| Age Bracket | Male | Female |
| Under 5 Years | 0 (0.0%) | 0 (0.0%) |
| 5 Years | 0 (0.0%) | 0 (0.0%) |
| 6 to 11 Years | 0 (0.0%) | 0 (0.0%) |
| 12 to 14 Years | 17 (40.5%) | 33 (100.0%) |
| 15 Years | 19 (100.0%) | 18 (100.0%) |
| 16 and 17 Years | 79 (85.0%) | 17 (100.0%) |
| 18 to 24 Years | 5 (7.0%) | 33 (45.2%) |
| 25 to 34 Years | 25 (46.3%) | 0 (0.0%) |
| 35 to 44 Years | 1 (1.6%) | 43 (100.0%) |
| 45 to 54 Years | 18 (15.4%) | 18 (13.4%) |
| 55 to 64 Years | 41 (51.9%) | 3 (3.0%) |
| 65 to 74 Years | 1 (2.1%) | 43 (21.5%) |
| 75 Years and over | 0 (0.0%) | 0 (0.0%) |
| Total | 206 (29.4%) | 208 (29.1%) |
Income Above Poverty by Sex and Age in Bridgton
According to the poverty statistics in Bridgton, males aged under 5 years and females aged 6 to 11 years are the age groups that are most secure financially, with 100.0% of males and 100.0% of females in these age groups living above the poverty line.
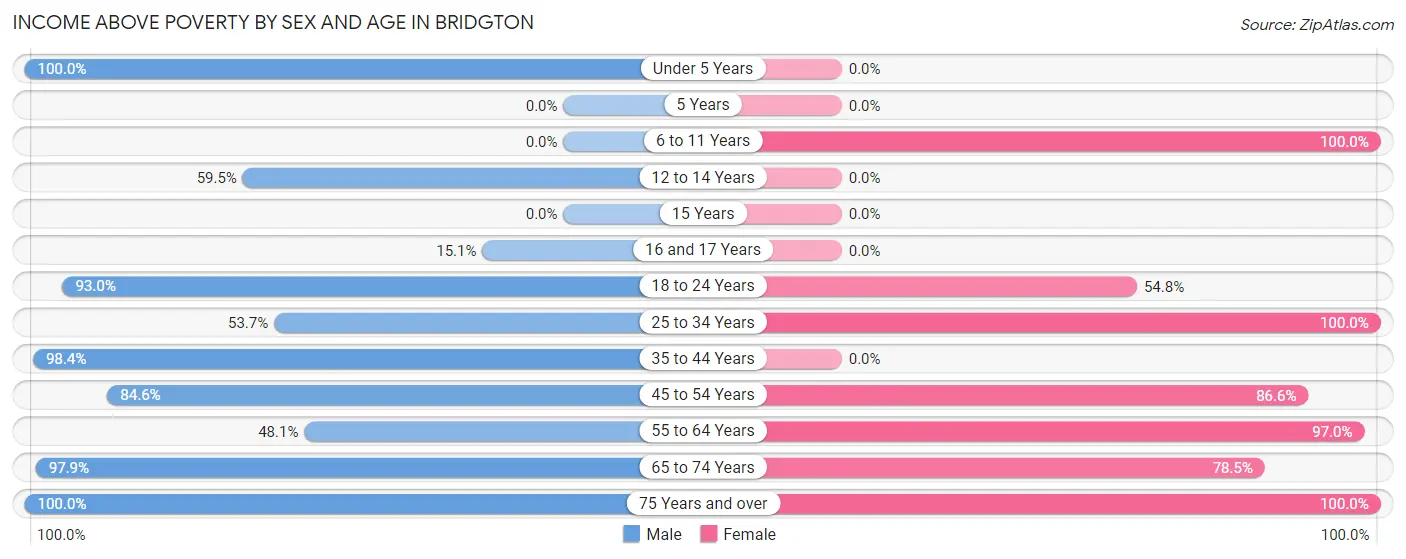
| Age Bracket | Male | Female |
| Under 5 Years | 47 (100.0%) | 0 (0.0%) |
| 5 Years | 0 (0.0%) | 0 (0.0%) |
| 6 to 11 Years | 0 (0.0%) | 12 (100.0%) |
| 12 to 14 Years | 25 (59.5%) | 0 (0.0%) |
| 15 Years | 0 (0.0%) | 0 (0.0%) |
| 16 and 17 Years | 14 (15.0%) | 0 (0.0%) |
| 18 to 24 Years | 66 (93.0%) | 40 (54.8%) |
| 25 to 34 Years | 29 (53.7%) | 54 (100.0%) |
| 35 to 44 Years | 63 (98.4%) | 0 (0.0%) |
| 45 to 54 Years | 99 (84.6%) | 116 (86.6%) |
| 55 to 64 Years | 38 (48.1%) | 96 (97.0%) |
| 65 to 74 Years | 47 (97.9%) | 157 (78.5%) |
| 75 Years and over | 66 (100.0%) | 31 (100.0%) |
| Total | 494 (70.6%) | 506 (70.9%) |
Income Below Poverty Among Married-Couple Families in Bridgton
The poverty statistics for married-couple families in Bridgton show that 12.2% or 26 of the total 213 families live below the poverty line. Families with 1 or 2 children have the highest poverty rate of 27.7%, comprising of 18 families. On the other hand, families with no children have the lowest poverty rate of 5.4%, which includes 8 families.
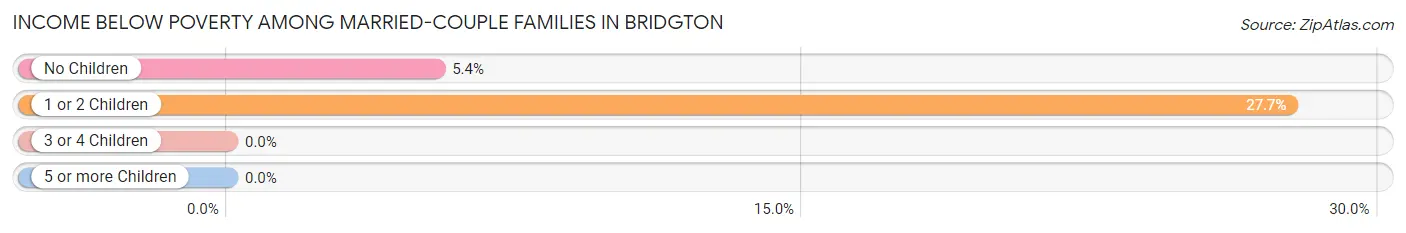
| Children | Above Poverty | Below Poverty |
| No Children | 140 (94.6%) | 8 (5.4%) |
| 1 or 2 Children | 47 (72.3%) | 18 (27.7%) |
| 3 or 4 Children | 0 (0.0%) | 0 (0.0%) |
| 5 or more Children | 0 (0.0%) | 0 (0.0%) |
| Total | 187 (87.8%) | 26 (12.2%) |
Income Below Poverty Among Single-Parent Households in Bridgton
According to the poverty data in Bridgton, 68.8% or 33 single-father households and 15.6% or 17 single-mother households are living below the poverty line. Among single-father households, those with 1 or 2 children have the highest poverty rate, with 33 households (100.0%) experiencing poverty. Likewise, among single-mother households, those with 3 or 4 children have the highest poverty rate, with 17 households (100.0%) falling below the poverty line.
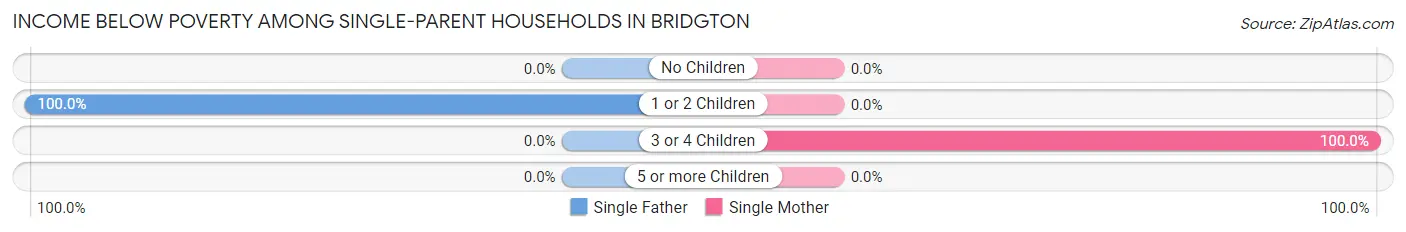
| Children | Single Father | Single Mother |
| No Children | 0 (0.0%) | 0 (0.0%) |
| 1 or 2 Children | 33 (100.0%) | 0 (0.0%) |
| 3 or 4 Children | 0 (0.0%) | 17 (100.0%) |
| 5 or more Children | 0 (0.0%) | 0 (0.0%) |
| Total | 33 (68.8%) | 17 (15.6%) |
Income Below Poverty Among Married-Couple vs Single-Parent Households in Bridgton
The poverty data for Bridgton shows that 26 of the married-couple family households (12.2%) and 50 of the single-parent households (31.9%) are living below the poverty level. Within the married-couple family households, those with 1 or 2 children have the highest poverty rate, with 18 households (27.7%) falling below the poverty line. Among the single-parent households, those with 3 or 4 children have the highest poverty rate, with 17 household (100.0%) living below poverty.
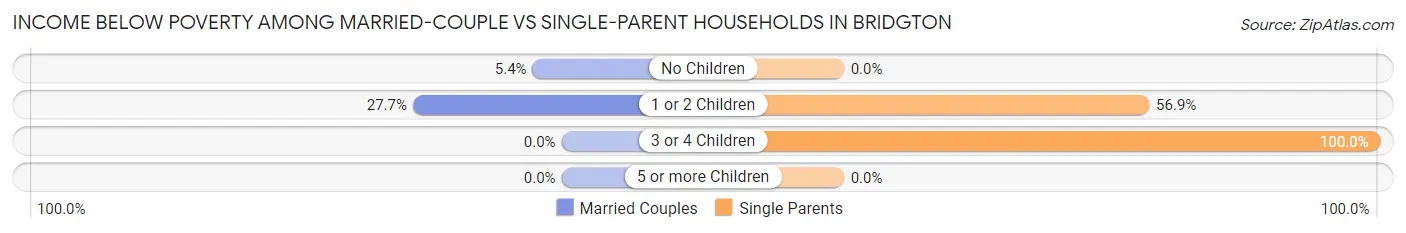
| Children | Married-Couple Families | Single-Parent Households |
| No Children | 8 (5.4%) | 0 (0.0%) |
| 1 or 2 Children | 18 (27.7%) | 33 (56.9%) |
| 3 or 4 Children | 0 (0.0%) | 17 (100.0%) |
| 5 or more Children | 0 (0.0%) | 0 (0.0%) |
| Total | 26 (12.2%) | 50 (31.9%) |
Race in Bridgton
The most populous races in Bridgton are White / Caucasian (1,389 | 91.7%), Two or more Races (105 | 6.9%), and Black / African American (14 | 0.9%).
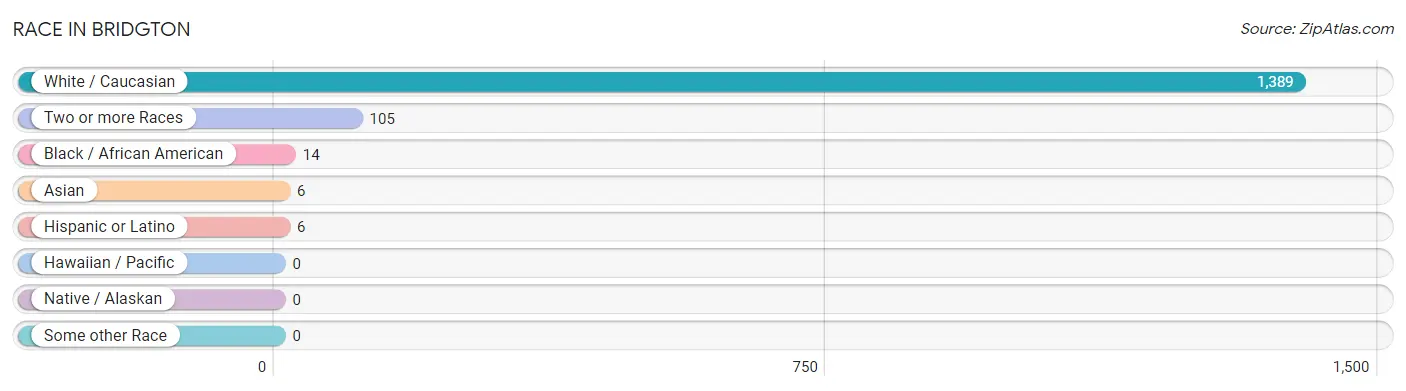
| Race | # Population | % Population |
| Asian | 6 | 0.4% |
| Black / African American | 14 | 0.9% |
| Hawaiian / Pacific | 0 | 0.0% |
| Hispanic or Latino | 6 | 0.4% |
| Native / Alaskan | 0 | 0.0% |
| White / Caucasian | 1,389 | 91.7% |
| Two or more Races | 105 | 6.9% |
| Some other Race | 0 | 0.0% |
| Total | 1,514 | 100.0% |
Ancestry in Bridgton
The most populous ancestries reported in Bridgton are English (274 | 18.1%), Irish (205 | 13.5%), German (129 | 8.5%), French (119 | 7.9%), and American (112 | 7.4%), together accounting for 55.4% of all Bridgton residents.
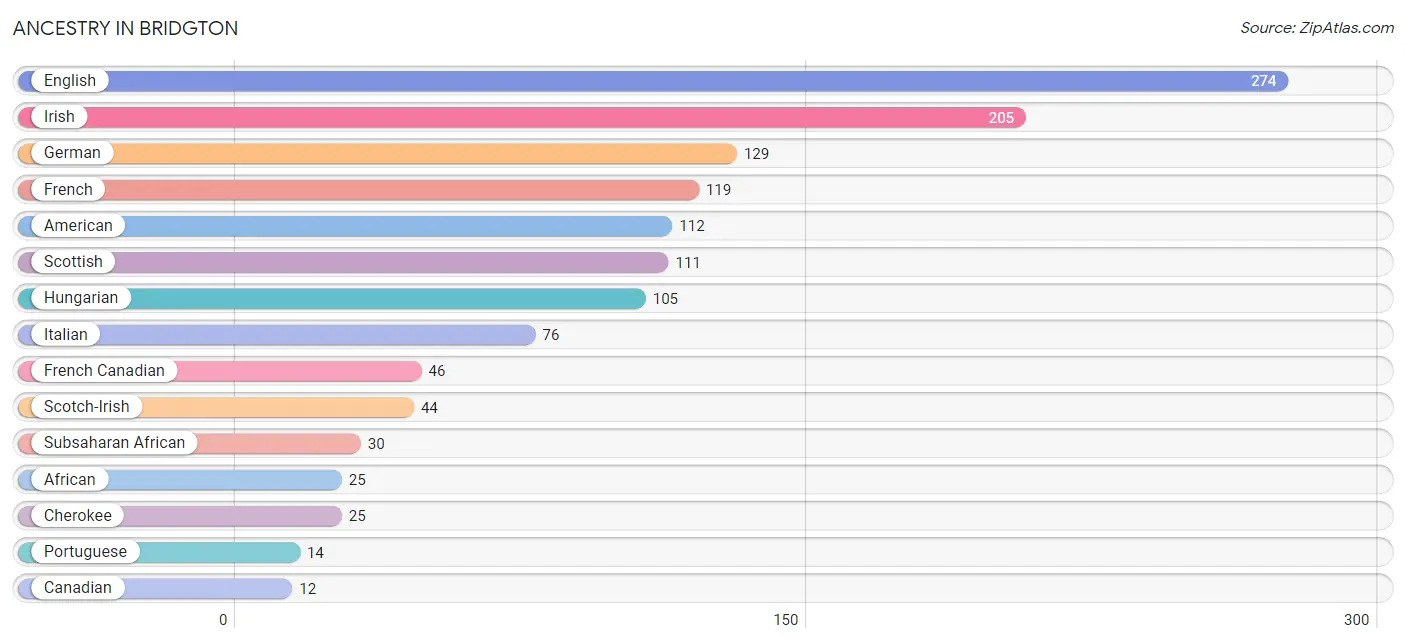
| Ancestry | # Population | % Population |
| African | 25 | 1.7% |
| American | 112 | 7.4% |
| Burmese | 6 | 0.4% |
| Canadian | 12 | 0.8% |
| Cherokee | 25 | 1.7% |
| Chippewa | 6 | 0.4% |
| Eastern European | 12 | 0.8% |
| English | 274 | 18.1% |
| European | 1 | 0.1% |
| French | 119 | 7.9% |
| French Canadian | 46 | 3.0% |
| German | 129 | 8.5% |
| Hungarian | 105 | 6.9% |
| Irish | 205 | 13.5% |
| Italian | 76 | 5.0% |
| Lithuanian | 2 | 0.1% |
| Mexican | 6 | 0.4% |
| Norwegian | 1 | 0.1% |
| Polish | 11 | 0.7% |
| Portuguese | 14 | 0.9% |
| Russian | 2 | 0.1% |
| Scotch-Irish | 44 | 2.9% |
| Scottish | 111 | 7.3% |
| Subsaharan African | 30 | 2.0% |
| Swedish | 4 | 0.3% | View All 25 Rows |
Immigrants in Bridgton
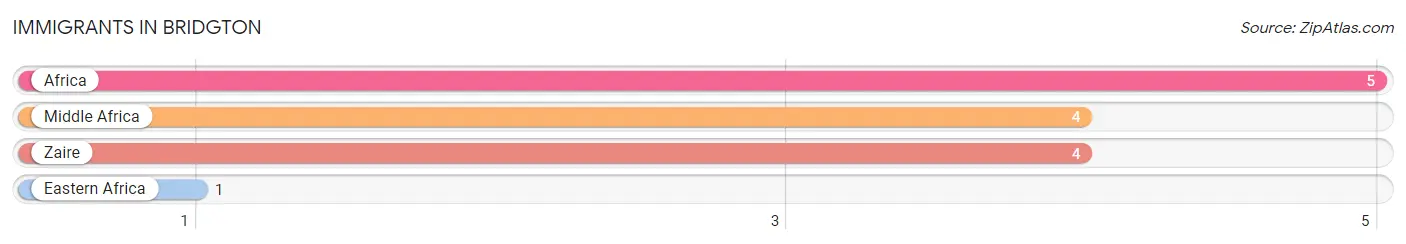
The most numerous immigrant groups reported in Bridgton came from Africa (5 | 0.3%), Middle Africa (4 | 0.3%), Zaire (4 | 0.3%), and Eastern Africa (1 | 0.1%), together accounting for 0.9% of all Bridgton residents.
| Immigration Origin | # Population | % Population |
| Africa | 5 | 0.3% |
| Eastern Africa | 1 | 0.1% |
| Middle Africa | 4 | 0.3% |
| Zaire | 4 | 0.3% | View All 4 Rows |
Sex and Age in Bridgton
Sex and Age in Bridgton
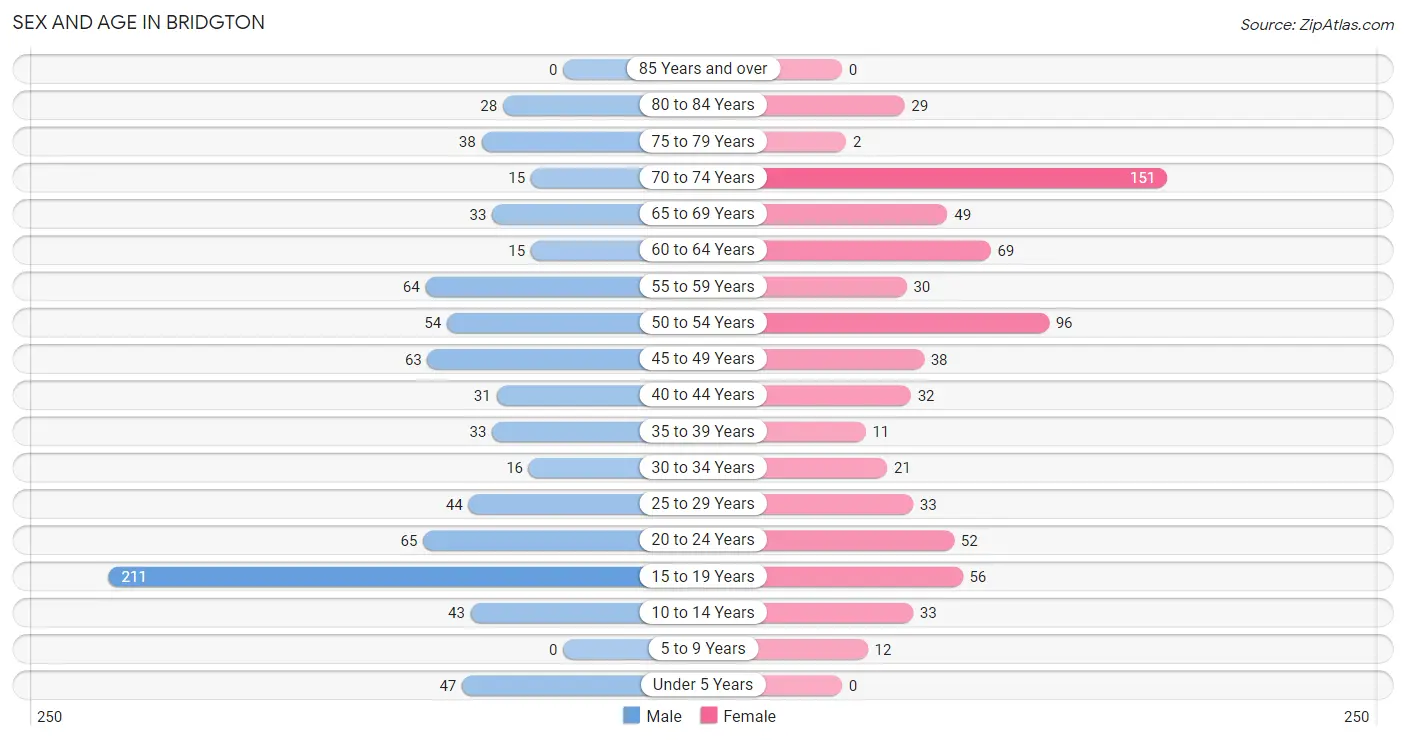
The most populous age groups in Bridgton are 15 to 19 Years (211 | 26.4%) for men and 70 to 74 Years (151 | 21.1%) for women.
| Age Bracket | Male | Female |
| Under 5 Years | 47 (5.9%) | 0 (0.0%) |
| 5 to 9 Years | 0 (0.0%) | 12 (1.7%) |
| 10 to 14 Years | 43 (5.4%) | 33 (4.6%) |
| 15 to 19 Years | 211 (26.4%) | 56 (7.8%) |
| 20 to 24 Years | 65 (8.1%) | 52 (7.3%) |
| 25 to 29 Years | 44 (5.5%) | 33 (4.6%) |
| 30 to 34 Years | 16 (2.0%) | 21 (2.9%) |
| 35 to 39 Years | 33 (4.1%) | 11 (1.5%) |
| 40 to 44 Years | 31 (3.9%) | 32 (4.5%) |
| 45 to 49 Years | 63 (7.9%) | 38 (5.3%) |
| 50 to 54 Years | 54 (6.8%) | 96 (13.5%) |
| 55 to 59 Years | 64 (8.0%) | 30 (4.2%) |
| 60 to 64 Years | 15 (1.9%) | 69 (9.7%) |
| 65 to 69 Years | 33 (4.1%) | 49 (6.9%) |
| 70 to 74 Years | 15 (1.9%) | 151 (21.1%) |
| 75 to 79 Years | 38 (4.8%) | 2 (0.3%) |
| 80 to 84 Years | 28 (3.5%) | 29 (4.1%) |
| 85 Years and over | 0 (0.0%) | 0 (0.0%) |
| Total | 800 (100.0%) | 714 (100.0%) |
Families and Households in Bridgton
Median Family Size in Bridgton
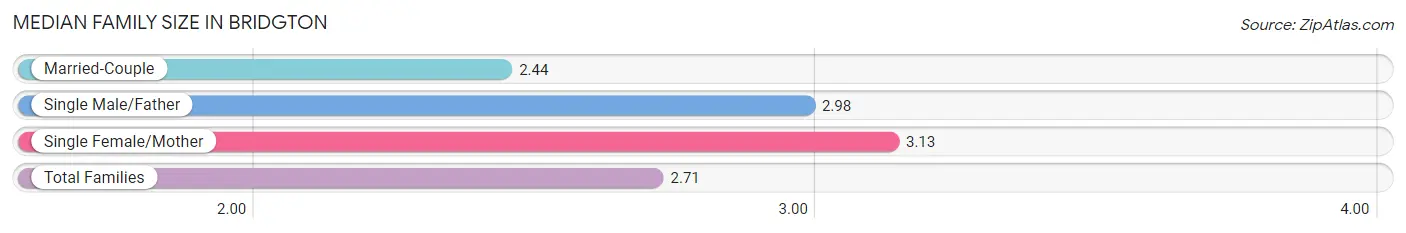
The median family size in Bridgton is 2.71 persons per family, with single female/mother families (109 | 29.5%) accounting for the largest median family size of 3.13 persons per family. On the other hand, married-couple families (213 | 57.6%) represent the smallest median family size with 2.44 persons per family.
| Family Type | # Families | Family Size |
| Married-Couple | 213 (57.6%) | 2.44 |
| Single Male/Father | 48 (13.0%) | 2.98 |
| Single Female/Mother | 109 (29.5%) | 3.13 |
| Total Families | 370 (100.0%) | 2.71 |
Median Household Size in Bridgton
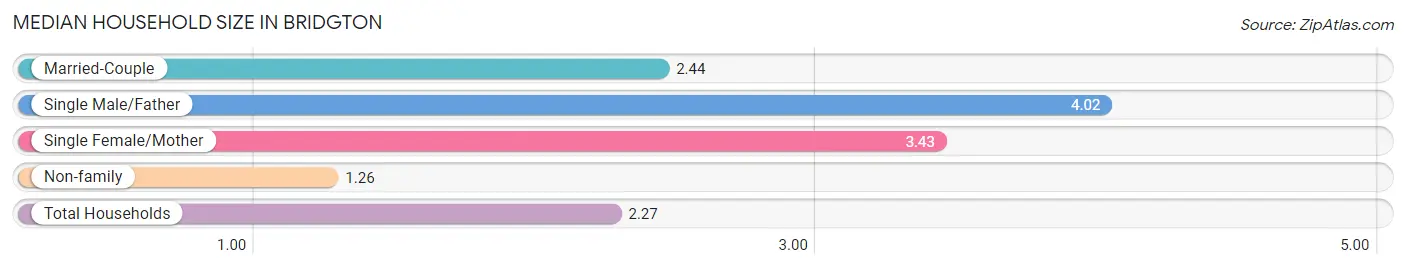
The median household size in Bridgton is 2.27 persons per household, with single male/father households (48 | 7.8%) accounting for the largest median household size of 4.02 persons per household. non-family households (246 | 39.9%) represent the smallest median household size with 1.26 persons per household.
| Household Type | # Households | Household Size |
| Married-Couple | 213 (34.6%) | 2.44 |
| Single Male/Father | 48 (7.8%) | 4.02 |
| Single Female/Mother | 109 (17.7%) | 3.43 |
| Non-family | 246 (39.9%) | 1.26 |
| Total Households | 616 (100.0%) | 2.27 |
Household Size by Marriage Status in Bridgton
Out of a total of 616 households in Bridgton, 370 (60.1%) are family households, while 246 (39.9%) are nonfamily households. The most numerous type of family households are 2-person households, comprising 202, and the most common type of nonfamily households are 1-person households, comprising 196.
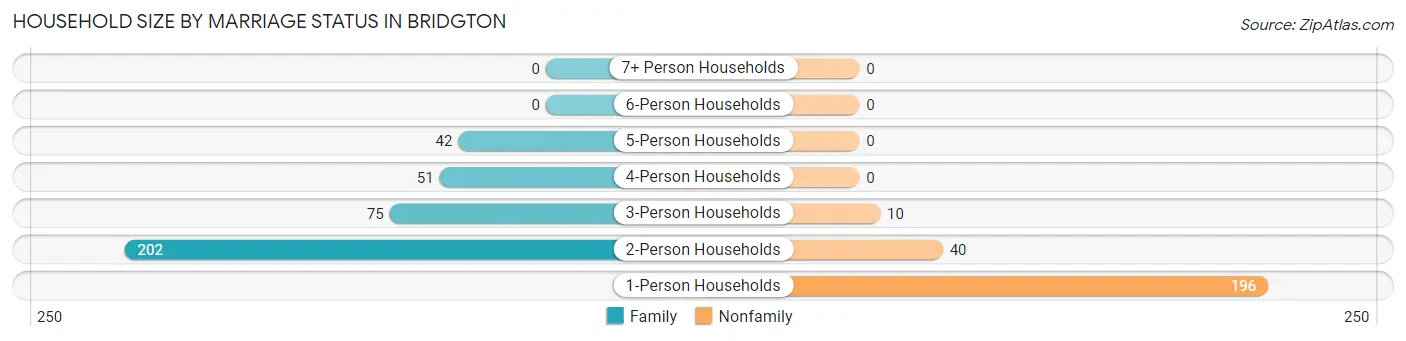
| Household Size | Family Households | Nonfamily Households |
| 1-Person Households | - | 196 (31.8%) |
| 2-Person Households | 202 (32.8%) | 40 (6.5%) |
| 3-Person Households | 75 (12.2%) | 10 (1.6%) |
| 4-Person Households | 51 (8.3%) | 0 (0.0%) |
| 5-Person Households | 42 (6.8%) | 0 (0.0%) |
| 6-Person Households | 0 (0.0%) | 0 (0.0%) |
| 7+ Person Households | 0 (0.0%) | 0 (0.0%) |
| Total | 370 (60.1%) | 246 (39.9%) |
Female Fertility in Bridgton
Fertility by Age in Bridgton
Average fertility rate in Bridgton is 76.0 births per 1,000 women. Women in the age bracket of 20 to 34 years have the highest fertility rate with 198.0 births per 1,000 women. Women in the age bracket of 20 to 34 years acount for 100.0% of all women with births.
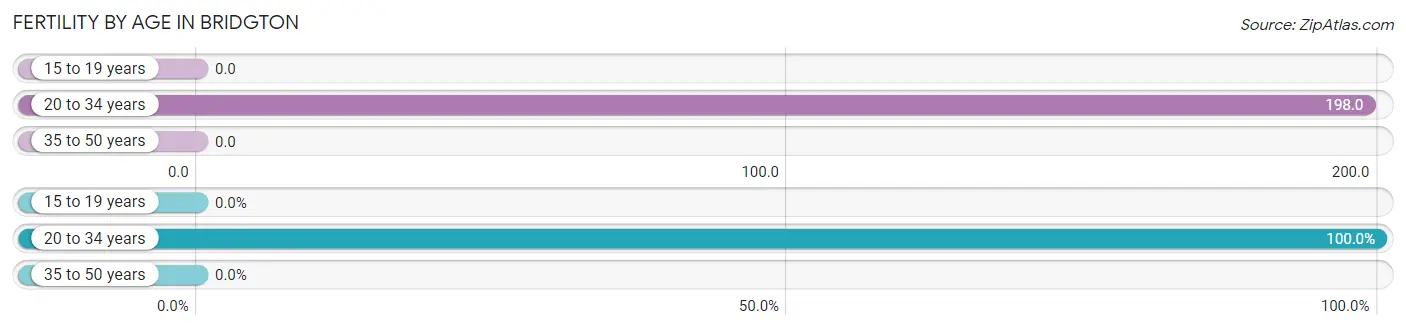
| Age Bracket | Women with Births | Births / 1,000 Women |
| 15 to 19 years | 0 (0.0%) | 0.0 |
| 20 to 34 years | 21 (100.0%) | 198.0 |
| 35 to 50 years | 0 (0.0%) | 0.0 |
| Total | 21 (100.0%) | 76.0 |
Fertility by Age by Marriage Status in Bridgton
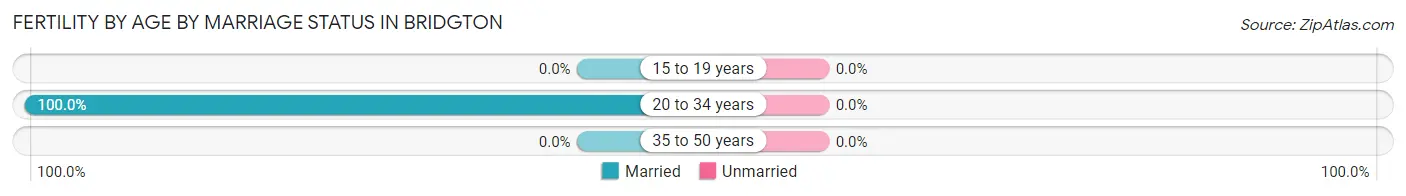
| Age Bracket | Married | Unmarried |
| 15 to 19 years | 0 (0.0%) | 0 (0.0%) |
| 20 to 34 years | 21 (100.0%) | 0 (0.0%) |
| 35 to 50 years | 0 (0.0%) | 0 (0.0%) |
| Total | 21 (100.0%) | 0 (0.0%) |
Fertility by Education in Bridgton
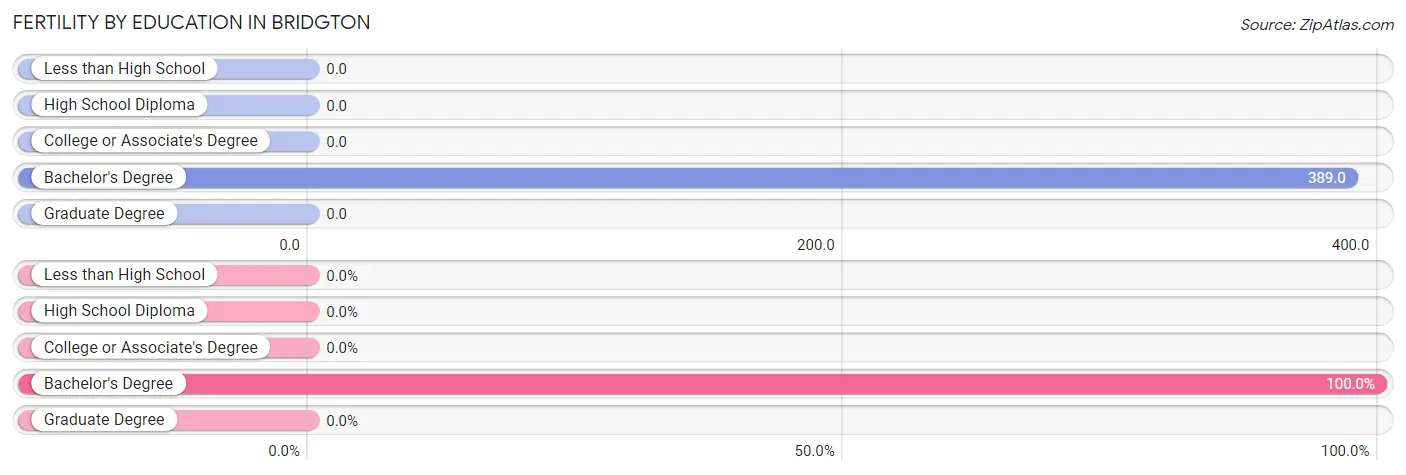
| Educational Attainment | Women with Births | Births / 1,000 Women |
| Less than High School | 0 (0.0%) | 0.0 |
| High School Diploma | 0 (0.0%) | 0.0 |
| College or Associate's Degree | 0 (0.0%) | 0.0 |
| Bachelor's Degree | 21 (100.0%) | 389.0 |
| Graduate Degree | 0 (0.0%) | 0.0 |
| Total | 21 (100.0%) | 76.0 |
Fertility by Education by Marriage Status in Bridgton
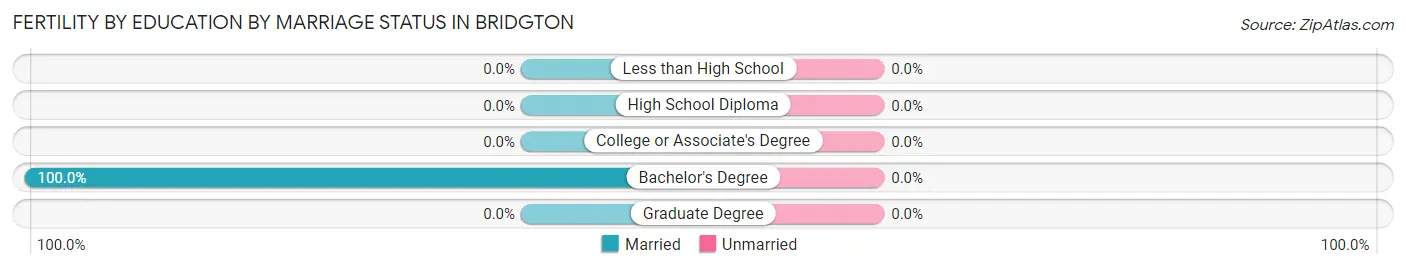
| Educational Attainment | Married | Unmarried |
| Less than High School | 0 (0.0%) | 0 (0.0%) |
| High School Diploma | 0 (0.0%) | 0 (0.0%) |
| College or Associate's Degree | 0 (0.0%) | 0 (0.0%) |
| Bachelor's Degree | 21 (100.0%) | 0 (0.0%) |
| Graduate Degree | 0 (0.0%) | 0 (0.0%) |
| Total | 21 (100.0%) | 0 (0.0%) |
Employment Characteristics in Bridgton
Employment by Class of Employer in Bridgton
Among the 588 employed individuals in Bridgton, private company employees (301 | 51.2%), self-employed (not incorporated) (110 | 18.7%), and not-for-profit organizations (78 | 13.3%) make up the most common classes of employment.
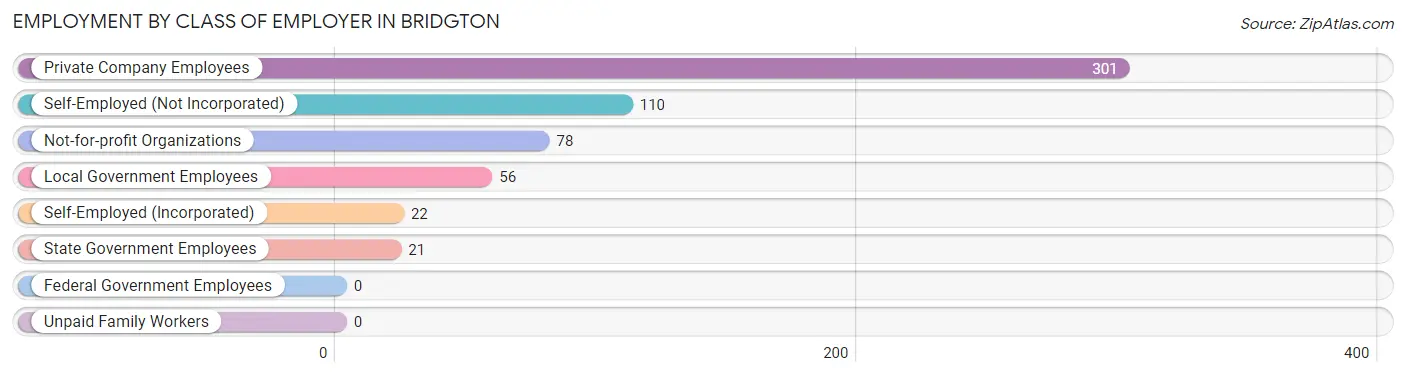
| Employer Class | # Employees | % Employees |
| Private Company Employees | 301 | 51.2% |
| Self-Employed (Incorporated) | 22 | 3.7% |
| Self-Employed (Not Incorporated) | 110 | 18.7% |
| Not-for-profit Organizations | 78 | 13.3% |
| Local Government Employees | 56 | 9.5% |
| State Government Employees | 21 | 3.6% |
| Federal Government Employees | 0 | 0.0% |
| Unpaid Family Workers | 0 | 0.0% |
| Total | 588 | 100.0% |
Employment Status by Age in Bridgton
According to the labor force statistics for Bridgton, out of the total population over 16 years of age (1,340), 47.9% or 642 individuals are in the labor force, with 8.4% or 54 of them unemployed. The age group with the highest labor force participation rate is 30 to 34 years, with 100.0% or 37 individuals in the labor force. Within the labor force, the 16 to 19 years age range has the highest percentage of unemployed individuals, with 59.6% or 28 of them being unemployed.
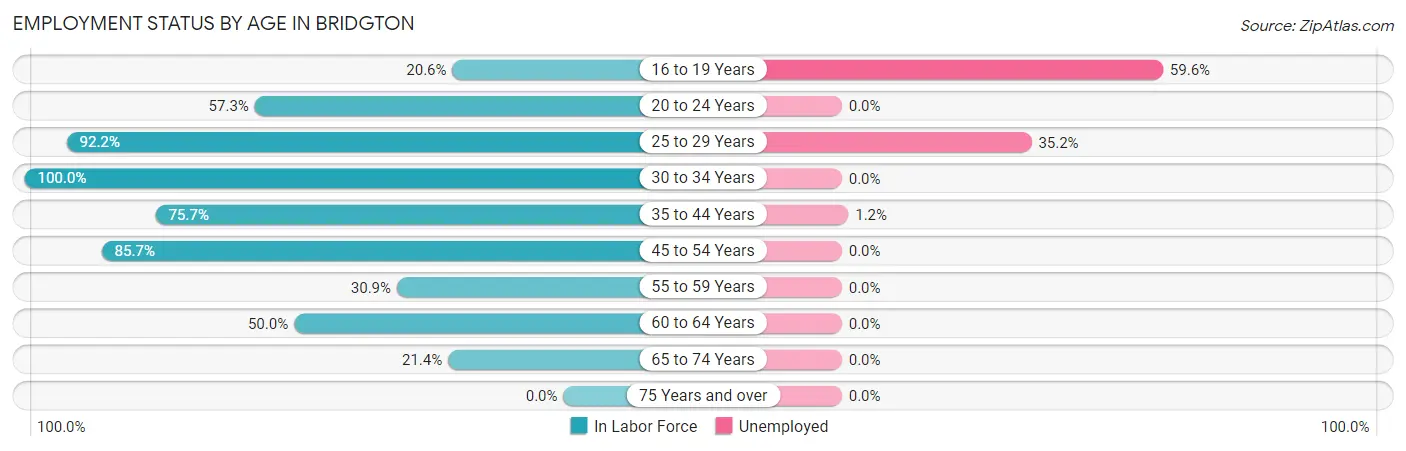
| Age Bracket | In Labor Force | Unemployed |
| 16 to 19 Years | 47 (20.6%) | 28 (59.6%) |
| 20 to 24 Years | 67 (57.3%) | 0 (0.0%) |
| 25 to 29 Years | 71 (92.2%) | 25 (35.2%) |
| 30 to 34 Years | 37 (100.0%) | 0 (0.0%) |
| 35 to 44 Years | 81 (75.7%) | 1 (1.2%) |
| 45 to 54 Years | 215 (85.7%) | 0 (0.0%) |
| 55 to 59 Years | 29 (30.9%) | 0 (0.0%) |
| 60 to 64 Years | 42 (50.0%) | 0 (0.0%) |
| 65 to 74 Years | 53 (21.4%) | 0 (0.0%) |
| 75 Years and over | 0 (0.0%) | 0 (0.0%) |
| Total | 642 (47.9%) | 54 (8.4%) |
Employment Status by Educational Attainment in Bridgton
According to labor force statistics for Bridgton, 73.1% of individuals (475) out of the total population between 25 and 64 years of age (650) are in the labor force, with 5.5% or 26 of them being unemployed. The group with the highest labor force participation rate are those with the educational attainment of bachelor's degree or higher, with 98.7% or 229 individuals in the labor force. Within the labor force, individuals with bachelor's degree or higher education have the highest percentage of unemployment, with 10.9% or 25 of them being unemployed.
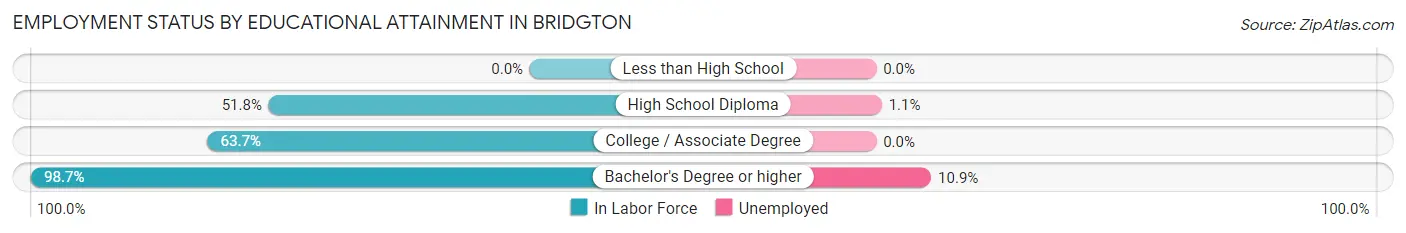
| Educational Attainment | In Labor Force | Unemployed |
| Less than High School | 0 (0.0%) | 0 (0.0%) |
| High School Diploma | 88 (51.8%) | 2 (1.1%) |
| College / Associate Degree | 158 (63.7%) | 0 (0.0%) |
| Bachelor's Degree or higher | 229 (98.7%) | 25 (10.9%) |
| Total | 475 (73.1%) | 36 (5.5%) |
Employment Occupations by Sex in Bridgton
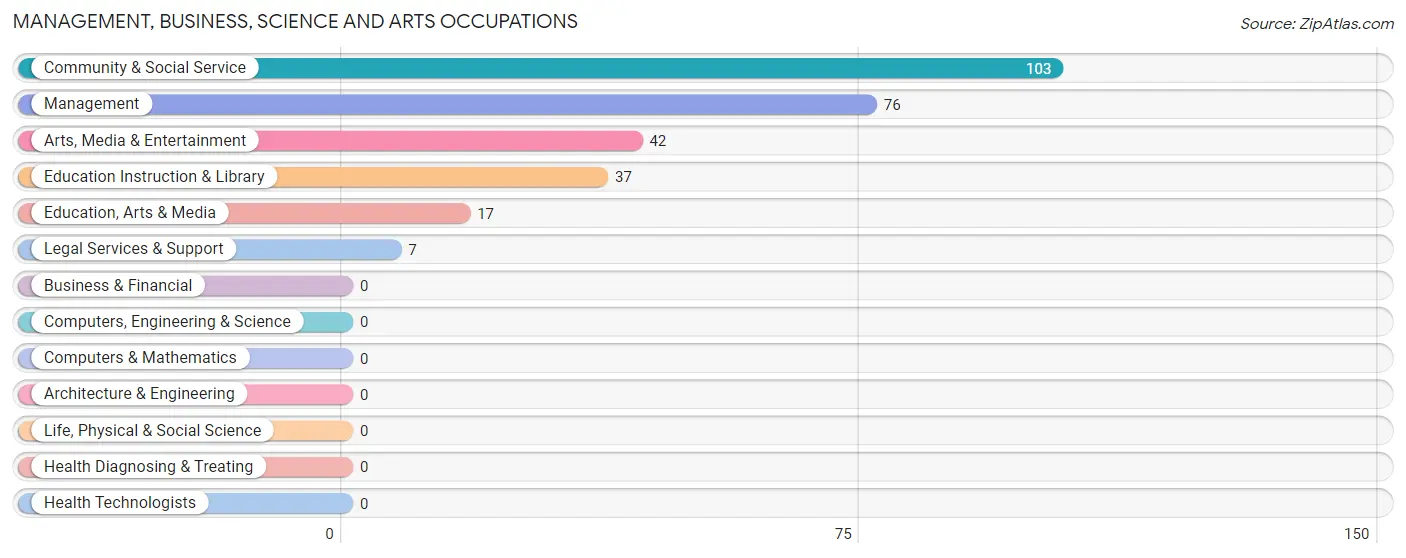
Management, Business, Science and Arts Occupations
The most common Management, Business, Science and Arts occupations in Bridgton are Community & Social Service (103 | 17.5%), Management (76 | 12.9%), Arts, Media & Entertainment (42 | 7.1%), Education Instruction & Library (37 | 6.3%), and Education, Arts & Media (17 | 2.9%).
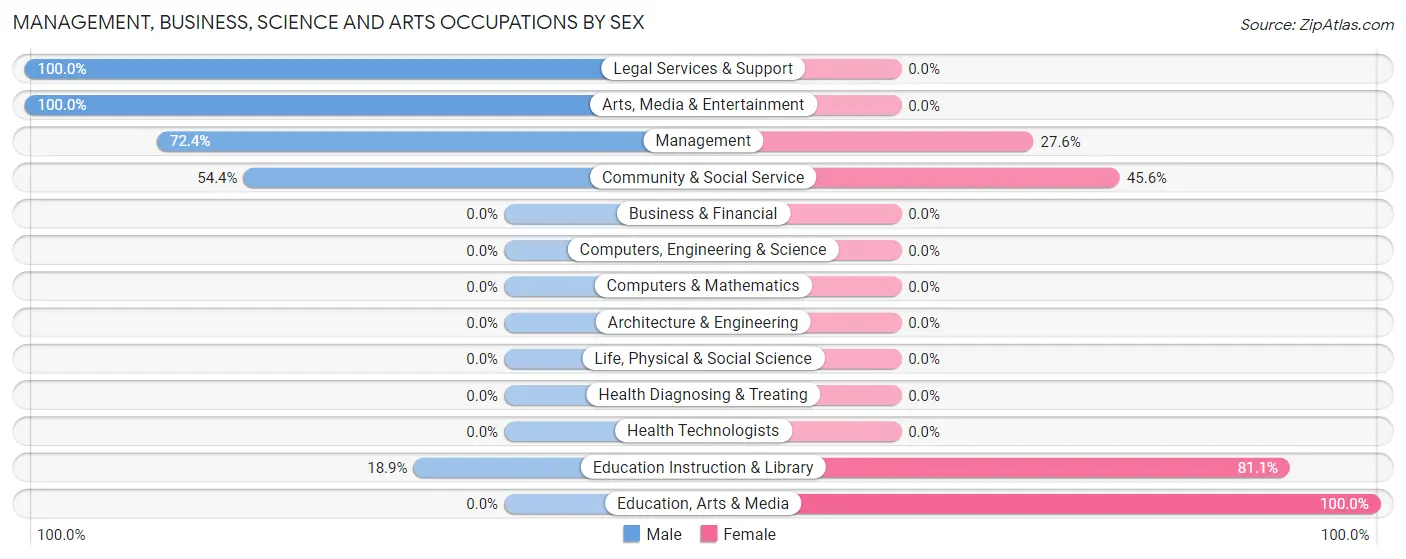
Management, Business, Science and Arts Occupations by Sex
Within the Management, Business, Science and Arts occupations in Bridgton, the most male-oriented occupations are Legal Services & Support (100.0%), Arts, Media & Entertainment (100.0%), and Management (72.4%), while the most female-oriented occupations are Education, Arts & Media (100.0%), Education Instruction & Library (81.1%), and Community & Social Service (45.6%).
| Occupation | Male | Female |
| Management | 55 (72.4%) | 21 (27.6%) |
| Business & Financial | 0 (0.0%) | 0 (0.0%) |
| Computers, Engineering & Science | 0 (0.0%) | 0 (0.0%) |
| Computers & Mathematics | 0 (0.0%) | 0 (0.0%) |
| Architecture & Engineering | 0 (0.0%) | 0 (0.0%) |
| Life, Physical & Social Science | 0 (0.0%) | 0 (0.0%) |
| Community & Social Service | 56 (54.4%) | 47 (45.6%) |
| Education, Arts & Media | 0 (0.0%) | 17 (100.0%) |
| Legal Services & Support | 7 (100.0%) | 0 (0.0%) |
| Education Instruction & Library | 7 (18.9%) | 30 (81.1%) |
| Arts, Media & Entertainment | 42 (100.0%) | 0 (0.0%) |
| Health Diagnosing & Treating | 0 (0.0%) | 0 (0.0%) |
| Health Technologists | 0 (0.0%) | 0 (0.0%) |
| Total (Category) | 111 (62.0%) | 68 (38.0%) |
| Total (Overall) | 296 (50.3%) | 292 (49.7%) |
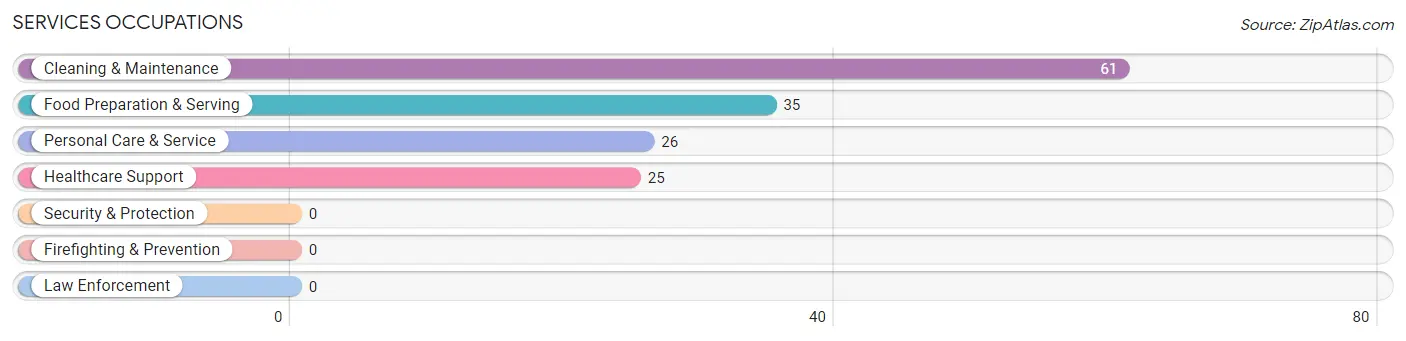
Services Occupations
The most common Services occupations in Bridgton are Cleaning & Maintenance (61 | 10.4%), Food Preparation & Serving (35 | 5.9%), Personal Care & Service (26 | 4.4%), and Healthcare Support (25 | 4.3%).
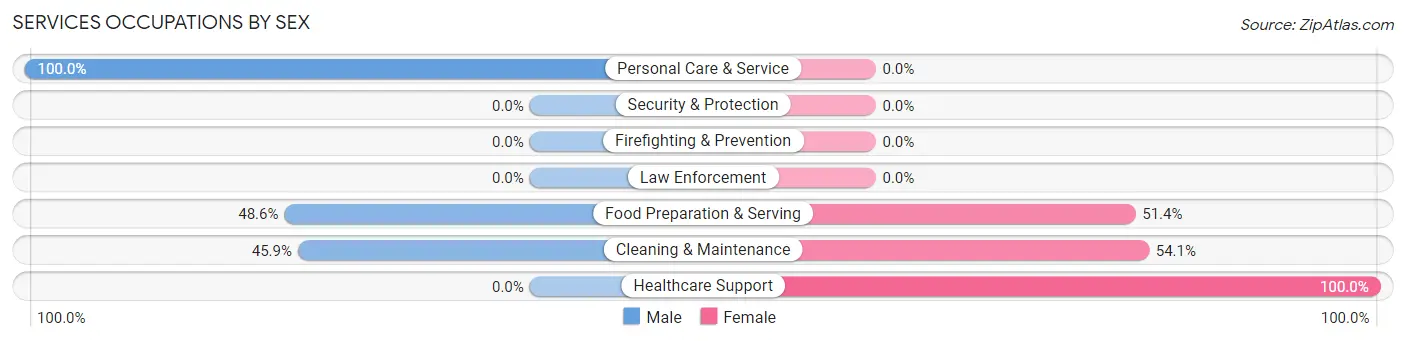
Services Occupations by Sex
Within the Services occupations in Bridgton, the most male-oriented occupations are Personal Care & Service (100.0%), Food Preparation & Serving (48.6%), and Cleaning & Maintenance (45.9%), while the most female-oriented occupations are Healthcare Support (100.0%), Cleaning & Maintenance (54.1%), and Food Preparation & Serving (51.4%).
| Occupation | Male | Female |
| Healthcare Support | 0 (0.0%) | 25 (100.0%) |
| Security & Protection | 0 (0.0%) | 0 (0.0%) |
| Firefighting & Prevention | 0 (0.0%) | 0 (0.0%) |
| Law Enforcement | 0 (0.0%) | 0 (0.0%) |
| Food Preparation & Serving | 17 (48.6%) | 18 (51.4%) |
| Cleaning & Maintenance | 28 (45.9%) | 33 (54.1%) |
| Personal Care & Service | 26 (100.0%) | 0 (0.0%) |
| Total (Category) | 71 (48.3%) | 76 (51.7%) |
| Total (Overall) | 296 (50.3%) | 292 (49.7%) |
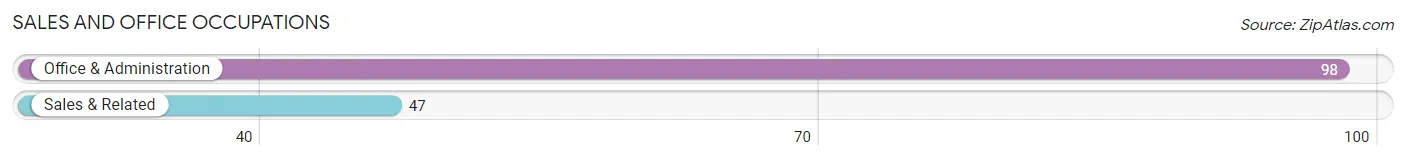
Sales and Office Occupations
The most common Sales and Office occupations in Bridgton are Office & Administration (98 | 16.7%), and Sales & Related (47 | 8.0%).
Sales and Office Occupations by Sex
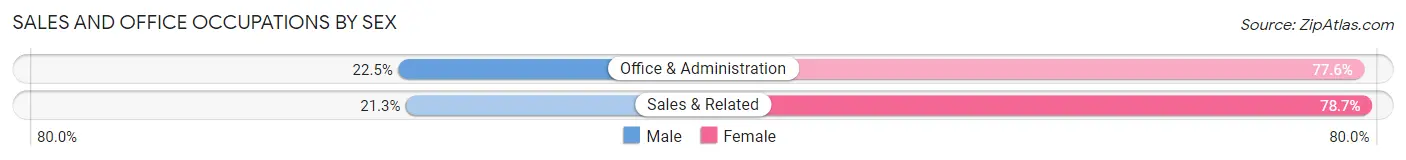
| Occupation | Male | Female |
| Sales & Related | 10 (21.3%) | 37 (78.7%) |
| Office & Administration | 22 (22.5%) | 76 (77.5%) |
| Total (Category) | 32 (22.1%) | 113 (77.9%) |
| Total (Overall) | 296 (50.3%) | 292 (49.7%) |
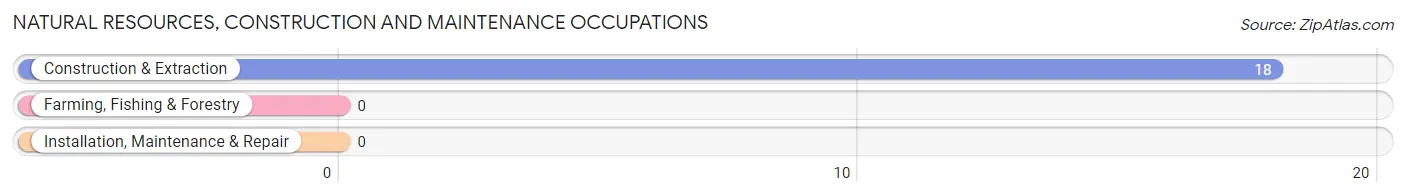
Natural Resources, Construction and Maintenance Occupations
The most common Natural Resources, Construction and Maintenance occupations in Bridgton are , and Construction & Extraction (18 | 3.1%).
Natural Resources, Construction and Maintenance Occupations by Sex
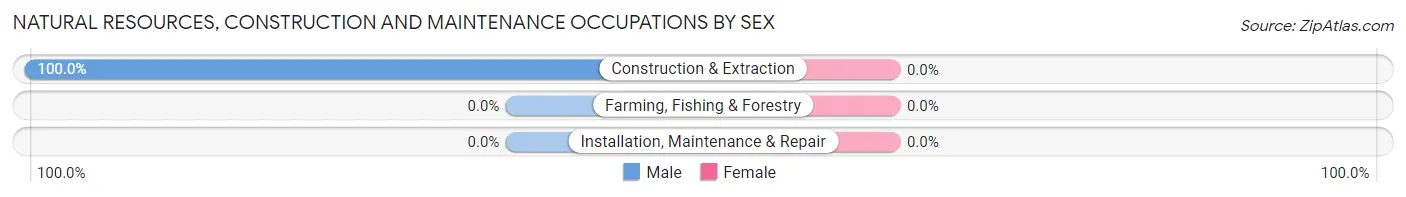
| Occupation | Male | Female |
| Farming, Fishing & Forestry | 0 (0.0%) | 0 (0.0%) |
| Construction & Extraction | 18 (100.0%) | 0 (0.0%) |
| Installation, Maintenance & Repair | 0 (0.0%) | 0 (0.0%) |
| Total (Category) | 18 (100.0%) | 0 (0.0%) |
| Total (Overall) | 296 (50.3%) | 292 (49.7%) |
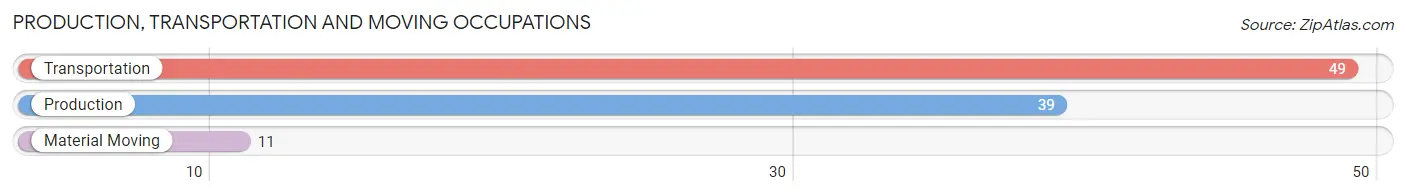
Production, Transportation and Moving Occupations
The most common Production, Transportation and Moving occupations in Bridgton are Transportation (49 | 8.3%), Production (39 | 6.6%), and Material Moving (11 | 1.9%).
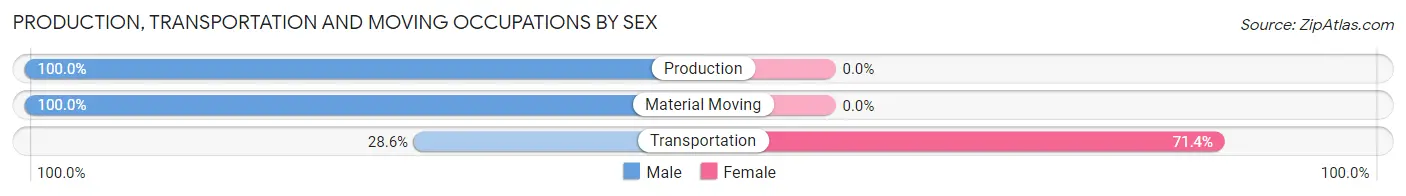
Production, Transportation and Moving Occupations by Sex
| Occupation | Male | Female |
| Production | 39 (100.0%) | 0 (0.0%) |
| Transportation | 14 (28.6%) | 35 (71.4%) |
| Material Moving | 11 (100.0%) | 0 (0.0%) |
| Total (Category) | 64 (64.6%) | 35 (35.3%) |
| Total (Overall) | 296 (50.3%) | 292 (49.7%) |
Employment Industries by Sex in Bridgton
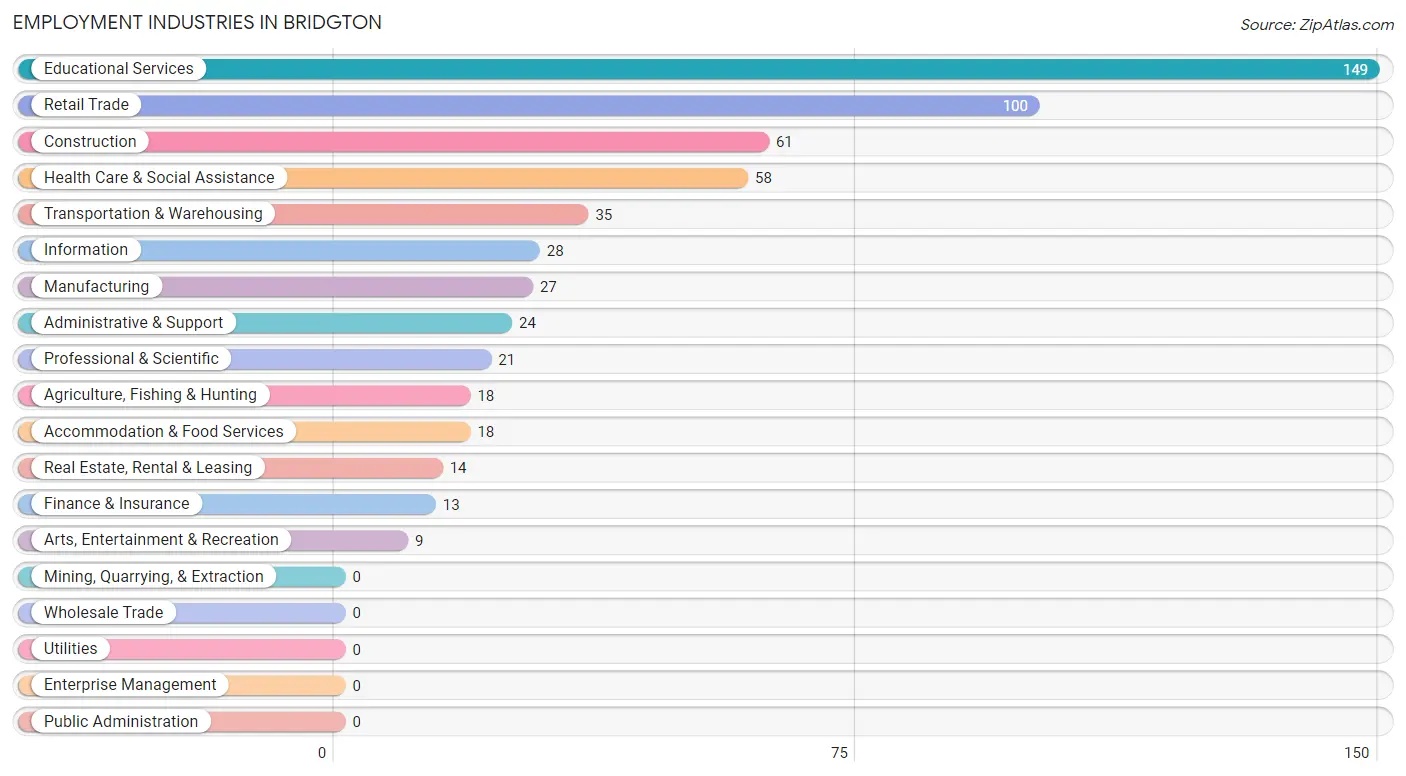
Employment Industries in Bridgton
The major employment industries in Bridgton include Educational Services (149 | 25.3%), Retail Trade (100 | 17.0%), Construction (61 | 10.4%), Health Care & Social Assistance (58 | 9.9%), and Transportation & Warehousing (35 | 5.9%).
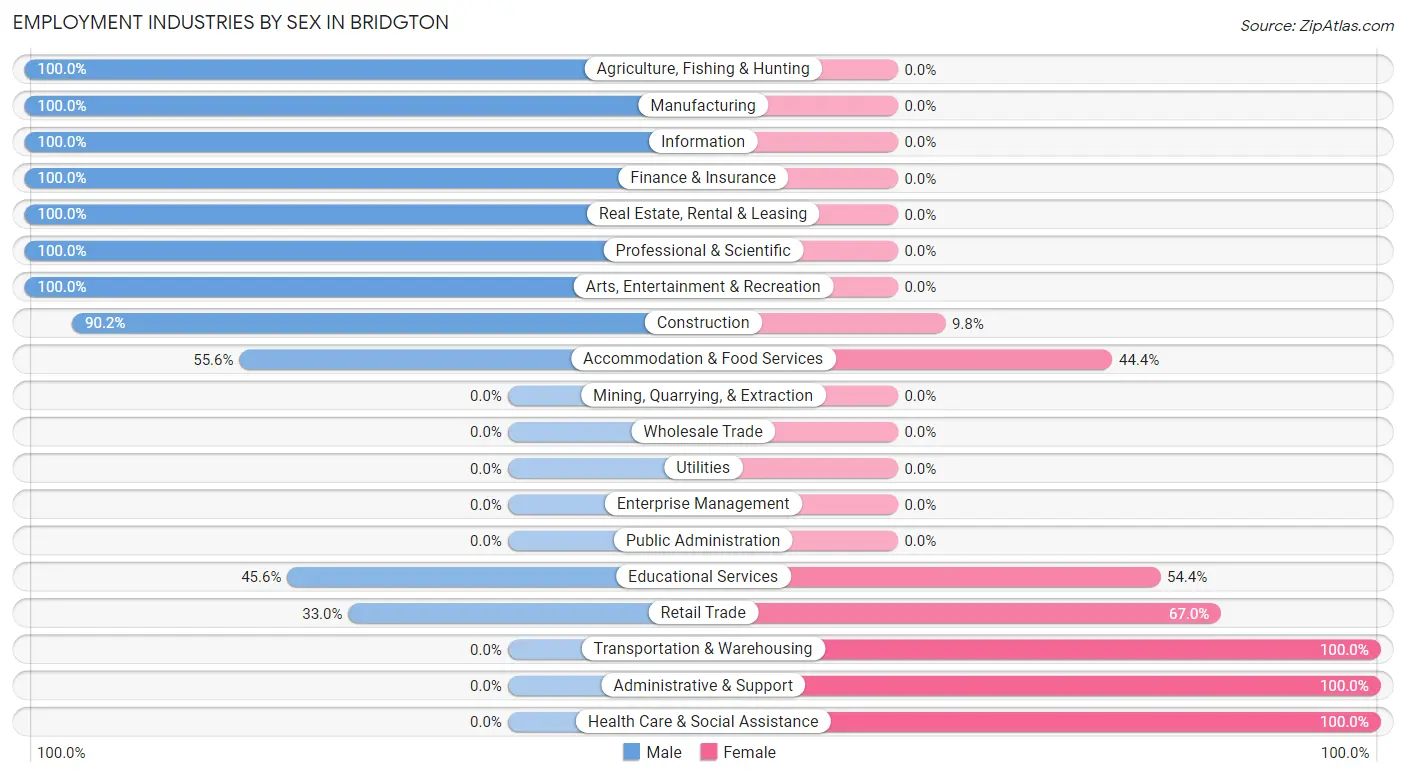
Employment Industries by Sex in Bridgton
The Bridgton industries that see more men than women are Agriculture, Fishing & Hunting (100.0%), Manufacturing (100.0%), and Information (100.0%), whereas the industries that tend to have a higher number of women are Transportation & Warehousing (100.0%), Administrative & Support (100.0%), and Health Care & Social Assistance (100.0%).
| Industry | Male | Female |
| Agriculture, Fishing & Hunting | 18 (100.0%) | 0 (0.0%) |
| Mining, Quarrying, & Extraction | 0 (0.0%) | 0 (0.0%) |
| Construction | 55 (90.2%) | 6 (9.8%) |
| Manufacturing | 27 (100.0%) | 0 (0.0%) |
| Wholesale Trade | 0 (0.0%) | 0 (0.0%) |
| Retail Trade | 33 (33.0%) | 67 (67.0%) |
| Transportation & Warehousing | 0 (0.0%) | 35 (100.0%) |
| Utilities | 0 (0.0%) | 0 (0.0%) |
| Information | 28 (100.0%) | 0 (0.0%) |
| Finance & Insurance | 13 (100.0%) | 0 (0.0%) |
| Real Estate, Rental & Leasing | 14 (100.0%) | 0 (0.0%) |
| Professional & Scientific | 21 (100.0%) | 0 (0.0%) |
| Enterprise Management | 0 (0.0%) | 0 (0.0%) |
| Administrative & Support | 0 (0.0%) | 24 (100.0%) |
| Educational Services | 68 (45.6%) | 81 (54.4%) |
| Health Care & Social Assistance | 0 (0.0%) | 58 (100.0%) |
| Arts, Entertainment & Recreation | 9 (100.0%) | 0 (0.0%) |
| Accommodation & Food Services | 10 (55.6%) | 8 (44.4%) |
| Public Administration | 0 (0.0%) | 0 (0.0%) |
| Total | 296 (50.3%) | 292 (49.7%) |
Education in Bridgton
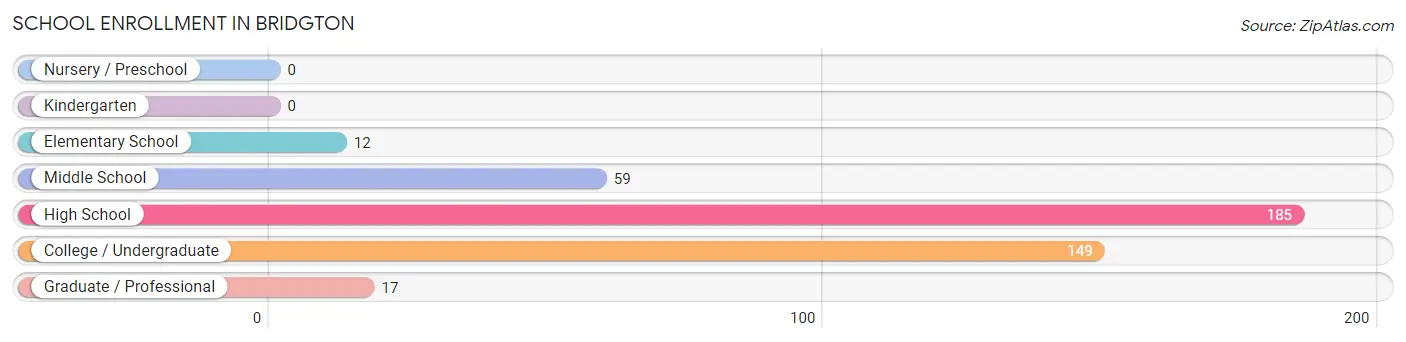
School Enrollment in Bridgton
The most common levels of schooling among the 422 students in Bridgton are high school (185 | 43.8%), college / undergraduate (149 | 35.3%), and middle school (59 | 14.0%).
| School Level | # Students | % Students |
| Nursery / Preschool | 0 | 0.0% |
| Kindergarten | 0 | 0.0% |
| Elementary School | 12 | 2.8% |
| Middle School | 59 | 14.0% |
| High School | 185 | 43.8% |
| College / Undergraduate | 149 | 35.3% |
| Graduate / Professional | 17 | 4.0% |
| Total | 422 | 100.0% |
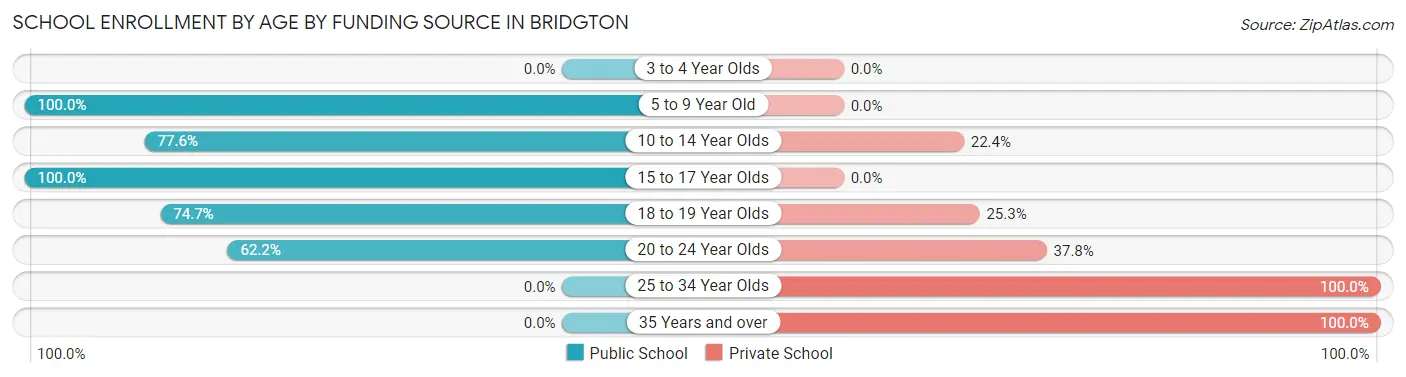
School Enrollment by Age by Funding Source in Bridgton
Out of a total of 422 students who are enrolled in schools in Bridgton, 92 (21.8%) attend a private institution, while the remaining 330 (78.2%) are enrolled in public schools. The age group of 25 to 34 year olds has the highest likelihood of being enrolled in private schools, with 6 (100.0% in the age bracket) enrolled. Conversely, the age group of 5 to 9 year old has the lowest likelihood of being enrolled in a private school, with 12 (100.0% in the age bracket) attending a public institution.
| Age Bracket | Public School | Private School |
| 3 to 4 Year Olds | 0 (0.0%) | 0 (0.0%) |
| 5 to 9 Year Old | 12 (100.0%) | 0 (0.0%) |
| 10 to 14 Year Olds | 59 (77.6%) | 17 (22.4%) |
| 15 to 17 Year Olds | 146 (100.0%) | 0 (0.0%) |
| 18 to 19 Year Olds | 62 (74.7%) | 21 (25.3%) |
| 20 to 24 Year Olds | 51 (62.2%) | 31 (37.8%) |
| 25 to 34 Year Olds | 0 (0.0%) | 6 (100.0%) |
| 35 Years and over | 0 (0.0%) | 17 (100.0%) |
| Total | 330 (78.2%) | 92 (21.8%) |
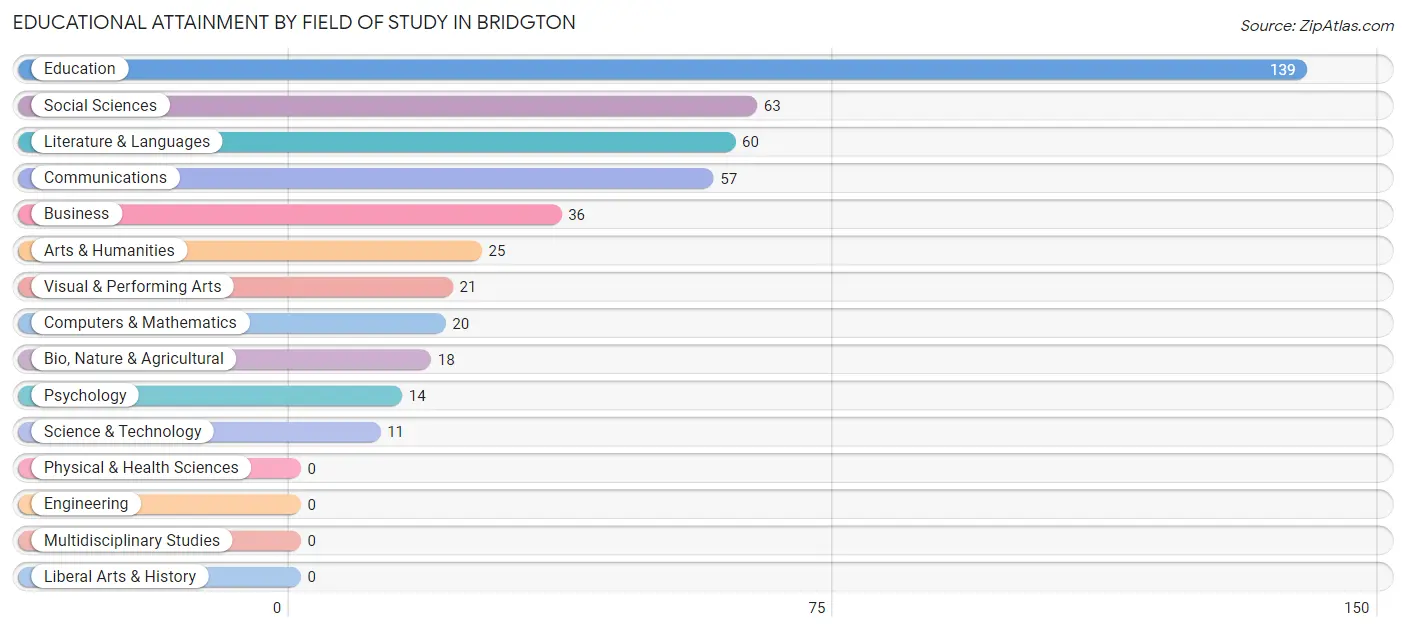
Educational Attainment by Field of Study in Bridgton
Education (139 | 30.0%), social sciences (63 | 13.6%), literature & languages (60 | 12.9%), communications (57 | 12.3%), and business (36 | 7.8%) are the most common fields of study among 464 individuals in Bridgton who have obtained a bachelor's degree or higher.
| Field of Study | # Graduates | % Graduates |
| Computers & Mathematics | 20 | 4.3% |
| Bio, Nature & Agricultural | 18 | 3.9% |
| Physical & Health Sciences | 0 | 0.0% |
| Psychology | 14 | 3.0% |
| Social Sciences | 63 | 13.6% |
| Engineering | 0 | 0.0% |
| Multidisciplinary Studies | 0 | 0.0% |
| Science & Technology | 11 | 2.4% |
| Business | 36 | 7.8% |
| Education | 139 | 30.0% |
| Literature & Languages | 60 | 12.9% |
| Liberal Arts & History | 0 | 0.0% |
| Visual & Performing Arts | 21 | 4.5% |
| Communications | 57 | 12.3% |
| Arts & Humanities | 25 | 5.4% |
| Total | 464 | 100.0% |
Transportation & Commute in Bridgton
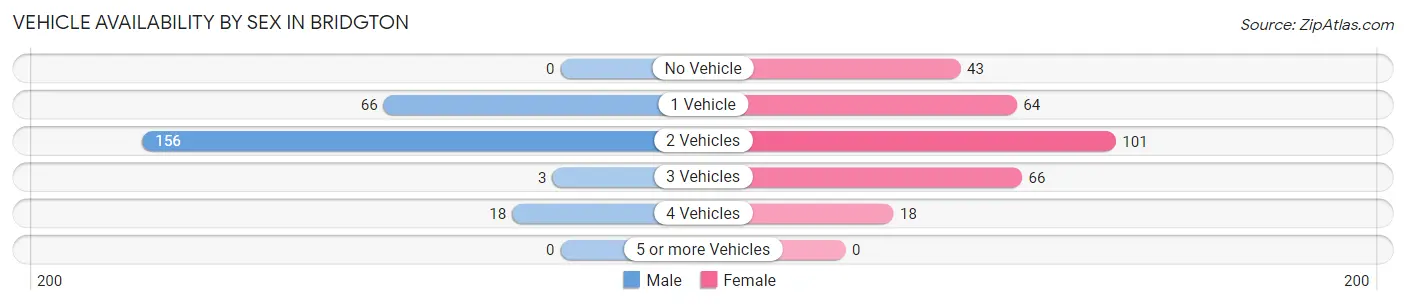
Vehicle Availability by Sex in Bridgton
The most prevalent vehicle ownership categories in Bridgton are males with 2 vehicles (156, accounting for 64.2%) and females with 2 vehicles (101, making up 53.4%).
| Vehicles Available | Male | Female |
| No Vehicle | 0 (0.0%) | 43 (14.7%) |
| 1 Vehicle | 66 (27.2%) | 64 (21.9%) |
| 2 Vehicles | 156 (64.2%) | 101 (34.6%) |
| 3 Vehicles | 3 (1.2%) | 66 (22.6%) |
| 4 Vehicles | 18 (7.4%) | 18 (6.2%) |
| 5 or more Vehicles | 0 (0.0%) | 0 (0.0%) |
| Total | 243 (100.0%) | 292 (100.0%) |
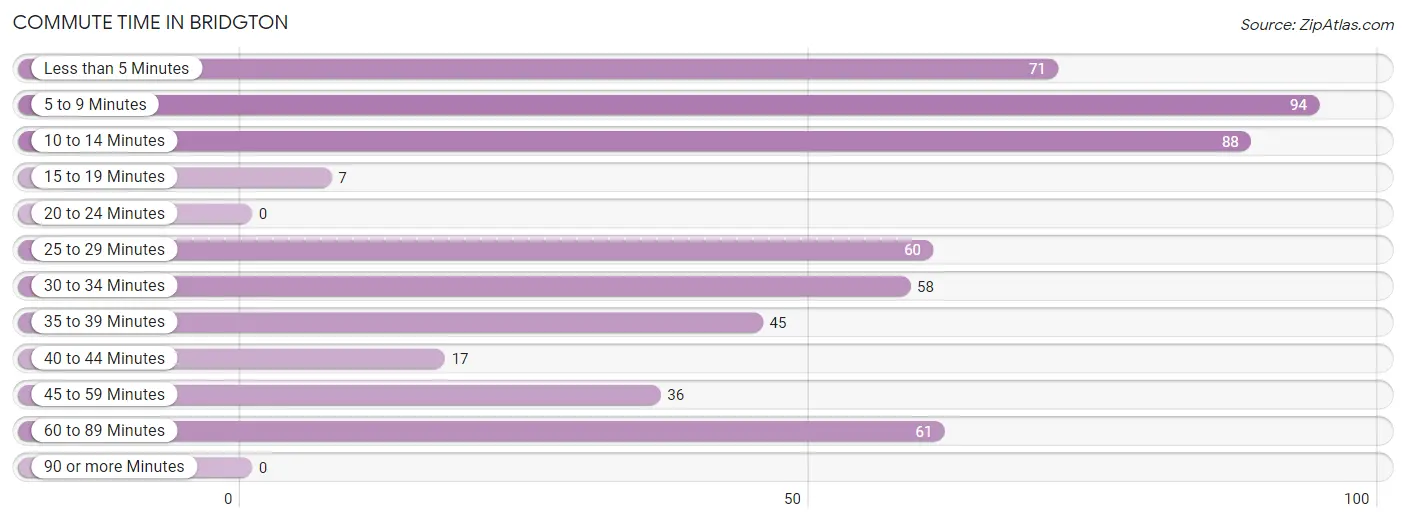
Commute Time in Bridgton
The most frequently occuring commute durations in Bridgton are 5 to 9 minutes (94 commuters, 17.5%), 10 to 14 minutes (88 commuters, 16.4%), and less than 5 minutes (71 commuters, 13.2%).
| Commute Time | # Commuters | % Commuters |
| Less than 5 Minutes | 71 | 13.2% |
| 5 to 9 Minutes | 94 | 17.5% |
| 10 to 14 Minutes | 88 | 16.4% |
| 15 to 19 Minutes | 7 | 1.3% |
| 20 to 24 Minutes | 0 | 0.0% |
| 25 to 29 Minutes | 60 | 11.2% |
| 30 to 34 Minutes | 58 | 10.8% |
| 35 to 39 Minutes | 45 | 8.4% |
| 40 to 44 Minutes | 17 | 3.2% |
| 45 to 59 Minutes | 36 | 6.7% |
| 60 to 89 Minutes | 61 | 11.4% |
| 90 or more Minutes | 0 | 0.0% |
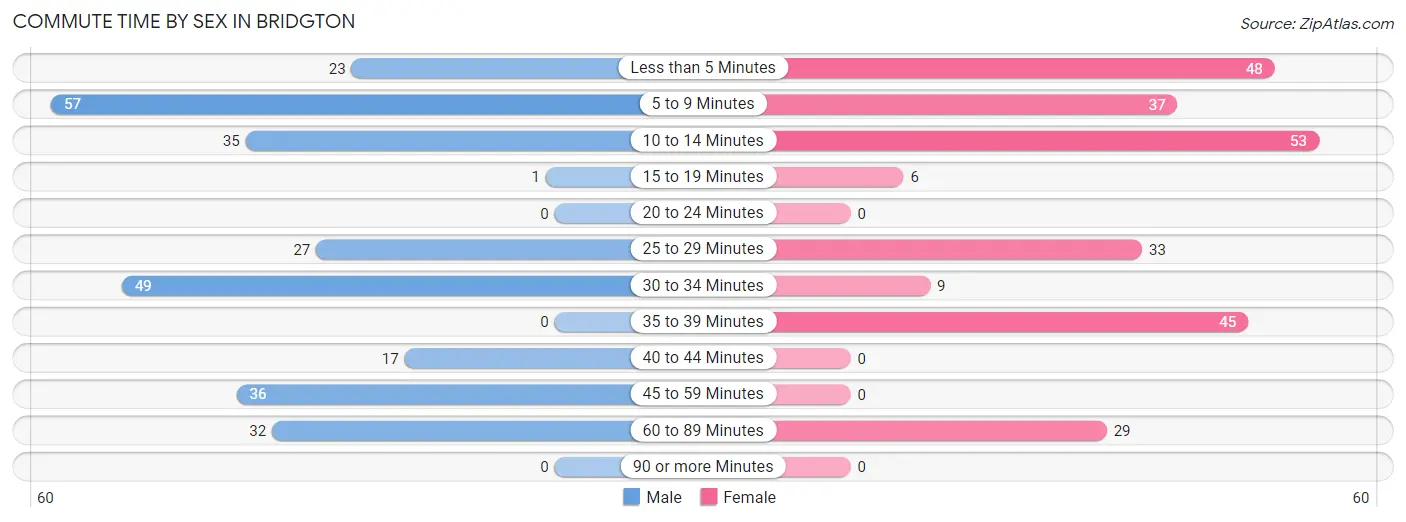
Commute Time by Sex in Bridgton
The most common commute times in Bridgton are 5 to 9 minutes (57 commuters, 20.6%) for males and 10 to 14 minutes (53 commuters, 20.4%) for females.
| Commute Time | Male | Female |
| Less than 5 Minutes | 23 (8.3%) | 48 (18.5%) |
| 5 to 9 Minutes | 57 (20.6%) | 37 (14.2%) |
| 10 to 14 Minutes | 35 (12.6%) | 53 (20.4%) |
| 15 to 19 Minutes | 1 (0.4%) | 6 (2.3%) |
| 20 to 24 Minutes | 0 (0.0%) | 0 (0.0%) |
| 25 to 29 Minutes | 27 (9.8%) | 33 (12.7%) |
| 30 to 34 Minutes | 49 (17.7%) | 9 (3.5%) |
| 35 to 39 Minutes | 0 (0.0%) | 45 (17.3%) |
| 40 to 44 Minutes | 17 (6.1%) | 0 (0.0%) |
| 45 to 59 Minutes | 36 (13.0%) | 0 (0.0%) |
| 60 to 89 Minutes | 32 (11.6%) | 29 (11.2%) |
| 90 or more Minutes | 0 (0.0%) | 0 (0.0%) |
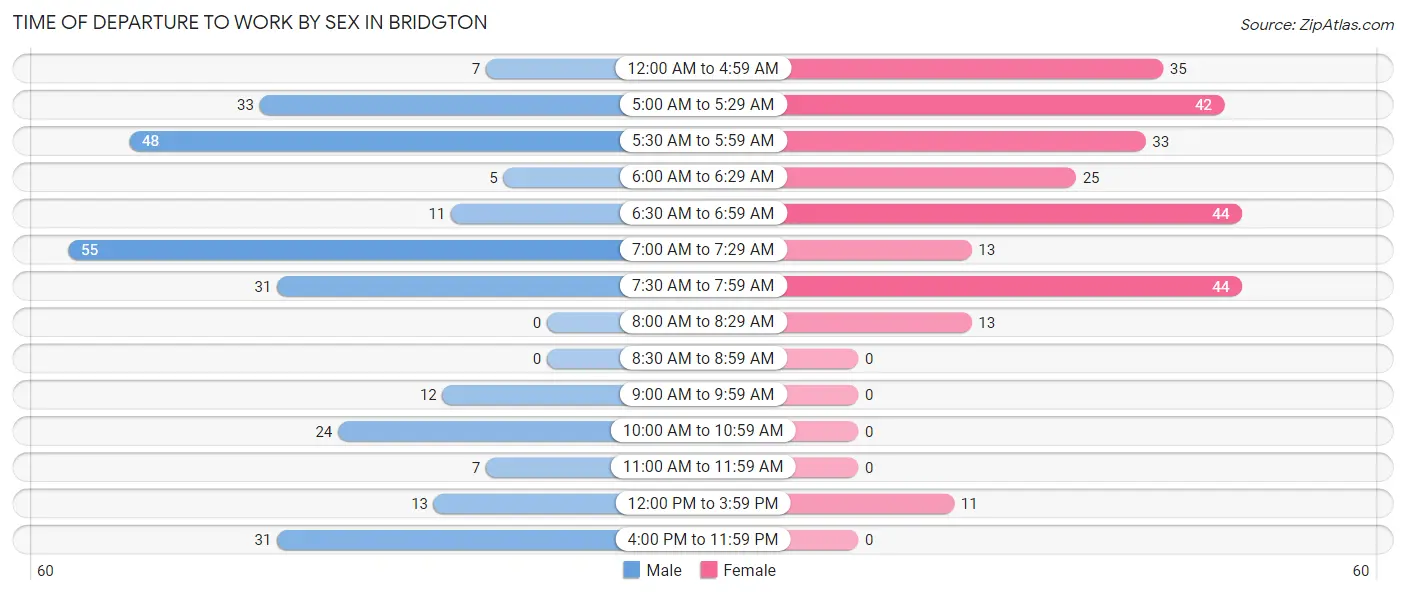
Time of Departure to Work by Sex in Bridgton
The most frequent times of departure to work in Bridgton are 7:00 AM to 7:29 AM (55, 19.9%) for males and 6:30 AM to 6:59 AM (44, 16.9%) for females.
| Time of Departure | Male | Female |
| 12:00 AM to 4:59 AM | 7 (2.5%) | 35 (13.5%) |
| 5:00 AM to 5:29 AM | 33 (11.9%) | 42 (16.2%) |
| 5:30 AM to 5:59 AM | 48 (17.3%) | 33 (12.7%) |
| 6:00 AM to 6:29 AM | 5 (1.8%) | 25 (9.6%) |
| 6:30 AM to 6:59 AM | 11 (4.0%) | 44 (16.9%) |
| 7:00 AM to 7:29 AM | 55 (19.9%) | 13 (5.0%) |
| 7:30 AM to 7:59 AM | 31 (11.2%) | 44 (16.9%) |
| 8:00 AM to 8:29 AM | 0 (0.0%) | 13 (5.0%) |
| 8:30 AM to 8:59 AM | 0 (0.0%) | 0 (0.0%) |
| 9:00 AM to 9:59 AM | 12 (4.3%) | 0 (0.0%) |
| 10:00 AM to 10:59 AM | 24 (8.7%) | 0 (0.0%) |
| 11:00 AM to 11:59 AM | 7 (2.5%) | 0 (0.0%) |
| 12:00 PM to 3:59 PM | 13 (4.7%) | 11 (4.2%) |
| 4:00 PM to 11:59 PM | 31 (11.2%) | 0 (0.0%) |
| Total | 277 (100.0%) | 260 (100.0%) |
Housing Occupancy in Bridgton
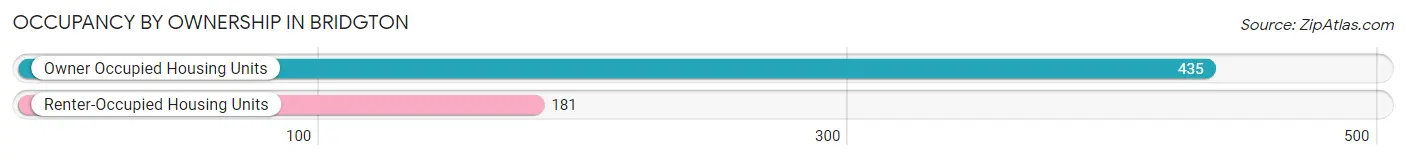
Occupancy by Ownership in Bridgton
Of the total 616 dwellings in Bridgton, owner-occupied units account for 435 (70.6%), while renter-occupied units make up 181 (29.4%).
| Occupancy | # Housing Units | % Housing Units |
| Owner Occupied Housing Units | 435 | 70.6% |
| Renter-Occupied Housing Units | 181 | 29.4% |
| Total Occupied Housing Units | 616 | 100.0% |
Occupancy by Household Size in Bridgton
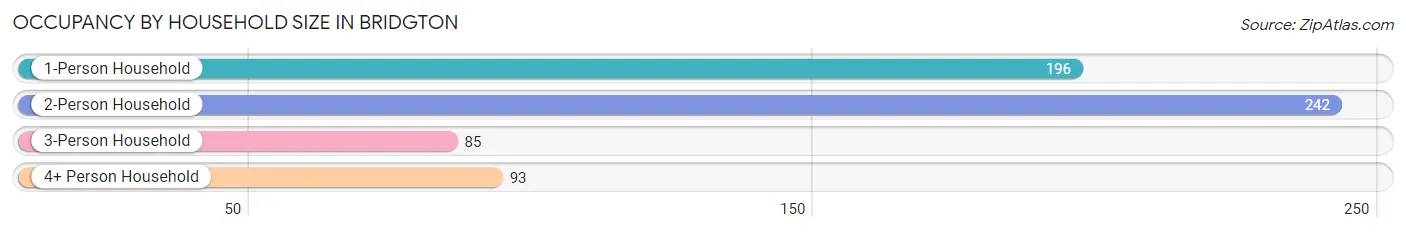
| Household Size | # Housing Units | % Housing Units |
| 1-Person Household | 196 | 31.8% |
| 2-Person Household | 242 | 39.3% |
| 3-Person Household | 85 | 13.8% |
| 4+ Person Household | 93 | 15.1% |
| Total Housing Units | 616 | 100.0% |
Occupancy by Ownership by Household Size in Bridgton
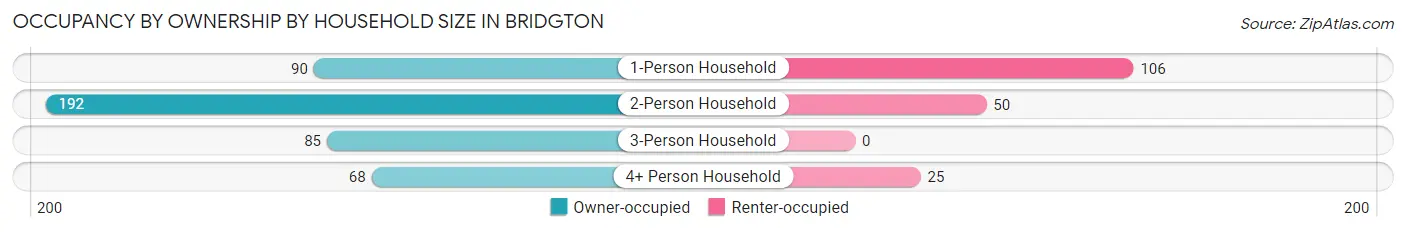
| Household Size | Owner-occupied | Renter-occupied |
| 1-Person Household | 90 (45.9%) | 106 (54.1%) |
| 2-Person Household | 192 (79.3%) | 50 (20.7%) |
| 3-Person Household | 85 (100.0%) | 0 (0.0%) |
| 4+ Person Household | 68 (73.1%) | 25 (26.9%) |
| Total Housing Units | 435 (70.6%) | 181 (29.4%) |
Occupancy by Educational Attainment in Bridgton
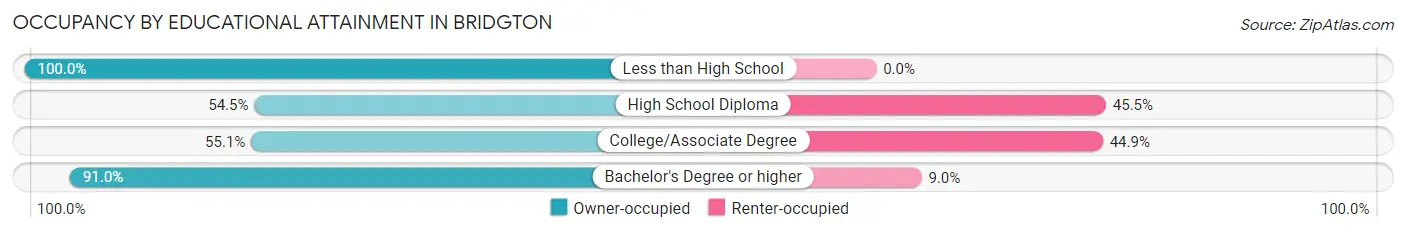
| Household Size | Owner-occupied | Renter-occupied |
| Less than High School | 1 (100.0%) | 0 (0.0%) |
| High School Diploma | 61 (54.5%) | 51 (45.5%) |
| College/Associate Degree | 130 (55.1%) | 106 (44.9%) |
| Bachelor's Degree or higher | 243 (91.0%) | 24 (9.0%) |
Occupancy by Age of Householder in Bridgton
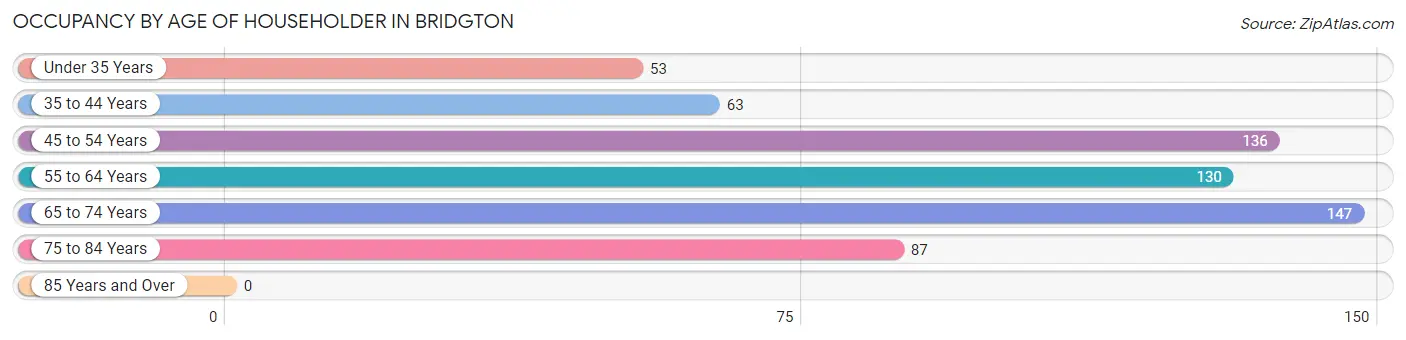
| Age Bracket | # Households | % Households |
| Under 35 Years | 53 | 8.6% |
| 35 to 44 Years | 63 | 10.2% |
| 45 to 54 Years | 136 | 22.1% |
| 55 to 64 Years | 130 | 21.1% |
| 65 to 74 Years | 147 | 23.9% |
| 75 to 84 Years | 87 | 14.1% |
| 85 Years and Over | 0 | 0.0% |
| Total | 616 | 100.0% |
Housing Finances in Bridgton
Median Income by Occupancy in Bridgton
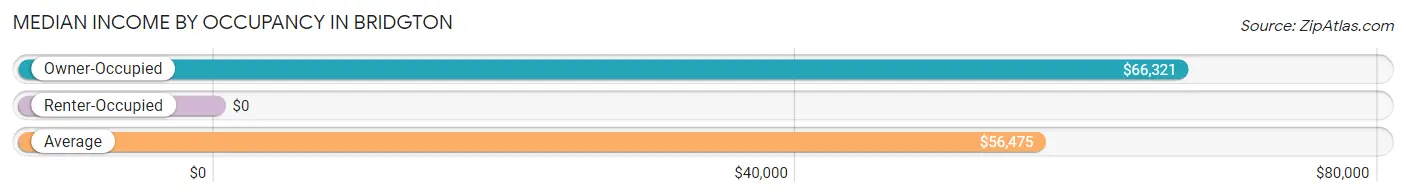
| Occupancy Type | # Households | Median Income |
| Owner-Occupied | 435 (70.6%) | $66,321 |
| Renter-Occupied | 181 (29.4%) | $0 |
| Average | 616 (100.0%) | $56,475 |
Occupancy by Householder Income Bracket in Bridgton
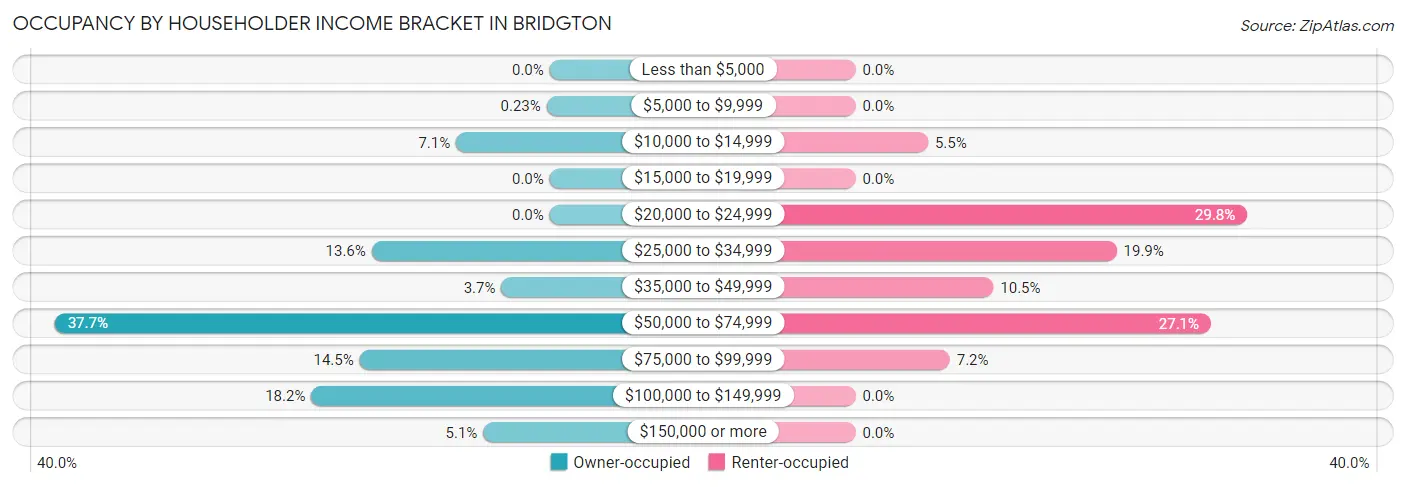
| Income Bracket | Owner-occupied | Renter-occupied |
| Less than $5,000 | 0 (0.0%) | 0 (0.0%) |
| $5,000 to $9,999 | 1 (0.2%) | 0 (0.0%) |
| $10,000 to $14,999 | 31 (7.1%) | 10 (5.5%) |
| $15,000 to $19,999 | 0 (0.0%) | 0 (0.0%) |
| $20,000 to $24,999 | 0 (0.0%) | 54 (29.8%) |
| $25,000 to $34,999 | 59 (13.6%) | 36 (19.9%) |
| $35,000 to $49,999 | 16 (3.7%) | 19 (10.5%) |
| $50,000 to $74,999 | 164 (37.7%) | 49 (27.1%) |
| $75,000 to $99,999 | 63 (14.5%) | 13 (7.2%) |
| $100,000 to $149,999 | 79 (18.2%) | 0 (0.0%) |
| $150,000 or more | 22 (5.1%) | 0 (0.0%) |
| Total | 435 (100.0%) | 181 (100.0%) |
Monthly Housing Cost Tiers in Bridgton
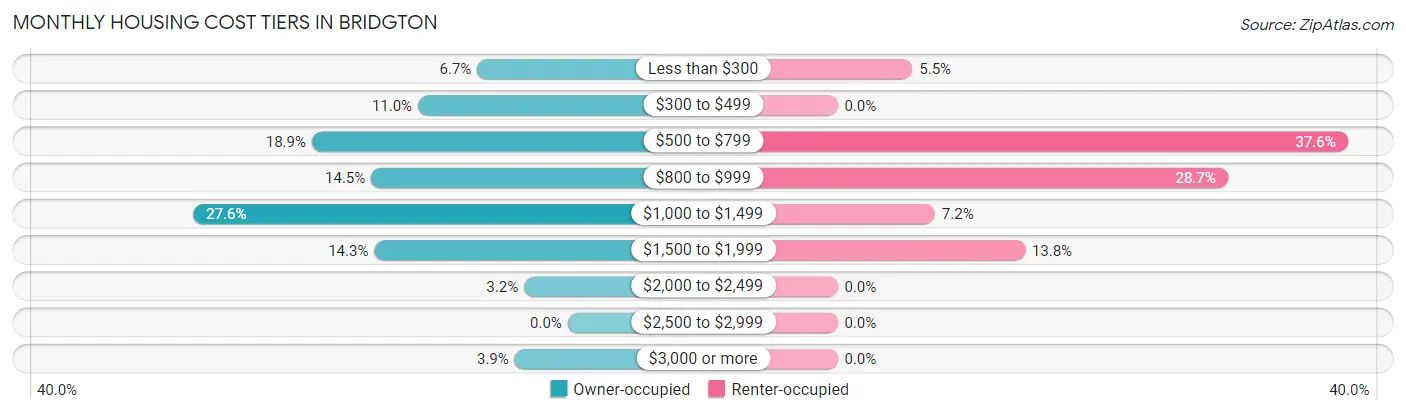
| Monthly Cost | Owner-occupied | Renter-occupied |
| Less than $300 | 29 (6.7%) | 10 (5.5%) |
| $300 to $499 | 48 (11.0%) | 0 (0.0%) |
| $500 to $799 | 82 (18.9%) | 68 (37.6%) |
| $800 to $999 | 63 (14.5%) | 52 (28.7%) |
| $1,000 to $1,499 | 120 (27.6%) | 13 (7.2%) |
| $1,500 to $1,999 | 62 (14.2%) | 25 (13.8%) |
| $2,000 to $2,499 | 14 (3.2%) | 0 (0.0%) |
| $2,500 to $2,999 | 0 (0.0%) | 0 (0.0%) |
| $3,000 or more | 17 (3.9%) | 0 (0.0%) |
| Total | 435 (100.0%) | 181 (100.0%) |
Physical Housing Characteristics in Bridgton
Housing Structures in Bridgton
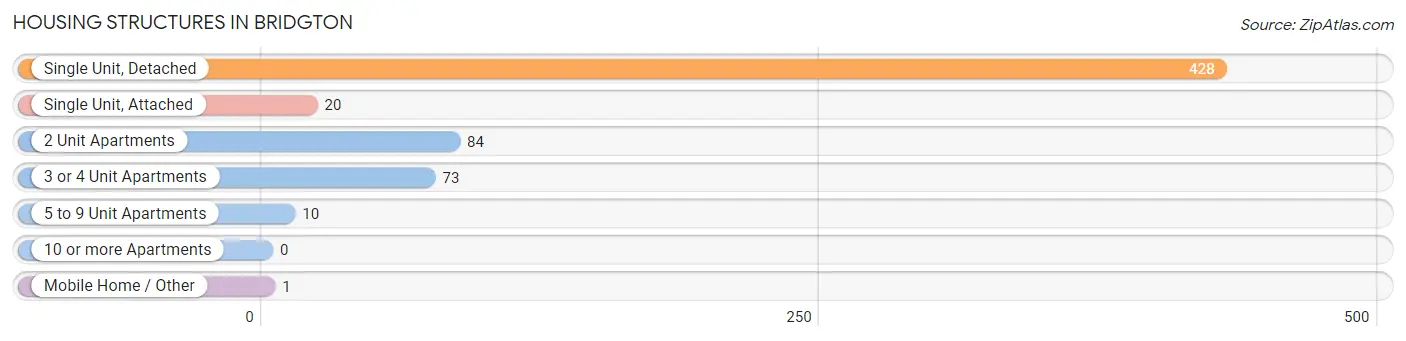
| Structure Type | # Housing Units | % Housing Units |
| Single Unit, Detached | 428 | 69.5% |
| Single Unit, Attached | 20 | 3.3% |
| 2 Unit Apartments | 84 | 13.6% |
| 3 or 4 Unit Apartments | 73 | 11.8% |
| 5 to 9 Unit Apartments | 10 | 1.6% |
| 10 or more Apartments | 0 | 0.0% |
| Mobile Home / Other | 1 | 0.2% |
| Total | 616 | 100.0% |
Housing Structures by Occupancy in Bridgton
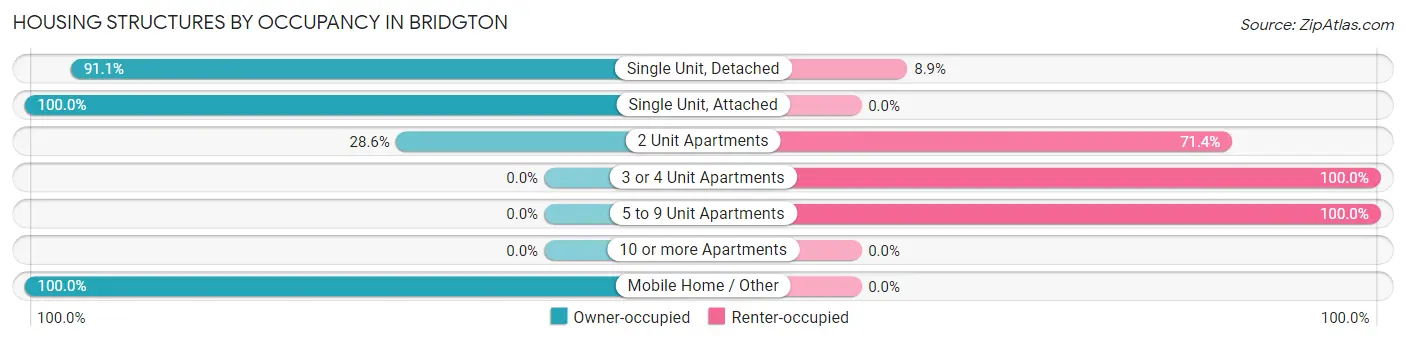
| Structure Type | Owner-occupied | Renter-occupied |
| Single Unit, Detached | 390 (91.1%) | 38 (8.9%) |
| Single Unit, Attached | 20 (100.0%) | 0 (0.0%) |
| 2 Unit Apartments | 24 (28.6%) | 60 (71.4%) |
| 3 or 4 Unit Apartments | 0 (0.0%) | 73 (100.0%) |
| 5 to 9 Unit Apartments | 0 (0.0%) | 10 (100.0%) |
| 10 or more Apartments | 0 (0.0%) | 0 (0.0%) |
| Mobile Home / Other | 1 (100.0%) | 0 (0.0%) |
| Total | 435 (70.6%) | 181 (29.4%) |
Housing Structures by Number of Rooms in Bridgton
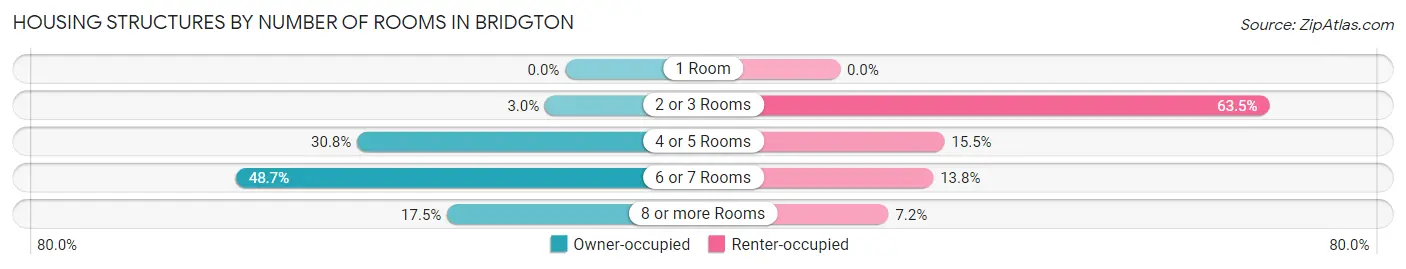
| Number of Rooms | Owner-occupied | Renter-occupied |
| 1 Room | 0 (0.0%) | 0 (0.0%) |
| 2 or 3 Rooms | 13 (3.0%) | 115 (63.5%) |
| 4 or 5 Rooms | 134 (30.8%) | 28 (15.5%) |
| 6 or 7 Rooms | 212 (48.7%) | 25 (13.8%) |
| 8 or more Rooms | 76 (17.5%) | 13 (7.2%) |
| Total | 435 (100.0%) | 181 (100.0%) |
Housing Structure by Heating Type in Bridgton
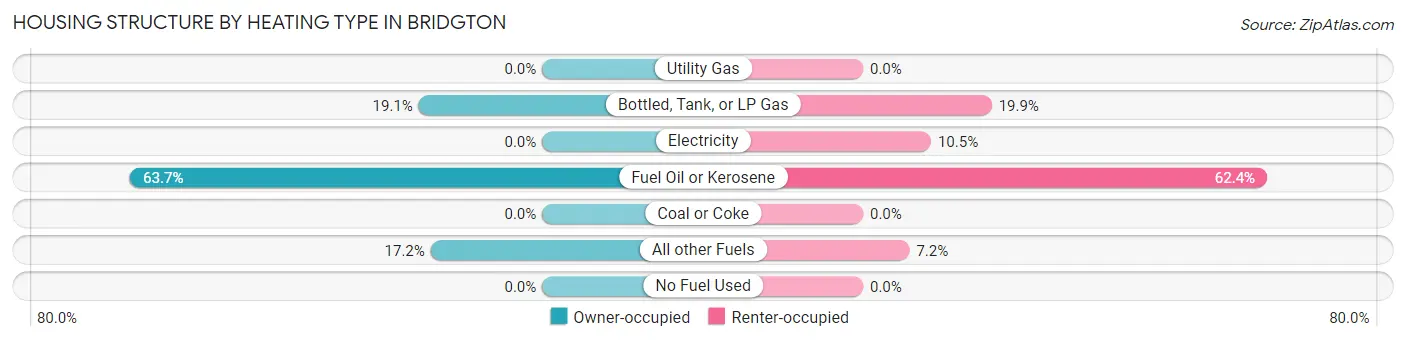
| Heating Type | Owner-occupied | Renter-occupied |
| Utility Gas | 0 (0.0%) | 0 (0.0%) |
| Bottled, Tank, or LP Gas | 83 (19.1%) | 36 (19.9%) |
| Electricity | 0 (0.0%) | 19 (10.5%) |
| Fuel Oil or Kerosene | 277 (63.7%) | 113 (62.4%) |
| Coal or Coke | 0 (0.0%) | 0 (0.0%) |
| All other Fuels | 75 (17.2%) | 13 (7.2%) |
| No Fuel Used | 0 (0.0%) | 0 (0.0%) |
| Total | 435 (100.0%) | 181 (100.0%) |
Household Vehicle Usage in Bridgton
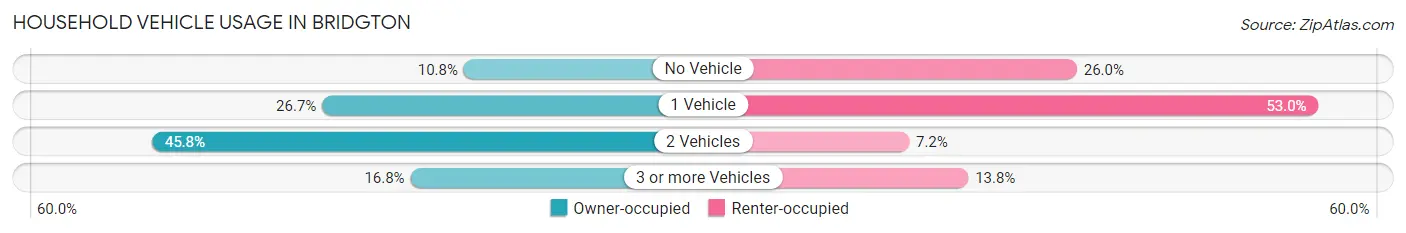
| Vehicles per Household | Owner-occupied | Renter-occupied |
| No Vehicle | 47 (10.8%) | 47 (26.0%) |
| 1 Vehicle | 116 (26.7%) | 96 (53.0%) |
| 2 Vehicles | 199 (45.8%) | 13 (7.2%) |
| 3 or more Vehicles | 73 (16.8%) | 25 (13.8%) |
| Total | 435 (100.0%) | 181 (100.0%) |
Real Estate & Mortgages in Bridgton
Real Estate and Mortgage Overview in Bridgton
| Characteristic | Without Mortgage | With Mortgage |
| Housing Units | 203 | 232 |
| Median Property Value | $205,200 | $232,400 |
| Median Household Income | $57,465 | $20 |
| Monthly Housing Costs | $602 | $17 |
| Real Estate Taxes | $2,608 | $0 |
Property Value by Mortgage Status in Bridgton
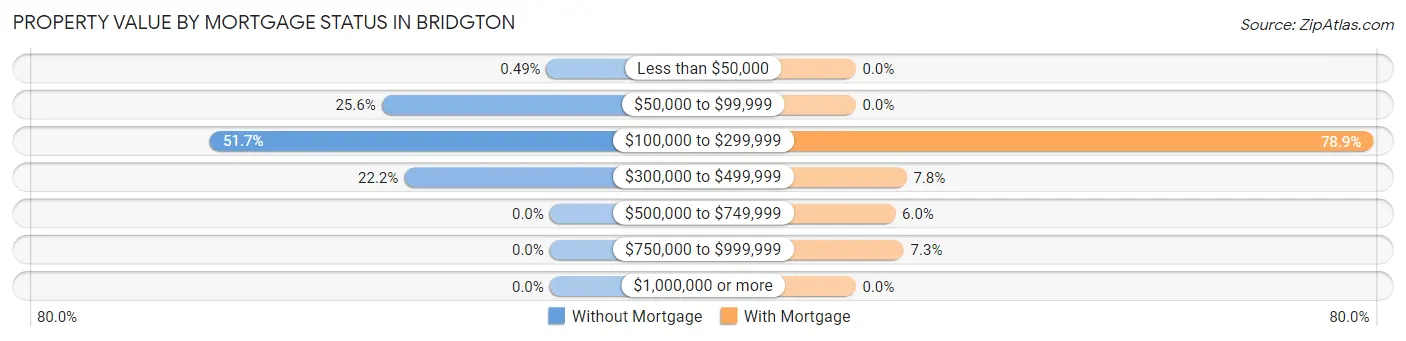
| Property Value | Without Mortgage | With Mortgage |
| Less than $50,000 | 1 (0.5%) | 0 (0.0%) |
| $50,000 to $99,999 | 52 (25.6%) | 0 (0.0%) |
| $100,000 to $299,999 | 105 (51.7%) | 183 (78.9%) |
| $300,000 to $499,999 | 45 (22.2%) | 18 (7.8%) |
| $500,000 to $749,999 | 0 (0.0%) | 14 (6.0%) |
| $750,000 to $999,999 | 0 (0.0%) | 17 (7.3%) |
| $1,000,000 or more | 0 (0.0%) | 0 (0.0%) |
| Total | 203 (100.0%) | 232 (100.0%) |
Household Income by Mortgage Status in Bridgton
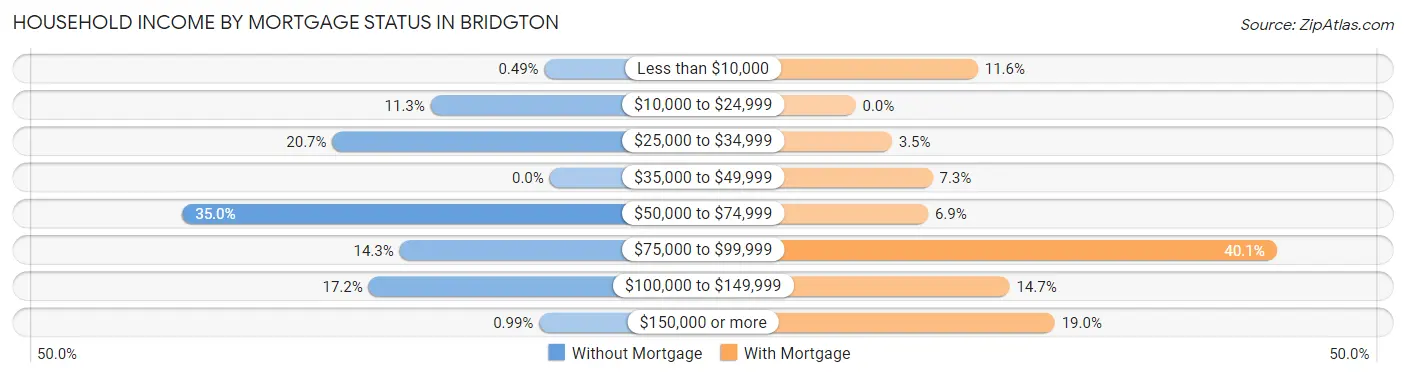
| Household Income | Without Mortgage | With Mortgage |
| Less than $10,000 | 1 (0.5%) | 27 (11.6%) |
| $10,000 to $24,999 | 23 (11.3%) | 0 (0.0%) |
| $25,000 to $34,999 | 42 (20.7%) | 8 (3.5%) |
| $35,000 to $49,999 | 0 (0.0%) | 17 (7.3%) |
| $50,000 to $74,999 | 71 (35.0%) | 16 (6.9%) |
| $75,000 to $99,999 | 29 (14.3%) | 93 (40.1%) |
| $100,000 to $149,999 | 35 (17.2%) | 34 (14.7%) |
| $150,000 or more | 2 (1.0%) | 44 (19.0%) |
| Total | 203 (100.0%) | 232 (100.0%) |
Property Value to Household Income Ratio in Bridgton
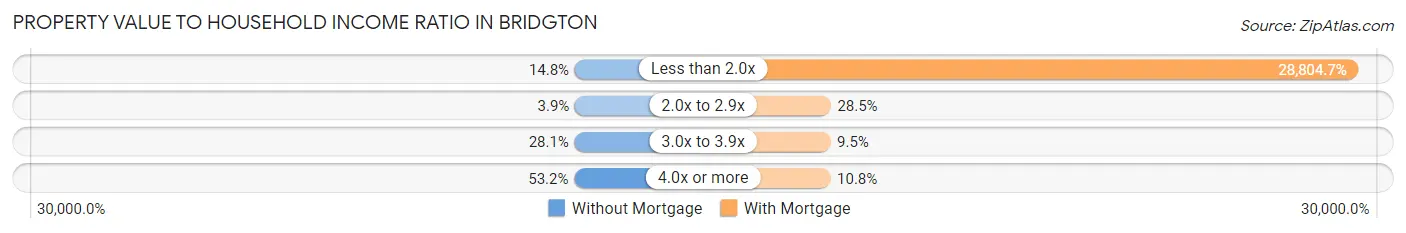
| Value-to-Income Ratio | Without Mortgage | With Mortgage |
| Less than 2.0x | 30 (14.8%) | 66,827 (28,804.7%) |
| 2.0x to 2.9x | 8 (3.9%) | 66 (28.4%) |
| 3.0x to 3.9x | 57 (28.1%) | 22 (9.5%) |
| 4.0x or more | 108 (53.2%) | 25 (10.8%) |
| Total | 203 (100.0%) | 232 (100.0%) |
Real Estate Taxes by Mortgage Status in Bridgton
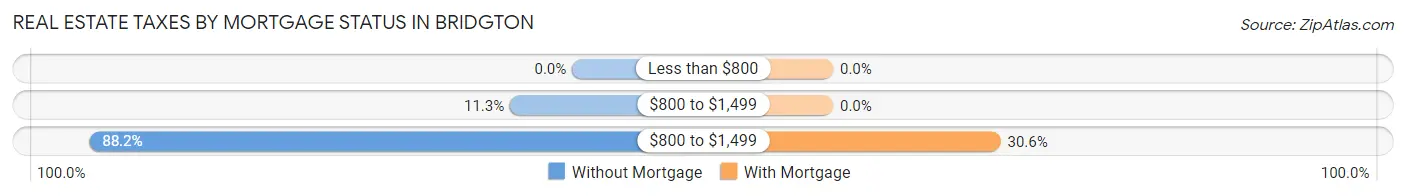
| Property Taxes | Without Mortgage | With Mortgage |
| Less than $800 | 0 (0.0%) | 0 (0.0%) |
| $800 to $1,499 | 23 (11.3%) | 0 (0.0%) |
| $800 to $1,499 | 179 (88.2%) | 71 (30.6%) |
| Total | 203 (100.0%) | 232 (100.0%) |
Health & Disability in Bridgton
Health Insurance Coverage by Age in Bridgton
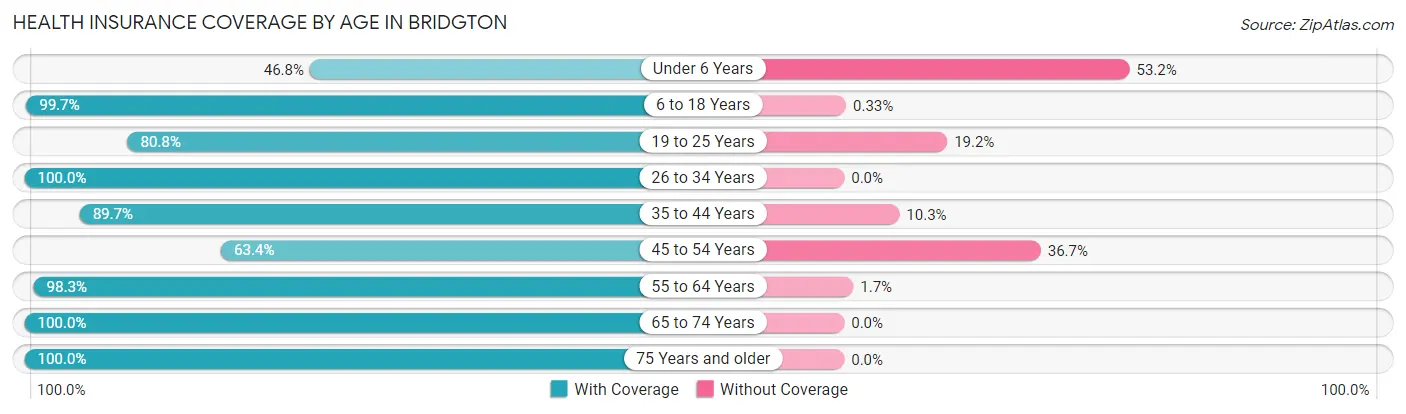
| Age Bracket | With Coverage | Without Coverage |
| Under 6 Years | 22 (46.8%) | 25 (53.2%) |
| 6 to 18 Years | 300 (99.7%) | 1 (0.3%) |
| 19 to 25 Years | 139 (80.8%) | 33 (19.2%) |
| 26 to 34 Years | 108 (100.0%) | 0 (0.0%) |
| 35 to 44 Years | 96 (89.7%) | 11 (10.3%) |
| 45 to 54 Years | 159 (63.3%) | 92 (36.6%) |
| 55 to 64 Years | 175 (98.3%) | 3 (1.7%) |
| 65 to 74 Years | 248 (100.0%) | 0 (0.0%) |
| 75 Years and older | 97 (100.0%) | 0 (0.0%) |
| Total | 1,344 (89.1%) | 165 (10.9%) |
Health Insurance Coverage by Citizenship Status in Bridgton
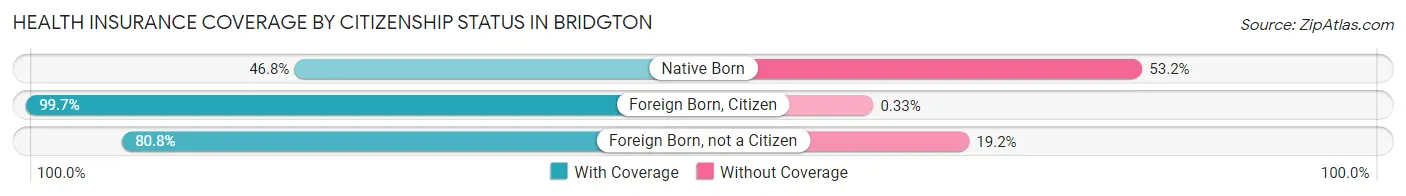
| Citizenship Status | With Coverage | Without Coverage |
| Native Born | 22 (46.8%) | 25 (53.2%) |
| Foreign Born, Citizen | 300 (99.7%) | 1 (0.3%) |
| Foreign Born, not a Citizen | 139 (80.8%) | 33 (19.2%) |
Health Insurance Coverage by Household Income in Bridgton
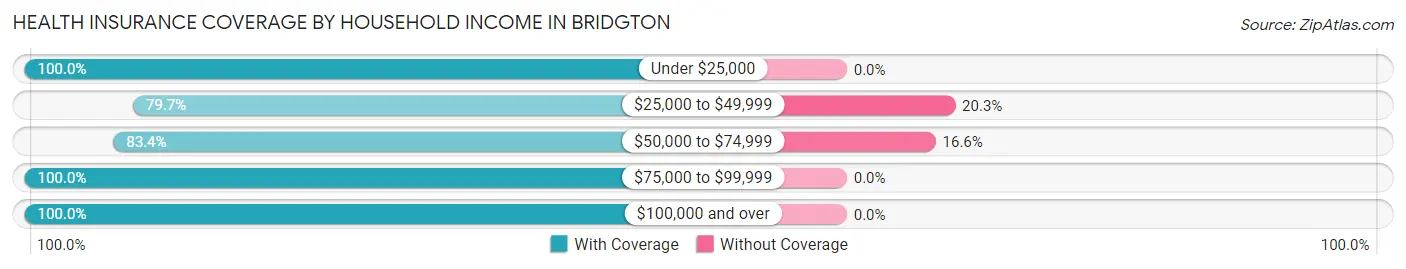
| Household Income | With Coverage | Without Coverage |
| Under $25,000 | 121 (100.0%) | 0 (0.0%) |
| $25,000 to $49,999 | 216 (79.7%) | 55 (20.3%) |
| $50,000 to $74,999 | 531 (83.4%) | 106 (16.6%) |
| $75,000 to $99,999 | 120 (100.0%) | 0 (0.0%) |
| $100,000 and over | 249 (100.0%) | 0 (0.0%) |
Public vs Private Health Insurance Coverage by Age in Bridgton
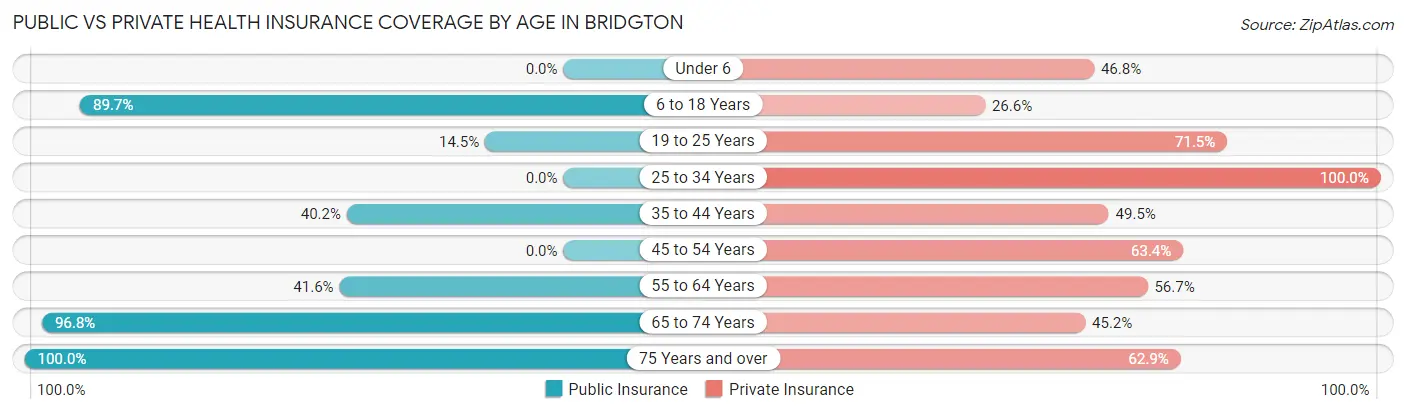
| Age Bracket | Public Insurance | Private Insurance |
| Under 6 | 0 (0.0%) | 22 (46.8%) |
| 6 to 18 Years | 270 (89.7%) | 80 (26.6%) |
| 19 to 25 Years | 25 (14.5%) | 123 (71.5%) |
| 25 to 34 Years | 0 (0.0%) | 108 (100.0%) |
| 35 to 44 Years | 43 (40.2%) | 53 (49.5%) |
| 45 to 54 Years | 0 (0.0%) | 159 (63.3%) |
| 55 to 64 Years | 74 (41.6%) | 101 (56.7%) |
| 65 to 74 Years | 240 (96.8%) | 112 (45.2%) |
| 75 Years and over | 97 (100.0%) | 61 (62.9%) |
| Total | 749 (49.6%) | 819 (54.3%) |
Disability Status by Sex by Age in Bridgton
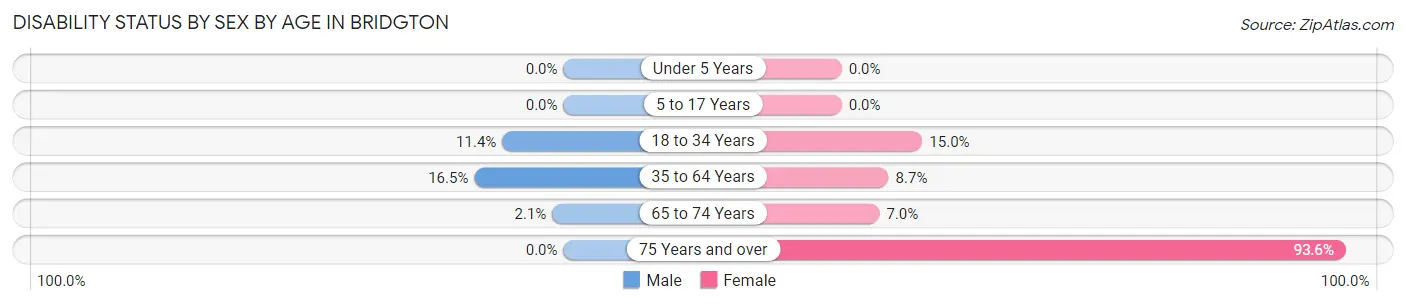
| Age Bracket | Male | Female |
| Under 5 Years | 0 (0.0%) | 0 (0.0%) |
| 5 to 17 Years | 0 (0.0%) | 0 (0.0%) |
| 18 to 34 Years | 25 (11.4%) | 19 (15.0%) |
| 35 to 64 Years | 43 (16.5%) | 24 (8.7%) |
| 65 to 74 Years | 1 (2.1%) | 14 (7.0%) |
| 75 Years and over | 0 (0.0%) | 29 (93.5%) |
Disability Class by Sex by Age in Bridgton
Disability Class: Hearing Difficulty
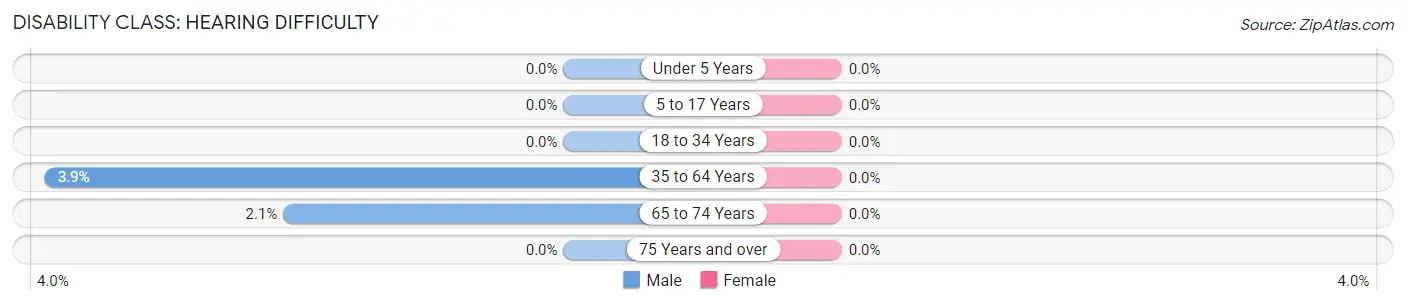
| Age Bracket | Male | Female |
| Under 5 Years | 0 (0.0%) | 0 (0.0%) |
| 5 to 17 Years | 0 (0.0%) | 0 (0.0%) |
| 18 to 34 Years | 0 (0.0%) | 0 (0.0%) |
| 35 to 64 Years | 10 (3.8%) | 0 (0.0%) |
| 65 to 74 Years | 1 (2.1%) | 0 (0.0%) |
| 75 Years and over | 0 (0.0%) | 0 (0.0%) |
Disability Class: Vision Difficulty
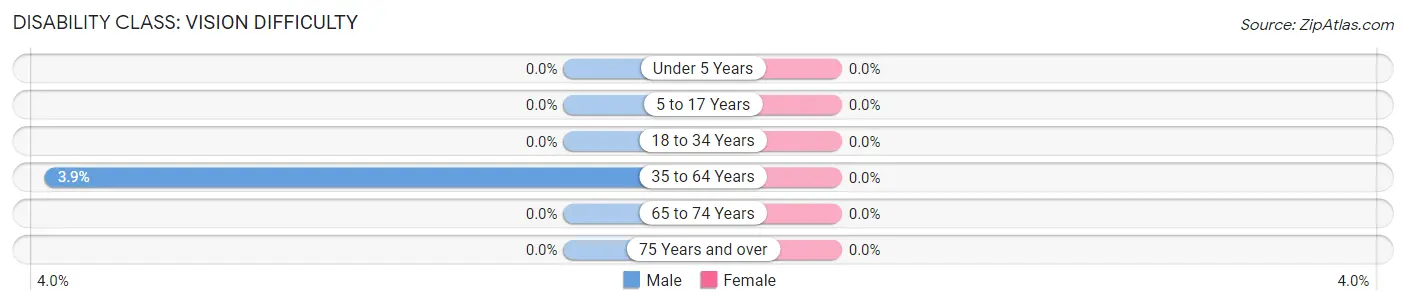
| Age Bracket | Male | Female |
| Under 5 Years | 0 (0.0%) | 0 (0.0%) |
| 5 to 17 Years | 0 (0.0%) | 0 (0.0%) |
| 18 to 34 Years | 0 (0.0%) | 0 (0.0%) |
| 35 to 64 Years | 10 (3.8%) | 0 (0.0%) |
| 65 to 74 Years | 0 (0.0%) | 0 (0.0%) |
| 75 Years and over | 0 (0.0%) | 0 (0.0%) |
Disability Class: Cognitive Difficulty
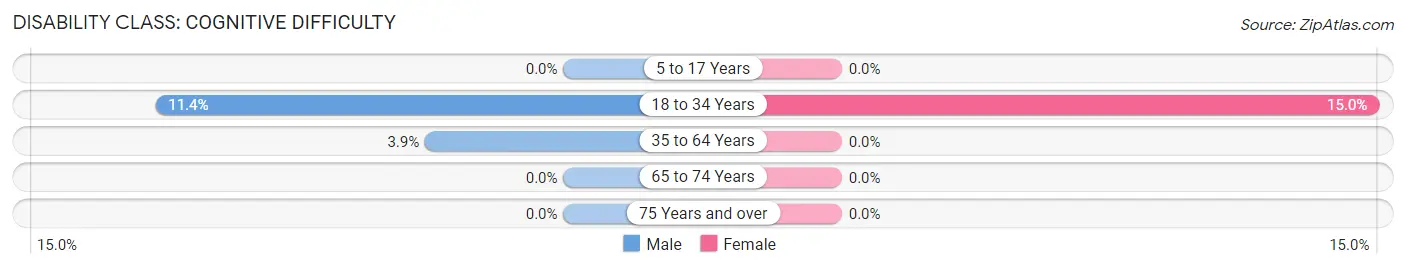
| Age Bracket | Male | Female |
| 5 to 17 Years | 0 (0.0%) | 0 (0.0%) |
| 18 to 34 Years | 25 (11.4%) | 19 (15.0%) |
| 35 to 64 Years | 10 (3.8%) | 0 (0.0%) |
| 65 to 74 Years | 0 (0.0%) | 0 (0.0%) |
| 75 Years and over | 0 (0.0%) | 0 (0.0%) |
Disability Class: Ambulatory Difficulty
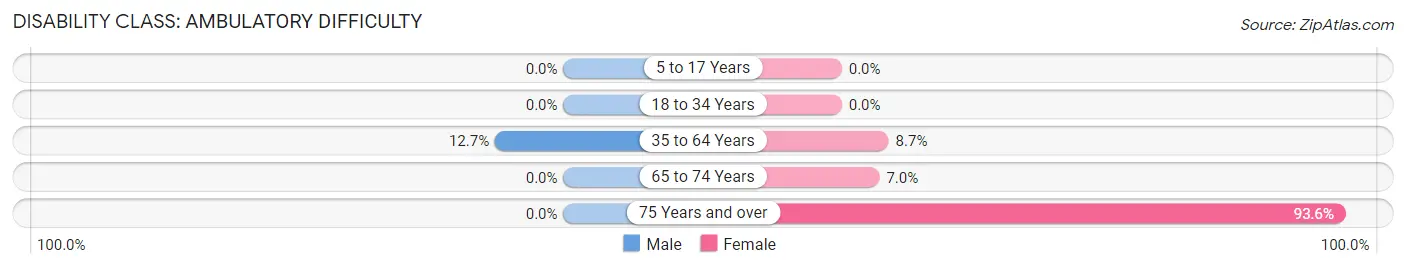
| Age Bracket | Male | Female |
| 5 to 17 Years | 0 (0.0%) | 0 (0.0%) |
| 18 to 34 Years | 0 (0.0%) | 0 (0.0%) |
| 35 to 64 Years | 33 (12.7%) | 24 (8.7%) |
| 65 to 74 Years | 0 (0.0%) | 14 (7.0%) |
| 75 Years and over | 0 (0.0%) | 29 (93.5%) |
Disability Class: Self-Care Difficulty
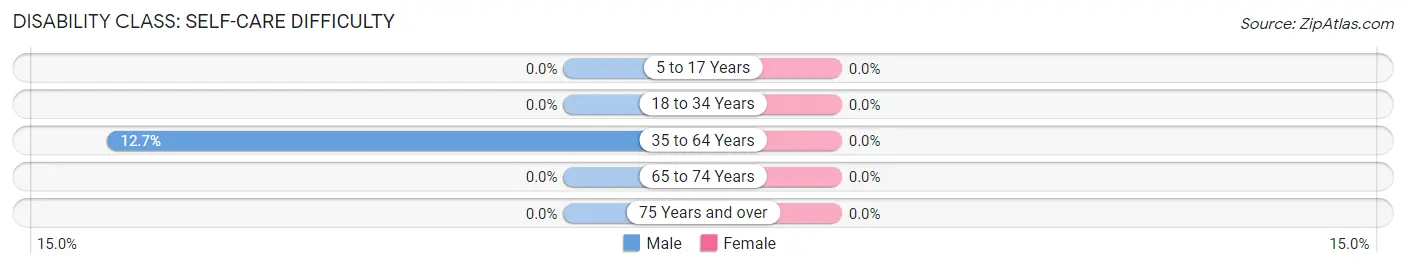
| Age Bracket | Male | Female |
| 5 to 17 Years | 0 (0.0%) | 0 (0.0%) |
| 18 to 34 Years | 0 (0.0%) | 0 (0.0%) |
| 35 to 64 Years | 33 (12.7%) | 0 (0.0%) |
| 65 to 74 Years | 0 (0.0%) | 0 (0.0%) |
| 75 Years and over | 0 (0.0%) | 0 (0.0%) |
Technology Access in Bridgton
Computing Device Access in Bridgton
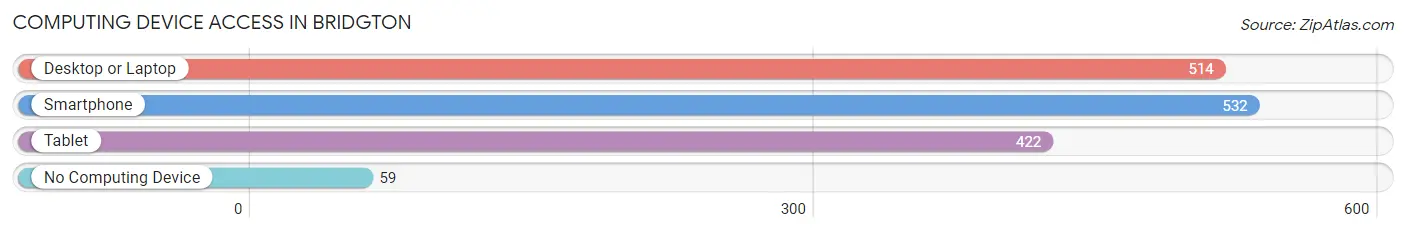
| Device Type | # Households | % Households |
| Desktop or Laptop | 514 | 83.4% |
| Smartphone | 532 | 86.4% |
| Tablet | 422 | 68.5% |
| No Computing Device | 59 | 9.6% |
| Total | 616 | 100.0% |
Internet Access in Bridgton
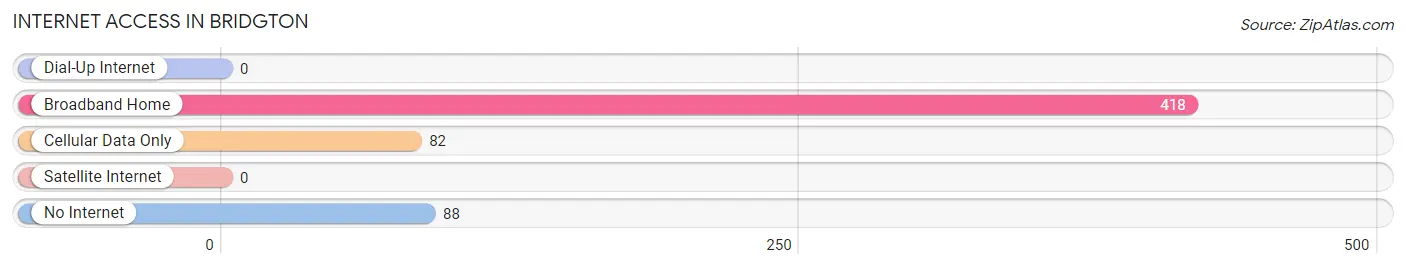
| Internet Type | # Households | % Households |
| Dial-Up Internet | 0 | 0.0% |
| Broadband Home | 418 | 67.9% |
| Cellular Data Only | 82 | 13.3% |
| Satellite Internet | 0 | 0.0% |
| No Internet | 88 | 14.3% |
| Total | 616 | 100.0% |
Bridgton Summary
Bridgton, Maine is a small town located in the western part of the state, in Cumberland County. It is situated on the shores of Long Lake and is part of the Lakes Region of Maine. The town has a population of 5,210 people, according to the 2010 census.
History
Bridgton was first settled in 1768 by a group of settlers from Massachusetts. The town was originally called Pondicherry, after the French city of Pondicherry in India. The name was changed to Bridgton in 1794, after the town of Bridgton in England. The town was incorporated in 1794 and was named after the English town because of its similarity in size and location.
The town was an important stop on the stagecoach route between Portland and Fryeburg. The town was also a major lumbering center in the 19th century. The town was home to several sawmills and gristmills, as well as a tannery.
Geography
Bridgton is located in western Maine, in Cumberland County. It is situated on the shores of Long Lake, which is part of the Lakes Region of Maine. The town is bordered by the towns of Harrison to the north, Naples to the east, Denmark to the south, and Sebago to the west.
The town has a total area of 28.2 square miles, of which 26.2 square miles is land and 2.0 square miles is water. The highest point in the town is Bald Pate Mountain, which has an elevation of 1,065 feet.
Economy
Bridgton’s economy is largely based on tourism. The town is home to several resorts and campgrounds, as well as a number of restaurants and shops. The town is also home to several small businesses, including a lumber mill, a printing company, and a furniture store.
The town is also home to Bridgton Hospital, a 25-bed acute care facility. The hospital is part of the Central Maine Healthcare system.
Demographics
According to the 2010 census, Bridgton has a population of 5,210 people. The racial makeup of the town is 95.3% White, 0.7% African American, 0.4% Native American, 0.7% Asian, 0.1% Pacific Islander, 0.7% from other races, and 2.1% from two or more races. Hispanic or Latino of any race were 1.7% of the population.
The median income for a household in the town was $41,944, and the median income for a family was $50,917. The per capita income for the town was $22,845. About 8.3% of families and 11.2% of the population were below the poverty line, including 15.2% of those under age 18 and 8.2% of those age 65 or over.
Common Questions
What is Per Capita Income in Bridgton?
Per Capita income in Bridgton is $26,952.
What is the Median Family Income in Bridgton?
Median Family Income in Bridgton is $66,357.
What is the Median Household income in Bridgton?
Median Household Income in Bridgton is $56,475.
What is Income or Wage Gap in Bridgton?
Income or Wage Gap in Bridgton is 67.8%.
Women in Bridgton earn 32.2 cents for every dollar earned by a man.
What is Inequality or Gini Index in Bridgton?
Inequality or Gini Index in Bridgton is 0.34.
What is the Total Population of Bridgton?
Total Population of Bridgton is 1,514.
What is the Total Male Population of Bridgton?
Total Male Population of Bridgton is 800.
What is the Total Female Population of Bridgton?
Total Female Population of Bridgton is 714.
What is the Ratio of Males per 100 Females in Bridgton?
There are 112.04 Males per 100 Females in Bridgton.
What is the Ratio of Females per 100 Males in Bridgton?
There are 89.25 Females per 100 Males in Bridgton.
What is the Median Population Age in Bridgton?
Median Population Age in Bridgton is 47.2 Years.
What is the Average Family Size in Bridgton
Average Family Size in Bridgton is 2.7 People.
What is the Average Household Size in Bridgton
Average Household Size in Bridgton is 2.3 People.
How Large is the Labor Force in Bridgton?
There are 642 People in the Labor Forcein in Bridgton.
What is the Percentage of People in the Labor Force in Bridgton?
47.9% of People are in the Labor Force in Bridgton.
What is the Unemployment Rate in Bridgton?
Unemployment Rate in Bridgton is 8.4%.