Farmington, ME Map & Demographics
Farmington Map
Farmington Overview
$26,313
PER CAPITA INCOME
$82,279
AVG FAMILY INCOME
$40,350
AVG HOUSEHOLD INCOME
66.3%
WAGE / INCOME GAP [ % ]
33.7¢/ $1
WAGE / INCOME GAP [ $ ]
0.45
INEQUALITY / GINI INDEX
4,318
TOTAL POPULATION
1,849
MALE POPULATION
2,469
FEMALE POPULATION
74.89
MALES / 100 FEMALES
133.53
FEMALES / 100 MALES
35.4
MEDIAN AGE
2.5
AVG FAMILY SIZE
2.0
AVG HOUSEHOLD SIZE
2,167
LABOR FORCE [ PEOPLE ]
53.3%
PERCENT IN LABOR FORCE
4.4%
UNEMPLOYMENT RATE
Farmington Zip Codes
Farmington Area Codes
Income in Farmington
Income Overview in Farmington
Per Capita Income in Farmington is $26,313, while median incomes of families and households are $82,279 and $40,350 respectively.
| Characteristic | Number | Measure |
| Per Capita Income | 4,318 | $26,313 |
| Median Family Income | 583 | $82,279 |
| Mean Family Income | 583 | $93,508 |
| Median Household Income | 1,715 | $40,350 |
| Mean Household Income | 1,715 | $59,219 |
| Income Deficit | 583 | $0 |
| Wage / Income Gap (%) | 4,318 | 66.30% |
| Wage / Income Gap ($) | 4,318 | 33.70¢ per $1 |
| Gini / Inequality Index | 4,318 | 0.45 |
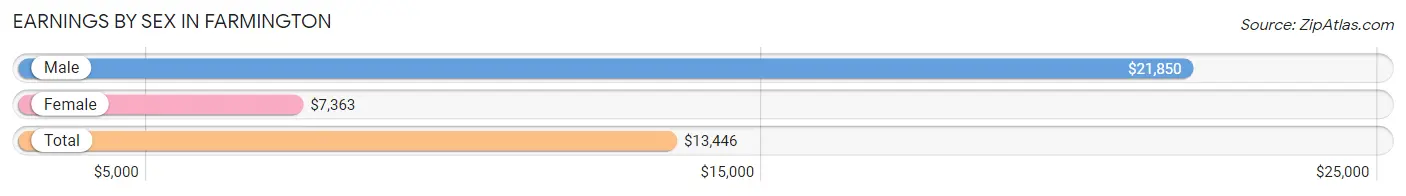
Earnings by Sex in Farmington
Average Earnings in Farmington are $13,446, $21,850 for men and $7,363 for women, a difference of 66.3%.
| Sex | Number | Average Earnings |
| Male | 1,293 (48.1%) | $21,850 |
| Female | 1,395 (51.9%) | $7,363 |
| Total | 2,688 (100.0%) | $13,446 |
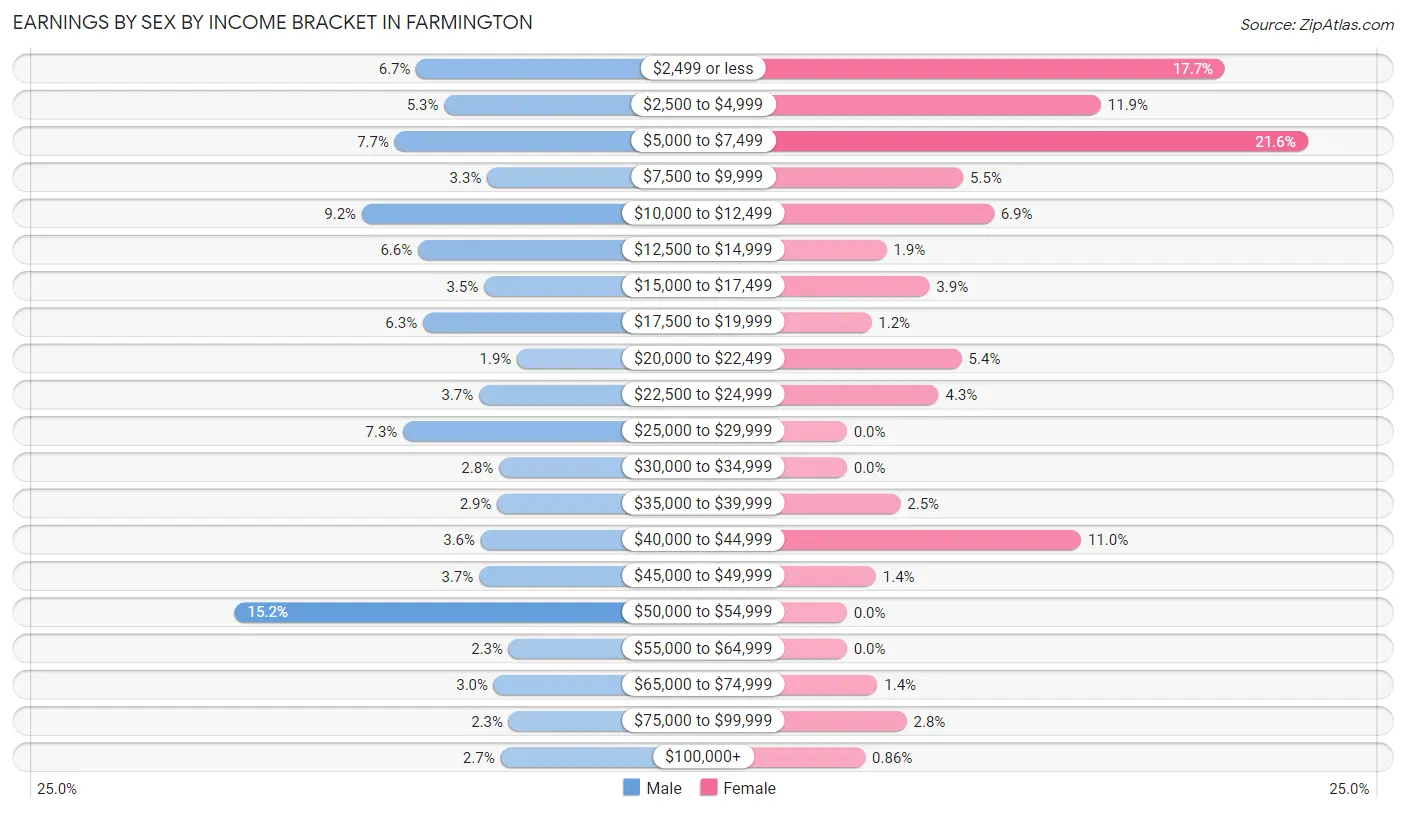
Earnings by Sex by Income Bracket in Farmington
The most common earnings brackets in Farmington are $50,000 to $54,999 for men (196 | 15.2%) and $5,000 to $7,499 for women (301 | 21.6%).
| Income | Male | Female |
| $2,499 or less | 86 (6.7%) | 247 (17.7%) |
| $2,500 to $4,999 | 69 (5.3%) | 166 (11.9%) |
| $5,000 to $7,499 | 99 (7.7%) | 301 (21.6%) |
| $7,500 to $9,999 | 43 (3.3%) | 76 (5.4%) |
| $10,000 to $12,499 | 119 (9.2%) | 96 (6.9%) |
| $12,500 to $14,999 | 85 (6.6%) | 26 (1.9%) |
| $15,000 to $17,499 | 45 (3.5%) | 54 (3.9%) |
| $17,500 to $19,999 | 82 (6.3%) | 16 (1.1%) |
| $20,000 to $22,499 | 25 (1.9%) | 75 (5.4%) |
| $22,500 to $24,999 | 48 (3.7%) | 60 (4.3%) |
| $25,000 to $29,999 | 94 (7.3%) | 0 (0.0%) |
| $30,000 to $34,999 | 36 (2.8%) | 0 (0.0%) |
| $35,000 to $39,999 | 37 (2.9%) | 35 (2.5%) |
| $40,000 to $44,999 | 47 (3.6%) | 153 (11.0%) |
| $45,000 to $49,999 | 48 (3.7%) | 19 (1.4%) |
| $50,000 to $54,999 | 196 (15.2%) | 0 (0.0%) |
| $55,000 to $64,999 | 30 (2.3%) | 0 (0.0%) |
| $65,000 to $74,999 | 39 (3.0%) | 20 (1.4%) |
| $75,000 to $99,999 | 30 (2.3%) | 39 (2.8%) |
| $100,000+ | 35 (2.7%) | 12 (0.9%) |
| Total | 1,293 (100.0%) | 1,395 (100.0%) |
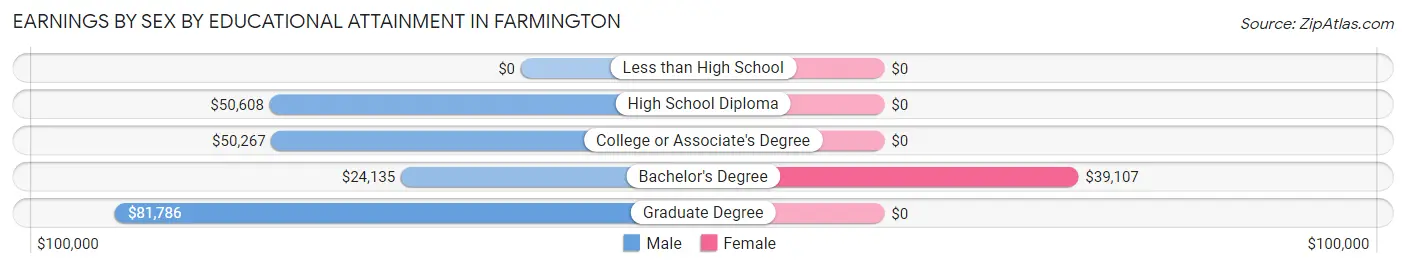
Earnings by Sex by Educational Attainment in Farmington
| Educational Attainment | Male Income | Female Income |
| Less than High School | - | - |
| High School Diploma | $50,608 | $0 |
| College or Associate's Degree | $50,267 | $0 |
| Bachelor's Degree | $24,135 | $39,107 |
| Graduate Degree | $81,786 | $0 |
| Total | $44,545 | $0 |
Family Income in Farmington
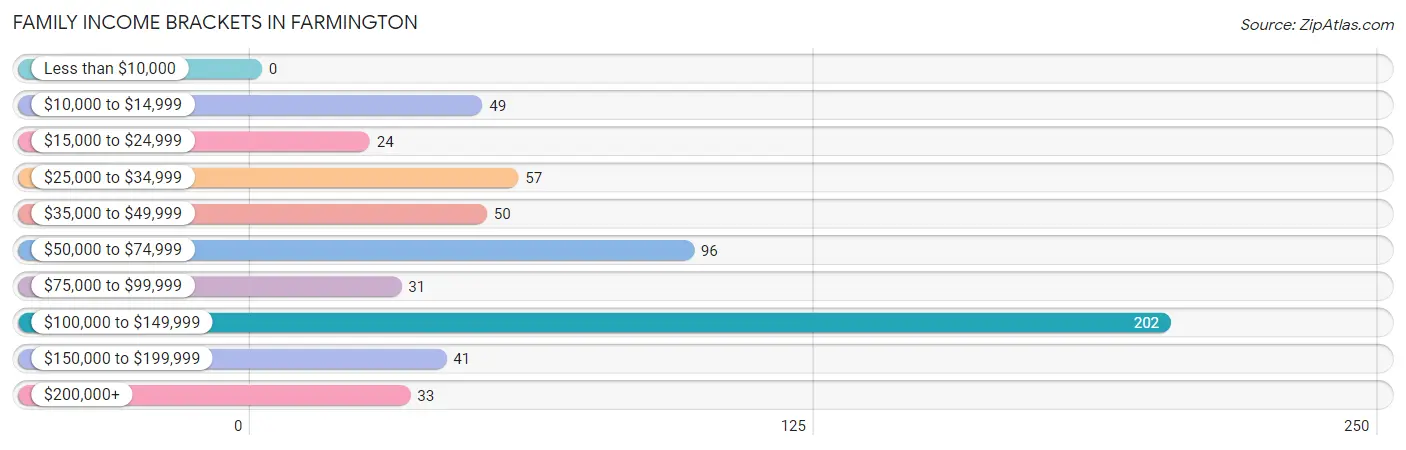
Family Income Brackets in Farmington
According to the Farmington family income data, there are 202 families falling into the $100,000 to $149,999 income range, which is the most common income bracket and makes up 34.6% of all families.
| Income Bracket | # Families | % Families |
| Less than $10,000 | 0 | 0.0% |
| $10,000 to $14,999 | 49 | 8.4% |
| $15,000 to $24,999 | 24 | 4.1% |
| $25,000 to $34,999 | 57 | 9.8% |
| $35,000 to $49,999 | 50 | 8.6% |
| $50,000 to $74,999 | 96 | 16.5% |
| $75,000 to $99,999 | 31 | 5.3% |
| $100,000 to $149,999 | 202 | 34.6% |
| $150,000 to $199,999 | 41 | 7.0% |
| $200,000+ | 33 | 5.7% |
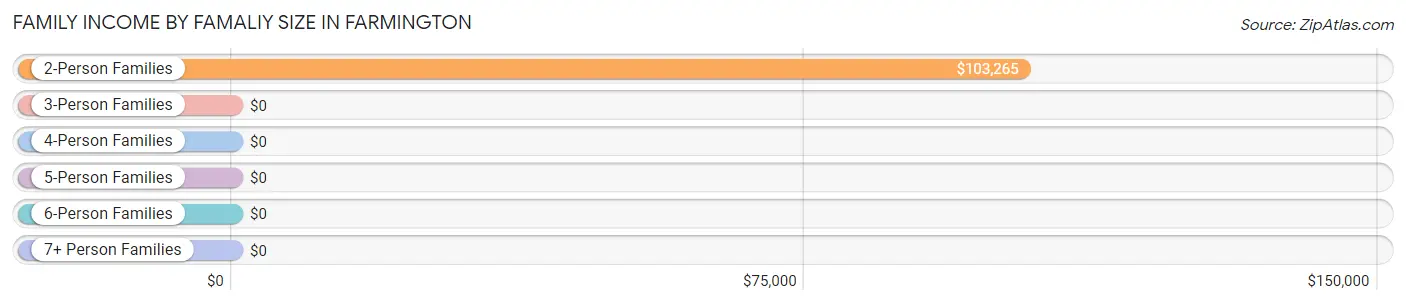
Family Income by Famaliy Size in Farmington
2-person families (428 | 73.4%) account for the highest median family income in Farmington with $103,265 per family, while 2-person families (428 | 73.4%) have the highest median income of $51,632 per family member.
| Income Bracket | # Families | Median Income |
| 2-Person Families | 428 (73.4%) | $103,265 |
| 3-Person Families | 106 (18.2%) | $0 |
| 4-Person Families | 40 (6.9%) | $0 |
| 5-Person Families | 9 (1.5%) | $0 |
| 6-Person Families | 0 (0.0%) | $0 |
| 7+ Person Families | 0 (0.0%) | $0 |
| Total | 583 (100.0%) | $82,279 |
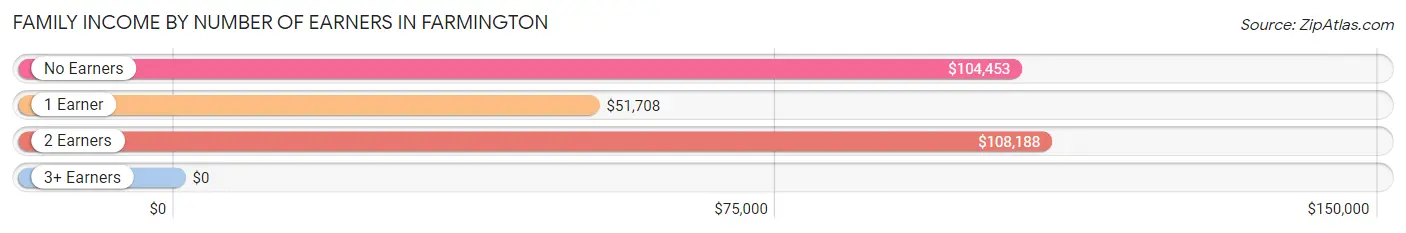
Family Income by Number of Earners in Farmington
| Number of Earners | # Families | Median Income |
| No Earners | 67 (11.5%) | $104,453 |
| 1 Earner | 229 (39.3%) | $51,708 |
| 2 Earners | 287 (49.2%) | $108,188 |
| 3+ Earners | 0 (0.0%) | $0 |
| Total | 583 (100.0%) | $82,279 |
Household Income in Farmington
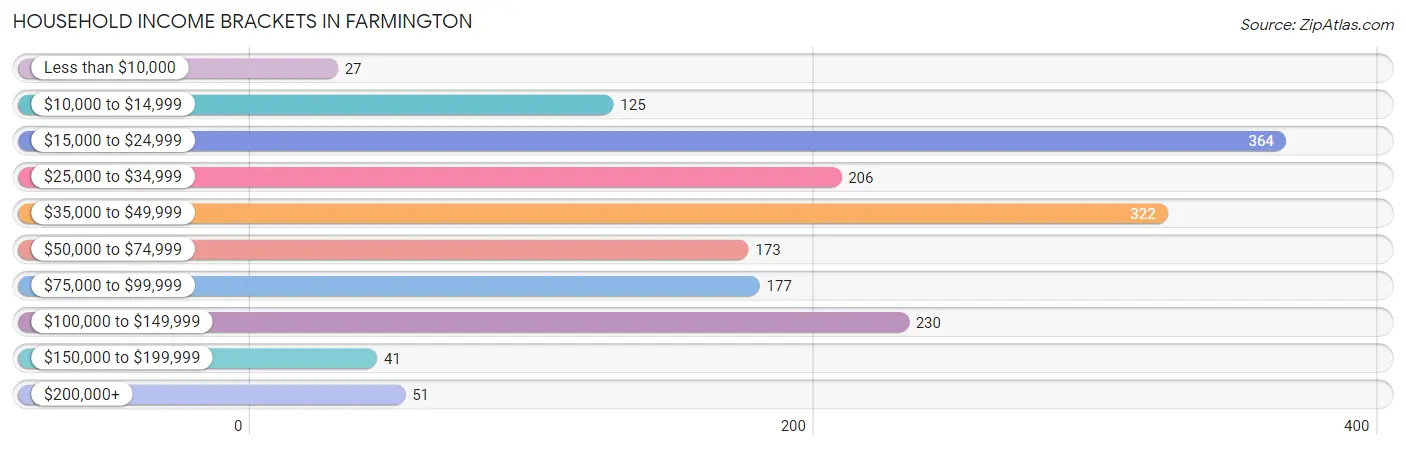
Household Income Brackets in Farmington
With 364 households falling in the category, the $15,000 to $24,999 income range is the most frequent in Farmington, accounting for 21.2% of all households. In contrast, only 27 households (1.6%) fall into the less than $10,000 income bracket, making it the least populous group.
| Income Bracket | # Households | % Households |
| Less than $10,000 | 27 | 1.6% |
| $10,000 to $14,999 | 125 | 7.3% |
| $15,000 to $24,999 | 364 | 21.2% |
| $25,000 to $34,999 | 206 | 12.0% |
| $35,000 to $49,999 | 322 | 18.8% |
| $50,000 to $74,999 | 173 | 10.1% |
| $75,000 to $99,999 | 177 | 10.3% |
| $100,000 to $149,999 | 230 | 13.4% |
| $150,000 to $199,999 | 41 | 2.4% |
| $200,000+ | 51 | 3.0% |
Household Income by Householder Age in Farmington
The median household income in Farmington is $40,350, with the highest median household income of $41,725 found in the 45 to 64 years age bracket for the primary householder. A total of 471 households (27.5%) fall into this category. Meanwhile, the 65+ years age bracket for the primary householder has the lowest median household income of $0, with 625 households (36.4%) in this group.
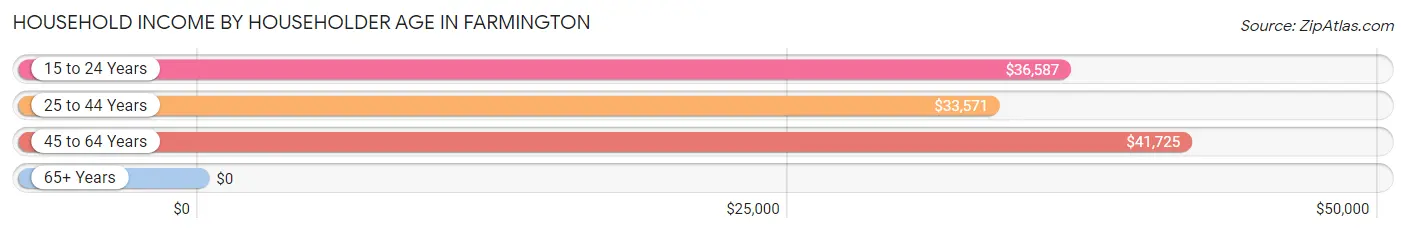
| Income Bracket | # Households | Median Income |
| 15 to 24 Years | 327 (19.1%) | $36,587 |
| 25 to 44 Years | 292 (17.0%) | $33,571 |
| 45 to 64 Years | 471 (27.5%) | $41,725 |
| 65+ Years | 625 (36.4%) | $0 |
| Total | 1,715 (100.0%) | $40,350 |
Poverty in Farmington
Income Below Poverty by Sex and Age in Farmington
With 14.1% poverty level for males and 32.5% for females among the residents of Farmington, under 5 year old males and under 5 year old females are the most vulnerable to poverty, with 50 males (83.3%) and 49 females (100.0%) in their respective age groups living below the poverty level.
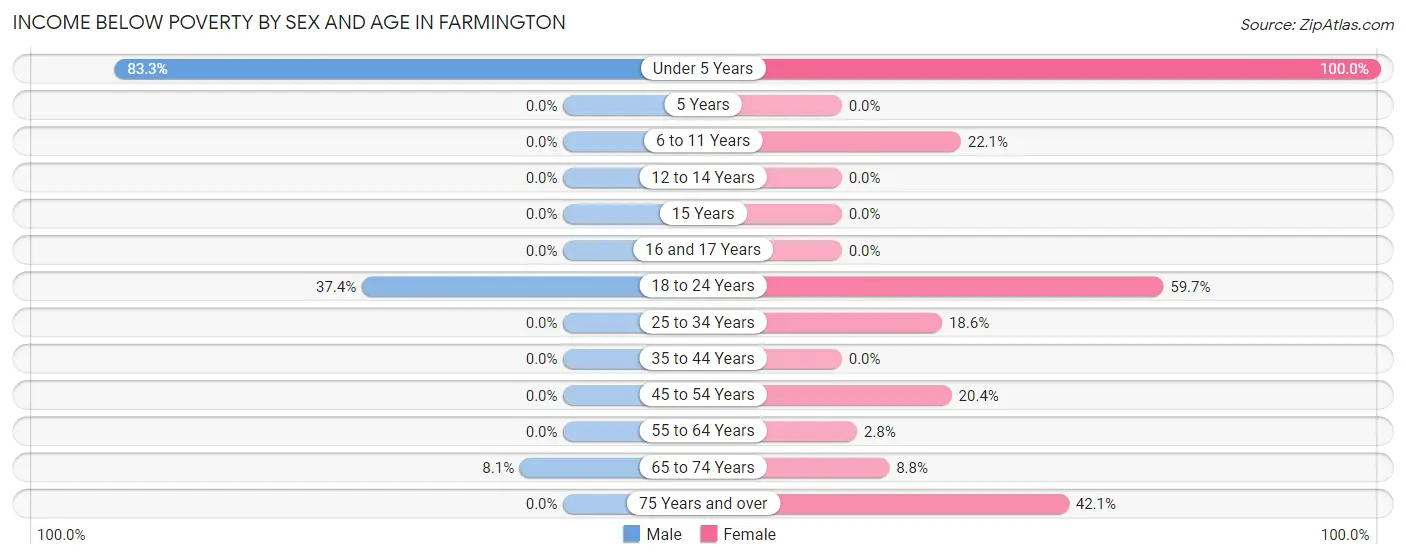
| Age Bracket | Male | Female |
| Under 5 Years | 50 (83.3%) | 49 (100.0%) |
| 5 Years | 0 (0.0%) | 0 (0.0%) |
| 6 to 11 Years | 0 (0.0%) | 19 (22.1%) |
| 12 to 14 Years | 0 (0.0%) | 0 (0.0%) |
| 15 Years | 0 (0.0%) | 0 (0.0%) |
| 16 and 17 Years | 0 (0.0%) | 0 (0.0%) |
| 18 to 24 Years | 142 (37.4%) | 256 (59.7%) |
| 25 to 34 Years | 0 (0.0%) | 24 (18.6%) |
| 35 to 44 Years | 0 (0.0%) | 0 (0.0%) |
| 45 to 54 Years | 0 (0.0%) | 21 (20.4%) |
| 55 to 64 Years | 0 (0.0%) | 8 (2.8%) |
| 65 to 74 Years | 19 (8.1%) | 19 (8.8%) |
| 75 Years and over | 0 (0.0%) | 228 (42.1%) |
| Total | 211 (14.1%) | 624 (32.5%) |
Income Above Poverty by Sex and Age in Farmington
According to the poverty statistics in Farmington, males aged 6 to 11 years and females aged 35 to 44 years are the age groups that are most secure financially, with 100.0% of males and 100.0% of females in these age groups living above the poverty line.
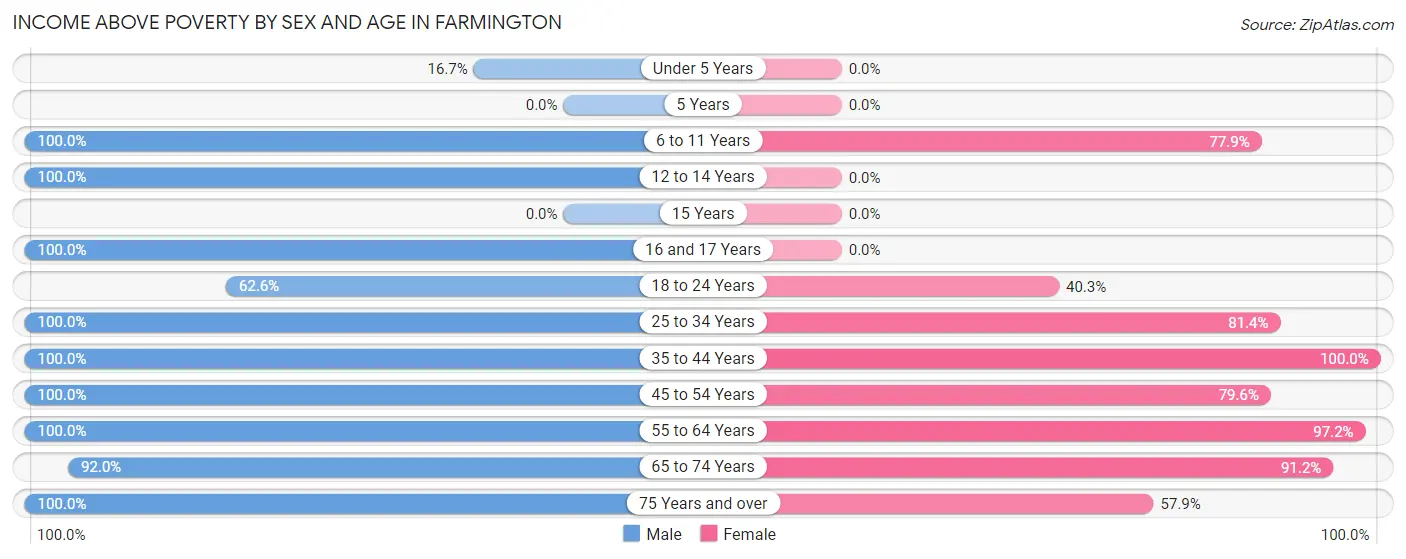
| Age Bracket | Male | Female |
| Under 5 Years | 10 (16.7%) | 0 (0.0%) |
| 5 Years | 0 (0.0%) | 0 (0.0%) |
| 6 to 11 Years | 45 (100.0%) | 67 (77.9%) |
| 12 to 14 Years | 12 (100.0%) | 0 (0.0%) |
| 15 Years | 0 (0.0%) | 0 (0.0%) |
| 16 and 17 Years | 11 (100.0%) | 0 (0.0%) |
| 18 to 24 Years | 238 (62.6%) | 173 (40.3%) |
| 25 to 34 Years | 131 (100.0%) | 105 (81.4%) |
| 35 to 44 Years | 87 (100.0%) | 84 (100.0%) |
| 45 to 54 Years | 68 (100.0%) | 82 (79.6%) |
| 55 to 64 Years | 241 (100.0%) | 276 (97.2%) |
| 65 to 74 Years | 217 (91.9%) | 197 (91.2%) |
| 75 Years and over | 224 (100.0%) | 313 (57.9%) |
| Total | 1,284 (85.9%) | 1,297 (67.5%) |
Income Below Poverty Among Married-Couple Families in Farmington
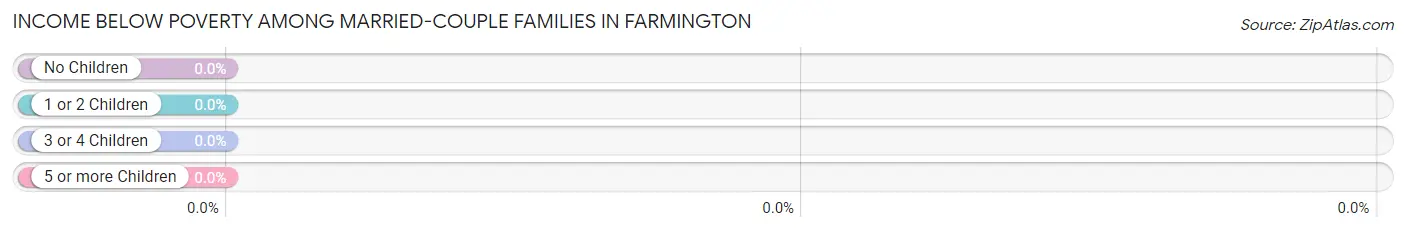
| Children | Above Poverty | Below Poverty |
| No Children | 388 (100.0%) | 0 (0.0%) |
| 1 or 2 Children | 50 (100.0%) | 0 (0.0%) |
| 3 or 4 Children | 0 (0.0%) | 0 (0.0%) |
| 5 or more Children | 0 (0.0%) | 0 (0.0%) |
| Total | 438 (100.0%) | 0 (0.0%) |
Income Below Poverty Among Single-Parent Households in Farmington
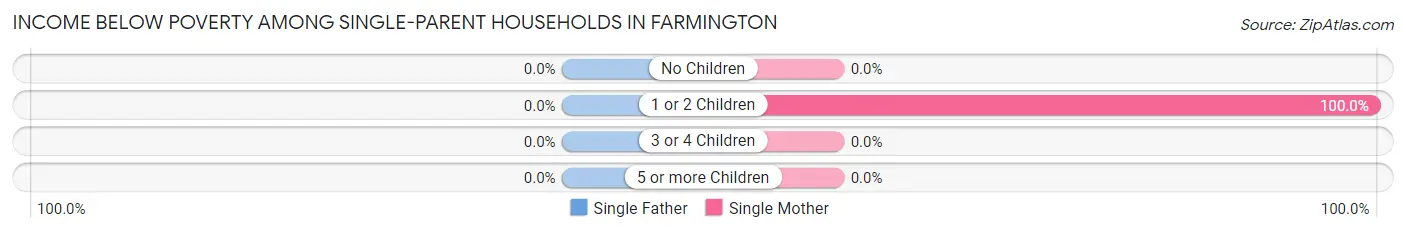
| Children | Single Father | Single Mother |
| No Children | 0 (0.0%) | 0 (0.0%) |
| 1 or 2 Children | 0 (0.0%) | 73 (100.0%) |
| 3 or 4 Children | 0 (0.0%) | 0 (0.0%) |
| 5 or more Children | 0 (0.0%) | 0 (0.0%) |
| Total | 0 (0.0%) | 73 (50.3%) |
Income Below Poverty Among Married-Couple vs Single-Parent Households in Farmington
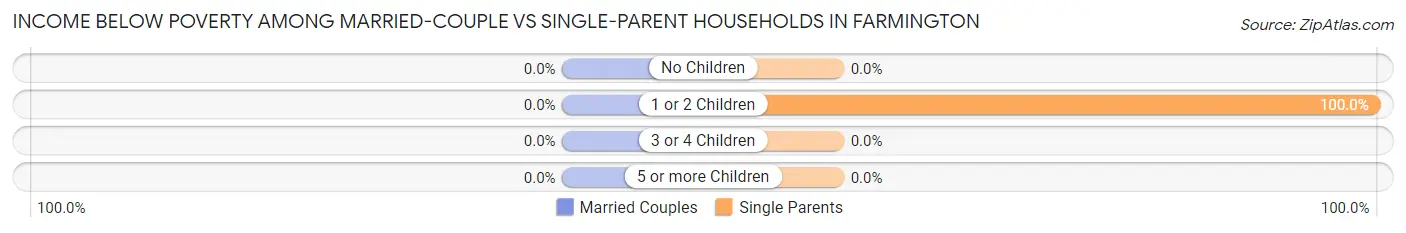
| Children | Married-Couple Families | Single-Parent Households |
| No Children | 0 (0.0%) | 0 (0.0%) |
| 1 or 2 Children | 0 (0.0%) | 73 (100.0%) |
| 3 or 4 Children | 0 (0.0%) | 0 (0.0%) |
| 5 or more Children | 0 (0.0%) | 0 (0.0%) |
| Total | 0 (0.0%) | 73 (50.3%) |
Race in Farmington
The most populous races in Farmington are White / Caucasian (3,936 | 91.1%), Two or more Races (255 | 5.9%), and Black / African American (65 | 1.5%).
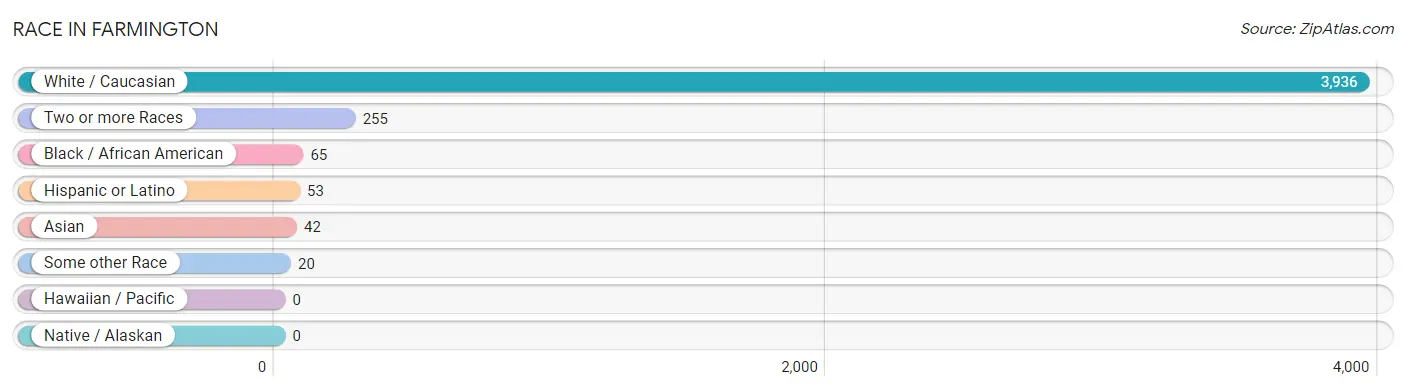
| Race | # Population | % Population |
| Asian | 42 | 1.0% |
| Black / African American | 65 | 1.5% |
| Hawaiian / Pacific | 0 | 0.0% |
| Hispanic or Latino | 53 | 1.2% |
| Native / Alaskan | 0 | 0.0% |
| White / Caucasian | 3,936 | 91.1% |
| Two or more Races | 255 | 5.9% |
| Some other Race | 20 | 0.5% |
| Total | 4,318 | 100.0% |
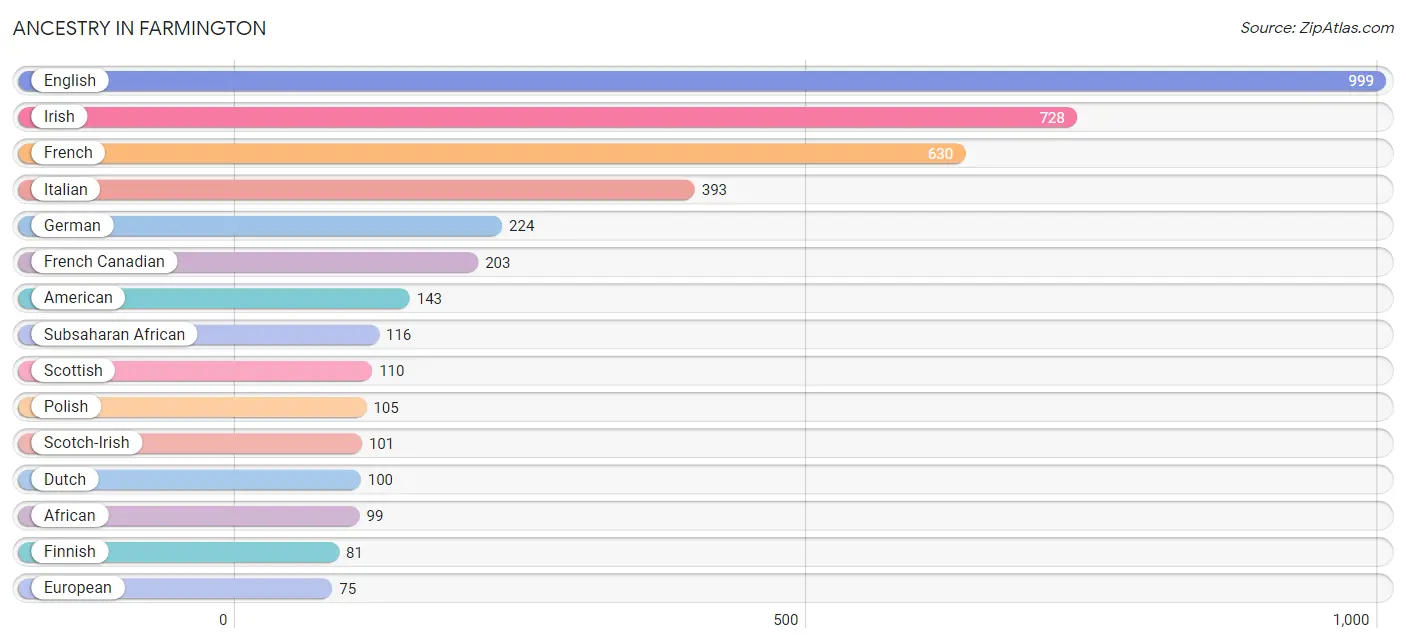
Ancestry in Farmington
The most populous ancestries reported in Farmington are English (999 | 23.1%), Irish (728 | 16.9%), French (630 | 14.6%), Italian (393 | 9.1%), and German (224 | 5.2%), together accounting for 68.9% of all Farmington residents.
| Ancestry | # Population | % Population |
| Afghan | 4 | 0.1% |
| African | 99 | 2.3% |
| American | 143 | 3.3% |
| Arab | 2 | 0.1% |
| Argentinean | 11 | 0.3% |
| Austrian | 38 | 0.9% |
| Barbadian | 3 | 0.1% |
| Bhutanese | 3 | 0.1% |
| British | 4 | 0.1% |
| Central American | 3 | 0.1% |
| Chippewa | 5 | 0.1% |
| Czech | 7 | 0.2% |
| Dutch | 100 | 2.3% |
| English | 999 | 23.1% |
| European | 75 | 1.7% |
| Filipino | 7 | 0.2% |
| Finnish | 81 | 1.9% |
| French | 630 | 14.6% |
| French Canadian | 203 | 4.7% |
| German | 224 | 5.2% |
| Greek | 50 | 1.2% |
| Indian (Asian) | 29 | 0.7% |
| Iraqi | 2 | 0.1% |
| Irish | 728 | 16.9% |
| Italian | 393 | 9.1% |
| Mexican | 3 | 0.1% |
| Northern European | 8 | 0.2% |
| Norwegian | 53 | 1.2% |
| Panamanian | 3 | 0.1% |
| Polish | 105 | 2.4% |
| Portuguese | 3 | 0.1% |
| Russian | 15 | 0.4% |
| Scandinavian | 10 | 0.2% |
| Scotch-Irish | 101 | 2.3% |
| Scottish | 110 | 2.5% |
| Senegalese | 4 | 0.1% |
| South American | 11 | 0.3% |
| Spaniard | 36 | 0.8% |
| Subsaharan African | 116 | 2.7% |
| Swedish | 47 | 1.1% |
| Thai | 2 | 0.1% |
| Welsh | 9 | 0.2% | View All 42 Rows |
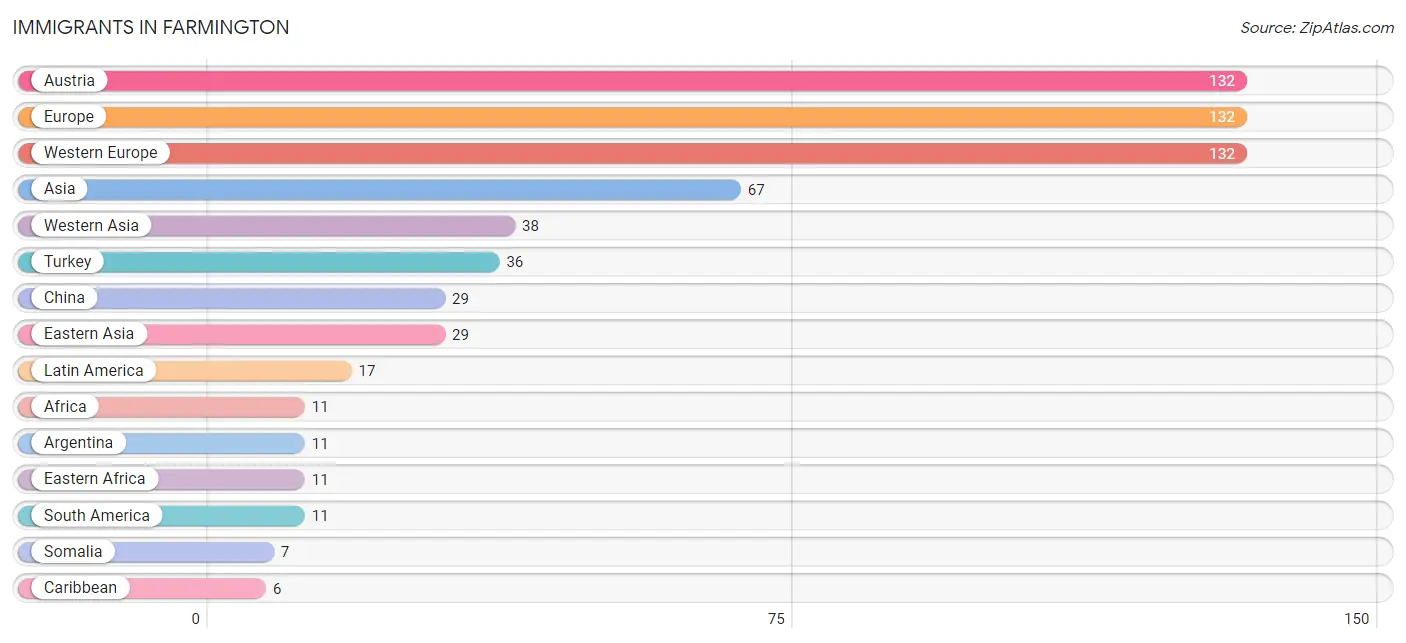
Immigrants in Farmington
The most numerous immigrant groups reported in Farmington came from Austria (132 | 3.1%), Europe (132 | 3.1%), Western Europe (132 | 3.1%), Asia (67 | 1.5%), and Western Asia (38 | 0.9%), together accounting for 11.6% of all Farmington residents.
| Immigration Origin | # Population | % Population |
| Africa | 11 | 0.3% |
| Argentina | 11 | 0.3% |
| Asia | 67 | 1.5% |
| Austria | 132 | 3.1% |
| Caribbean | 6 | 0.1% |
| China | 29 | 0.7% |
| Eastern Africa | 11 | 0.3% |
| Eastern Asia | 29 | 0.7% |
| Europe | 132 | 3.1% |
| Jamaica | 6 | 0.1% |
| Jordan | 2 | 0.1% |
| Latin America | 17 | 0.4% |
| Somalia | 7 | 0.2% |
| South America | 11 | 0.3% |
| Turkey | 36 | 0.8% |
| Western Asia | 38 | 0.9% |
| Western Europe | 132 | 3.1% | View All 17 Rows |
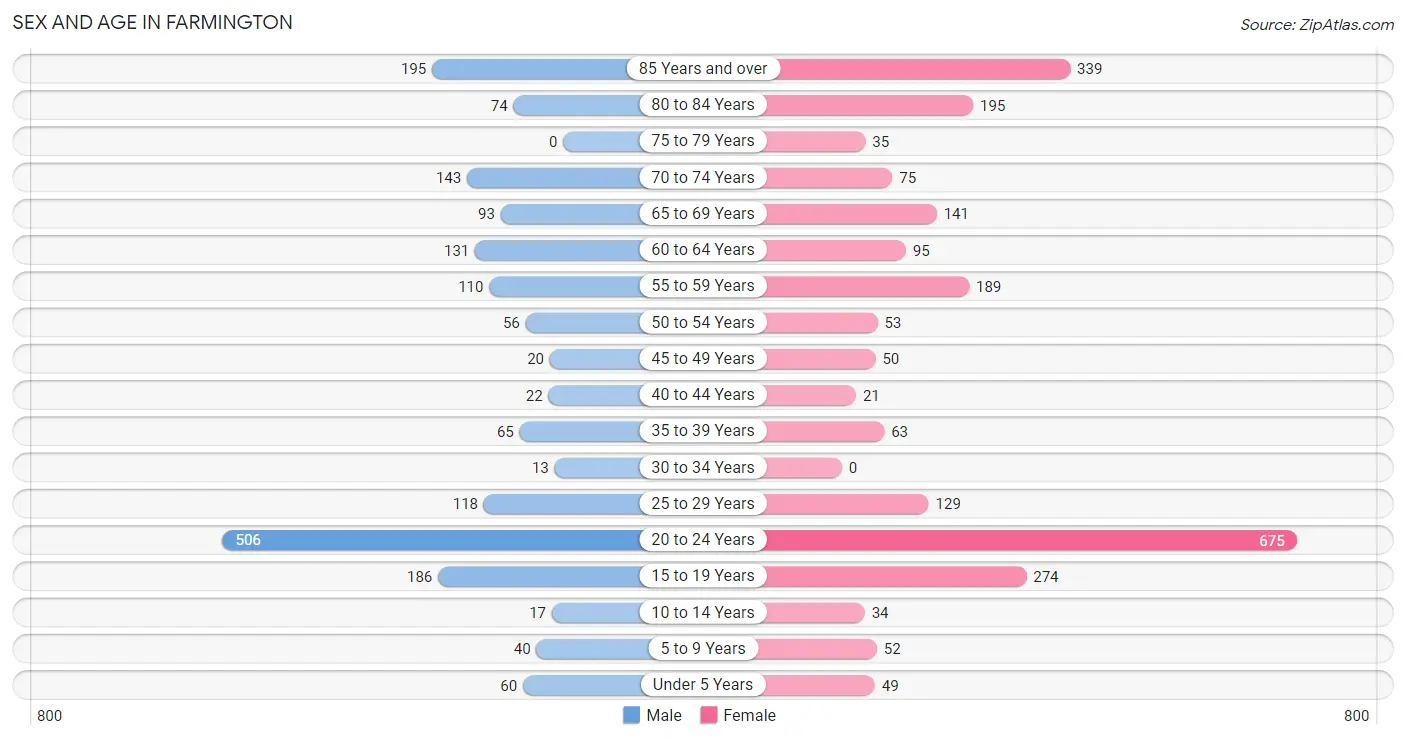
Sex and Age in Farmington
Sex and Age in Farmington
The most populous age groups in Farmington are 20 to 24 Years (506 | 27.4%) for men and 20 to 24 Years (675 | 27.3%) for women.
| Age Bracket | Male | Female |
| Under 5 Years | 60 (3.2%) | 49 (2.0%) |
| 5 to 9 Years | 40 (2.2%) | 52 (2.1%) |
| 10 to 14 Years | 17 (0.9%) | 34 (1.4%) |
| 15 to 19 Years | 186 (10.1%) | 274 (11.1%) |
| 20 to 24 Years | 506 (27.4%) | 675 (27.3%) |
| 25 to 29 Years | 118 (6.4%) | 129 (5.2%) |
| 30 to 34 Years | 13 (0.7%) | 0 (0.0%) |
| 35 to 39 Years | 65 (3.5%) | 63 (2.5%) |
| 40 to 44 Years | 22 (1.2%) | 21 (0.9%) |
| 45 to 49 Years | 20 (1.1%) | 50 (2.0%) |
| 50 to 54 Years | 56 (3.0%) | 53 (2.1%) |
| 55 to 59 Years | 110 (5.9%) | 189 (7.6%) |
| 60 to 64 Years | 131 (7.1%) | 95 (3.8%) |
| 65 to 69 Years | 93 (5.0%) | 141 (5.7%) |
| 70 to 74 Years | 143 (7.7%) | 75 (3.0%) |
| 75 to 79 Years | 0 (0.0%) | 35 (1.4%) |
| 80 to 84 Years | 74 (4.0%) | 195 (7.9%) |
| 85 Years and over | 195 (10.5%) | 339 (13.7%) |
| Total | 1,849 (100.0%) | 2,469 (100.0%) |
Families and Households in Farmington
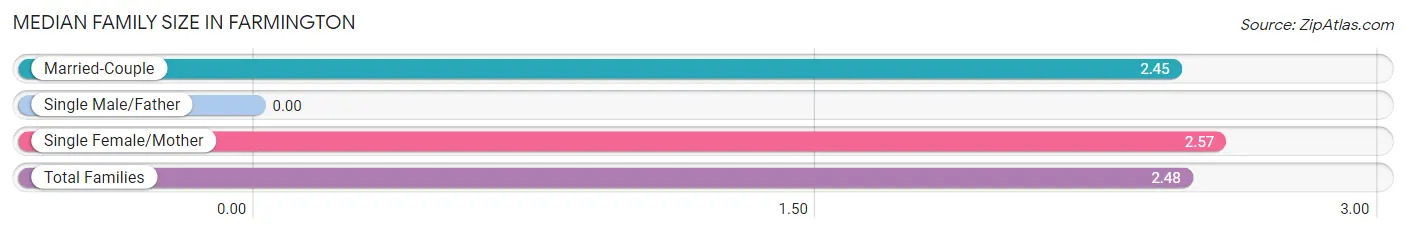
Median Family Size in Farmington
| Family Type | # Families | Family Size |
| Married-Couple | 438 (75.1%) | 2.45 |
| Single Male/Father | 0 (0.0%) | - |
| Single Female/Mother | 145 (24.9%) | 2.57 |
| Total Families | 583 (100.0%) | 2.48 |
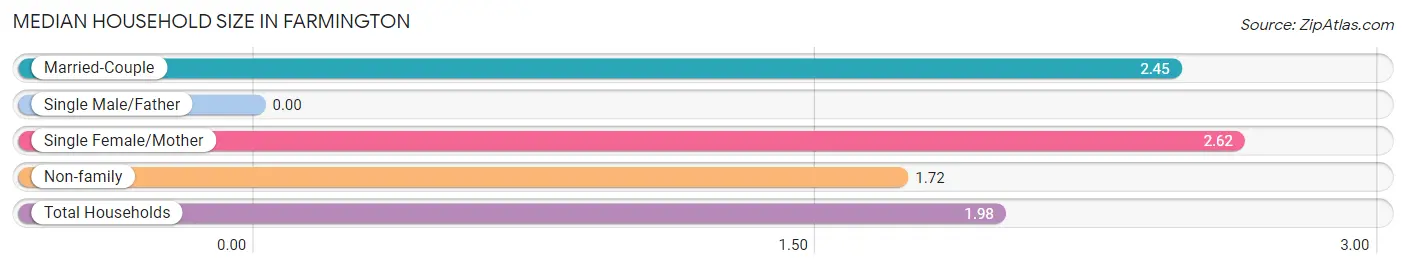
Median Household Size in Farmington
| Household Type | # Households | Household Size |
| Married-Couple | 438 (25.5%) | 2.45 |
| Single Male/Father | 0 (0.0%) | - |
| Single Female/Mother | 145 (8.5%) | 2.62 |
| Non-family | 1,132 (66.0%) | 1.72 |
| Total Households | 1,715 (100.0%) | 1.98 |
Household Size by Marriage Status in Farmington
Out of a total of 1,715 households in Farmington, 583 (34.0%) are family households, while 1,132 (66.0%) are nonfamily households. The most numerous type of family households are 2-person households, comprising 428, and the most common type of nonfamily households are 1-person households, comprising 910.
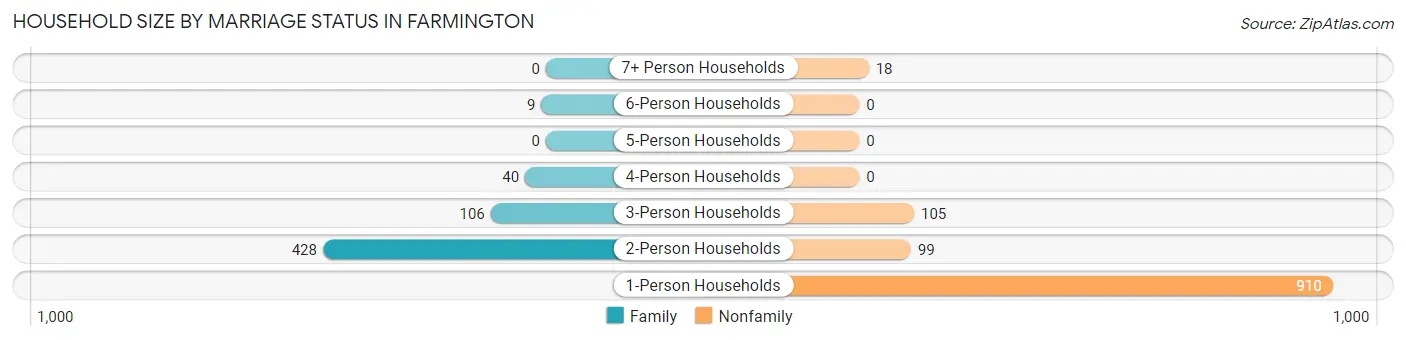
| Household Size | Family Households | Nonfamily Households |
| 1-Person Households | - | 910 (53.1%) |
| 2-Person Households | 428 (25.0%) | 99 (5.8%) |
| 3-Person Households | 106 (6.2%) | 105 (6.1%) |
| 4-Person Households | 40 (2.3%) | 0 (0.0%) |
| 5-Person Households | 0 (0.0%) | 0 (0.0%) |
| 6-Person Households | 9 (0.5%) | 0 (0.0%) |
| 7+ Person Households | 0 (0.0%) | 18 (1.1%) |
| Total | 583 (34.0%) | 1,132 (66.0%) |
Female Fertility in Farmington
Fertility by Age in Farmington
| Age Bracket | Women with Births | Births / 1,000 Women |
| 15 to 19 years | 0 (0.0%) | 0.0 |
| 20 to 34 years | 0 (0.0%) | 0.0 |
| 35 to 50 years | 0 (0.0%) | 0.0 |
| Total | 0 (0.0%) | 0.0 |
Fertility by Age by Marriage Status in Farmington
| Age Bracket | Married | Unmarried |
| 15 to 19 years | 0 (0.0%) | 0 (0.0%) |
| 20 to 34 years | 0 (0.0%) | 0 (0.0%) |
| 35 to 50 years | 0 (0.0%) | 0 (0.0%) |
| Total | 0 (0.0%) | 0 (0.0%) |
Fertility by Education in Farmington
| Educational Attainment | Women with Births | Births / 1,000 Women |
| Less than High School | 0 (0.0%) | 0.0 |
| High School Diploma | 0 (0.0%) | 0.0 |
| College or Associate's Degree | 0 (0.0%) | 0.0 |
| Bachelor's Degree | 0 (0.0%) | 0.0 |
| Graduate Degree | 0 (0.0%) | 0.0 |
| Total | 0 (0.0%) | 0.0 |
Fertility by Education by Marriage Status in Farmington
| Educational Attainment | Married | Unmarried |
| Less than High School | 0 (0.0%) | 0 (0.0%) |
| High School Diploma | 0 (0.0%) | 0 (0.0%) |
| College or Associate's Degree | 0 (0.0%) | 0 (0.0%) |
| Bachelor's Degree | 0 (0.0%) | 0 (0.0%) |
| Graduate Degree | 0 (0.0%) | 0 (0.0%) |
| Total | 0 (0.0%) | 0 (0.0%) |
Employment Characteristics in Farmington
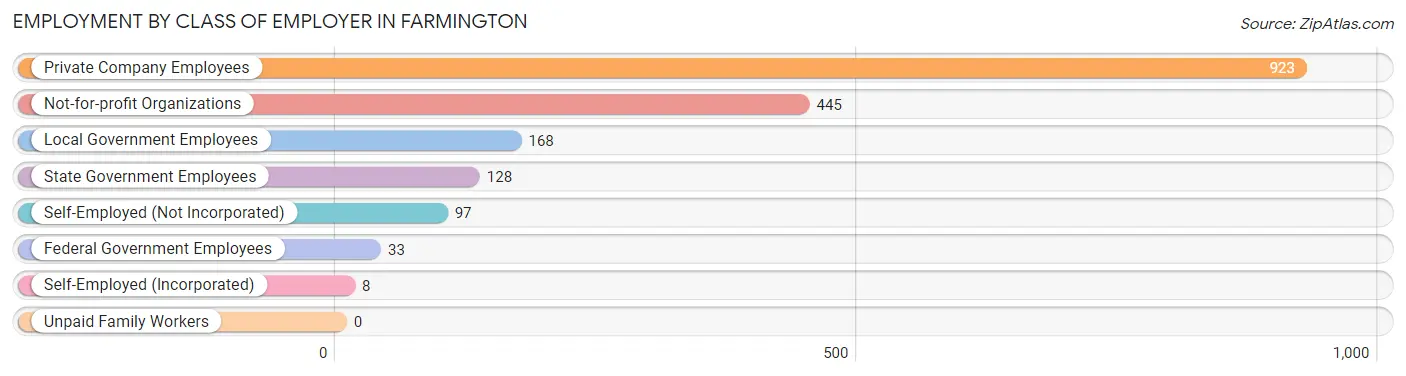
Employment by Class of Employer in Farmington
Among the 1,802 employed individuals in Farmington, private company employees (923 | 51.2%), not-for-profit organizations (445 | 24.7%), and local government employees (168 | 9.3%) make up the most common classes of employment.
| Employer Class | # Employees | % Employees |
| Private Company Employees | 923 | 51.2% |
| Self-Employed (Incorporated) | 8 | 0.4% |
| Self-Employed (Not Incorporated) | 97 | 5.4% |
| Not-for-profit Organizations | 445 | 24.7% |
| Local Government Employees | 168 | 9.3% |
| State Government Employees | 128 | 7.1% |
| Federal Government Employees | 33 | 1.8% |
| Unpaid Family Workers | 0 | 0.0% |
| Total | 1,802 | 100.0% |
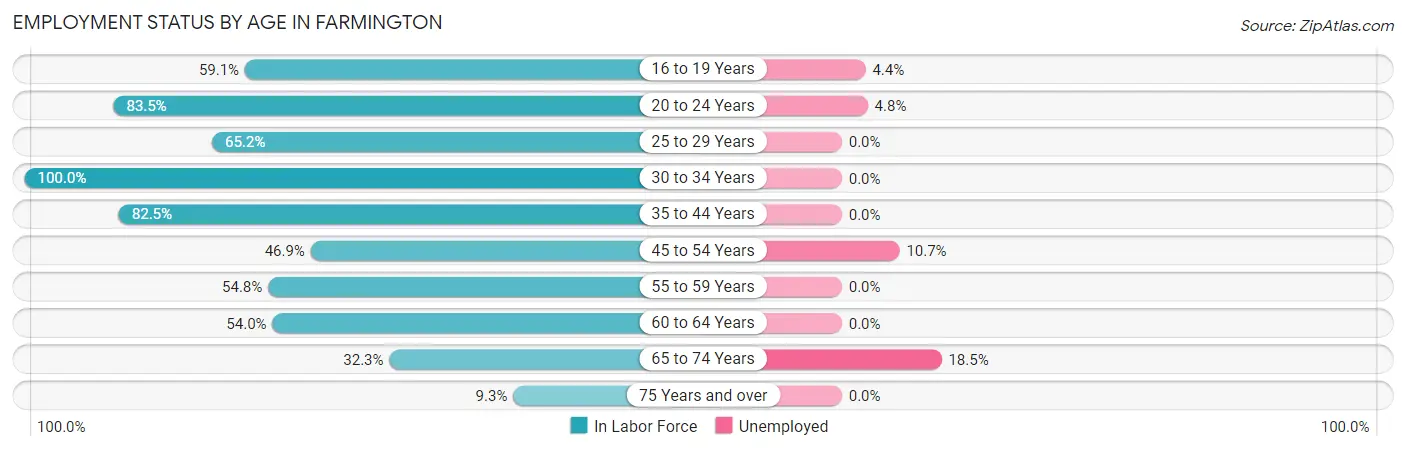
Employment Status by Age in Farmington
According to the labor force statistics for Farmington, out of the total population over 16 years of age (4,066), 53.3% or 2,167 individuals are in the labor force, with 4.4% or 95 of them unemployed. The age group with the highest labor force participation rate is 30 to 34 years, with 100.0% or 13 individuals in the labor force. Within the labor force, the 65 to 74 years age range has the highest percentage of unemployed individuals, with 18.5% or 27 of them being unemployed.
| Age Bracket | In Labor Force | Unemployed |
| 16 to 19 Years | 272 (59.1%) | 12 (4.4%) |
| 20 to 24 Years | 986 (83.5%) | 47 (4.8%) |
| 25 to 29 Years | 161 (65.2%) | 0 (0.0%) |
| 30 to 34 Years | 13 (100.0%) | 0 (0.0%) |
| 35 to 44 Years | 141 (82.5%) | 0 (0.0%) |
| 45 to 54 Years | 84 (46.9%) | 9 (10.7%) |
| 55 to 59 Years | 164 (54.8%) | 0 (0.0%) |
| 60 to 64 Years | 122 (54.0%) | 0 (0.0%) |
| 65 to 74 Years | 146 (32.3%) | 27 (18.5%) |
| 75 Years and over | 78 (9.3%) | 0 (0.0%) |
| Total | 2,167 (53.3%) | 95 (4.4%) |
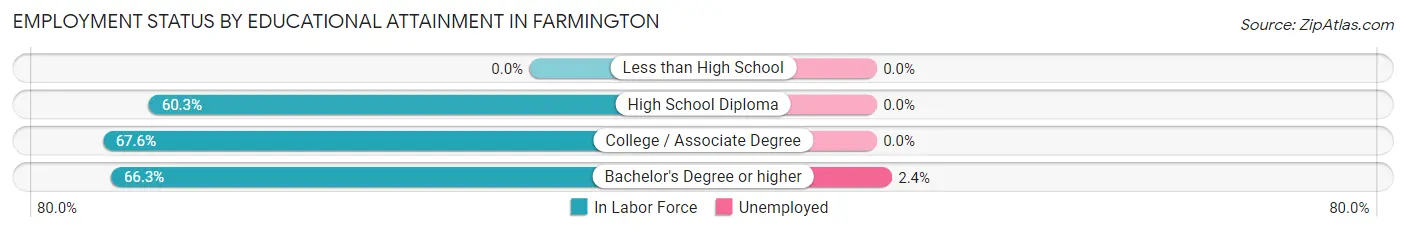
Employment Status by Educational Attainment in Farmington
According to labor force statistics for Farmington, 60.4% of individuals (686) out of the total population between 25 and 64 years of age (1,135) are in the labor force, with 1.3% or 9 of them being unemployed. The group with the highest labor force participation rate are those with the educational attainment of college / associate degree, with 67.6% or 225 individuals in the labor force. Within the labor force, individuals with bachelor's degree or higher education have the highest percentage of unemployment, with 2.4% or 9 of them being unemployed.
| Educational Attainment | In Labor Force | Unemployed |
| Less than High School | 0 (0.0%) | 0 (0.0%) |
| High School Diploma | 79 (60.3%) | 0 (0.0%) |
| College / Associate Degree | 225 (67.6%) | 0 (0.0%) |
| Bachelor's Degree or higher | 381 (66.3%) | 14 (2.4%) |
| Total | 686 (60.4%) | 15 (1.3%) |
Employment Occupations by Sex in Farmington
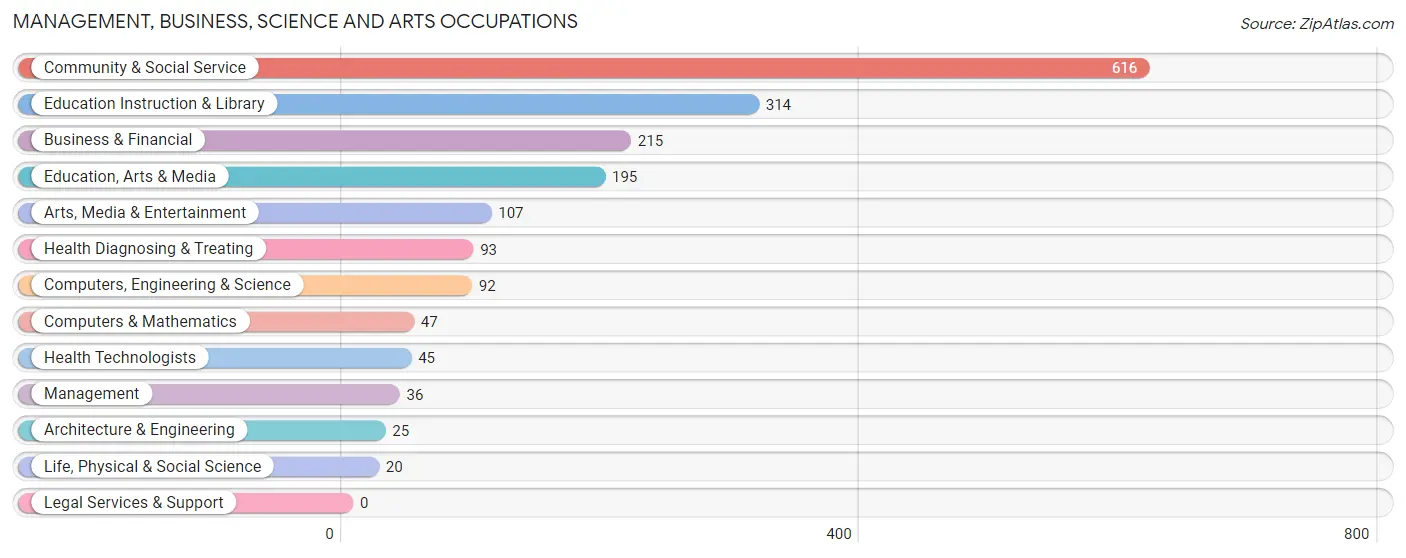
Management, Business, Science and Arts Occupations
The most common Management, Business, Science and Arts occupations in Farmington are Community & Social Service (616 | 29.7%), Education Instruction & Library (314 | 15.1%), Business & Financial (215 | 10.4%), Education, Arts & Media (195 | 9.4%), and Arts, Media & Entertainment (107 | 5.2%).
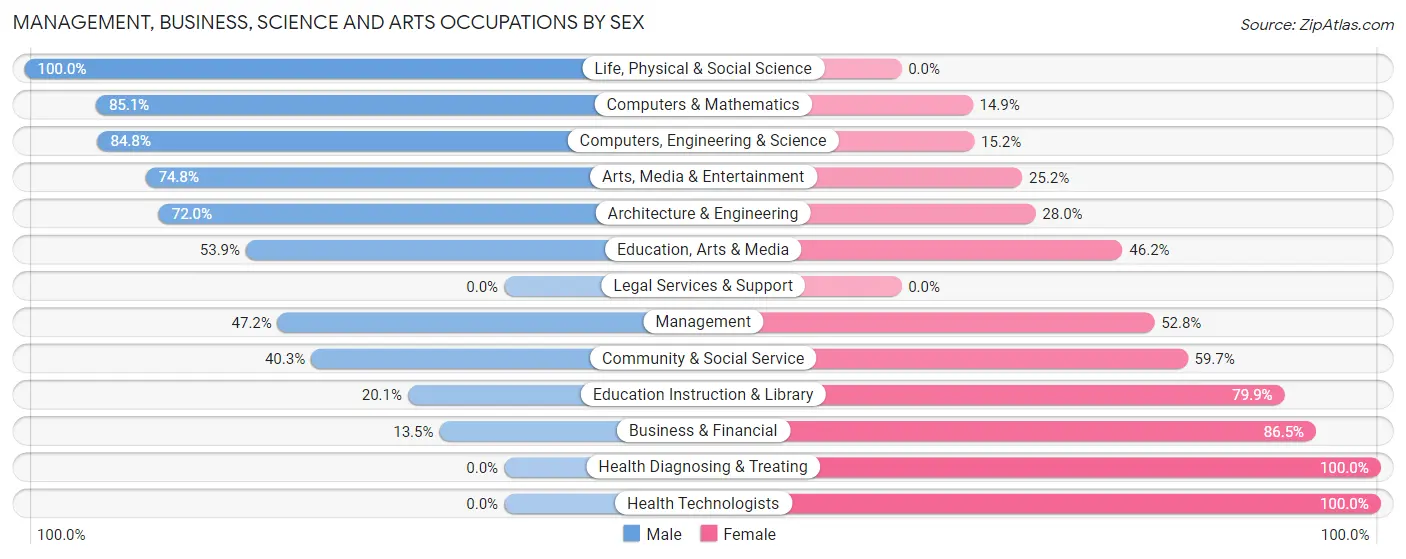
Management, Business, Science and Arts Occupations by Sex
Within the Management, Business, Science and Arts occupations in Farmington, the most male-oriented occupations are Life, Physical & Social Science (100.0%), Computers & Mathematics (85.1%), and Computers, Engineering & Science (84.8%), while the most female-oriented occupations are Health Diagnosing & Treating (100.0%), Health Technologists (100.0%), and Business & Financial (86.5%).
| Occupation | Male | Female |
| Management | 17 (47.2%) | 19 (52.8%) |
| Business & Financial | 29 (13.5%) | 186 (86.5%) |
| Computers, Engineering & Science | 78 (84.8%) | 14 (15.2%) |
| Computers & Mathematics | 40 (85.1%) | 7 (14.9%) |
| Architecture & Engineering | 18 (72.0%) | 7 (28.0%) |
| Life, Physical & Social Science | 20 (100.0%) | 0 (0.0%) |
| Community & Social Service | 248 (40.3%) | 368 (59.7%) |
| Education, Arts & Media | 105 (53.8%) | 90 (46.2%) |
| Legal Services & Support | 0 (0.0%) | 0 (0.0%) |
| Education Instruction & Library | 63 (20.1%) | 251 (79.9%) |
| Arts, Media & Entertainment | 80 (74.8%) | 27 (25.2%) |
| Health Diagnosing & Treating | 0 (0.0%) | 93 (100.0%) |
| Health Technologists | 0 (0.0%) | 45 (100.0%) |
| Total (Category) | 372 (35.4%) | 680 (64.6%) |
| Total (Overall) | 959 (46.3%) | 1,113 (53.7%) |
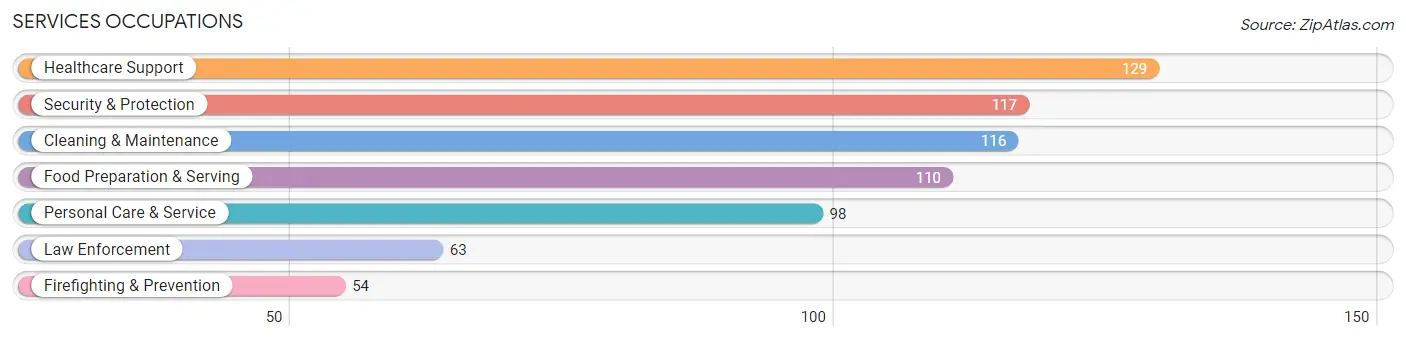
Services Occupations
The most common Services occupations in Farmington are Healthcare Support (129 | 6.2%), Security & Protection (117 | 5.7%), Cleaning & Maintenance (116 | 5.6%), Food Preparation & Serving (110 | 5.3%), and Personal Care & Service (98 | 4.7%).
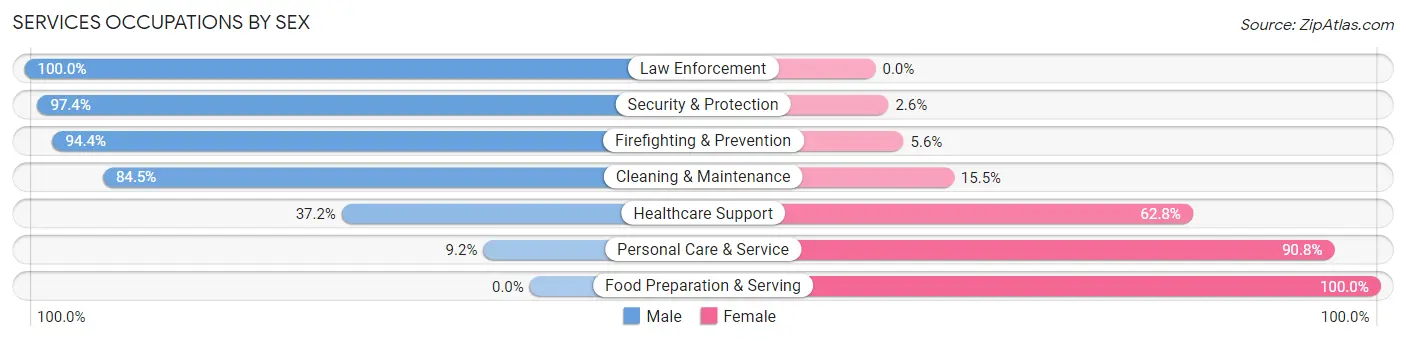
Services Occupations by Sex
Within the Services occupations in Farmington, the most male-oriented occupations are Law Enforcement (100.0%), Security & Protection (97.4%), and Firefighting & Prevention (94.4%), while the most female-oriented occupations are Food Preparation & Serving (100.0%), Personal Care & Service (90.8%), and Healthcare Support (62.8%).
| Occupation | Male | Female |
| Healthcare Support | 48 (37.2%) | 81 (62.8%) |
| Security & Protection | 114 (97.4%) | 3 (2.6%) |
| Firefighting & Prevention | 51 (94.4%) | 3 (5.6%) |
| Law Enforcement | 63 (100.0%) | 0 (0.0%) |
| Food Preparation & Serving | 0 (0.0%) | 110 (100.0%) |
| Cleaning & Maintenance | 98 (84.5%) | 18 (15.5%) |
| Personal Care & Service | 9 (9.2%) | 89 (90.8%) |
| Total (Category) | 269 (47.2%) | 301 (52.8%) |
| Total (Overall) | 959 (46.3%) | 1,113 (53.7%) |
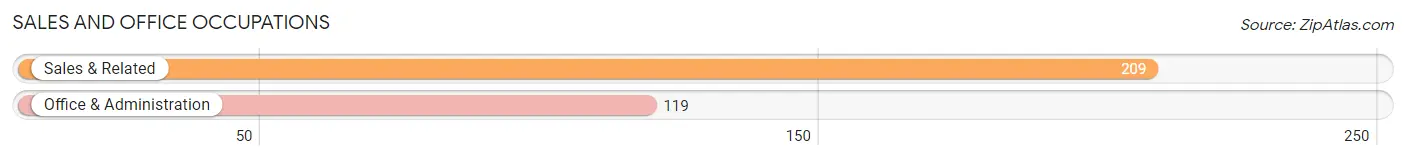
Sales and Office Occupations
The most common Sales and Office occupations in Farmington are Sales & Related (209 | 10.1%), and Office & Administration (119 | 5.7%).
Sales and Office Occupations by Sex
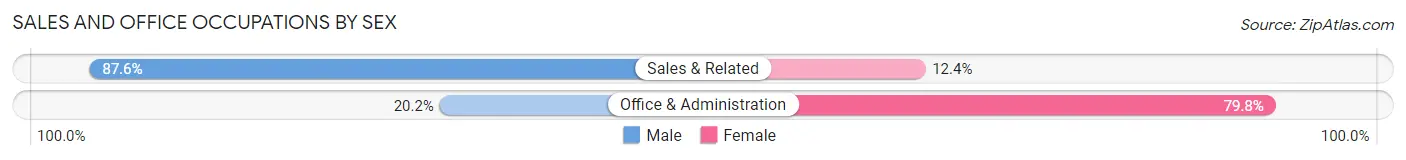
| Occupation | Male | Female |
| Sales & Related | 183 (87.6%) | 26 (12.4%) |
| Office & Administration | 24 (20.2%) | 95 (79.8%) |
| Total (Category) | 207 (63.1%) | 121 (36.9%) |
| Total (Overall) | 959 (46.3%) | 1,113 (53.7%) |
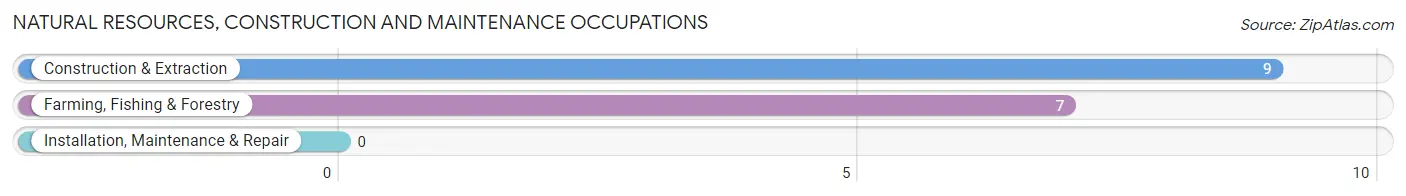
Natural Resources, Construction and Maintenance Occupations
The most common Natural Resources, Construction and Maintenance occupations in Farmington are Construction & Extraction (9 | 0.4%), and Farming, Fishing & Forestry (7 | 0.3%).
Natural Resources, Construction and Maintenance Occupations by Sex
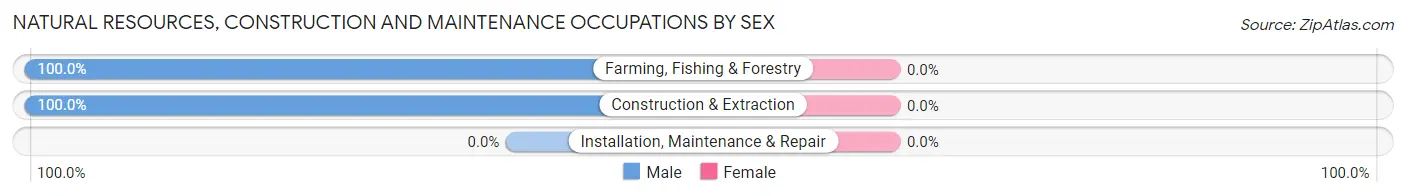
| Occupation | Male | Female |
| Farming, Fishing & Forestry | 7 (100.0%) | 0 (0.0%) |
| Construction & Extraction | 9 (100.0%) | 0 (0.0%) |
| Installation, Maintenance & Repair | 0 (0.0%) | 0 (0.0%) |
| Total (Category) | 16 (100.0%) | 0 (0.0%) |
| Total (Overall) | 959 (46.3%) | 1,113 (53.7%) |
Production, Transportation and Moving Occupations
The most common Production, Transportation and Moving occupations in Farmington are Transportation (83 | 4.0%), and Material Moving (23 | 1.1%).
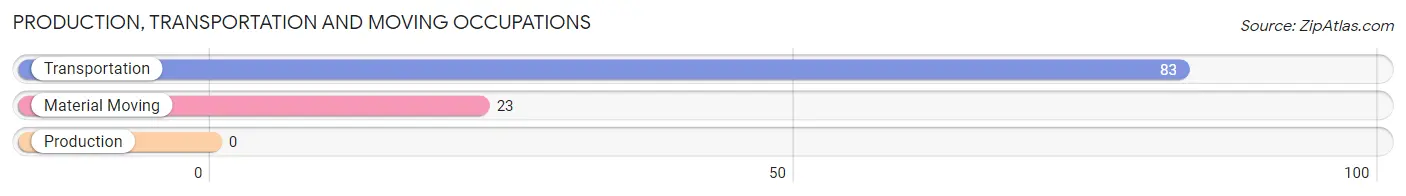
Production, Transportation and Moving Occupations by Sex
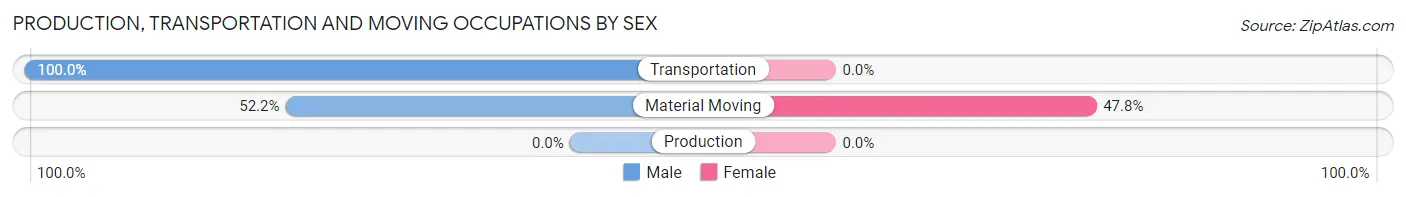
| Occupation | Male | Female |
| Production | 0 (0.0%) | 0 (0.0%) |
| Transportation | 83 (100.0%) | 0 (0.0%) |
| Material Moving | 12 (52.2%) | 11 (47.8%) |
| Total (Category) | 95 (89.6%) | 11 (10.4%) |
| Total (Overall) | 959 (46.3%) | 1,113 (53.7%) |
Employment Industries by Sex in Farmington
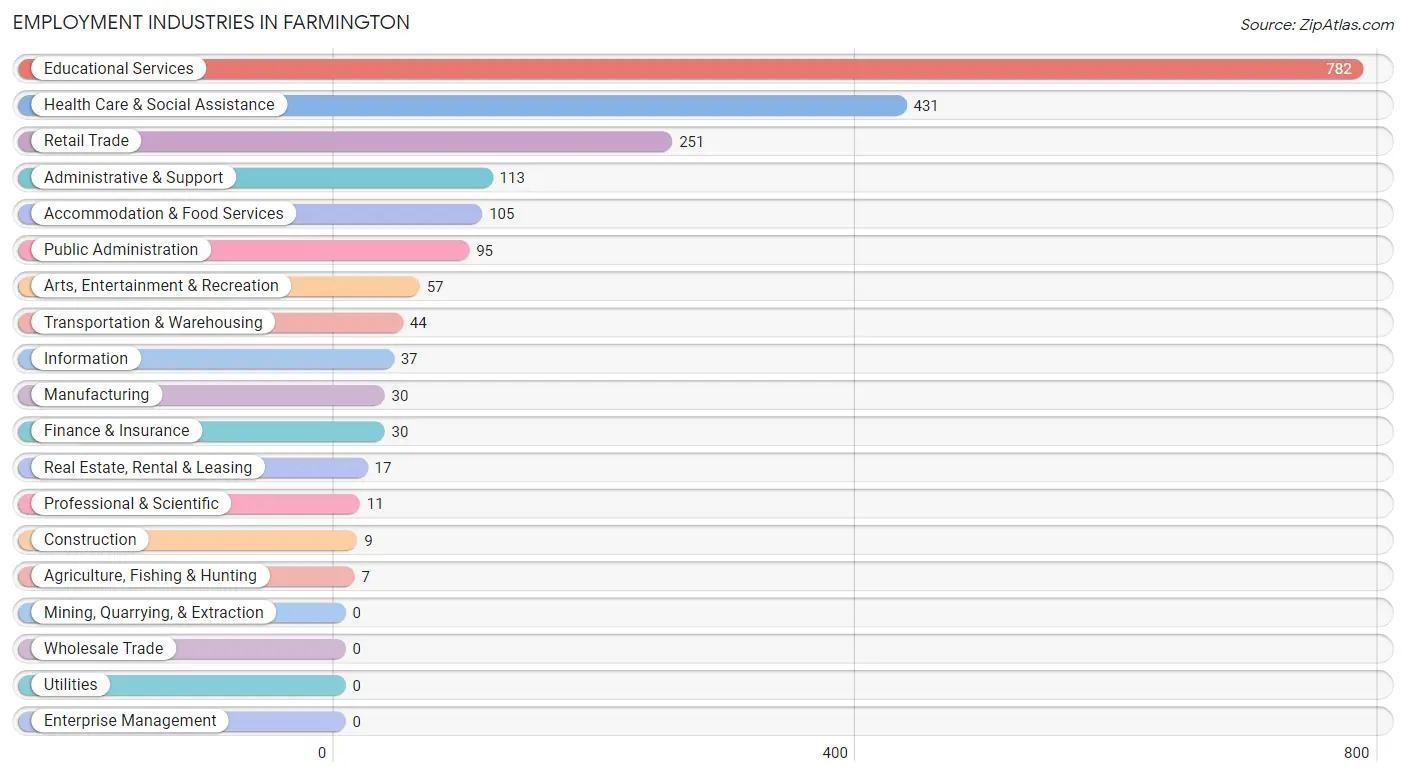
Employment Industries in Farmington
The major employment industries in Farmington include Educational Services (782 | 37.7%), Health Care & Social Assistance (431 | 20.8%), Retail Trade (251 | 12.1%), Administrative & Support (113 | 5.4%), and Accommodation & Food Services (105 | 5.1%).
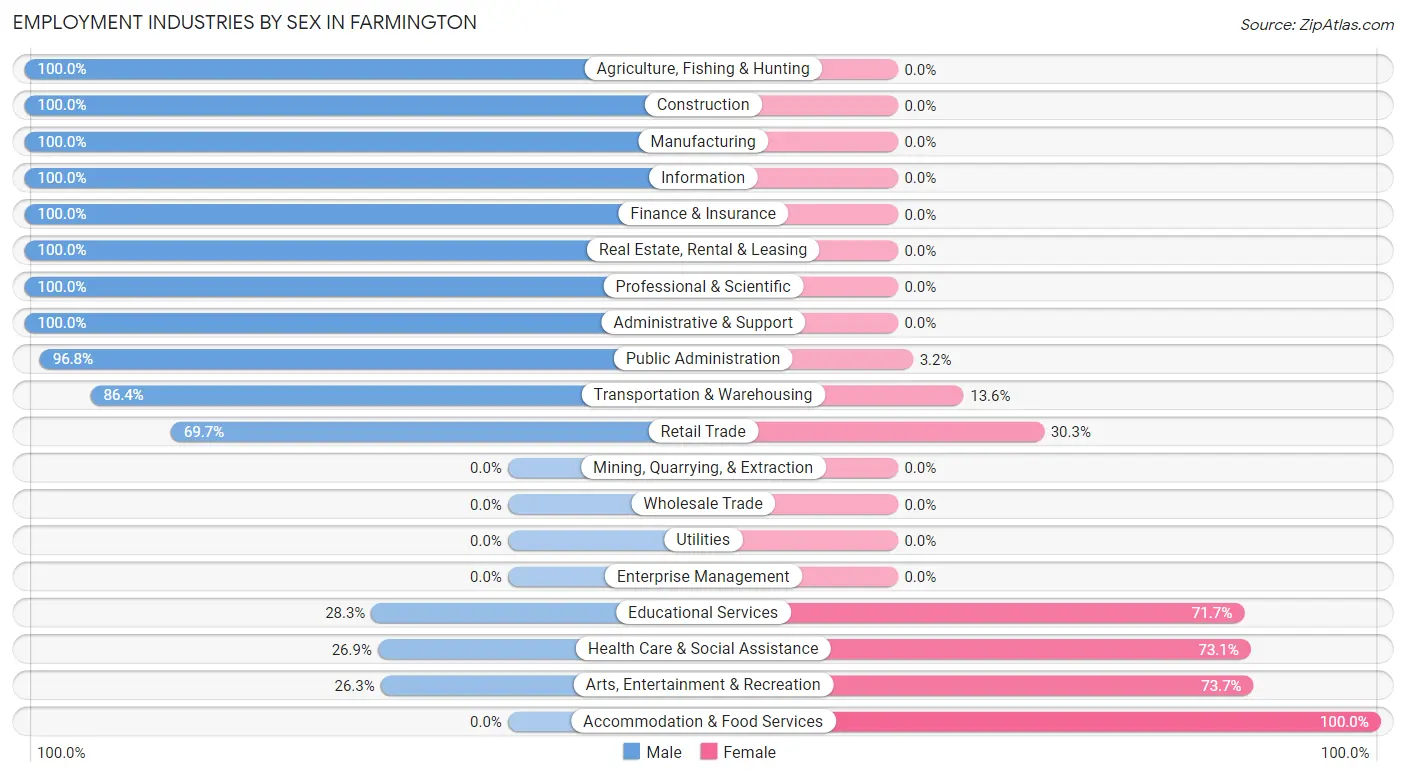
Employment Industries by Sex in Farmington
The Farmington industries that see more men than women are Agriculture, Fishing & Hunting (100.0%), Construction (100.0%), and Manufacturing (100.0%), whereas the industries that tend to have a higher number of women are Accommodation & Food Services (100.0%), Arts, Entertainment & Recreation (73.7%), and Health Care & Social Assistance (73.1%).
| Industry | Male | Female |
| Agriculture, Fishing & Hunting | 7 (100.0%) | 0 (0.0%) |
| Mining, Quarrying, & Extraction | 0 (0.0%) | 0 (0.0%) |
| Construction | 9 (100.0%) | 0 (0.0%) |
| Manufacturing | 30 (100.0%) | 0 (0.0%) |
| Wholesale Trade | 0 (0.0%) | 0 (0.0%) |
| Retail Trade | 175 (69.7%) | 76 (30.3%) |
| Transportation & Warehousing | 38 (86.4%) | 6 (13.6%) |
| Utilities | 0 (0.0%) | 0 (0.0%) |
| Information | 37 (100.0%) | 0 (0.0%) |
| Finance & Insurance | 30 (100.0%) | 0 (0.0%) |
| Real Estate, Rental & Leasing | 17 (100.0%) | 0 (0.0%) |
| Professional & Scientific | 11 (100.0%) | 0 (0.0%) |
| Enterprise Management | 0 (0.0%) | 0 (0.0%) |
| Administrative & Support | 113 (100.0%) | 0 (0.0%) |
| Educational Services | 221 (28.3%) | 561 (71.7%) |
| Health Care & Social Assistance | 116 (26.9%) | 315 (73.1%) |
| Arts, Entertainment & Recreation | 15 (26.3%) | 42 (73.7%) |
| Accommodation & Food Services | 0 (0.0%) | 105 (100.0%) |
| Public Administration | 92 (96.8%) | 3 (3.2%) |
| Total | 959 (46.3%) | 1,113 (53.7%) |
Education in Farmington
School Enrollment in Farmington
The most common levels of schooling among the 1,436 students in Farmington are college / undergraduate (1,272 | 88.6%), elementary school (92 | 6.4%), and middle school (39 | 2.7%).
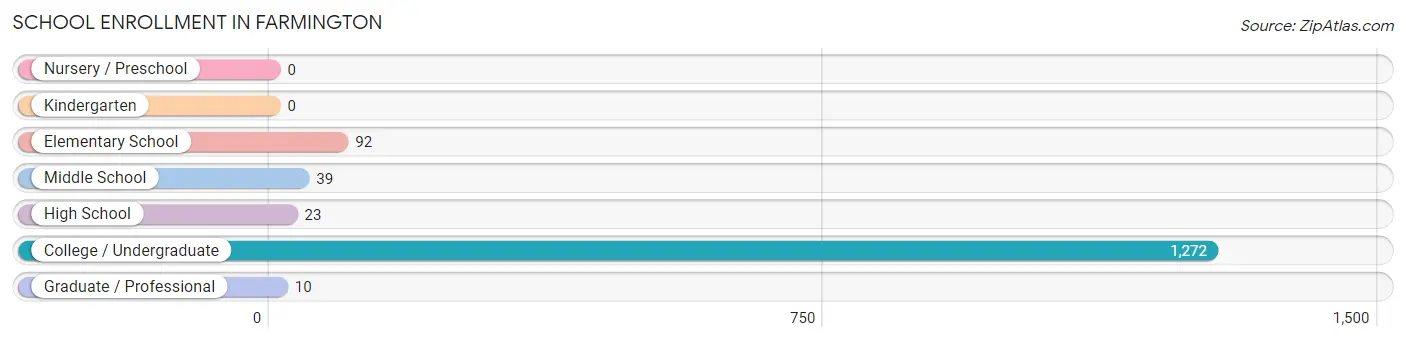
| School Level | # Students | % Students |
| Nursery / Preschool | 0 | 0.0% |
| Kindergarten | 0 | 0.0% |
| Elementary School | 92 | 6.4% |
| Middle School | 39 | 2.7% |
| High School | 23 | 1.6% |
| College / Undergraduate | 1,272 | 88.6% |
| Graduate / Professional | 10 | 0.7% |
| Total | 1,436 | 100.0% |
School Enrollment by Age by Funding Source in Farmington
Out of a total of 1,436 students who are enrolled in schools in Farmington, 261 (18.2%) attend a private institution, while the remaining 1,175 (81.8%) are enrolled in public schools. The age group of 15 to 17 year olds has the highest likelihood of being enrolled in private schools, with 11 (100.0% in the age bracket) enrolled. Conversely, the age group of 25 to 34 year olds has the lowest likelihood of being enrolled in a private school, with 24 (100.0% in the age bracket) attending a public institution.
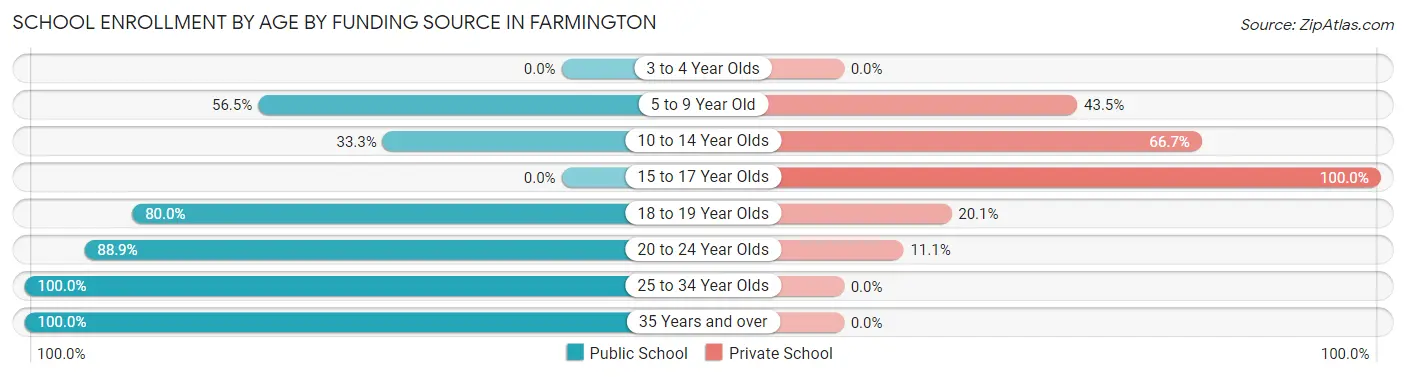
| Age Bracket | Public School | Private School |
| 3 to 4 Year Olds | 0 (0.0%) | 0 (0.0%) |
| 5 to 9 Year Old | 52 (56.5%) | 40 (43.5%) |
| 10 to 14 Year Olds | 17 (33.3%) | 34 (66.7%) |
| 15 to 17 Year Olds | 0 (0.0%) | 11 (100.0%) |
| 18 to 19 Year Olds | 339 (79.9%) | 85 (20.1%) |
| 20 to 24 Year Olds | 734 (88.9%) | 92 (11.1%) |
| 25 to 34 Year Olds | 24 (100.0%) | 0 (0.0%) |
| 35 Years and over | 8 (100.0%) | 0 (0.0%) |
| Total | 1,175 (81.8%) | 261 (18.2%) |
Educational Attainment by Field of Study in Farmington
Education (208 | 17.7%), business (173 | 14.7%), liberal arts & history (157 | 13.4%), social sciences (142 | 12.1%), and literature & languages (109 | 9.3%) are the most common fields of study among 1,174 individuals in Farmington who have obtained a bachelor's degree or higher.
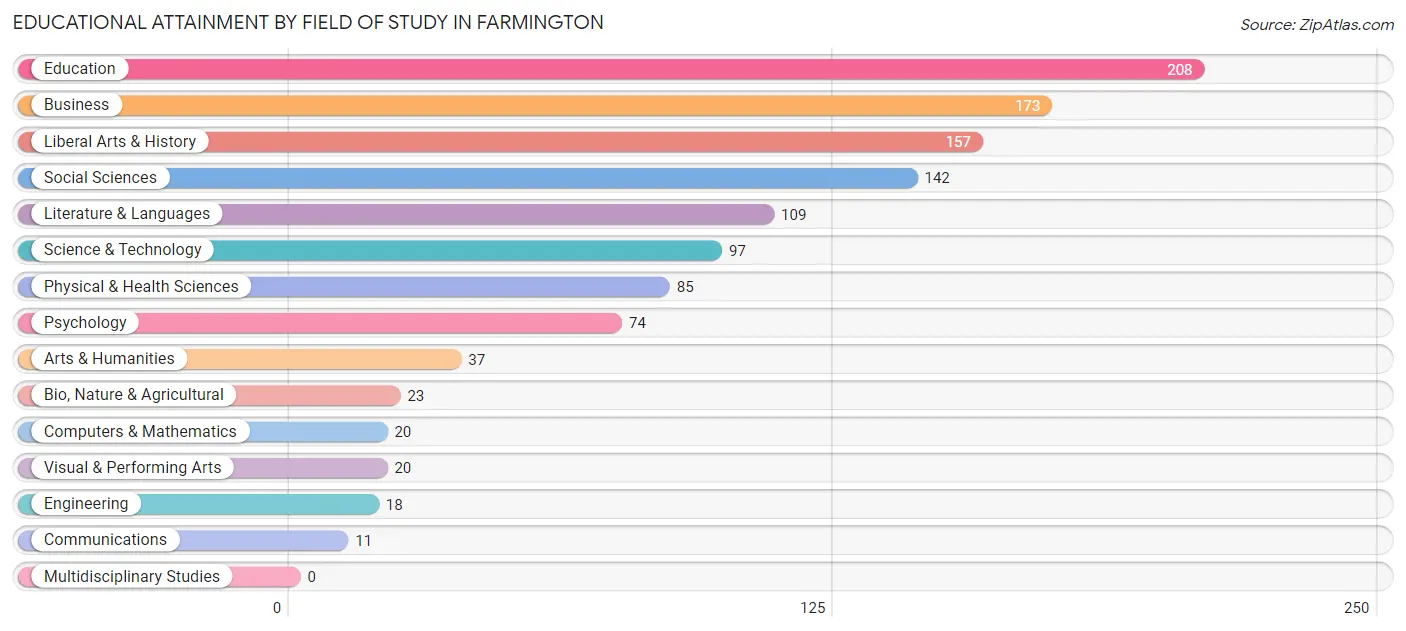
| Field of Study | # Graduates | % Graduates |
| Computers & Mathematics | 20 | 1.7% |
| Bio, Nature & Agricultural | 23 | 2.0% |
| Physical & Health Sciences | 85 | 7.2% |
| Psychology | 74 | 6.3% |
| Social Sciences | 142 | 12.1% |
| Engineering | 18 | 1.5% |
| Multidisciplinary Studies | 0 | 0.0% |
| Science & Technology | 97 | 8.3% |
| Business | 173 | 14.7% |
| Education | 208 | 17.7% |
| Literature & Languages | 109 | 9.3% |
| Liberal Arts & History | 157 | 13.4% |
| Visual & Performing Arts | 20 | 1.7% |
| Communications | 11 | 0.9% |
| Arts & Humanities | 37 | 3.2% |
| Total | 1,174 | 100.0% |
Transportation & Commute in Farmington
Vehicle Availability by Sex in Farmington
The most prevalent vehicle ownership categories in Farmington are males with 2 vehicles (335, accounting for 38.6%) and females with 2 vehicles (221, making up 67.9%).
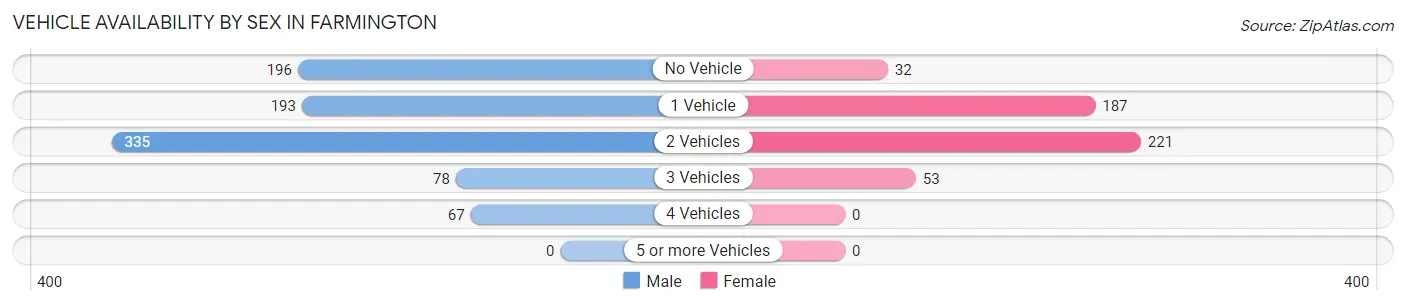
| Vehicles Available | Male | Female |
| No Vehicle | 196 (22.6%) | 32 (6.5%) |
| 1 Vehicle | 193 (22.2%) | 187 (37.9%) |
| 2 Vehicles | 335 (38.6%) | 221 (44.8%) |
| 3 Vehicles | 78 (9.0%) | 53 (10.7%) |
| 4 Vehicles | 67 (7.7%) | 0 (0.0%) |
| 5 or more Vehicles | 0 (0.0%) | 0 (0.0%) |
| Total | 869 (100.0%) | 493 (100.0%) |
Commute Time in Farmington
The most frequently occuring commute durations in Farmington are 5 to 9 minutes (447 commuters, 30.3%), 10 to 14 minutes (259 commuters, 17.6%), and 20 to 24 minutes (201 commuters, 13.6%).
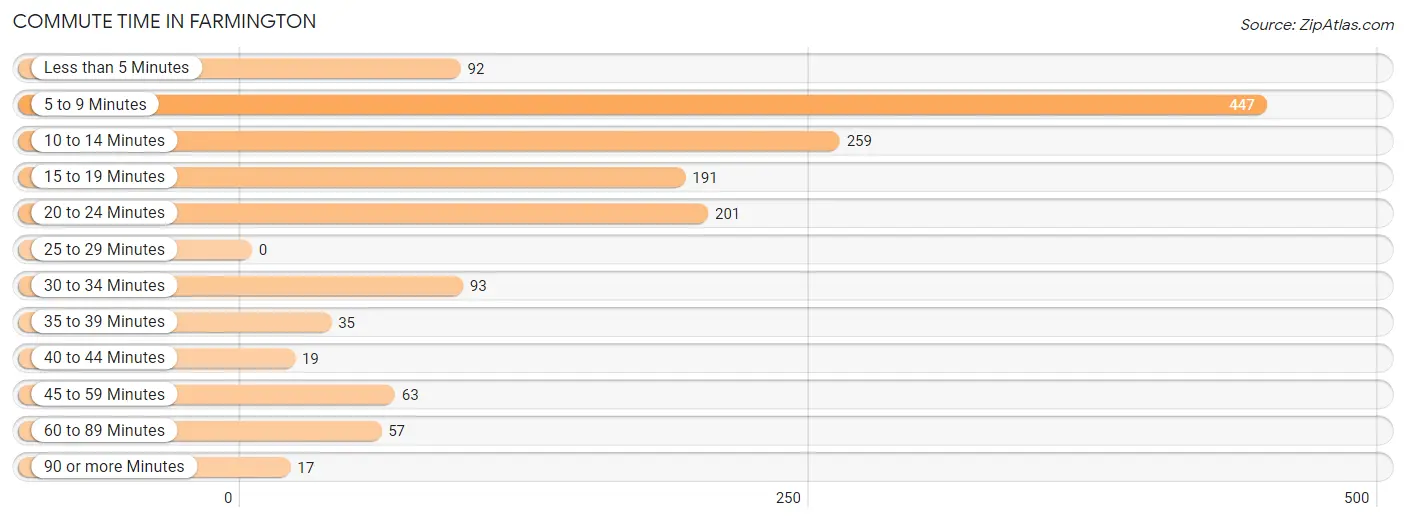
| Commute Time | # Commuters | % Commuters |
| Less than 5 Minutes | 92 | 6.2% |
| 5 to 9 Minutes | 447 | 30.3% |
| 10 to 14 Minutes | 259 | 17.6% |
| 15 to 19 Minutes | 191 | 13.0% |
| 20 to 24 Minutes | 201 | 13.6% |
| 25 to 29 Minutes | 0 | 0.0% |
| 30 to 34 Minutes | 93 | 6.3% |
| 35 to 39 Minutes | 35 | 2.4% |
| 40 to 44 Minutes | 19 | 1.3% |
| 45 to 59 Minutes | 63 | 4.3% |
| 60 to 89 Minutes | 57 | 3.9% |
| 90 or more Minutes | 17 | 1.1% |
Commute Time by Sex in Farmington
The most common commute times in Farmington are 5 to 9 minutes (250 commuters, 31.1%) for males and 5 to 9 minutes (197 commuters, 29.4%) for females.
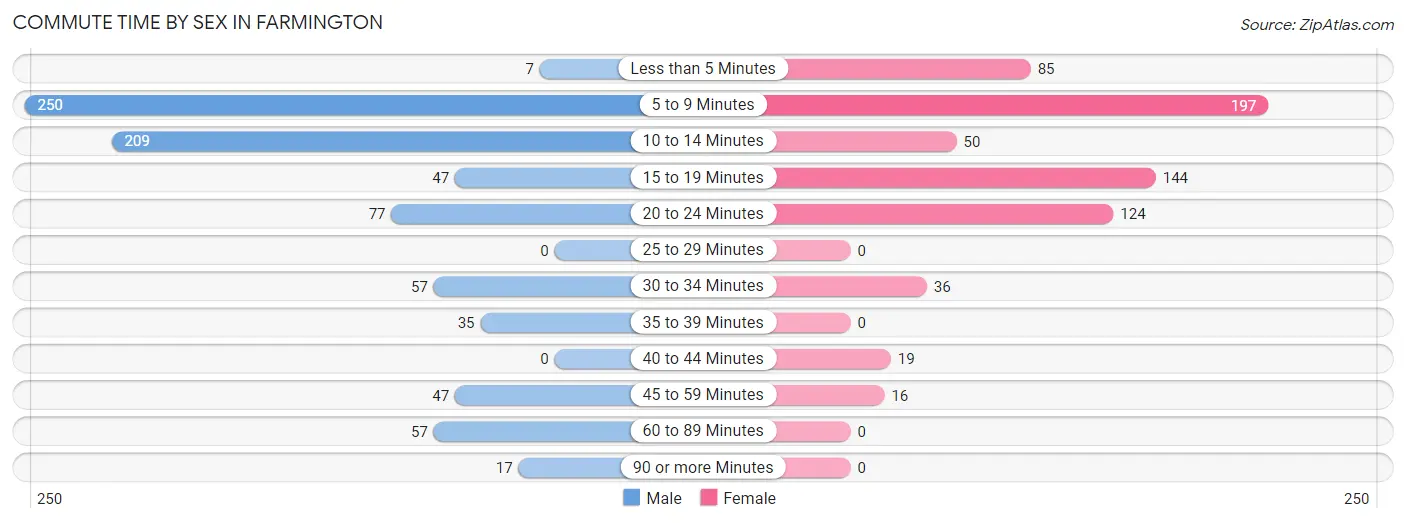
| Commute Time | Male | Female |
| Less than 5 Minutes | 7 (0.9%) | 85 (12.7%) |
| 5 to 9 Minutes | 250 (31.1%) | 197 (29.4%) |
| 10 to 14 Minutes | 209 (26.0%) | 50 (7.4%) |
| 15 to 19 Minutes | 47 (5.9%) | 144 (21.5%) |
| 20 to 24 Minutes | 77 (9.6%) | 124 (18.5%) |
| 25 to 29 Minutes | 0 (0.0%) | 0 (0.0%) |
| 30 to 34 Minutes | 57 (7.1%) | 36 (5.4%) |
| 35 to 39 Minutes | 35 (4.4%) | 0 (0.0%) |
| 40 to 44 Minutes | 0 (0.0%) | 19 (2.8%) |
| 45 to 59 Minutes | 47 (5.9%) | 16 (2.4%) |
| 60 to 89 Minutes | 57 (7.1%) | 0 (0.0%) |
| 90 or more Minutes | 17 (2.1%) | 0 (0.0%) |
Time of Departure to Work by Sex in Farmington
The most frequent times of departure to work in Farmington are 7:30 AM to 7:59 AM (149, 18.6%) for males and 12:00 PM to 3:59 PM (184, 27.4%) for females.
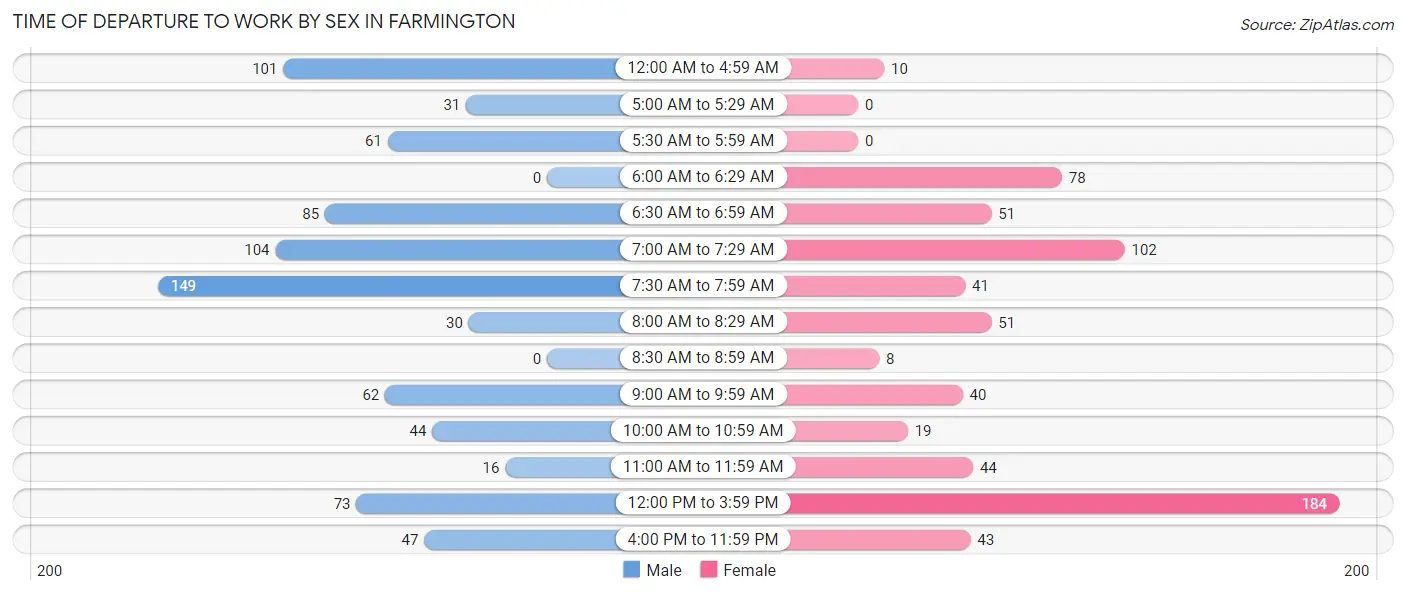
| Time of Departure | Male | Female |
| 12:00 AM to 4:59 AM | 101 (12.6%) | 10 (1.5%) |
| 5:00 AM to 5:29 AM | 31 (3.9%) | 0 (0.0%) |
| 5:30 AM to 5:59 AM | 61 (7.6%) | 0 (0.0%) |
| 6:00 AM to 6:29 AM | 0 (0.0%) | 78 (11.6%) |
| 6:30 AM to 6:59 AM | 85 (10.6%) | 51 (7.6%) |
| 7:00 AM to 7:29 AM | 104 (13.0%) | 102 (15.2%) |
| 7:30 AM to 7:59 AM | 149 (18.6%) | 41 (6.1%) |
| 8:00 AM to 8:29 AM | 30 (3.7%) | 51 (7.6%) |
| 8:30 AM to 8:59 AM | 0 (0.0%) | 8 (1.2%) |
| 9:00 AM to 9:59 AM | 62 (7.7%) | 40 (6.0%) |
| 10:00 AM to 10:59 AM | 44 (5.5%) | 19 (2.8%) |
| 11:00 AM to 11:59 AM | 16 (2.0%) | 44 (6.6%) |
| 12:00 PM to 3:59 PM | 73 (9.1%) | 184 (27.4%) |
| 4:00 PM to 11:59 PM | 47 (5.9%) | 43 (6.4%) |
| Total | 803 (100.0%) | 671 (100.0%) |
Housing Occupancy in Farmington
Occupancy by Ownership in Farmington
Of the total 1,715 dwellings in Farmington, owner-occupied units account for 605 (35.3%), while renter-occupied units make up 1,110 (64.7%).
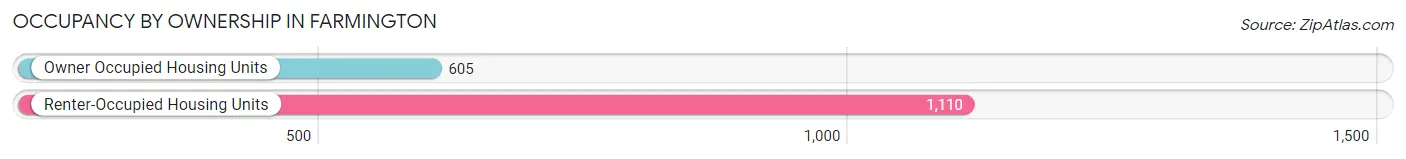
| Occupancy | # Housing Units | % Housing Units |
| Owner Occupied Housing Units | 605 | 35.3% |
| Renter-Occupied Housing Units | 1,110 | 64.7% |
| Total Occupied Housing Units | 1,715 | 100.0% |
Occupancy by Household Size in Farmington
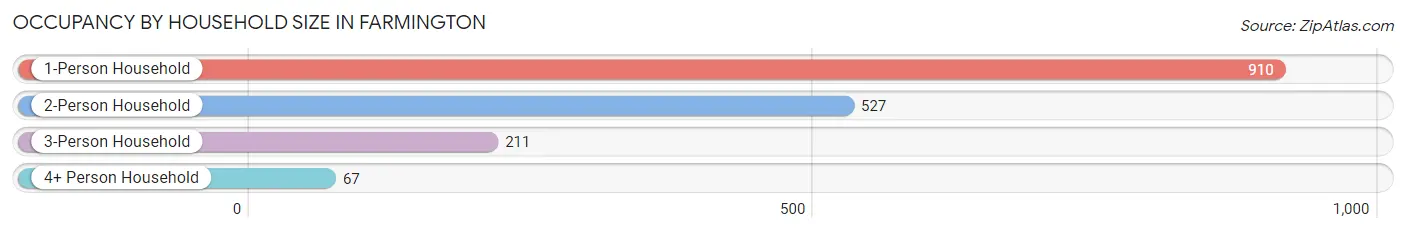
| Household Size | # Housing Units | % Housing Units |
| 1-Person Household | 910 | 53.1% |
| 2-Person Household | 527 | 30.7% |
| 3-Person Household | 211 | 12.3% |
| 4+ Person Household | 67 | 3.9% |
| Total Housing Units | 1,715 | 100.0% |
Occupancy by Ownership by Household Size in Farmington
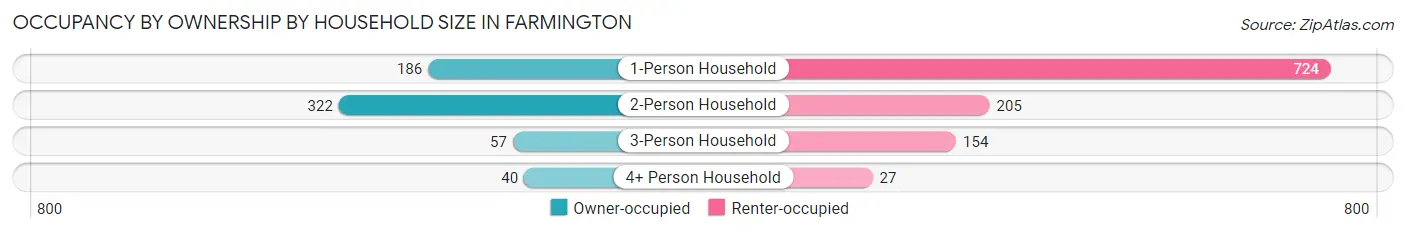
| Household Size | Owner-occupied | Renter-occupied |
| 1-Person Household | 186 (20.4%) | 724 (79.6%) |
| 2-Person Household | 322 (61.1%) | 205 (38.9%) |
| 3-Person Household | 57 (27.0%) | 154 (73.0%) |
| 4+ Person Household | 40 (59.7%) | 27 (40.3%) |
| Total Housing Units | 605 (35.3%) | 1,110 (64.7%) |
Occupancy by Educational Attainment in Farmington
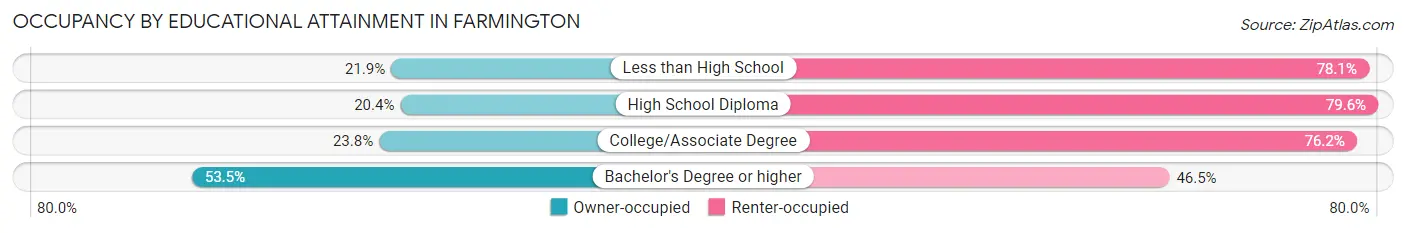
| Household Size | Owner-occupied | Renter-occupied |
| Less than High School | 21 (21.9%) | 75 (78.1%) |
| High School Diploma | 87 (20.4%) | 339 (79.6%) |
| College/Associate Degree | 113 (23.8%) | 362 (76.2%) |
| Bachelor's Degree or higher | 384 (53.5%) | 334 (46.5%) |
Occupancy by Age of Householder in Farmington
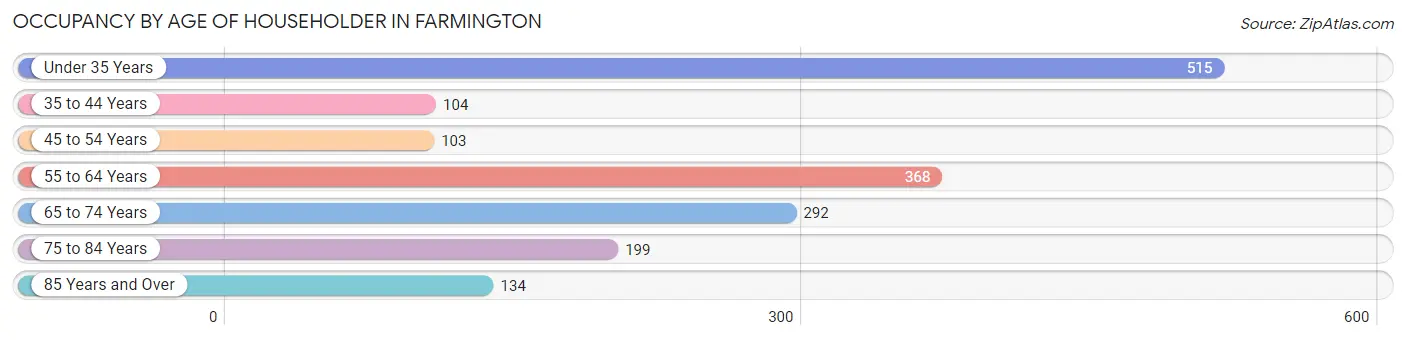
| Age Bracket | # Households | % Households |
| Under 35 Years | 515 | 30.0% |
| 35 to 44 Years | 104 | 6.1% |
| 45 to 54 Years | 103 | 6.0% |
| 55 to 64 Years | 368 | 21.5% |
| 65 to 74 Years | 292 | 17.0% |
| 75 to 84 Years | 199 | 11.6% |
| 85 Years and Over | 134 | 7.8% |
| Total | 1,715 | 100.0% |
Housing Finances in Farmington
Median Income by Occupancy in Farmington
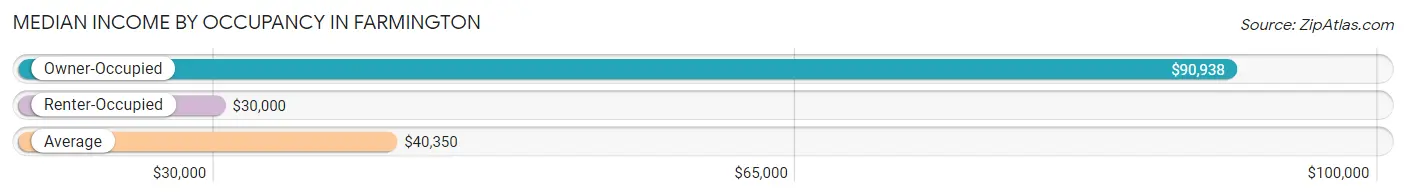
| Occupancy Type | # Households | Median Income |
| Owner-Occupied | 605 (35.3%) | $90,938 |
| Renter-Occupied | 1,110 (64.7%) | $30,000 |
| Average | 1,715 (100.0%) | $40,350 |
Occupancy by Householder Income Bracket in Farmington
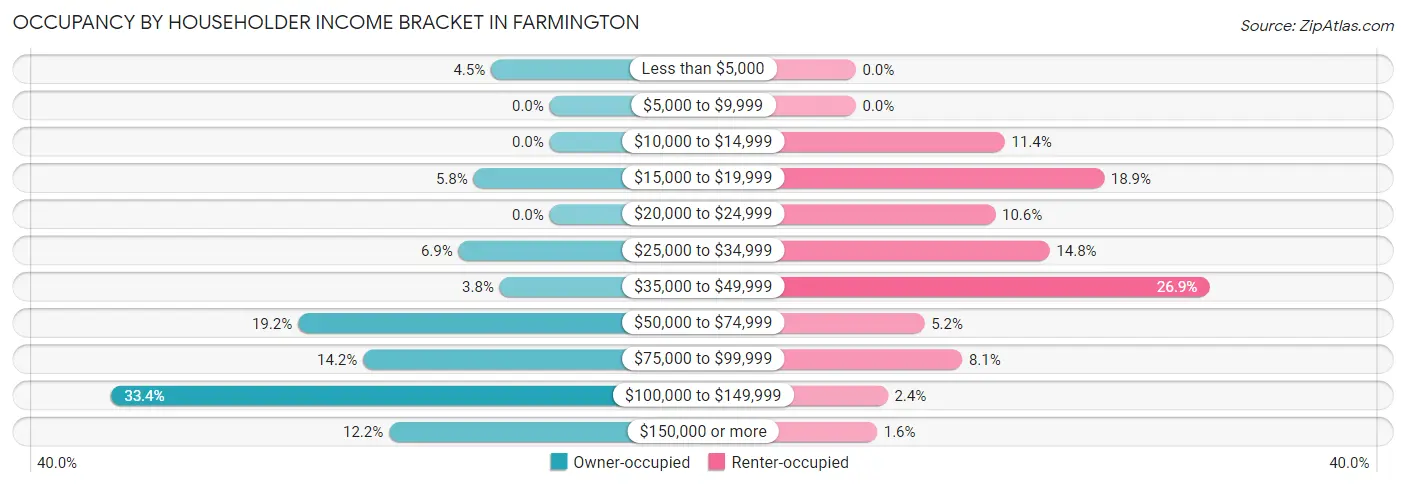
| Income Bracket | Owner-occupied | Renter-occupied |
| Less than $5,000 | 27 (4.5%) | 0 (0.0%) |
| $5,000 to $9,999 | 0 (0.0%) | 0 (0.0%) |
| $10,000 to $14,999 | 0 (0.0%) | 126 (11.4%) |
| $15,000 to $19,999 | 35 (5.8%) | 210 (18.9%) |
| $20,000 to $24,999 | 0 (0.0%) | 118 (10.6%) |
| $25,000 to $34,999 | 42 (6.9%) | 164 (14.8%) |
| $35,000 to $49,999 | 23 (3.8%) | 299 (26.9%) |
| $50,000 to $74,999 | 116 (19.2%) | 58 (5.2%) |
| $75,000 to $99,999 | 86 (14.2%) | 90 (8.1%) |
| $100,000 to $149,999 | 202 (33.4%) | 27 (2.4%) |
| $150,000 or more | 74 (12.2%) | 18 (1.6%) |
| Total | 605 (100.0%) | 1,110 (100.0%) |
Monthly Housing Cost Tiers in Farmington
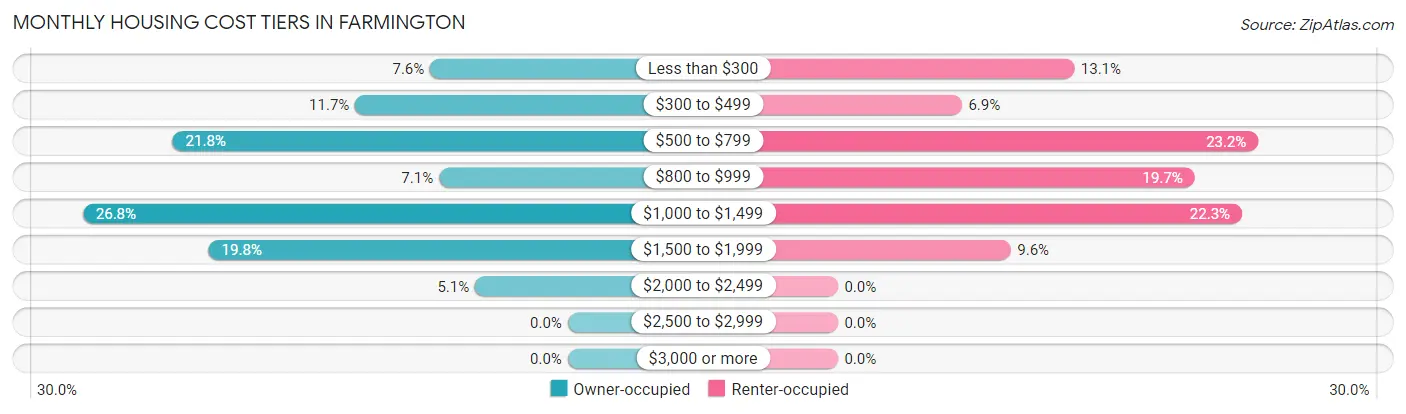
| Monthly Cost | Owner-occupied | Renter-occupied |
| Less than $300 | 46 (7.6%) | 145 (13.1%) |
| $300 to $499 | 71 (11.7%) | 76 (6.9%) |
| $500 to $799 | 132 (21.8%) | 258 (23.2%) |
| $800 to $999 | 43 (7.1%) | 219 (19.7%) |
| $1,000 to $1,499 | 162 (26.8%) | 248 (22.3%) |
| $1,500 to $1,999 | 120 (19.8%) | 106 (9.6%) |
| $2,000 to $2,499 | 31 (5.1%) | 0 (0.0%) |
| $2,500 to $2,999 | 0 (0.0%) | 0 (0.0%) |
| $3,000 or more | 0 (0.0%) | 0 (0.0%) |
| Total | 605 (100.0%) | 1,110 (100.0%) |
Physical Housing Characteristics in Farmington
Housing Structures in Farmington
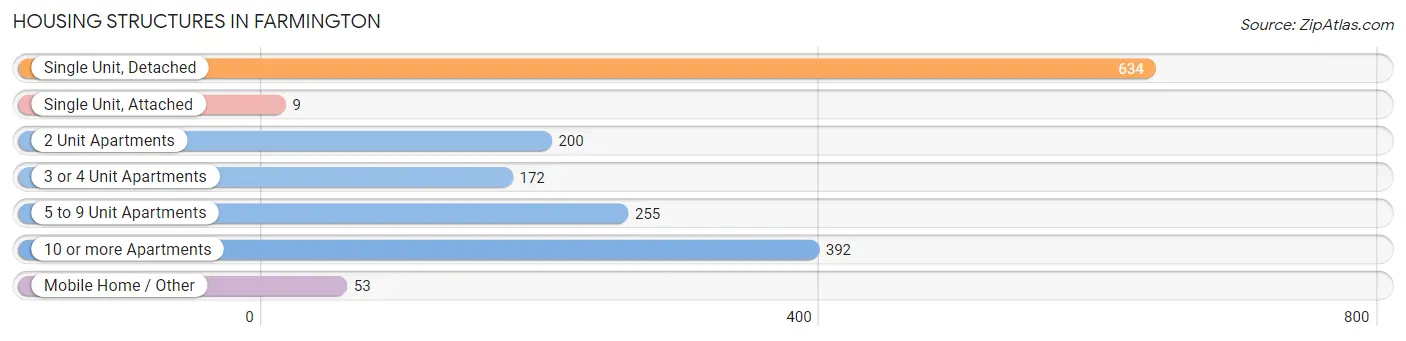
| Structure Type | # Housing Units | % Housing Units |
| Single Unit, Detached | 634 | 37.0% |
| Single Unit, Attached | 9 | 0.5% |
| 2 Unit Apartments | 200 | 11.7% |
| 3 or 4 Unit Apartments | 172 | 10.0% |
| 5 to 9 Unit Apartments | 255 | 14.9% |
| 10 or more Apartments | 392 | 22.9% |
| Mobile Home / Other | 53 | 3.1% |
| Total | 1,715 | 100.0% |
Housing Structures by Occupancy in Farmington
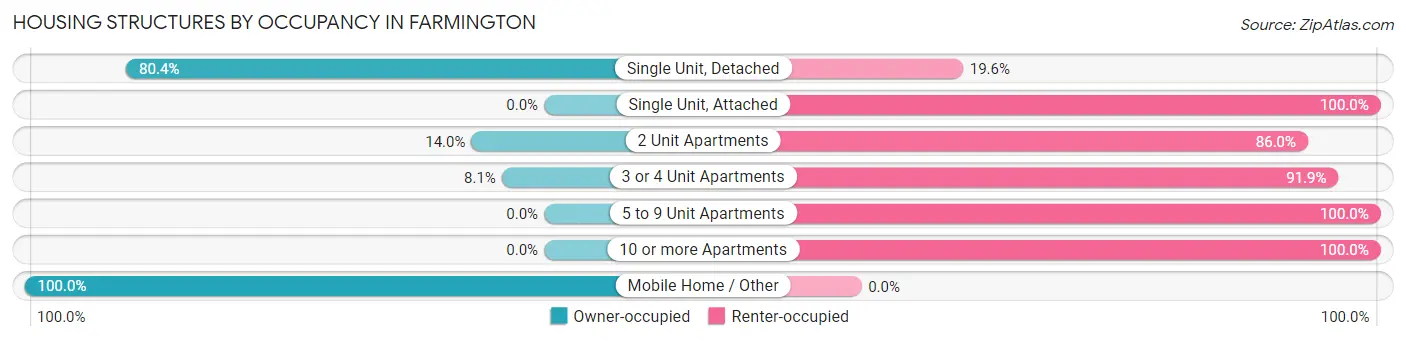
| Structure Type | Owner-occupied | Renter-occupied |
| Single Unit, Detached | 510 (80.4%) | 124 (19.6%) |
| Single Unit, Attached | 0 (0.0%) | 9 (100.0%) |
| 2 Unit Apartments | 28 (14.0%) | 172 (86.0%) |
| 3 or 4 Unit Apartments | 14 (8.1%) | 158 (91.9%) |
| 5 to 9 Unit Apartments | 0 (0.0%) | 255 (100.0%) |
| 10 or more Apartments | 0 (0.0%) | 392 (100.0%) |
| Mobile Home / Other | 53 (100.0%) | 0 (0.0%) |
| Total | 605 (35.3%) | 1,110 (64.7%) |
Housing Structures by Number of Rooms in Farmington
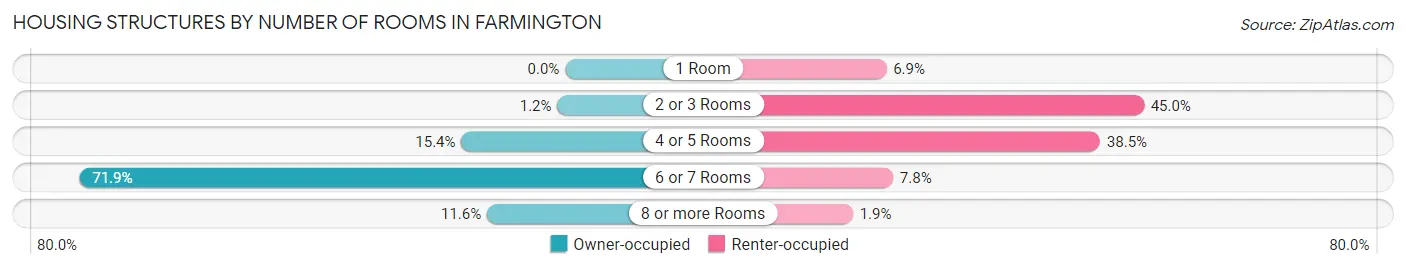
| Number of Rooms | Owner-occupied | Renter-occupied |
| 1 Room | 0 (0.0%) | 76 (6.9%) |
| 2 or 3 Rooms | 7 (1.2%) | 499 (45.0%) |
| 4 or 5 Rooms | 93 (15.4%) | 427 (38.5%) |
| 6 or 7 Rooms | 435 (71.9%) | 87 (7.8%) |
| 8 or more Rooms | 70 (11.6%) | 21 (1.9%) |
| Total | 605 (100.0%) | 1,110 (100.0%) |
Housing Structure by Heating Type in Farmington
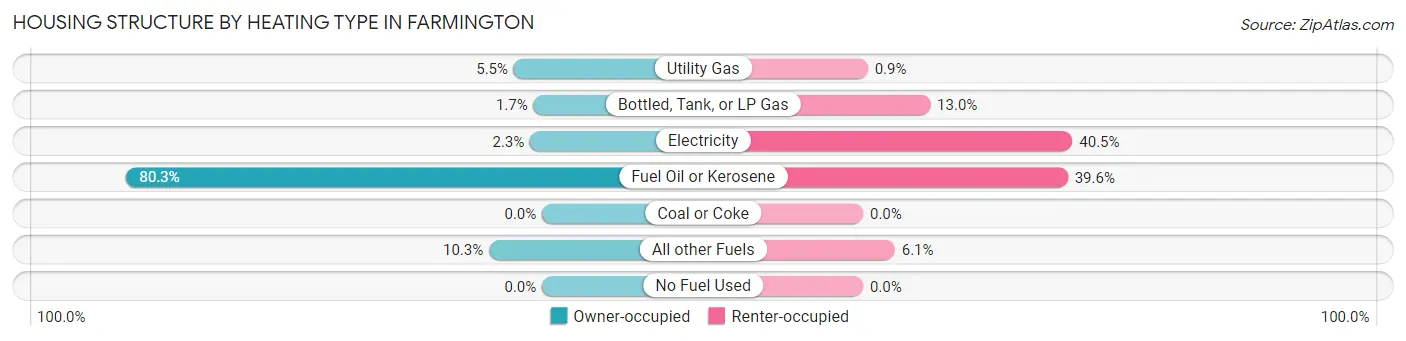
| Heating Type | Owner-occupied | Renter-occupied |
| Utility Gas | 33 (5.4%) | 10 (0.9%) |
| Bottled, Tank, or LP Gas | 10 (1.7%) | 144 (13.0%) |
| Electricity | 14 (2.3%) | 449 (40.5%) |
| Fuel Oil or Kerosene | 486 (80.3%) | 439 (39.6%) |
| Coal or Coke | 0 (0.0%) | 0 (0.0%) |
| All other Fuels | 62 (10.2%) | 68 (6.1%) |
| No Fuel Used | 0 (0.0%) | 0 (0.0%) |
| Total | 605 (100.0%) | 1,110 (100.0%) |
Household Vehicle Usage in Farmington
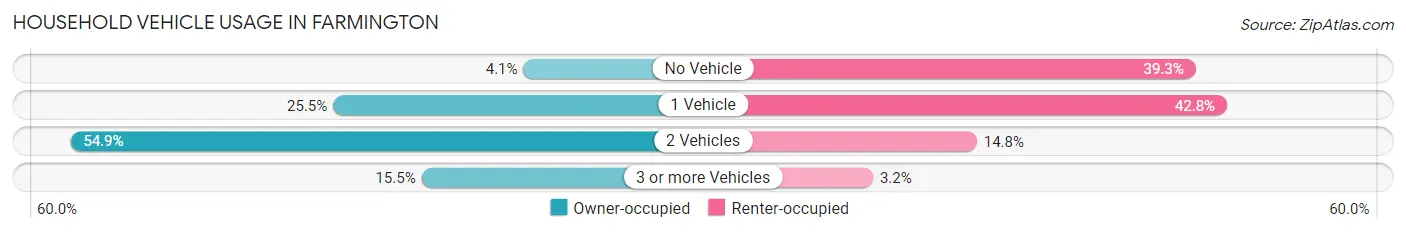
| Vehicles per Household | Owner-occupied | Renter-occupied |
| No Vehicle | 25 (4.1%) | 436 (39.3%) |
| 1 Vehicle | 154 (25.5%) | 475 (42.8%) |
| 2 Vehicles | 332 (54.9%) | 164 (14.8%) |
| 3 or more Vehicles | 94 (15.5%) | 35 (3.2%) |
| Total | 605 (100.0%) | 1,110 (100.0%) |
Real Estate & Mortgages in Farmington
Real Estate and Mortgage Overview in Farmington
| Characteristic | Without Mortgage | With Mortgage |
| Housing Units | 195 | 410 |
| Median Property Value | $135,500 | $192,700 |
| Median Household Income | - | - |
| Monthly Housing Costs | $465 | $0 |
| Real Estate Taxes | $2,583 | $0 |
Property Value by Mortgage Status in Farmington
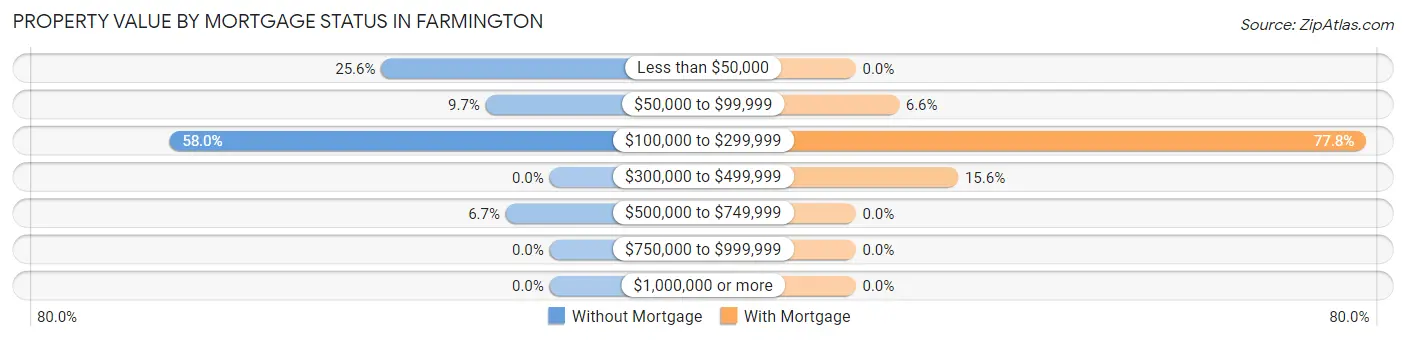
| Property Value | Without Mortgage | With Mortgage |
| Less than $50,000 | 50 (25.6%) | 0 (0.0%) |
| $50,000 to $99,999 | 19 (9.7%) | 27 (6.6%) |
| $100,000 to $299,999 | 113 (58.0%) | 319 (77.8%) |
| $300,000 to $499,999 | 0 (0.0%) | 64 (15.6%) |
| $500,000 to $749,999 | 13 (6.7%) | 0 (0.0%) |
| $750,000 to $999,999 | 0 (0.0%) | 0 (0.0%) |
| $1,000,000 or more | 0 (0.0%) | 0 (0.0%) |
| Total | 195 (100.0%) | 410 (100.0%) |
Household Income by Mortgage Status in Farmington
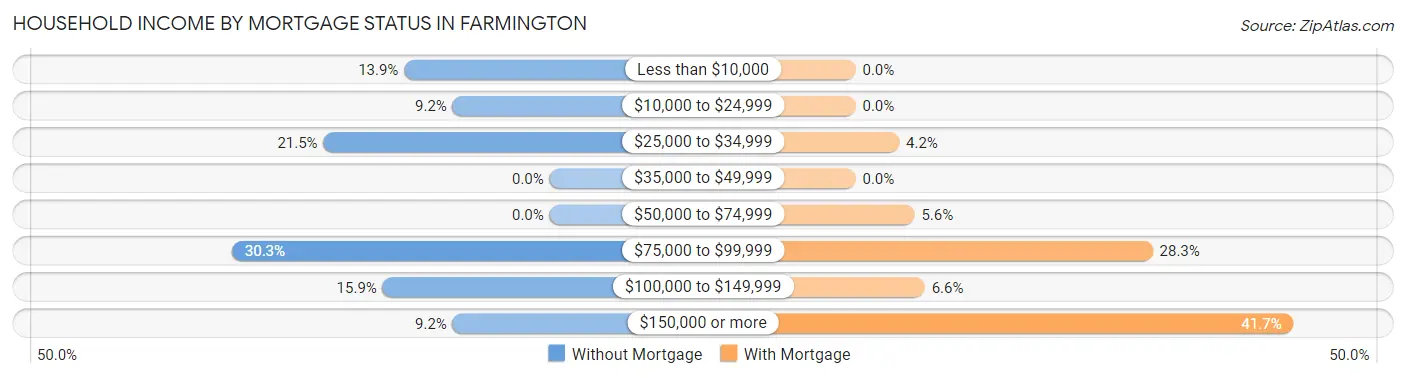
| Household Income | Without Mortgage | With Mortgage |
| Less than $10,000 | 27 (13.9%) | 0 (0.0%) |
| $10,000 to $24,999 | 18 (9.2%) | 0 (0.0%) |
| $25,000 to $34,999 | 42 (21.5%) | 17 (4.2%) |
| $35,000 to $49,999 | 0 (0.0%) | 0 (0.0%) |
| $50,000 to $74,999 | 0 (0.0%) | 23 (5.6%) |
| $75,000 to $99,999 | 59 (30.3%) | 116 (28.3%) |
| $100,000 to $149,999 | 31 (15.9%) | 27 (6.6%) |
| $150,000 or more | 18 (9.2%) | 171 (41.7%) |
| Total | 195 (100.0%) | 410 (100.0%) |
Property Value to Household Income Ratio in Farmington
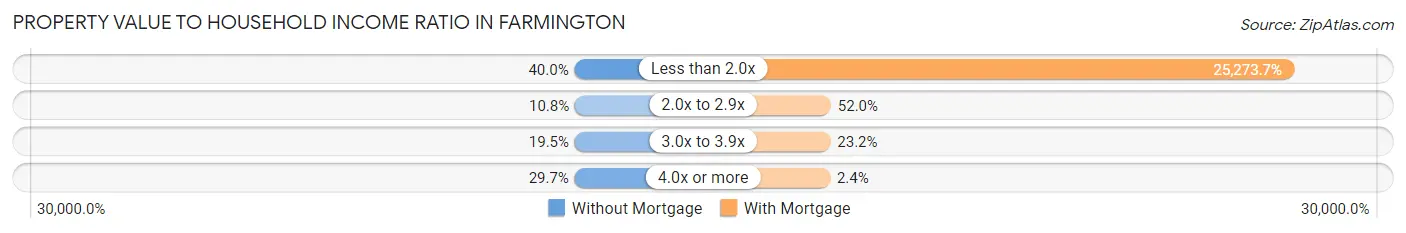
| Value-to-Income Ratio | Without Mortgage | With Mortgage |
| Less than 2.0x | 78 (40.0%) | 103,622 (25,273.7%) |
| 2.0x to 2.9x | 21 (10.8%) | 213 (51.9%) |
| 3.0x to 3.9x | 38 (19.5%) | 95 (23.2%) |
| 4.0x or more | 58 (29.7%) | 10 (2.4%) |
| Total | 195 (100.0%) | 410 (100.0%) |
Real Estate Taxes by Mortgage Status in Farmington
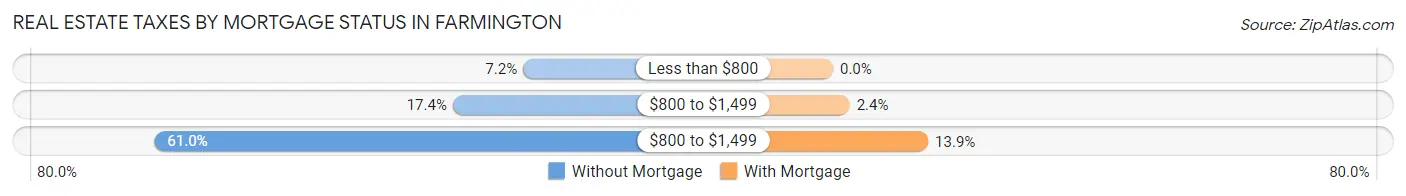
| Property Taxes | Without Mortgage | With Mortgage |
| Less than $800 | 14 (7.2%) | 0 (0.0%) |
| $800 to $1,499 | 34 (17.4%) | 10 (2.4%) |
| $800 to $1,499 | 119 (61.0%) | 57 (13.9%) |
| Total | 195 (100.0%) | 410 (100.0%) |
Health & Disability in Farmington
Health Insurance Coverage by Age in Farmington
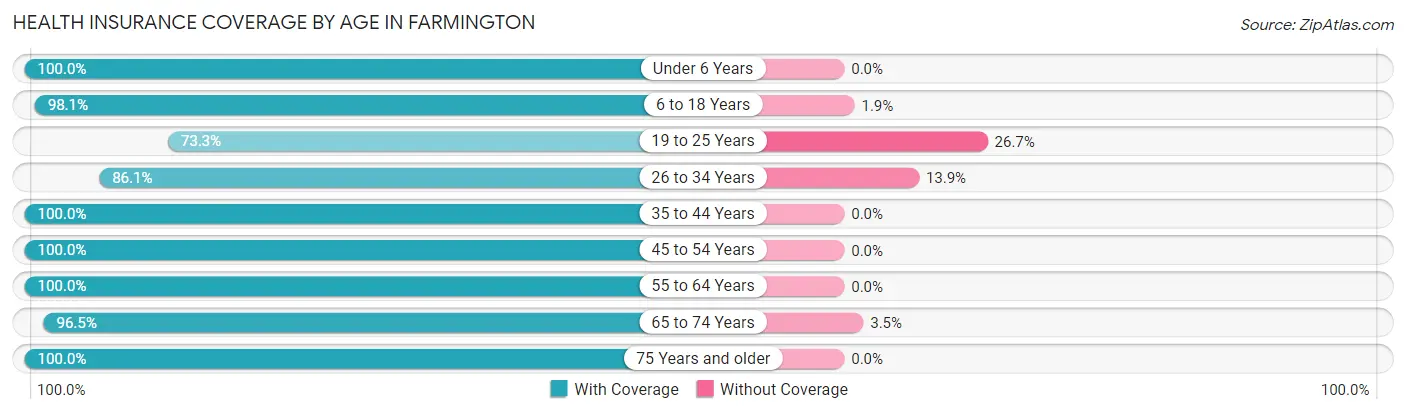
| Age Bracket | With Coverage | Without Coverage |
| Under 6 Years | 109 (100.0%) | 0 (0.0%) |
| 6 to 18 Years | 308 (98.1%) | 6 (1.9%) |
| 19 to 25 Years | 1,094 (73.3%) | 399 (26.7%) |
| 26 to 34 Years | 204 (86.1%) | 33 (13.9%) |
| 35 to 44 Years | 171 (100.0%) | 0 (0.0%) |
| 45 to 54 Years | 171 (100.0%) | 0 (0.0%) |
| 55 to 64 Years | 525 (100.0%) | 0 (0.0%) |
| 65 to 74 Years | 436 (96.5%) | 16 (3.5%) |
| 75 Years and older | 765 (100.0%) | 0 (0.0%) |
| Total | 3,783 (89.3%) | 454 (10.7%) |
Health Insurance Coverage by Citizenship Status in Farmington
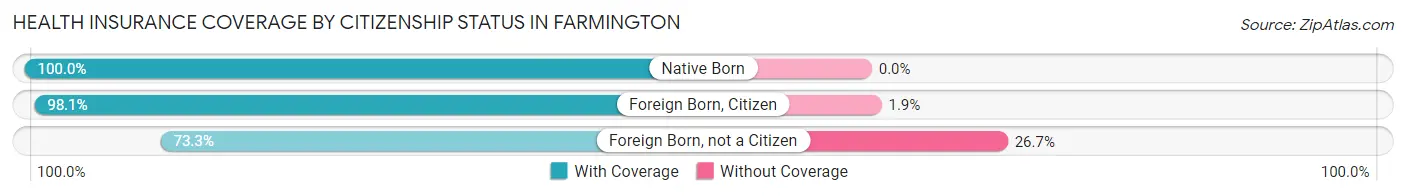
| Citizenship Status | With Coverage | Without Coverage |
| Native Born | 109 (100.0%) | 0 (0.0%) |
| Foreign Born, Citizen | 308 (98.1%) | 6 (1.9%) |
| Foreign Born, not a Citizen | 1,094 (73.3%) | 399 (26.7%) |
Health Insurance Coverage by Household Income in Farmington
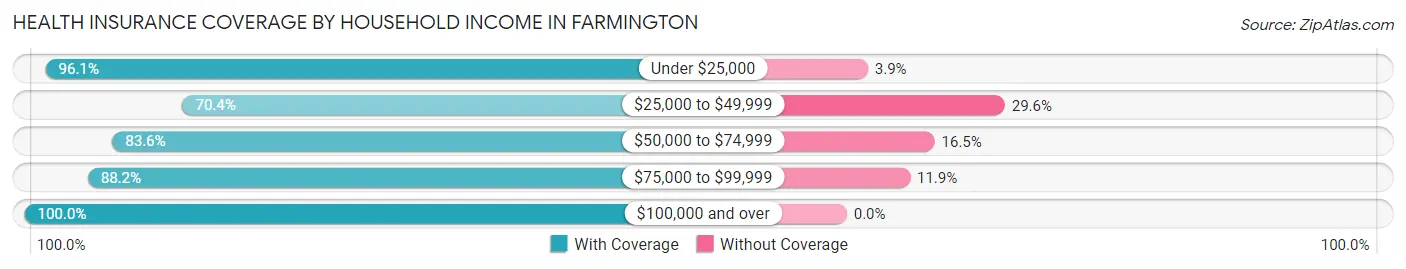
| Household Income | With Coverage | Without Coverage |
| Under $25,000 | 609 (96.1%) | 25 (3.9%) |
| $25,000 to $49,999 | 673 (70.4%) | 283 (29.6%) |
| $50,000 to $74,999 | 386 (83.6%) | 76 (16.5%) |
| $75,000 to $99,999 | 290 (88.1%) | 39 (11.8%) |
| $100,000 and over | 1,022 (100.0%) | 0 (0.0%) |
Public vs Private Health Insurance Coverage by Age in Farmington
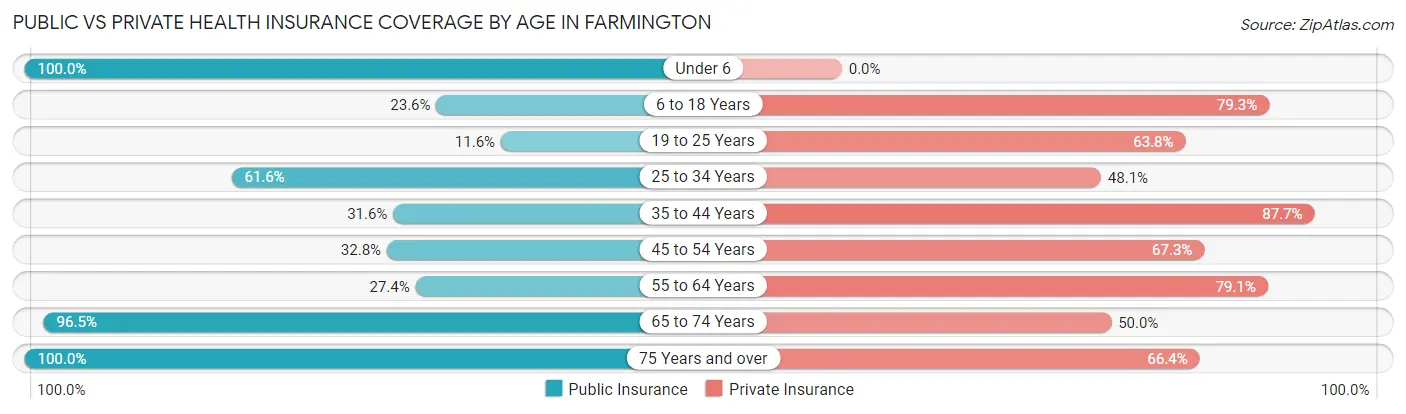
| Age Bracket | Public Insurance | Private Insurance |
| Under 6 | 109 (100.0%) | 0 (0.0%) |
| 6 to 18 Years | 74 (23.6%) | 249 (79.3%) |
| 19 to 25 Years | 173 (11.6%) | 952 (63.8%) |
| 25 to 34 Years | 146 (61.6%) | 114 (48.1%) |
| 35 to 44 Years | 54 (31.6%) | 150 (87.7%) |
| 45 to 54 Years | 56 (32.8%) | 115 (67.2%) |
| 55 to 64 Years | 144 (27.4%) | 415 (79.0%) |
| 65 to 74 Years | 436 (96.5%) | 226 (50.0%) |
| 75 Years and over | 765 (100.0%) | 508 (66.4%) |
| Total | 1,957 (46.2%) | 2,729 (64.4%) |
Disability Status by Sex by Age in Farmington
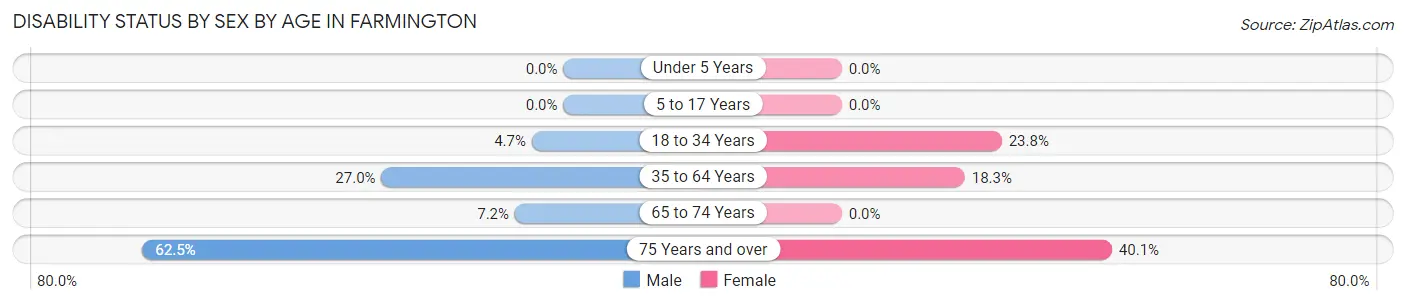
| Age Bracket | Male | Female |
| Under 5 Years | 0 (0.0%) | 0 (0.0%) |
| 5 to 17 Years | 0 (0.0%) | 0 (0.0%) |
| 18 to 34 Years | 38 (4.7%) | 256 (23.7%) |
| 35 to 64 Years | 107 (27.0%) | 86 (18.3%) |
| 65 to 74 Years | 17 (7.2%) | 0 (0.0%) |
| 75 Years and over | 140 (62.5%) | 217 (40.1%) |
Disability Class by Sex by Age in Farmington
Disability Class: Hearing Difficulty
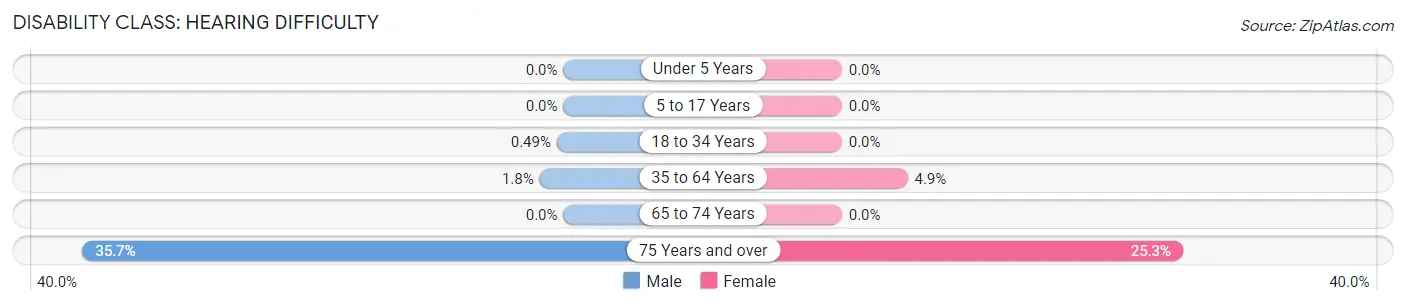
| Age Bracket | Male | Female |
| Under 5 Years | 0 (0.0%) | 0 (0.0%) |
| 5 to 17 Years | 0 (0.0%) | 0 (0.0%) |
| 18 to 34 Years | 4 (0.5%) | 0 (0.0%) |
| 35 to 64 Years | 7 (1.8%) | 23 (4.9%) |
| 65 to 74 Years | 0 (0.0%) | 0 (0.0%) |
| 75 Years and over | 80 (35.7%) | 137 (25.3%) |
Disability Class: Vision Difficulty
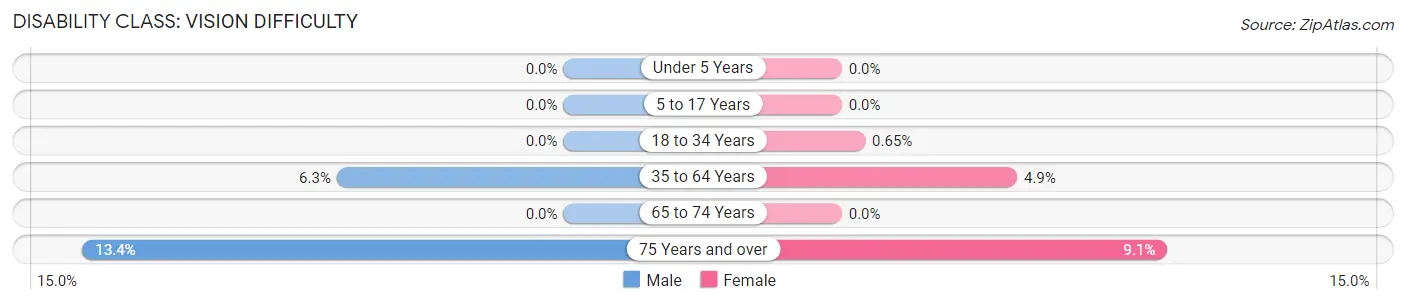
| Age Bracket | Male | Female |
| Under 5 Years | 0 (0.0%) | 0 (0.0%) |
| 5 to 17 Years | 0 (0.0%) | 0 (0.0%) |
| 18 to 34 Years | 0 (0.0%) | 7 (0.6%) |
| 35 to 64 Years | 25 (6.3%) | 23 (4.9%) |
| 65 to 74 Years | 0 (0.0%) | 0 (0.0%) |
| 75 Years and over | 30 (13.4%) | 49 (9.1%) |
Disability Class: Cognitive Difficulty
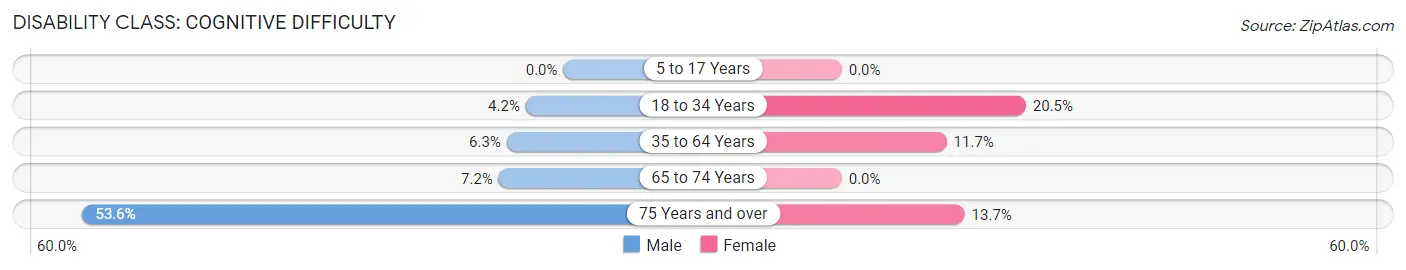
| Age Bracket | Male | Female |
| 5 to 17 Years | 0 (0.0%) | 0 (0.0%) |
| 18 to 34 Years | 34 (4.2%) | 221 (20.5%) |
| 35 to 64 Years | 25 (6.3%) | 55 (11.7%) |
| 65 to 74 Years | 17 (7.2%) | 0 (0.0%) |
| 75 Years and over | 120 (53.6%) | 74 (13.7%) |
Disability Class: Ambulatory Difficulty
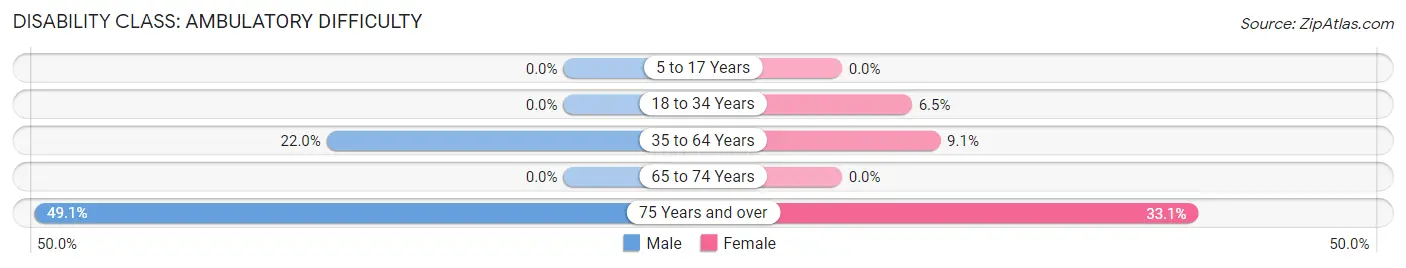
| Age Bracket | Male | Female |
| 5 to 17 Years | 0 (0.0%) | 0 (0.0%) |
| 18 to 34 Years | 0 (0.0%) | 70 (6.5%) |
| 35 to 64 Years | 87 (22.0%) | 43 (9.1%) |
| 65 to 74 Years | 0 (0.0%) | 0 (0.0%) |
| 75 Years and over | 110 (49.1%) | 179 (33.1%) |
Disability Class: Self-Care Difficulty
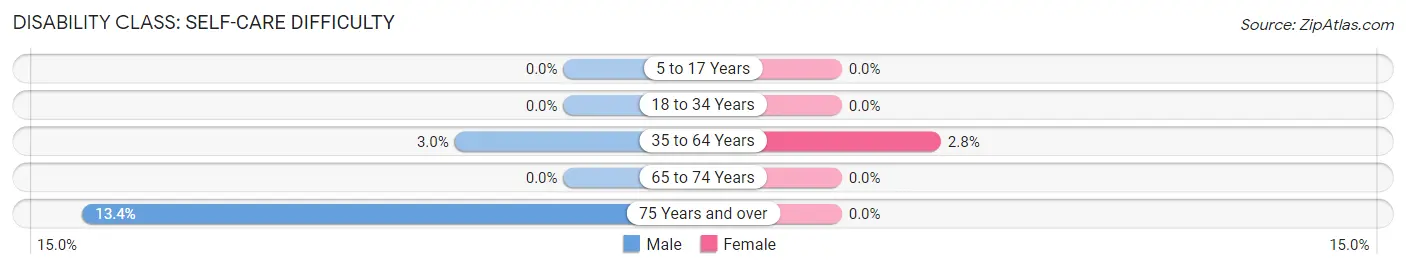
| Age Bracket | Male | Female |
| 5 to 17 Years | 0 (0.0%) | 0 (0.0%) |
| 18 to 34 Years | 0 (0.0%) | 0 (0.0%) |
| 35 to 64 Years | 12 (3.0%) | 13 (2.8%) |
| 65 to 74 Years | 0 (0.0%) | 0 (0.0%) |
| 75 Years and over | 30 (13.4%) | 0 (0.0%) |
Technology Access in Farmington
Computing Device Access in Farmington
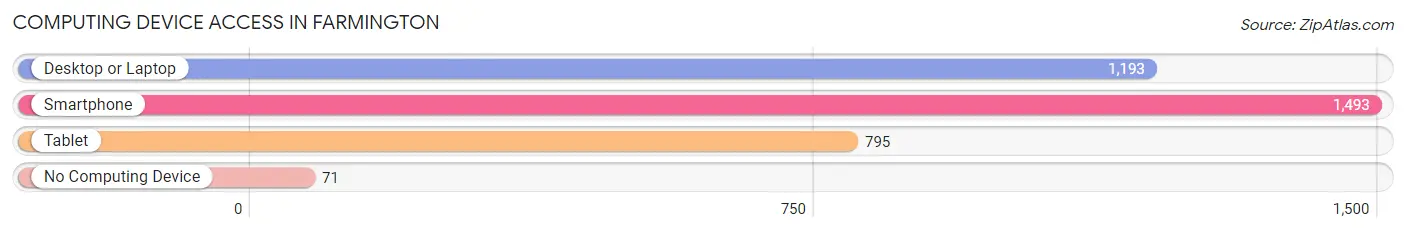
| Device Type | # Households | % Households |
| Desktop or Laptop | 1,193 | 69.6% |
| Smartphone | 1,493 | 87.1% |
| Tablet | 795 | 46.4% |
| No Computing Device | 71 | 4.1% |
| Total | 1,715 | 100.0% |
Internet Access in Farmington
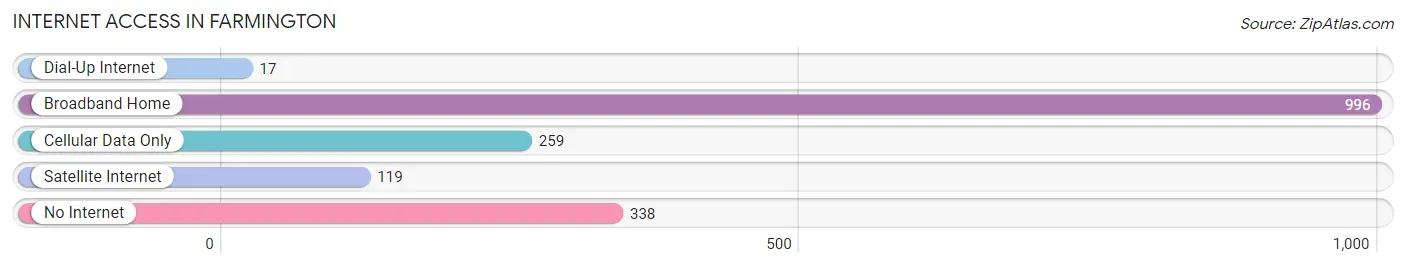
| Internet Type | # Households | % Households |
| Dial-Up Internet | 17 | 1.0% |
| Broadband Home | 996 | 58.1% |
| Cellular Data Only | 259 | 15.1% |
| Satellite Internet | 119 | 6.9% |
| No Internet | 338 | 19.7% |
| Total | 1,715 | 100.0% |
Farmington Summary
History
The area now known as Farmington, Maine was first inhabited by the Abenaki people, who called the area “Namaskeag”. The first European settlers arrived in the area in 1776, and the town was officially incorporated in 1794. The town was named after Farmington, Connecticut, where many of the settlers had come from.
The town of Farmington was initially an agricultural community, with many of the settlers growing crops such as potatoes, corn, and hay. The town also had a thriving lumber industry, with many of the settlers cutting down trees to use for building materials. The town also had a number of mills, which were used to grind grain and produce textiles.
In the 19th century, the town of Farmington began to grow and develop. The town was home to a number of businesses, including a tannery, a shoe factory, and a woolen mill. The town also had a number of churches, schools, and other public buildings.
In the 20th century, the town of Farmington continued to grow and develop. The town was home to a number of businesses, including a furniture factory, a paper mill, and a canning factory. The town also had a number of churches, schools, and other public buildings.
Geography
Farmington is located in the western part of Maine, in Franklin County. The town is situated on the banks of the Sandy River, and is bordered by the towns of Wilton, New Sharon, and Industry. The town covers an area of approximately 25 square miles, and has a population of approximately 7,000 people.
The town of Farmington is located in a rural area, and is surrounded by forests and rolling hills. The town is home to a number of lakes and ponds, including Long Pond, which is the largest lake in the area. The town is also home to a number of parks and recreational areas, including the Farmington River Trail, which is a popular hiking and biking trail.
Economy
The economy of Farmington is largely based on agriculture and tourism. The town is home to a number of farms, which produce a variety of crops, including potatoes, corn, hay, and other vegetables. The town is also home to a number of businesses, including a furniture factory, a paper mill, and a canning factory.
The town of Farmington is also a popular tourist destination, and is home to a number of attractions, including the Sandy River Railroad, which is a popular tourist attraction. The town is also home to a number of parks and recreational areas, including the Farmington River Trail, which is a popular hiking and biking trail.
Demographics
As of the 2010 census, the town of Farmington had a population of 7,000 people. The racial makeup of the town was 97.2% White, 0.7% African American, 0.3% Native American, 0.3% Asian, 0.1% Pacific Islander, 0.3% from other races, and 1.2% from two or more races. The median household income in the town was $41,000, and the median family income was $50,000. The per capita income in the town was $20,000.
Common Questions
What is Per Capita Income in Farmington?
Per Capita income in Farmington is $26,313.
What is the Median Family Income in Farmington?
Median Family Income in Farmington is $82,279.
What is the Median Household income in Farmington?
Median Household Income in Farmington is $40,350.
What is Income or Wage Gap in Farmington?
Income or Wage Gap in Farmington is 66.3%.
Women in Farmington earn 33.7 cents for every dollar earned by a man.
What is Inequality or Gini Index in Farmington?
Inequality or Gini Index in Farmington is 0.45.
What is the Total Population of Farmington?
Total Population of Farmington is 4,318.
What is the Total Male Population of Farmington?
Total Male Population of Farmington is 1,849.
What is the Total Female Population of Farmington?
Total Female Population of Farmington is 2,469.
What is the Ratio of Males per 100 Females in Farmington?
There are 74.89 Males per 100 Females in Farmington.
What is the Ratio of Females per 100 Males in Farmington?
There are 133.53 Females per 100 Males in Farmington.
What is the Median Population Age in Farmington?
Median Population Age in Farmington is 35.4 Years.
What is the Average Family Size in Farmington
Average Family Size in Farmington is 2.5 People.
What is the Average Household Size in Farmington
Average Household Size in Farmington is 2.0 People.
How Large is the Labor Force in Farmington?
There are 2,167 People in the Labor Forcein in Farmington.
What is the Percentage of People in the Labor Force in Farmington?
53.3% of People are in the Labor Force in Farmington.
What is the Unemployment Rate in Farmington?
Unemployment Rate in Farmington is 4.4%.