Augusta, ME Map & Demographics
Augusta Map
Augusta Overview
$32,743
PER CAPITA INCOME
$63,675
AVG FAMILY INCOME
$45,006
AVG HOUSEHOLD INCOME
2.6%
WAGE / INCOME GAP [ % ]
97.4¢/ $1
WAGE / INCOME GAP [ $ ]
$7,233
FAMILY INCOME DEFICIT
0.46
INEQUALITY / GINI INDEX
18,938
TOTAL POPULATION
8,921
MALE POPULATION
10,017
FEMALE POPULATION
89.06
MALES / 100 FEMALES
112.29
FEMALES / 100 MALES
44.9
MEDIAN AGE
2.7
AVG FAMILY SIZE
1.9
AVG HOUSEHOLD SIZE
9,486
LABOR FORCE [ PEOPLE ]
58.9%
PERCENT IN LABOR FORCE
7.7%
UNEMPLOYMENT RATE
Augusta Zip Codes
Augusta Area Codes
Income in Augusta
Income Overview in Augusta
Per Capita Income in Augusta is $32,743, while median incomes of families and households are $63,675 and $45,006 respectively.
| Characteristic | Number | Measure |
| Per Capita Income | 18,938 | $32,743 |
| Median Family Income | 4,113 | $63,675 |
| Mean Family Income | 4,113 | $85,225 |
| Median Household Income | 9,249 | $45,006 |
| Mean Household Income | 9,249 | $65,585 |
| Income Deficit | 4,113 | $7,233 |
| Wage / Income Gap (%) | 18,938 | 2.59% |
| Wage / Income Gap ($) | 18,938 | 97.41¢ per $1 |
| Gini / Inequality Index | 18,938 | 0.46 |
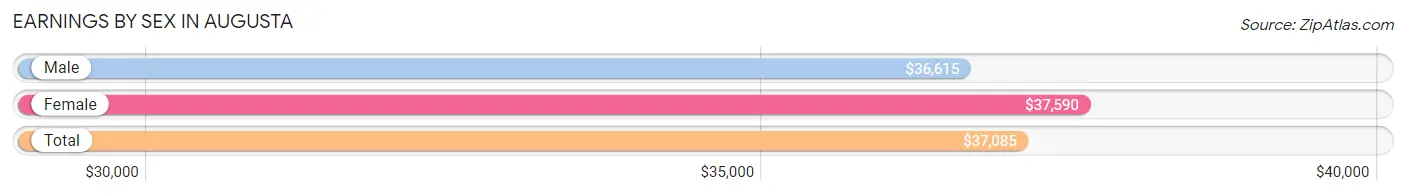
Earnings by Sex in Augusta
Average Earnings in Augusta are $37,085, $36,615 for men and $37,590 for women, a difference of 2.6%.
| Sex | Number | Average Earnings |
| Male | 5,077 (52.5%) | $36,615 |
| Female | 4,597 (47.5%) | $37,590 |
| Total | 9,674 (100.0%) | $37,085 |
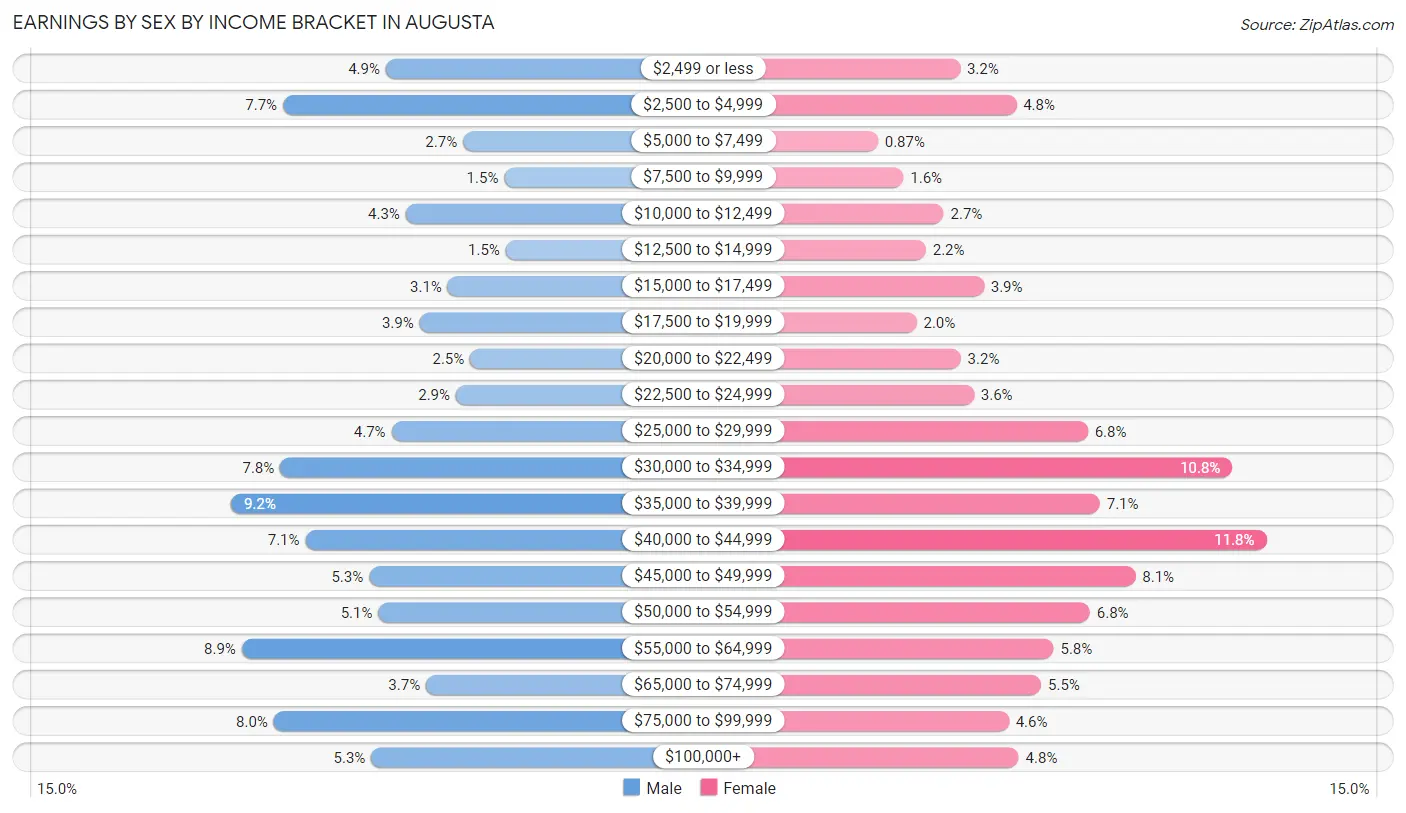
Earnings by Sex by Income Bracket in Augusta
The most common earnings brackets in Augusta are $35,000 to $39,999 for men (467 | 9.2%) and $40,000 to $44,999 for women (542 | 11.8%).
| Income | Male | Female |
| $2,499 or less | 246 (4.9%) | 146 (3.2%) |
| $2,500 to $4,999 | 393 (7.7%) | 219 (4.8%) |
| $5,000 to $7,499 | 136 (2.7%) | 40 (0.9%) |
| $7,500 to $9,999 | 77 (1.5%) | 73 (1.6%) |
| $10,000 to $12,499 | 218 (4.3%) | 125 (2.7%) |
| $12,500 to $14,999 | 75 (1.5%) | 102 (2.2%) |
| $15,000 to $17,499 | 158 (3.1%) | 177 (3.8%) |
| $17,500 to $19,999 | 198 (3.9%) | 90 (2.0%) |
| $20,000 to $22,499 | 126 (2.5%) | 147 (3.2%) |
| $22,500 to $24,999 | 146 (2.9%) | 164 (3.6%) |
| $25,000 to $29,999 | 238 (4.7%) | 311 (6.8%) |
| $30,000 to $34,999 | 397 (7.8%) | 498 (10.8%) |
| $35,000 to $39,999 | 467 (9.2%) | 327 (7.1%) |
| $40,000 to $44,999 | 361 (7.1%) | 542 (11.8%) |
| $45,000 to $49,999 | 270 (5.3%) | 373 (8.1%) |
| $50,000 to $54,999 | 257 (5.1%) | 314 (6.8%) |
| $55,000 to $64,999 | 452 (8.9%) | 267 (5.8%) |
| $65,000 to $74,999 | 189 (3.7%) | 251 (5.5%) |
| $75,000 to $99,999 | 406 (8.0%) | 209 (4.5%) |
| $100,000+ | 267 (5.3%) | 222 (4.8%) |
| Total | 5,077 (100.0%) | 4,597 (100.0%) |
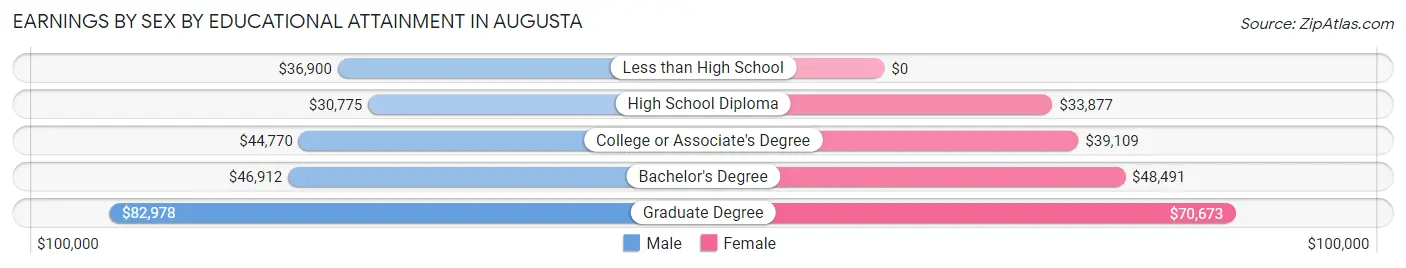
Earnings by Sex by Educational Attainment in Augusta
Average earnings in Augusta are $38,331 for men and $40,995 for women, a difference of 6.5%. Men with an educational attainment of graduate degree enjoy the highest average annual earnings of $82,978, while those with high school diploma education earn the least with $30,775. Women with an educational attainment of graduate degree earn the most with the average annual earnings of $70,673, while those with high school diploma education have the smallest earnings of $33,877.
| Educational Attainment | Male Income | Female Income |
| Less than High School | $36,900 | $0 |
| High School Diploma | $30,775 | $33,877 |
| College or Associate's Degree | $44,770 | $39,109 |
| Bachelor's Degree | $46,912 | $48,491 |
| Graduate Degree | $82,978 | $70,673 |
| Total | $38,331 | $40,995 |
Family Income in Augusta
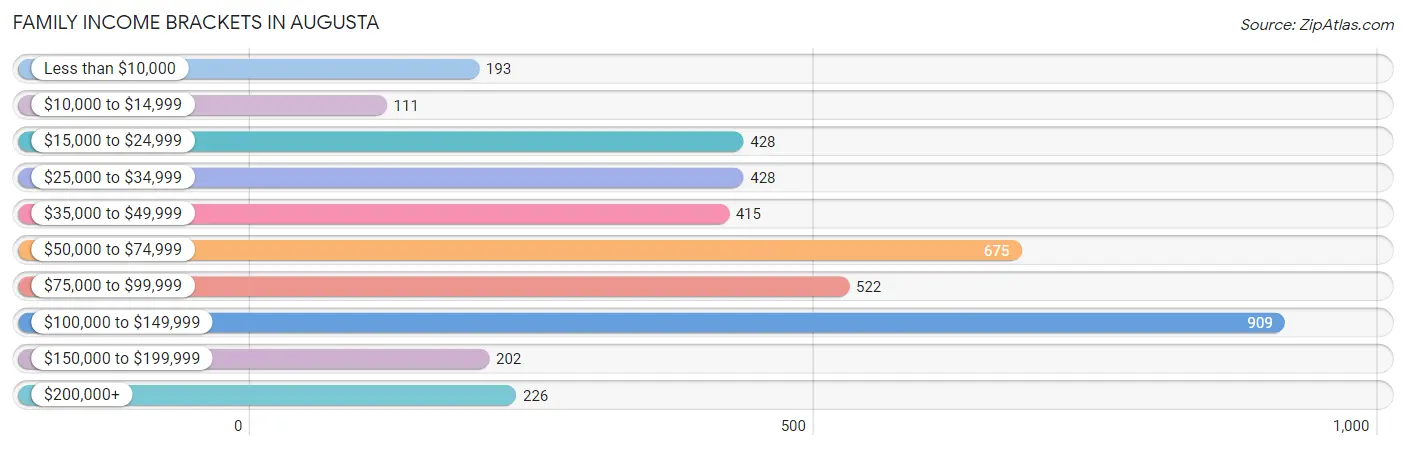
Family Income Brackets in Augusta
According to the Augusta family income data, there are 909 families falling into the $100,000 to $149,999 income range, which is the most common income bracket and makes up 22.1% of all families. Conversely, the $10,000 to $14,999 income bracket is the least frequent group with only 111 families (2.7%) belonging to this category.
| Income Bracket | # Families | % Families |
| Less than $10,000 | 193 | 4.7% |
| $10,000 to $14,999 | 111 | 2.7% |
| $15,000 to $24,999 | 428 | 10.4% |
| $25,000 to $34,999 | 428 | 10.4% |
| $35,000 to $49,999 | 415 | 10.1% |
| $50,000 to $74,999 | 675 | 16.4% |
| $75,000 to $99,999 | 522 | 12.7% |
| $100,000 to $149,999 | 909 | 22.1% |
| $150,000 to $199,999 | 202 | 4.9% |
| $200,000+ | 226 | 5.5% |
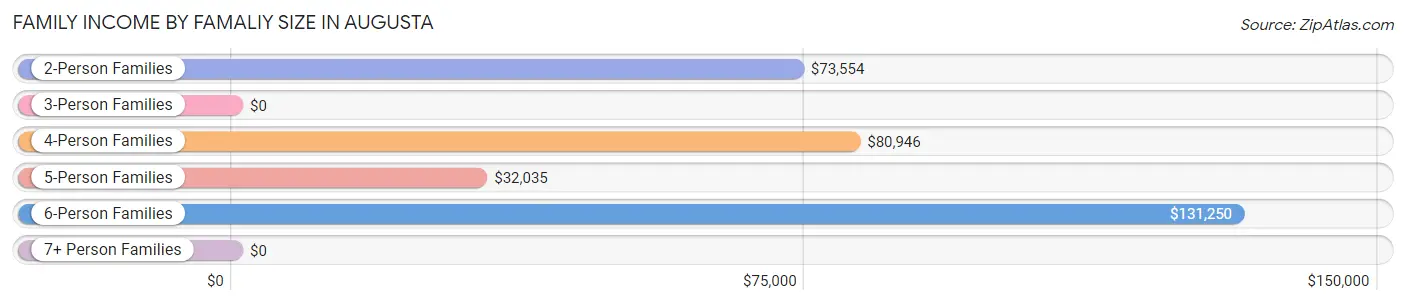
Family Income by Famaliy Size in Augusta
6-person families (34 | 0.8%) account for the highest median family income in Augusta with $131,250 per family, while 2-person families (2,066 | 50.2%) have the highest median income of $36,777 per family member.
| Income Bracket | # Families | Median Income |
| 2-Person Families | 2,066 (50.2%) | $73,554 |
| 3-Person Families | 1,362 (33.1%) | $0 |
| 4-Person Families | 396 (9.6%) | $80,946 |
| 5-Person Families | 255 (6.2%) | $32,035 |
| 6-Person Families | 34 (0.8%) | $131,250 |
| 7+ Person Families | 0 (0.0%) | $0 |
| Total | 4,113 (100.0%) | $63,675 |
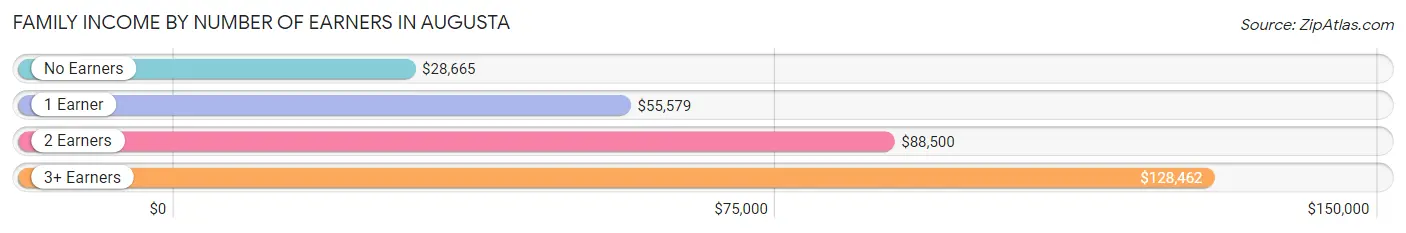
Family Income by Number of Earners in Augusta
The median family income in Augusta is $63,675, with families comprising 3+ earners (258) having the highest median family income of $128,462, while families with no earners (935) have the lowest median family income of $28,665, accounting for 6.3% and 22.7% of families, respectively.
| Number of Earners | # Families | Median Income |
| No Earners | 935 (22.7%) | $28,665 |
| 1 Earner | 1,350 (32.8%) | $55,579 |
| 2 Earners | 1,570 (38.2%) | $88,500 |
| 3+ Earners | 258 (6.3%) | $128,462 |
| Total | 4,113 (100.0%) | $63,675 |
Household Income in Augusta
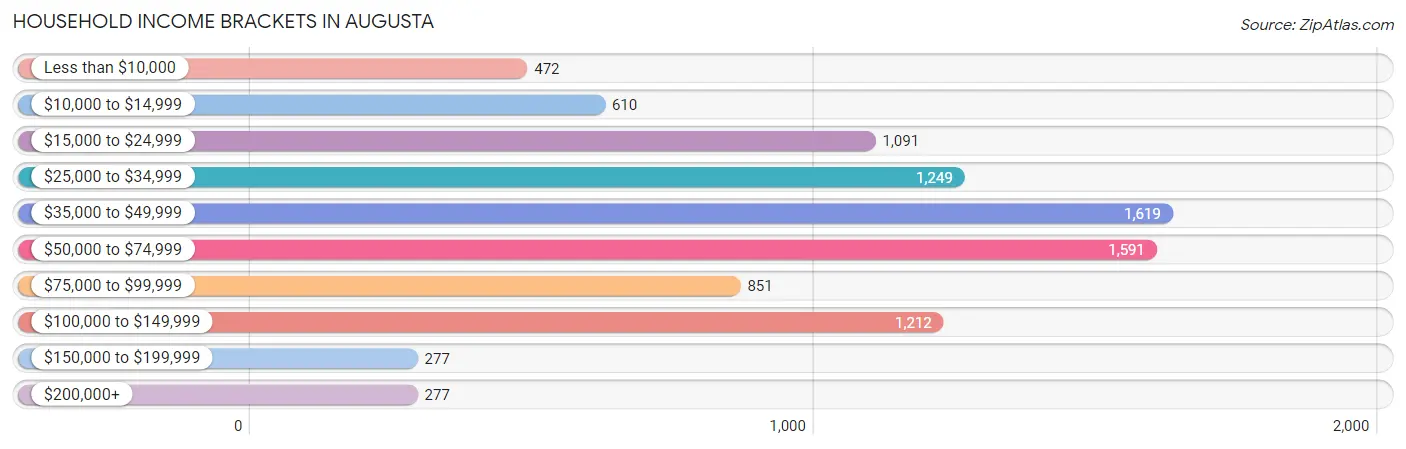
Household Income Brackets in Augusta
With 1,619 households falling in the category, the $35,000 to $49,999 income range is the most frequent in Augusta, accounting for 17.5% of all households. In contrast, only 277 households (3.0%) fall into the $150,000 to $199,999 income bracket, making it the least populous group.
| Income Bracket | # Households | % Households |
| Less than $10,000 | 472 | 5.1% |
| $10,000 to $14,999 | 610 | 6.6% |
| $15,000 to $24,999 | 1,091 | 11.8% |
| $25,000 to $34,999 | 1,249 | 13.5% |
| $35,000 to $49,999 | 1,619 | 17.5% |
| $50,000 to $74,999 | 1,591 | 17.2% |
| $75,000 to $99,999 | 851 | 9.2% |
| $100,000 to $149,999 | 1,212 | 13.1% |
| $150,000 to $199,999 | 277 | 3.0% |
| $200,000+ | 277 | 3.0% |
Household Income by Householder Age in Augusta
The median household income in Augusta is $45,006, with the highest median household income of $57,909 found in the 45 to 64 years age bracket for the primary householder. A total of 3,460 households (37.4%) fall into this category. Meanwhile, the 65+ years age bracket for the primary householder has the lowest median household income of $35,625, with 2,887 households (31.2%) in this group.
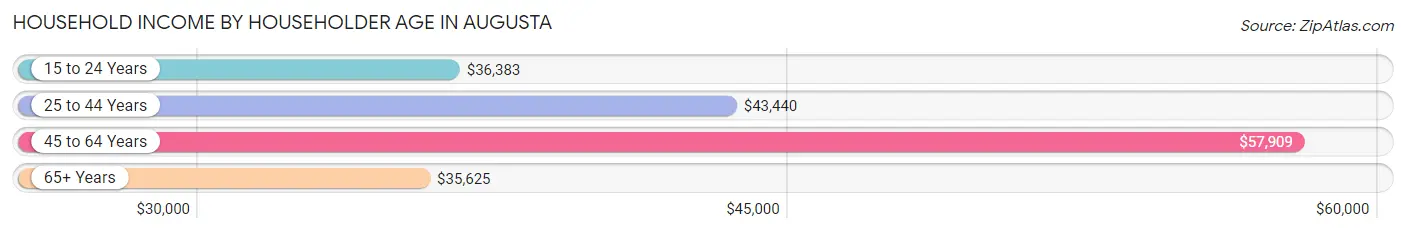
| Income Bracket | # Households | Median Income |
| 15 to 24 Years | 326 (3.5%) | $36,383 |
| 25 to 44 Years | 2,576 (27.9%) | $43,440 |
| 45 to 64 Years | 3,460 (37.4%) | $57,909 |
| 65+ Years | 2,887 (31.2%) | $35,625 |
| Total | 9,249 (100.0%) | $45,006 |
Poverty in Augusta
Income Below Poverty by Sex and Age in Augusta
With 17.6% poverty level for males and 27.4% for females among the residents of Augusta, 6 to 11 year old males and 5 year old females are the most vulnerable to poverty, with 228 males (50.4%) and 126 females (100.0%) in their respective age groups living below the poverty level.
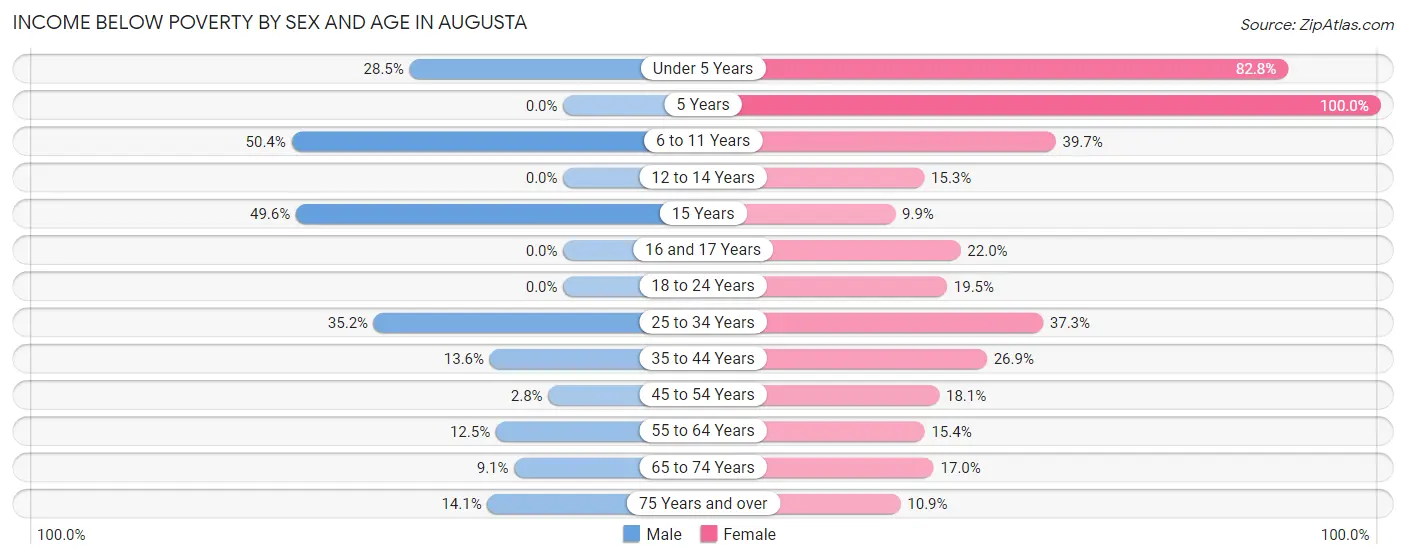
| Age Bracket | Male | Female |
| Under 5 Years | 125 (28.5%) | 593 (82.8%) |
| 5 Years | 0 (0.0%) | 126 (100.0%) |
| 6 to 11 Years | 228 (50.4%) | 198 (39.7%) |
| 12 to 14 Years | 0 (0.0%) | 22 (15.3%) |
| 15 Years | 64 (49.6%) | 10 (9.9%) |
| 16 and 17 Years | 0 (0.0%) | 48 (22.0%) |
| 18 to 24 Years | 0 (0.0%) | 117 (19.5%) |
| 25 to 34 Years | 577 (35.2%) | 537 (37.3%) |
| 35 to 44 Years | 124 (13.6%) | 258 (26.9%) |
| 45 to 54 Years | 31 (2.8%) | 224 (18.0%) |
| 55 to 64 Years | 172 (12.5%) | 209 (15.3%) |
| 65 to 74 Years | 78 (9.1%) | 182 (17.0%) |
| 75 Years and over | 86 (14.1%) | 132 (10.9%) |
| Total | 1,485 (17.6%) | 2,656 (27.4%) |
Income Above Poverty by Sex and Age in Augusta
According to the poverty statistics in Augusta, males aged 5 years and females aged 15 years are the age groups that are most secure financially, with 100.0% of males and 90.1% of females in these age groups living above the poverty line.
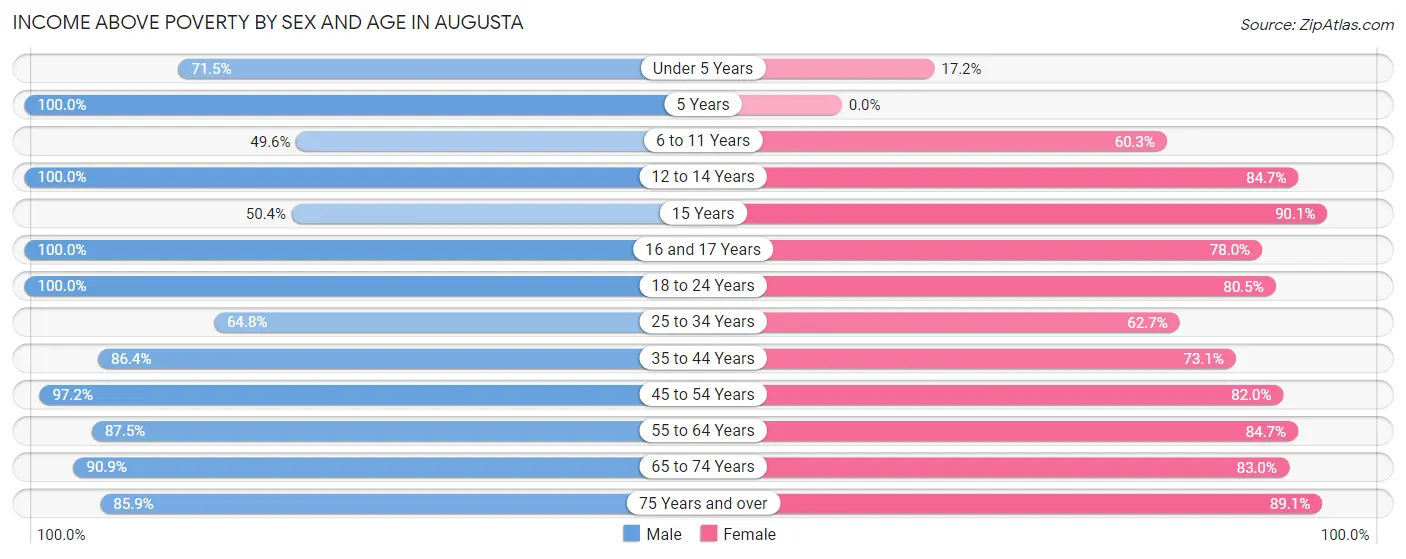
| Age Bracket | Male | Female |
| Under 5 Years | 313 (71.5%) | 123 (17.2%) |
| 5 Years | 44 (100.0%) | 0 (0.0%) |
| 6 to 11 Years | 224 (49.6%) | 301 (60.3%) |
| 12 to 14 Years | 165 (100.0%) | 122 (84.7%) |
| 15 Years | 65 (50.4%) | 91 (90.1%) |
| 16 and 17 Years | 255 (100.0%) | 170 (78.0%) |
| 18 to 24 Years | 455 (100.0%) | 483 (80.5%) |
| 25 to 34 Years | 1,064 (64.8%) | 902 (62.7%) |
| 35 to 44 Years | 785 (86.4%) | 701 (73.1%) |
| 45 to 54 Years | 1,089 (97.2%) | 1,017 (82.0%) |
| 55 to 64 Years | 1,204 (87.5%) | 1,153 (84.7%) |
| 65 to 74 Years | 780 (90.9%) | 886 (83.0%) |
| 75 Years and over | 525 (85.9%) | 1,082 (89.1%) |
| Total | 6,968 (82.4%) | 7,031 (72.6%) |
Income Below Poverty Among Married-Couple Families in Augusta
The poverty statistics for married-couple families in Augusta show that 3.7% or 90 of the total 2,417 families live below the poverty line. Families with 1 or 2 children have the highest poverty rate of 3.9%, comprising of 26 families. On the other hand, families with 3 or 4 children have the lowest poverty rate of 0.0%, which includes 0 families.
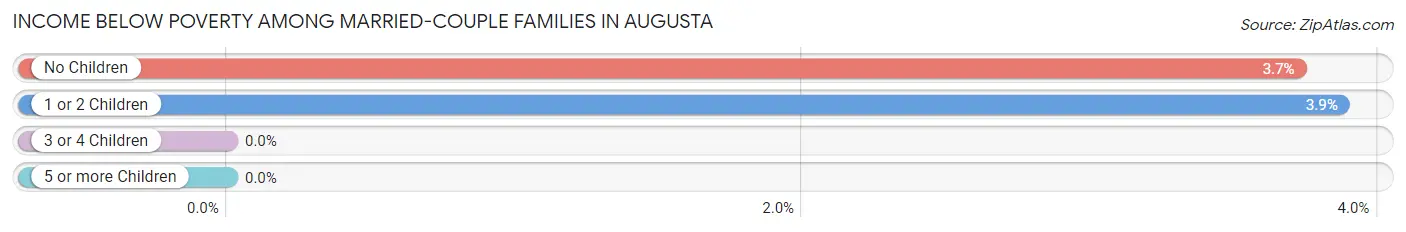
| Children | Above Poverty | Below Poverty |
| No Children | 1,656 (96.3%) | 64 (3.7%) |
| 1 or 2 Children | 645 (96.1%) | 26 (3.9%) |
| 3 or 4 Children | 26 (100.0%) | 0 (0.0%) |
| 5 or more Children | 0 (0.0%) | 0 (0.0%) |
| Total | 2,327 (96.3%) | 90 (3.7%) |
Income Below Poverty Among Single-Parent Households in Augusta
According to the poverty data in Augusta, 30.8% or 90 single-father households and 44.1% or 619 single-mother households are living below the poverty line. Among single-father households, those with 1 or 2 children have the highest poverty rate, with 60 households (38.7%) experiencing poverty. Likewise, among single-mother households, those with 3 or 4 children have the highest poverty rate, with 150 households (82.4%) falling below the poverty line.
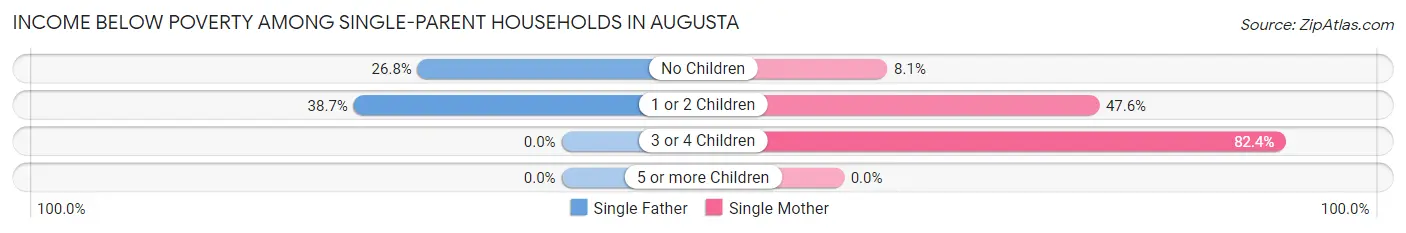
| Children | Single Father | Single Mother |
| No Children | 30 (26.8%) | 23 (8.1%) |
| 1 or 2 Children | 60 (38.7%) | 446 (47.5%) |
| 3 or 4 Children | 0 (0.0%) | 150 (82.4%) |
| 5 or more Children | 0 (0.0%) | 0 (0.0%) |
| Total | 90 (30.8%) | 619 (44.1%) |
Income Below Poverty Among Married-Couple vs Single-Parent Households in Augusta
The poverty data for Augusta shows that 90 of the married-couple family households (3.7%) and 709 of the single-parent households (41.8%) are living below the poverty level. Within the married-couple family households, those with 1 or 2 children have the highest poverty rate, with 26 households (3.9%) falling below the poverty line. Among the single-parent households, those with 3 or 4 children have the highest poverty rate, with 150 household (72.5%) living below poverty.
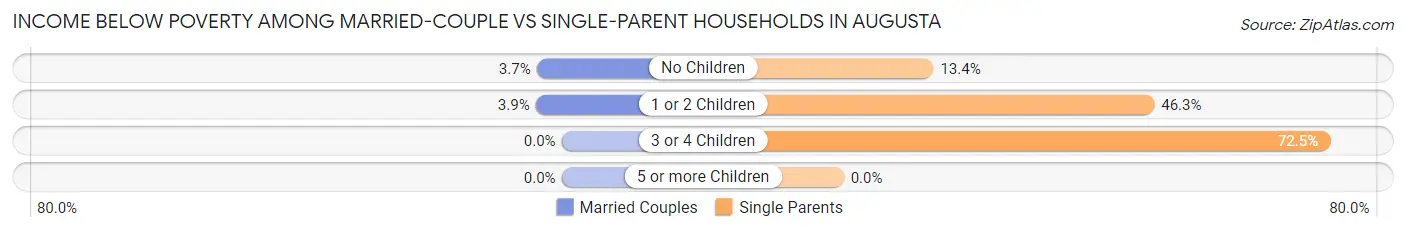
| Children | Married-Couple Families | Single-Parent Households |
| No Children | 64 (3.7%) | 53 (13.4%) |
| 1 or 2 Children | 26 (3.9%) | 506 (46.3%) |
| 3 or 4 Children | 0 (0.0%) | 150 (72.5%) |
| 5 or more Children | 0 (0.0%) | 0 (0.0%) |
| Total | 90 (3.7%) | 709 (41.8%) |
Race in Augusta
The most populous races in Augusta are White / Caucasian (17,651 | 93.2%), Two or more Races (517 | 2.7%), and Hispanic or Latino (463 | 2.4%).
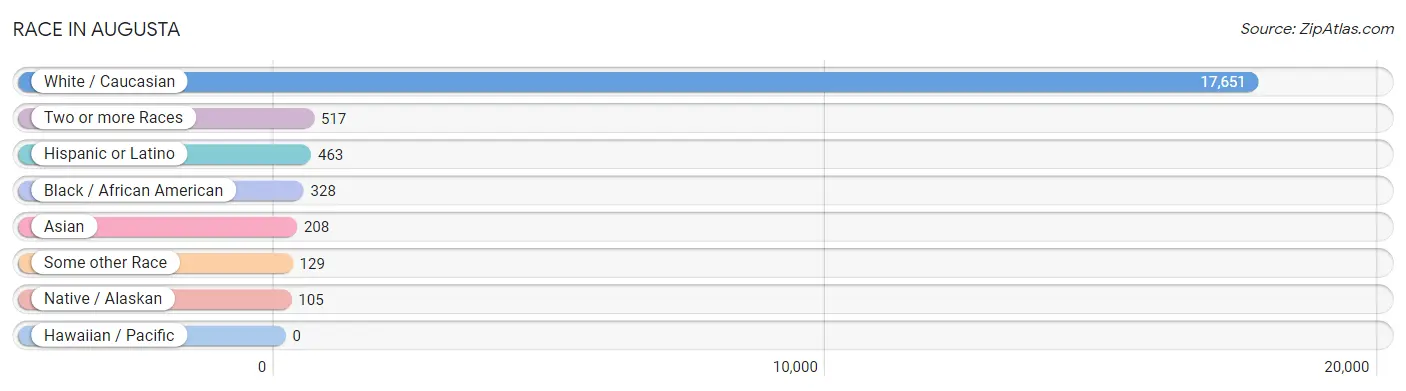
| Race | # Population | % Population |
| Asian | 208 | 1.1% |
| Black / African American | 328 | 1.7% |
| Hawaiian / Pacific | 0 | 0.0% |
| Hispanic or Latino | 463 | 2.4% |
| Native / Alaskan | 105 | 0.5% |
| White / Caucasian | 17,651 | 93.2% |
| Two or more Races | 517 | 2.7% |
| Some other Race | 129 | 0.7% |
| Total | 18,938 | 100.0% |
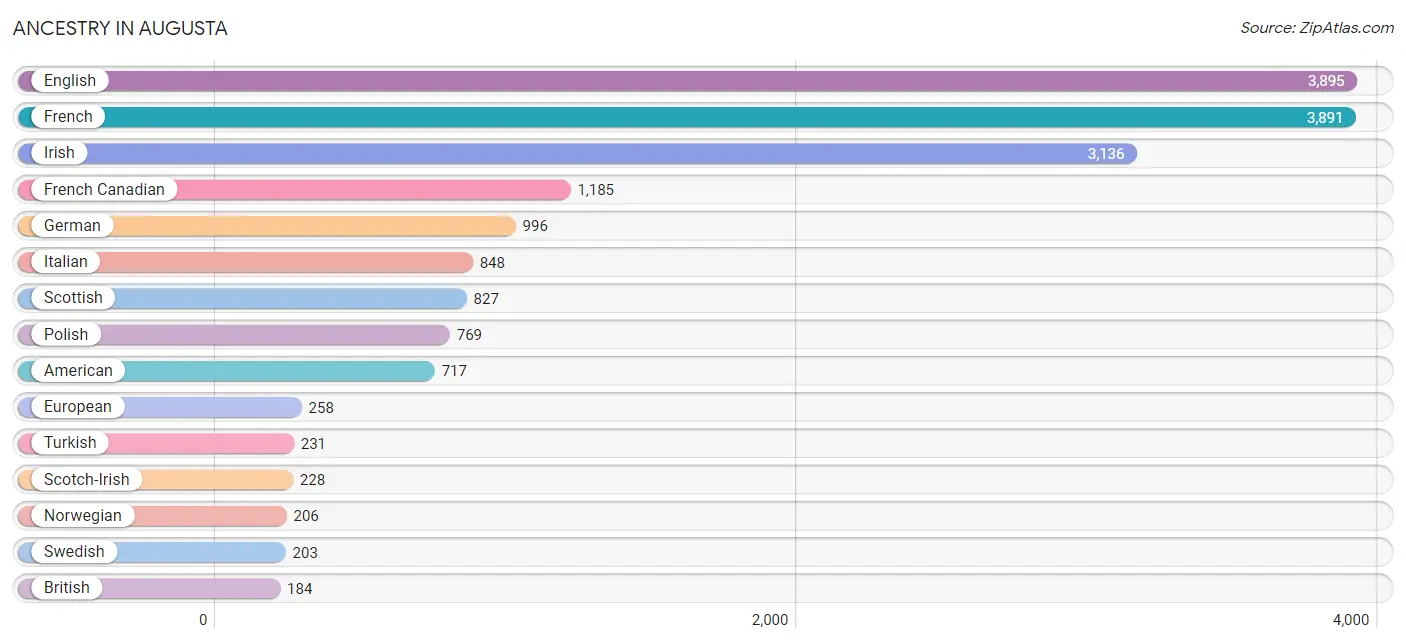
Ancestry in Augusta
The most populous ancestries reported in Augusta are English (3,895 | 20.6%), French (3,891 | 20.5%), Irish (3,136 | 16.6%), French Canadian (1,185 | 6.3%), and German (996 | 5.3%), together accounting for 69.2% of all Augusta residents.
| Ancestry | # Population | % Population |
| African | 22 | 0.1% |
| Albanian | 5 | 0.0% |
| American | 717 | 3.8% |
| Arab | 53 | 0.3% |
| Austrian | 23 | 0.1% |
| Blackfeet | 101 | 0.5% |
| British | 184 | 1.0% |
| British West Indian | 8 | 0.0% |
| Burmese | 10 | 0.1% |
| Canadian | 146 | 0.8% |
| Celtic | 5 | 0.0% |
| Central American | 2 | 0.0% |
| Cuban | 98 | 0.5% |
| Czech | 28 | 0.2% |
| Czechoslovakian | 5 | 0.0% |
| Dominican | 10 | 0.1% |
| Dutch | 15 | 0.1% |
| Eastern European | 9 | 0.1% |
| Ecuadorian | 25 | 0.1% |
| English | 3,895 | 20.6% |
| European | 258 | 1.4% |
| Finnish | 88 | 0.5% |
| French | 3,891 | 20.5% |
| French Canadian | 1,185 | 6.3% |
| German | 996 | 5.3% |
| Greek | 25 | 0.1% |
| Guatemalan | 2 | 0.0% |
| Haitian | 18 | 0.1% |
| Hungarian | 27 | 0.1% |
| Indian (Asian) | 13 | 0.1% |
| Indonesian | 6 | 0.0% |
| Inupiat | 12 | 0.1% |
| Iraqi | 37 | 0.2% |
| Irish | 3,136 | 16.6% |
| Italian | 848 | 4.5% |
| Jamaican | 60 | 0.3% |
| Korean | 36 | 0.2% |
| Lithuanian | 25 | 0.1% |
| Mexican | 157 | 0.8% |
| Moroccan | 16 | 0.1% |
| Northern European | 32 | 0.2% |
| Norwegian | 206 | 1.1% |
| Polish | 769 | 4.1% |
| Portuguese | 84 | 0.4% |
| Puerto Rican | 73 | 0.4% |
| Russian | 26 | 0.1% |
| Scandinavian | 26 | 0.1% |
| Scotch-Irish | 228 | 1.2% |
| Scottish | 827 | 4.4% |
| Slovak | 13 | 0.1% |
| South American | 25 | 0.1% |
| Spaniard | 74 | 0.4% |
| Spanish | 10 | 0.1% |
| Sri Lankan | 120 | 0.6% |
| Subsaharan African | 22 | 0.1% |
| Swedish | 203 | 1.1% |
| Swiss | 44 | 0.2% |
| Thai | 86 | 0.4% |
| Turkish | 231 | 1.2% |
| Ukrainian | 2 | 0.0% |
| Welsh | 96 | 0.5% | View All 61 Rows |
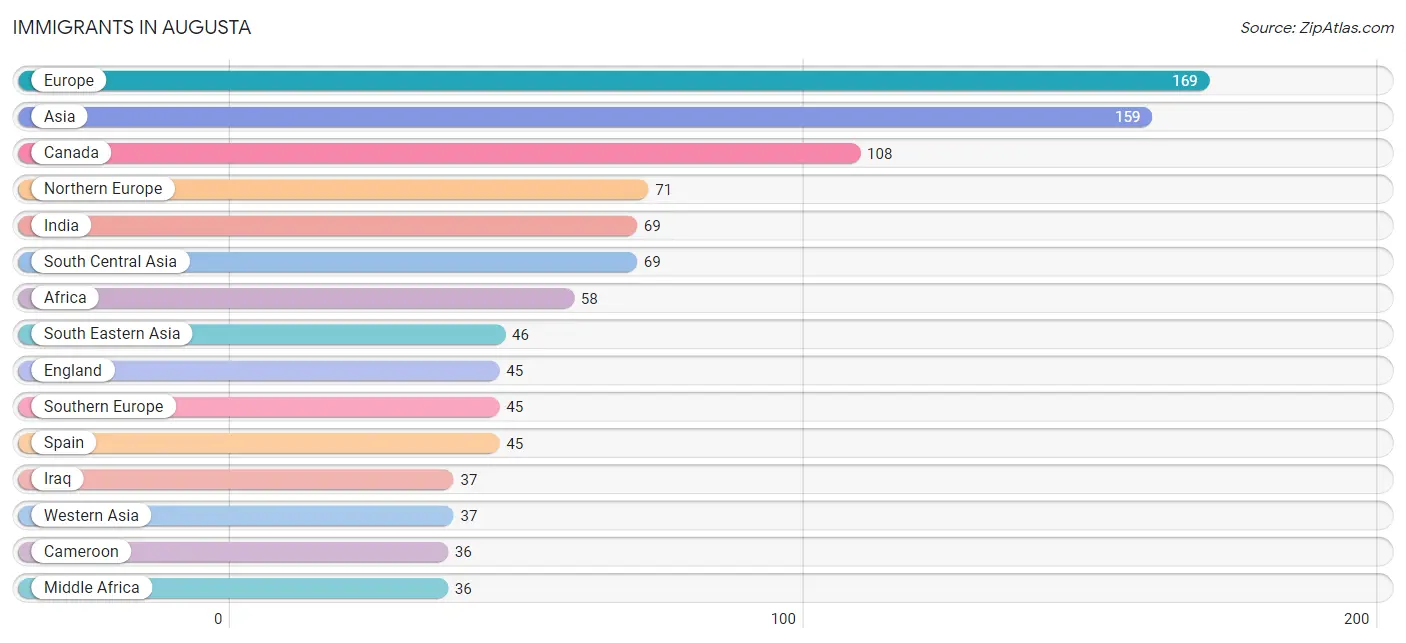
Immigrants in Augusta
The most numerous immigrant groups reported in Augusta came from Europe (169 | 0.9%), Asia (159 | 0.8%), Canada (108 | 0.6%), Northern Europe (71 | 0.4%), and India (69 | 0.4%), together accounting for 3.0% of all Augusta residents.
| Immigration Origin | # Population | % Population |
| Africa | 58 | 0.3% |
| Asia | 159 | 0.8% |
| Cameroon | 36 | 0.2% |
| Canada | 108 | 0.6% |
| China | 7 | 0.0% |
| Eastern Africa | 4 | 0.0% |
| Eastern Asia | 7 | 0.0% |
| Eastern Europe | 21 | 0.1% |
| Ecuador | 25 | 0.1% |
| England | 45 | 0.2% |
| Ethiopia | 4 | 0.0% |
| Europe | 169 | 0.9% |
| Germany | 12 | 0.1% |
| India | 69 | 0.4% |
| Iraq | 37 | 0.2% |
| Latin America | 25 | 0.1% |
| Middle Africa | 36 | 0.2% |
| Netherlands | 20 | 0.1% |
| Northern Africa | 18 | 0.1% |
| Northern Europe | 71 | 0.4% |
| Norway | 9 | 0.1% |
| Philippines | 24 | 0.1% |
| Poland | 12 | 0.1% |
| Russia | 9 | 0.1% |
| South America | 25 | 0.1% |
| South Central Asia | 69 | 0.4% |
| South Eastern Asia | 46 | 0.2% |
| Southern Europe | 45 | 0.2% |
| Spain | 45 | 0.2% |
| Sudan | 18 | 0.1% |
| Vietnam | 16 | 0.1% |
| Western Asia | 37 | 0.2% |
| Western Europe | 32 | 0.2% | View All 33 Rows |
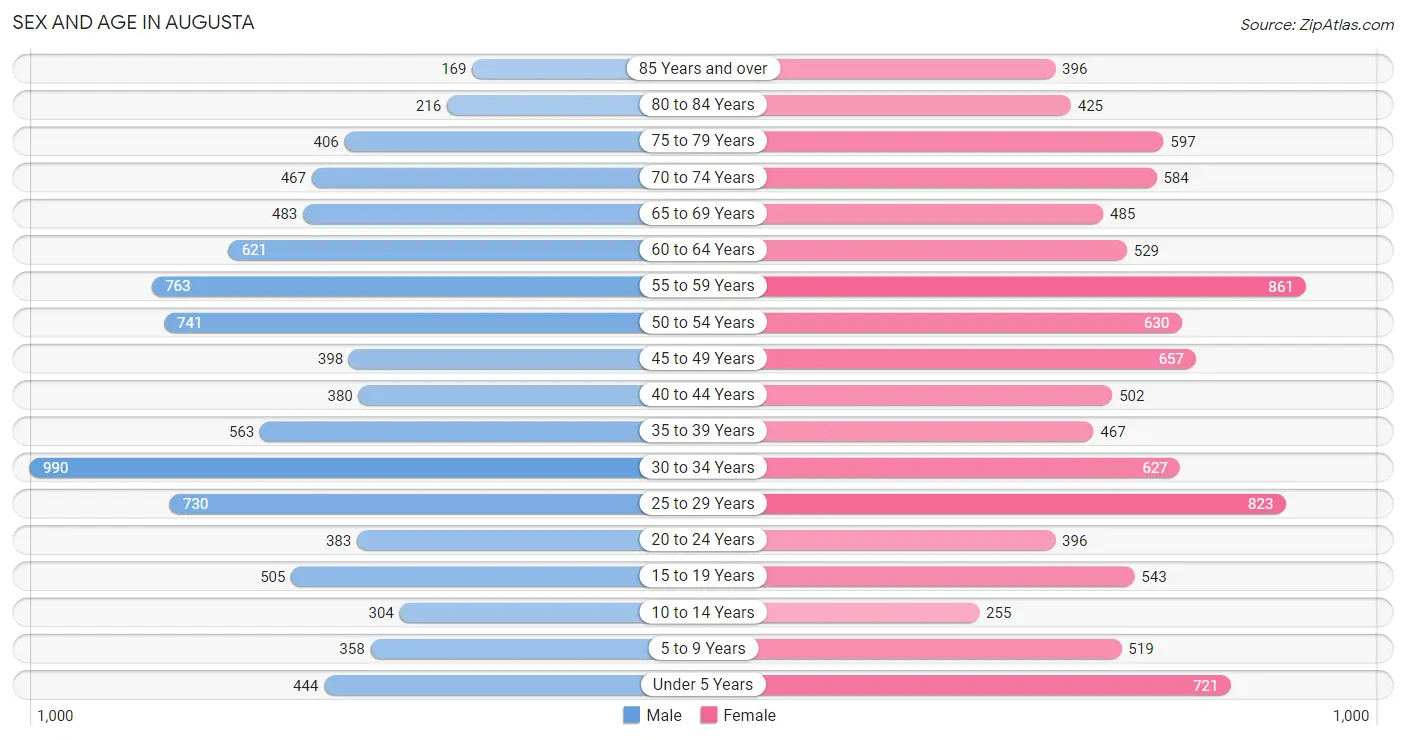
Sex and Age in Augusta
Sex and Age in Augusta
The most populous age groups in Augusta are 30 to 34 Years (990 | 11.1%) for men and 55 to 59 Years (861 | 8.6%) for women.
| Age Bracket | Male | Female |
| Under 5 Years | 444 (5.0%) | 721 (7.2%) |
| 5 to 9 Years | 358 (4.0%) | 519 (5.2%) |
| 10 to 14 Years | 304 (3.4%) | 255 (2.5%) |
| 15 to 19 Years | 505 (5.7%) | 543 (5.4%) |
| 20 to 24 Years | 383 (4.3%) | 396 (4.0%) |
| 25 to 29 Years | 730 (8.2%) | 823 (8.2%) |
| 30 to 34 Years | 990 (11.1%) | 627 (6.3%) |
| 35 to 39 Years | 563 (6.3%) | 467 (4.7%) |
| 40 to 44 Years | 380 (4.3%) | 502 (5.0%) |
| 45 to 49 Years | 398 (4.5%) | 657 (6.6%) |
| 50 to 54 Years | 741 (8.3%) | 630 (6.3%) |
| 55 to 59 Years | 763 (8.6%) | 861 (8.6%) |
| 60 to 64 Years | 621 (7.0%) | 529 (5.3%) |
| 65 to 69 Years | 483 (5.4%) | 485 (4.8%) |
| 70 to 74 Years | 467 (5.2%) | 584 (5.8%) |
| 75 to 79 Years | 406 (4.5%) | 597 (6.0%) |
| 80 to 84 Years | 216 (2.4%) | 425 (4.2%) |
| 85 Years and over | 169 (1.9%) | 396 (4.0%) |
| Total | 8,921 (100.0%) | 10,017 (100.0%) |
Families and Households in Augusta
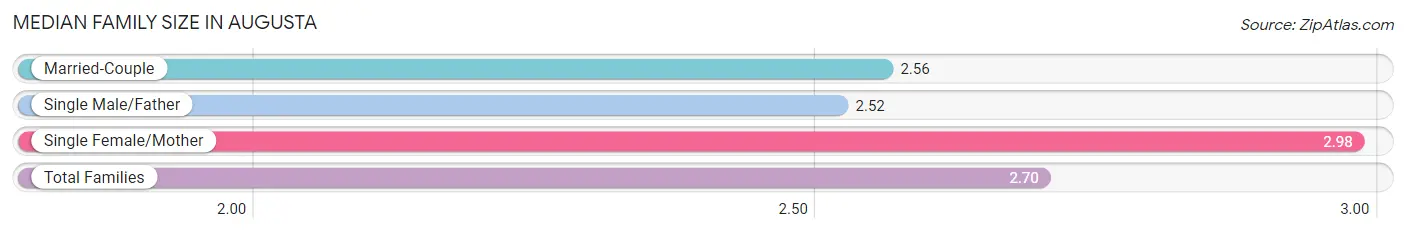
Median Family Size in Augusta
The median family size in Augusta is 2.70 persons per family, with single female/mother families (1,404 | 34.1%) accounting for the largest median family size of 2.98 persons per family. On the other hand, single male/father families (292 | 7.1%) represent the smallest median family size with 2.52 persons per family.
| Family Type | # Families | Family Size |
| Married-Couple | 2,417 (58.8%) | 2.56 |
| Single Male/Father | 292 (7.1%) | 2.52 |
| Single Female/Mother | 1,404 (34.1%) | 2.98 |
| Total Families | 4,113 (100.0%) | 2.70 |
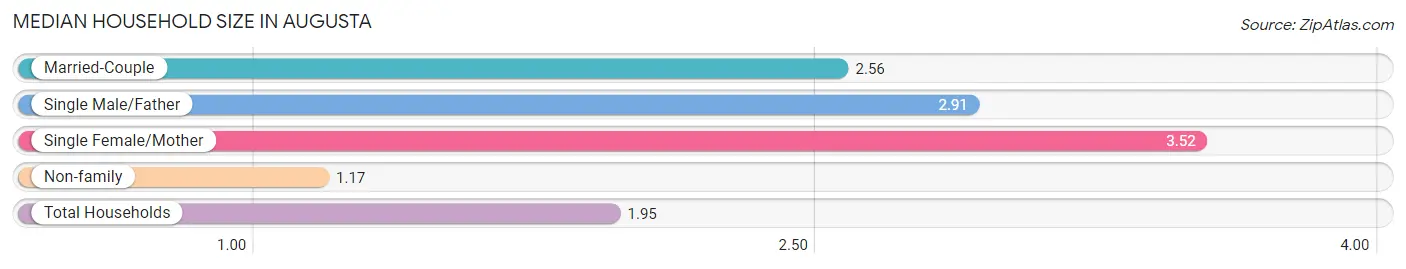
Median Household Size in Augusta
The median household size in Augusta is 1.95 persons per household, with single female/mother households (1,404 | 15.2%) accounting for the largest median household size of 3.52 persons per household. non-family households (5,136 | 55.5%) represent the smallest median household size with 1.17 persons per household.
| Household Type | # Households | Household Size |
| Married-Couple | 2,417 (26.1%) | 2.56 |
| Single Male/Father | 292 (3.2%) | 2.91 |
| Single Female/Mother | 1,404 (15.2%) | 3.52 |
| Non-family | 5,136 (55.5%) | 1.17 |
| Total Households | 9,249 (100.0%) | 1.95 |
Household Size by Marriage Status in Augusta
Out of a total of 9,249 households in Augusta, 4,113 (44.5%) are family households, while 5,136 (55.5%) are nonfamily households. The most numerous type of family households are 2-person households, comprising 1,939, and the most common type of nonfamily households are 1-person households, comprising 4,288.
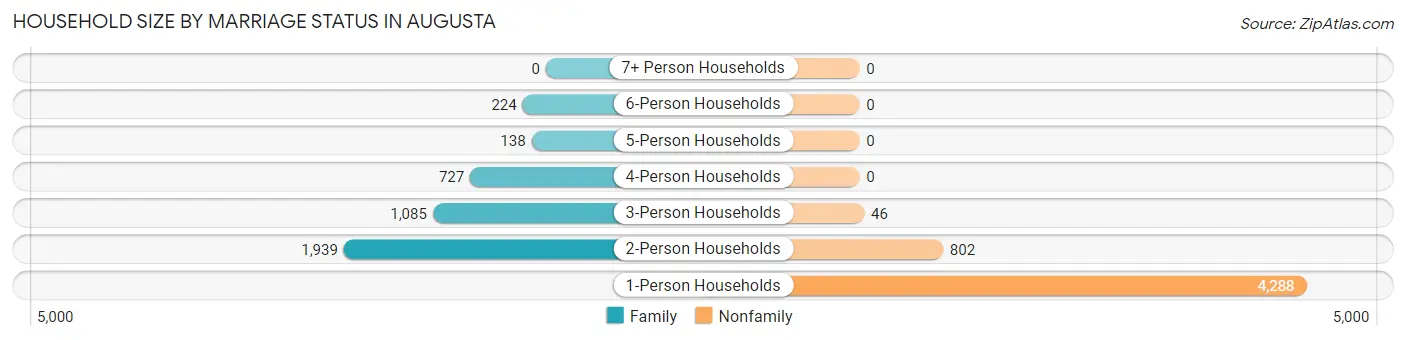
| Household Size | Family Households | Nonfamily Households |
| 1-Person Households | - | 4,288 (46.4%) |
| 2-Person Households | 1,939 (21.0%) | 802 (8.7%) |
| 3-Person Households | 1,085 (11.7%) | 46 (0.5%) |
| 4-Person Households | 727 (7.9%) | 0 (0.0%) |
| 5-Person Households | 138 (1.5%) | 0 (0.0%) |
| 6-Person Households | 224 (2.4%) | 0 (0.0%) |
| 7+ Person Households | 0 (0.0%) | 0 (0.0%) |
| Total | 4,113 (44.5%) | 5,136 (55.5%) |
Female Fertility in Augusta
Fertility by Age in Augusta
Average fertility rate in Augusta is 46.0 births per 1,000 women. Women in the age bracket of 20 to 34 years have the highest fertility rate with 104.0 births per 1,000 women. Women in the age bracket of 20 to 34 years acount for 100.0% of all women with births.
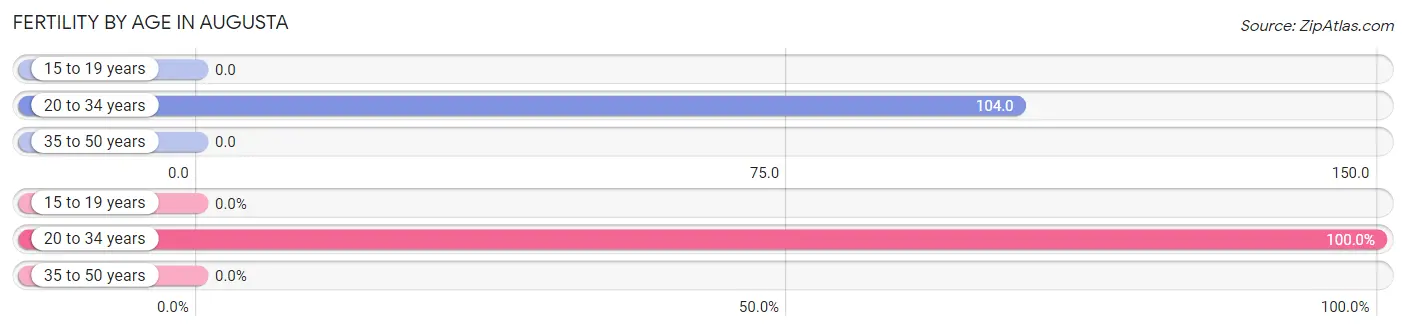
| Age Bracket | Women with Births | Births / 1,000 Women |
| 15 to 19 years | 0 (0.0%) | 0.0 |
| 20 to 34 years | 192 (100.0%) | 104.0 |
| 35 to 50 years | 0 (0.0%) | 0.0 |
| Total | 192 (100.0%) | 46.0 |
Fertility by Age by Marriage Status in Augusta
19.3% of women with births (192) in Augusta are married. The highest percentage of unmarried women with births falls into 20 to 34 years age bracket with 80.7% of them unmarried at the time of birth, while the lowest percentage of unmarried women with births belong to 20 to 34 years age bracket with 80.7% of them unmarried.
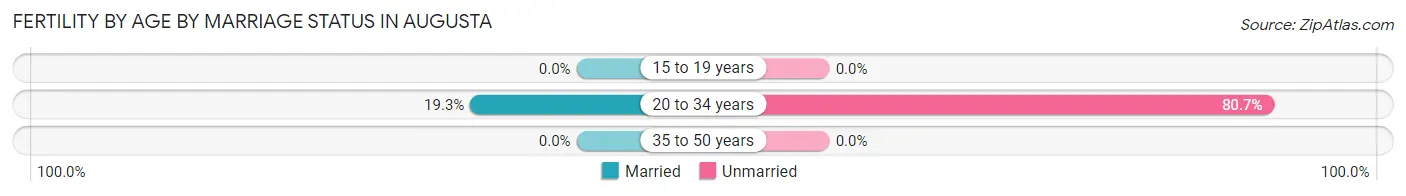
| Age Bracket | Married | Unmarried |
| 15 to 19 years | 0 (0.0%) | 0 (0.0%) |
| 20 to 34 years | 37 (19.3%) | 155 (80.7%) |
| 35 to 50 years | 0 (0.0%) | 0 (0.0%) |
| Total | 37 (19.3%) | 155 (80.7%) |
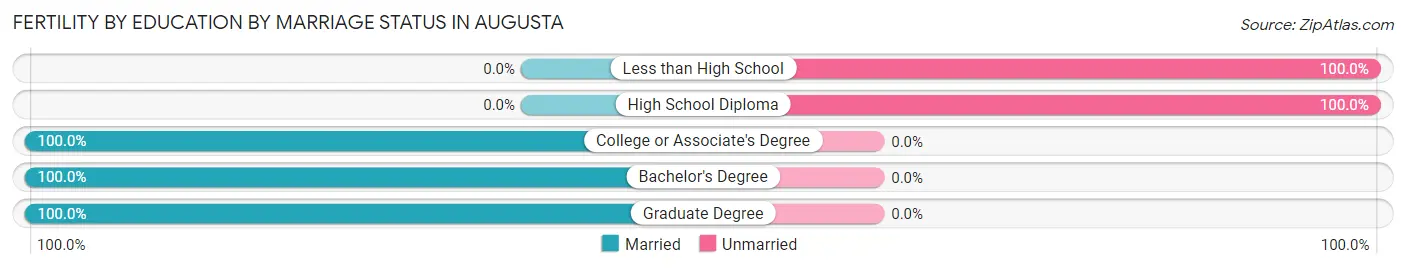
Fertility by Education in Augusta
Average fertility rate in Augusta is 46.0 births per 1,000 women. Women with the education attainment of high school diploma have the highest fertility rate of 89.0 births per 1,000 women, while women with the education attainment of college or associate's degree have the lowest fertility at 8.0 births per 1,000 women. Women with the education attainment of high school diploma represent 77.6% of all women with births.
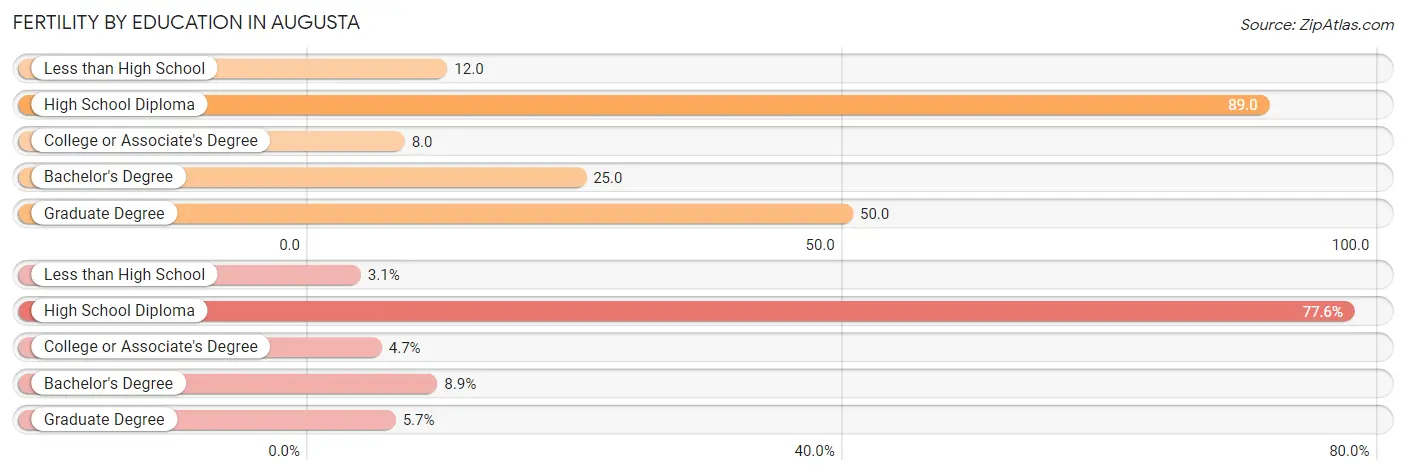
| Educational Attainment | Women with Births | Births / 1,000 Women |
| Less than High School | 6 (3.1%) | 12.0 |
| High School Diploma | 149 (77.6%) | 89.0 |
| College or Associate's Degree | 9 (4.7%) | 8.0 |
| Bachelor's Degree | 17 (8.8%) | 25.0 |
| Graduate Degree | 11 (5.7%) | 50.0 |
| Total | 192 (100.0%) | 46.0 |
Fertility by Education by Marriage Status in Augusta
80.7% of women with births in Augusta are unmarried. Women with the educational attainment of college or associate's degree are most likely to be married with 100.0% of them married at childbirth, while women with the educational attainment of less than high school are least likely to be married with 100.0% of them unmarried at childbirth.
| Educational Attainment | Married | Unmarried |
| Less than High School | 0 (0.0%) | 6 (100.0%) |
| High School Diploma | 0 (0.0%) | 149 (100.0%) |
| College or Associate's Degree | 9 (100.0%) | 0 (0.0%) |
| Bachelor's Degree | 17 (100.0%) | 0 (0.0%) |
| Graduate Degree | 11 (100.0%) | 0 (0.0%) |
| Total | 37 (19.3%) | 155 (80.7%) |
Employment Characteristics in Augusta
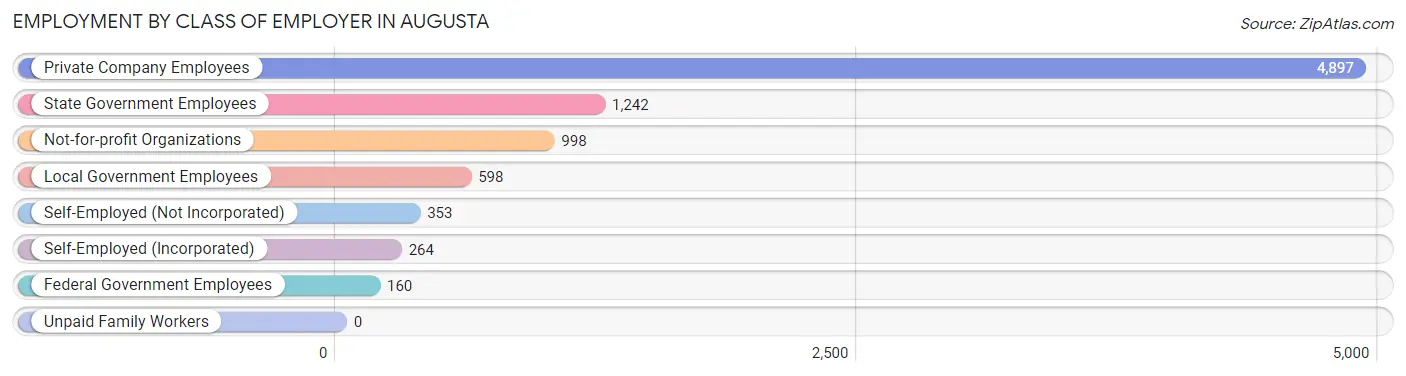
Employment by Class of Employer in Augusta
Among the 8,512 employed individuals in Augusta, private company employees (4,897 | 57.5%), state government employees (1,242 | 14.6%), and not-for-profit organizations (998 | 11.7%) make up the most common classes of employment.
| Employer Class | # Employees | % Employees |
| Private Company Employees | 4,897 | 57.5% |
| Self-Employed (Incorporated) | 264 | 3.1% |
| Self-Employed (Not Incorporated) | 353 | 4.2% |
| Not-for-profit Organizations | 998 | 11.7% |
| Local Government Employees | 598 | 7.0% |
| State Government Employees | 1,242 | 14.6% |
| Federal Government Employees | 160 | 1.9% |
| Unpaid Family Workers | 0 | 0.0% |
| Total | 8,512 | 100.0% |
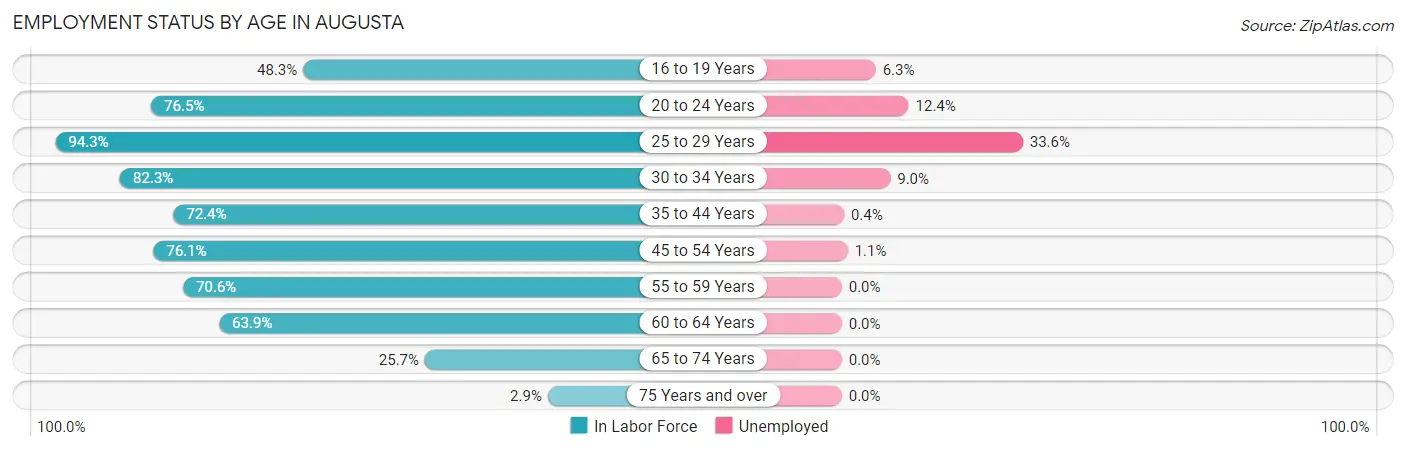
Employment Status by Age in Augusta
According to the labor force statistics for Augusta, out of the total population over 16 years of age (16,106), 58.9% or 9,486 individuals are in the labor force, with 7.7% or 730 of them unemployed. The age group with the highest labor force participation rate is 25 to 29 years, with 94.3% or 1,464 individuals in the labor force. Within the labor force, the 25 to 29 years age range has the highest percentage of unemployed individuals, with 33.6% or 492 of them being unemployed.
| Age Bracket | In Labor Force | Unemployed |
| 16 to 19 Years | 395 (48.3%) | 25 (6.3%) |
| 20 to 24 Years | 596 (76.5%) | 74 (12.4%) |
| 25 to 29 Years | 1,464 (94.3%) | 492 (33.6%) |
| 30 to 34 Years | 1,331 (82.3%) | 120 (9.0%) |
| 35 to 44 Years | 1,384 (72.4%) | 6 (0.4%) |
| 45 to 54 Years | 1,846 (76.1%) | 20 (1.1%) |
| 55 to 59 Years | 1,147 (70.6%) | 0 (0.0%) |
| 60 to 64 Years | 735 (63.9%) | 0 (0.0%) |
| 65 to 74 Years | 519 (25.7%) | 0 (0.0%) |
| 75 Years and over | 64 (2.9%) | 0 (0.0%) |
| Total | 9,486 (58.9%) | 730 (7.7%) |
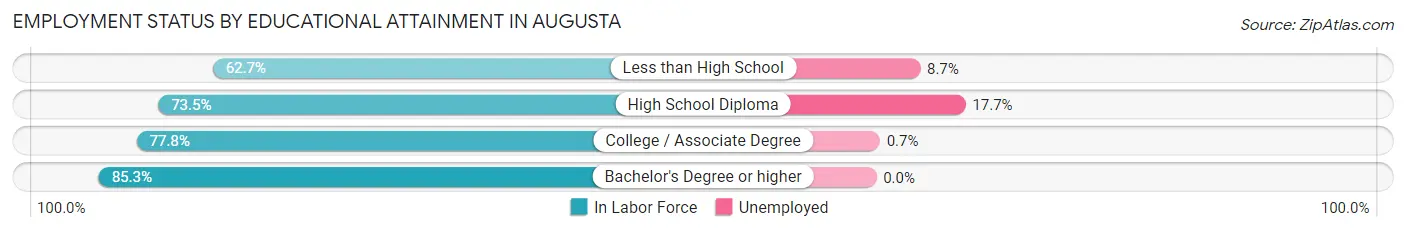
Employment Status by Educational Attainment in Augusta
According to labor force statistics for Augusta, 76.9% of individuals (7,907) out of the total population between 25 and 64 years of age (10,282) are in the labor force, with 8.0% or 633 of them being unemployed. The group with the highest labor force participation rate are those with the educational attainment of bachelor's degree or higher, with 85.3% or 2,170 individuals in the labor force. Within the labor force, individuals with high school diploma education have the highest percentage of unemployment, with 17.7% or 590 of them being unemployed.
| Educational Attainment | In Labor Force | Unemployed |
| Less than High School | 356 (62.7%) | 49 (8.7%) |
| High School Diploma | 3,335 (73.5%) | 803 (17.7%) |
| College / Associate Degree | 2,048 (77.8%) | 18 (0.7%) |
| Bachelor's Degree or higher | 2,170 (85.3%) | 0 (0.0%) |
| Total | 7,907 (76.9%) | 823 (8.0%) |
Employment Occupations by Sex in Augusta
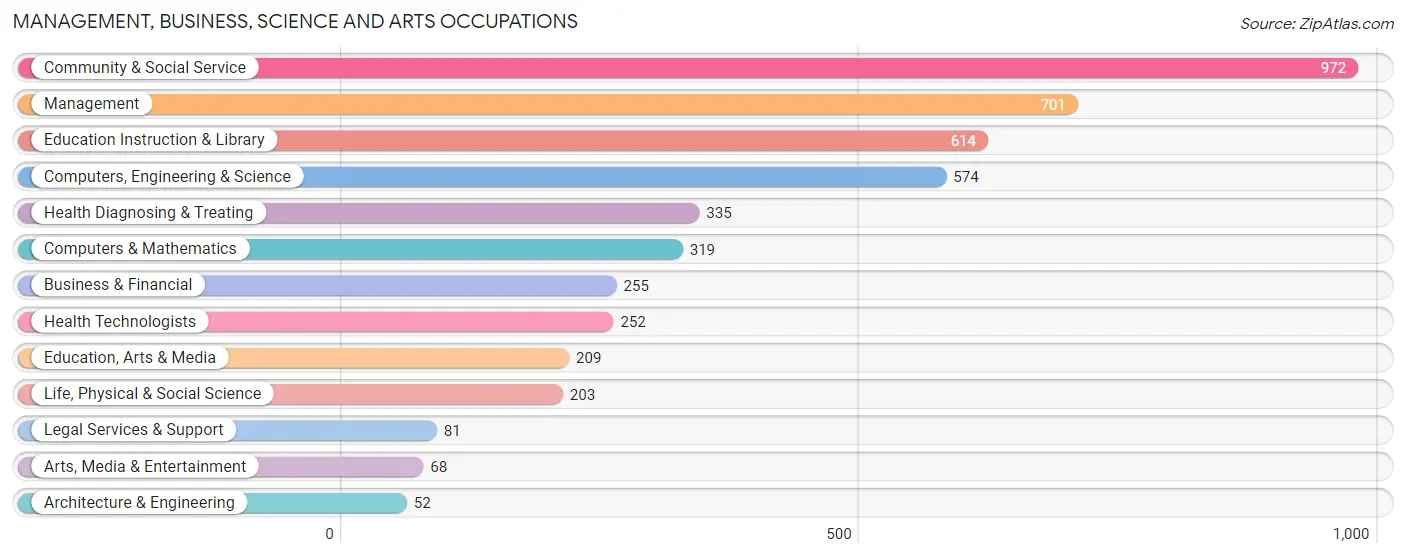
Management, Business, Science and Arts Occupations
The most common Management, Business, Science and Arts occupations in Augusta are Community & Social Service (972 | 11.1%), Management (701 | 8.0%), Education Instruction & Library (614 | 7.0%), Computers, Engineering & Science (574 | 6.6%), and Health Diagnosing & Treating (335 | 3.8%).
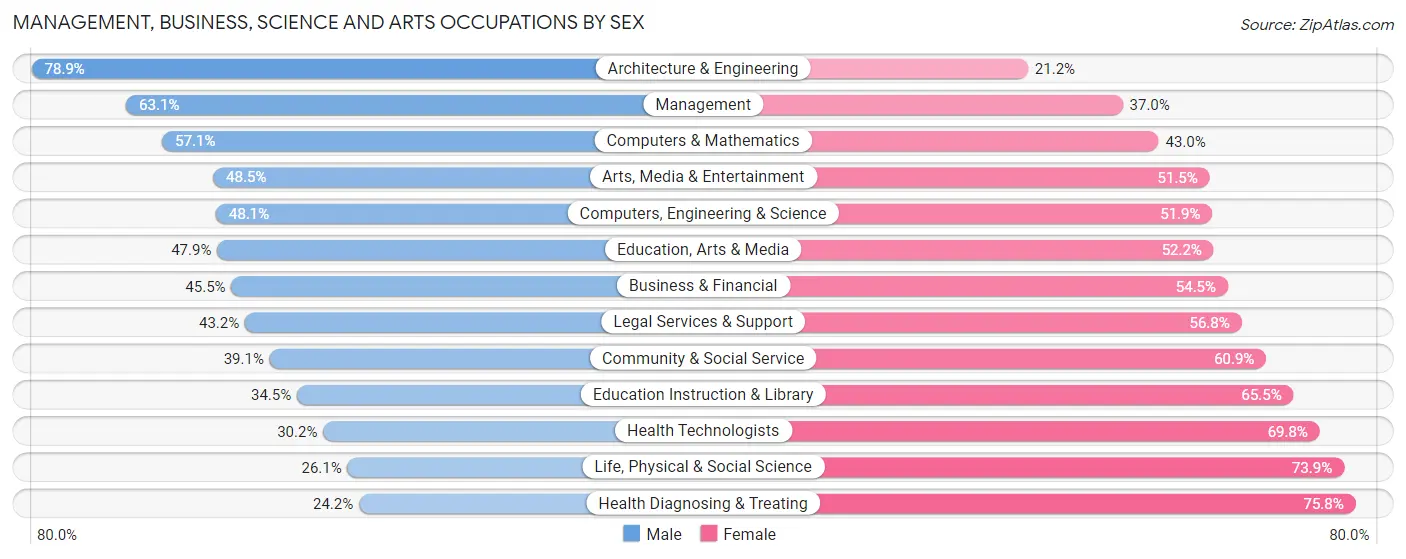
Management, Business, Science and Arts Occupations by Sex
Within the Management, Business, Science and Arts occupations in Augusta, the most male-oriented occupations are Architecture & Engineering (78.8%), Management (63.0%), and Computers & Mathematics (57.1%), while the most female-oriented occupations are Health Diagnosing & Treating (75.8%), Life, Physical & Social Science (73.9%), and Health Technologists (69.8%).
| Occupation | Male | Female |
| Management | 442 (63.0%) | 259 (36.9%) |
| Business & Financial | 116 (45.5%) | 139 (54.5%) |
| Computers, Engineering & Science | 276 (48.1%) | 298 (51.9%) |
| Computers & Mathematics | 182 (57.1%) | 137 (42.9%) |
| Architecture & Engineering | 41 (78.8%) | 11 (21.1%) |
| Life, Physical & Social Science | 53 (26.1%) | 150 (73.9%) |
| Community & Social Service | 380 (39.1%) | 592 (60.9%) |
| Education, Arts & Media | 100 (47.8%) | 109 (52.1%) |
| Legal Services & Support | 35 (43.2%) | 46 (56.8%) |
| Education Instruction & Library | 212 (34.5%) | 402 (65.5%) |
| Arts, Media & Entertainment | 33 (48.5%) | 35 (51.5%) |
| Health Diagnosing & Treating | 81 (24.2%) | 254 (75.8%) |
| Health Technologists | 76 (30.2%) | 176 (69.8%) |
| Total (Category) | 1,295 (45.7%) | 1,542 (54.3%) |
| Total (Overall) | 4,342 (49.7%) | 4,385 (50.2%) |
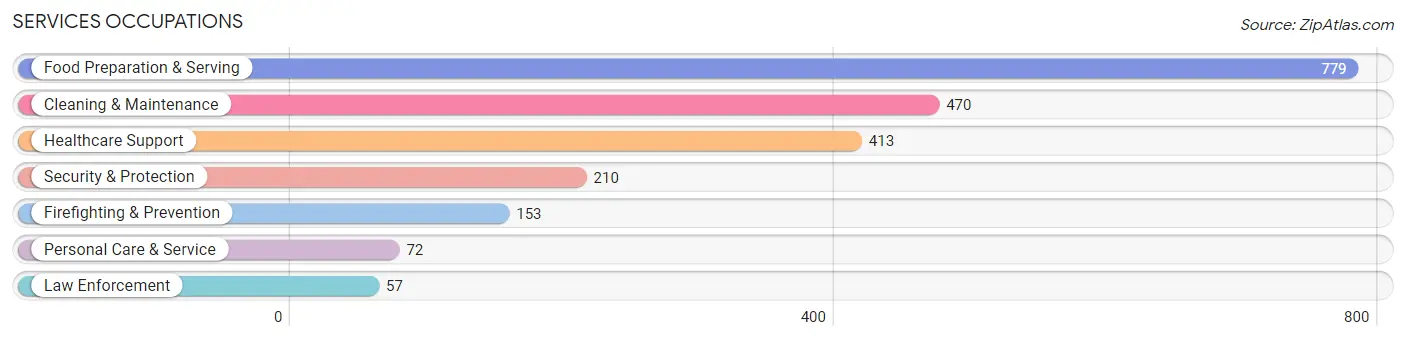
Services Occupations
The most common Services occupations in Augusta are Food Preparation & Serving (779 | 8.9%), Cleaning & Maintenance (470 | 5.4%), Healthcare Support (413 | 4.7%), Security & Protection (210 | 2.4%), and Firefighting & Prevention (153 | 1.8%).
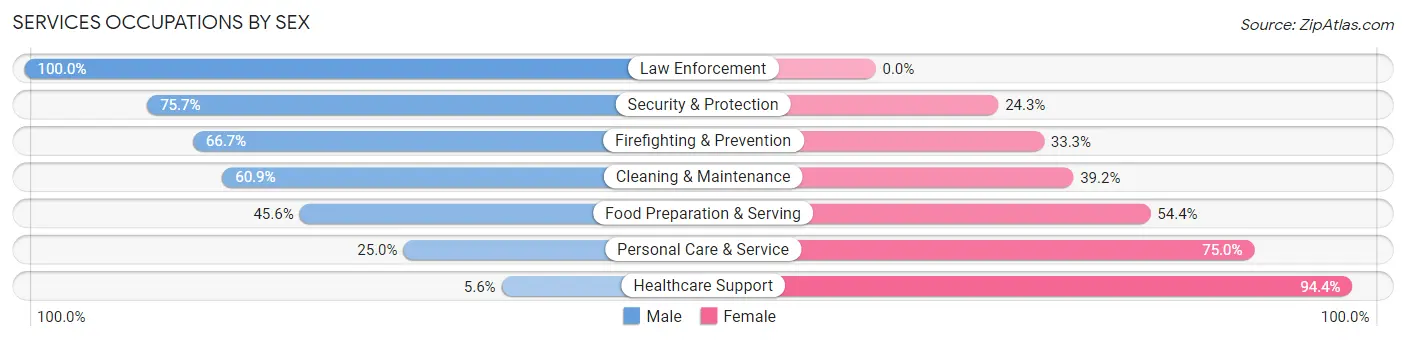
Services Occupations by Sex
Within the Services occupations in Augusta, the most male-oriented occupations are Law Enforcement (100.0%), Security & Protection (75.7%), and Firefighting & Prevention (66.7%), while the most female-oriented occupations are Healthcare Support (94.4%), Personal Care & Service (75.0%), and Food Preparation & Serving (54.4%).
| Occupation | Male | Female |
| Healthcare Support | 23 (5.6%) | 390 (94.4%) |
| Security & Protection | 159 (75.7%) | 51 (24.3%) |
| Firefighting & Prevention | 102 (66.7%) | 51 (33.3%) |
| Law Enforcement | 57 (100.0%) | 0 (0.0%) |
| Food Preparation & Serving | 355 (45.6%) | 424 (54.4%) |
| Cleaning & Maintenance | 286 (60.9%) | 184 (39.2%) |
| Personal Care & Service | 18 (25.0%) | 54 (75.0%) |
| Total (Category) | 841 (43.3%) | 1,103 (56.7%) |
| Total (Overall) | 4,342 (49.7%) | 4,385 (50.2%) |
Sales and Office Occupations
The most common Sales and Office occupations in Augusta are Office & Administration (1,385 | 15.9%), and Sales & Related (854 | 9.8%).
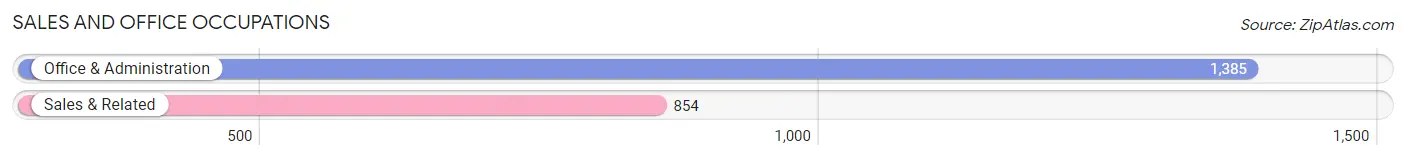
Sales and Office Occupations by Sex

| Occupation | Male | Female |
| Sales & Related | 379 (44.4%) | 475 (55.6%) |
| Office & Administration | 270 (19.5%) | 1,115 (80.5%) |
| Total (Category) | 649 (29.0%) | 1,590 (71.0%) |
| Total (Overall) | 4,342 (49.7%) | 4,385 (50.2%) |
Natural Resources, Construction and Maintenance Occupations
The most common Natural Resources, Construction and Maintenance occupations in Augusta are Construction & Extraction (460 | 5.3%), Installation, Maintenance & Repair (188 | 2.1%), and Farming, Fishing & Forestry (25 | 0.3%).
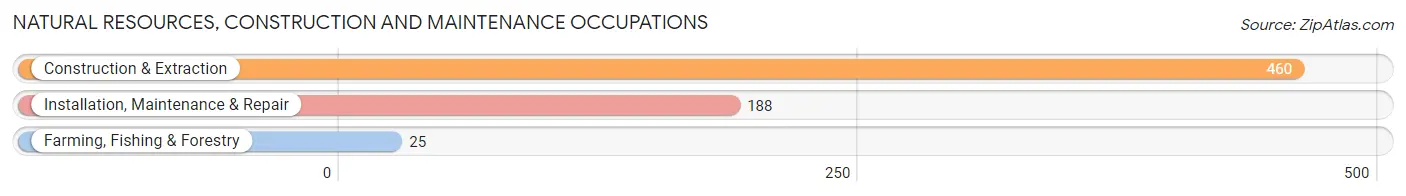
Natural Resources, Construction and Maintenance Occupations by Sex
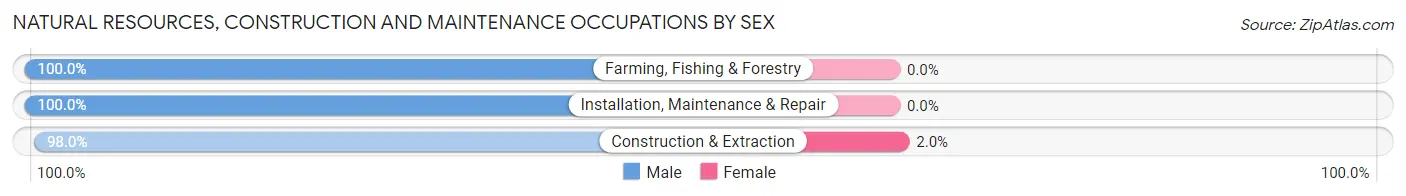
| Occupation | Male | Female |
| Farming, Fishing & Forestry | 25 (100.0%) | 0 (0.0%) |
| Construction & Extraction | 451 (98.0%) | 9 (2.0%) |
| Installation, Maintenance & Repair | 188 (100.0%) | 0 (0.0%) |
| Total (Category) | 664 (98.7%) | 9 (1.3%) |
| Total (Overall) | 4,342 (49.7%) | 4,385 (50.2%) |
Production, Transportation and Moving Occupations
The most common Production, Transportation and Moving occupations in Augusta are Material Moving (508 | 5.8%), Transportation (304 | 3.5%), and Production (222 | 2.5%).
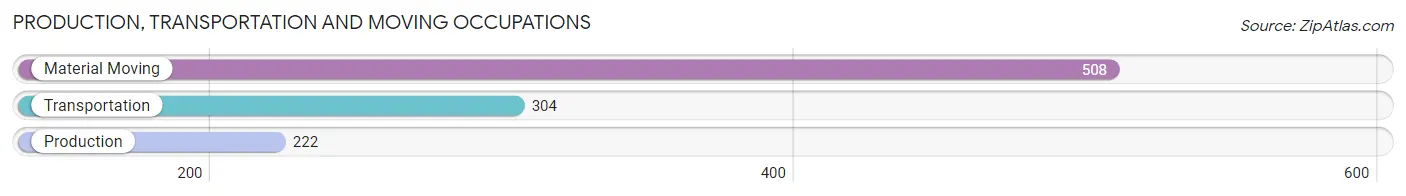
Production, Transportation and Moving Occupations by Sex
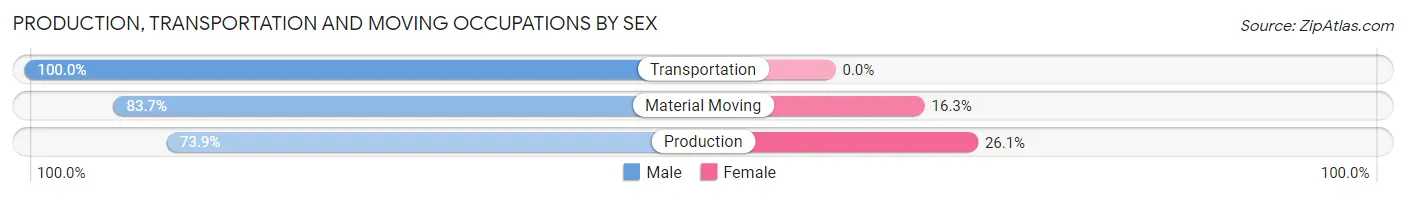
| Occupation | Male | Female |
| Production | 164 (73.9%) | 58 (26.1%) |
| Transportation | 304 (100.0%) | 0 (0.0%) |
| Material Moving | 425 (83.7%) | 83 (16.3%) |
| Total (Category) | 893 (86.4%) | 141 (13.6%) |
| Total (Overall) | 4,342 (49.7%) | 4,385 (50.2%) |
Employment Industries by Sex in Augusta
Employment Industries in Augusta
The major employment industries in Augusta include Retail Trade (1,423 | 16.3%), Health Care & Social Assistance (1,365 | 15.6%), Public Administration (1,231 | 14.1%), Accommodation & Food Services (761 | 8.7%), and Construction (662 | 7.6%).
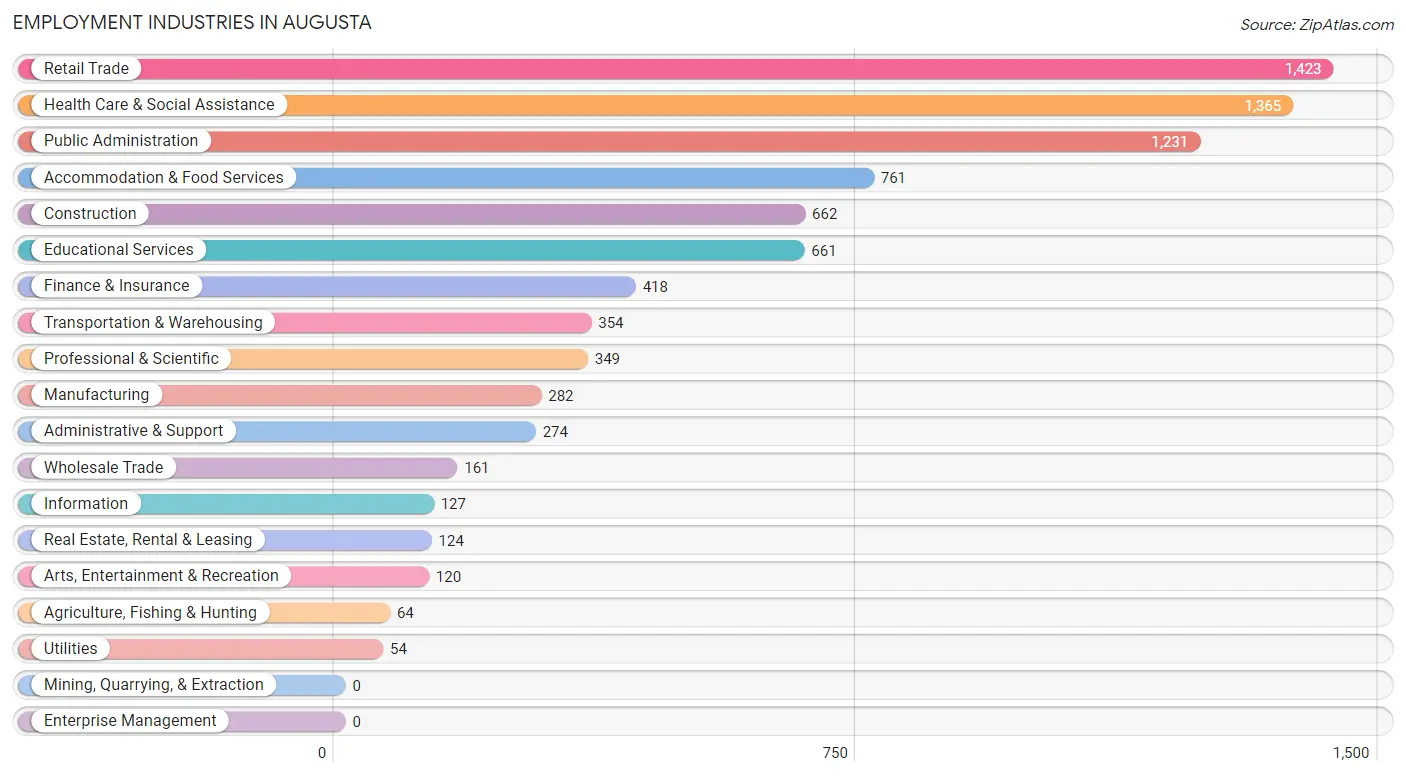
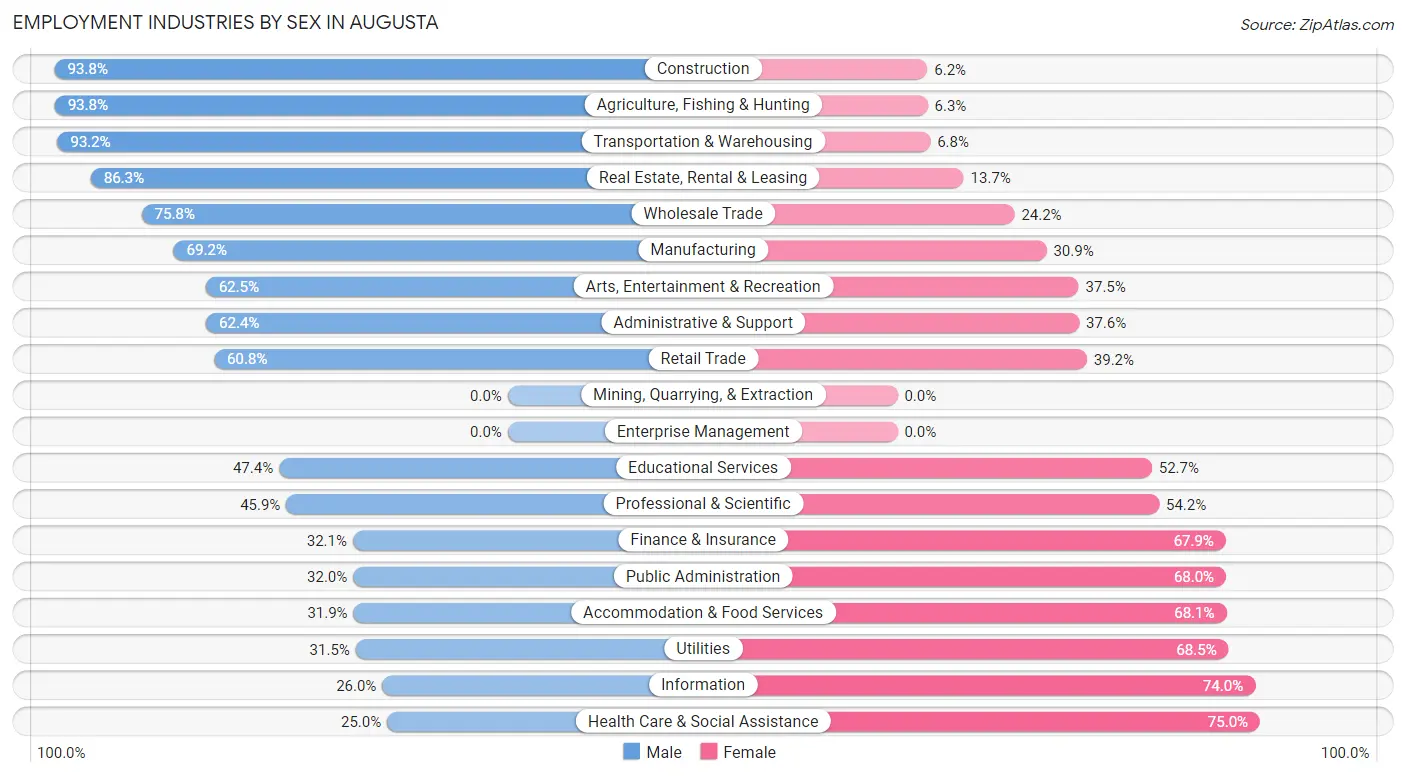
Employment Industries by Sex in Augusta
The Augusta industries that see more men than women are Construction (93.8%), Agriculture, Fishing & Hunting (93.8%), and Transportation & Warehousing (93.2%), whereas the industries that tend to have a higher number of women are Health Care & Social Assistance (75.0%), Information (74.0%), and Utilities (68.5%).
| Industry | Male | Female |
| Agriculture, Fishing & Hunting | 60 (93.8%) | 4 (6.2%) |
| Mining, Quarrying, & Extraction | 0 (0.0%) | 0 (0.0%) |
| Construction | 621 (93.8%) | 41 (6.2%) |
| Manufacturing | 195 (69.2%) | 87 (30.8%) |
| Wholesale Trade | 122 (75.8%) | 39 (24.2%) |
| Retail Trade | 865 (60.8%) | 558 (39.2%) |
| Transportation & Warehousing | 330 (93.2%) | 24 (6.8%) |
| Utilities | 17 (31.5%) | 37 (68.5%) |
| Information | 33 (26.0%) | 94 (74.0%) |
| Finance & Insurance | 134 (32.1%) | 284 (67.9%) |
| Real Estate, Rental & Leasing | 107 (86.3%) | 17 (13.7%) |
| Professional & Scientific | 160 (45.9%) | 189 (54.1%) |
| Enterprise Management | 0 (0.0%) | 0 (0.0%) |
| Administrative & Support | 171 (62.4%) | 103 (37.6%) |
| Educational Services | 313 (47.3%) | 348 (52.6%) |
| Health Care & Social Assistance | 341 (25.0%) | 1,024 (75.0%) |
| Arts, Entertainment & Recreation | 75 (62.5%) | 45 (37.5%) |
| Accommodation & Food Services | 243 (31.9%) | 518 (68.1%) |
| Public Administration | 394 (32.0%) | 837 (68.0%) |
| Total | 4,342 (49.7%) | 4,385 (50.2%) |
Education in Augusta
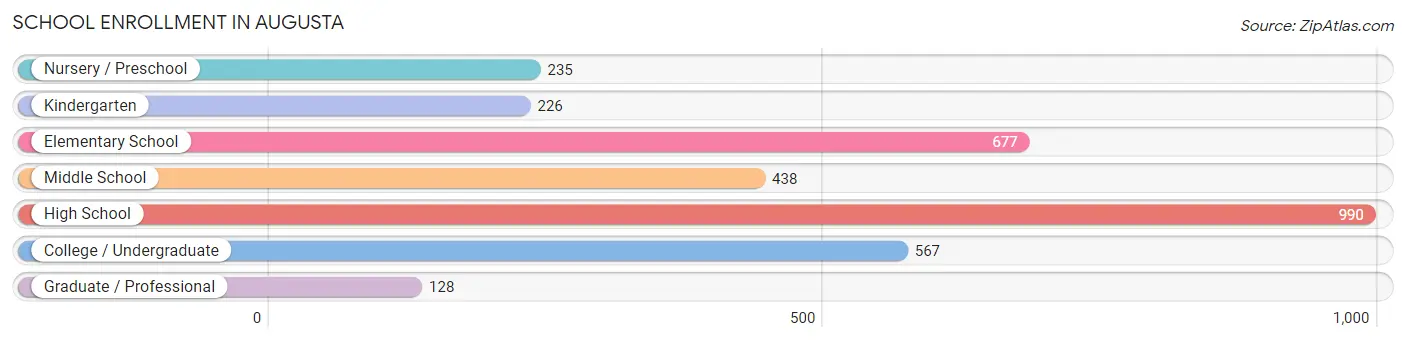
School Enrollment in Augusta
The most common levels of schooling among the 3,261 students in Augusta are high school (990 | 30.4%), elementary school (677 | 20.8%), and college / undergraduate (567 | 17.4%).
| School Level | # Students | % Students |
| Nursery / Preschool | 235 | 7.2% |
| Kindergarten | 226 | 6.9% |
| Elementary School | 677 | 20.8% |
| Middle School | 438 | 13.4% |
| High School | 990 | 30.4% |
| College / Undergraduate | 567 | 17.4% |
| Graduate / Professional | 128 | 3.9% |
| Total | 3,261 | 100.0% |
School Enrollment by Age by Funding Source in Augusta
Out of a total of 3,261 students who are enrolled in schools in Augusta, 554 (17.0%) attend a private institution, while the remaining 2,707 (83.0%) are enrolled in public schools. The age group of 20 to 24 year olds has the highest likelihood of being enrolled in private schools, with 120 (59.1% in the age bracket) enrolled. Conversely, the age group of 15 to 17 year olds has the lowest likelihood of being enrolled in a private school, with 702 (100.0% in the age bracket) attending a public institution.
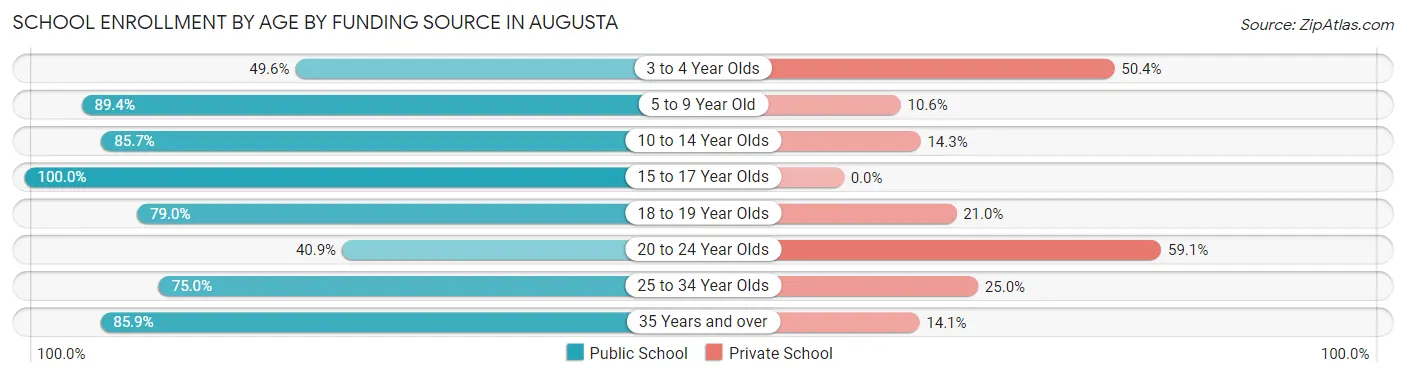
| Age Bracket | Public School | Private School |
| 3 to 4 Year Olds | 119 (49.6%) | 121 (50.4%) |
| 5 to 9 Year Old | 758 (89.4%) | 90 (10.6%) |
| 10 to 14 Year Olds | 479 (85.7%) | 80 (14.3%) |
| 15 to 17 Year Olds | 702 (100.0%) | 0 (0.0%) |
| 18 to 19 Year Olds | 132 (79.0%) | 35 (21.0%) |
| 20 to 24 Year Olds | 83 (40.9%) | 120 (59.1%) |
| 25 to 34 Year Olds | 231 (75.0%) | 77 (25.0%) |
| 35 Years and over | 201 (85.9%) | 33 (14.1%) |
| Total | 2,707 (83.0%) | 554 (17.0%) |
Educational Attainment by Field of Study in Augusta
Business (753 | 19.0%), education (670 | 16.9%), science & technology (383 | 9.7%), arts & humanities (275 | 6.9%), and bio, nature & agricultural (254 | 6.4%) are the most common fields of study among 3,963 individuals in Augusta who have obtained a bachelor's degree or higher.
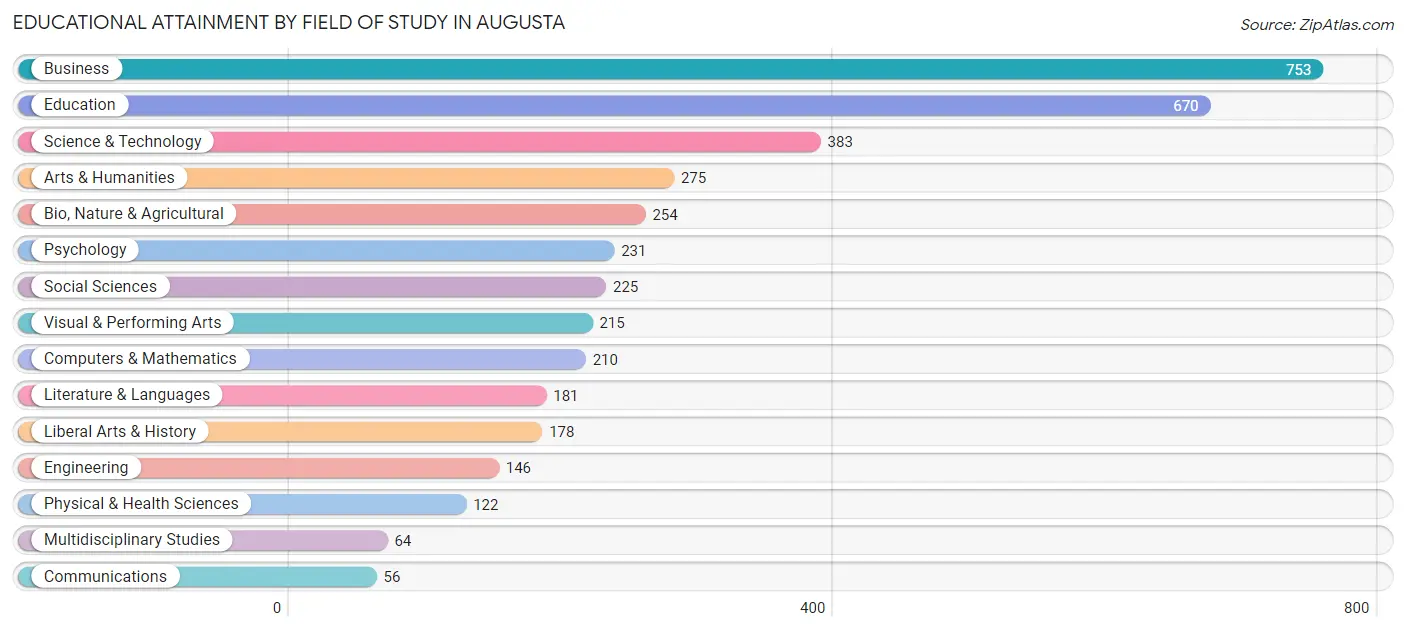
| Field of Study | # Graduates | % Graduates |
| Computers & Mathematics | 210 | 5.3% |
| Bio, Nature & Agricultural | 254 | 6.4% |
| Physical & Health Sciences | 122 | 3.1% |
| Psychology | 231 | 5.8% |
| Social Sciences | 225 | 5.7% |
| Engineering | 146 | 3.7% |
| Multidisciplinary Studies | 64 | 1.6% |
| Science & Technology | 383 | 9.7% |
| Business | 753 | 19.0% |
| Education | 670 | 16.9% |
| Literature & Languages | 181 | 4.6% |
| Liberal Arts & History | 178 | 4.5% |
| Visual & Performing Arts | 215 | 5.4% |
| Communications | 56 | 1.4% |
| Arts & Humanities | 275 | 6.9% |
| Total | 3,963 | 100.0% |
Transportation & Commute in Augusta
Vehicle Availability by Sex in Augusta
The most prevalent vehicle ownership categories in Augusta are males with 2 vehicles (2,003, accounting for 47.9%) and females with 2 vehicles (2,045, making up 46.6%).
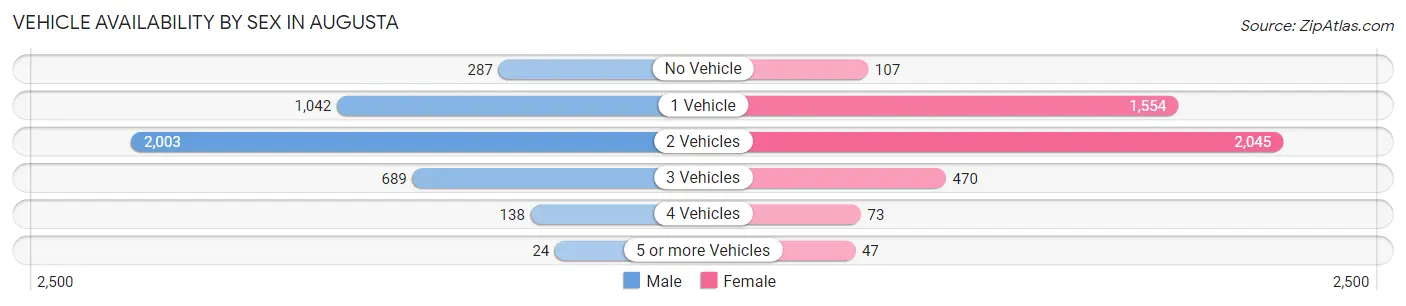
| Vehicles Available | Male | Female |
| No Vehicle | 287 (6.9%) | 107 (2.5%) |
| 1 Vehicle | 1,042 (24.9%) | 1,554 (36.2%) |
| 2 Vehicles | 2,003 (47.9%) | 2,045 (47.6%) |
| 3 Vehicles | 689 (16.5%) | 470 (10.9%) |
| 4 Vehicles | 138 (3.3%) | 73 (1.7%) |
| 5 or more Vehicles | 24 (0.6%) | 47 (1.1%) |
| Total | 4,183 (100.0%) | 4,296 (100.0%) |
Commute Time in Augusta
The most frequently occuring commute durations in Augusta are 5 to 9 minutes (2,029 commuters, 26.9%), 10 to 14 minutes (1,873 commuters, 24.8%), and 15 to 19 minutes (1,261 commuters, 16.7%).
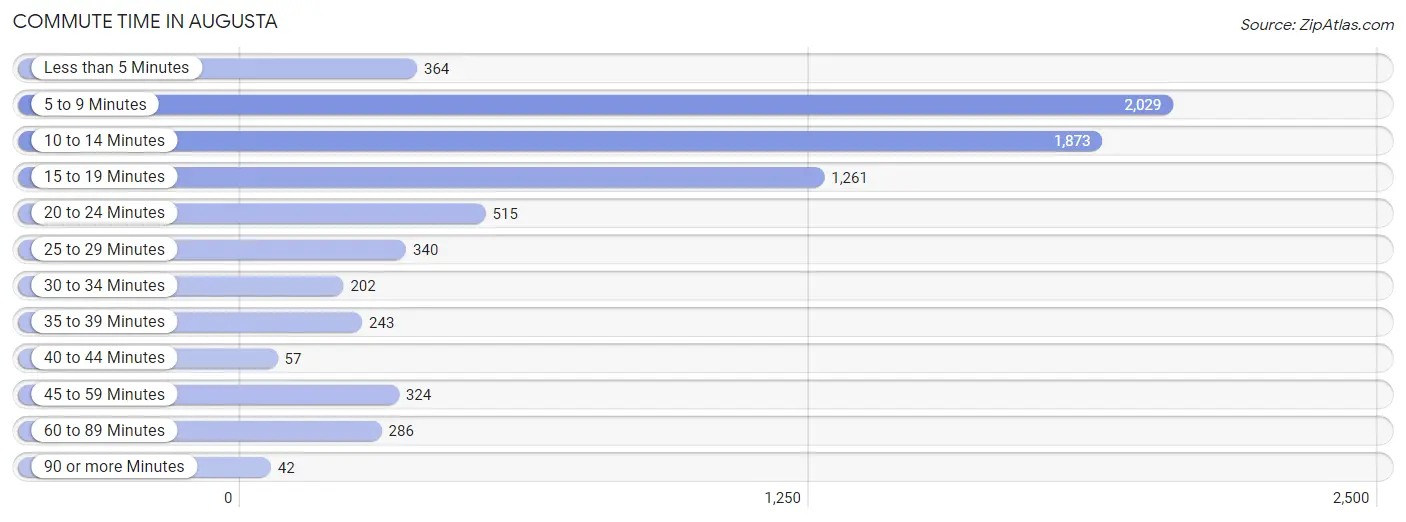
| Commute Time | # Commuters | % Commuters |
| Less than 5 Minutes | 364 | 4.8% |
| 5 to 9 Minutes | 2,029 | 26.9% |
| 10 to 14 Minutes | 1,873 | 24.8% |
| 15 to 19 Minutes | 1,261 | 16.7% |
| 20 to 24 Minutes | 515 | 6.8% |
| 25 to 29 Minutes | 340 | 4.5% |
| 30 to 34 Minutes | 202 | 2.7% |
| 35 to 39 Minutes | 243 | 3.2% |
| 40 to 44 Minutes | 57 | 0.8% |
| 45 to 59 Minutes | 324 | 4.3% |
| 60 to 89 Minutes | 286 | 3.8% |
| 90 or more Minutes | 42 | 0.6% |
Commute Time by Sex in Augusta
The most common commute times in Augusta are 5 to 9 minutes (1,078 commuters, 28.7%) for males and 10 to 14 minutes (1,229 commuters, 32.5%) for females.
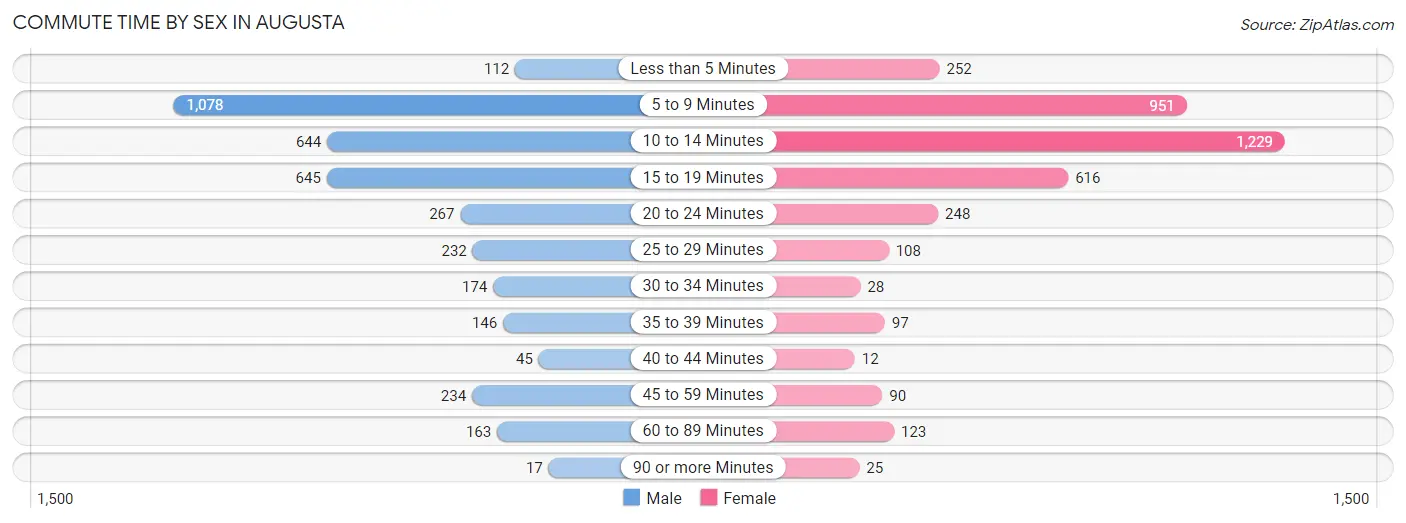
| Commute Time | Male | Female |
| Less than 5 Minutes | 112 (3.0%) | 252 (6.7%) |
| 5 to 9 Minutes | 1,078 (28.7%) | 951 (25.2%) |
| 10 to 14 Minutes | 644 (17.1%) | 1,229 (32.5%) |
| 15 to 19 Minutes | 645 (17.2%) | 616 (16.3%) |
| 20 to 24 Minutes | 267 (7.1%) | 248 (6.6%) |
| 25 to 29 Minutes | 232 (6.2%) | 108 (2.9%) |
| 30 to 34 Minutes | 174 (4.6%) | 28 (0.7%) |
| 35 to 39 Minutes | 146 (3.9%) | 97 (2.6%) |
| 40 to 44 Minutes | 45 (1.2%) | 12 (0.3%) |
| 45 to 59 Minutes | 234 (6.2%) | 90 (2.4%) |
| 60 to 89 Minutes | 163 (4.3%) | 123 (3.3%) |
| 90 or more Minutes | 17 (0.4%) | 25 (0.7%) |
Time of Departure to Work by Sex in Augusta
The most frequent times of departure to work in Augusta are 7:30 AM to 7:59 AM (825, 22.0%) for males and 7:30 AM to 7:59 AM (725, 19.2%) for females.
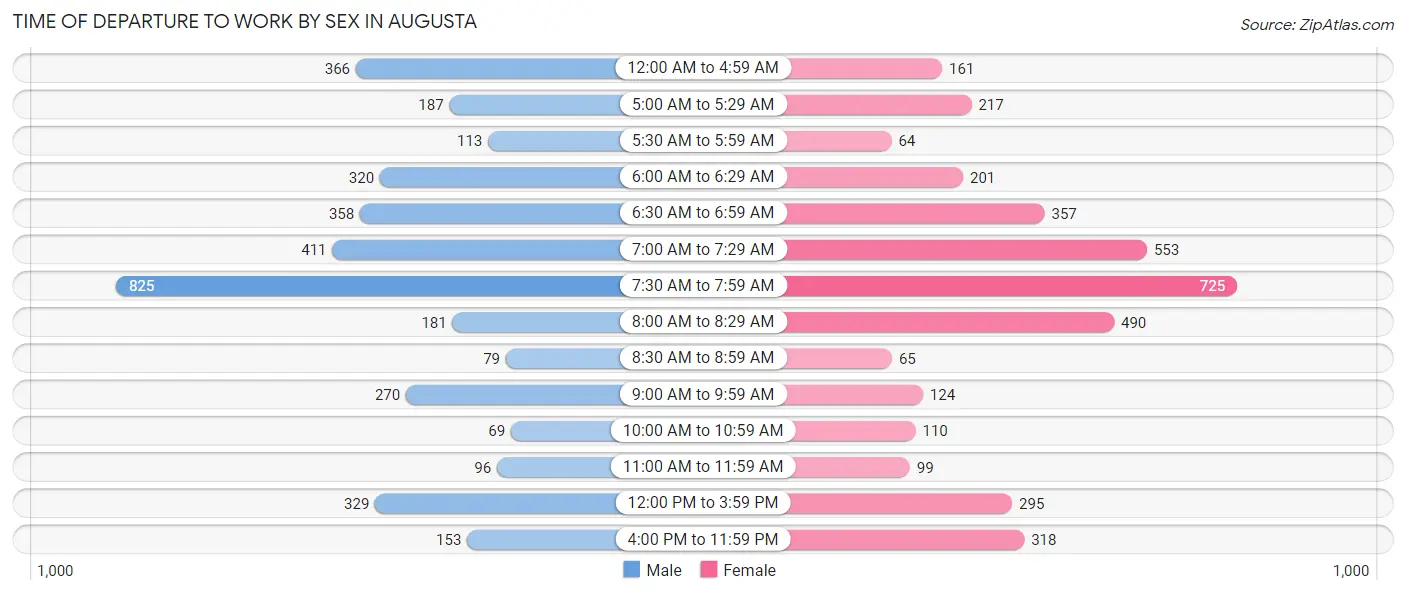
| Time of Departure | Male | Female |
| 12:00 AM to 4:59 AM | 366 (9.7%) | 161 (4.3%) |
| 5:00 AM to 5:29 AM | 187 (5.0%) | 217 (5.7%) |
| 5:30 AM to 5:59 AM | 113 (3.0%) | 64 (1.7%) |
| 6:00 AM to 6:29 AM | 320 (8.5%) | 201 (5.3%) |
| 6:30 AM to 6:59 AM | 358 (9.5%) | 357 (9.5%) |
| 7:00 AM to 7:29 AM | 411 (10.9%) | 553 (14.6%) |
| 7:30 AM to 7:59 AM | 825 (22.0%) | 725 (19.2%) |
| 8:00 AM to 8:29 AM | 181 (4.8%) | 490 (13.0%) |
| 8:30 AM to 8:59 AM | 79 (2.1%) | 65 (1.7%) |
| 9:00 AM to 9:59 AM | 270 (7.2%) | 124 (3.3%) |
| 10:00 AM to 10:59 AM | 69 (1.8%) | 110 (2.9%) |
| 11:00 AM to 11:59 AM | 96 (2.6%) | 99 (2.6%) |
| 12:00 PM to 3:59 PM | 329 (8.8%) | 295 (7.8%) |
| 4:00 PM to 11:59 PM | 153 (4.1%) | 318 (8.4%) |
| Total | 3,757 (100.0%) | 3,779 (100.0%) |
Housing Occupancy in Augusta
Occupancy by Ownership in Augusta
Of the total 9,249 dwellings in Augusta, owner-occupied units account for 4,886 (52.8%), while renter-occupied units make up 4,363 (47.2%).
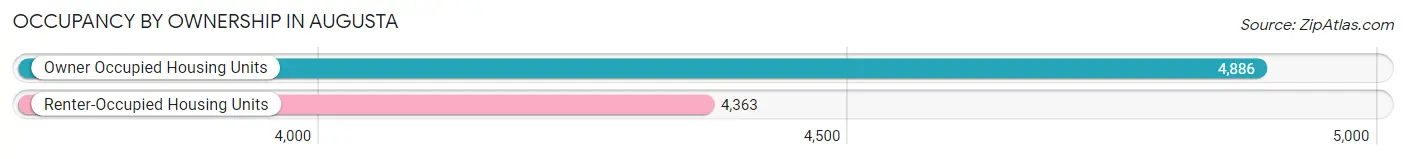
| Occupancy | # Housing Units | % Housing Units |
| Owner Occupied Housing Units | 4,886 | 52.8% |
| Renter-Occupied Housing Units | 4,363 | 47.2% |
| Total Occupied Housing Units | 9,249 | 100.0% |
Occupancy by Household Size in Augusta
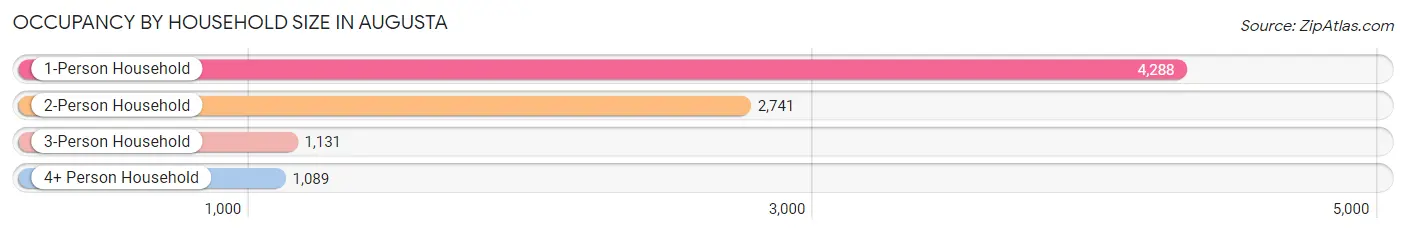
| Household Size | # Housing Units | % Housing Units |
| 1-Person Household | 4,288 | 46.4% |
| 2-Person Household | 2,741 | 29.6% |
| 3-Person Household | 1,131 | 12.2% |
| 4+ Person Household | 1,089 | 11.8% |
| Total Housing Units | 9,249 | 100.0% |
Occupancy by Ownership by Household Size in Augusta
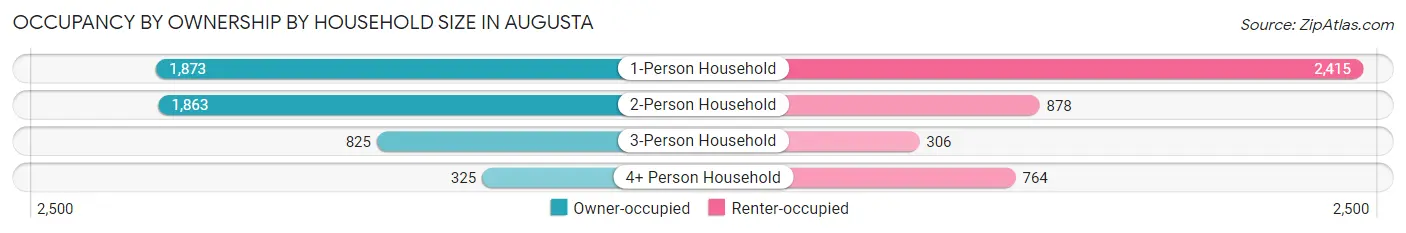
| Household Size | Owner-occupied | Renter-occupied |
| 1-Person Household | 1,873 (43.7%) | 2,415 (56.3%) |
| 2-Person Household | 1,863 (68.0%) | 878 (32.0%) |
| 3-Person Household | 825 (72.9%) | 306 (27.1%) |
| 4+ Person Household | 325 (29.8%) | 764 (70.2%) |
| Total Housing Units | 4,886 (52.8%) | 4,363 (47.2%) |
Occupancy by Educational Attainment in Augusta
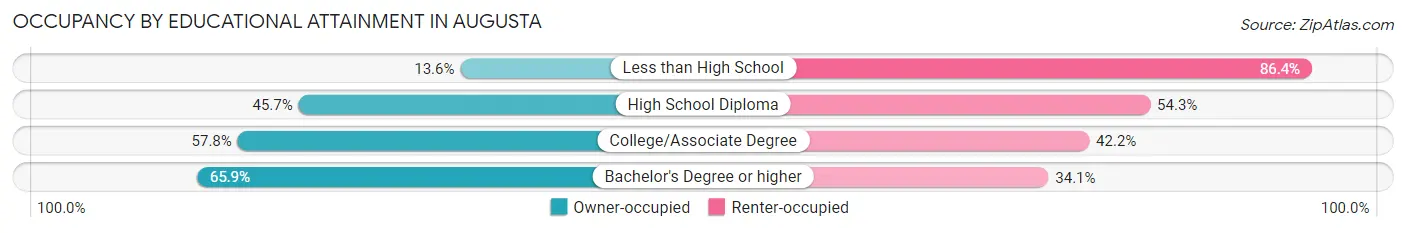
| Household Size | Owner-occupied | Renter-occupied |
| Less than High School | 60 (13.6%) | 381 (86.4%) |
| High School Diploma | 1,744 (45.7%) | 2,074 (54.3%) |
| College/Associate Degree | 1,458 (57.8%) | 1,066 (42.2%) |
| Bachelor's Degree or higher | 1,624 (65.9%) | 842 (34.1%) |
Occupancy by Age of Householder in Augusta
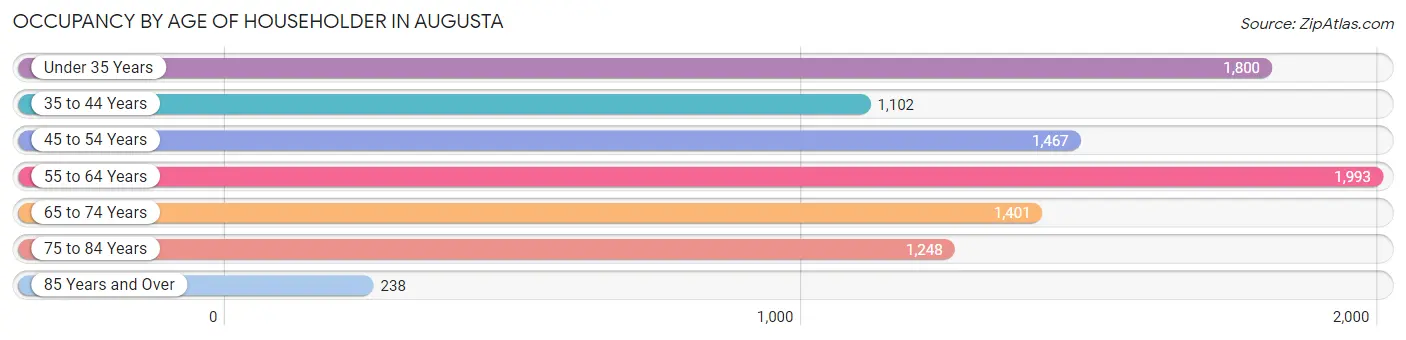
| Age Bracket | # Households | % Households |
| Under 35 Years | 1,800 | 19.5% |
| 35 to 44 Years | 1,102 | 11.9% |
| 45 to 54 Years | 1,467 | 15.9% |
| 55 to 64 Years | 1,993 | 21.5% |
| 65 to 74 Years | 1,401 | 15.1% |
| 75 to 84 Years | 1,248 | 13.5% |
| 85 Years and Over | 238 | 2.6% |
| Total | 9,249 | 100.0% |
Housing Finances in Augusta
Median Income by Occupancy in Augusta
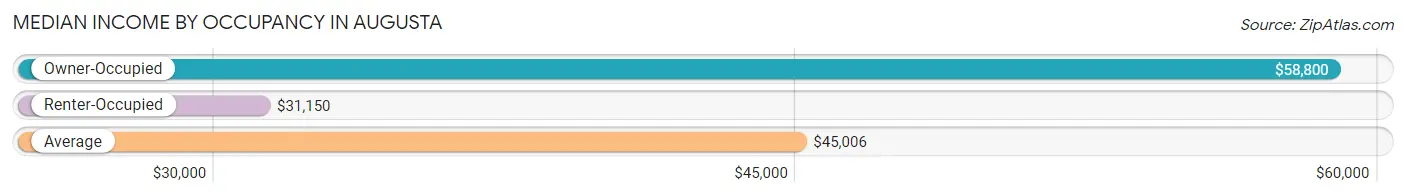
| Occupancy Type | # Households | Median Income |
| Owner-Occupied | 4,886 (52.8%) | $58,800 |
| Renter-Occupied | 4,363 (47.2%) | $31,150 |
| Average | 9,249 (100.0%) | $45,006 |
Occupancy by Householder Income Bracket in Augusta
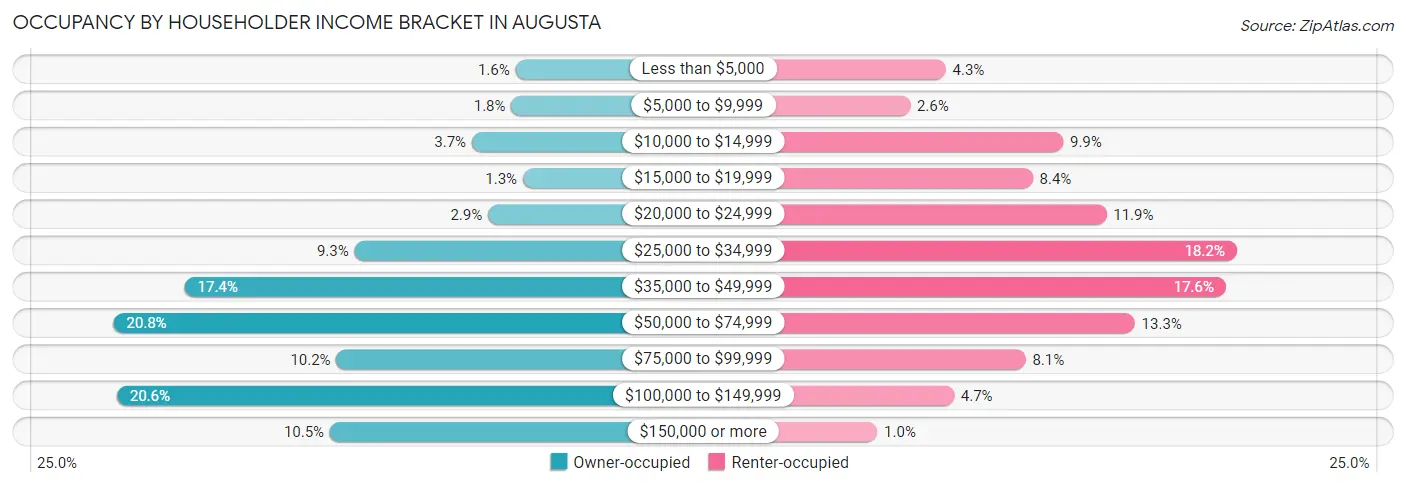
| Income Bracket | Owner-occupied | Renter-occupied |
| Less than $5,000 | 79 (1.6%) | 187 (4.3%) |
| $5,000 to $9,999 | 89 (1.8%) | 113 (2.6%) |
| $10,000 to $14,999 | 181 (3.7%) | 431 (9.9%) |
| $15,000 to $19,999 | 62 (1.3%) | 368 (8.4%) |
| $20,000 to $24,999 | 143 (2.9%) | 521 (11.9%) |
| $25,000 to $34,999 | 454 (9.3%) | 792 (18.1%) |
| $35,000 to $49,999 | 849 (17.4%) | 769 (17.6%) |
| $50,000 to $74,999 | 1,015 (20.8%) | 580 (13.3%) |
| $75,000 to $99,999 | 496 (10.2%) | 353 (8.1%) |
| $100,000 to $149,999 | 1,007 (20.6%) | 204 (4.7%) |
| $150,000 or more | 511 (10.5%) | 45 (1.0%) |
| Total | 4,886 (100.0%) | 4,363 (100.0%) |
Monthly Housing Cost Tiers in Augusta
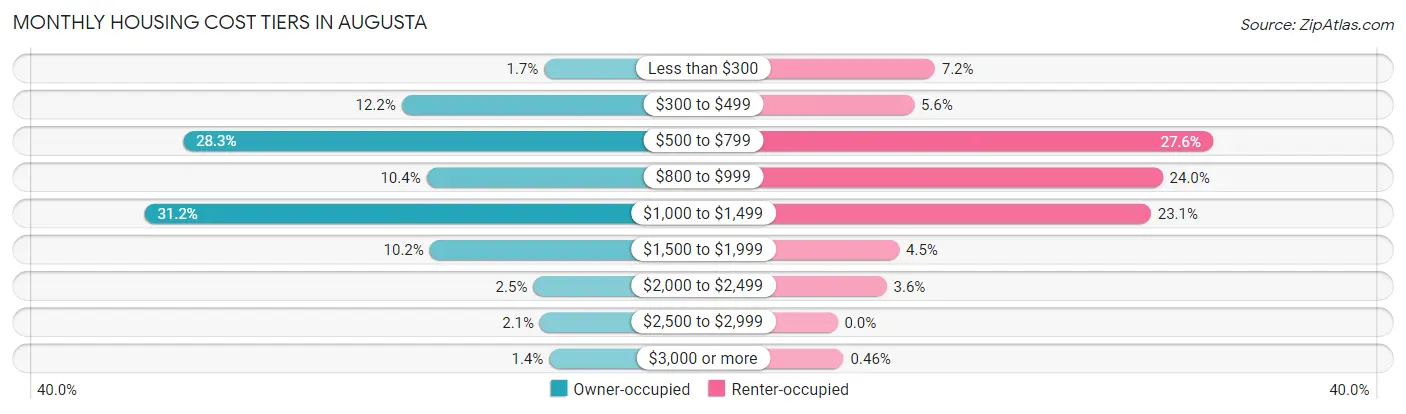
| Monthly Cost | Owner-occupied | Renter-occupied |
| Less than $300 | 85 (1.7%) | 313 (7.2%) |
| $300 to $499 | 598 (12.2%) | 246 (5.6%) |
| $500 to $799 | 1,384 (28.3%) | 1,206 (27.6%) |
| $800 to $999 | 508 (10.4%) | 1,045 (23.9%) |
| $1,000 to $1,499 | 1,523 (31.2%) | 1,007 (23.1%) |
| $1,500 to $1,999 | 497 (10.2%) | 198 (4.5%) |
| $2,000 to $2,499 | 124 (2.5%) | 158 (3.6%) |
| $2,500 to $2,999 | 100 (2.1%) | 0 (0.0%) |
| $3,000 or more | 67 (1.4%) | 20 (0.5%) |
| Total | 4,886 (100.0%) | 4,363 (100.0%) |
Physical Housing Characteristics in Augusta
Housing Structures in Augusta
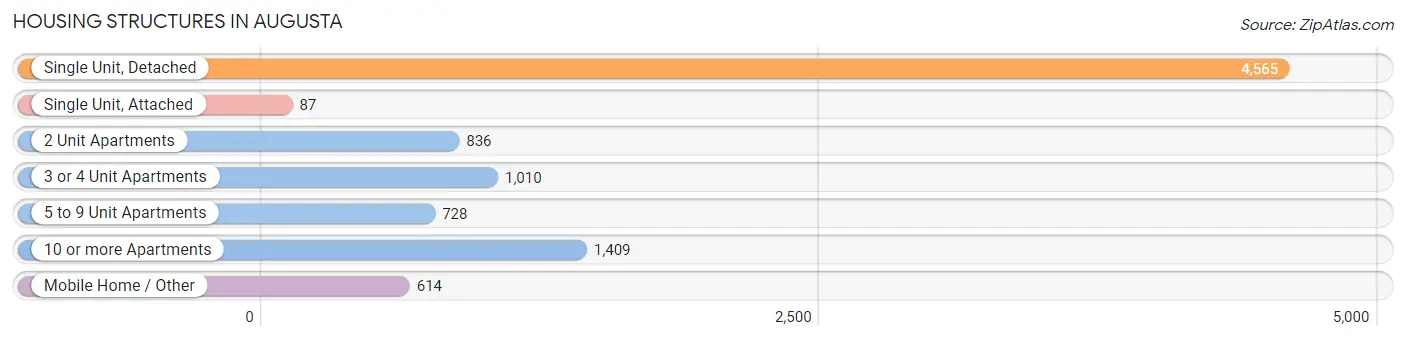
| Structure Type | # Housing Units | % Housing Units |
| Single Unit, Detached | 4,565 | 49.4% |
| Single Unit, Attached | 87 | 0.9% |
| 2 Unit Apartments | 836 | 9.0% |
| 3 or 4 Unit Apartments | 1,010 | 10.9% |
| 5 to 9 Unit Apartments | 728 | 7.9% |
| 10 or more Apartments | 1,409 | 15.2% |
| Mobile Home / Other | 614 | 6.6% |
| Total | 9,249 | 100.0% |
Housing Structures by Occupancy in Augusta
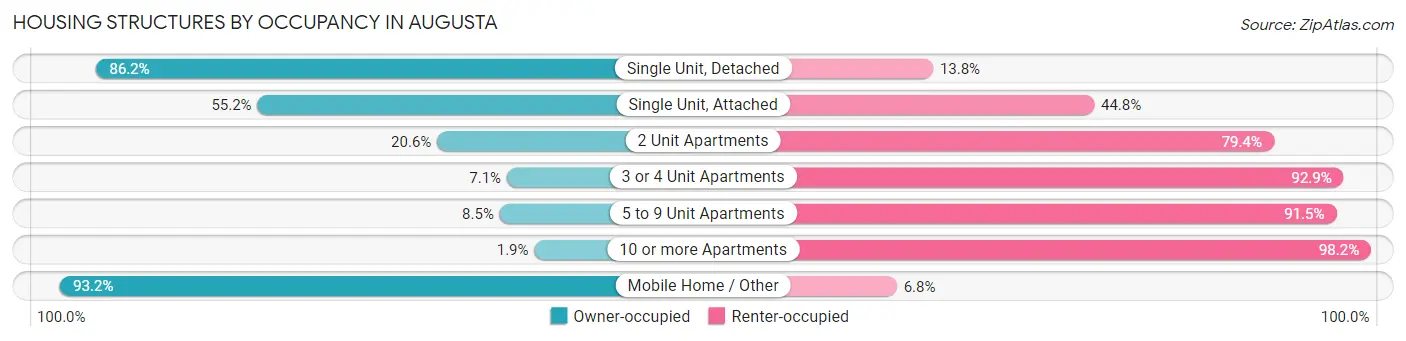
| Structure Type | Owner-occupied | Renter-occupied |
| Single Unit, Detached | 3,934 (86.2%) | 631 (13.8%) |
| Single Unit, Attached | 48 (55.2%) | 39 (44.8%) |
| 2 Unit Apartments | 172 (20.6%) | 664 (79.4%) |
| 3 or 4 Unit Apartments | 72 (7.1%) | 938 (92.9%) |
| 5 to 9 Unit Apartments | 62 (8.5%) | 666 (91.5%) |
| 10 or more Apartments | 26 (1.8%) | 1,383 (98.2%) |
| Mobile Home / Other | 572 (93.2%) | 42 (6.8%) |
| Total | 4,886 (52.8%) | 4,363 (47.2%) |
Housing Structures by Number of Rooms in Augusta
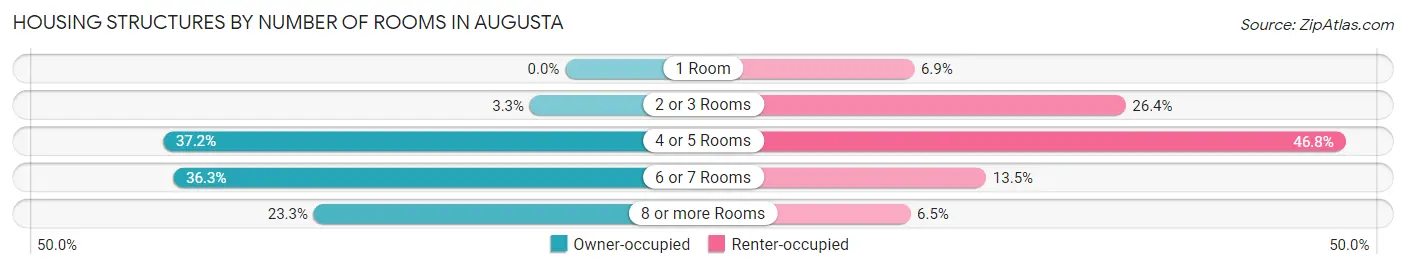
| Number of Rooms | Owner-occupied | Renter-occupied |
| 1 Room | 0 (0.0%) | 299 (6.9%) |
| 2 or 3 Rooms | 160 (3.3%) | 1,152 (26.4%) |
| 4 or 5 Rooms | 1,818 (37.2%) | 2,040 (46.8%) |
| 6 or 7 Rooms | 1,772 (36.3%) | 589 (13.5%) |
| 8 or more Rooms | 1,136 (23.3%) | 283 (6.5%) |
| Total | 4,886 (100.0%) | 4,363 (100.0%) |
Housing Structure by Heating Type in Augusta
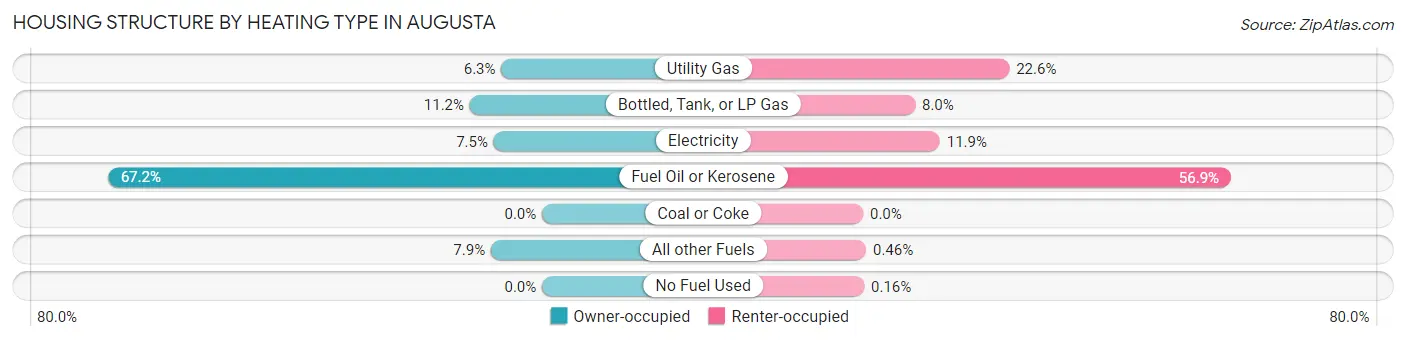
| Heating Type | Owner-occupied | Renter-occupied |
| Utility Gas | 308 (6.3%) | 986 (22.6%) |
| Bottled, Tank, or LP Gas | 546 (11.2%) | 351 (8.0%) |
| Electricity | 365 (7.5%) | 518 (11.9%) |
| Fuel Oil or Kerosene | 3,281 (67.1%) | 2,481 (56.9%) |
| Coal or Coke | 0 (0.0%) | 0 (0.0%) |
| All other Fuels | 386 (7.9%) | 20 (0.5%) |
| No Fuel Used | 0 (0.0%) | 7 (0.2%) |
| Total | 4,886 (100.0%) | 4,363 (100.0%) |
Household Vehicle Usage in Augusta
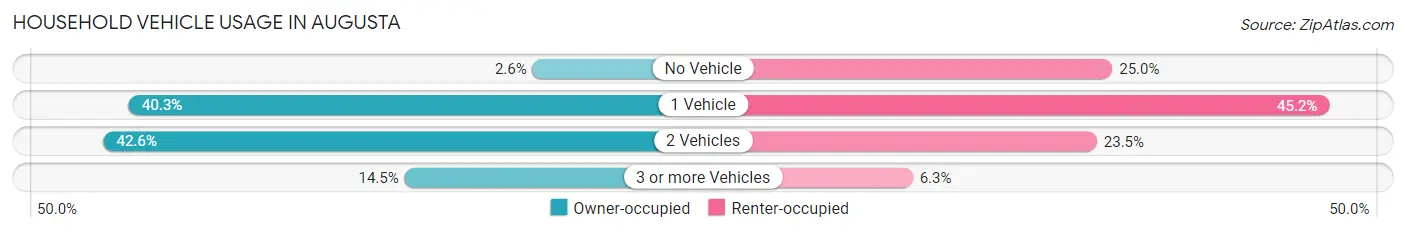
| Vehicles per Household | Owner-occupied | Renter-occupied |
| No Vehicle | 126 (2.6%) | 1,089 (25.0%) |
| 1 Vehicle | 1,967 (40.3%) | 1,972 (45.2%) |
| 2 Vehicles | 2,083 (42.6%) | 1,026 (23.5%) |
| 3 or more Vehicles | 710 (14.5%) | 276 (6.3%) |
| Total | 4,886 (100.0%) | 4,363 (100.0%) |
Real Estate & Mortgages in Augusta
Real Estate and Mortgage Overview in Augusta
| Characteristic | Without Mortgage | With Mortgage |
| Housing Units | 1,830 | 3,056 |
| Median Property Value | $169,700 | $163,800 |
| Median Household Income | $53,929 | $374 |
| Monthly Housing Costs | $547 | $67 |
| Real Estate Taxes | $2,660 | $36 |
Property Value by Mortgage Status in Augusta
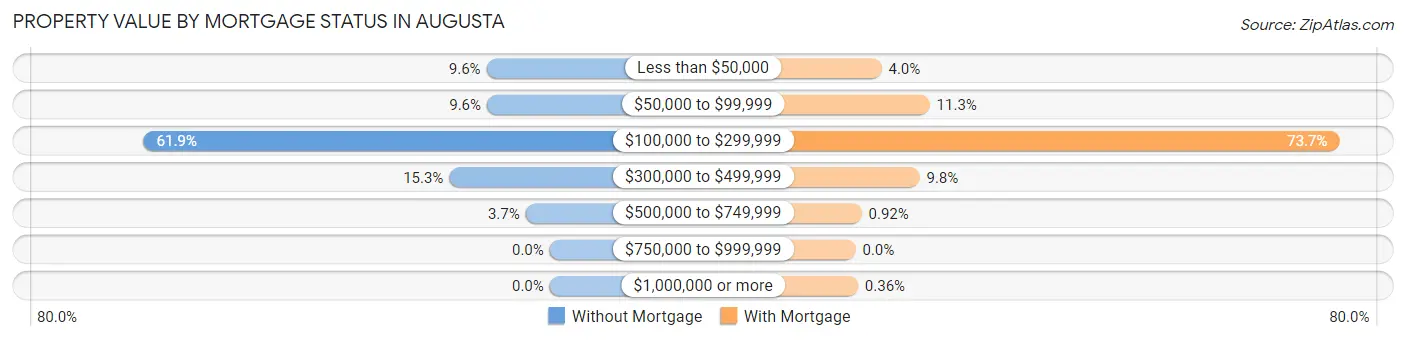
| Property Value | Without Mortgage | With Mortgage |
| Less than $50,000 | 176 (9.6%) | 121 (4.0%) |
| $50,000 to $99,999 | 175 (9.6%) | 345 (11.3%) |
| $100,000 to $299,999 | 1,132 (61.9%) | 2,253 (73.7%) |
| $300,000 to $499,999 | 280 (15.3%) | 298 (9.8%) |
| $500,000 to $749,999 | 67 (3.7%) | 28 (0.9%) |
| $750,000 to $999,999 | 0 (0.0%) | 0 (0.0%) |
| $1,000,000 or more | 0 (0.0%) | 11 (0.4%) |
| Total | 1,830 (100.0%) | 3,056 (100.0%) |
Household Income by Mortgage Status in Augusta
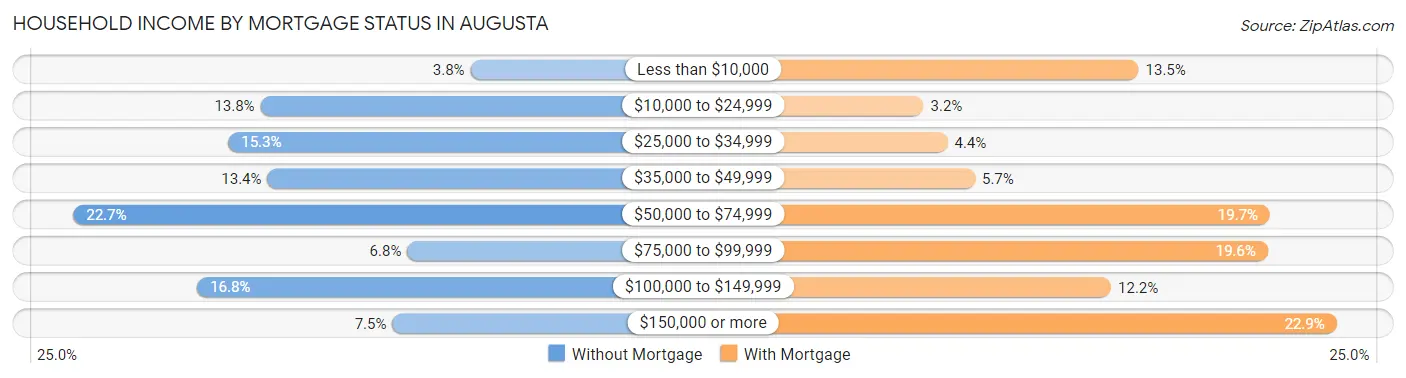
| Household Income | Without Mortgage | With Mortgage |
| Less than $10,000 | 69 (3.8%) | 412 (13.5%) |
| $10,000 to $24,999 | 252 (13.8%) | 99 (3.2%) |
| $25,000 to $34,999 | 280 (15.3%) | 134 (4.4%) |
| $35,000 to $49,999 | 246 (13.4%) | 174 (5.7%) |
| $50,000 to $74,999 | 415 (22.7%) | 603 (19.7%) |
| $75,000 to $99,999 | 124 (6.8%) | 600 (19.6%) |
| $100,000 to $149,999 | 307 (16.8%) | 372 (12.2%) |
| $150,000 or more | 137 (7.5%) | 700 (22.9%) |
| Total | 1,830 (100.0%) | 3,056 (100.0%) |
Property Value to Household Income Ratio in Augusta
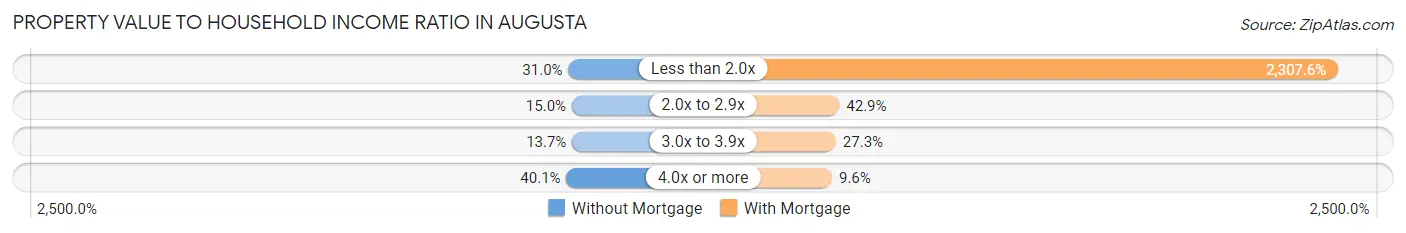
| Value-to-Income Ratio | Without Mortgage | With Mortgage |
| Less than 2.0x | 567 (31.0%) | 70,521 (2,307.6%) |
| 2.0x to 2.9x | 275 (15.0%) | 1,312 (42.9%) |
| 3.0x to 3.9x | 251 (13.7%) | 833 (27.3%) |
| 4.0x or more | 733 (40.1%) | 293 (9.6%) |
| Total | 1,830 (100.0%) | 3,056 (100.0%) |
Real Estate Taxes by Mortgage Status in Augusta
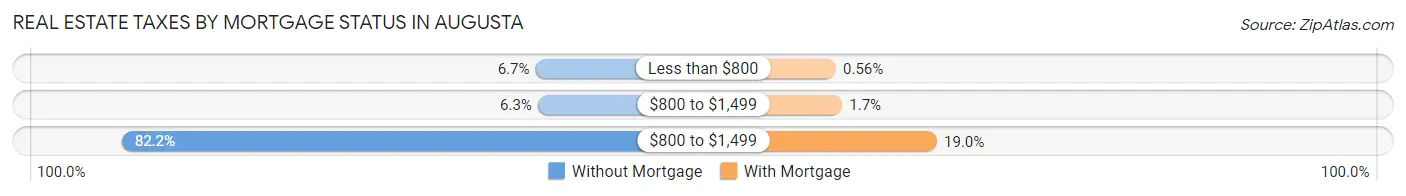
| Property Taxes | Without Mortgage | With Mortgage |
| Less than $800 | 123 (6.7%) | 17 (0.6%) |
| $800 to $1,499 | 115 (6.3%) | 52 (1.7%) |
| $800 to $1,499 | 1,505 (82.2%) | 581 (19.0%) |
| Total | 1,830 (100.0%) | 3,056 (100.0%) |
Health & Disability in Augusta
Health Insurance Coverage by Age in Augusta
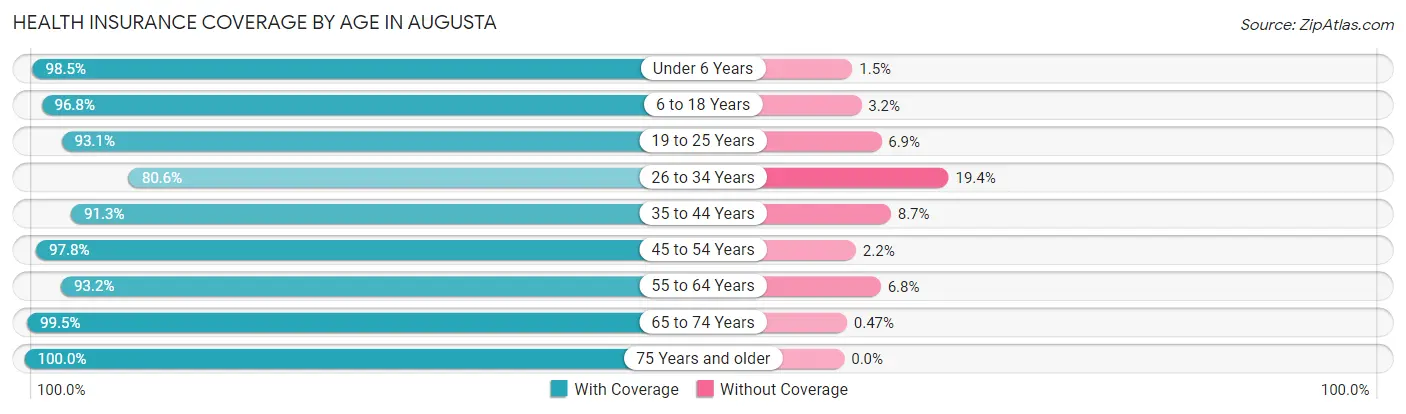
| Age Bracket | With Coverage | Without Coverage |
| Under 6 Years | 1,315 (98.5%) | 20 (1.5%) |
| 6 to 18 Years | 2,013 (96.8%) | 66 (3.2%) |
| 19 to 25 Years | 1,025 (93.1%) | 76 (6.9%) |
| 26 to 34 Years | 2,349 (80.6%) | 567 (19.4%) |
| 35 to 44 Years | 1,706 (91.3%) | 162 (8.7%) |
| 45 to 54 Years | 2,310 (97.8%) | 51 (2.2%) |
| 55 to 64 Years | 2,552 (93.2%) | 186 (6.8%) |
| 65 to 74 Years | 1,917 (99.5%) | 9 (0.5%) |
| 75 Years and older | 1,825 (100.0%) | 0 (0.0%) |
| Total | 17,012 (93.7%) | 1,137 (6.3%) |
Health Insurance Coverage by Citizenship Status in Augusta
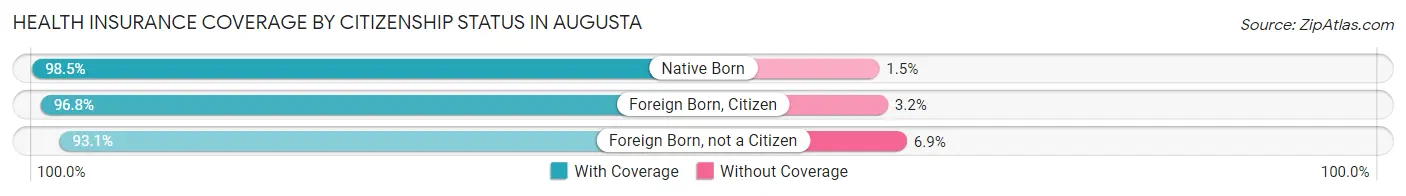
| Citizenship Status | With Coverage | Without Coverage |
| Native Born | 1,315 (98.5%) | 20 (1.5%) |
| Foreign Born, Citizen | 2,013 (96.8%) | 66 (3.2%) |
| Foreign Born, not a Citizen | 1,025 (93.1%) | 76 (6.9%) |
Health Insurance Coverage by Household Income in Augusta
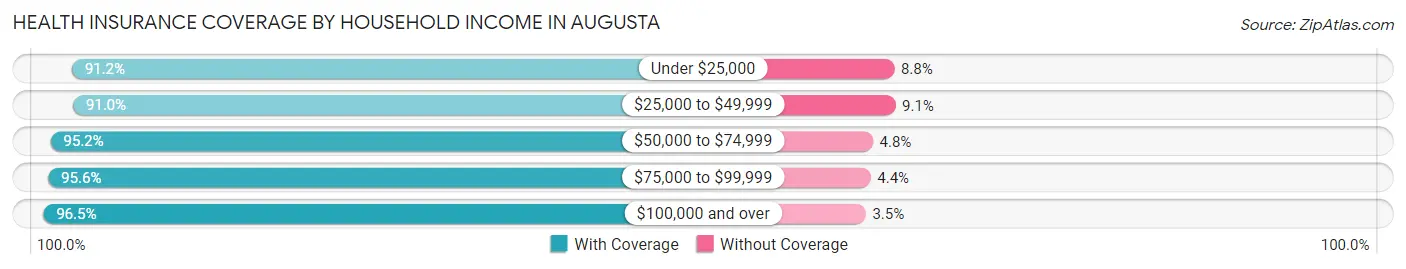
| Household Income | With Coverage | Without Coverage |
| Under $25,000 | 2,526 (91.2%) | 245 (8.8%) |
| $25,000 to $49,999 | 4,625 (90.9%) | 460 (9.0%) |
| $50,000 to $74,999 | 3,249 (95.2%) | 165 (4.8%) |
| $75,000 to $99,999 | 2,208 (95.6%) | 102 (4.4%) |
| $100,000 and over | 4,277 (96.5%) | 155 (3.5%) |
Public vs Private Health Insurance Coverage by Age in Augusta
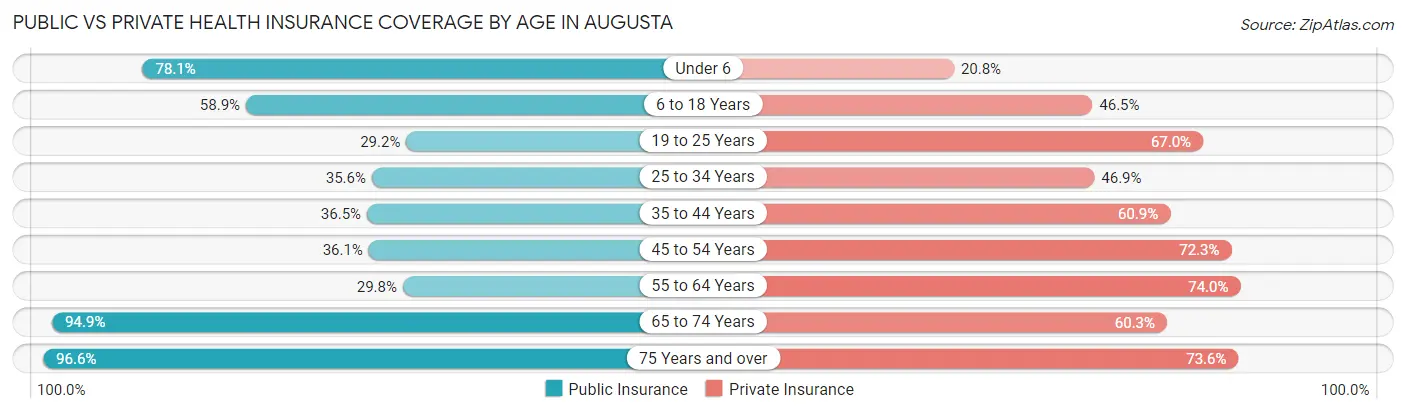
| Age Bracket | Public Insurance | Private Insurance |
| Under 6 | 1,043 (78.1%) | 278 (20.8%) |
| 6 to 18 Years | 1,225 (58.9%) | 967 (46.5%) |
| 19 to 25 Years | 321 (29.2%) | 738 (67.0%) |
| 25 to 34 Years | 1,037 (35.6%) | 1,367 (46.9%) |
| 35 to 44 Years | 681 (36.5%) | 1,138 (60.9%) |
| 45 to 54 Years | 853 (36.1%) | 1,707 (72.3%) |
| 55 to 64 Years | 816 (29.8%) | 2,025 (74.0%) |
| 65 to 74 Years | 1,828 (94.9%) | 1,162 (60.3%) |
| 75 Years and over | 1,762 (96.6%) | 1,343 (73.6%) |
| Total | 9,566 (52.7%) | 10,725 (59.1%) |
Disability Status by Sex by Age in Augusta
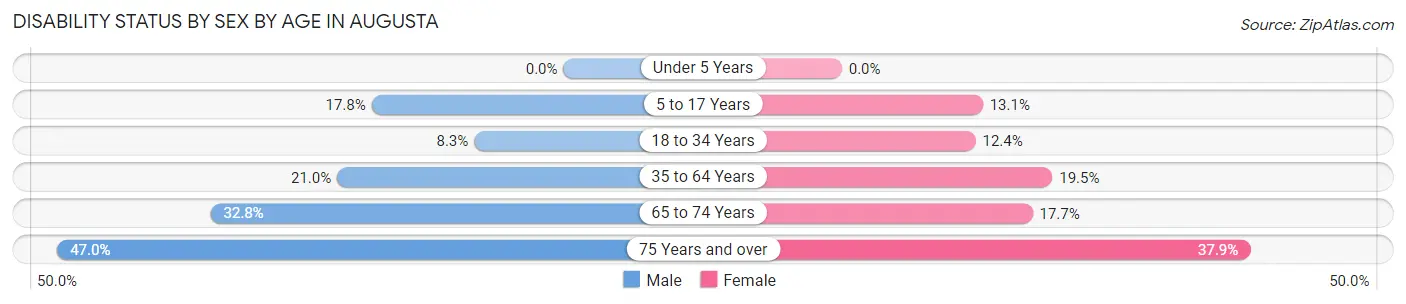
| Age Bracket | Male | Female |
| Under 5 Years | 0 (0.0%) | 0 (0.0%) |
| 5 to 17 Years | 186 (17.8%) | 143 (13.1%) |
| 18 to 34 Years | 173 (8.3%) | 253 (12.4%) |
| 35 to 64 Years | 715 (21.0%) | 696 (19.5%) |
| 65 to 74 Years | 281 (32.8%) | 189 (17.7%) |
| 75 Years and over | 287 (47.0%) | 460 (37.9%) |
Disability Class by Sex by Age in Augusta
Disability Class: Hearing Difficulty
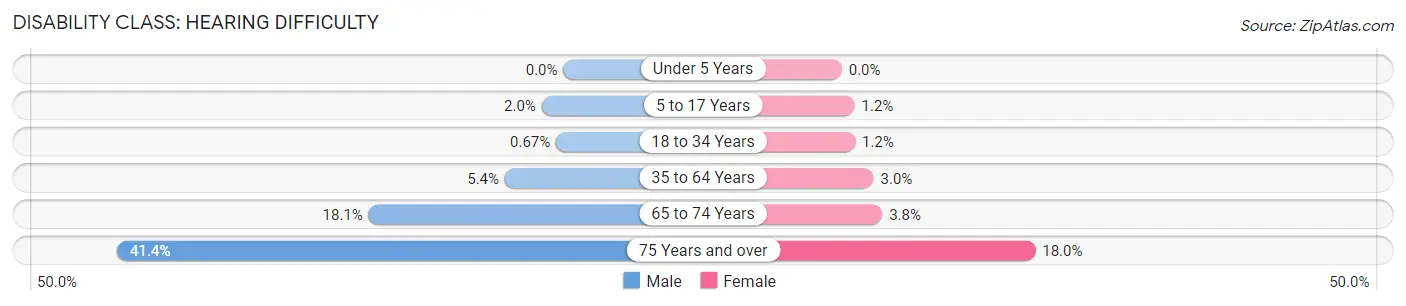
| Age Bracket | Male | Female |
| Under 5 Years | 0 (0.0%) | 0 (0.0%) |
| 5 to 17 Years | 21 (2.0%) | 13 (1.2%) |
| 18 to 34 Years | 14 (0.7%) | 25 (1.2%) |
| 35 to 64 Years | 185 (5.4%) | 105 (2.9%) |
| 65 to 74 Years | 155 (18.1%) | 40 (3.7%) |
| 75 Years and over | 253 (41.4%) | 218 (18.0%) |
Disability Class: Vision Difficulty
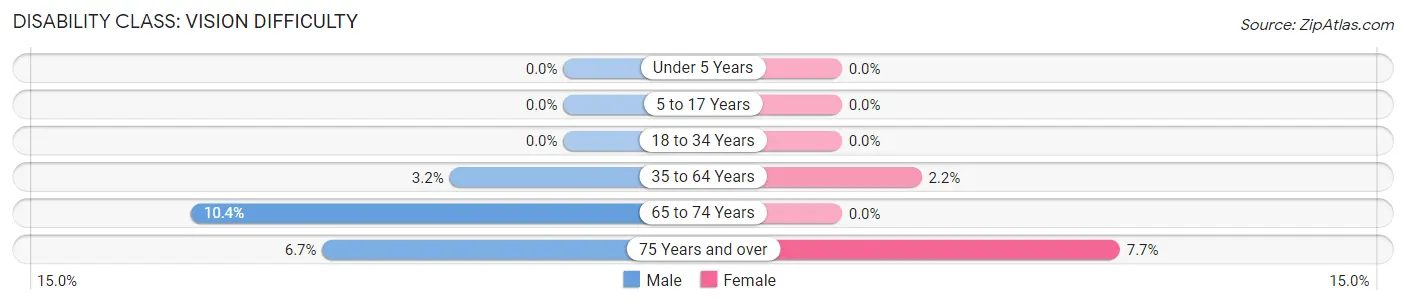
| Age Bracket | Male | Female |
| Under 5 Years | 0 (0.0%) | 0 (0.0%) |
| 5 to 17 Years | 0 (0.0%) | 0 (0.0%) |
| 18 to 34 Years | 0 (0.0%) | 0 (0.0%) |
| 35 to 64 Years | 108 (3.2%) | 79 (2.2%) |
| 65 to 74 Years | 89 (10.4%) | 0 (0.0%) |
| 75 Years and over | 41 (6.7%) | 94 (7.7%) |
Disability Class: Cognitive Difficulty
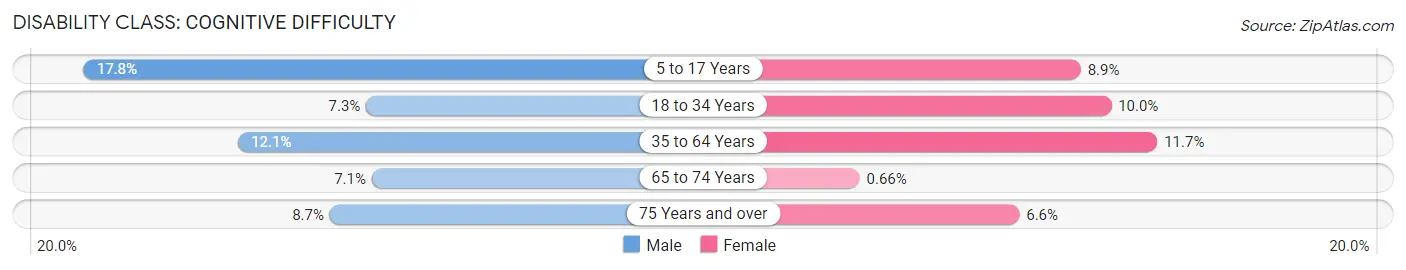
| Age Bracket | Male | Female |
| 5 to 17 Years | 186 (17.8%) | 97 (8.9%) |
| 18 to 34 Years | 153 (7.3%) | 204 (10.0%) |
| 35 to 64 Years | 411 (12.1%) | 417 (11.7%) |
| 65 to 74 Years | 61 (7.1%) | 7 (0.7%) |
| 75 Years and over | 53 (8.7%) | 80 (6.6%) |
Disability Class: Ambulatory Difficulty
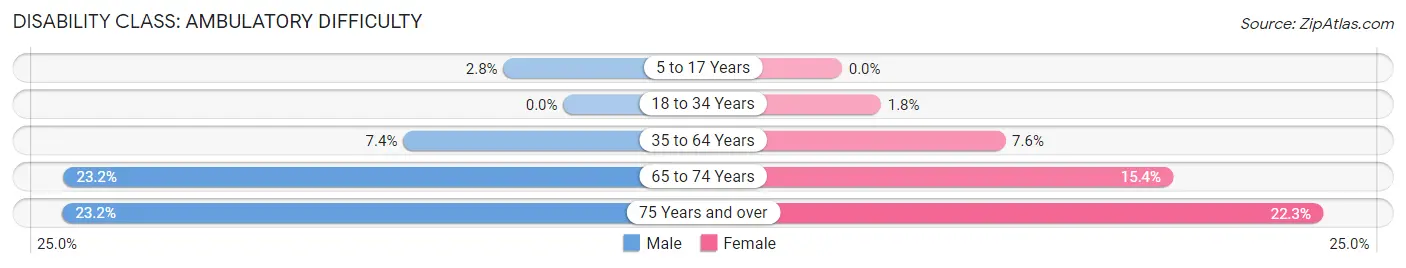
| Age Bracket | Male | Female |
| 5 to 17 Years | 29 (2.8%) | 0 (0.0%) |
| 18 to 34 Years | 0 (0.0%) | 37 (1.8%) |
| 35 to 64 Years | 253 (7.4%) | 270 (7.6%) |
| 65 to 74 Years | 199 (23.2%) | 164 (15.4%) |
| 75 Years and over | 142 (23.2%) | 271 (22.3%) |
Disability Class: Self-Care Difficulty
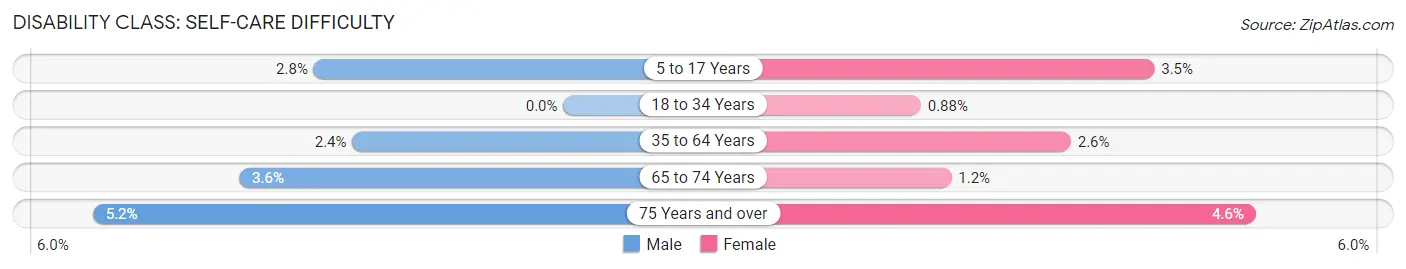
| Age Bracket | Male | Female |
| 5 to 17 Years | 29 (2.8%) | 38 (3.5%) |
| 18 to 34 Years | 0 (0.0%) | 18 (0.9%) |
| 35 to 64 Years | 80 (2.4%) | 91 (2.5%) |
| 65 to 74 Years | 31 (3.6%) | 13 (1.2%) |
| 75 Years and over | 32 (5.2%) | 56 (4.6%) |
Technology Access in Augusta
Computing Device Access in Augusta
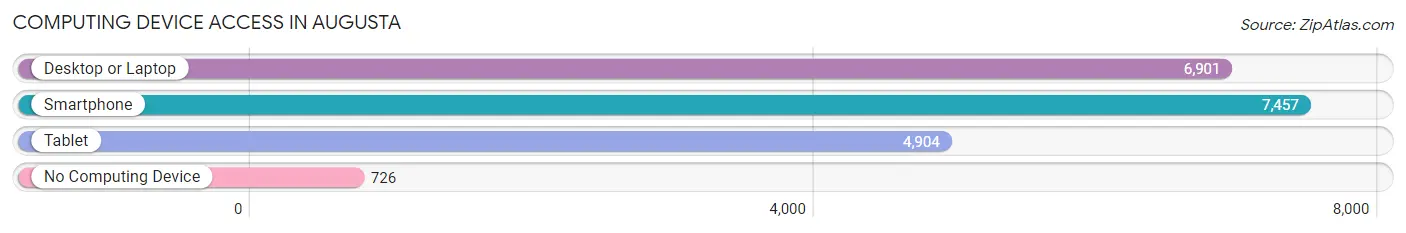
| Device Type | # Households | % Households |
| Desktop or Laptop | 6,901 | 74.6% |
| Smartphone | 7,457 | 80.6% |
| Tablet | 4,904 | 53.0% |
| No Computing Device | 726 | 7.9% |
| Total | 9,249 | 100.0% |
Internet Access in Augusta
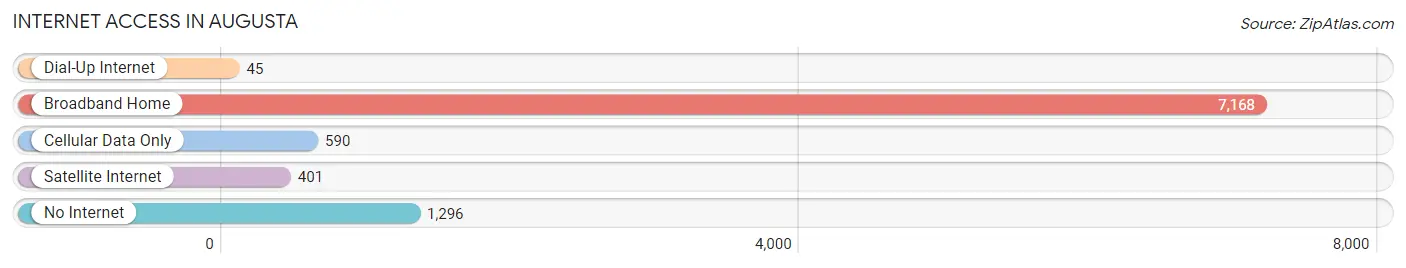
| Internet Type | # Households | % Households |
| Dial-Up Internet | 45 | 0.5% |
| Broadband Home | 7,168 | 77.5% |
| Cellular Data Only | 590 | 6.4% |
| Satellite Internet | 401 | 4.3% |
| No Internet | 1,296 | 14.0% |
| Total | 9,249 | 100.0% |
Augusta Summary
Augusta, Maine is the capital of the state of Maine and the county seat of Kennebec County. It is located in the south-central part of the state, along the Kennebec River. Augusta is the third-largest city in Maine, with a population of 19,136 as of the 2010 census.
History
Augusta was first settled in 1754 by British colonists, who named it Harrington after the Earl of Harrington. The town was incorporated in 1797 and renamed Augusta after Princess Augusta, the daughter of King George III. During the 19th century, Augusta was an important center for the lumber and shipbuilding industries. It was also the site of the first state capital of Maine, from 1827 to 1832.
Geography
Augusta is located in south-central Maine, along the Kennebec River. It is situated at the head of navigation on the river, and is bordered by the towns of Hallowell, Manchester, Chelsea, and Vassalboro. The city has a total area of 28.2 square miles, of which 27.7 square miles is land and 0.5 square miles is water.
Economy
Augusta’s economy is largely based on government and services. The city is home to the Maine State House, the Maine State Senate, and the Maine Supreme Judicial Court. It is also the site of the Augusta State Airport, which serves the city and surrounding areas.
The city is also home to several large employers, including the MaineGeneral Medical Center, the Maine Department of Corrections, and the Maine Department of Transportation. Other major employers include the University of Maine at Augusta, the Maine State Employees Association, and the Maine State Employees Credit Union.
Demographics
As of the 2010 census, the population of Augusta was 19,136. The racial makeup of the city was 94.2% White, 1.3% African American, 0.5% Native American, 1.2% Asian, 0.1% Pacific Islander, 0.7% from other races, and 1.9% from two or more races. Hispanic or Latino of any race were 2.2% of the population.
The median income for a household in the city was $37,945, and the median income for a family was $45,945. The per capita income for the city was $20,845. About 11.2% of families and 14.3% of the population were below the poverty line, including 19.2% of those under age 18 and 8.2% of those age 65 or over.
Augusta is served by the Kennebec Valley Community College, the University of Maine at Augusta, and the Augusta School Department. The city is also home to several museums, including the Maine State Museum, the Maine State Library, and the Maine State Archives.
Common Questions
What is Per Capita Income in Augusta?
Per Capita income in Augusta is $32,743.
What is the Median Family Income in Augusta?
Median Family Income in Augusta is $63,675.
What is the Median Household income in Augusta?
Median Household Income in Augusta is $45,006.
What is Income or Wage Gap in Augusta?
Income or Wage Gap in Augusta is 2.6%.
Women in Augusta earn 97.4 cents for every dollar earned by a man.
What is Family Income Deficit in Augusta?
Family Income Deficit in Augusta is $7,233.
Families that are below poverty line in Augusta earn $7,233 less on average than the poverty threshold level.
What is Inequality or Gini Index in Augusta?
Inequality or Gini Index in Augusta is 0.46.
What is the Total Population of Augusta?
Total Population of Augusta is 18,938.
What is the Total Male Population of Augusta?
Total Male Population of Augusta is 8,921.
What is the Total Female Population of Augusta?
Total Female Population of Augusta is 10,017.
What is the Ratio of Males per 100 Females in Augusta?
There are 89.06 Males per 100 Females in Augusta.
What is the Ratio of Females per 100 Males in Augusta?
There are 112.29 Females per 100 Males in Augusta.
What is the Median Population Age in Augusta?
Median Population Age in Augusta is 44.9 Years.
What is the Average Family Size in Augusta
Average Family Size in Augusta is 2.7 People.
What is the Average Household Size in Augusta
Average Household Size in Augusta is 1.9 People.
How Large is the Labor Force in Augusta?
There are 9,486 People in the Labor Forcein in Augusta.
What is the Percentage of People in the Labor Force in Augusta?
58.9% of People are in the Labor Force in Augusta.
What is the Unemployment Rate in Augusta?
Unemployment Rate in Augusta is 7.7%.