Bath, ME Map & Demographics
Bath Map
Bath Overview
$36,471
PER CAPITA INCOME
$85,741
AVG FAMILY INCOME
$63,023
AVG HOUSEHOLD INCOME
37.2%
WAGE / INCOME GAP [ % ]
62.8¢/ $1
WAGE / INCOME GAP [ $ ]
$10,393
FAMILY INCOME DEFICIT
0.42
INEQUALITY / GINI INDEX
8,775
TOTAL POPULATION
4,327
MALE POPULATION
4,448
FEMALE POPULATION
97.28
MALES / 100 FEMALES
102.80
FEMALES / 100 MALES
43.5
MEDIAN AGE
2.8
AVG FAMILY SIZE
2.2
AVG HOUSEHOLD SIZE
4,576
LABOR FORCE [ PEOPLE ]
63.2%
PERCENT IN LABOR FORCE
5.2%
UNEMPLOYMENT RATE
Bath Zip Codes
Bath Area Codes
Income in Bath
Income Overview in Bath
Per Capita Income in Bath is $36,471, while median incomes of families and households are $85,741 and $63,023 respectively.
| Characteristic | Number | Measure |
| Per Capita Income | 8,775 | $36,471 |
| Median Family Income | 2,296 | $85,741 |
| Mean Family Income | 2,296 | $97,070 |
| Median Household Income | 4,014 | $63,023 |
| Mean Household Income | 4,014 | $79,024 |
| Income Deficit | 2,296 | $10,393 |
| Wage / Income Gap (%) | 8,775 | 37.23% |
| Wage / Income Gap ($) | 8,775 | 62.77¢ per $1 |
| Gini / Inequality Index | 8,775 | 0.42 |
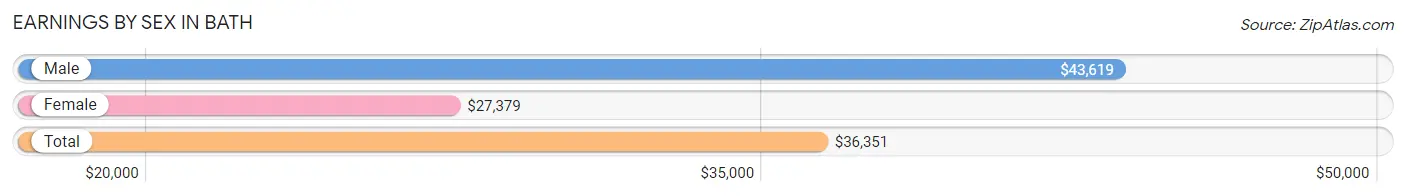
Earnings by Sex in Bath
Average Earnings in Bath are $36,351, $43,619 for men and $27,379 for women, a difference of 37.2%.
| Sex | Number | Average Earnings |
| Male | 2,372 (48.9%) | $43,619 |
| Female | 2,480 (51.1%) | $27,379 |
| Total | 4,852 (100.0%) | $36,351 |
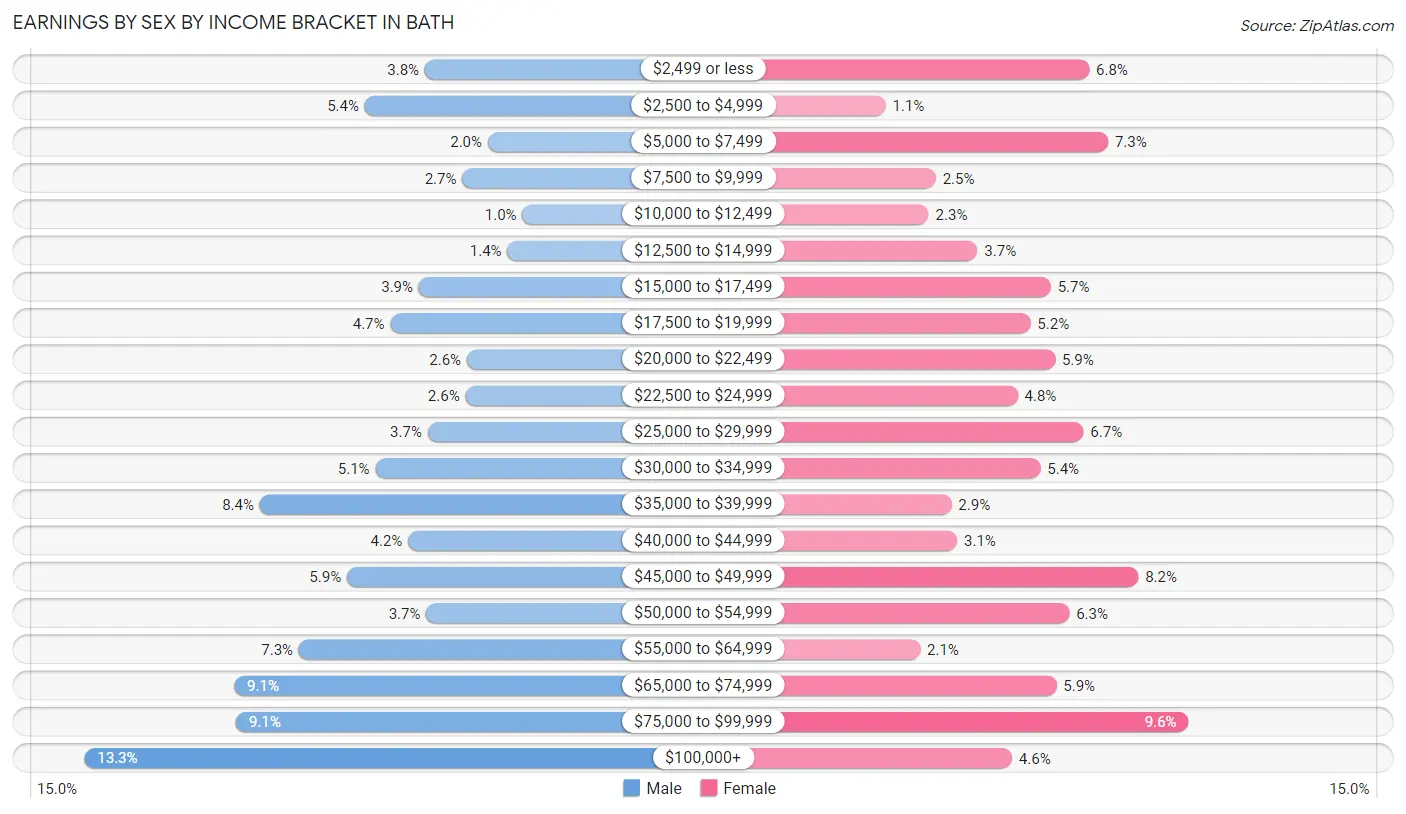
Earnings by Sex by Income Bracket in Bath
The most common earnings brackets in Bath are $100,000+ for men (316 | 13.3%) and $75,000 to $99,999 for women (238 | 9.6%).
| Income | Male | Female |
| $2,499 or less | 89 (3.7%) | 169 (6.8%) |
| $2,500 to $4,999 | 129 (5.4%) | 27 (1.1%) |
| $5,000 to $7,499 | 47 (2.0%) | 182 (7.3%) |
| $7,500 to $9,999 | 64 (2.7%) | 62 (2.5%) |
| $10,000 to $12,499 | 24 (1.0%) | 57 (2.3%) |
| $12,500 to $14,999 | 34 (1.4%) | 91 (3.7%) |
| $15,000 to $17,499 | 93 (3.9%) | 142 (5.7%) |
| $17,500 to $19,999 | 112 (4.7%) | 128 (5.2%) |
| $20,000 to $22,499 | 61 (2.6%) | 145 (5.9%) |
| $22,500 to $24,999 | 62 (2.6%) | 119 (4.8%) |
| $25,000 to $29,999 | 87 (3.7%) | 165 (6.7%) |
| $30,000 to $34,999 | 122 (5.1%) | 135 (5.4%) |
| $35,000 to $39,999 | 199 (8.4%) | 73 (2.9%) |
| $40,000 to $44,999 | 100 (4.2%) | 77 (3.1%) |
| $45,000 to $49,999 | 141 (5.9%) | 203 (8.2%) |
| $50,000 to $54,999 | 88 (3.7%) | 155 (6.2%) |
| $55,000 to $64,999 | 173 (7.3%) | 51 (2.1%) |
| $65,000 to $74,999 | 216 (9.1%) | 146 (5.9%) |
| $75,000 to $99,999 | 215 (9.1%) | 238 (9.6%) |
| $100,000+ | 316 (13.3%) | 115 (4.6%) |
| Total | 2,372 (100.0%) | 2,480 (100.0%) |
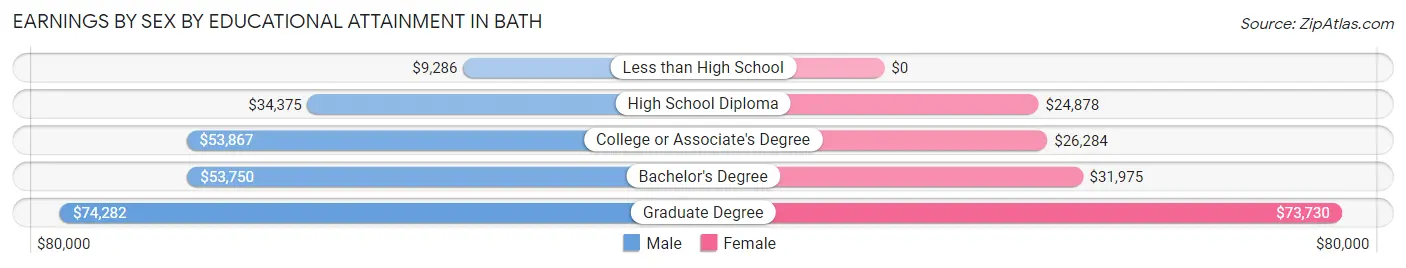
Earnings by Sex by Educational Attainment in Bath
Average earnings in Bath are $48,158 for men and $32,472 for women, a difference of 32.6%. Men with an educational attainment of graduate degree enjoy the highest average annual earnings of $74,282, while those with less than high school education earn the least with $9,286. Women with an educational attainment of graduate degree earn the most with the average annual earnings of $73,730, while those with high school diploma education have the smallest earnings of $24,878.
| Educational Attainment | Male Income | Female Income |
| Less than High School | $9,286 | $0 |
| High School Diploma | $34,375 | $24,878 |
| College or Associate's Degree | $53,867 | $26,284 |
| Bachelor's Degree | $53,750 | $31,975 |
| Graduate Degree | $74,282 | $73,730 |
| Total | $48,158 | $32,472 |
Family Income in Bath
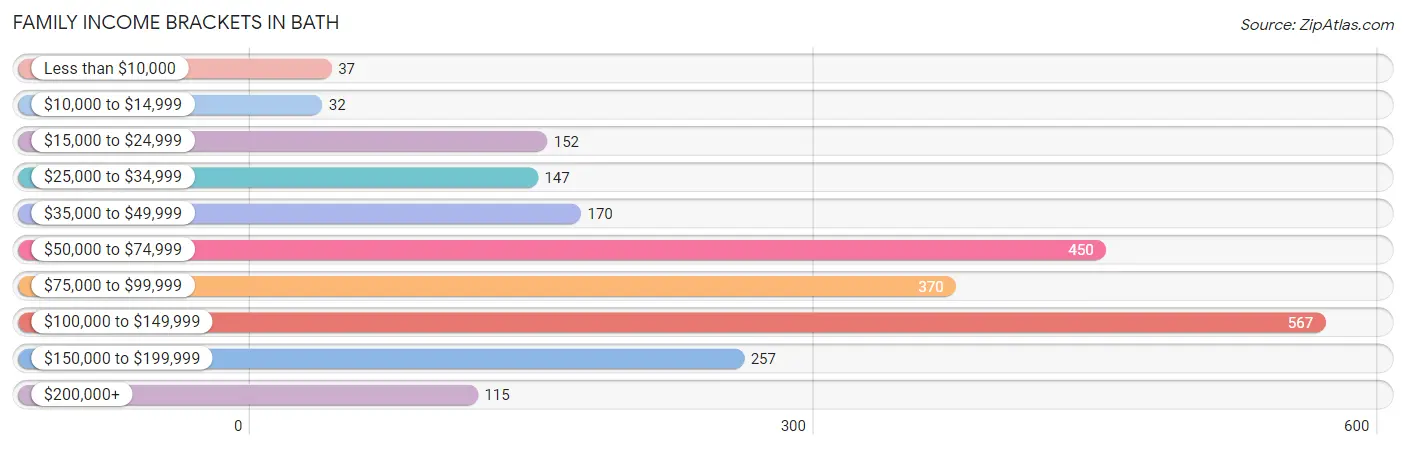
Family Income Brackets in Bath
According to the Bath family income data, there are 567 families falling into the $100,000 to $149,999 income range, which is the most common income bracket and makes up 24.7% of all families. Conversely, the $10,000 to $14,999 income bracket is the least frequent group with only 32 families (1.4%) belonging to this category.
| Income Bracket | # Families | % Families |
| Less than $10,000 | 37 | 1.6% |
| $10,000 to $14,999 | 32 | 1.4% |
| $15,000 to $24,999 | 152 | 6.6% |
| $25,000 to $34,999 | 147 | 6.4% |
| $35,000 to $49,999 | 170 | 7.4% |
| $50,000 to $74,999 | 450 | 19.6% |
| $75,000 to $99,999 | 370 | 16.1% |
| $100,000 to $149,999 | 567 | 24.7% |
| $150,000 to $199,999 | 257 | 11.2% |
| $200,000+ | 115 | 5.0% |
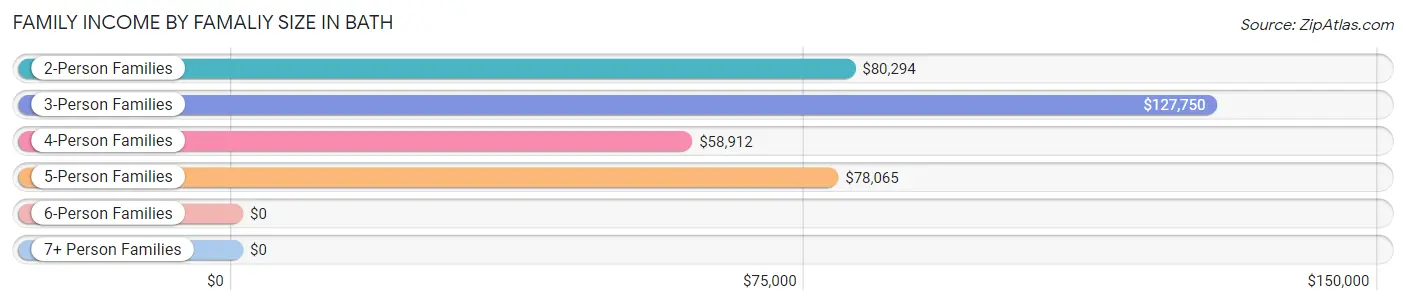
Family Income by Famaliy Size in Bath
3-person families (344 | 15.0%) account for the highest median family income in Bath with $127,750 per family, while 3-person families (344 | 15.0%) have the highest median income of $42,583 per family member.
| Income Bracket | # Families | Median Income |
| 2-Person Families | 1,402 (61.1%) | $80,294 |
| 3-Person Families | 344 (15.0%) | $127,750 |
| 4-Person Families | 413 (18.0%) | $58,912 |
| 5-Person Families | 77 (3.4%) | $78,065 |
| 6-Person Families | 35 (1.5%) | $0 |
| 7+ Person Families | 25 (1.1%) | $0 |
| Total | 2,296 (100.0%) | $85,741 |
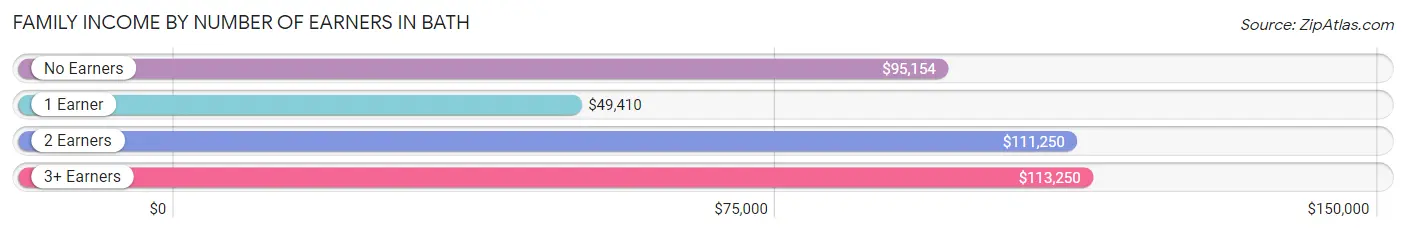
Family Income by Number of Earners in Bath
The median family income in Bath is $85,741, with families comprising 3+ earners (162) having the highest median family income of $113,250, while families with 1 earner (712) have the lowest median family income of $49,410, accounting for 7.1% and 31.0% of families, respectively.
| Number of Earners | # Families | Median Income |
| No Earners | 453 (19.7%) | $95,154 |
| 1 Earner | 712 (31.0%) | $49,410 |
| 2 Earners | 969 (42.2%) | $111,250 |
| 3+ Earners | 162 (7.1%) | $113,250 |
| Total | 2,296 (100.0%) | $85,741 |
Household Income in Bath
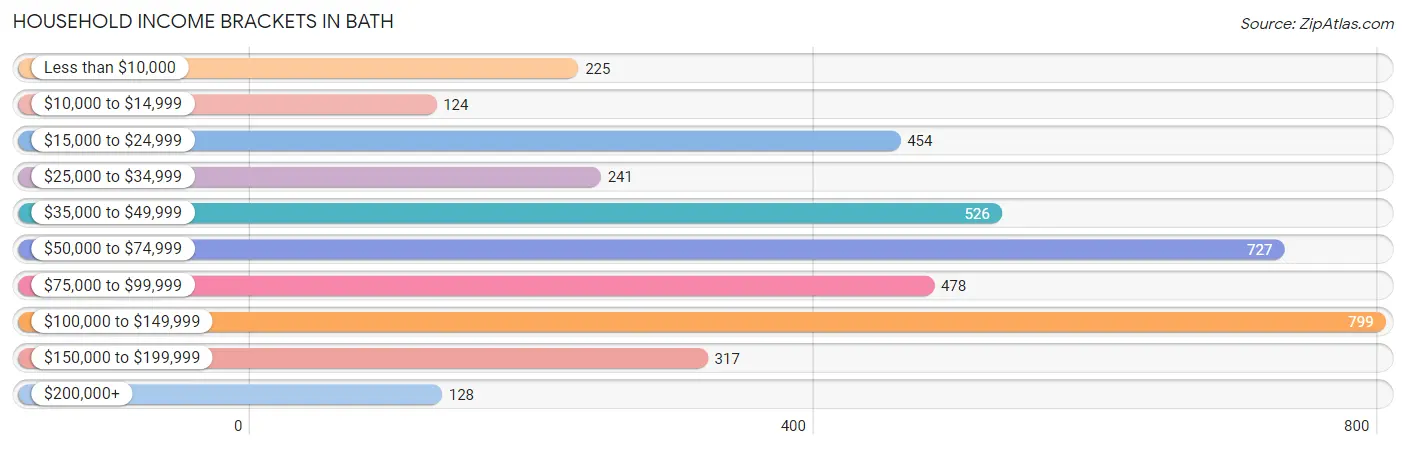
Household Income Brackets in Bath
With 799 households falling in the category, the $100,000 to $149,999 income range is the most frequent in Bath, accounting for 19.9% of all households. In contrast, only 124 households (3.1%) fall into the $10,000 to $14,999 income bracket, making it the least populous group.
| Income Bracket | # Households | % Households |
| Less than $10,000 | 225 | 5.6% |
| $10,000 to $14,999 | 124 | 3.1% |
| $15,000 to $24,999 | 454 | 11.3% |
| $25,000 to $34,999 | 241 | 6.0% |
| $35,000 to $49,999 | 526 | 13.1% |
| $50,000 to $74,999 | 727 | 18.1% |
| $75,000 to $99,999 | 478 | 11.9% |
| $100,000 to $149,999 | 799 | 19.9% |
| $150,000 to $199,999 | 317 | 7.9% |
| $200,000+ | 128 | 3.2% |
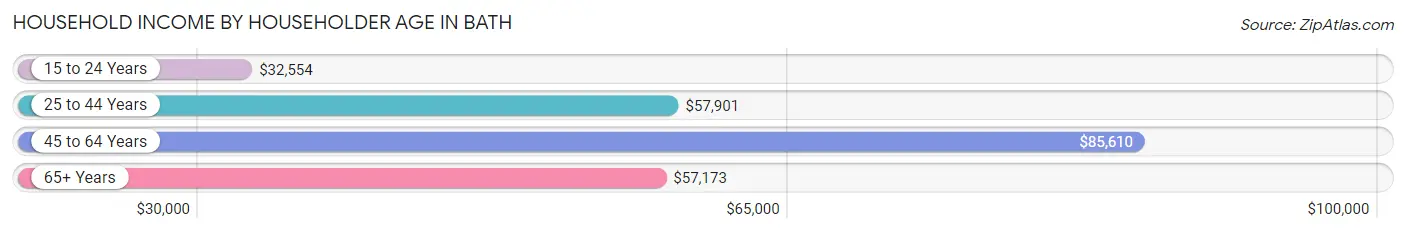
Household Income by Householder Age in Bath
The median household income in Bath is $63,023, with the highest median household income of $85,610 found in the 45 to 64 years age bracket for the primary householder. A total of 1,287 households (32.1%) fall into this category. Meanwhile, the 15 to 24 years age bracket for the primary householder has the lowest median household income of $32,554, with 247 households (6.1%) in this group.
| Income Bracket | # Households | Median Income |
| 15 to 24 Years | 247 (6.1%) | $32,554 |
| 25 to 44 Years | 1,187 (29.6%) | $57,901 |
| 45 to 64 Years | 1,287 (32.1%) | $85,610 |
| 65+ Years | 1,293 (32.2%) | $57,173 |
| Total | 4,014 (100.0%) | $63,023 |
Poverty in Bath
Income Below Poverty by Sex and Age in Bath
With 14.7% poverty level for males and 13.2% for females among the residents of Bath, 6 to 11 year old males and 25 to 34 year old females are the most vulnerable to poverty, with 164 males (41.6%) and 212 females (35.6%) in their respective age groups living below the poverty level.
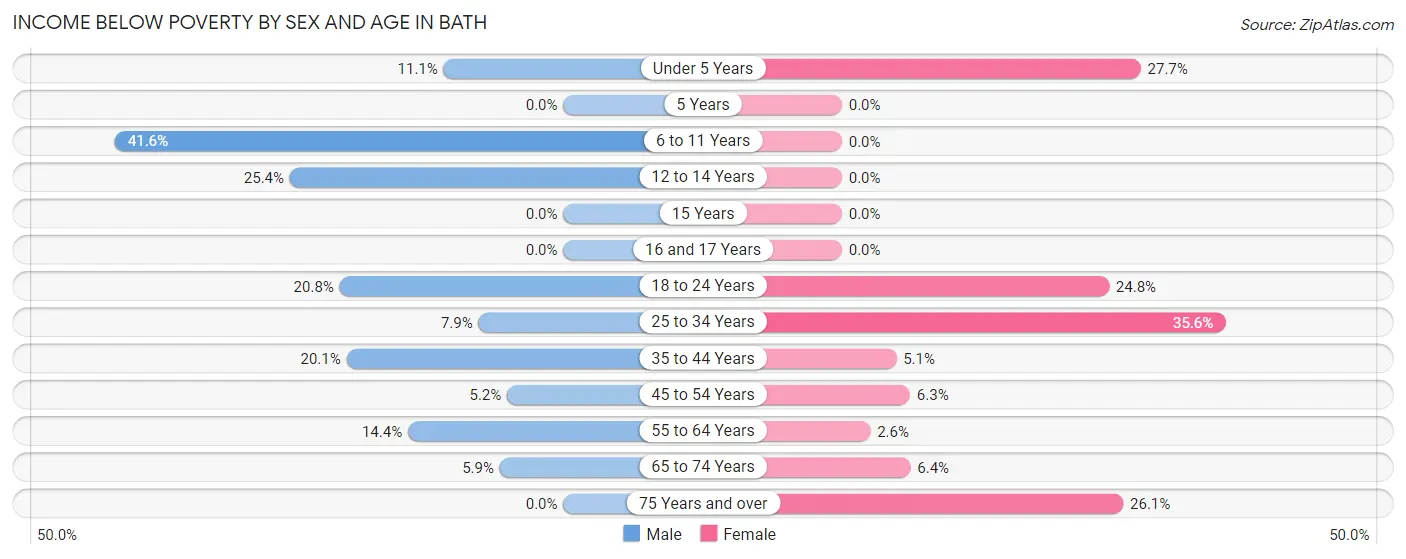
| Age Bracket | Male | Female |
| Under 5 Years | 23 (11.1%) | 33 (27.7%) |
| 5 Years | 0 (0.0%) | 0 (0.0%) |
| 6 to 11 Years | 164 (41.6%) | 0 (0.0%) |
| 12 to 14 Years | 83 (25.4%) | 0 (0.0%) |
| 15 Years | 0 (0.0%) | 0 (0.0%) |
| 16 and 17 Years | 0 (0.0%) | 0 (0.0%) |
| 18 to 24 Years | 87 (20.8%) | 88 (24.8%) |
| 25 to 34 Years | 40 (7.9%) | 212 (35.6%) |
| 35 to 44 Years | 101 (20.1%) | 25 (5.1%) |
| 45 to 54 Years | 28 (5.2%) | 37 (6.3%) |
| 55 to 64 Years | 74 (14.4%) | 16 (2.6%) |
| 65 to 74 Years | 33 (5.9%) | 43 (6.4%) |
| 75 Years and over | 0 (0.0%) | 123 (26.1%) |
| Total | 633 (14.7%) | 577 (13.2%) |
Income Above Poverty by Sex and Age in Bath
According to the poverty statistics in Bath, males aged 5 years and females aged 5 years are the age groups that are most secure financially, with 100.0% of males and 100.0% of females in these age groups living above the poverty line.
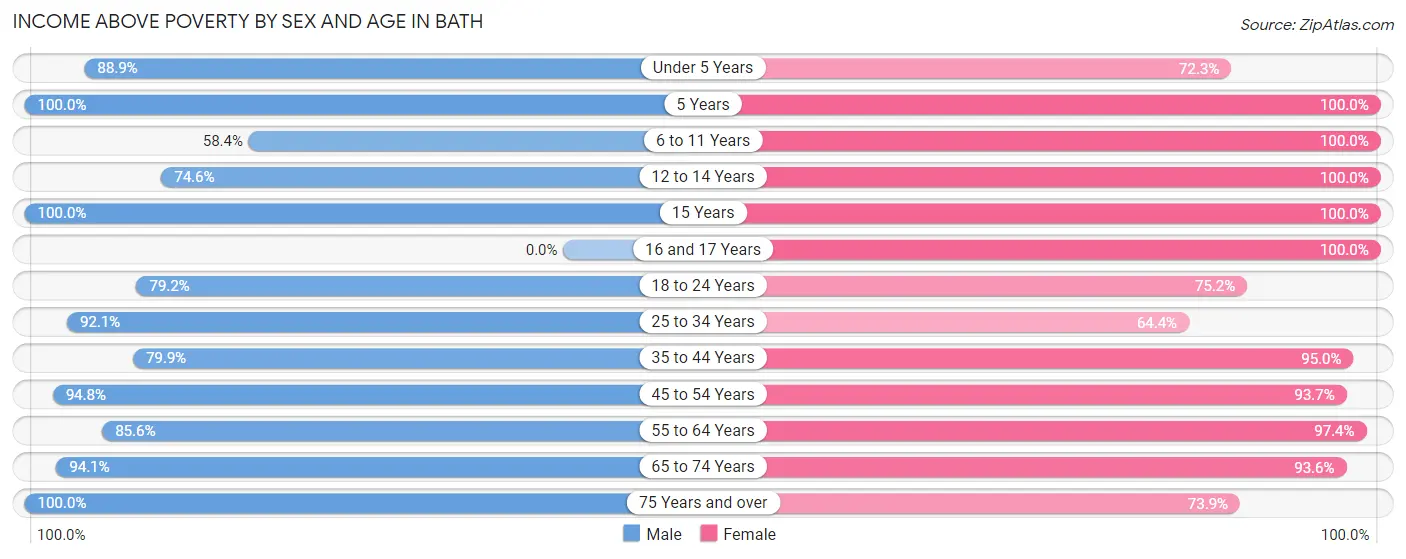
| Age Bracket | Male | Female |
| Under 5 Years | 184 (88.9%) | 86 (72.3%) |
| 5 Years | 41 (100.0%) | 14 (100.0%) |
| 6 to 11 Years | 230 (58.4%) | 165 (100.0%) |
| 12 to 14 Years | 244 (74.6%) | 198 (100.0%) |
| 15 Years | 50 (100.0%) | 9 (100.0%) |
| 16 and 17 Years | 0 (0.0%) | 92 (100.0%) |
| 18 to 24 Years | 332 (79.2%) | 267 (75.2%) |
| 25 to 34 Years | 468 (92.1%) | 384 (64.4%) |
| 35 to 44 Years | 401 (79.9%) | 470 (95.0%) |
| 45 to 54 Years | 508 (94.8%) | 548 (93.7%) |
| 55 to 64 Years | 439 (85.6%) | 589 (97.4%) |
| 65 to 74 Years | 526 (94.1%) | 633 (93.6%) |
| 75 Years and over | 243 (100.0%) | 348 (73.9%) |
| Total | 3,666 (85.3%) | 3,803 (86.8%) |
Income Below Poverty Among Married-Couple Families in Bath
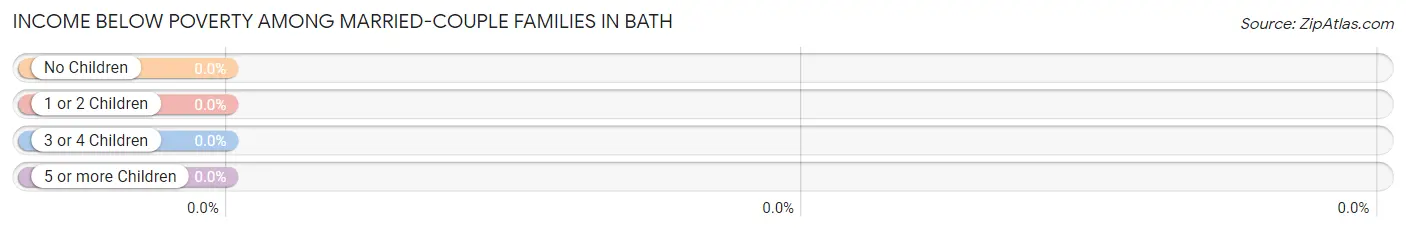
| Children | Above Poverty | Below Poverty |
| No Children | 1,151 (100.0%) | 0 (0.0%) |
| 1 or 2 Children | 459 (100.0%) | 0 (0.0%) |
| 3 or 4 Children | 79 (100.0%) | 0 (0.0%) |
| 5 or more Children | 0 (0.0%) | 0 (0.0%) |
| Total | 1,689 (100.0%) | 0 (0.0%) |
Income Below Poverty Among Single-Parent Households in Bath
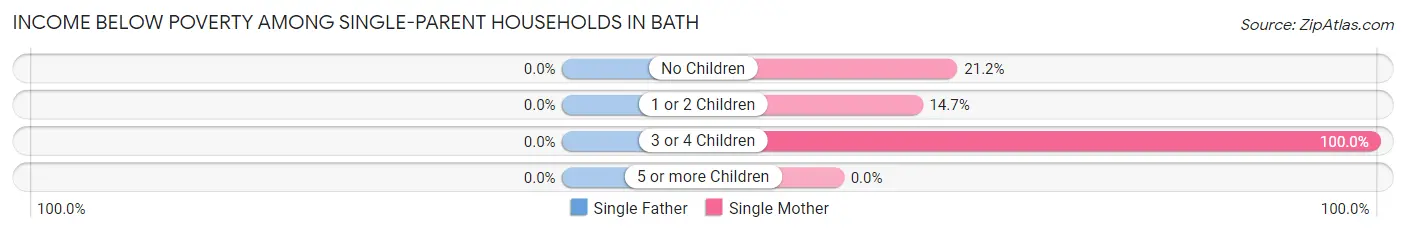
| Children | Single Father | Single Mother |
| No Children | 0 (0.0%) | 36 (21.2%) |
| 1 or 2 Children | 0 (0.0%) | 32 (14.7%) |
| 3 or 4 Children | 0 (0.0%) | 126 (100.0%) |
| 5 or more Children | 0 (0.0%) | 0 (0.0%) |
| Total | 0 (0.0%) | 194 (37.7%) |
Income Below Poverty Among Married-Couple vs Single-Parent Households in Bath
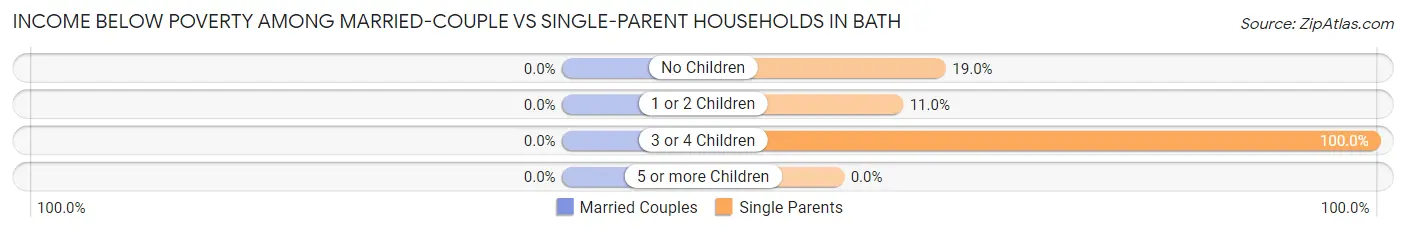
| Children | Married-Couple Families | Single-Parent Households |
| No Children | 0 (0.0%) | 36 (19.0%) |
| 1 or 2 Children | 0 (0.0%) | 32 (11.0%) |
| 3 or 4 Children | 0 (0.0%) | 126 (100.0%) |
| 5 or more Children | 0 (0.0%) | 0 (0.0%) |
| Total | 0 (0.0%) | 194 (32.0%) |
Race in Bath
The most populous races in Bath are White / Caucasian (8,408 | 95.8%), Two or more Races (284 | 3.2%), and Hispanic or Latino (61 | 0.7%).
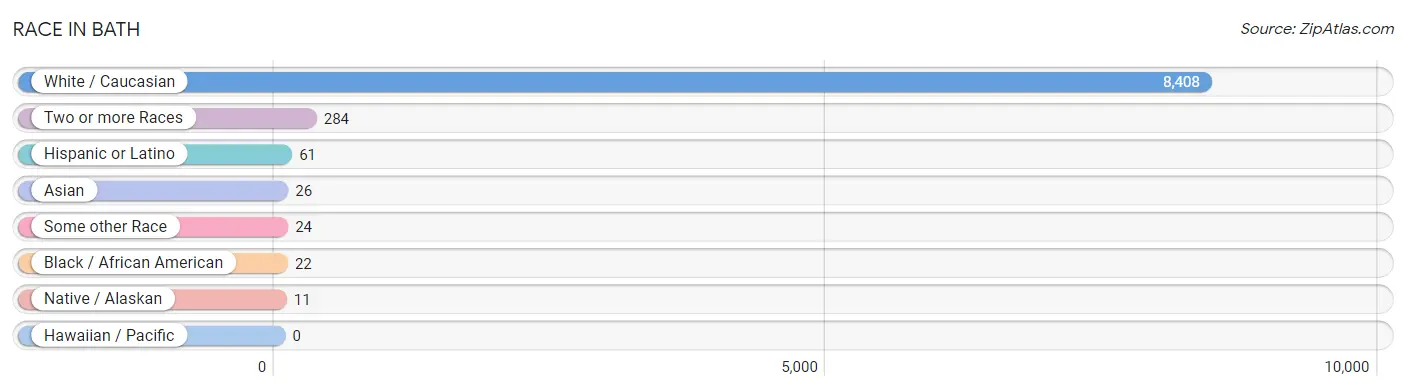
| Race | # Population | % Population |
| Asian | 26 | 0.3% |
| Black / African American | 22 | 0.3% |
| Hawaiian / Pacific | 0 | 0.0% |
| Hispanic or Latino | 61 | 0.7% |
| Native / Alaskan | 11 | 0.1% |
| White / Caucasian | 8,408 | 95.8% |
| Two or more Races | 284 | 3.2% |
| Some other Race | 24 | 0.3% |
| Total | 8,775 | 100.0% |
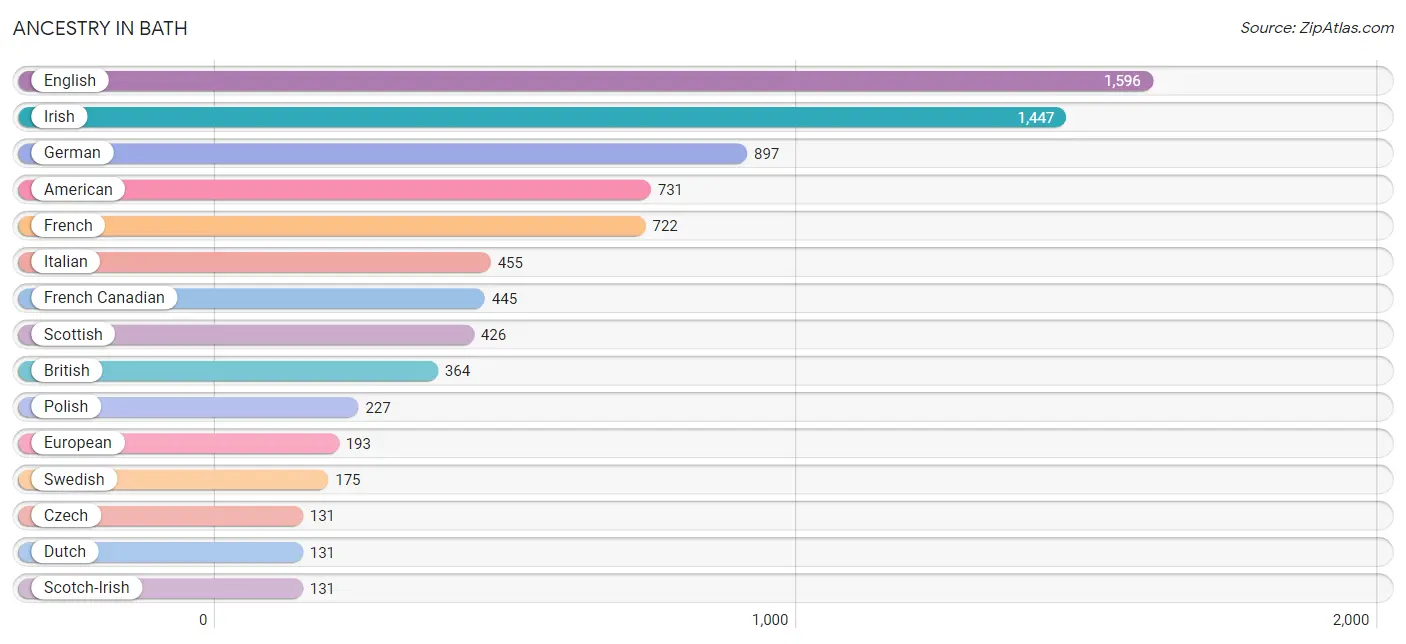
Ancestry in Bath
The most populous ancestries reported in Bath are English (1,596 | 18.2%), Irish (1,447 | 16.5%), German (897 | 10.2%), American (731 | 8.3%), and French (722 | 8.2%), together accounting for 61.5% of all Bath residents.
| Ancestry | # Population | % Population |
| American | 731 | 8.3% |
| Armenian | 15 | 0.2% |
| Belgian | 11 | 0.1% |
| Bhutanese | 40 | 0.5% |
| British | 364 | 4.2% |
| Canadian | 107 | 1.2% |
| Cuban | 40 | 0.5% |
| Czech | 131 | 1.5% |
| Czechoslovakian | 59 | 0.7% |
| Danish | 87 | 1.0% |
| Dutch | 131 | 1.5% |
| Eastern European | 23 | 0.3% |
| English | 1,596 | 18.2% |
| European | 193 | 2.2% |
| Finnish | 121 | 1.4% |
| French | 722 | 8.2% |
| French Canadian | 445 | 5.1% |
| German | 897 | 10.2% |
| Greek | 51 | 0.6% |
| Haitian | 9 | 0.1% |
| Indian (Asian) | 39 | 0.4% |
| Irish | 1,447 | 16.5% |
| Italian | 455 | 5.2% |
| Korean | 49 | 0.6% |
| Lithuanian | 19 | 0.2% |
| Mexican | 21 | 0.2% |
| Northern European | 22 | 0.3% |
| Norwegian | 38 | 0.4% |
| Polish | 227 | 2.6% |
| Portuguese | 52 | 0.6% |
| Scandinavian | 25 | 0.3% |
| Scotch-Irish | 131 | 1.5% |
| Scottish | 426 | 4.9% |
| Slovak | 13 | 0.2% |
| Slovene | 12 | 0.1% |
| Swedish | 175 | 2.0% |
| Ukrainian | 69 | 0.8% |
| Welsh | 85 | 1.0% | View All 38 Rows |
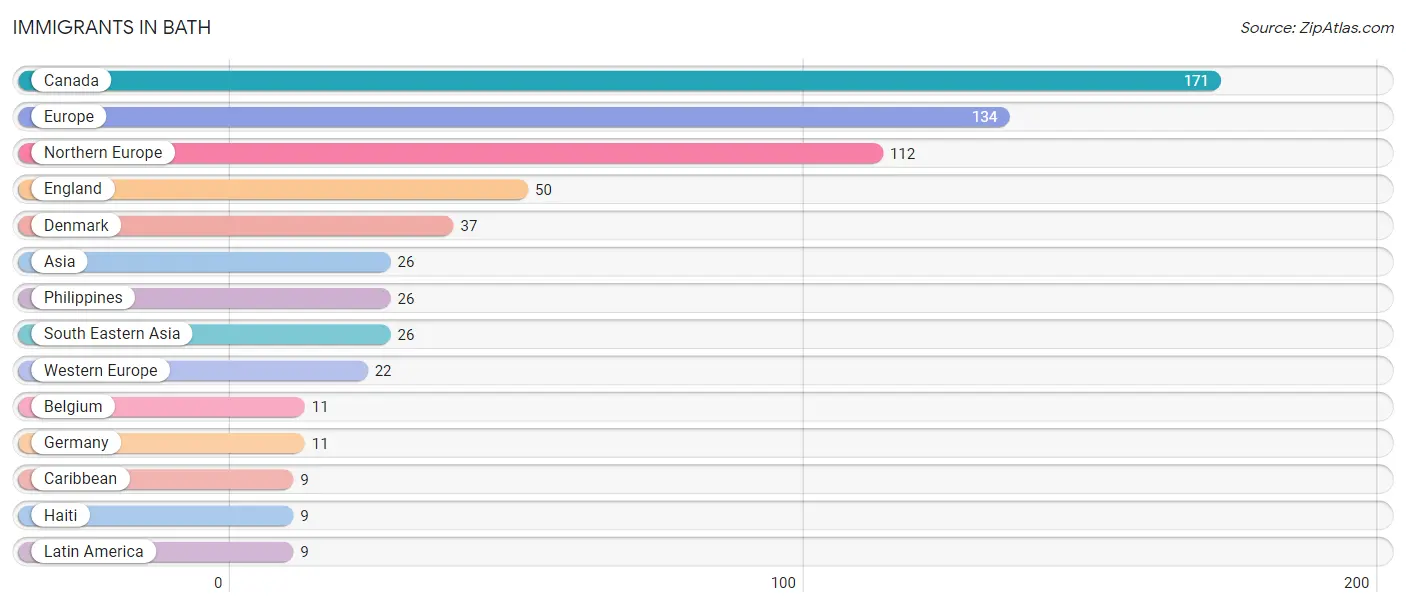
Immigrants in Bath
The most numerous immigrant groups reported in Bath came from Canada (171 | 1.9%), Europe (134 | 1.5%), Northern Europe (112 | 1.3%), England (50 | 0.6%), and Denmark (37 | 0.4%), together accounting for 5.8% of all Bath residents.
| Immigration Origin | # Population | % Population |
| Asia | 26 | 0.3% |
| Belgium | 11 | 0.1% |
| Canada | 171 | 1.9% |
| Caribbean | 9 | 0.1% |
| Denmark | 37 | 0.4% |
| England | 50 | 0.6% |
| Europe | 134 | 1.5% |
| Germany | 11 | 0.1% |
| Haiti | 9 | 0.1% |
| Latin America | 9 | 0.1% |
| Northern Europe | 112 | 1.3% |
| Philippines | 26 | 0.3% |
| South Eastern Asia | 26 | 0.3% |
| Western Europe | 22 | 0.3% | View All 14 Rows |
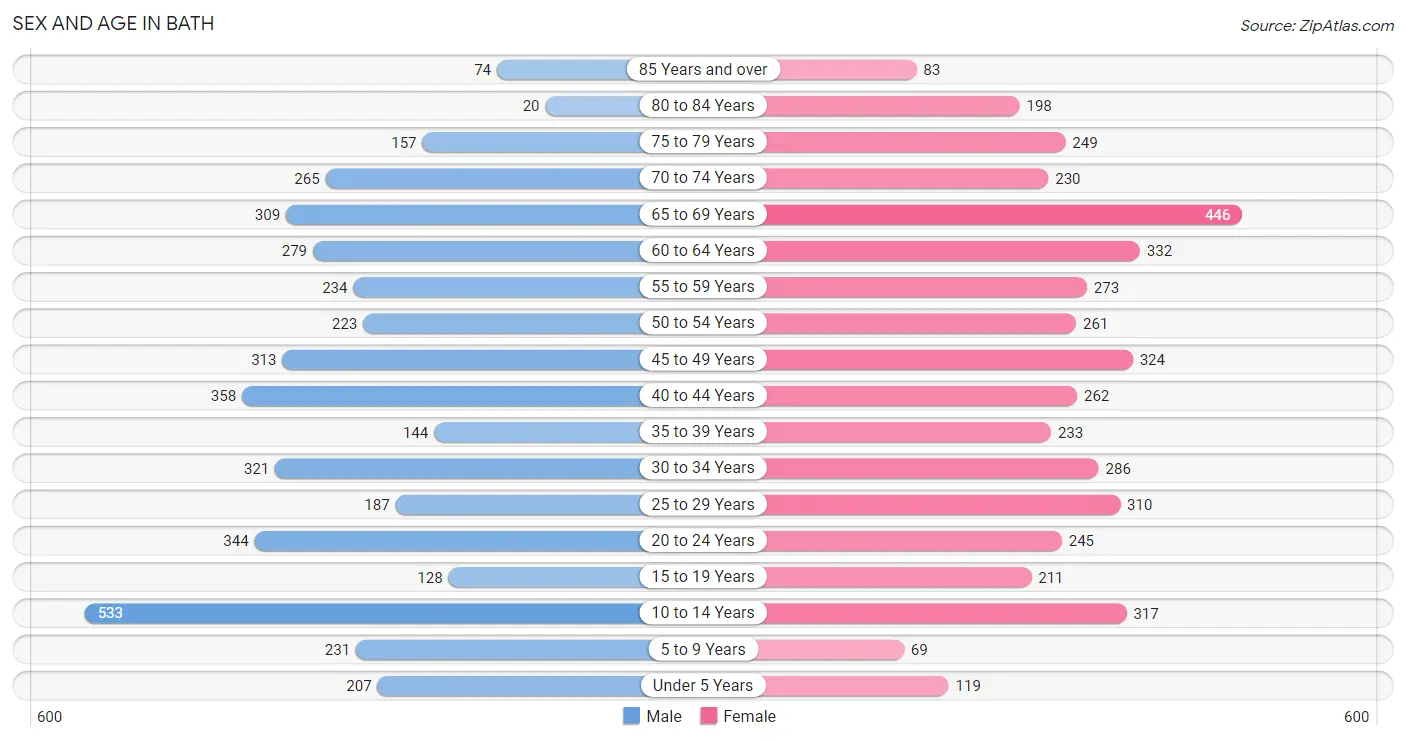
Sex and Age in Bath
Sex and Age in Bath
The most populous age groups in Bath are 10 to 14 Years (533 | 12.3%) for men and 65 to 69 Years (446 | 10.0%) for women.
| Age Bracket | Male | Female |
| Under 5 Years | 207 (4.8%) | 119 (2.7%) |
| 5 to 9 Years | 231 (5.3%) | 69 (1.5%) |
| 10 to 14 Years | 533 (12.3%) | 317 (7.1%) |
| 15 to 19 Years | 128 (3.0%) | 211 (4.7%) |
| 20 to 24 Years | 344 (8.0%) | 245 (5.5%) |
| 25 to 29 Years | 187 (4.3%) | 310 (7.0%) |
| 30 to 34 Years | 321 (7.4%) | 286 (6.4%) |
| 35 to 39 Years | 144 (3.3%) | 233 (5.2%) |
| 40 to 44 Years | 358 (8.3%) | 262 (5.9%) |
| 45 to 49 Years | 313 (7.2%) | 324 (7.3%) |
| 50 to 54 Years | 223 (5.1%) | 261 (5.9%) |
| 55 to 59 Years | 234 (5.4%) | 273 (6.1%) |
| 60 to 64 Years | 279 (6.5%) | 332 (7.5%) |
| 65 to 69 Years | 309 (7.1%) | 446 (10.0%) |
| 70 to 74 Years | 265 (6.1%) | 230 (5.2%) |
| 75 to 79 Years | 157 (3.6%) | 249 (5.6%) |
| 80 to 84 Years | 20 (0.5%) | 198 (4.4%) |
| 85 Years and over | 74 (1.7%) | 83 (1.9%) |
| Total | 4,327 (100.0%) | 4,448 (100.0%) |
Families and Households in Bath
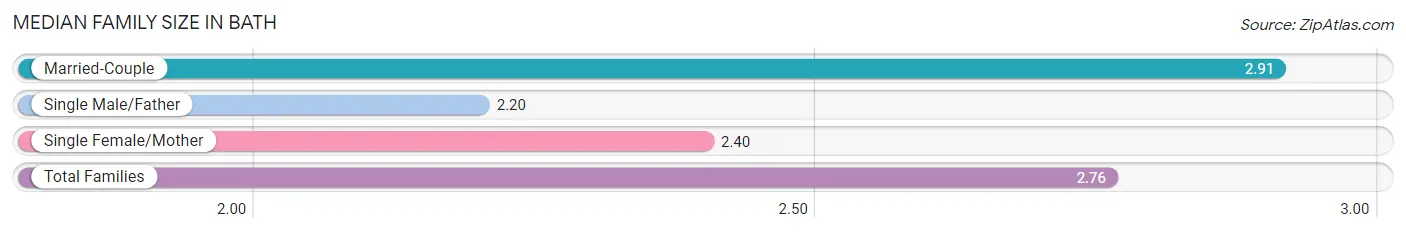
Median Family Size in Bath
The median family size in Bath is 2.76 persons per family, with married-couple families (1,689 | 73.6%) accounting for the largest median family size of 2.91 persons per family. On the other hand, single male/father families (93 | 4.1%) represent the smallest median family size with 2.20 persons per family.
| Family Type | # Families | Family Size |
| Married-Couple | 1,689 (73.6%) | 2.91 |
| Single Male/Father | 93 (4.1%) | 2.20 |
| Single Female/Mother | 514 (22.4%) | 2.40 |
| Total Families | 2,296 (100.0%) | 2.76 |
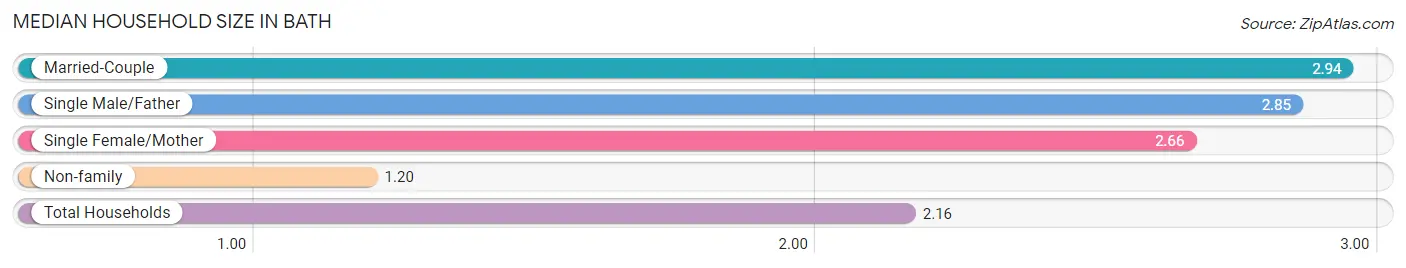
Median Household Size in Bath
The median household size in Bath is 2.16 persons per household, with married-couple households (1,689 | 42.1%) accounting for the largest median household size of 2.94 persons per household. non-family households (1,718 | 42.8%) represent the smallest median household size with 1.20 persons per household.
| Household Type | # Households | Household Size |
| Married-Couple | 1,689 (42.1%) | 2.94 |
| Single Male/Father | 93 (2.3%) | 2.85 |
| Single Female/Mother | 514 (12.8%) | 2.66 |
| Non-family | 1,718 (42.8%) | 1.20 |
| Total Households | 4,014 (100.0%) | 2.16 |
Household Size by Marriage Status in Bath
Out of a total of 4,014 households in Bath, 2,296 (57.2%) are family households, while 1,718 (42.8%) are nonfamily households. The most numerous type of family households are 2-person households, comprising 1,278, and the most common type of nonfamily households are 1-person households, comprising 1,364.
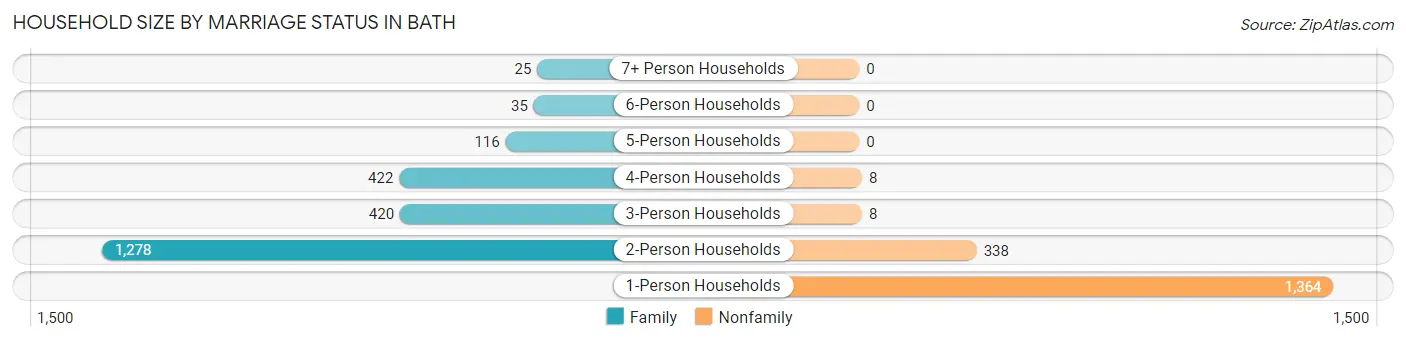
| Household Size | Family Households | Nonfamily Households |
| 1-Person Households | - | 1,364 (34.0%) |
| 2-Person Households | 1,278 (31.8%) | 338 (8.4%) |
| 3-Person Households | 420 (10.5%) | 8 (0.2%) |
| 4-Person Households | 422 (10.5%) | 8 (0.2%) |
| 5-Person Households | 116 (2.9%) | 0 (0.0%) |
| 6-Person Households | 35 (0.9%) | 0 (0.0%) |
| 7+ Person Households | 25 (0.6%) | 0 (0.0%) |
| Total | 2,296 (57.2%) | 1,718 (42.8%) |
Female Fertility in Bath
Fertility by Age in Bath
Average fertility rate in Bath is 51.0 births per 1,000 women. Women in the age bracket of 20 to 34 years have the highest fertility rate with 103.0 births per 1,000 women. Women in the age bracket of 20 to 34 years acount for 89.7% of all women with births.
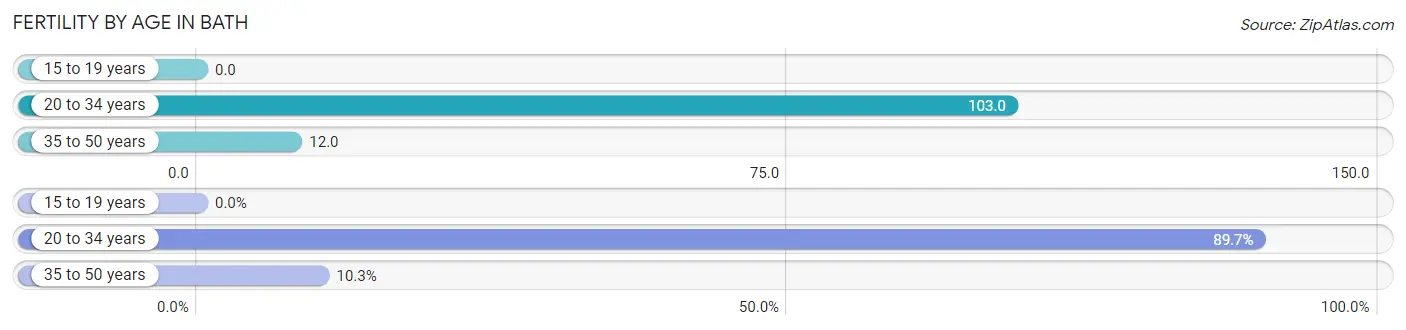
| Age Bracket | Women with Births | Births / 1,000 Women |
| 15 to 19 years | 0 (0.0%) | 0.0 |
| 20 to 34 years | 87 (89.7%) | 103.0 |
| 35 to 50 years | 10 (10.3%) | 12.0 |
| Total | 97 (100.0%) | 51.0 |
Fertility by Age by Marriage Status in Bath
33.0% of women with births (97) in Bath are married. The highest percentage of unmarried women with births falls into 35 to 50 years age bracket with 100.0% of them unmarried at the time of birth, while the lowest percentage of unmarried women with births belong to 20 to 34 years age bracket with 63.2% of them unmarried.
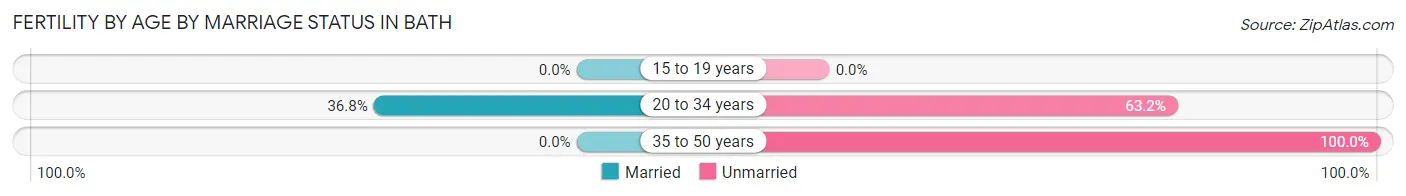
| Age Bracket | Married | Unmarried |
| 15 to 19 years | 0 (0.0%) | 0 (0.0%) |
| 20 to 34 years | 32 (36.8%) | 55 (63.2%) |
| 35 to 50 years | 0 (0.0%) | 10 (100.0%) |
| Total | 32 (33.0%) | 65 (67.0%) |
Fertility by Education in Bath
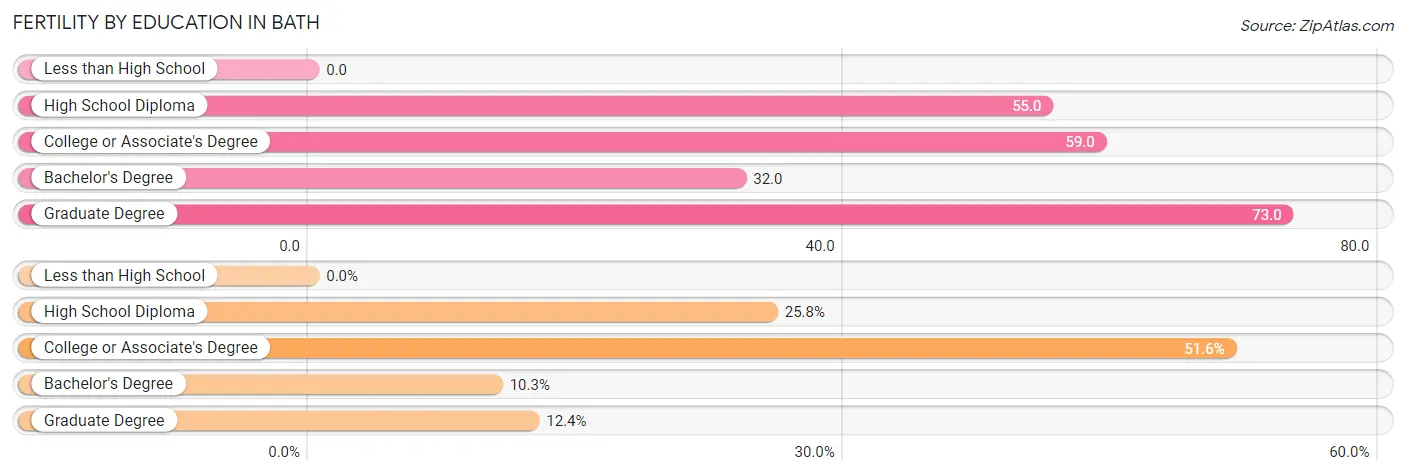
| Educational Attainment | Women with Births | Births / 1,000 Women |
| Less than High School | 0 (0.0%) | 0.0 |
| High School Diploma | 25 (25.8%) | 55.0 |
| College or Associate's Degree | 50 (51.5%) | 59.0 |
| Bachelor's Degree | 10 (10.3%) | 32.0 |
| Graduate Degree | 12 (12.4%) | 73.0 |
| Total | 97 (100.0%) | 51.0 |
Fertility by Education by Marriage Status in Bath
67.0% of women with births in Bath are unmarried. Women with the educational attainment of graduate degree are most likely to be married with 100.0% of them married at childbirth, while women with the educational attainment of high school diploma are least likely to be married with 100.0% of them unmarried at childbirth.
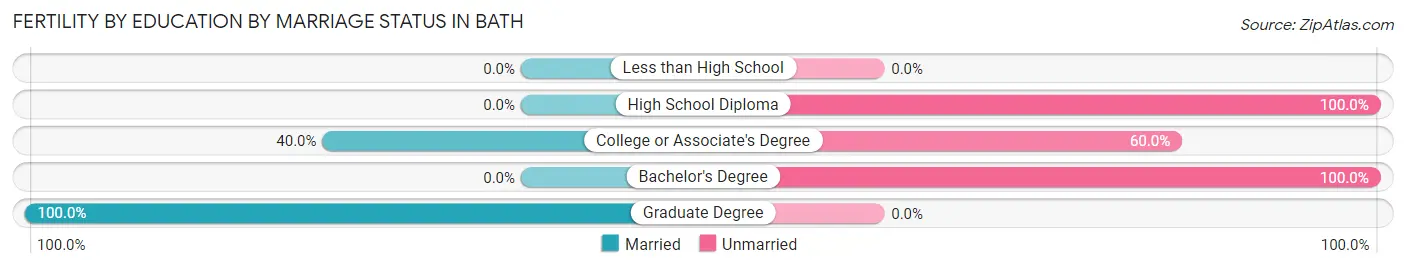
| Educational Attainment | Married | Unmarried |
| Less than High School | 0 (0.0%) | 0 (0.0%) |
| High School Diploma | 0 (0.0%) | 25 (100.0%) |
| College or Associate's Degree | 20 (40.0%) | 30 (60.0%) |
| Bachelor's Degree | 0 (0.0%) | 10 (100.0%) |
| Graduate Degree | 12 (100.0%) | 0 (0.0%) |
| Total | 32 (33.0%) | 65 (67.0%) |
Employment Characteristics in Bath
Employment by Class of Employer in Bath
Among the 4,259 employed individuals in Bath, private company employees (2,510 | 58.9%), self-employed (not incorporated) (482 | 11.3%), and self-employed (incorporated) (428 | 10.1%) make up the most common classes of employment.
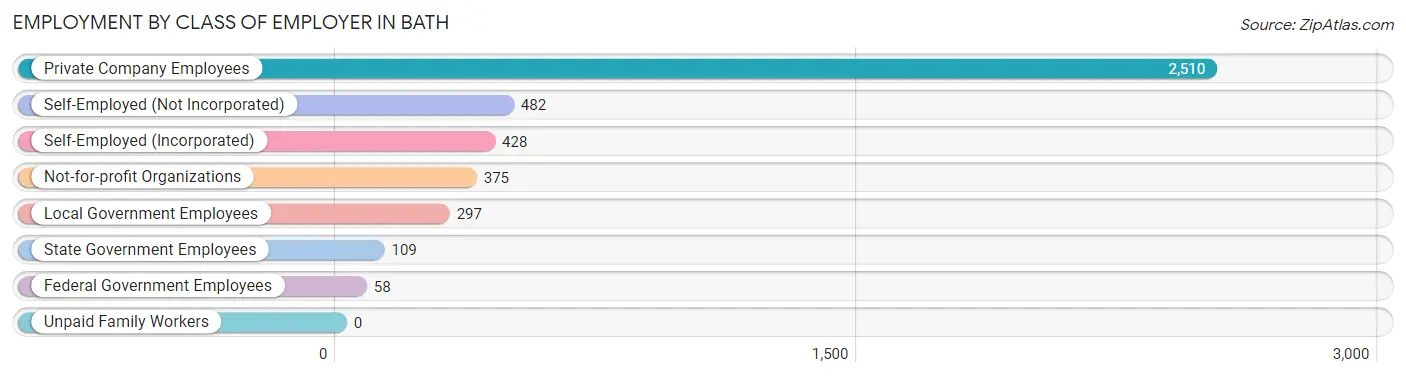
| Employer Class | # Employees | % Employees |
| Private Company Employees | 2,510 | 58.9% |
| Self-Employed (Incorporated) | 428 | 10.1% |
| Self-Employed (Not Incorporated) | 482 | 11.3% |
| Not-for-profit Organizations | 375 | 8.8% |
| Local Government Employees | 297 | 7.0% |
| State Government Employees | 109 | 2.6% |
| Federal Government Employees | 58 | 1.4% |
| Unpaid Family Workers | 0 | 0.0% |
| Total | 4,259 | 100.0% |
Employment Status by Age in Bath
According to the labor force statistics for Bath, out of the total population over 16 years of age (7,240), 63.2% or 4,576 individuals are in the labor force, with 5.2% or 238 of them unemployed. The age group with the highest labor force participation rate is 55 to 59 years, with 90.5% or 459 individuals in the labor force. Within the labor force, the 16 to 19 years age range has the highest percentage of unemployed individuals, with 29.1% or 57 of them being unemployed.
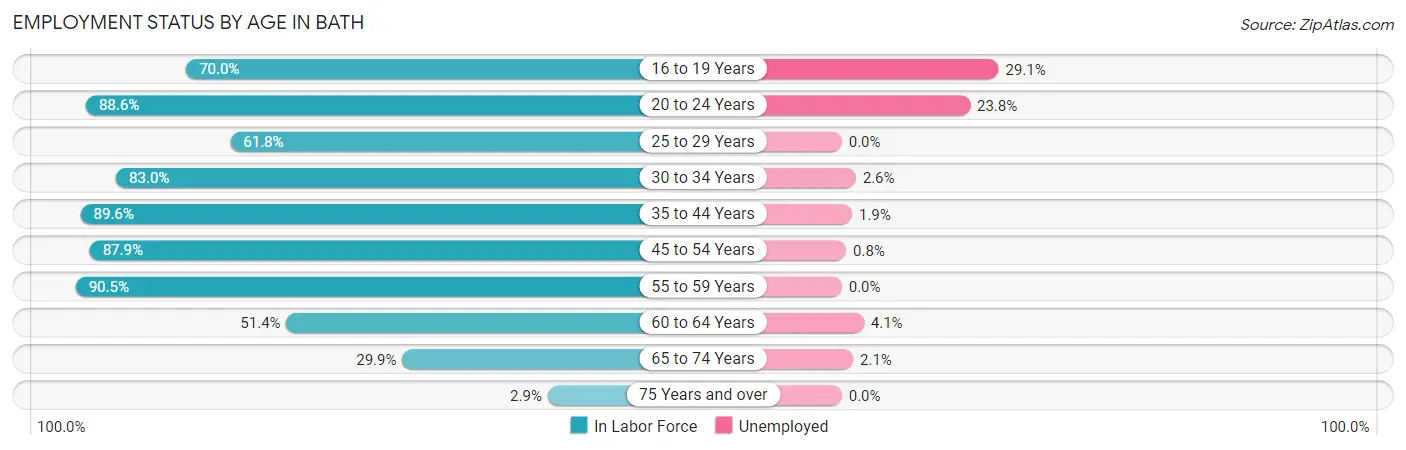
| Age Bracket | In Labor Force | Unemployed |
| 16 to 19 Years | 196 (70.0%) | 57 (29.1%) |
| 20 to 24 Years | 522 (88.6%) | 124 (23.8%) |
| 25 to 29 Years | 307 (61.8%) | 0 (0.0%) |
| 30 to 34 Years | 504 (83.0%) | 13 (2.6%) |
| 35 to 44 Years | 893 (89.6%) | 17 (1.9%) |
| 45 to 54 Years | 985 (87.9%) | 8 (0.8%) |
| 55 to 59 Years | 459 (90.5%) | 0 (0.0%) |
| 60 to 64 Years | 314 (51.4%) | 13 (4.1%) |
| 65 to 74 Years | 374 (29.9%) | 8 (2.1%) |
| 75 Years and over | 23 (2.9%) | 0 (0.0%) |
| Total | 4,576 (63.2%) | 238 (5.2%) |
Employment Status by Educational Attainment in Bath
According to labor force statistics for Bath, 79.8% of individuals (3,463) out of the total population between 25 and 64 years of age (4,340) are in the labor force, with 1.5% or 52 of them being unemployed. The group with the highest labor force participation rate are those with the educational attainment of bachelor's degree or higher, with 92.0% or 1,323 individuals in the labor force. Within the labor force, individuals with less than high school education have the highest percentage of unemployment, with 5.6% or 8 of them being unemployed.
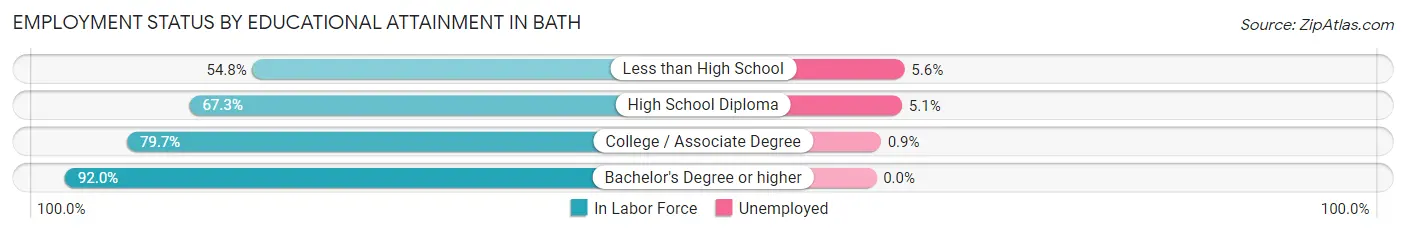
| Educational Attainment | In Labor Force | Unemployed |
| Less than High School | 144 (54.8%) | 15 (5.6%) |
| High School Diploma | 593 (67.3%) | 45 (5.1%) |
| College / Associate Degree | 1,401 (79.7%) | 16 (0.9%) |
| Bachelor's Degree or higher | 1,323 (92.0%) | 0 (0.0%) |
| Total | 3,463 (79.8%) | 65 (1.5%) |
Employment Occupations by Sex in Bath
Management, Business, Science and Arts Occupations
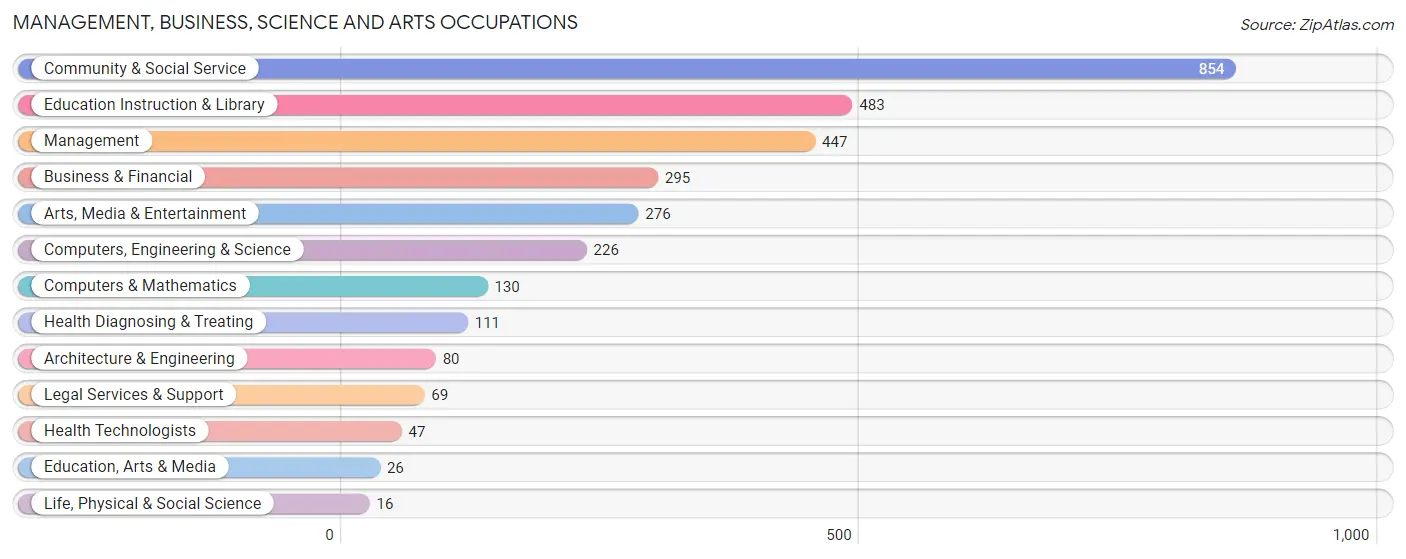
The most common Management, Business, Science and Arts occupations in Bath are Community & Social Service (854 | 19.7%), Education Instruction & Library (483 | 11.1%), Management (447 | 10.3%), Business & Financial (295 | 6.8%), and Arts, Media & Entertainment (276 | 6.4%).
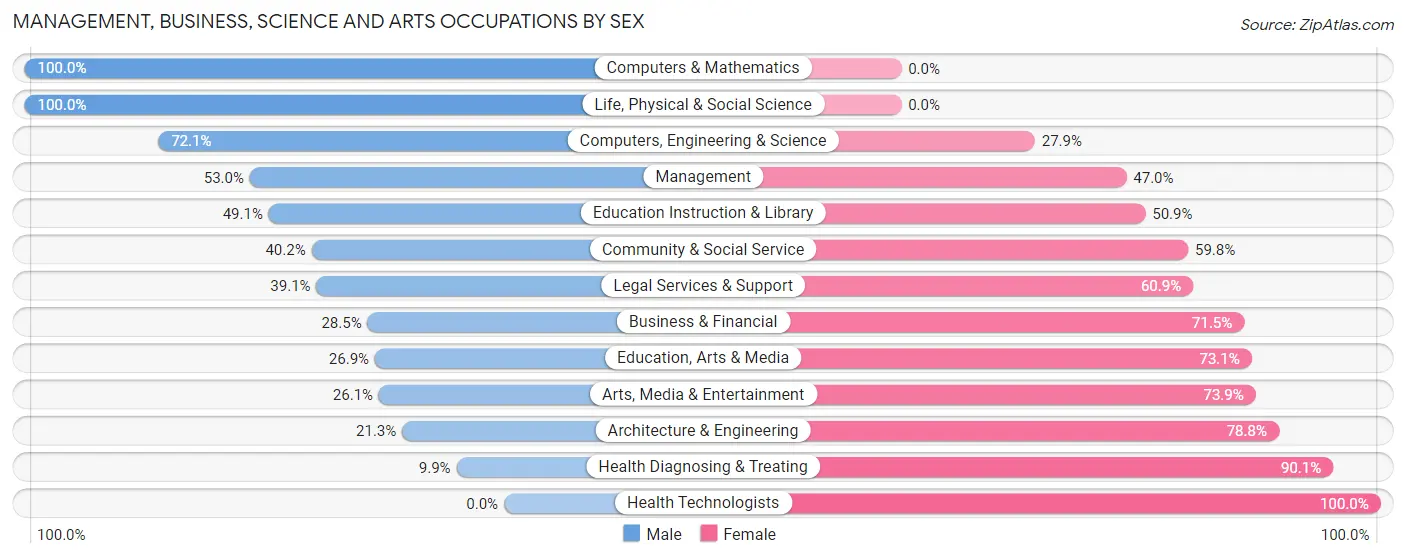
Management, Business, Science and Arts Occupations by Sex
Within the Management, Business, Science and Arts occupations in Bath, the most male-oriented occupations are Computers & Mathematics (100.0%), Life, Physical & Social Science (100.0%), and Computers, Engineering & Science (72.1%), while the most female-oriented occupations are Health Technologists (100.0%), Health Diagnosing & Treating (90.1%), and Architecture & Engineering (78.7%).
| Occupation | Male | Female |
| Management | 237 (53.0%) | 210 (47.0%) |
| Business & Financial | 84 (28.5%) | 211 (71.5%) |
| Computers, Engineering & Science | 163 (72.1%) | 63 (27.9%) |
| Computers & Mathematics | 130 (100.0%) | 0 (0.0%) |
| Architecture & Engineering | 17 (21.2%) | 63 (78.7%) |
| Life, Physical & Social Science | 16 (100.0%) | 0 (0.0%) |
| Community & Social Service | 343 (40.2%) | 511 (59.8%) |
| Education, Arts & Media | 7 (26.9%) | 19 (73.1%) |
| Legal Services & Support | 27 (39.1%) | 42 (60.9%) |
| Education Instruction & Library | 237 (49.1%) | 246 (50.9%) |
| Arts, Media & Entertainment | 72 (26.1%) | 204 (73.9%) |
| Health Diagnosing & Treating | 11 (9.9%) | 100 (90.1%) |
| Health Technologists | 0 (0.0%) | 47 (100.0%) |
| Total (Category) | 838 (43.3%) | 1,095 (56.7%) |
| Total (Overall) | 2,106 (48.6%) | 2,231 (51.4%) |
Services Occupations
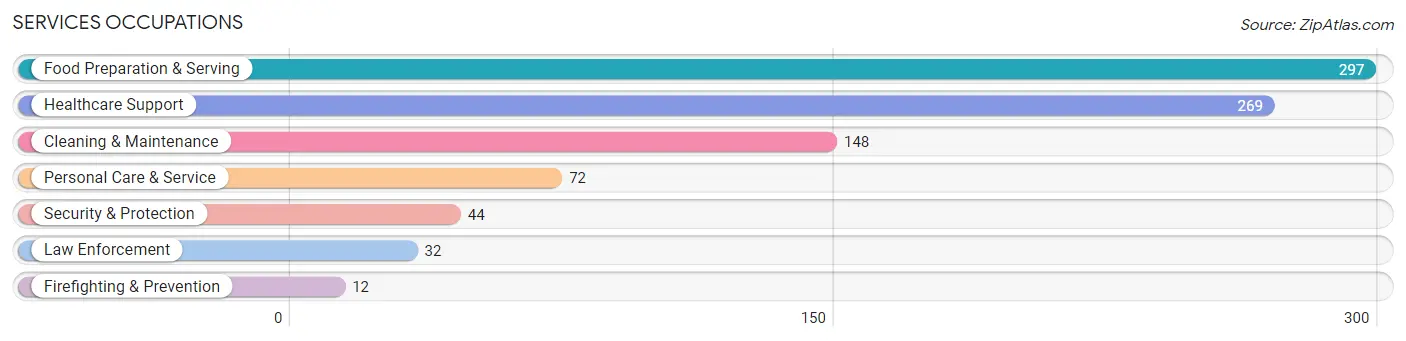
The most common Services occupations in Bath are Food Preparation & Serving (297 | 6.9%), Healthcare Support (269 | 6.2%), Cleaning & Maintenance (148 | 3.4%), Personal Care & Service (72 | 1.7%), and Security & Protection (44 | 1.0%).
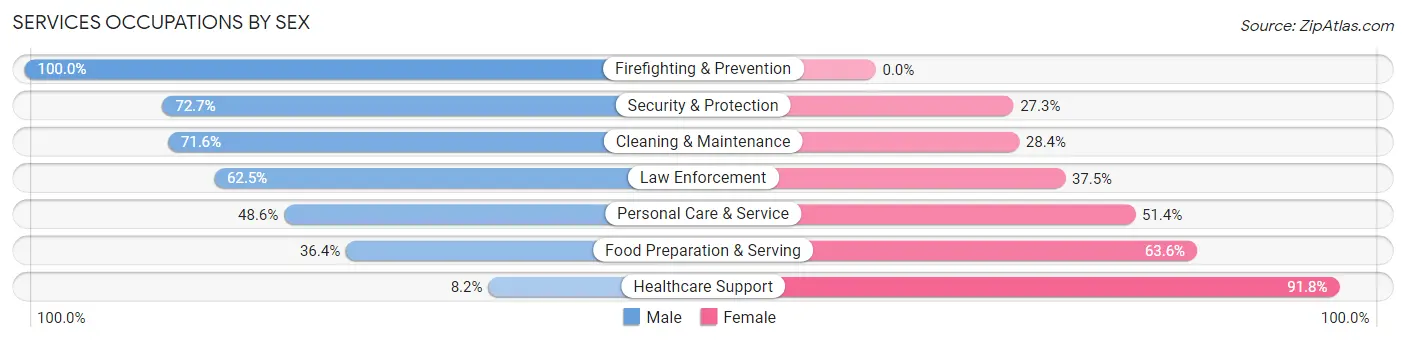
Services Occupations by Sex
Within the Services occupations in Bath, the most male-oriented occupations are Firefighting & Prevention (100.0%), Security & Protection (72.7%), and Cleaning & Maintenance (71.6%), while the most female-oriented occupations are Healthcare Support (91.8%), Food Preparation & Serving (63.6%), and Personal Care & Service (51.4%).
| Occupation | Male | Female |
| Healthcare Support | 22 (8.2%) | 247 (91.8%) |
| Security & Protection | 32 (72.7%) | 12 (27.3%) |
| Firefighting & Prevention | 12 (100.0%) | 0 (0.0%) |
| Law Enforcement | 20 (62.5%) | 12 (37.5%) |
| Food Preparation & Serving | 108 (36.4%) | 189 (63.6%) |
| Cleaning & Maintenance | 106 (71.6%) | 42 (28.4%) |
| Personal Care & Service | 35 (48.6%) | 37 (51.4%) |
| Total (Category) | 303 (36.5%) | 527 (63.5%) |
| Total (Overall) | 2,106 (48.6%) | 2,231 (51.4%) |
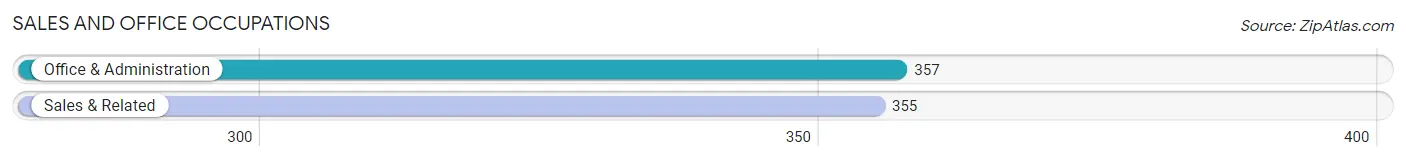
Sales and Office Occupations
The most common Sales and Office occupations in Bath are Office & Administration (357 | 8.2%), and Sales & Related (355 | 8.2%).
Sales and Office Occupations by Sex
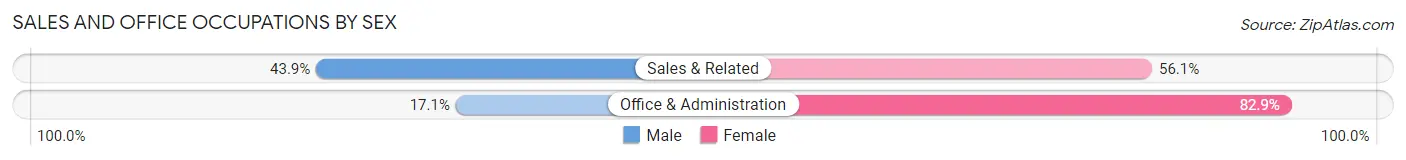
| Occupation | Male | Female |
| Sales & Related | 156 (43.9%) | 199 (56.1%) |
| Office & Administration | 61 (17.1%) | 296 (82.9%) |
| Total (Category) | 217 (30.5%) | 495 (69.5%) |
| Total (Overall) | 2,106 (48.6%) | 2,231 (51.4%) |
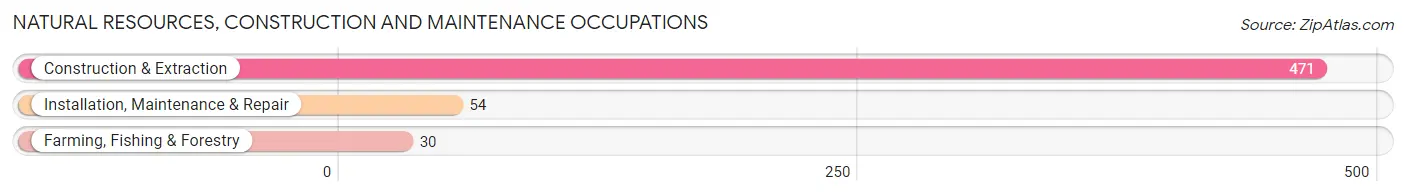
Natural Resources, Construction and Maintenance Occupations
The most common Natural Resources, Construction and Maintenance occupations in Bath are Construction & Extraction (471 | 10.9%), Installation, Maintenance & Repair (54 | 1.3%), and Farming, Fishing & Forestry (30 | 0.7%).
Natural Resources, Construction and Maintenance Occupations by Sex
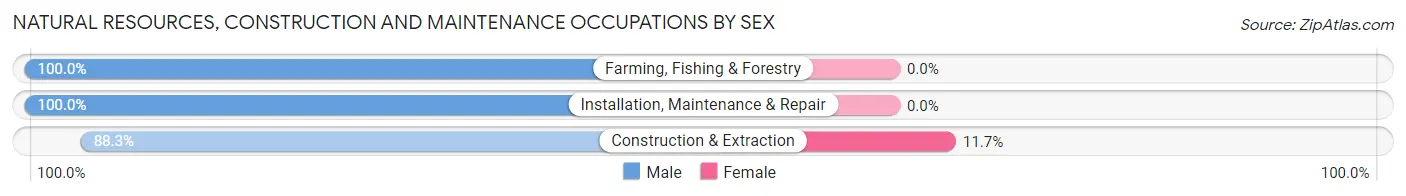
| Occupation | Male | Female |
| Farming, Fishing & Forestry | 30 (100.0%) | 0 (0.0%) |
| Construction & Extraction | 416 (88.3%) | 55 (11.7%) |
| Installation, Maintenance & Repair | 54 (100.0%) | 0 (0.0%) |
| Total (Category) | 500 (90.1%) | 55 (9.9%) |
| Total (Overall) | 2,106 (48.6%) | 2,231 (51.4%) |
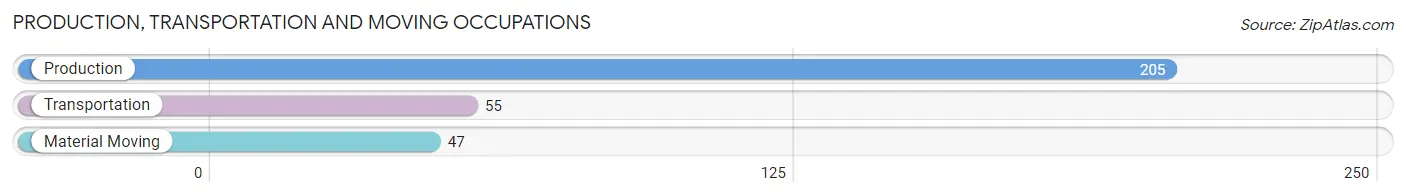
Production, Transportation and Moving Occupations
The most common Production, Transportation and Moving occupations in Bath are Production (205 | 4.7%), Transportation (55 | 1.3%), and Material Moving (47 | 1.1%).
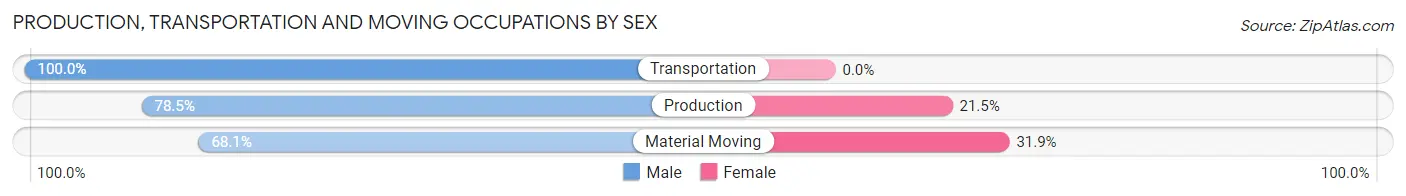
Production, Transportation and Moving Occupations by Sex
| Occupation | Male | Female |
| Production | 161 (78.5%) | 44 (21.5%) |
| Transportation | 55 (100.0%) | 0 (0.0%) |
| Material Moving | 32 (68.1%) | 15 (31.9%) |
| Total (Category) | 248 (80.8%) | 59 (19.2%) |
| Total (Overall) | 2,106 (48.6%) | 2,231 (51.4%) |
Employment Industries by Sex in Bath
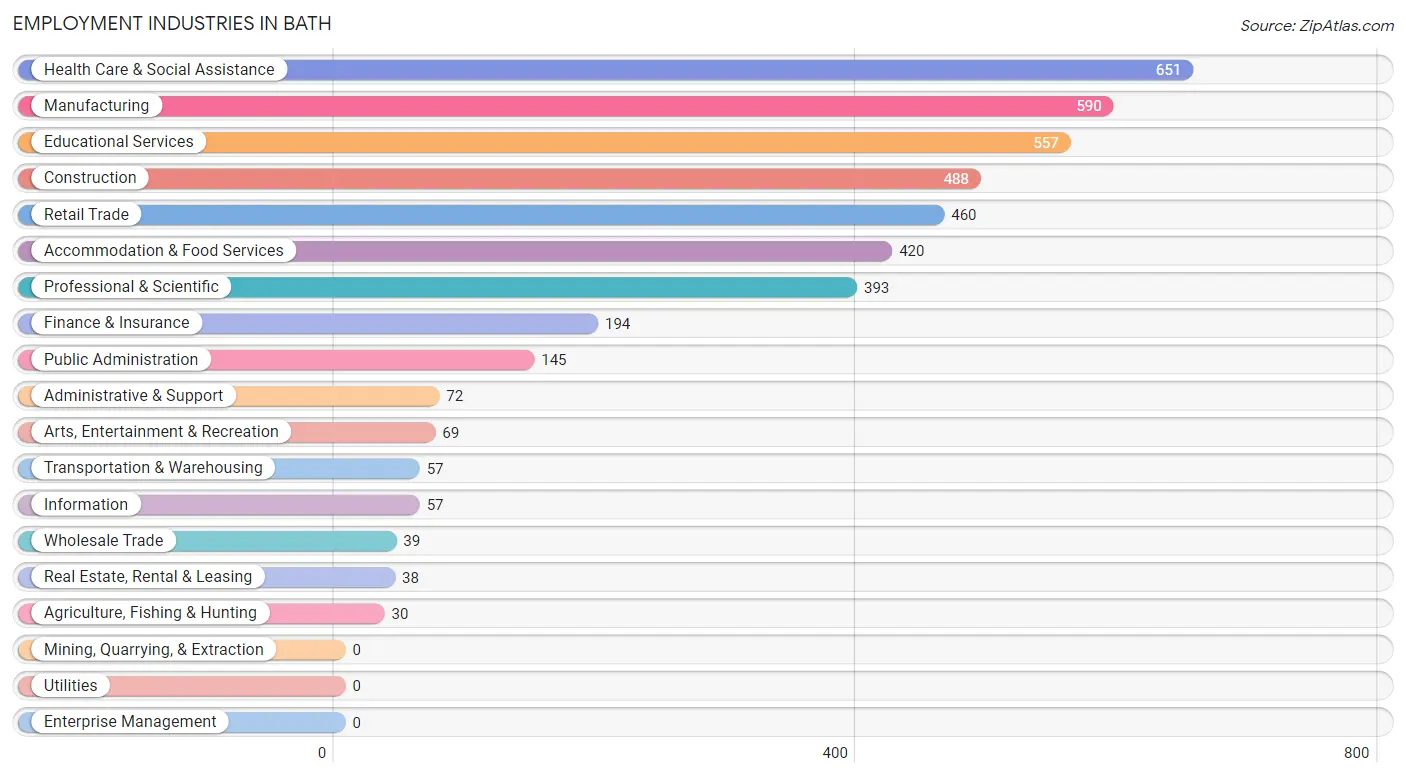
Employment Industries in Bath
The major employment industries in Bath include Health Care & Social Assistance (651 | 15.0%), Manufacturing (590 | 13.6%), Educational Services (557 | 12.8%), Construction (488 | 11.3%), and Retail Trade (460 | 10.6%).
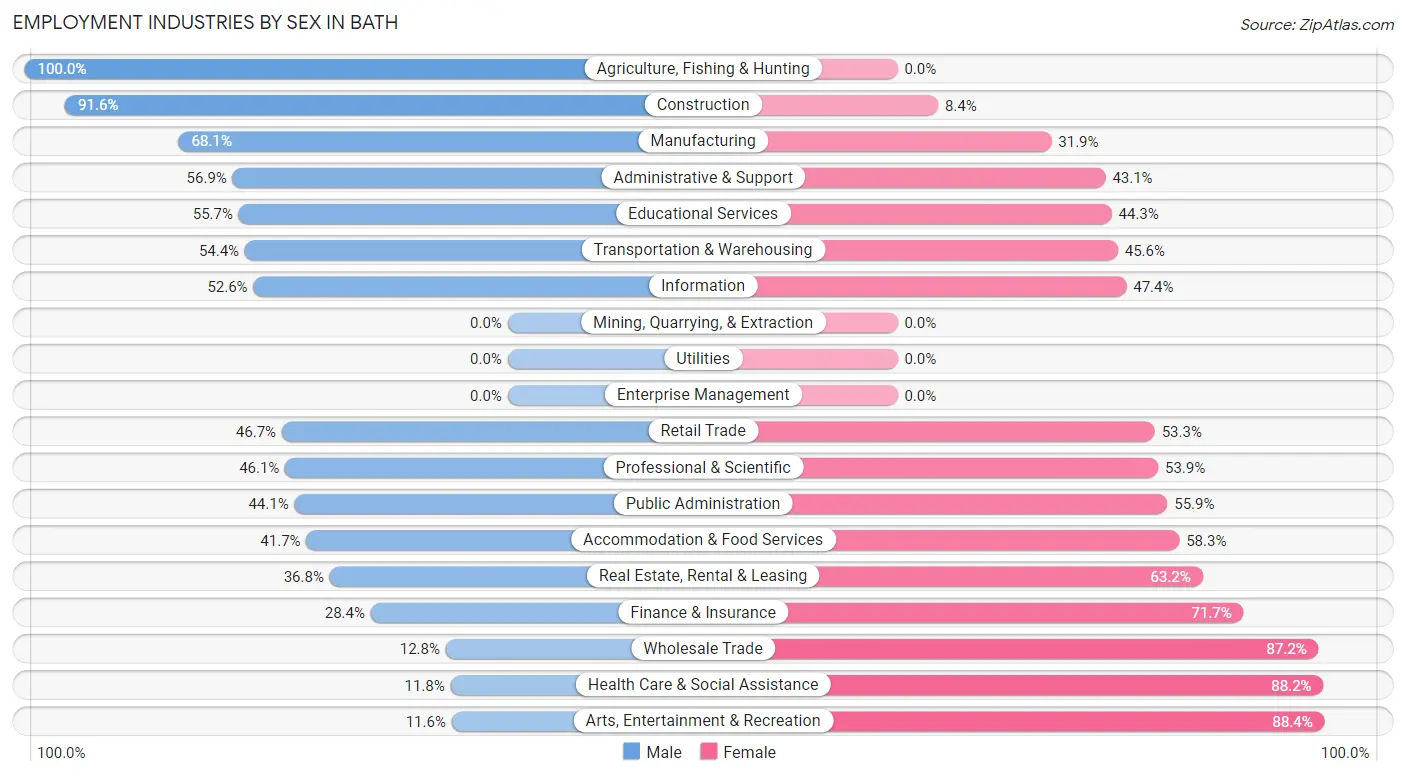
Employment Industries by Sex in Bath
The Bath industries that see more men than women are Agriculture, Fishing & Hunting (100.0%), Construction (91.6%), and Manufacturing (68.1%), whereas the industries that tend to have a higher number of women are Arts, Entertainment & Recreation (88.4%), Health Care & Social Assistance (88.2%), and Wholesale Trade (87.2%).
| Industry | Male | Female |
| Agriculture, Fishing & Hunting | 30 (100.0%) | 0 (0.0%) |
| Mining, Quarrying, & Extraction | 0 (0.0%) | 0 (0.0%) |
| Construction | 447 (91.6%) | 41 (8.4%) |
| Manufacturing | 402 (68.1%) | 188 (31.9%) |
| Wholesale Trade | 5 (12.8%) | 34 (87.2%) |
| Retail Trade | 215 (46.7%) | 245 (53.3%) |
| Transportation & Warehousing | 31 (54.4%) | 26 (45.6%) |
| Utilities | 0 (0.0%) | 0 (0.0%) |
| Information | 30 (52.6%) | 27 (47.4%) |
| Finance & Insurance | 55 (28.3%) | 139 (71.7%) |
| Real Estate, Rental & Leasing | 14 (36.8%) | 24 (63.2%) |
| Professional & Scientific | 181 (46.1%) | 212 (53.9%) |
| Enterprise Management | 0 (0.0%) | 0 (0.0%) |
| Administrative & Support | 41 (56.9%) | 31 (43.1%) |
| Educational Services | 310 (55.7%) | 247 (44.3%) |
| Health Care & Social Assistance | 77 (11.8%) | 574 (88.2%) |
| Arts, Entertainment & Recreation | 8 (11.6%) | 61 (88.4%) |
| Accommodation & Food Services | 175 (41.7%) | 245 (58.3%) |
| Public Administration | 64 (44.1%) | 81 (55.9%) |
| Total | 2,106 (48.6%) | 2,231 (51.4%) |
Education in Bath
School Enrollment in Bath
The most common levels of schooling among the 1,808 students in Bath are middle school (740 | 40.9%), college / undergraduate (405 | 22.4%), and high school (291 | 16.1%).
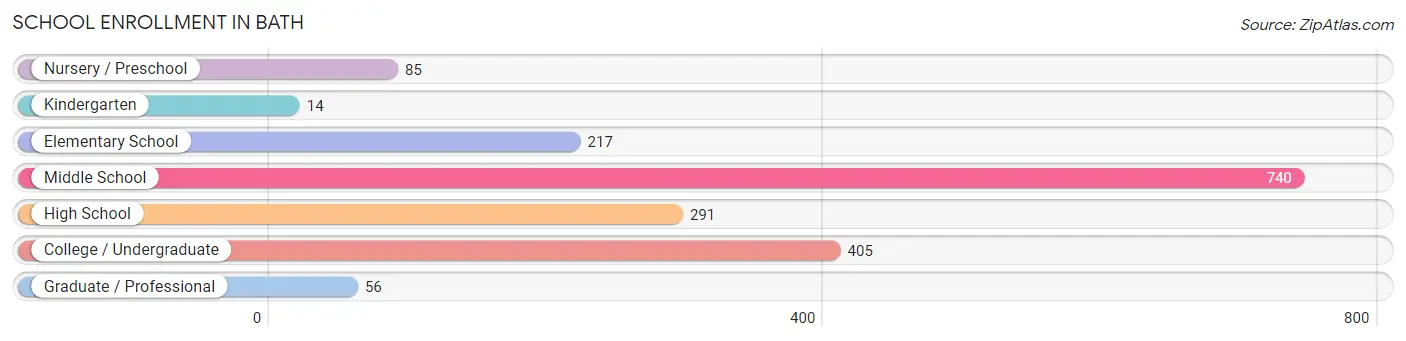
| School Level | # Students | % Students |
| Nursery / Preschool | 85 | 4.7% |
| Kindergarten | 14 | 0.8% |
| Elementary School | 217 | 12.0% |
| Middle School | 740 | 40.9% |
| High School | 291 | 16.1% |
| College / Undergraduate | 405 | 22.4% |
| Graduate / Professional | 56 | 3.1% |
| Total | 1,808 | 100.0% |
School Enrollment by Age by Funding Source in Bath
Out of a total of 1,808 students who are enrolled in schools in Bath, 410 (22.7%) attend a private institution, while the remaining 1,398 (77.3%) are enrolled in public schools. The age group of 3 to 4 year olds has the highest likelihood of being enrolled in private schools, with 31 (70.5% in the age bracket) enrolled. Conversely, the age group of 20 to 24 year olds has the lowest likelihood of being enrolled in a private school, with 109 (100.0% in the age bracket) attending a public institution.
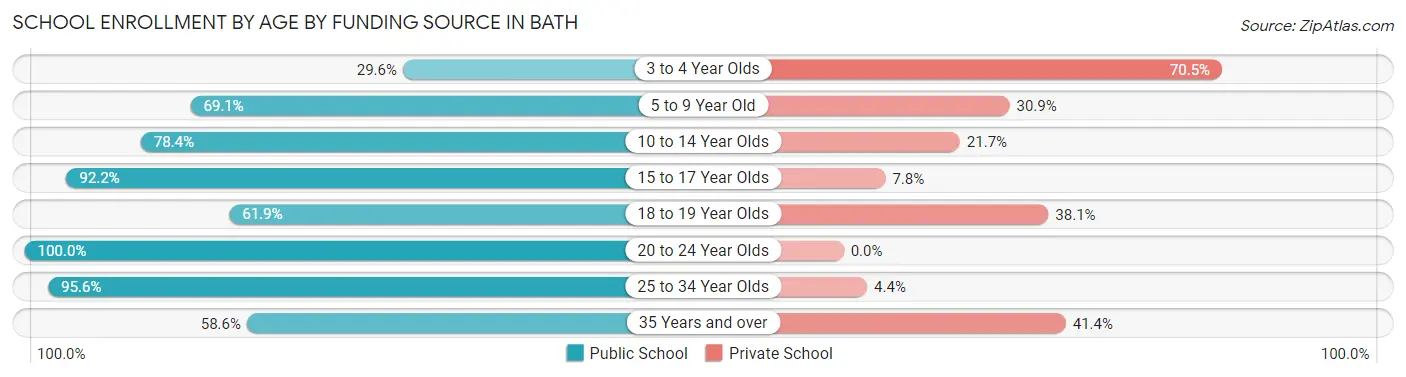
| Age Bracket | Public School | Private School |
| 3 to 4 Year Olds | 13 (29.5%) | 31 (70.5%) |
| 5 to 9 Year Old | 199 (69.1%) | 89 (30.9%) |
| 10 to 14 Year Olds | 666 (78.3%) | 184 (21.6%) |
| 15 to 17 Year Olds | 142 (92.2%) | 12 (7.8%) |
| 18 to 19 Year Olds | 86 (61.9%) | 53 (38.1%) |
| 20 to 24 Year Olds | 109 (100.0%) | 0 (0.0%) |
| 25 to 34 Year Olds | 131 (95.6%) | 6 (4.4%) |
| 35 Years and over | 51 (58.6%) | 36 (41.4%) |
| Total | 1,398 (77.3%) | 410 (22.7%) |
Educational Attainment by Field of Study in Bath
Liberal arts & history (429 | 17.2%), literature & languages (332 | 13.3%), visual & performing arts (297 | 11.9%), education (268 | 10.8%), and business (215 | 8.6%) are the most common fields of study among 2,489 individuals in Bath who have obtained a bachelor's degree or higher.
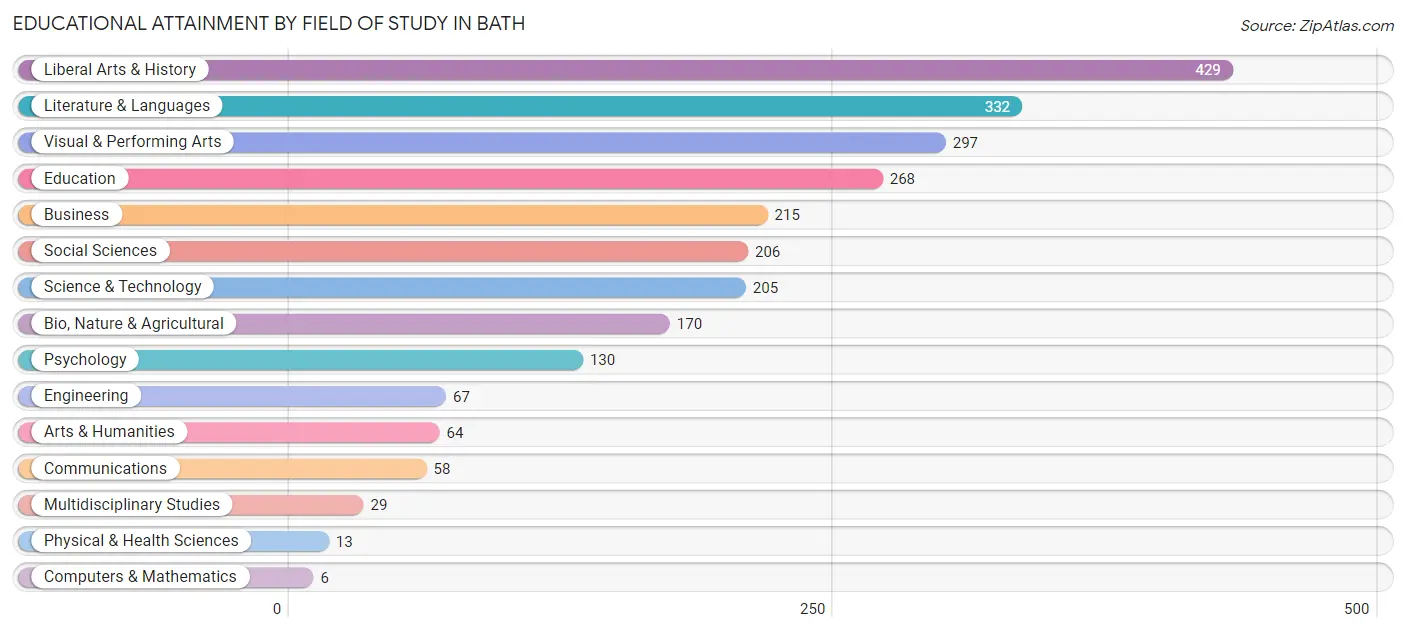
| Field of Study | # Graduates | % Graduates |
| Computers & Mathematics | 6 | 0.2% |
| Bio, Nature & Agricultural | 170 | 6.8% |
| Physical & Health Sciences | 13 | 0.5% |
| Psychology | 130 | 5.2% |
| Social Sciences | 206 | 8.3% |
| Engineering | 67 | 2.7% |
| Multidisciplinary Studies | 29 | 1.2% |
| Science & Technology | 205 | 8.2% |
| Business | 215 | 8.6% |
| Education | 268 | 10.8% |
| Literature & Languages | 332 | 13.3% |
| Liberal Arts & History | 429 | 17.2% |
| Visual & Performing Arts | 297 | 11.9% |
| Communications | 58 | 2.3% |
| Arts & Humanities | 64 | 2.6% |
| Total | 2,489 | 100.0% |
Transportation & Commute in Bath
Vehicle Availability by Sex in Bath
The most prevalent vehicle ownership categories in Bath are males with 2 vehicles (1,096, accounting for 53.9%) and females with 2 vehicles (850, making up 49.3%).
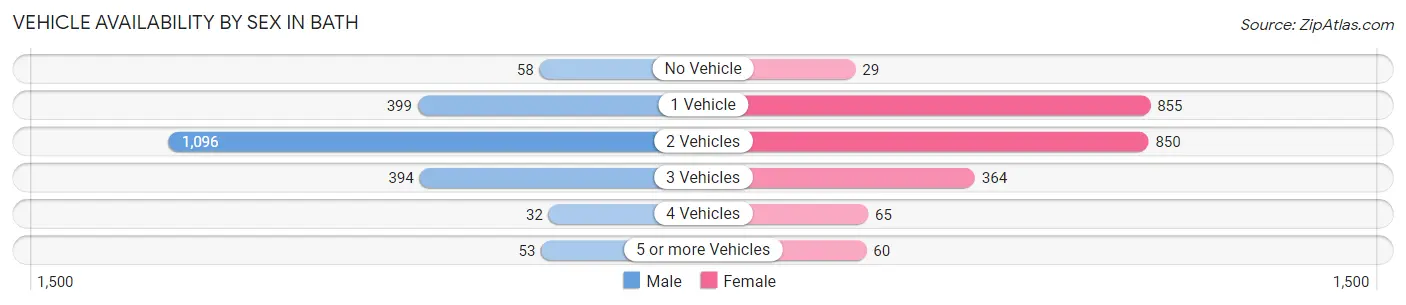
| Vehicles Available | Male | Female |
| No Vehicle | 58 (2.9%) | 29 (1.3%) |
| 1 Vehicle | 399 (19.6%) | 855 (38.5%) |
| 2 Vehicles | 1,096 (53.9%) | 850 (38.2%) |
| 3 Vehicles | 394 (19.4%) | 364 (16.4%) |
| 4 Vehicles | 32 (1.6%) | 65 (2.9%) |
| 5 or more Vehicles | 53 (2.6%) | 60 (2.7%) |
| Total | 2,032 (100.0%) | 2,223 (100.0%) |
Commute Time in Bath
The most frequently occuring commute durations in Bath are 5 to 9 minutes (816 commuters, 22.8%), 10 to 14 minutes (724 commuters, 20.2%), and 15 to 19 minutes (474 commuters, 13.3%).
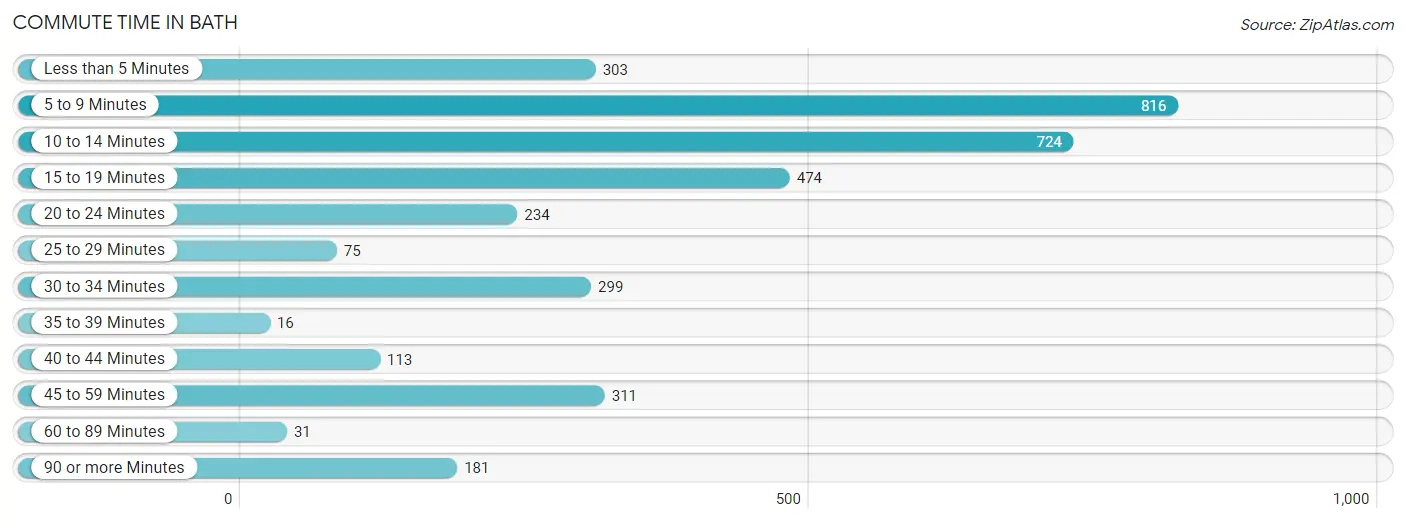
| Commute Time | # Commuters | % Commuters |
| Less than 5 Minutes | 303 | 8.5% |
| 5 to 9 Minutes | 816 | 22.8% |
| 10 to 14 Minutes | 724 | 20.2% |
| 15 to 19 Minutes | 474 | 13.3% |
| 20 to 24 Minutes | 234 | 6.5% |
| 25 to 29 Minutes | 75 | 2.1% |
| 30 to 34 Minutes | 299 | 8.4% |
| 35 to 39 Minutes | 16 | 0.4% |
| 40 to 44 Minutes | 113 | 3.2% |
| 45 to 59 Minutes | 311 | 8.7% |
| 60 to 89 Minutes | 31 | 0.9% |
| 90 or more Minutes | 181 | 5.1% |
Commute Time by Sex in Bath
The most common commute times in Bath are 5 to 9 minutes (421 commuters, 24.9%) for males and 10 to 14 minutes (439 commuters, 23.3%) for females.
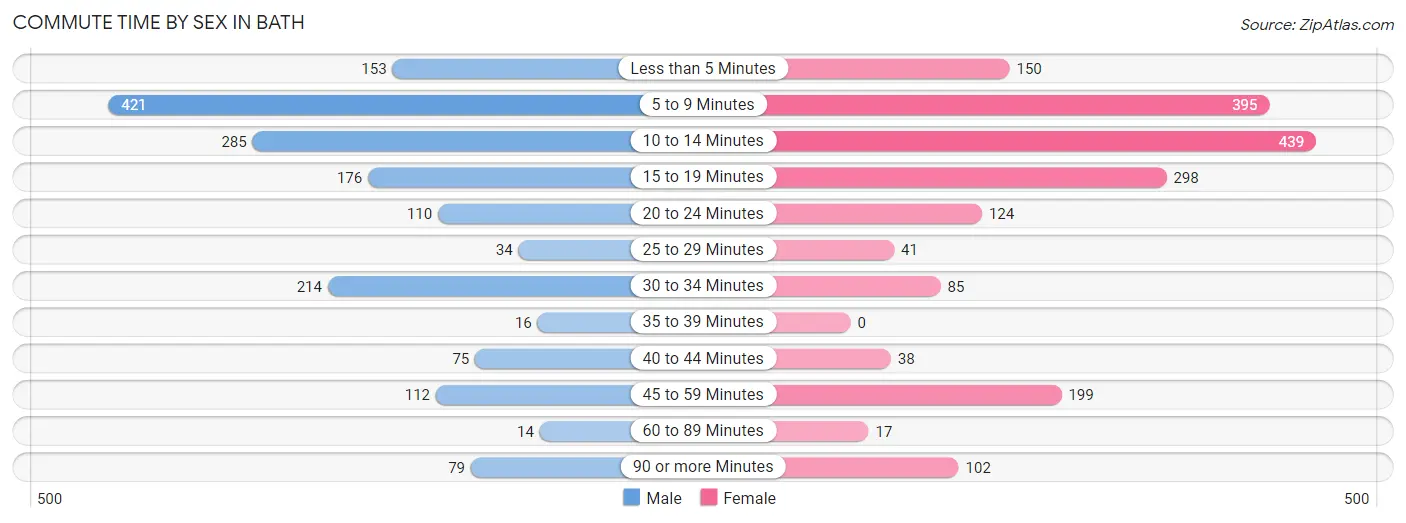
| Commute Time | Male | Female |
| Less than 5 Minutes | 153 (9.1%) | 150 (7.9%) |
| 5 to 9 Minutes | 421 (24.9%) | 395 (20.9%) |
| 10 to 14 Minutes | 285 (16.9%) | 439 (23.3%) |
| 15 to 19 Minutes | 176 (10.4%) | 298 (15.8%) |
| 20 to 24 Minutes | 110 (6.5%) | 124 (6.6%) |
| 25 to 29 Minutes | 34 (2.0%) | 41 (2.2%) |
| 30 to 34 Minutes | 214 (12.7%) | 85 (4.5%) |
| 35 to 39 Minutes | 16 (0.9%) | 0 (0.0%) |
| 40 to 44 Minutes | 75 (4.4%) | 38 (2.0%) |
| 45 to 59 Minutes | 112 (6.6%) | 199 (10.5%) |
| 60 to 89 Minutes | 14 (0.8%) | 17 (0.9%) |
| 90 or more Minutes | 79 (4.7%) | 102 (5.4%) |
Time of Departure to Work by Sex in Bath
The most frequent times of departure to work in Bath are 7:00 AM to 7:29 AM (419, 24.8%) for males and 7:30 AM to 7:59 AM (281, 14.9%) for females.
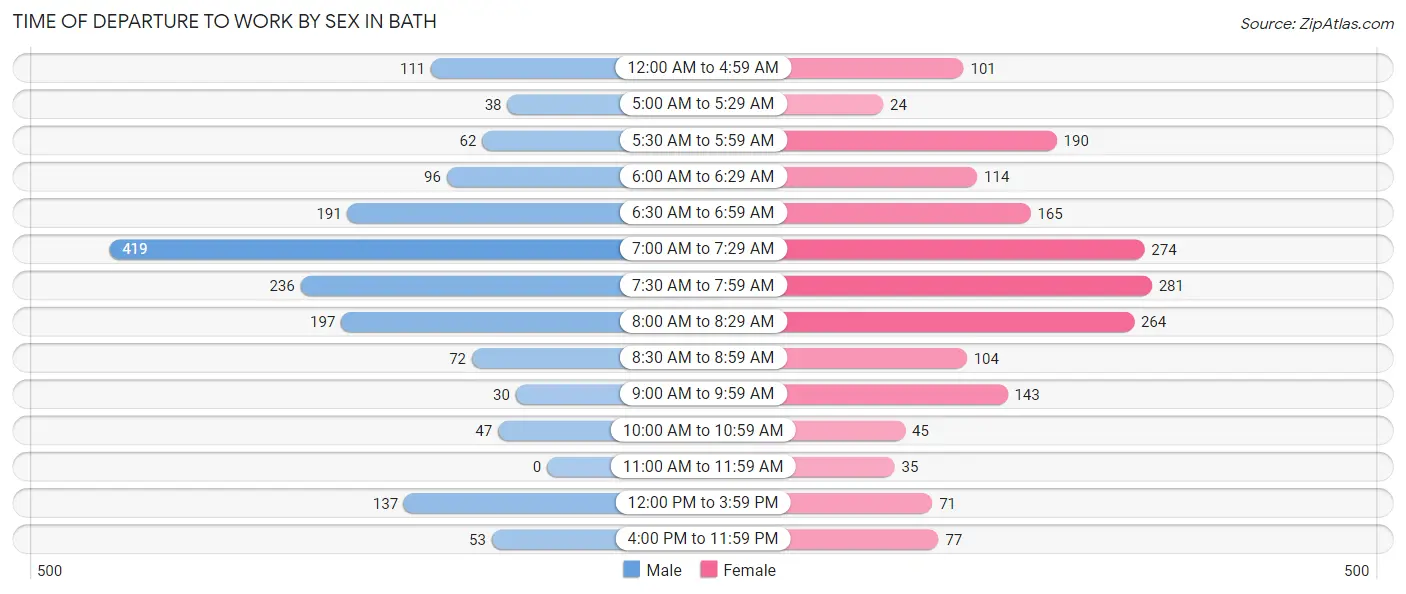
| Time of Departure | Male | Female |
| 12:00 AM to 4:59 AM | 111 (6.6%) | 101 (5.3%) |
| 5:00 AM to 5:29 AM | 38 (2.2%) | 24 (1.3%) |
| 5:30 AM to 5:59 AM | 62 (3.7%) | 190 (10.1%) |
| 6:00 AM to 6:29 AM | 96 (5.7%) | 114 (6.0%) |
| 6:30 AM to 6:59 AM | 191 (11.3%) | 165 (8.7%) |
| 7:00 AM to 7:29 AM | 419 (24.8%) | 274 (14.5%) |
| 7:30 AM to 7:59 AM | 236 (14.0%) | 281 (14.9%) |
| 8:00 AM to 8:29 AM | 197 (11.7%) | 264 (14.0%) |
| 8:30 AM to 8:59 AM | 72 (4.3%) | 104 (5.5%) |
| 9:00 AM to 9:59 AM | 30 (1.8%) | 143 (7.6%) |
| 10:00 AM to 10:59 AM | 47 (2.8%) | 45 (2.4%) |
| 11:00 AM to 11:59 AM | 0 (0.0%) | 35 (1.8%) |
| 12:00 PM to 3:59 PM | 137 (8.1%) | 71 (3.8%) |
| 4:00 PM to 11:59 PM | 53 (3.1%) | 77 (4.1%) |
| Total | 1,689 (100.0%) | 1,888 (100.0%) |
Housing Occupancy in Bath
Occupancy by Ownership in Bath
Of the total 4,014 dwellings in Bath, owner-occupied units account for 2,503 (62.4%), while renter-occupied units make up 1,511 (37.6%).
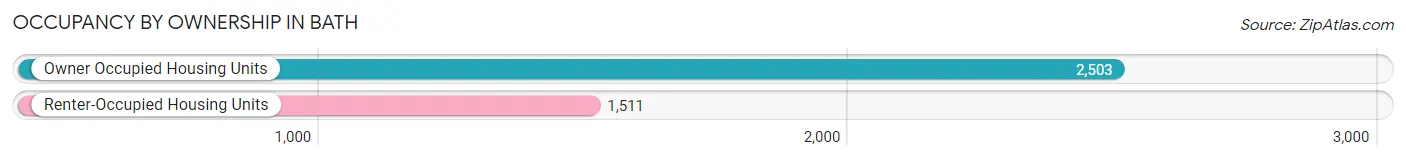
| Occupancy | # Housing Units | % Housing Units |
| Owner Occupied Housing Units | 2,503 | 62.4% |
| Renter-Occupied Housing Units | 1,511 | 37.6% |
| Total Occupied Housing Units | 4,014 | 100.0% |
Occupancy by Household Size in Bath
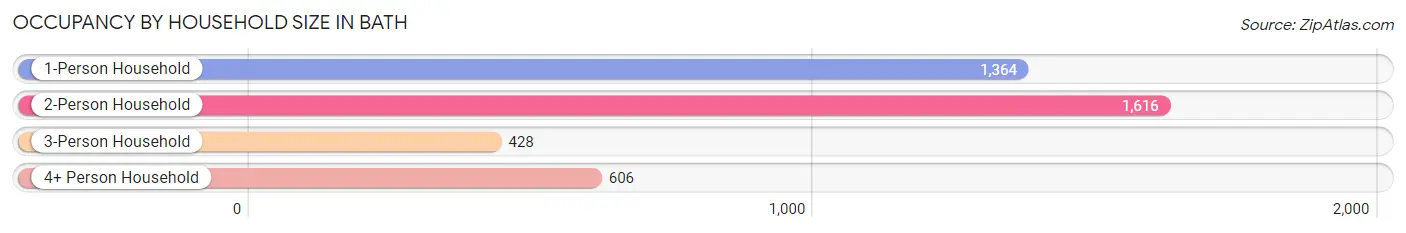
| Household Size | # Housing Units | % Housing Units |
| 1-Person Household | 1,364 | 34.0% |
| 2-Person Household | 1,616 | 40.3% |
| 3-Person Household | 428 | 10.7% |
| 4+ Person Household | 606 | 15.1% |
| Total Housing Units | 4,014 | 100.0% |
Occupancy by Ownership by Household Size in Bath
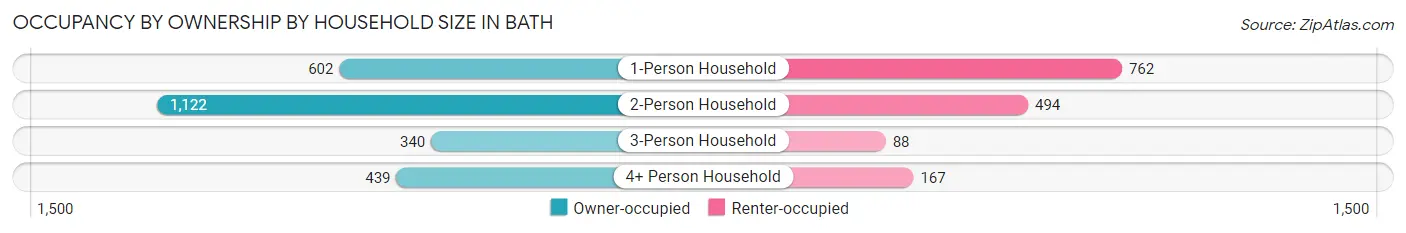
| Household Size | Owner-occupied | Renter-occupied |
| 1-Person Household | 602 (44.1%) | 762 (55.9%) |
| 2-Person Household | 1,122 (69.4%) | 494 (30.6%) |
| 3-Person Household | 340 (79.4%) | 88 (20.6%) |
| 4+ Person Household | 439 (72.4%) | 167 (27.6%) |
| Total Housing Units | 2,503 (62.4%) | 1,511 (37.6%) |
Occupancy by Educational Attainment in Bath
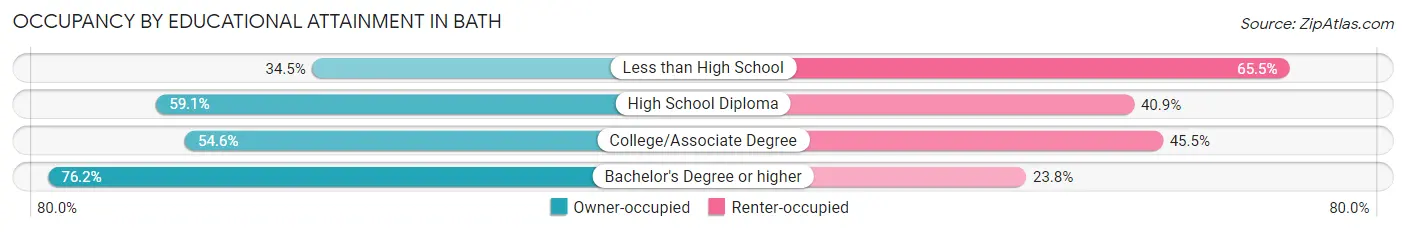
| Household Size | Owner-occupied | Renter-occupied |
| Less than High School | 80 (34.5%) | 152 (65.5%) |
| High School Diploma | 542 (59.1%) | 375 (40.9%) |
| College/Associate Degree | 762 (54.5%) | 635 (45.5%) |
| Bachelor's Degree or higher | 1,119 (76.2%) | 349 (23.8%) |
Occupancy by Age of Householder in Bath
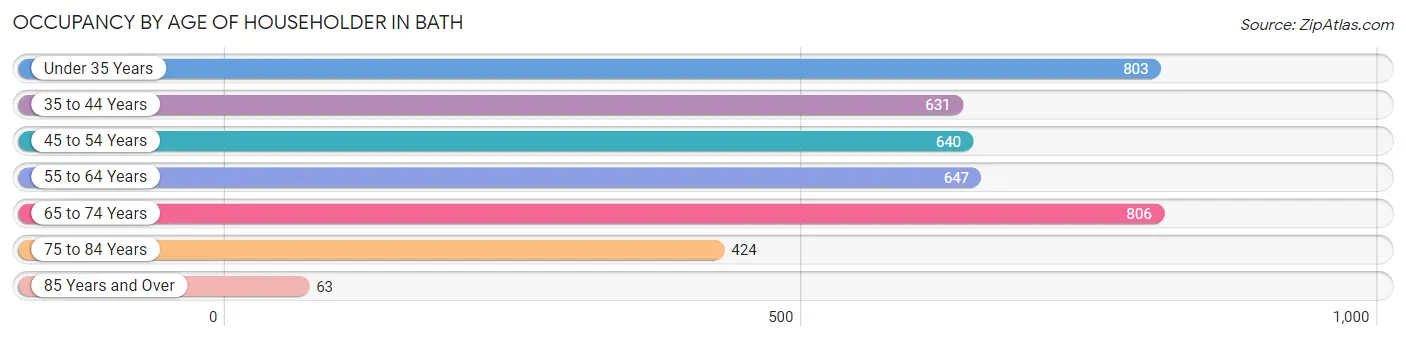
| Age Bracket | # Households | % Households |
| Under 35 Years | 803 | 20.0% |
| 35 to 44 Years | 631 | 15.7% |
| 45 to 54 Years | 640 | 15.9% |
| 55 to 64 Years | 647 | 16.1% |
| 65 to 74 Years | 806 | 20.1% |
| 75 to 84 Years | 424 | 10.6% |
| 85 Years and Over | 63 | 1.6% |
| Total | 4,014 | 100.0% |
Housing Finances in Bath
Median Income by Occupancy in Bath
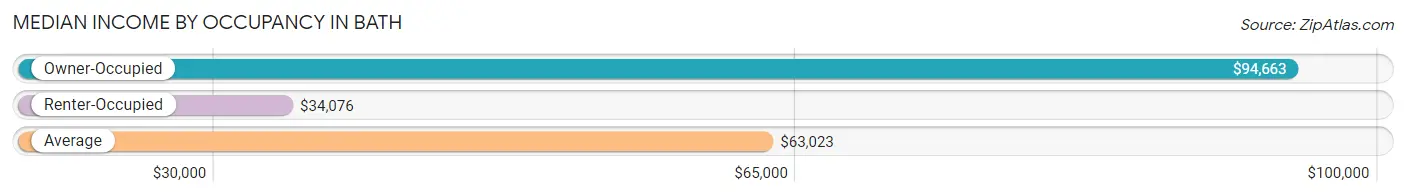
| Occupancy Type | # Households | Median Income |
| Owner-Occupied | 2,503 (62.4%) | $94,663 |
| Renter-Occupied | 1,511 (37.6%) | $34,076 |
| Average | 4,014 (100.0%) | $63,023 |
Occupancy by Householder Income Bracket in Bath
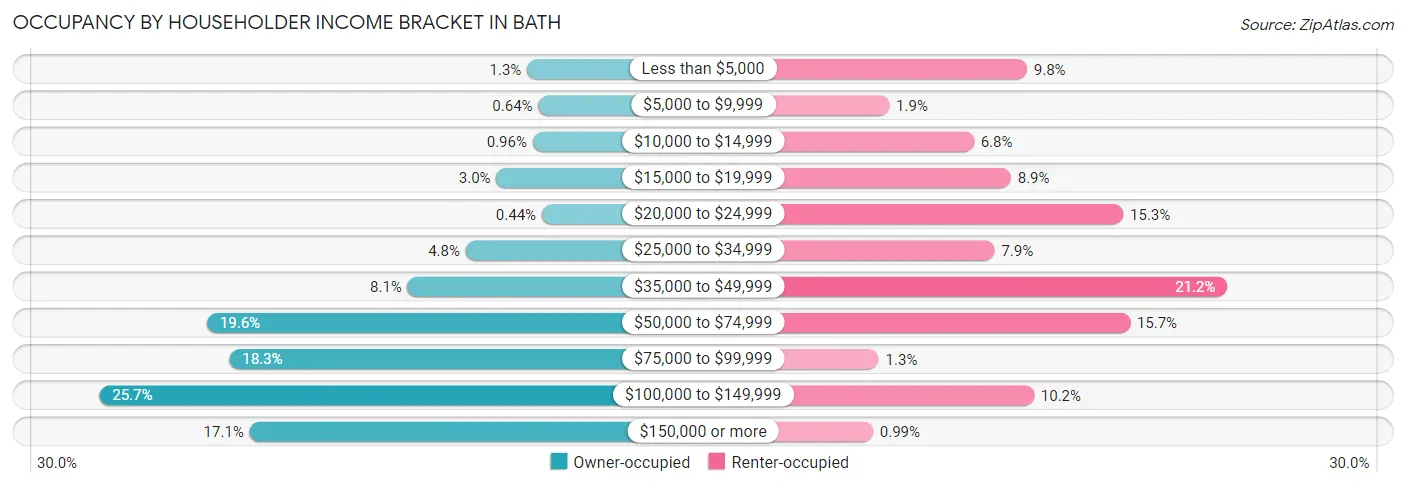
| Income Bracket | Owner-occupied | Renter-occupied |
| Less than $5,000 | 32 (1.3%) | 148 (9.8%) |
| $5,000 to $9,999 | 16 (0.6%) | 29 (1.9%) |
| $10,000 to $14,999 | 24 (1.0%) | 102 (6.8%) |
| $15,000 to $19,999 | 76 (3.0%) | 134 (8.9%) |
| $20,000 to $24,999 | 11 (0.4%) | 231 (15.3%) |
| $25,000 to $34,999 | 120 (4.8%) | 120 (7.9%) |
| $35,000 to $49,999 | 203 (8.1%) | 321 (21.2%) |
| $50,000 to $74,999 | 490 (19.6%) | 237 (15.7%) |
| $75,000 to $99,999 | 458 (18.3%) | 20 (1.3%) |
| $100,000 to $149,999 | 644 (25.7%) | 154 (10.2%) |
| $150,000 or more | 429 (17.1%) | 15 (1.0%) |
| Total | 2,503 (100.0%) | 1,511 (100.0%) |
Monthly Housing Cost Tiers in Bath
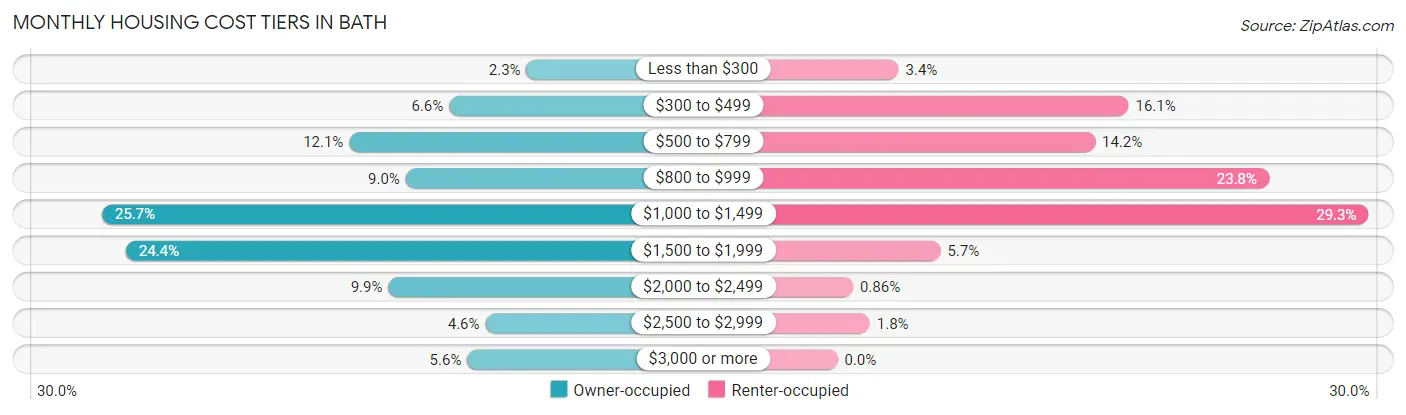
| Monthly Cost | Owner-occupied | Renter-occupied |
| Less than $300 | 57 (2.3%) | 51 (3.4%) |
| $300 to $499 | 164 (6.6%) | 243 (16.1%) |
| $500 to $799 | 302 (12.1%) | 215 (14.2%) |
| $800 to $999 | 224 (8.9%) | 360 (23.8%) |
| $1,000 to $1,499 | 644 (25.7%) | 443 (29.3%) |
| $1,500 to $1,999 | 611 (24.4%) | 86 (5.7%) |
| $2,000 to $2,499 | 248 (9.9%) | 13 (0.9%) |
| $2,500 to $2,999 | 114 (4.5%) | 27 (1.8%) |
| $3,000 or more | 139 (5.6%) | 0 (0.0%) |
| Total | 2,503 (100.0%) | 1,511 (100.0%) |
Physical Housing Characteristics in Bath
Housing Structures in Bath
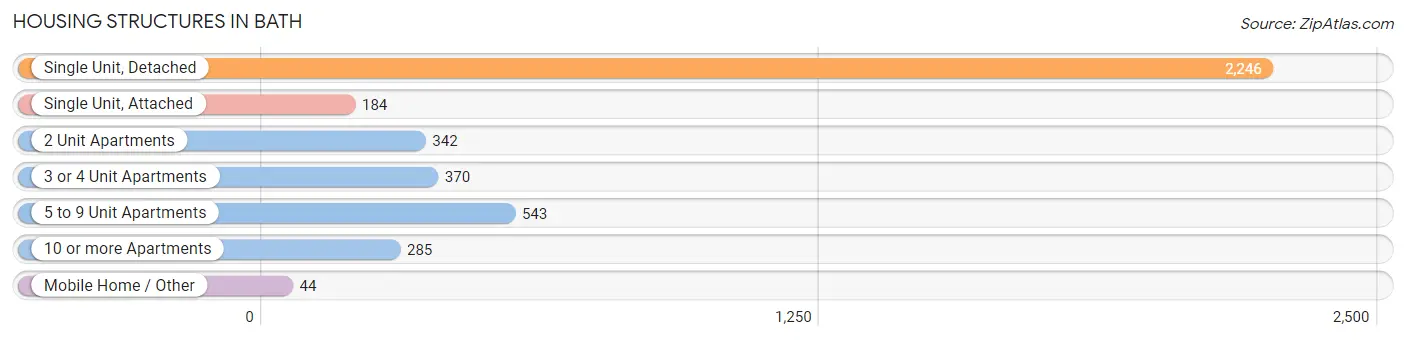
| Structure Type | # Housing Units | % Housing Units |
| Single Unit, Detached | 2,246 | 55.9% |
| Single Unit, Attached | 184 | 4.6% |
| 2 Unit Apartments | 342 | 8.5% |
| 3 or 4 Unit Apartments | 370 | 9.2% |
| 5 to 9 Unit Apartments | 543 | 13.5% |
| 10 or more Apartments | 285 | 7.1% |
| Mobile Home / Other | 44 | 1.1% |
| Total | 4,014 | 100.0% |
Housing Structures by Occupancy in Bath
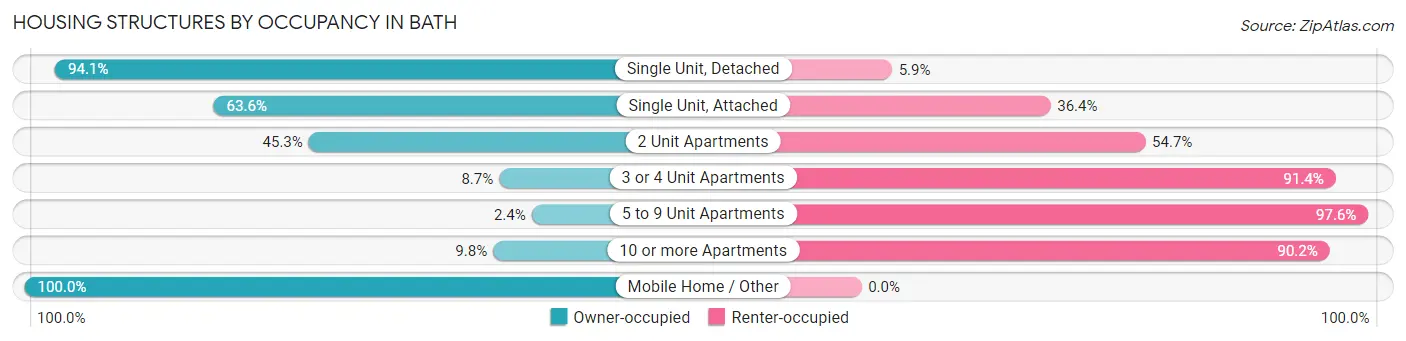
| Structure Type | Owner-occupied | Renter-occupied |
| Single Unit, Detached | 2,114 (94.1%) | 132 (5.9%) |
| Single Unit, Attached | 117 (63.6%) | 67 (36.4%) |
| 2 Unit Apartments | 155 (45.3%) | 187 (54.7%) |
| 3 or 4 Unit Apartments | 32 (8.6%) | 338 (91.3%) |
| 5 to 9 Unit Apartments | 13 (2.4%) | 530 (97.6%) |
| 10 or more Apartments | 28 (9.8%) | 257 (90.2%) |
| Mobile Home / Other | 44 (100.0%) | 0 (0.0%) |
| Total | 2,503 (62.4%) | 1,511 (37.6%) |
Housing Structures by Number of Rooms in Bath
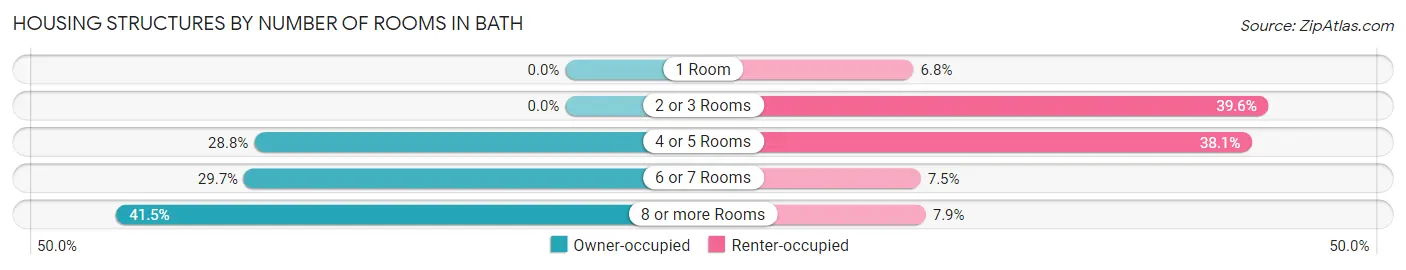
| Number of Rooms | Owner-occupied | Renter-occupied |
| 1 Room | 0 (0.0%) | 103 (6.8%) |
| 2 or 3 Rooms | 0 (0.0%) | 599 (39.6%) |
| 4 or 5 Rooms | 720 (28.8%) | 576 (38.1%) |
| 6 or 7 Rooms | 744 (29.7%) | 113 (7.5%) |
| 8 or more Rooms | 1,039 (41.5%) | 120 (7.9%) |
| Total | 2,503 (100.0%) | 1,511 (100.0%) |
Housing Structure by Heating Type in Bath
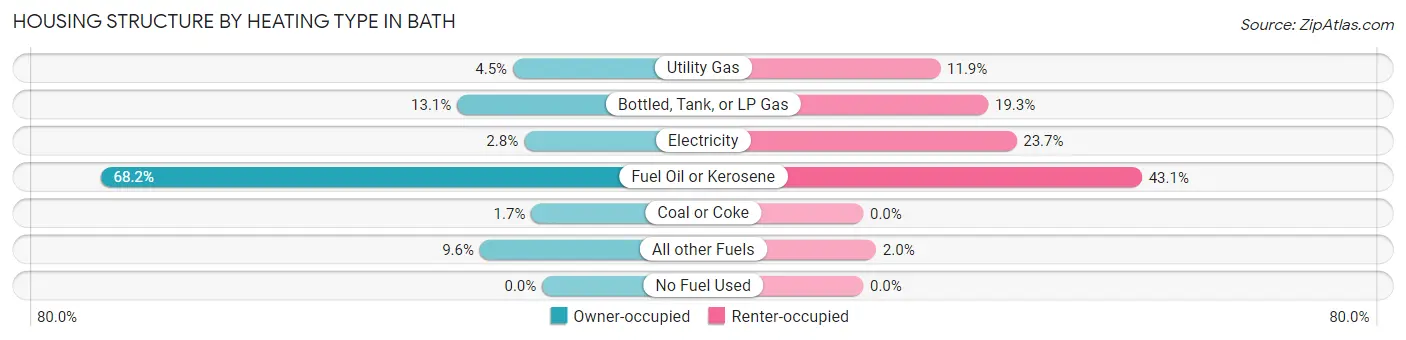
| Heating Type | Owner-occupied | Renter-occupied |
| Utility Gas | 113 (4.5%) | 180 (11.9%) |
| Bottled, Tank, or LP Gas | 329 (13.1%) | 292 (19.3%) |
| Electricity | 70 (2.8%) | 358 (23.7%) |
| Fuel Oil or Kerosene | 1,708 (68.2%) | 651 (43.1%) |
| Coal or Coke | 42 (1.7%) | 0 (0.0%) |
| All other Fuels | 241 (9.6%) | 30 (2.0%) |
| No Fuel Used | 0 (0.0%) | 0 (0.0%) |
| Total | 2,503 (100.0%) | 1,511 (100.0%) |
Household Vehicle Usage in Bath
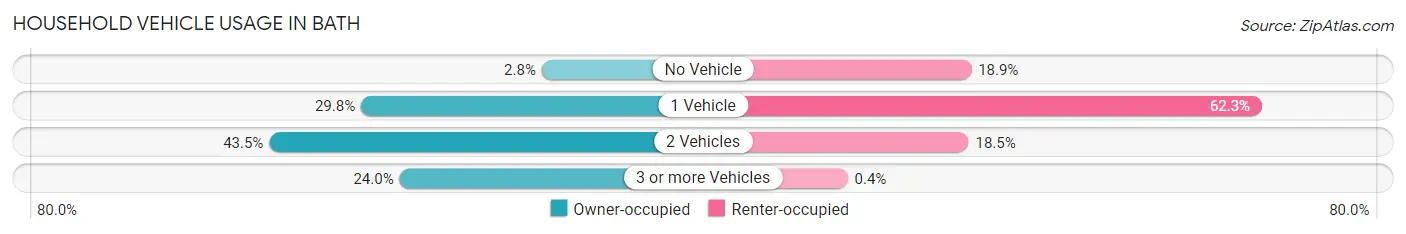
| Vehicles per Household | Owner-occupied | Renter-occupied |
| No Vehicle | 69 (2.8%) | 285 (18.9%) |
| 1 Vehicle | 745 (29.8%) | 941 (62.3%) |
| 2 Vehicles | 1,088 (43.5%) | 279 (18.5%) |
| 3 or more Vehicles | 601 (24.0%) | 6 (0.4%) |
| Total | 2,503 (100.0%) | 1,511 (100.0%) |
Real Estate & Mortgages in Bath
Real Estate and Mortgage Overview in Bath
| Characteristic | Without Mortgage | With Mortgage |
| Housing Units | 906 | 1,597 |
| Median Property Value | $245,100 | $253,100 |
| Median Household Income | $75,000 | $331 |
| Monthly Housing Costs | $785 | $139 |
| Real Estate Taxes | $3,651 | $0 |
Property Value by Mortgage Status in Bath
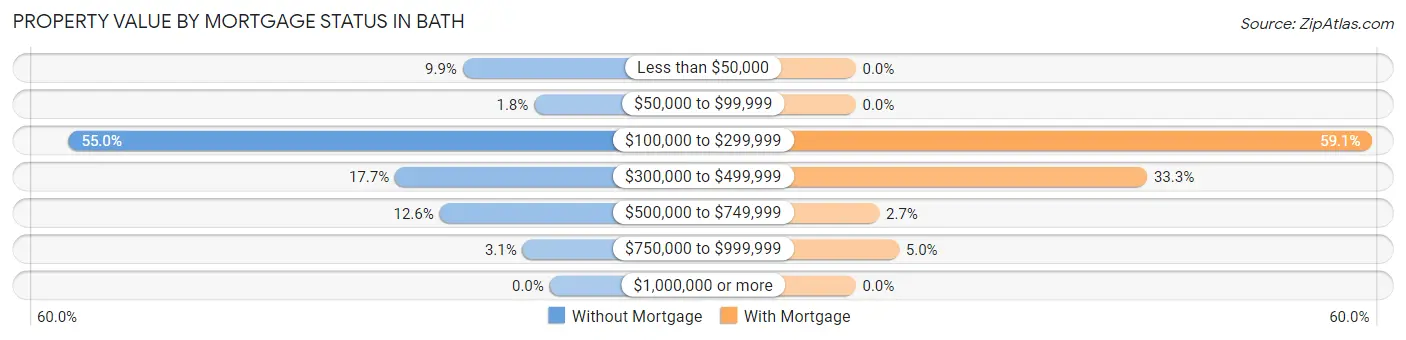
| Property Value | Without Mortgage | With Mortgage |
| Less than $50,000 | 90 (9.9%) | 0 (0.0%) |
| $50,000 to $99,999 | 16 (1.8%) | 0 (0.0%) |
| $100,000 to $299,999 | 498 (55.0%) | 943 (59.1%) |
| $300,000 to $499,999 | 160 (17.7%) | 532 (33.3%) |
| $500,000 to $749,999 | 114 (12.6%) | 43 (2.7%) |
| $750,000 to $999,999 | 28 (3.1%) | 79 (5.0%) |
| $1,000,000 or more | 0 (0.0%) | 0 (0.0%) |
| Total | 906 (100.0%) | 1,597 (100.0%) |
Household Income by Mortgage Status in Bath
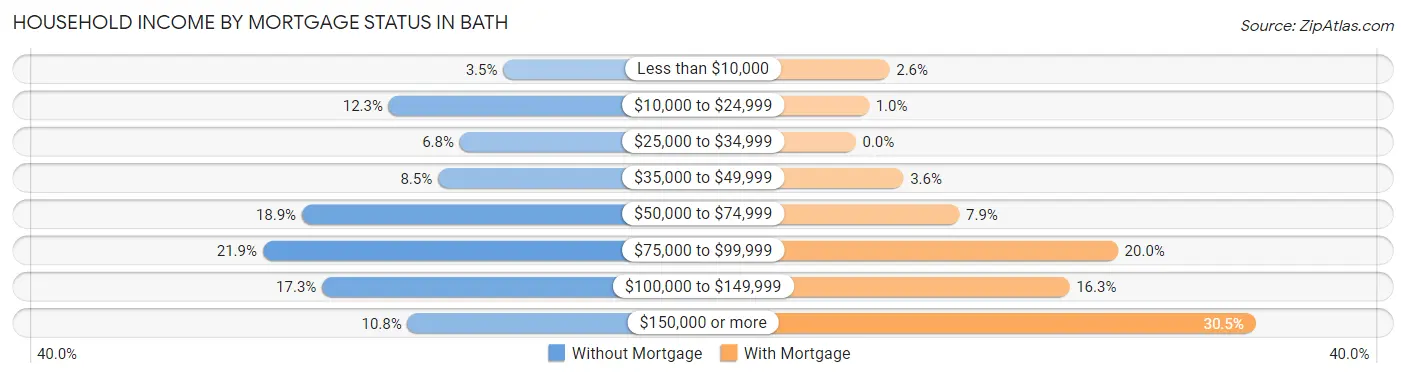
| Household Income | Without Mortgage | With Mortgage |
| Less than $10,000 | 32 (3.5%) | 41 (2.6%) |
| $10,000 to $24,999 | 111 (12.2%) | 16 (1.0%) |
| $25,000 to $34,999 | 62 (6.8%) | 0 (0.0%) |
| $35,000 to $49,999 | 77 (8.5%) | 58 (3.6%) |
| $50,000 to $74,999 | 171 (18.9%) | 126 (7.9%) |
| $75,000 to $99,999 | 198 (21.8%) | 319 (20.0%) |
| $100,000 to $149,999 | 157 (17.3%) | 260 (16.3%) |
| $150,000 or more | 98 (10.8%) | 487 (30.5%) |
| Total | 906 (100.0%) | 1,597 (100.0%) |
Property Value to Household Income Ratio in Bath
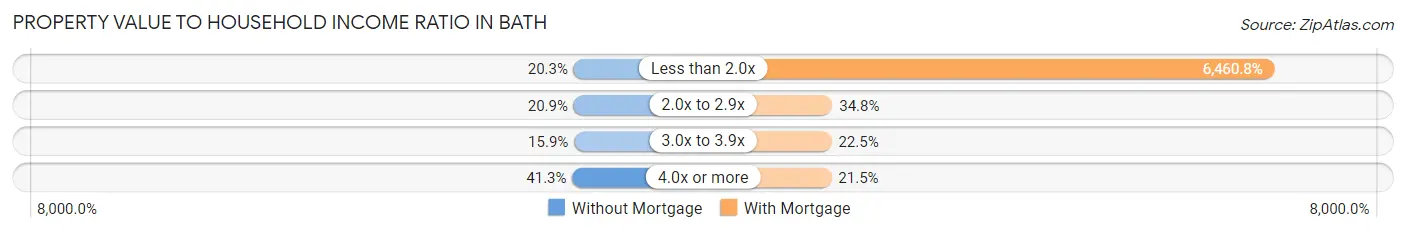
| Value-to-Income Ratio | Without Mortgage | With Mortgage |
| Less than 2.0x | 184 (20.3%) | 103,179 (6,460.8%) |
| 2.0x to 2.9x | 189 (20.9%) | 555 (34.7%) |
| 3.0x to 3.9x | 144 (15.9%) | 359 (22.5%) |
| 4.0x or more | 374 (41.3%) | 343 (21.5%) |
| Total | 906 (100.0%) | 1,597 (100.0%) |
Real Estate Taxes by Mortgage Status in Bath
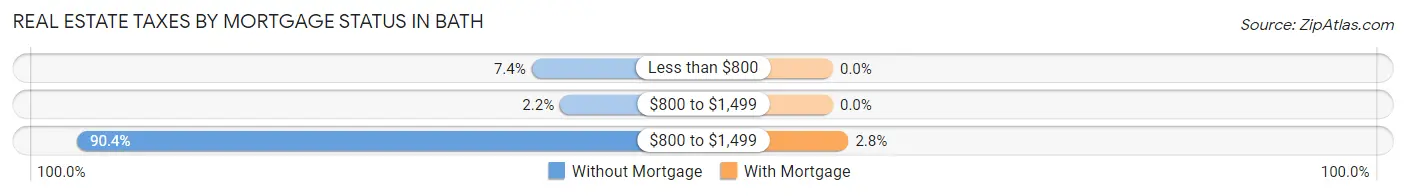
| Property Taxes | Without Mortgage | With Mortgage |
| Less than $800 | 67 (7.4%) | 0 (0.0%) |
| $800 to $1,499 | 20 (2.2%) | 0 (0.0%) |
| $800 to $1,499 | 819 (90.4%) | 45 (2.8%) |
| Total | 906 (100.0%) | 1,597 (100.0%) |
Health & Disability in Bath
Health Insurance Coverage by Age in Bath
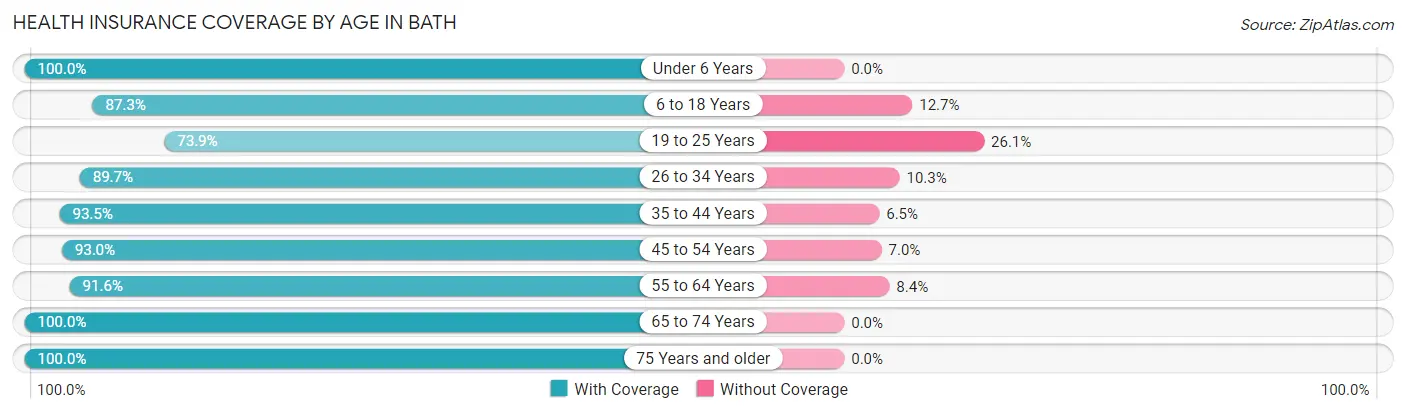
| Age Bracket | With Coverage | Without Coverage |
| Under 6 Years | 381 (100.0%) | 0 (0.0%) |
| 6 to 18 Years | 1,136 (87.3%) | 165 (12.7%) |
| 19 to 25 Years | 607 (73.9%) | 214 (26.1%) |
| 26 to 34 Years | 897 (89.7%) | 103 (10.3%) |
| 35 to 44 Years | 932 (93.5%) | 65 (6.5%) |
| 45 to 54 Years | 1,043 (93.0%) | 78 (7.0%) |
| 55 to 64 Years | 1,024 (91.6%) | 94 (8.4%) |
| 65 to 74 Years | 1,235 (100.0%) | 0 (0.0%) |
| 75 Years and older | 714 (100.0%) | 0 (0.0%) |
| Total | 7,969 (91.7%) | 719 (8.3%) |
Health Insurance Coverage by Citizenship Status in Bath
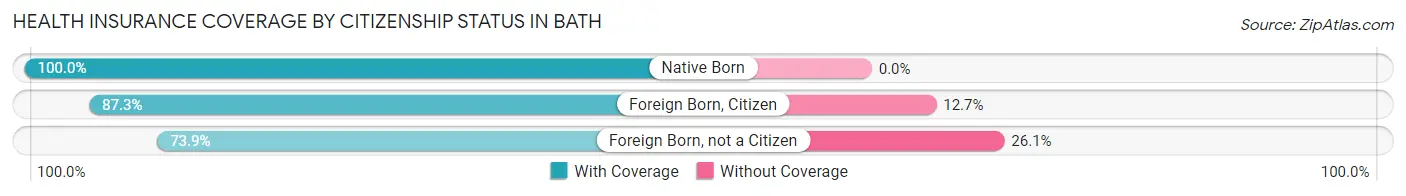
| Citizenship Status | With Coverage | Without Coverage |
| Native Born | 381 (100.0%) | 0 (0.0%) |
| Foreign Born, Citizen | 1,136 (87.3%) | 165 (12.7%) |
| Foreign Born, not a Citizen | 607 (73.9%) | 214 (26.1%) |
Health Insurance Coverage by Household Income in Bath
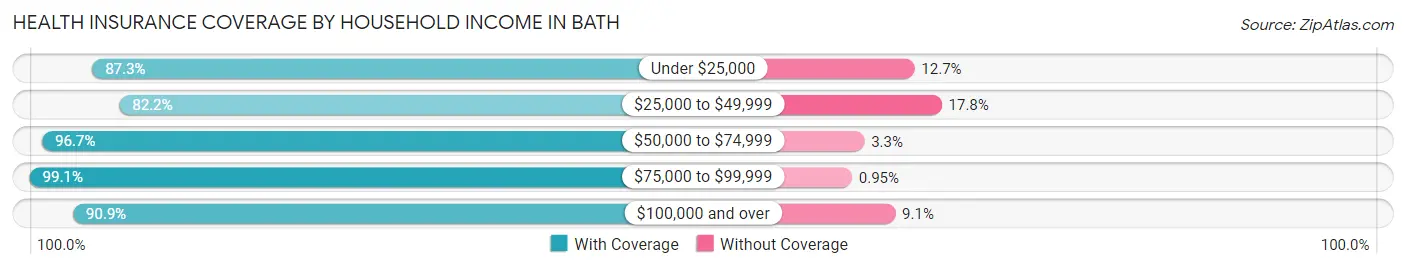
| Household Income | With Coverage | Without Coverage |
| Under $25,000 | 1,082 (87.3%) | 157 (12.7%) |
| $25,000 to $49,999 | 963 (82.2%) | 208 (17.8%) |
| $50,000 to $74,999 | 1,687 (96.7%) | 57 (3.3%) |
| $75,000 to $99,999 | 1,353 (99.1%) | 13 (0.9%) |
| $100,000 and over | 2,849 (90.9%) | 284 (9.1%) |
Public vs Private Health Insurance Coverage by Age in Bath
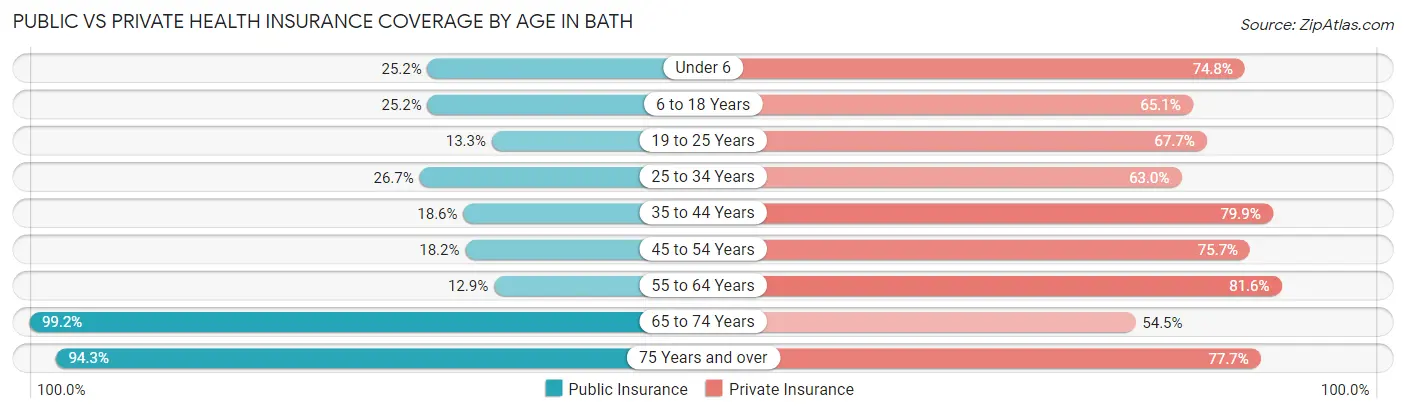
| Age Bracket | Public Insurance | Private Insurance |
| Under 6 | 96 (25.2%) | 285 (74.8%) |
| 6 to 18 Years | 328 (25.2%) | 847 (65.1%) |
| 19 to 25 Years | 109 (13.3%) | 556 (67.7%) |
| 25 to 34 Years | 267 (26.7%) | 630 (63.0%) |
| 35 to 44 Years | 185 (18.6%) | 797 (79.9%) |
| 45 to 54 Years | 204 (18.2%) | 849 (75.7%) |
| 55 to 64 Years | 144 (12.9%) | 912 (81.6%) |
| 65 to 74 Years | 1,225 (99.2%) | 673 (54.5%) |
| 75 Years and over | 673 (94.3%) | 555 (77.7%) |
| Total | 3,231 (37.2%) | 6,104 (70.3%) |
Disability Status by Sex by Age in Bath
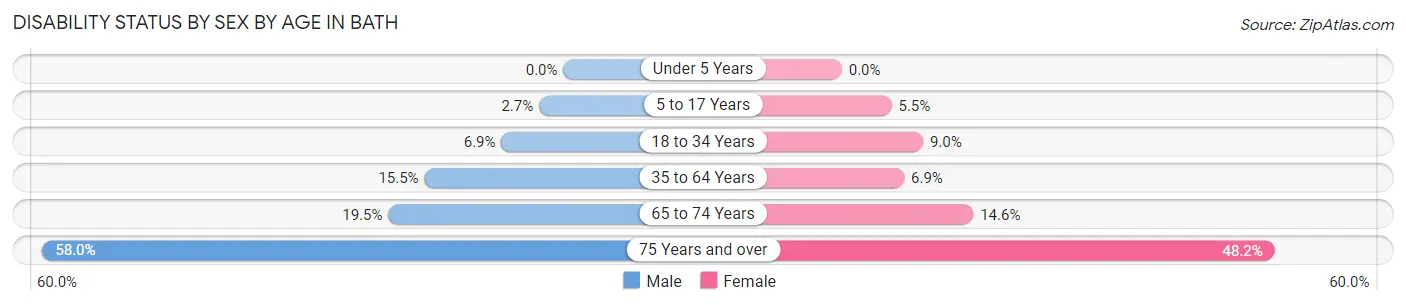
| Age Bracket | Male | Female |
| Under 5 Years | 0 (0.0%) | 0 (0.0%) |
| 5 to 17 Years | 22 (2.7%) | 27 (5.5%) |
| 18 to 34 Years | 64 (6.9%) | 86 (9.0%) |
| 35 to 64 Years | 240 (15.5%) | 117 (6.9%) |
| 65 to 74 Years | 109 (19.5%) | 99 (14.6%) |
| 75 Years and over | 141 (58.0%) | 227 (48.2%) |
Disability Class by Sex by Age in Bath
Disability Class: Hearing Difficulty
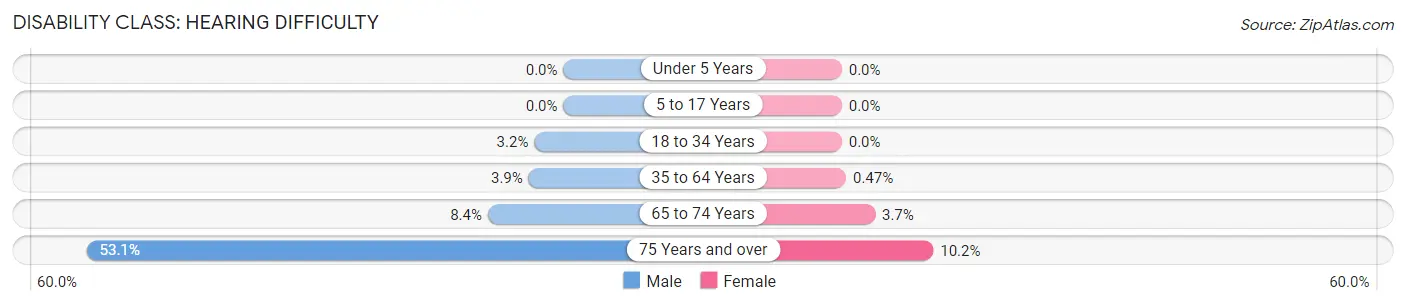
| Age Bracket | Male | Female |
| Under 5 Years | 0 (0.0%) | 0 (0.0%) |
| 5 to 17 Years | 0 (0.0%) | 0 (0.0%) |
| 18 to 34 Years | 30 (3.2%) | 0 (0.0%) |
| 35 to 64 Years | 60 (3.9%) | 8 (0.5%) |
| 65 to 74 Years | 47 (8.4%) | 25 (3.7%) |
| 75 Years and over | 129 (53.1%) | 48 (10.2%) |
Disability Class: Vision Difficulty
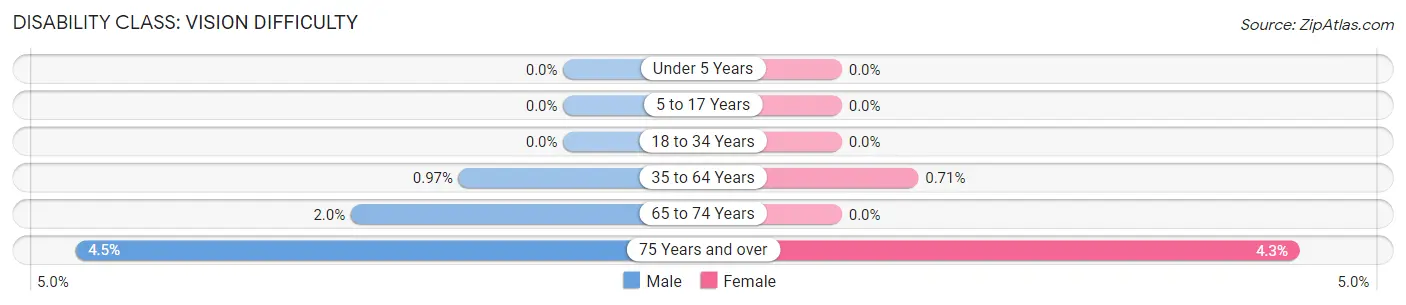
| Age Bracket | Male | Female |
| Under 5 Years | 0 (0.0%) | 0 (0.0%) |
| 5 to 17 Years | 0 (0.0%) | 0 (0.0%) |
| 18 to 34 Years | 0 (0.0%) | 0 (0.0%) |
| 35 to 64 Years | 15 (1.0%) | 12 (0.7%) |
| 65 to 74 Years | 11 (2.0%) | 0 (0.0%) |
| 75 Years and over | 11 (4.5%) | 20 (4.3%) |
Disability Class: Cognitive Difficulty
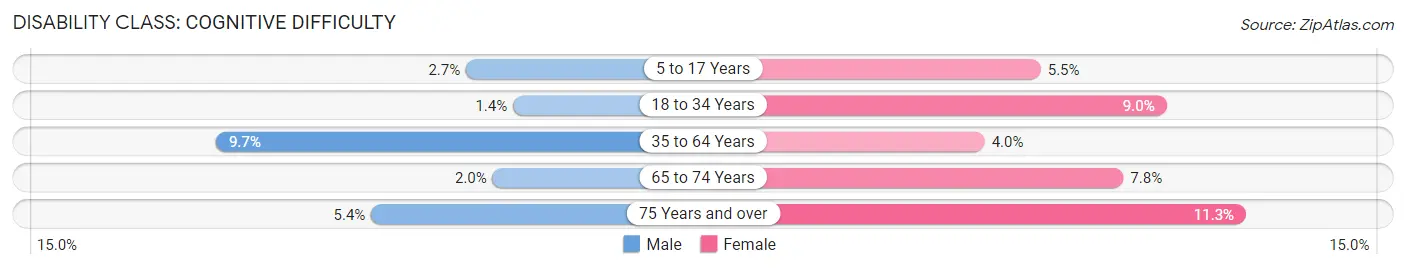
| Age Bracket | Male | Female |
| 5 to 17 Years | 22 (2.7%) | 27 (5.5%) |
| 18 to 34 Years | 13 (1.4%) | 86 (9.0%) |
| 35 to 64 Years | 150 (9.7%) | 67 (4.0%) |
| 65 to 74 Years | 11 (2.0%) | 53 (7.8%) |
| 75 Years and over | 13 (5.3%) | 53 (11.3%) |
Disability Class: Ambulatory Difficulty
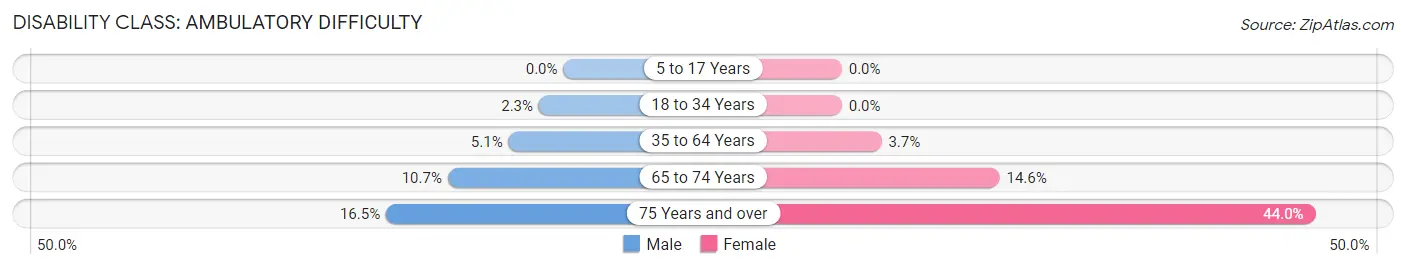
| Age Bracket | Male | Female |
| 5 to 17 Years | 0 (0.0%) | 0 (0.0%) |
| 18 to 34 Years | 21 (2.3%) | 0 (0.0%) |
| 35 to 64 Years | 79 (5.1%) | 62 (3.7%) |
| 65 to 74 Years | 60 (10.7%) | 99 (14.6%) |
| 75 Years and over | 40 (16.5%) | 207 (44.0%) |
Disability Class: Self-Care Difficulty
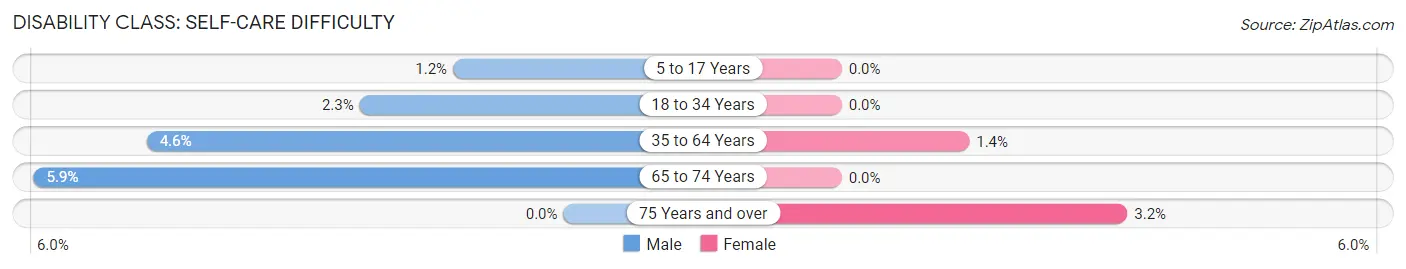
| Age Bracket | Male | Female |
| 5 to 17 Years | 10 (1.2%) | 0 (0.0%) |
| 18 to 34 Years | 21 (2.3%) | 0 (0.0%) |
| 35 to 64 Years | 72 (4.6%) | 24 (1.4%) |
| 65 to 74 Years | 33 (5.9%) | 0 (0.0%) |
| 75 Years and over | 0 (0.0%) | 15 (3.2%) |
Technology Access in Bath
Computing Device Access in Bath
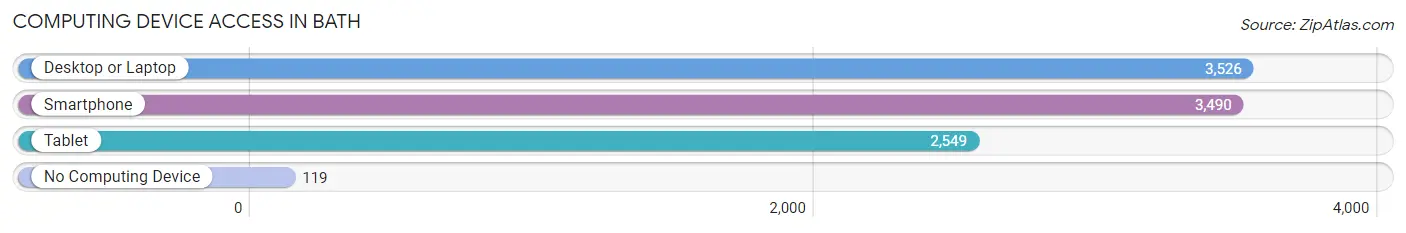
| Device Type | # Households | % Households |
| Desktop or Laptop | 3,526 | 87.8% |
| Smartphone | 3,490 | 87.0% |
| Tablet | 2,549 | 63.5% |
| No Computing Device | 119 | 3.0% |
| Total | 4,014 | 100.0% |
Internet Access in Bath
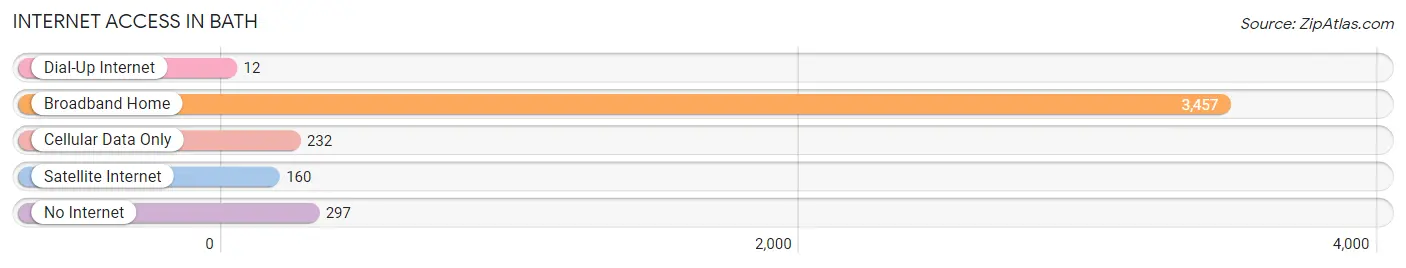
| Internet Type | # Households | % Households |
| Dial-Up Internet | 12 | 0.3% |
| Broadband Home | 3,457 | 86.1% |
| Cellular Data Only | 232 | 5.8% |
| Satellite Internet | 160 | 4.0% |
| No Internet | 297 | 7.4% |
| Total | 4,014 | 100.0% |
Bath Summary
Bath, Maine is a city located in Sagadahoc County, in the state of Maine. It is situated on the Kennebec River, approximately 30 miles upriver from the Atlantic Ocean. The city is the county seat of Sagadahoc County and is part of the Portland-South Portland-Biddeford, Maine metropolitan statistical area. As of the 2010 census, the city had a population of 8,514.
History
The area that is now Bath was originally inhabited by the Abenaki people. The first European settlers arrived in the area in 1607, when the English explorer George Weymouth explored the area. The first permanent settlement was established in 1660, when the area was part of the Massachusetts Bay Colony. The town was incorporated in 1781 and named after Bath, England.
In the 19th century, Bath became an important shipbuilding center. The city was home to the Bath Iron Works, which was founded in 1884 and became one of the largest shipbuilding companies in the United States. The company built many of the ships used by the U.S. Navy during World War II.
Geography
Bath is located at 43°54'N 69°51'W (43.9000, -69.8500). According to the United States Census Bureau, the city has a total area of 11.2 square miles (29.0 km2), of which 10.9 square miles (28.2 km2) is land and 0.3 square miles (0.8 km2) is water.
The city is situated on the Kennebec River, which is a tidal estuary. The city is located on the east side of the river, and is bordered by the towns of West Bath to the north, Woolwich to the east, Arrowsic to the south, and Phippsburg to the west.
Economy
Bath is the home of the Bath Iron Works, which is one of the largest shipbuilding companies in the United States. The company is owned by General Dynamics and employs over 5,000 people. The company builds ships for the U.S. Navy, as well as commercial vessels.
The city is also home to several other industries, including paper mills, boat builders, and machine shops. The city is also home to several retail stores, restaurants, and other businesses.
Demographics
As of the 2010 census, there were 8,514 people, 3,541 households, and 2,092 families residing in the city. The population density was 781.3 people per square mile (301.7/km2). There were 3,890 housing units at an average density of 355.7 per square mile (137.4/km2). The racial makeup of the city was 94.2% White, 1.3% African American, 0.4% Native American, 0.9% Asian, 0.1% Pacific Islander, 0.7% from other races, and 2.4% from two or more races. Hispanic or Latino of any race were 2.2% of the population.
There were 3,541 households, out of which 28.2% had children under the age of 18 living with them, 43.2% were married couples living together, 12.7% had a female householder with no husband present, and 39.2% were non-families. 32.2% of all households were made up of individuals, and 13.2% had someone living alone who was 65 years of age or older. The average household size was 2.30 and the average family size was 2.90.
In the city, the population was spread out, with 23.2% under the age of 18, 8.2% from 18 to 24, 28.2% from 25 to 44, 24.2% from 45 to 64, and 16.2% who were 65 years of age or older. The median age was 38 years. For every 100 females, there were 91.2 males. For every 100 females age 18 and over, there were 87.7 males.
The median income for a household in the city was $37,813, and the median income for a family was $45,938. Males had a median income of $35,945 versus $26,945 for females. The per capita income for the city was $20,945. About 9.2% of families and 11.7% of the population were below the poverty line, including 15.2% of those under age 18 and 9.2% of those age 65 or over.
Common Questions
What is Per Capita Income in Bath?
Per Capita income in Bath is $36,471.
What is the Median Family Income in Bath?
Median Family Income in Bath is $85,741.
What is the Median Household income in Bath?
Median Household Income in Bath is $63,023.
What is Income or Wage Gap in Bath?
Income or Wage Gap in Bath is 37.2%.
Women in Bath earn 62.8 cents for every dollar earned by a man.
What is Family Income Deficit in Bath?
Family Income Deficit in Bath is $10,393.
Families that are below poverty line in Bath earn $10,393 less on average than the poverty threshold level.
What is Inequality or Gini Index in Bath?
Inequality or Gini Index in Bath is 0.42.
What is the Total Population of Bath?
Total Population of Bath is 8,775.
What is the Total Male Population of Bath?
Total Male Population of Bath is 4,327.
What is the Total Female Population of Bath?
Total Female Population of Bath is 4,448.
What is the Ratio of Males per 100 Females in Bath?
There are 97.28 Males per 100 Females in Bath.
What is the Ratio of Females per 100 Males in Bath?
There are 102.80 Females per 100 Males in Bath.
What is the Median Population Age in Bath?
Median Population Age in Bath is 43.5 Years.
What is the Average Family Size in Bath
Average Family Size in Bath is 2.8 People.
What is the Average Household Size in Bath
Average Household Size in Bath is 2.2 People.
How Large is the Labor Force in Bath?
There are 4,576 People in the Labor Forcein in Bath.
What is the Percentage of People in the Labor Force in Bath?
63.2% of People are in the Labor Force in Bath.
What is the Unemployment Rate in Bath?
Unemployment Rate in Bath is 5.2%.