Milford, ME Map & Demographics
Milford Map
Milford Overview
$29,023
PER CAPITA INCOME
$73,932
AVG FAMILY INCOME
$59,053
AVG HOUSEHOLD INCOME
5.4%
WAGE / INCOME GAP [ % ]
94.6¢/ $1
WAGE / INCOME GAP [ $ ]
0.41
INEQUALITY / GINI INDEX
2,270
TOTAL POPULATION
1,383
MALE POPULATION
887
FEMALE POPULATION
155.92
MALES / 100 FEMALES
64.14
FEMALES / 100 MALES
42.0
MEDIAN AGE
3.0
AVG FAMILY SIZE
2.4
AVG HOUSEHOLD SIZE
1,196
LABOR FORCE [ PEOPLE ]
60.5%
PERCENT IN LABOR FORCE
3.5%
UNEMPLOYMENT RATE
Milford Zip Codes
Milford Area Codes
Income in Milford
Income Overview in Milford
Per Capita Income in Milford is $29,023, while median incomes of families and households are $73,932 and $59,053 respectively.
| Characteristic | Number | Measure |
| Per Capita Income | 2,270 | $29,023 |
| Median Family Income | 505 | $73,932 |
| Mean Family Income | 505 | $77,413 |
| Median Household Income | 955 | $59,053 |
| Mean Household Income | 955 | $68,205 |
| Income Deficit | 505 | $0 |
| Wage / Income Gap (%) | 2,270 | 5.36% |
| Wage / Income Gap ($) | 2,270 | 94.64¢ per $1 |
| Gini / Inequality Index | 2,270 | 0.41 |
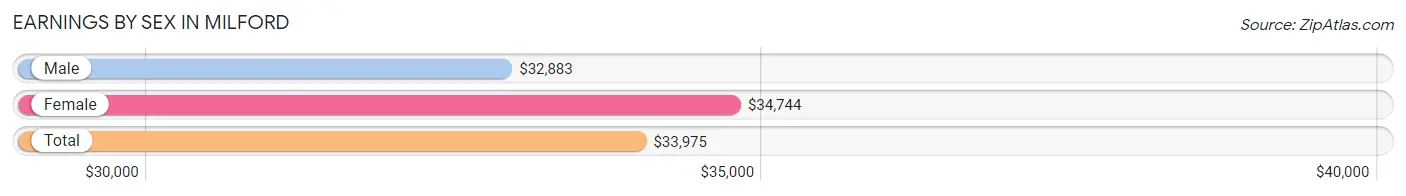
Earnings by Sex in Milford
Average Earnings in Milford are $33,975, $32,883 for men and $34,744 for women, a difference of 5.4%.
| Sex | Number | Average Earnings |
| Male | 703 (58.0%) | $32,883 |
| Female | 510 (42.0%) | $34,744 |
| Total | 1,213 (100.0%) | $33,975 |
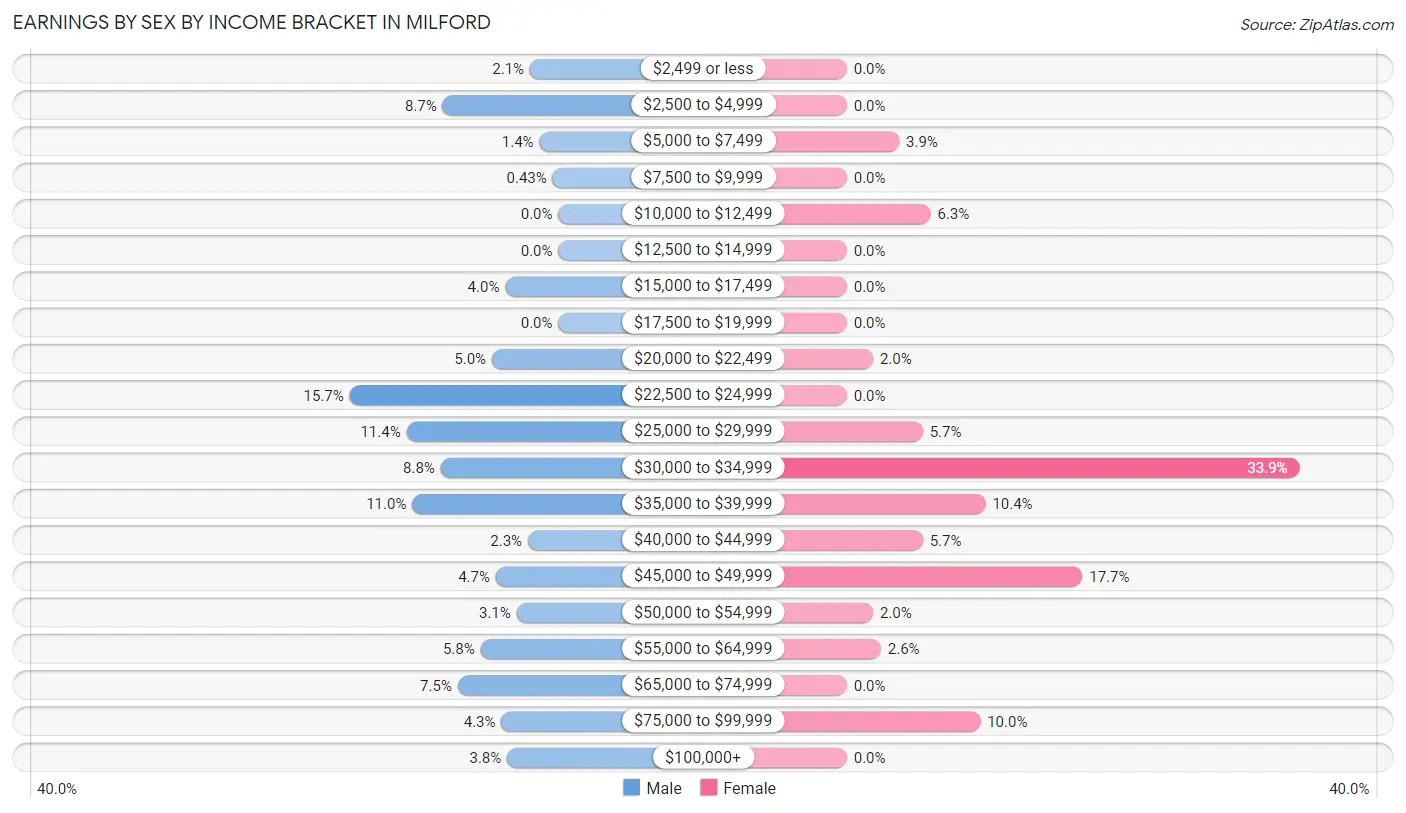
Earnings by Sex by Income Bracket in Milford
The most common earnings brackets in Milford are $22,500 to $24,999 for men (110 | 15.7%) and $30,000 to $34,999 for women (173 | 33.9%).
| Income | Male | Female |
| $2,499 or less | 15 (2.1%) | 0 (0.0%) |
| $2,500 to $4,999 | 61 (8.7%) | 0 (0.0%) |
| $5,000 to $7,499 | 10 (1.4%) | 20 (3.9%) |
| $7,500 to $9,999 | 3 (0.4%) | 0 (0.0%) |
| $10,000 to $12,499 | 0 (0.0%) | 32 (6.3%) |
| $12,500 to $14,999 | 0 (0.0%) | 0 (0.0%) |
| $15,000 to $17,499 | 28 (4.0%) | 0 (0.0%) |
| $17,500 to $19,999 | 0 (0.0%) | 0 (0.0%) |
| $20,000 to $22,499 | 35 (5.0%) | 10 (2.0%) |
| $22,500 to $24,999 | 110 (15.7%) | 0 (0.0%) |
| $25,000 to $29,999 | 80 (11.4%) | 29 (5.7%) |
| $30,000 to $34,999 | 62 (8.8%) | 173 (33.9%) |
| $35,000 to $39,999 | 77 (11.0%) | 53 (10.4%) |
| $40,000 to $44,999 | 16 (2.3%) | 29 (5.7%) |
| $45,000 to $49,999 | 33 (4.7%) | 90 (17.6%) |
| $50,000 to $54,999 | 22 (3.1%) | 10 (2.0%) |
| $55,000 to $64,999 | 41 (5.8%) | 13 (2.5%) |
| $65,000 to $74,999 | 53 (7.5%) | 0 (0.0%) |
| $75,000 to $99,999 | 30 (4.3%) | 51 (10.0%) |
| $100,000+ | 27 (3.8%) | 0 (0.0%) |
| Total | 703 (100.0%) | 510 (100.0%) |
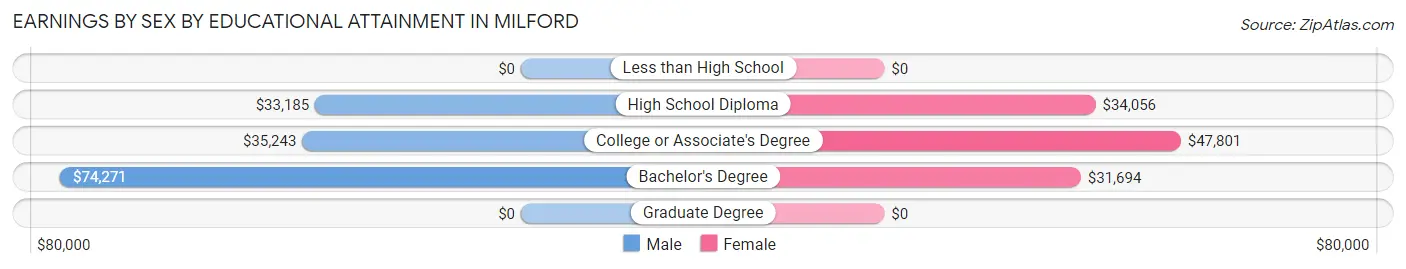
Earnings by Sex by Educational Attainment in Milford
Average earnings in Milford are $34,637 for men and $34,503 for women, a difference of 0.4%. Men with an educational attainment of bachelor's degree enjoy the highest average annual earnings of $74,271, while those with high school diploma education earn the least with $33,185. Women with an educational attainment of college or associate's degree earn the most with the average annual earnings of $47,801, while those with bachelor's degree education have the smallest earnings of $31,694.
| Educational Attainment | Male Income | Female Income |
| Less than High School | - | - |
| High School Diploma | $33,185 | $34,056 |
| College or Associate's Degree | $35,243 | $47,801 |
| Bachelor's Degree | $74,271 | $31,694 |
| Graduate Degree | - | - |
| Total | $34,637 | $34,503 |
Family Income in Milford
Family Income Brackets in Milford
According to the Milford family income data, there are 109 families falling into the $100,000 to $149,999 income range, which is the most common income bracket and makes up 21.6% of all families.
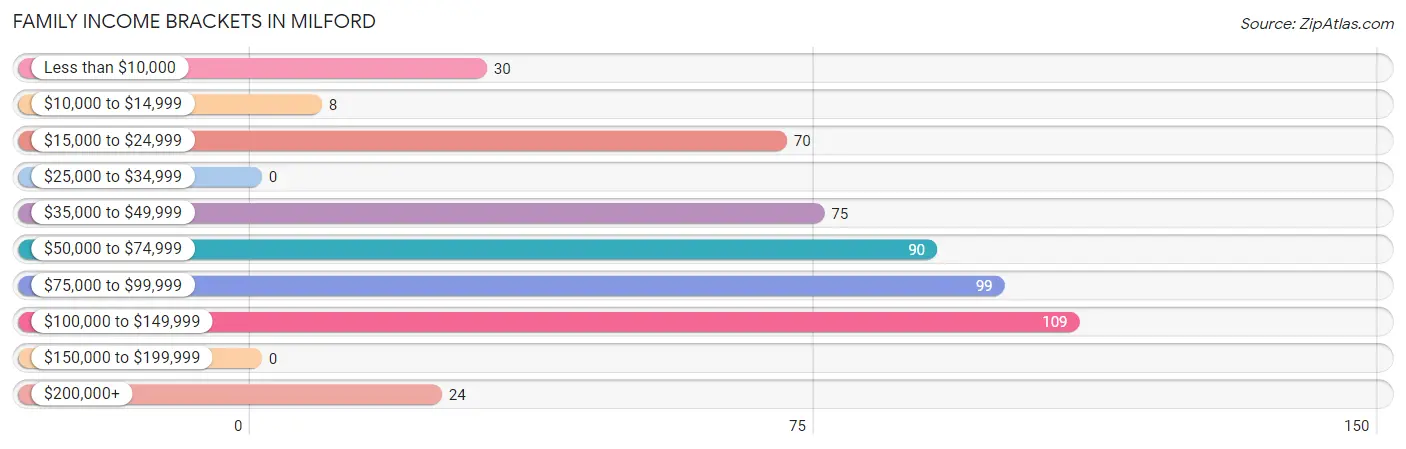
| Income Bracket | # Families | % Families |
| Less than $10,000 | 30 | 5.9% |
| $10,000 to $14,999 | 8 | 1.6% |
| $15,000 to $24,999 | 70 | 13.9% |
| $25,000 to $34,999 | 0 | 0.0% |
| $35,000 to $49,999 | 75 | 14.9% |
| $50,000 to $74,999 | 90 | 17.8% |
| $75,000 to $99,999 | 99 | 19.6% |
| $100,000 to $149,999 | 109 | 21.6% |
| $150,000 to $199,999 | 0 | 0.0% |
| $200,000+ | 24 | 4.8% |
Family Income by Famaliy Size in Milford
2-person families (256 | 50.7%) account for the highest median family income in Milford with $78,879 per family, while 2-person families (256 | 50.7%) have the highest median income of $39,440 per family member.
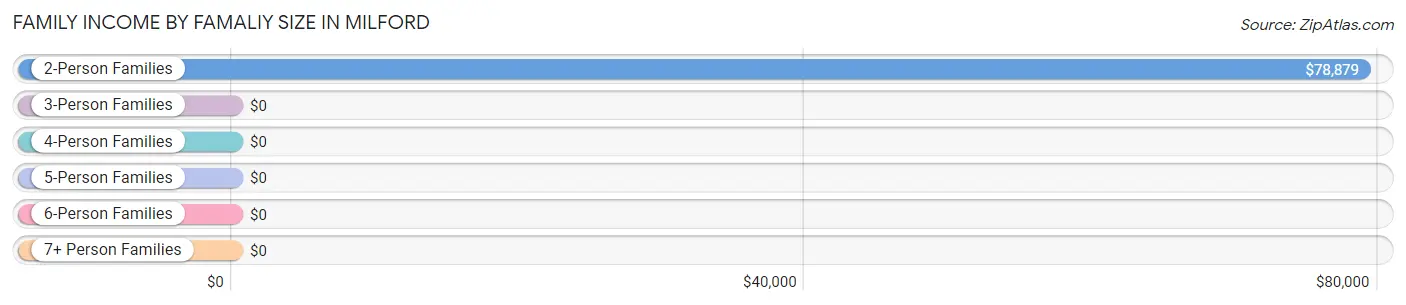
| Income Bracket | # Families | Median Income |
| 2-Person Families | 256 (50.7%) | $78,879 |
| 3-Person Families | 151 (29.9%) | $0 |
| 4-Person Families | 80 (15.8%) | $0 |
| 5-Person Families | 18 (3.6%) | $0 |
| 6-Person Families | 0 (0.0%) | $0 |
| 7+ Person Families | 0 (0.0%) | $0 |
| Total | 505 (100.0%) | $73,932 |
Family Income by Number of Earners in Milford
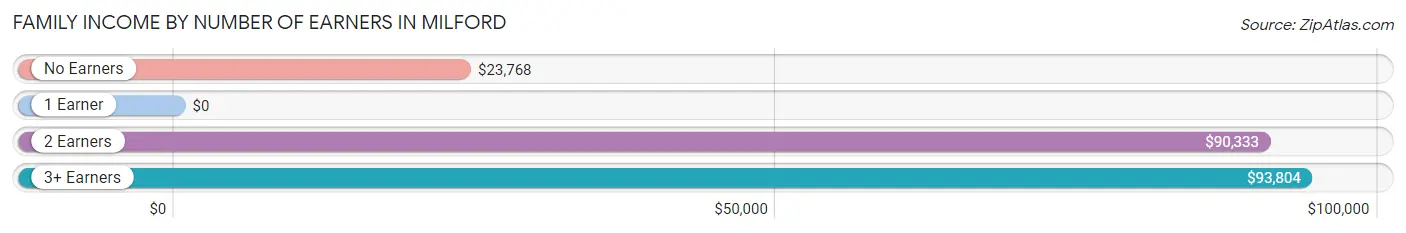
| Number of Earners | # Families | Median Income |
| No Earners | 147 (29.1%) | $23,768 |
| 1 Earner | 60 (11.9%) | $0 |
| 2 Earners | 240 (47.5%) | $90,333 |
| 3+ Earners | 58 (11.5%) | $93,804 |
| Total | 505 (100.0%) | $73,932 |
Household Income in Milford
Household Income Brackets in Milford
With 166 households falling in the category, the $75,000 to $99,999 income range is the most frequent in Milford, accounting for 17.4% of all households. In contrast, only 24 households (2.5%) fall into the $200,000+ income bracket, making it the least populous group.
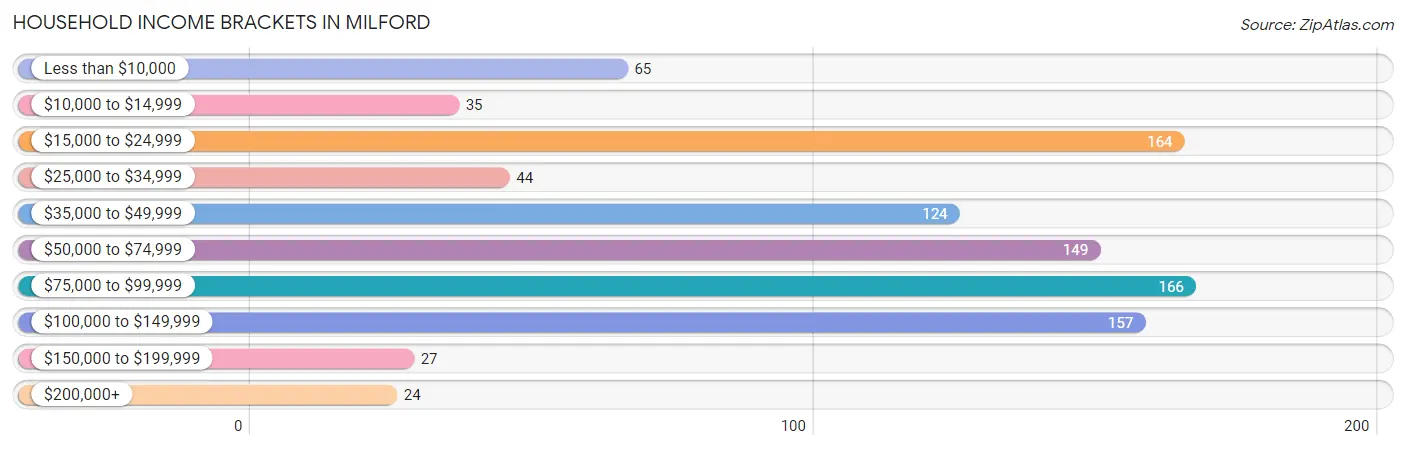
| Income Bracket | # Households | % Households |
| Less than $10,000 | 65 | 6.8% |
| $10,000 to $14,999 | 35 | 3.7% |
| $15,000 to $24,999 | 164 | 17.2% |
| $25,000 to $34,999 | 44 | 4.6% |
| $35,000 to $49,999 | 124 | 13.0% |
| $50,000 to $74,999 | 149 | 15.6% |
| $75,000 to $99,999 | 166 | 17.4% |
| $100,000 to $149,999 | 157 | 16.4% |
| $150,000 to $199,999 | 27 | 2.8% |
| $200,000+ | 24 | 2.5% |
Household Income by Householder Age in Milford
The median household income in Milford is $59,053, with the highest median household income of $61,654 found in the 25 to 44 years age bracket for the primary householder. A total of 291 households (30.5%) fall into this category.
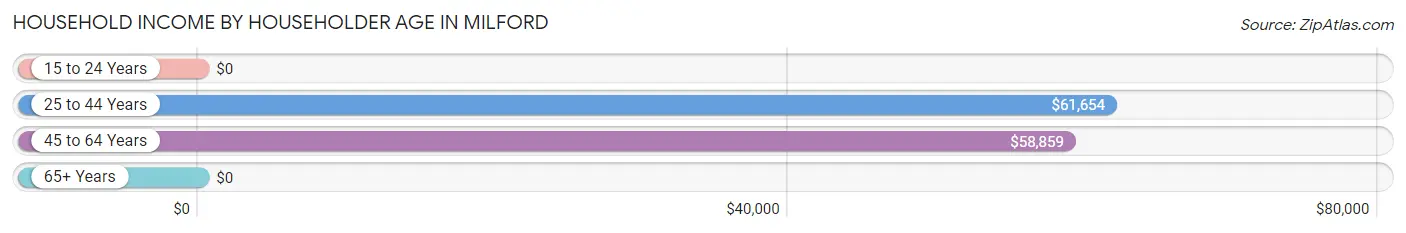
| Income Bracket | # Households | Median Income |
| 15 to 24 Years | 0 (0.0%) | $0 |
| 25 to 44 Years | 291 (30.5%) | $61,654 |
| 45 to 64 Years | 421 (44.1%) | $58,859 |
| 65+ Years | 243 (25.5%) | $0 |
| Total | 955 (100.0%) | $59,053 |
Poverty in Milford
Income Below Poverty by Sex and Age in Milford
With 8.5% poverty level for males and 11.9% for females among the residents of Milford, 15 year old males and 5 year old females are the most vulnerable to poverty, with 14 males (100.0%) and 26 females (100.0%) in their respective age groups living below the poverty level.
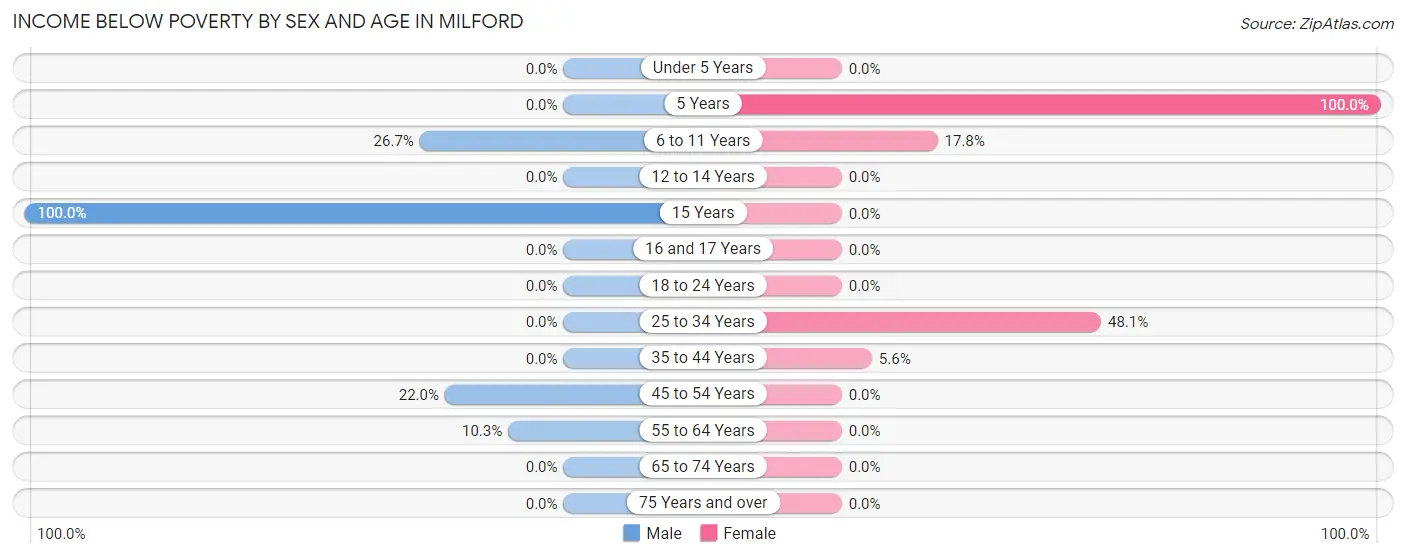
| Age Bracket | Male | Female |
| Under 5 Years | 0 (0.0%) | 0 (0.0%) |
| 5 Years | 0 (0.0%) | 26 (100.0%) |
| 6 to 11 Years | 32 (26.7%) | 8 (17.8%) |
| 12 to 14 Years | 0 (0.0%) | 0 (0.0%) |
| 15 Years | 14 (100.0%) | 0 (0.0%) |
| 16 and 17 Years | 0 (0.0%) | 0 (0.0%) |
| 18 to 24 Years | 0 (0.0%) | 0 (0.0%) |
| 25 to 34 Years | 0 (0.0%) | 64 (48.1%) |
| 35 to 44 Years | 0 (0.0%) | 8 (5.6%) |
| 45 to 54 Years | 35 (22.0%) | 0 (0.0%) |
| 55 to 64 Years | 35 (10.3%) | 0 (0.0%) |
| 65 to 74 Years | 0 (0.0%) | 0 (0.0%) |
| 75 Years and over | 0 (0.0%) | 0 (0.0%) |
| Total | 116 (8.5%) | 106 (11.9%) |
Income Above Poverty by Sex and Age in Milford
According to the poverty statistics in Milford, males aged under 5 years and females aged 12 to 14 years are the age groups that are most secure financially, with 100.0% of males and 100.0% of females in these age groups living above the poverty line.
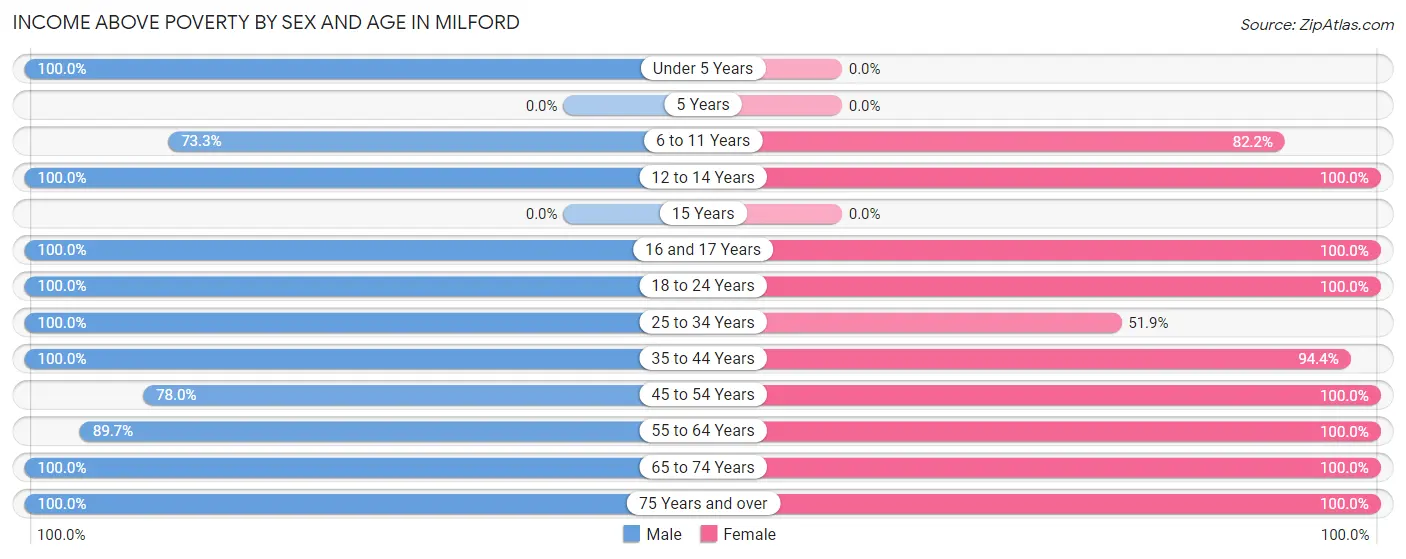
| Age Bracket | Male | Female |
| Under 5 Years | 27 (100.0%) | 0 (0.0%) |
| 5 Years | 0 (0.0%) | 0 (0.0%) |
| 6 to 11 Years | 88 (73.3%) | 37 (82.2%) |
| 12 to 14 Years | 20 (100.0%) | 20 (100.0%) |
| 15 Years | 0 (0.0%) | 0 (0.0%) |
| 16 and 17 Years | 1 (100.0%) | 20 (100.0%) |
| 18 to 24 Years | 128 (100.0%) | 37 (100.0%) |
| 25 to 34 Years | 382 (100.0%) | 69 (51.9%) |
| 35 to 44 Years | 56 (100.0%) | 135 (94.4%) |
| 45 to 54 Years | 124 (78.0%) | 87 (100.0%) |
| 55 to 64 Years | 306 (89.7%) | 145 (100.0%) |
| 65 to 74 Years | 81 (100.0%) | 174 (100.0%) |
| 75 Years and over | 33 (100.0%) | 57 (100.0%) |
| Total | 1,246 (91.5%) | 781 (88.0%) |
Income Below Poverty Among Married-Couple Families in Milford
| Children | Above Poverty | Below Poverty |
| No Children | 172 (100.0%) | 0 (0.0%) |
| 1 or 2 Children | 90 (100.0%) | 0 (0.0%) |
| 3 or 4 Children | 0 (0.0%) | 0 (0.0%) |
| 5 or more Children | 0 (0.0%) | 0 (0.0%) |
| Total | 262 (100.0%) | 0 (0.0%) |
Income Below Poverty Among Single-Parent Households in Milford
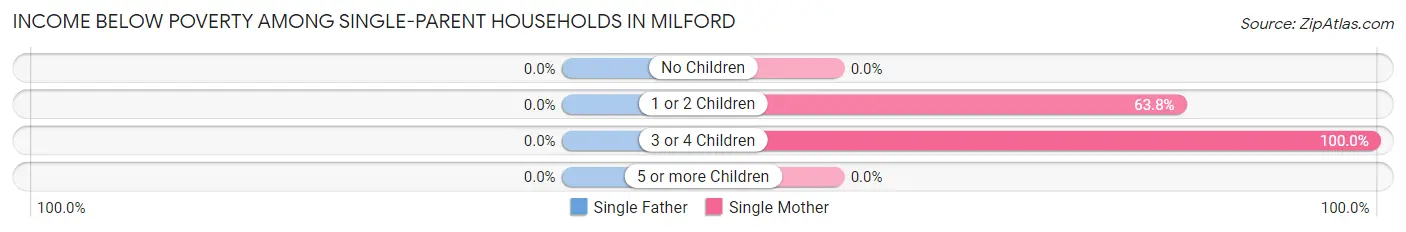
| Children | Single Father | Single Mother |
| No Children | 0 (0.0%) | 0 (0.0%) |
| 1 or 2 Children | 0 (0.0%) | 30 (63.8%) |
| 3 or 4 Children | 0 (0.0%) | 8 (100.0%) |
| 5 or more Children | 0 (0.0%) | 0 (0.0%) |
| Total | 0 (0.0%) | 38 (38.8%) |
Income Below Poverty Among Married-Couple vs Single-Parent Households in Milford
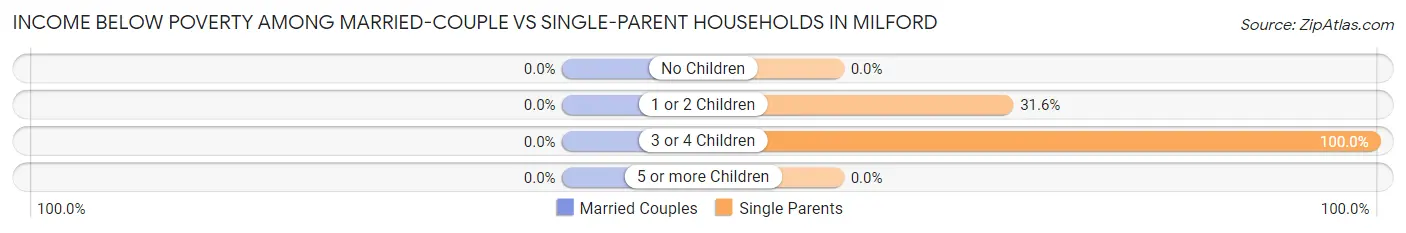
| Children | Married-Couple Families | Single-Parent Households |
| No Children | 0 (0.0%) | 0 (0.0%) |
| 1 or 2 Children | 0 (0.0%) | 30 (31.6%) |
| 3 or 4 Children | 0 (0.0%) | 8 (100.0%) |
| 5 or more Children | 0 (0.0%) | 0 (0.0%) |
| Total | 0 (0.0%) | 38 (15.6%) |
Race in Milford
The most populous races in Milford are White / Caucasian (2,055 | 90.5%), Hispanic or Latino (101 | 4.4%), and Asian (82 | 3.6%).
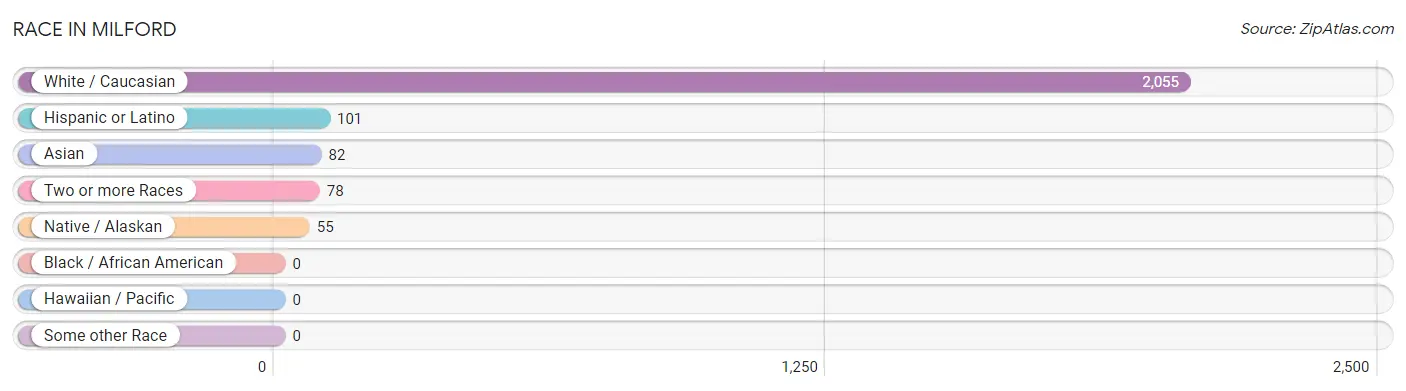
| Race | # Population | % Population |
| Asian | 82 | 3.6% |
| Black / African American | 0 | 0.0% |
| Hawaiian / Pacific | 0 | 0.0% |
| Hispanic or Latino | 101 | 4.4% |
| Native / Alaskan | 55 | 2.4% |
| White / Caucasian | 2,055 | 90.5% |
| Two or more Races | 78 | 3.4% |
| Some other Race | 0 | 0.0% |
| Total | 2,270 | 100.0% |
Ancestry in Milford
The most populous ancestries reported in Milford are English (777 | 34.2%), French (468 | 20.6%), Irish (229 | 10.1%), Burmese (82 | 3.6%), and Italian (74 | 3.3%), together accounting for 71.8% of all Milford residents.
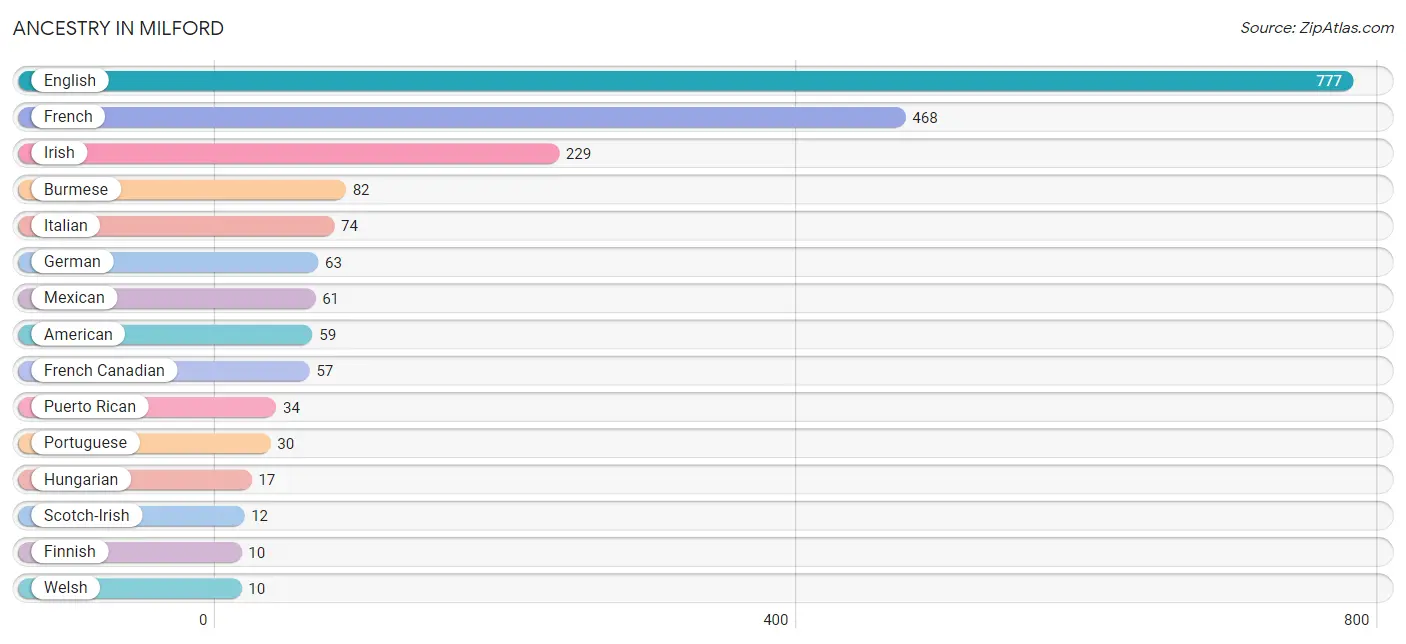
| Ancestry | # Population | % Population |
| American | 59 | 2.6% |
| Burmese | 82 | 3.6% |
| Cuban | 6 | 0.3% |
| English | 777 | 34.2% |
| Finnish | 10 | 0.4% |
| French | 468 | 20.6% |
| French Canadian | 57 | 2.5% |
| German | 63 | 2.8% |
| Hungarian | 17 | 0.7% |
| Irish | 229 | 10.1% |
| Italian | 74 | 3.3% |
| Mexican | 61 | 2.7% |
| Portuguese | 30 | 1.3% |
| Puerto Rican | 34 | 1.5% |
| Scotch-Irish | 12 | 0.5% |
| Welsh | 10 | 0.4% | View All 16 Rows |
Immigrants in Milford
The most numerous immigrant groups reported in Milford came from Asia (54 | 2.4%), Eastern Asia (54 | 2.4%), Korea (54 | 2.4%), and Canada (31 | 1.4%), together accounting for 8.5% of all Milford residents.
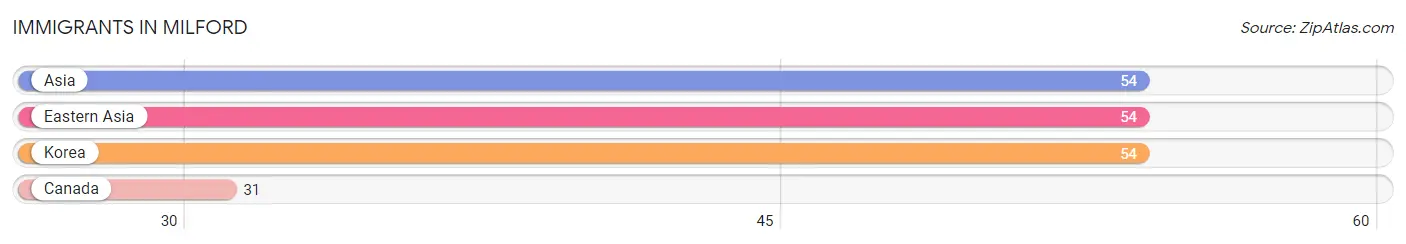
| Immigration Origin | # Population | % Population |
| Asia | 54 | 2.4% |
| Canada | 31 | 1.4% |
| Eastern Asia | 54 | 2.4% |
| Korea | 54 | 2.4% | View All 4 Rows |
Sex and Age in Milford
Sex and Age in Milford
The most populous age groups in Milford are 25 to 29 Years (273 | 19.7%) for men and 65 to 69 Years (90 | 10.2%) for women.
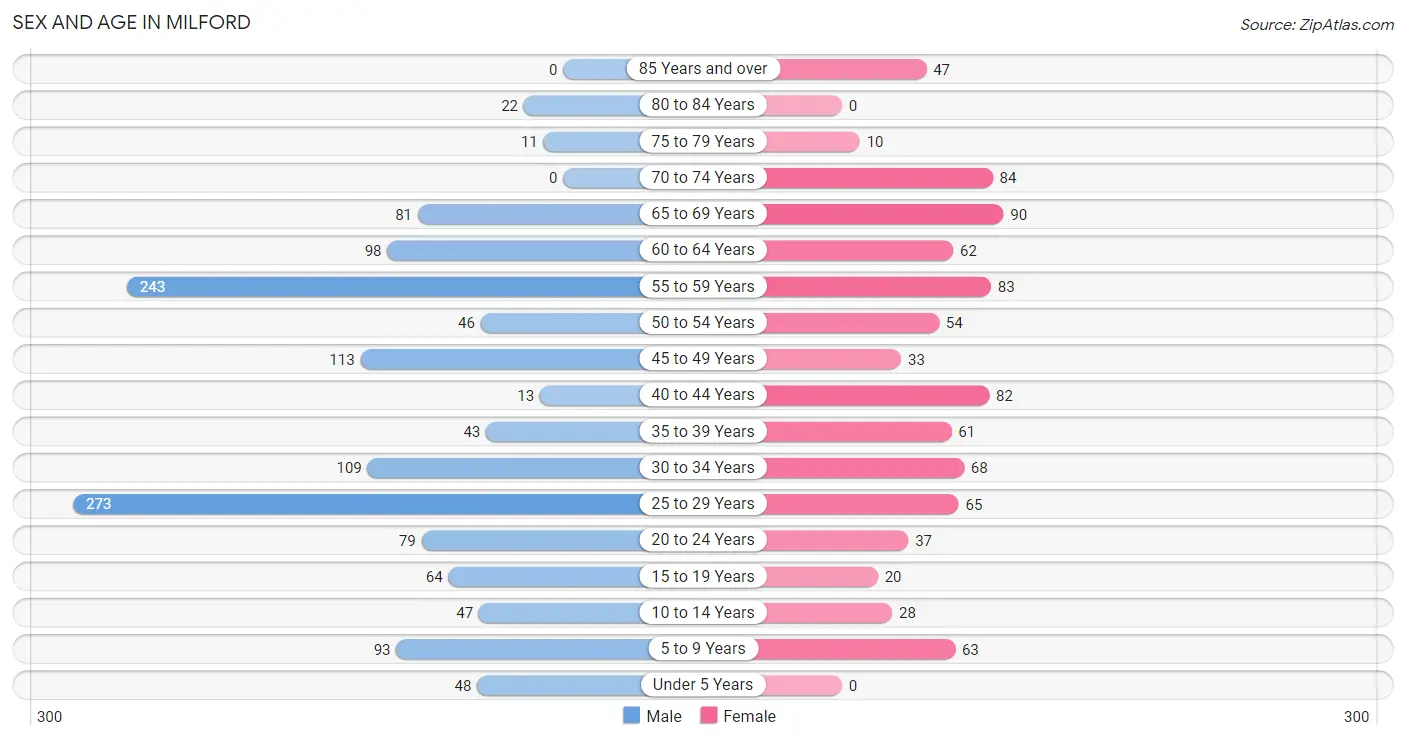
| Age Bracket | Male | Female |
| Under 5 Years | 48 (3.5%) | 0 (0.0%) |
| 5 to 9 Years | 93 (6.7%) | 63 (7.1%) |
| 10 to 14 Years | 47 (3.4%) | 28 (3.2%) |
| 15 to 19 Years | 64 (4.6%) | 20 (2.2%) |
| 20 to 24 Years | 79 (5.7%) | 37 (4.2%) |
| 25 to 29 Years | 273 (19.7%) | 65 (7.3%) |
| 30 to 34 Years | 109 (7.9%) | 68 (7.7%) |
| 35 to 39 Years | 43 (3.1%) | 61 (6.9%) |
| 40 to 44 Years | 13 (0.9%) | 82 (9.2%) |
| 45 to 49 Years | 113 (8.2%) | 33 (3.7%) |
| 50 to 54 Years | 46 (3.3%) | 54 (6.1%) |
| 55 to 59 Years | 243 (17.6%) | 83 (9.4%) |
| 60 to 64 Years | 98 (7.1%) | 62 (7.0%) |
| 65 to 69 Years | 81 (5.9%) | 90 (10.2%) |
| 70 to 74 Years | 0 (0.0%) | 84 (9.5%) |
| 75 to 79 Years | 11 (0.8%) | 10 (1.1%) |
| 80 to 84 Years | 22 (1.6%) | 0 (0.0%) |
| 85 Years and over | 0 (0.0%) | 47 (5.3%) |
| Total | 1,383 (100.0%) | 887 (100.0%) |
Families and Households in Milford
Median Family Size in Milford
The median family size in Milford is 2.95 persons per family, with single male/father families (145 | 28.7%) accounting for the largest median family size of 3.34 persons per family. On the other hand, married-couple families (262 | 51.9%) represent the smallest median family size with 2.77 persons per family.
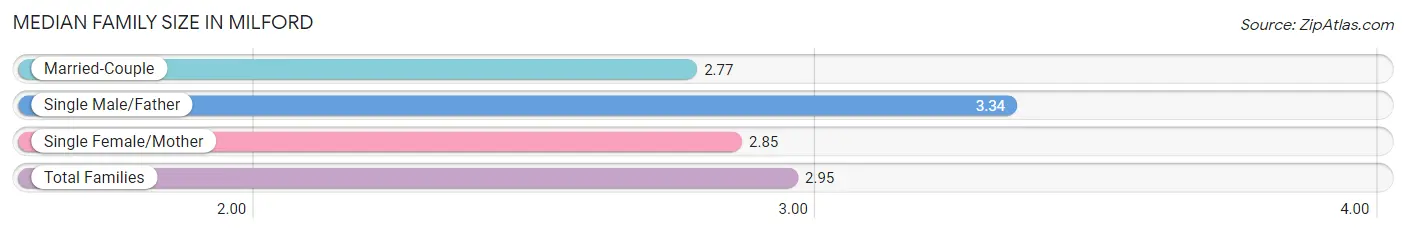
| Family Type | # Families | Family Size |
| Married-Couple | 262 (51.9%) | 2.77 |
| Single Male/Father | 145 (28.7%) | 3.34 |
| Single Female/Mother | 98 (19.4%) | 2.85 |
| Total Families | 505 (100.0%) | 2.95 |
Median Household Size in Milford
The median household size in Milford is 2.37 persons per household, with single male/father households (145 | 15.2%) accounting for the largest median household size of 4.29 persons per household. non-family households (450 | 47.1%) represent the smallest median household size with 1.35 persons per household.
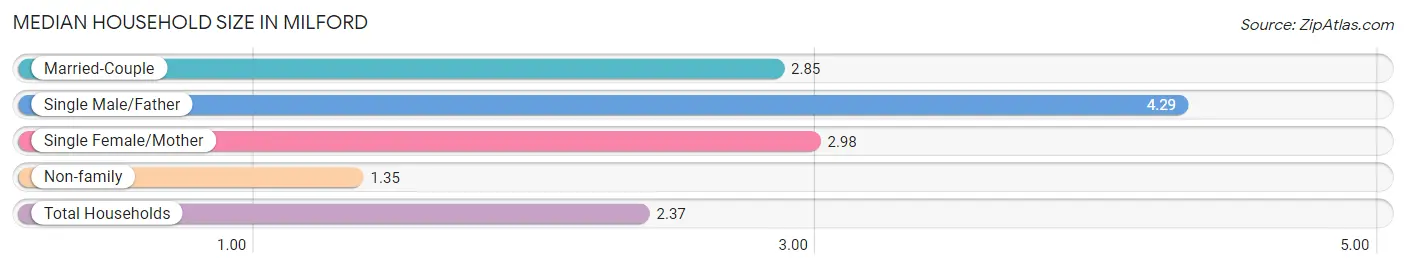
| Household Type | # Households | Household Size |
| Married-Couple | 262 (27.4%) | 2.85 |
| Single Male/Father | 145 (15.2%) | 4.29 |
| Single Female/Mother | 98 (10.3%) | 2.98 |
| Non-family | 450 (47.1%) | 1.35 |
| Total Households | 955 (100.0%) | 2.37 |
Household Size by Marriage Status in Milford
Out of a total of 955 households in Milford, 505 (52.9%) are family households, while 450 (47.1%) are nonfamily households. The most numerous type of family households are 3-person households, comprising 178, and the most common type of nonfamily households are 1-person households, comprising 327.
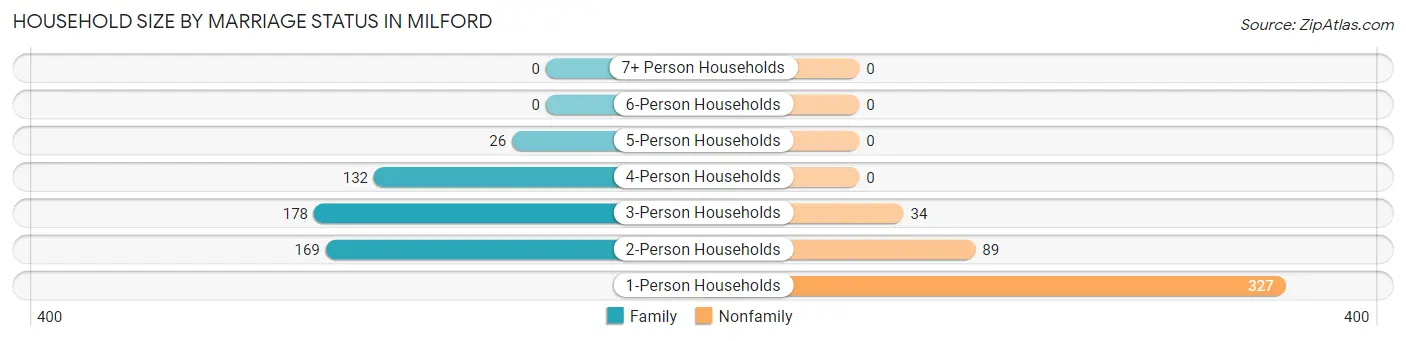
| Household Size | Family Households | Nonfamily Households |
| 1-Person Households | - | 327 (34.2%) |
| 2-Person Households | 169 (17.7%) | 89 (9.3%) |
| 3-Person Households | 178 (18.6%) | 34 (3.6%) |
| 4-Person Households | 132 (13.8%) | 0 (0.0%) |
| 5-Person Households | 26 (2.7%) | 0 (0.0%) |
| 6-Person Households | 0 (0.0%) | 0 (0.0%) |
| 7+ Person Households | 0 (0.0%) | 0 (0.0%) |
| Total | 505 (52.9%) | 450 (47.1%) |
Female Fertility in Milford
Fertility by Age in Milford
Average fertility rate in Milford is 77.0 births per 1,000 women. Women in the age bracket of 35 to 50 years have the highest fertility rate with 159.0 births per 1,000 women. Women in the age bracket of 35 to 50 years acount for 100.0% of all women with births.
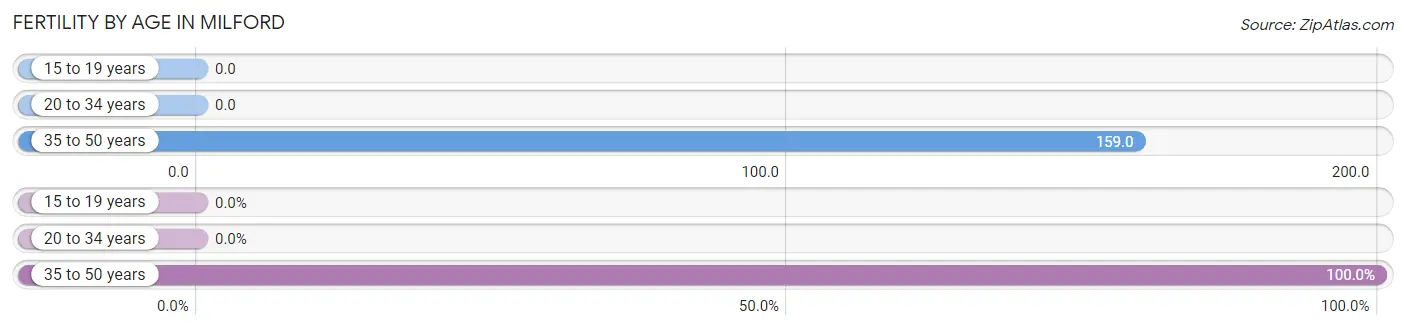
| Age Bracket | Women with Births | Births / 1,000 Women |
| 15 to 19 years | 0 (0.0%) | 0.0 |
| 20 to 34 years | 0 (0.0%) | 0.0 |
| 35 to 50 years | 28 (100.0%) | 159.0 |
| Total | 28 (100.0%) | 77.0 |
Fertility by Age by Marriage Status in Milford
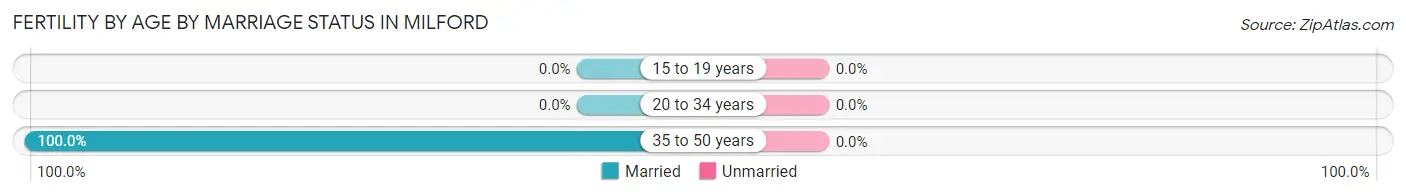
| Age Bracket | Married | Unmarried |
| 15 to 19 years | 0 (0.0%) | 0 (0.0%) |
| 20 to 34 years | 0 (0.0%) | 0 (0.0%) |
| 35 to 50 years | 28 (100.0%) | 0 (0.0%) |
| Total | 28 (100.0%) | 0 (0.0%) |
Fertility by Education in Milford
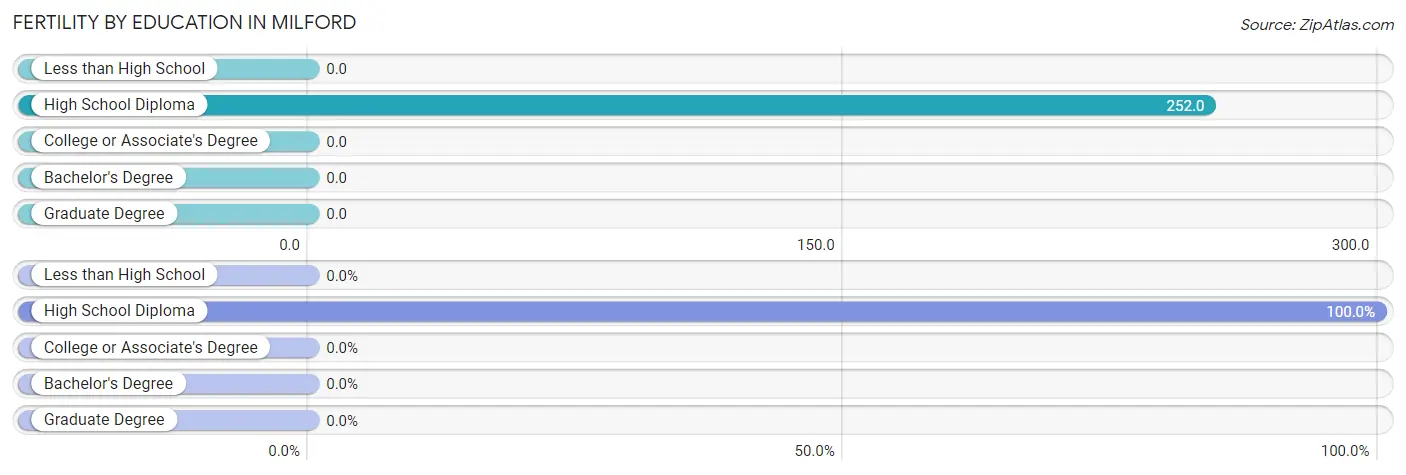
| Educational Attainment | Women with Births | Births / 1,000 Women |
| Less than High School | 0 (0.0%) | 0.0 |
| High School Diploma | 28 (100.0%) | 252.0 |
| College or Associate's Degree | 0 (0.0%) | 0.0 |
| Bachelor's Degree | 0 (0.0%) | 0.0 |
| Graduate Degree | 0 (0.0%) | 0.0 |
| Total | 28 (100.0%) | 77.0 |
Fertility by Education by Marriage Status in Milford
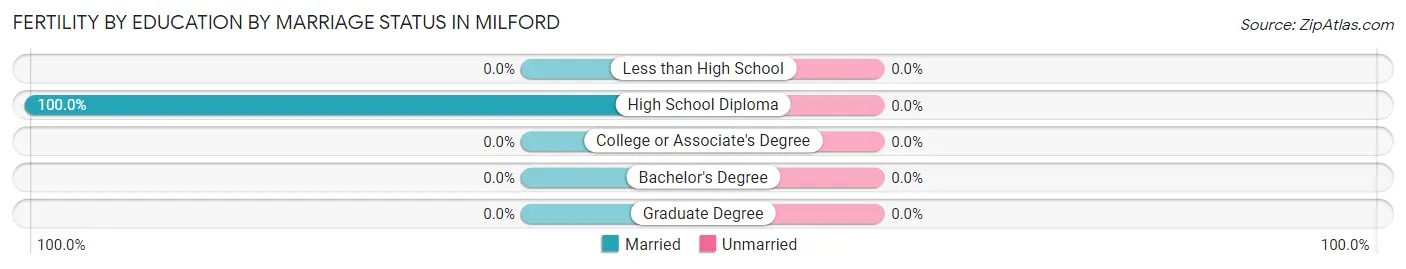
| Educational Attainment | Married | Unmarried |
| Less than High School | 0 (0.0%) | 0 (0.0%) |
| High School Diploma | 28 (100.0%) | 0 (0.0%) |
| College or Associate's Degree | 0 (0.0%) | 0 (0.0%) |
| Bachelor's Degree | 0 (0.0%) | 0 (0.0%) |
| Graduate Degree | 0 (0.0%) | 0 (0.0%) |
| Total | 28 (100.0%) | 0 (0.0%) |
Employment Characteristics in Milford
Employment by Class of Employer in Milford
Among the 1,155 employed individuals in Milford, private company employees (772 | 66.8%), not-for-profit organizations (141 | 12.2%), and local government employees (103 | 8.9%) make up the most common classes of employment.
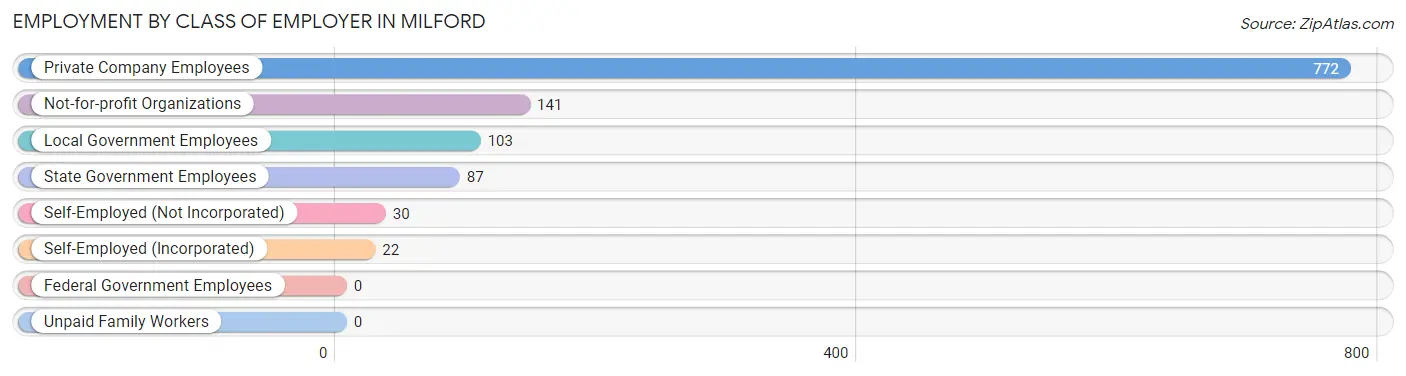
| Employer Class | # Employees | % Employees |
| Private Company Employees | 772 | 66.8% |
| Self-Employed (Incorporated) | 22 | 1.9% |
| Self-Employed (Not Incorporated) | 30 | 2.6% |
| Not-for-profit Organizations | 141 | 12.2% |
| Local Government Employees | 103 | 8.9% |
| State Government Employees | 87 | 7.5% |
| Federal Government Employees | 0 | 0.0% |
| Unpaid Family Workers | 0 | 0.0% |
| Total | 1,155 | 100.0% |
Employment Status by Age in Milford
According to the labor force statistics for Milford, out of the total population over 16 years of age (1,977), 60.5% or 1,196 individuals are in the labor force, with 3.5% or 42 of them unemployed. The age group with the highest labor force participation rate is 16 to 19 years, with 100.0% or 70 individuals in the labor force. Within the labor force, the 25 to 29 years age range has the highest percentage of unemployed individuals, with 20.0% or 34 of them being unemployed.
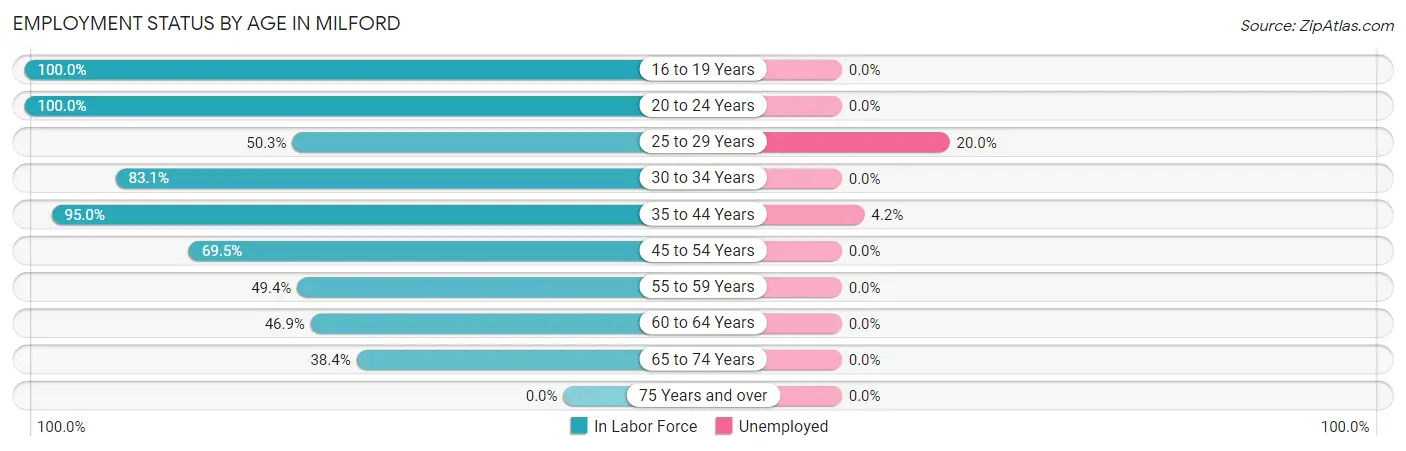
| Age Bracket | In Labor Force | Unemployed |
| 16 to 19 Years | 70 (100.0%) | 0 (0.0%) |
| 20 to 24 Years | 116 (100.0%) | 0 (0.0%) |
| 25 to 29 Years | 170 (50.3%) | 34 (20.0%) |
| 30 to 34 Years | 147 (83.1%) | 0 (0.0%) |
| 35 to 44 Years | 189 (95.0%) | 8 (4.2%) |
| 45 to 54 Years | 171 (69.5%) | 0 (0.0%) |
| 55 to 59 Years | 161 (49.4%) | 0 (0.0%) |
| 60 to 64 Years | 75 (46.9%) | 0 (0.0%) |
| 65 to 74 Years | 98 (38.4%) | 0 (0.0%) |
| 75 Years and over | 0 (0.0%) | 0 (0.0%) |
| Total | 1,196 (60.5%) | 42 (3.5%) |
Employment Status by Educational Attainment in Milford
According to labor force statistics for Milford, 63.1% of individuals (912) out of the total population between 25 and 64 years of age (1,446) are in the labor force, with 4.6% or 42 of them being unemployed. The group with the highest labor force participation rate are those with the educational attainment of bachelor's degree or higher, with 83.7% or 180 individuals in the labor force. Within the labor force, individuals with high school diploma education have the highest percentage of unemployment, with 7.4% or 34 of them being unemployed.
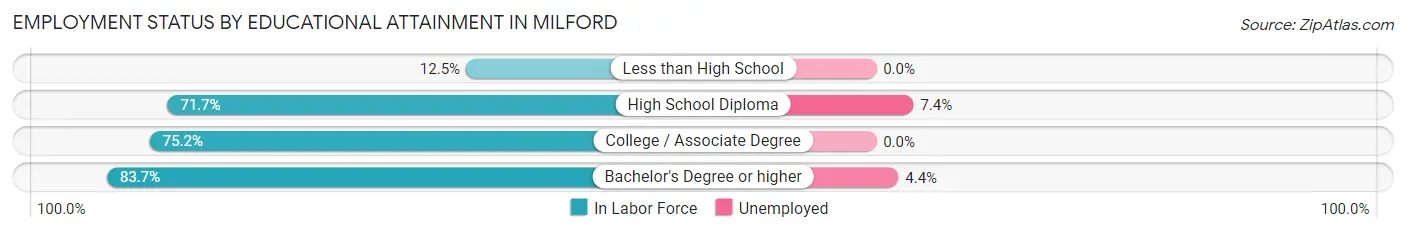
| Educational Attainment | In Labor Force | Unemployed |
| Less than High School | 34 (12.5%) | 0 (0.0%) |
| High School Diploma | 457 (71.7%) | 47 (7.4%) |
| College / Associate Degree | 242 (75.2%) | 0 (0.0%) |
| Bachelor's Degree or higher | 180 (83.7%) | 9 (4.4%) |
| Total | 912 (63.1%) | 67 (4.6%) |
Employment Occupations by Sex in Milford
Management, Business, Science and Arts Occupations
The most common Management, Business, Science and Arts occupations in Milford are Management (63 | 5.4%), Business & Financial (54 | 4.7%), Community & Social Service (33 | 2.9%), Education, Arts & Media (23 | 2.0%), and Health Diagnosing & Treating (18 | 1.6%).
Management, Business, Science and Arts Occupations by Sex
Within the Management, Business, Science and Arts occupations in Milford, the most male-oriented occupations are Management (84.1%), Business & Financial (68.5%), and Education, Arts & Media (52.2%), while the most female-oriented occupations are Computers, Engineering & Science (100.0%), Computers & Mathematics (100.0%), and Education Instruction & Library (100.0%).
| Occupation | Male | Female |
| Management | 53 (84.1%) | 10 (15.9%) |
| Business & Financial | 37 (68.5%) | 17 (31.5%) |
| Computers, Engineering & Science | 0 (0.0%) | 9 (100.0%) |
| Computers & Mathematics | 0 (0.0%) | 9 (100.0%) |
| Architecture & Engineering | 0 (0.0%) | 0 (0.0%) |
| Life, Physical & Social Science | 0 (0.0%) | 0 (0.0%) |
| Community & Social Service | 12 (36.4%) | 21 (63.6%) |
| Education, Arts & Media | 12 (52.2%) | 11 (47.8%) |
| Legal Services & Support | 0 (0.0%) | 0 (0.0%) |
| Education Instruction & Library | 0 (0.0%) | 10 (100.0%) |
| Arts, Media & Entertainment | 0 (0.0%) | 0 (0.0%) |
| Health Diagnosing & Treating | 0 (0.0%) | 18 (100.0%) |
| Health Technologists | 0 (0.0%) | 0 (0.0%) |
| Total (Category) | 102 (57.6%) | 75 (42.4%) |
| Total (Overall) | 675 (58.4%) | 480 (41.6%) |
Services Occupations
The most common Services occupations in Milford are Food Preparation & Serving (99 | 8.6%), Personal Care & Service (37 | 3.2%), Healthcare Support (30 | 2.6%), Security & Protection (20 | 1.7%), and Firefighting & Prevention (20 | 1.7%).
Services Occupations by Sex
Within the Services occupations in Milford, the most male-oriented occupations are Healthcare Support (100.0%), Cleaning & Maintenance (100.0%), and Food Preparation & Serving (87.9%), while the most female-oriented occupations are Security & Protection (100.0%), Firefighting & Prevention (100.0%), and Personal Care & Service (100.0%).
| Occupation | Male | Female |
| Healthcare Support | 30 (100.0%) | 0 (0.0%) |
| Security & Protection | 0 (0.0%) | 20 (100.0%) |
| Firefighting & Prevention | 0 (0.0%) | 20 (100.0%) |
| Law Enforcement | 0 (0.0%) | 0 (0.0%) |
| Food Preparation & Serving | 87 (87.9%) | 12 (12.1%) |
| Cleaning & Maintenance | 4 (100.0%) | 0 (0.0%) |
| Personal Care & Service | 0 (0.0%) | 37 (100.0%) |
| Total (Category) | 121 (63.7%) | 69 (36.3%) |
| Total (Overall) | 675 (58.4%) | 480 (41.6%) |
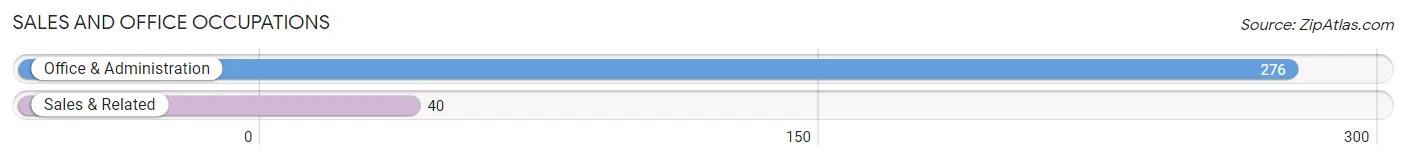
Sales and Office Occupations
The most common Sales and Office occupations in Milford are Office & Administration (276 | 23.9%), and Sales & Related (40 | 3.5%).
Sales and Office Occupations by Sex

| Occupation | Male | Female |
| Sales & Related | 38 (95.0%) | 2 (5.0%) |
| Office & Administration | 18 (6.5%) | 258 (93.5%) |
| Total (Category) | 56 (17.7%) | 260 (82.3%) |
| Total (Overall) | 675 (58.4%) | 480 (41.6%) |
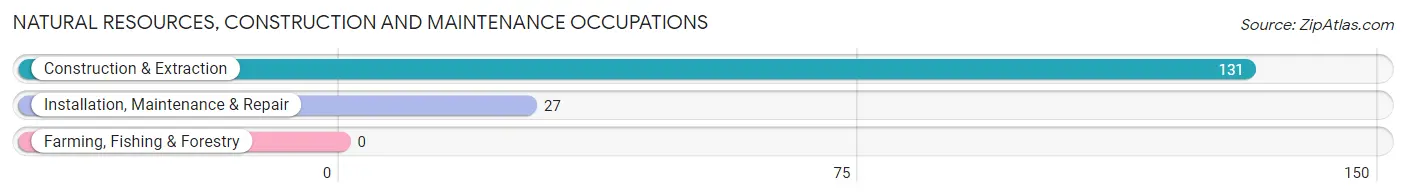
Natural Resources, Construction and Maintenance Occupations
The most common Natural Resources, Construction and Maintenance occupations in Milford are Construction & Extraction (131 | 11.3%), and Installation, Maintenance & Repair (27 | 2.3%).
Natural Resources, Construction and Maintenance Occupations by Sex

| Occupation | Male | Female |
| Farming, Fishing & Forestry | 0 (0.0%) | 0 (0.0%) |
| Construction & Extraction | 131 (100.0%) | 0 (0.0%) |
| Installation, Maintenance & Repair | 27 (100.0%) | 0 (0.0%) |
| Total (Category) | 158 (100.0%) | 0 (0.0%) |
| Total (Overall) | 675 (58.4%) | 480 (41.6%) |
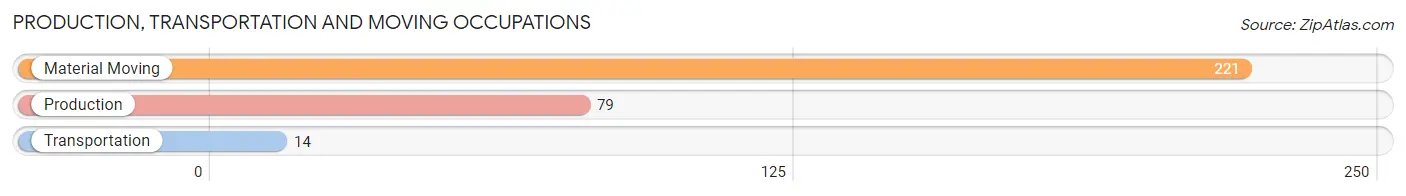
Production, Transportation and Moving Occupations
The most common Production, Transportation and Moving occupations in Milford are Material Moving (221 | 19.1%), Production (79 | 6.8%), and Transportation (14 | 1.2%).
Production, Transportation and Moving Occupations by Sex
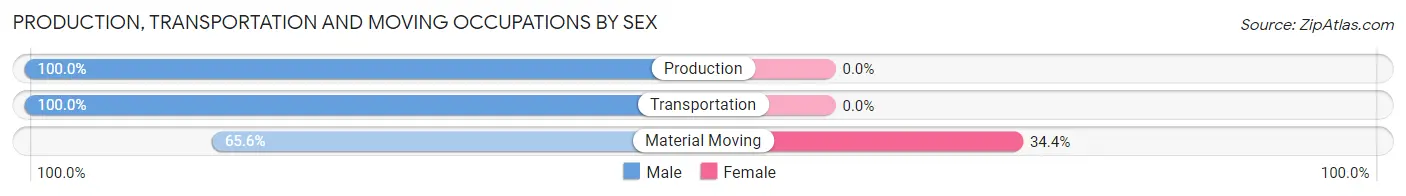
| Occupation | Male | Female |
| Production | 79 (100.0%) | 0 (0.0%) |
| Transportation | 14 (100.0%) | 0 (0.0%) |
| Material Moving | 145 (65.6%) | 76 (34.4%) |
| Total (Category) | 238 (75.8%) | 76 (24.2%) |
| Total (Overall) | 675 (58.4%) | 480 (41.6%) |
Employment Industries by Sex in Milford
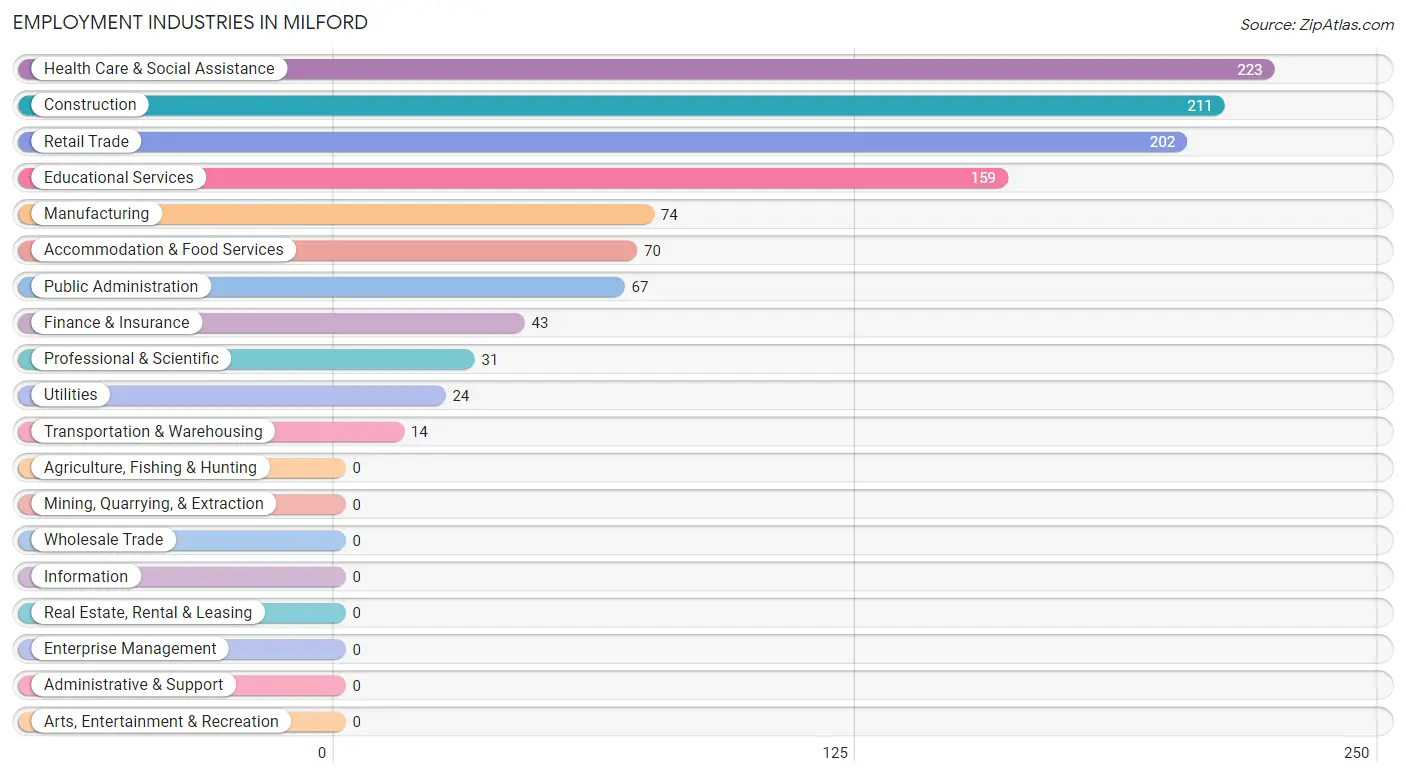
Employment Industries in Milford
The major employment industries in Milford include Health Care & Social Assistance (223 | 19.3%), Construction (211 | 18.3%), Retail Trade (202 | 17.5%), Educational Services (159 | 13.8%), and Manufacturing (74 | 6.4%).
Employment Industries by Sex in Milford
The Milford industries that see more men than women are Construction (100.0%), Manufacturing (100.0%), and Transportation & Warehousing (100.0%), whereas the industries that tend to have a higher number of women are Utilities (100.0%), Professional & Scientific (100.0%), and Health Care & Social Assistance (77.1%).
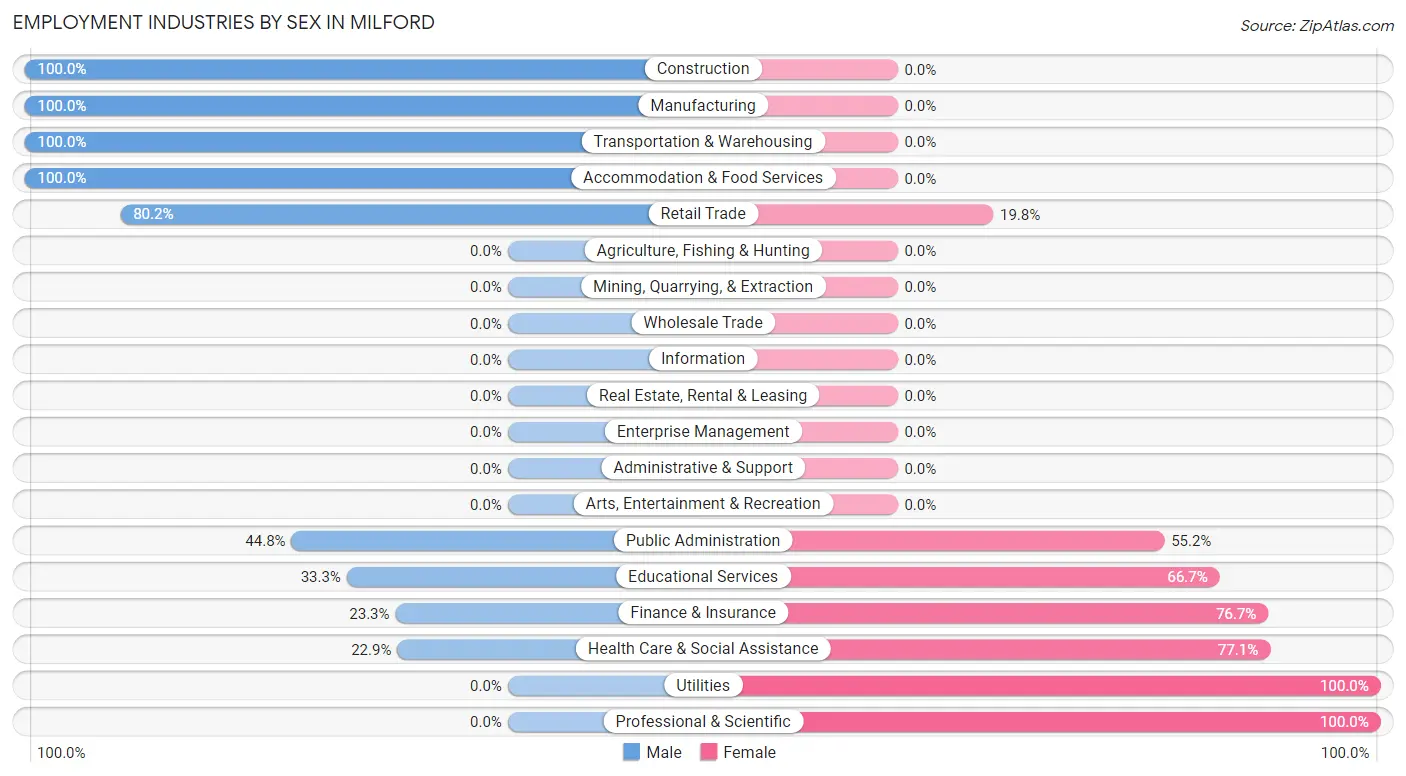
| Industry | Male | Female |
| Agriculture, Fishing & Hunting | 0 (0.0%) | 0 (0.0%) |
| Mining, Quarrying, & Extraction | 0 (0.0%) | 0 (0.0%) |
| Construction | 211 (100.0%) | 0 (0.0%) |
| Manufacturing | 74 (100.0%) | 0 (0.0%) |
| Wholesale Trade | 0 (0.0%) | 0 (0.0%) |
| Retail Trade | 162 (80.2%) | 40 (19.8%) |
| Transportation & Warehousing | 14 (100.0%) | 0 (0.0%) |
| Utilities | 0 (0.0%) | 24 (100.0%) |
| Information | 0 (0.0%) | 0 (0.0%) |
| Finance & Insurance | 10 (23.3%) | 33 (76.7%) |
| Real Estate, Rental & Leasing | 0 (0.0%) | 0 (0.0%) |
| Professional & Scientific | 0 (0.0%) | 31 (100.0%) |
| Enterprise Management | 0 (0.0%) | 0 (0.0%) |
| Administrative & Support | 0 (0.0%) | 0 (0.0%) |
| Educational Services | 53 (33.3%) | 106 (66.7%) |
| Health Care & Social Assistance | 51 (22.9%) | 172 (77.1%) |
| Arts, Entertainment & Recreation | 0 (0.0%) | 0 (0.0%) |
| Accommodation & Food Services | 70 (100.0%) | 0 (0.0%) |
| Public Administration | 30 (44.8%) | 37 (55.2%) |
| Total | 675 (58.4%) | 480 (41.6%) |
Education in Milford
School Enrollment in Milford
The most common levels of schooling among the 378 students in Milford are elementary school (123 | 32.5%), college / undergraduate (98 | 25.9%), and middle school (65 | 17.2%).
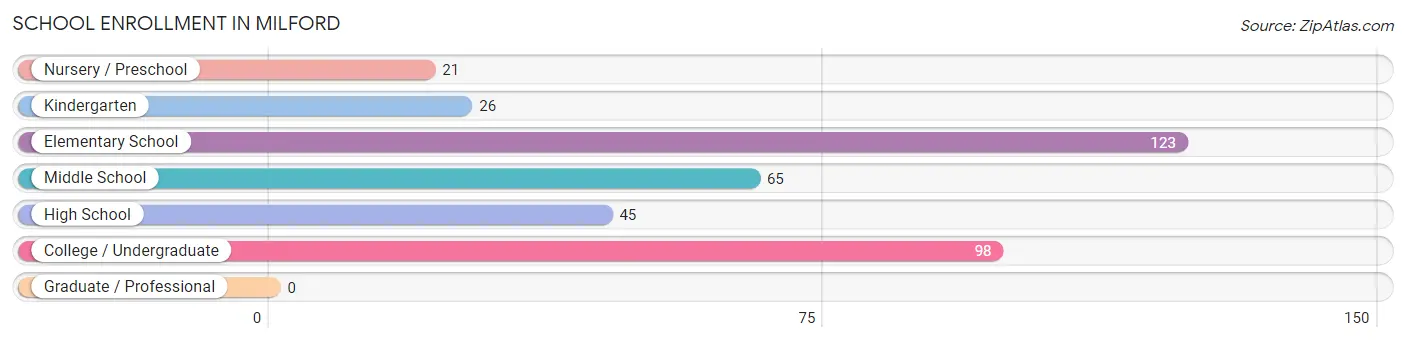
| School Level | # Students | % Students |
| Nursery / Preschool | 21 | 5.6% |
| Kindergarten | 26 | 6.9% |
| Elementary School | 123 | 32.5% |
| Middle School | 65 | 17.2% |
| High School | 45 | 11.9% |
| College / Undergraduate | 98 | 25.9% |
| Graduate / Professional | 0 | 0.0% |
| Total | 378 | 100.0% |
School Enrollment by Age by Funding Source in Milford
Out of a total of 378 students who are enrolled in schools in Milford, 28 (7.4%) attend a private institution, while the remaining 350 (92.6%) are enrolled in public schools. The age group of 18 to 19 year olds has the highest likelihood of being enrolled in private schools, with 28 (100.0% in the age bracket) enrolled. Conversely, the age group of 3 to 4 year olds has the lowest likelihood of being enrolled in a private school, with 21 (100.0% in the age bracket) attending a public institution.
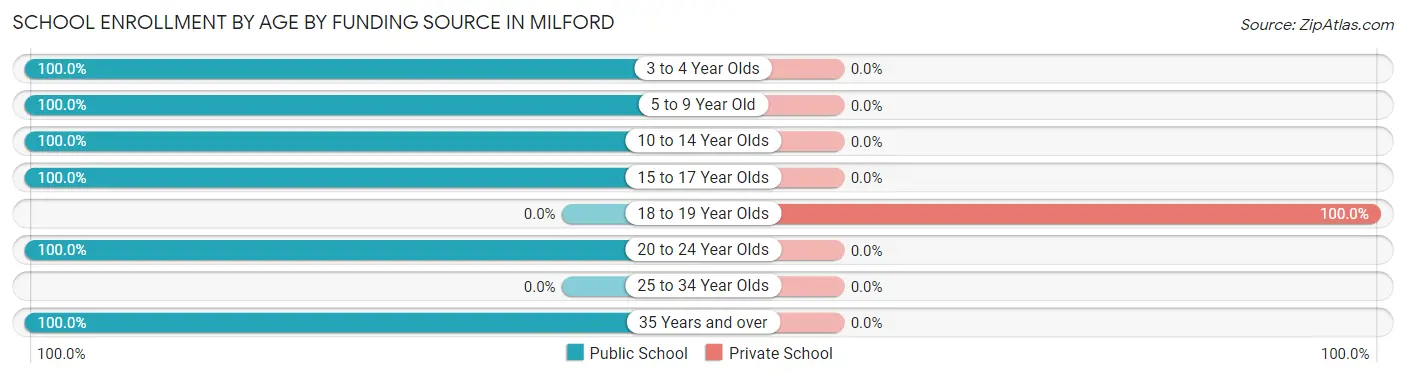
| Age Bracket | Public School | Private School |
| 3 to 4 Year Olds | 21 (100.0%) | 0 (0.0%) |
| 5 to 9 Year Old | 149 (100.0%) | 0 (0.0%) |
| 10 to 14 Year Olds | 75 (100.0%) | 0 (0.0%) |
| 15 to 17 Year Olds | 35 (100.0%) | 0 (0.0%) |
| 18 to 19 Year Olds | 0 (0.0%) | 28 (100.0%) |
| 20 to 24 Year Olds | 37 (100.0%) | 0 (0.0%) |
| 25 to 34 Year Olds | 0 (0.0%) | 0 (0.0%) |
| 35 Years and over | 33 (100.0%) | 0 (0.0%) |
| Total | 350 (92.6%) | 28 (7.4%) |
Educational Attainment by Field of Study in Milford
Business (113 | 41.7%), arts & humanities (46 | 17.0%), social sciences (35 | 12.9%), visual & performing arts (31 | 11.4%), and liberal arts & history (21 | 7.7%) are the most common fields of study among 271 individuals in Milford who have obtained a bachelor's degree or higher.
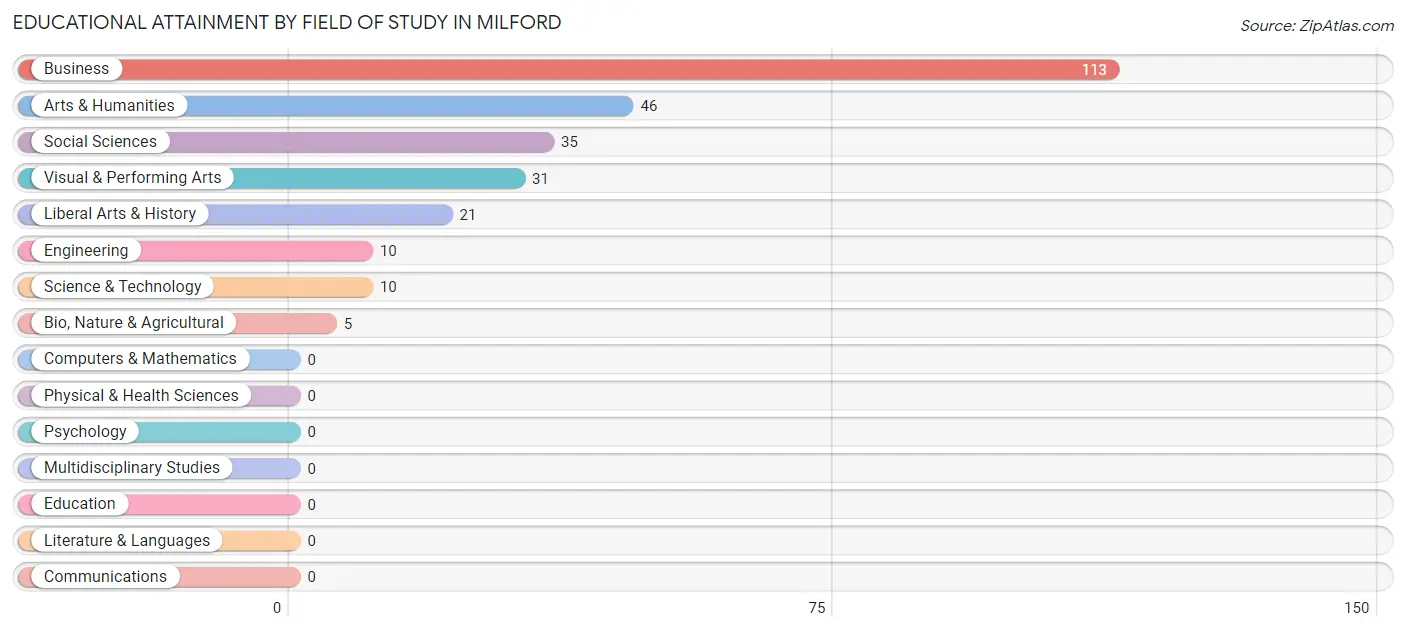
| Field of Study | # Graduates | % Graduates |
| Computers & Mathematics | 0 | 0.0% |
| Bio, Nature & Agricultural | 5 | 1.8% |
| Physical & Health Sciences | 0 | 0.0% |
| Psychology | 0 | 0.0% |
| Social Sciences | 35 | 12.9% |
| Engineering | 10 | 3.7% |
| Multidisciplinary Studies | 0 | 0.0% |
| Science & Technology | 10 | 3.7% |
| Business | 113 | 41.7% |
| Education | 0 | 0.0% |
| Literature & Languages | 0 | 0.0% |
| Liberal Arts & History | 21 | 7.7% |
| Visual & Performing Arts | 31 | 11.4% |
| Communications | 0 | 0.0% |
| Arts & Humanities | 46 | 17.0% |
| Total | 271 | 100.0% |
Transportation & Commute in Milford
Vehicle Availability by Sex in Milford
The most prevalent vehicle ownership categories in Milford are males with 3 vehicles (296, accounting for 44.1%) and females with 3 vehicles (220, making up 61.7%).
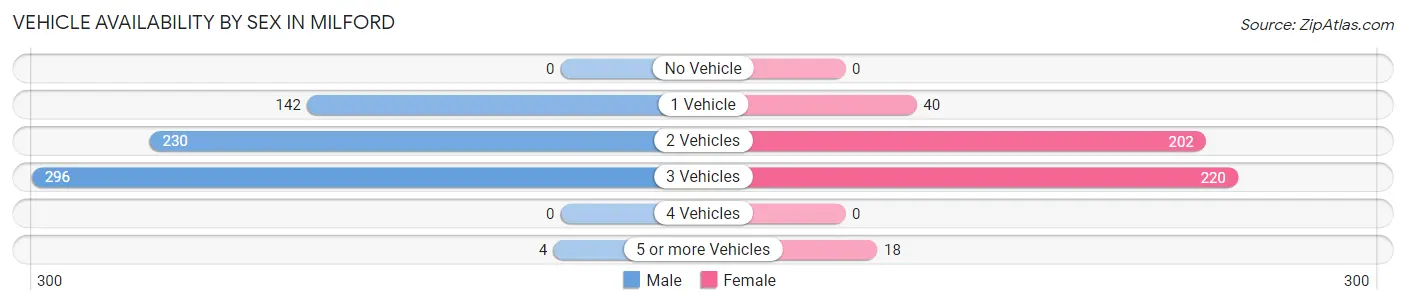
| Vehicles Available | Male | Female |
| No Vehicle | 0 (0.0%) | 0 (0.0%) |
| 1 Vehicle | 142 (21.1%) | 40 (8.3%) |
| 2 Vehicles | 230 (34.2%) | 202 (42.1%) |
| 3 Vehicles | 296 (44.1%) | 220 (45.8%) |
| 4 Vehicles | 0 (0.0%) | 0 (0.0%) |
| 5 or more Vehicles | 4 (0.6%) | 18 (3.7%) |
| Total | 672 (100.0%) | 480 (100.0%) |
Commute Time in Milford
The most frequently occuring commute durations in Milford are 30 to 34 minutes (209 commuters, 19.4%), 10 to 14 minutes (206 commuters, 19.1%), and 25 to 29 minutes (149 commuters, 13.8%).
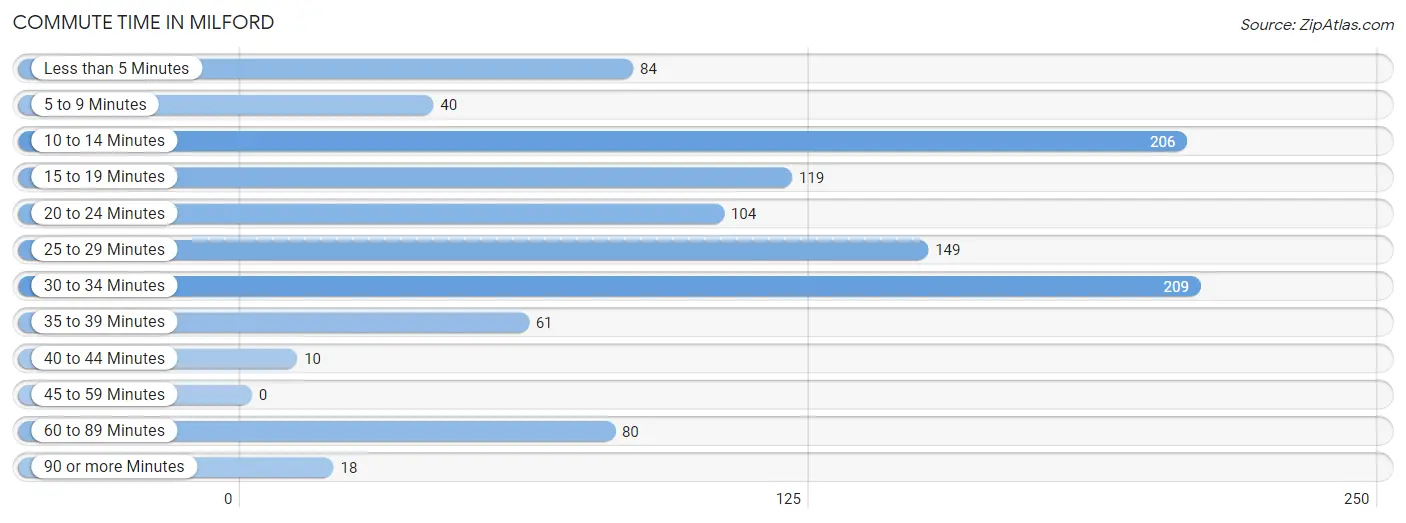
| Commute Time | # Commuters | % Commuters |
| Less than 5 Minutes | 84 | 7.8% |
| 5 to 9 Minutes | 40 | 3.7% |
| 10 to 14 Minutes | 206 | 19.1% |
| 15 to 19 Minutes | 119 | 11.0% |
| 20 to 24 Minutes | 104 | 9.6% |
| 25 to 29 Minutes | 149 | 13.8% |
| 30 to 34 Minutes | 209 | 19.4% |
| 35 to 39 Minutes | 61 | 5.7% |
| 40 to 44 Minutes | 10 | 0.9% |
| 45 to 59 Minutes | 0 | 0.0% |
| 60 to 89 Minutes | 80 | 7.4% |
| 90 or more Minutes | 18 | 1.7% |
Commute Time by Sex in Milford
The most common commute times in Milford are 30 to 34 minutes (196 commuters, 29.6%) for males and 25 to 29 minutes (85 commuters, 20.4%) for females.
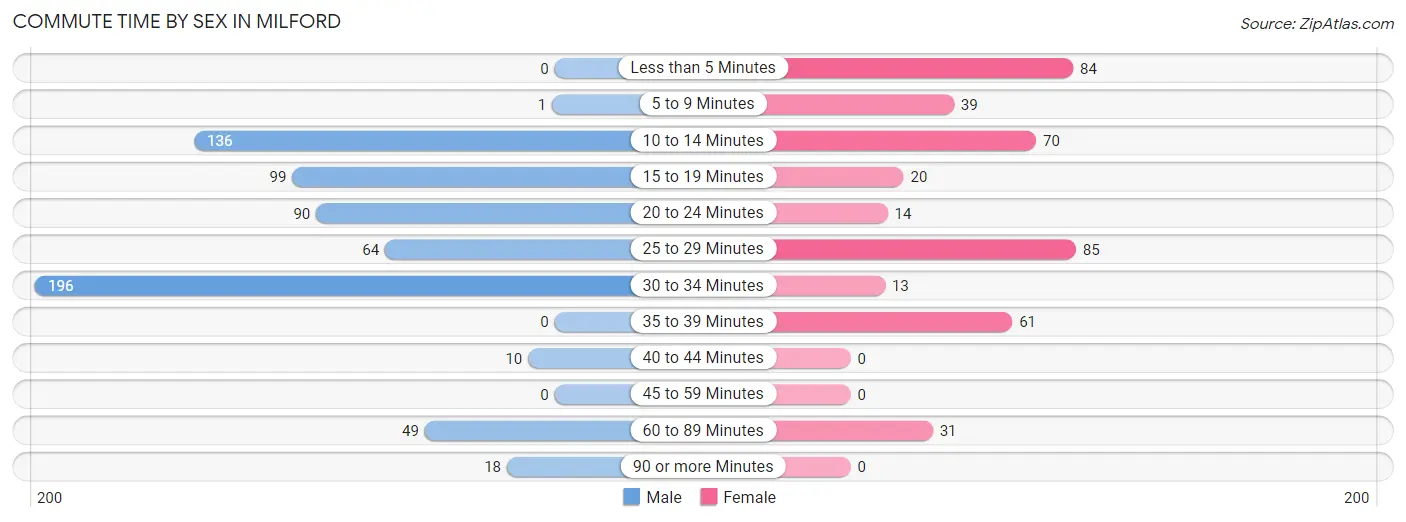
| Commute Time | Male | Female |
| Less than 5 Minutes | 0 (0.0%) | 84 (20.1%) |
| 5 to 9 Minutes | 1 (0.2%) | 39 (9.3%) |
| 10 to 14 Minutes | 136 (20.5%) | 70 (16.8%) |
| 15 to 19 Minutes | 99 (14.9%) | 20 (4.8%) |
| 20 to 24 Minutes | 90 (13.6%) | 14 (3.4%) |
| 25 to 29 Minutes | 64 (9.7%) | 85 (20.4%) |
| 30 to 34 Minutes | 196 (29.6%) | 13 (3.1%) |
| 35 to 39 Minutes | 0 (0.0%) | 61 (14.6%) |
| 40 to 44 Minutes | 10 (1.5%) | 0 (0.0%) |
| 45 to 59 Minutes | 0 (0.0%) | 0 (0.0%) |
| 60 to 89 Minutes | 49 (7.4%) | 31 (7.4%) |
| 90 or more Minutes | 18 (2.7%) | 0 (0.0%) |
Time of Departure to Work by Sex in Milford
The most frequent times of departure to work in Milford are 7:00 AM to 7:29 AM (165, 24.9%) for males and 7:00 AM to 7:29 AM (187, 44.8%) for females.
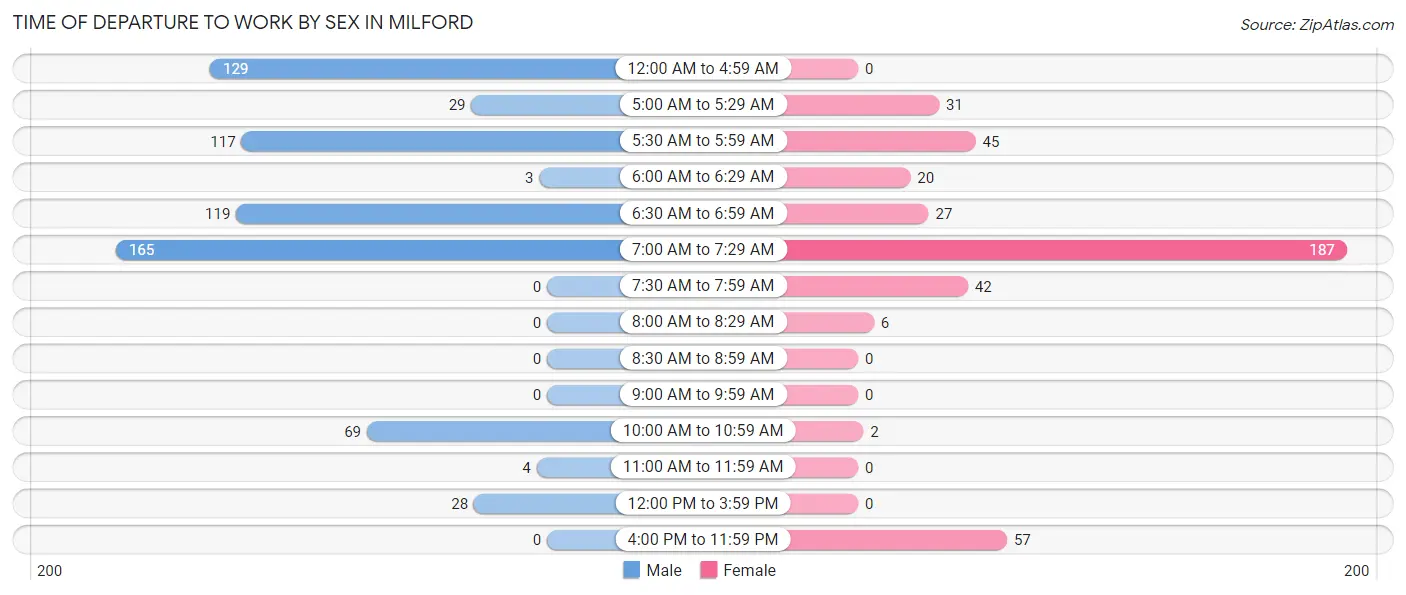
| Time of Departure | Male | Female |
| 12:00 AM to 4:59 AM | 129 (19.5%) | 0 (0.0%) |
| 5:00 AM to 5:29 AM | 29 (4.4%) | 31 (7.4%) |
| 5:30 AM to 5:59 AM | 117 (17.6%) | 45 (10.8%) |
| 6:00 AM to 6:29 AM | 3 (0.4%) | 20 (4.8%) |
| 6:30 AM to 6:59 AM | 119 (17.9%) | 27 (6.5%) |
| 7:00 AM to 7:29 AM | 165 (24.9%) | 187 (44.8%) |
| 7:30 AM to 7:59 AM | 0 (0.0%) | 42 (10.1%) |
| 8:00 AM to 8:29 AM | 0 (0.0%) | 6 (1.4%) |
| 8:30 AM to 8:59 AM | 0 (0.0%) | 0 (0.0%) |
| 9:00 AM to 9:59 AM | 0 (0.0%) | 0 (0.0%) |
| 10:00 AM to 10:59 AM | 69 (10.4%) | 2 (0.5%) |
| 11:00 AM to 11:59 AM | 4 (0.6%) | 0 (0.0%) |
| 12:00 PM to 3:59 PM | 28 (4.2%) | 0 (0.0%) |
| 4:00 PM to 11:59 PM | 0 (0.0%) | 57 (13.7%) |
| Total | 663 (100.0%) | 417 (100.0%) |
Housing Occupancy in Milford
Occupancy by Ownership in Milford
Of the total 955 dwellings in Milford, owner-occupied units account for 851 (89.1%), while renter-occupied units make up 104 (10.9%).
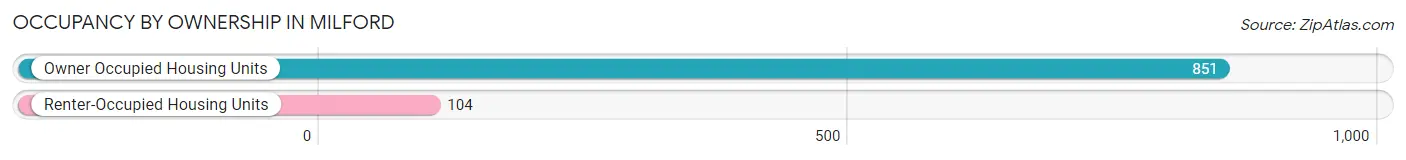
| Occupancy | # Housing Units | % Housing Units |
| Owner Occupied Housing Units | 851 | 89.1% |
| Renter-Occupied Housing Units | 104 | 10.9% |
| Total Occupied Housing Units | 955 | 100.0% |
Occupancy by Household Size in Milford
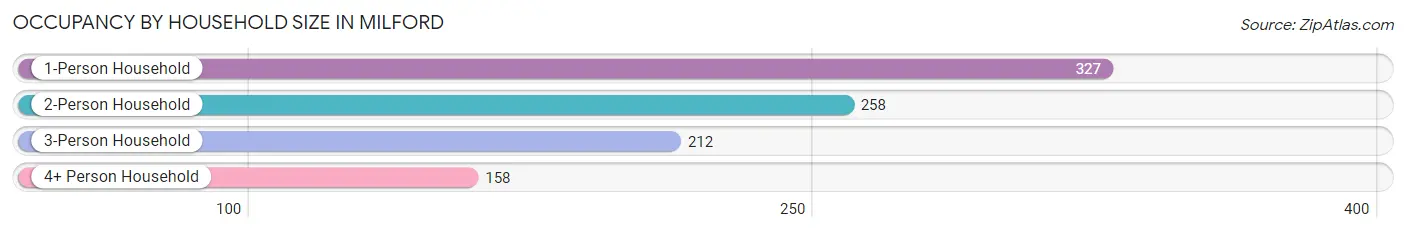
| Household Size | # Housing Units | % Housing Units |
| 1-Person Household | 327 | 34.2% |
| 2-Person Household | 258 | 27.0% |
| 3-Person Household | 212 | 22.2% |
| 4+ Person Household | 158 | 16.5% |
| Total Housing Units | 955 | 100.0% |
Occupancy by Ownership by Household Size in Milford
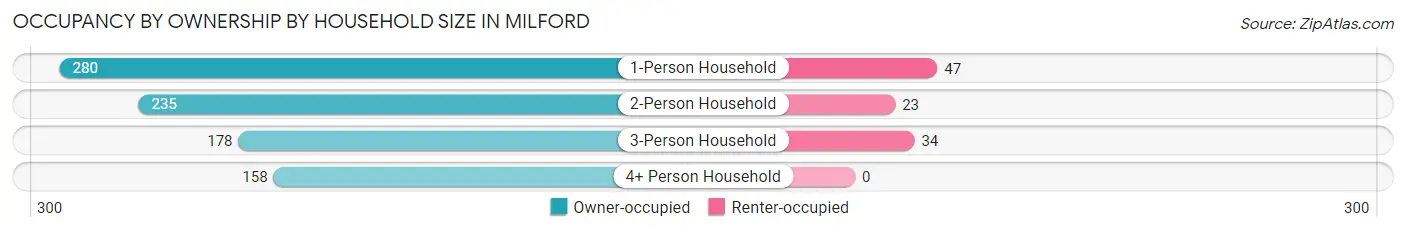
| Household Size | Owner-occupied | Renter-occupied |
| 1-Person Household | 280 (85.6%) | 47 (14.4%) |
| 2-Person Household | 235 (91.1%) | 23 (8.9%) |
| 3-Person Household | 178 (84.0%) | 34 (16.0%) |
| 4+ Person Household | 158 (100.0%) | 0 (0.0%) |
| Total Housing Units | 851 (89.1%) | 104 (10.9%) |
Occupancy by Educational Attainment in Milford
| Household Size | Owner-occupied | Renter-occupied |
| Less than High School | 70 (67.3%) | 34 (32.7%) |
| High School Diploma | 397 (100.0%) | 0 (0.0%) |
| College/Associate Degree | 172 (77.5%) | 50 (22.5%) |
| Bachelor's Degree or higher | 212 (91.4%) | 20 (8.6%) |
Occupancy by Age of Householder in Milford
| Age Bracket | # Households | % Households |
| Under 35 Years | 230 | 24.1% |
| 35 to 44 Years | 61 | 6.4% |
| 45 to 54 Years | 140 | 14.7% |
| 55 to 64 Years | 281 | 29.4% |
| 65 to 74 Years | 153 | 16.0% |
| 75 to 84 Years | 43 | 4.5% |
| 85 Years and Over | 47 | 4.9% |
| Total | 955 | 100.0% |
Housing Finances in Milford
Median Income by Occupancy in Milford
| Occupancy Type | # Households | Median Income |
| Owner-Occupied | 851 (89.1%) | $57,917 |
| Renter-Occupied | 104 (10.9%) | $0 |
| Average | 955 (100.0%) | $59,053 |
Occupancy by Householder Income Bracket in Milford
| Income Bracket | Owner-occupied | Renter-occupied |
| Less than $5,000 | 30 (3.5%) | 35 (33.7%) |
| $5,000 to $9,999 | 0 (0.0%) | 0 (0.0%) |
| $10,000 to $14,999 | 35 (4.1%) | 0 (0.0%) |
| $15,000 to $19,999 | 0 (0.0%) | 0 (0.0%) |
| $20,000 to $24,999 | 164 (19.3%) | 0 (0.0%) |
| $25,000 to $34,999 | 44 (5.2%) | 0 (0.0%) |
| $35,000 to $49,999 | 124 (14.6%) | 0 (0.0%) |
| $50,000 to $74,999 | 103 (12.1%) | 46 (44.2%) |
| $75,000 to $99,999 | 151 (17.7%) | 15 (14.4%) |
| $100,000 to $149,999 | 149 (17.5%) | 8 (7.7%) |
| $150,000 or more | 51 (6.0%) | 0 (0.0%) |
| Total | 851 (100.0%) | 104 (100.0%) |
Monthly Housing Cost Tiers in Milford
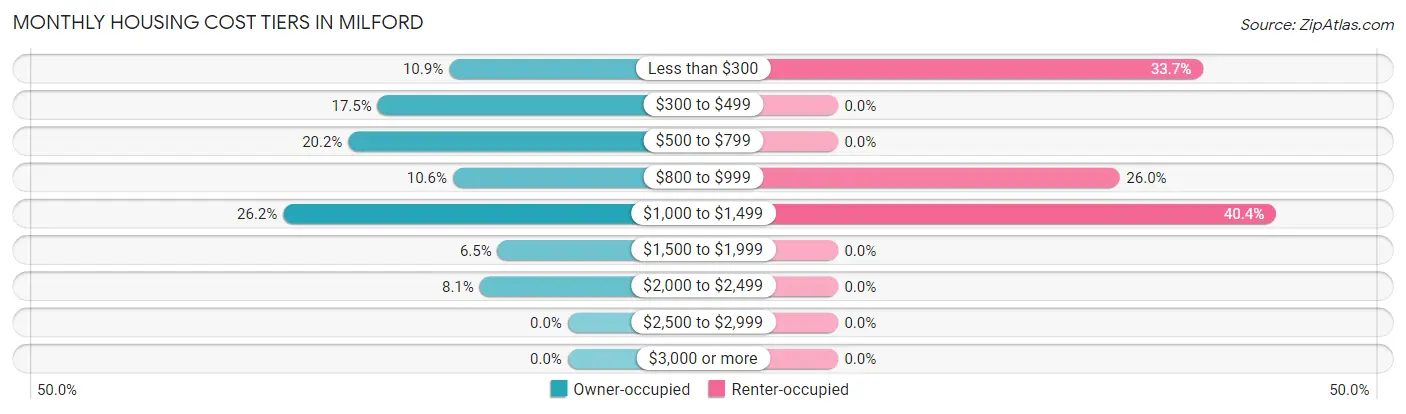
| Monthly Cost | Owner-occupied | Renter-occupied |
| Less than $300 | 93 (10.9%) | 35 (33.7%) |
| $300 to $499 | 149 (17.5%) | 0 (0.0%) |
| $500 to $799 | 172 (20.2%) | 0 (0.0%) |
| $800 to $999 | 90 (10.6%) | 27 (26.0%) |
| $1,000 to $1,499 | 223 (26.2%) | 42 (40.4%) |
| $1,500 to $1,999 | 55 (6.5%) | 0 (0.0%) |
| $2,000 to $2,499 | 69 (8.1%) | 0 (0.0%) |
| $2,500 to $2,999 | 0 (0.0%) | 0 (0.0%) |
| $3,000 or more | 0 (0.0%) | 0 (0.0%) |
| Total | 851 (100.0%) | 104 (100.0%) |
Physical Housing Characteristics in Milford
Housing Structures in Milford
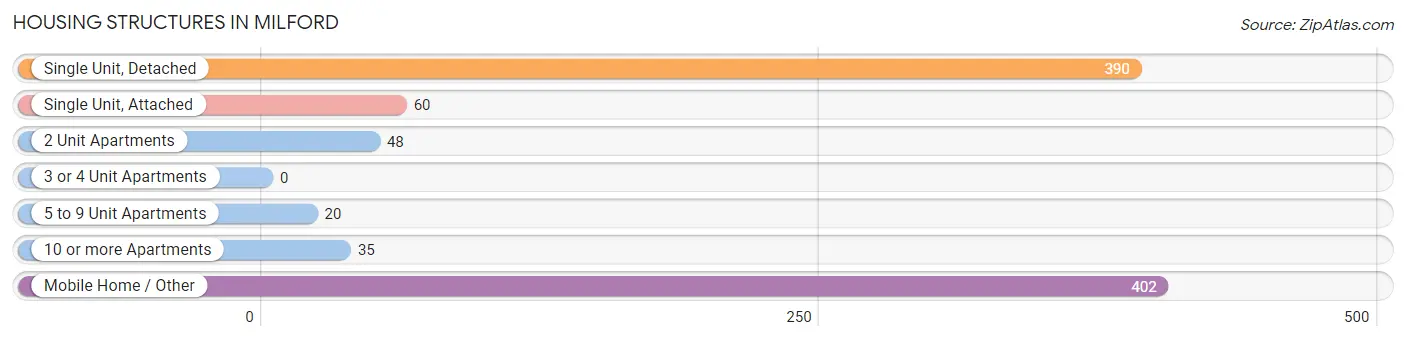
| Structure Type | # Housing Units | % Housing Units |
| Single Unit, Detached | 390 | 40.8% |
| Single Unit, Attached | 60 | 6.3% |
| 2 Unit Apartments | 48 | 5.0% |
| 3 or 4 Unit Apartments | 0 | 0.0% |
| 5 to 9 Unit Apartments | 20 | 2.1% |
| 10 or more Apartments | 35 | 3.7% |
| Mobile Home / Other | 402 | 42.1% |
| Total | 955 | 100.0% |
Housing Structures by Occupancy in Milford
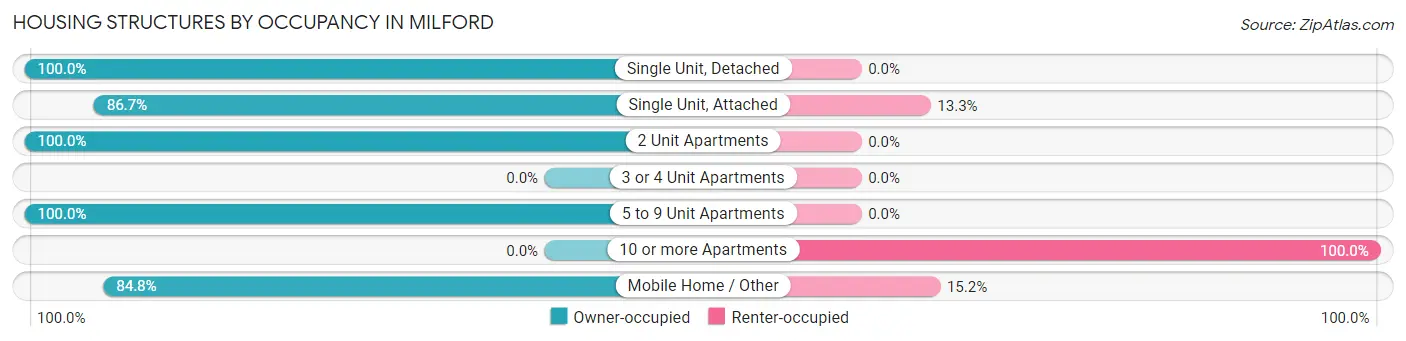
| Structure Type | Owner-occupied | Renter-occupied |
| Single Unit, Detached | 390 (100.0%) | 0 (0.0%) |
| Single Unit, Attached | 52 (86.7%) | 8 (13.3%) |
| 2 Unit Apartments | 48 (100.0%) | 0 (0.0%) |
| 3 or 4 Unit Apartments | 0 (0.0%) | 0 (0.0%) |
| 5 to 9 Unit Apartments | 20 (100.0%) | 0 (0.0%) |
| 10 or more Apartments | 0 (0.0%) | 35 (100.0%) |
| Mobile Home / Other | 341 (84.8%) | 61 (15.2%) |
| Total | 851 (89.1%) | 104 (10.9%) |
Housing Structures by Number of Rooms in Milford
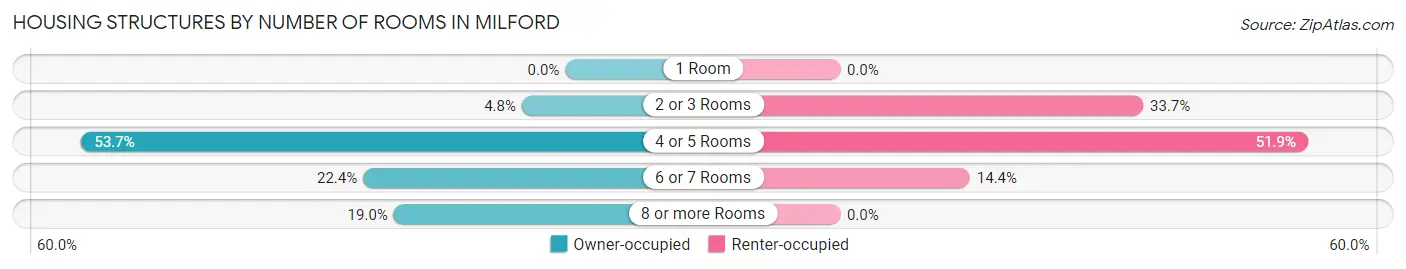
| Number of Rooms | Owner-occupied | Renter-occupied |
| 1 Room | 0 (0.0%) | 0 (0.0%) |
| 2 or 3 Rooms | 41 (4.8%) | 35 (33.7%) |
| 4 or 5 Rooms | 457 (53.7%) | 54 (51.9%) |
| 6 or 7 Rooms | 191 (22.4%) | 15 (14.4%) |
| 8 or more Rooms | 162 (19.0%) | 0 (0.0%) |
| Total | 851 (100.0%) | 104 (100.0%) |
Housing Structure by Heating Type in Milford
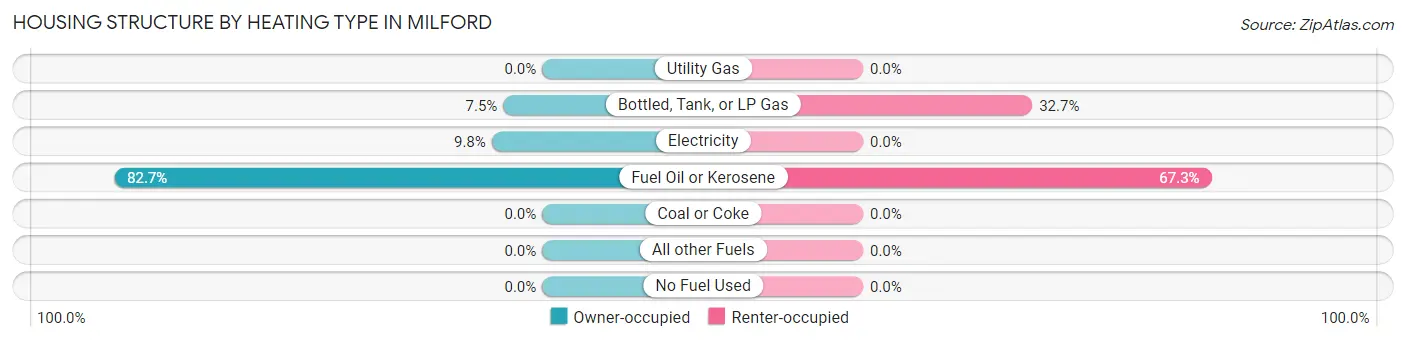
| Heating Type | Owner-occupied | Renter-occupied |
| Utility Gas | 0 (0.0%) | 0 (0.0%) |
| Bottled, Tank, or LP Gas | 64 (7.5%) | 34 (32.7%) |
| Electricity | 83 (9.8%) | 0 (0.0%) |
| Fuel Oil or Kerosene | 704 (82.7%) | 70 (67.3%) |
| Coal or Coke | 0 (0.0%) | 0 (0.0%) |
| All other Fuels | 0 (0.0%) | 0 (0.0%) |
| No Fuel Used | 0 (0.0%) | 0 (0.0%) |
| Total | 851 (100.0%) | 104 (100.0%) |
Household Vehicle Usage in Milford
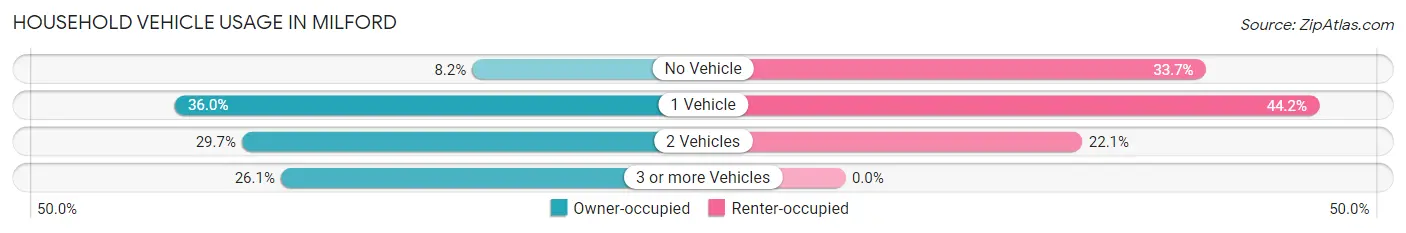
| Vehicles per Household | Owner-occupied | Renter-occupied |
| No Vehicle | 70 (8.2%) | 35 (33.7%) |
| 1 Vehicle | 306 (36.0%) | 46 (44.2%) |
| 2 Vehicles | 253 (29.7%) | 23 (22.1%) |
| 3 or more Vehicles | 222 (26.1%) | 0 (0.0%) |
| Total | 851 (100.0%) | 104 (100.0%) |
Real Estate & Mortgages in Milford
Real Estate and Mortgage Overview in Milford
| Characteristic | Without Mortgage | With Mortgage |
| Housing Units | 359 | 492 |
| Median Property Value | $64,200 | $179,400 |
| Median Household Income | $41,188 | $51 |
| Monthly Housing Costs | $434 | $0 |
| Real Estate Taxes | $1,426 | $0 |
Property Value by Mortgage Status in Milford
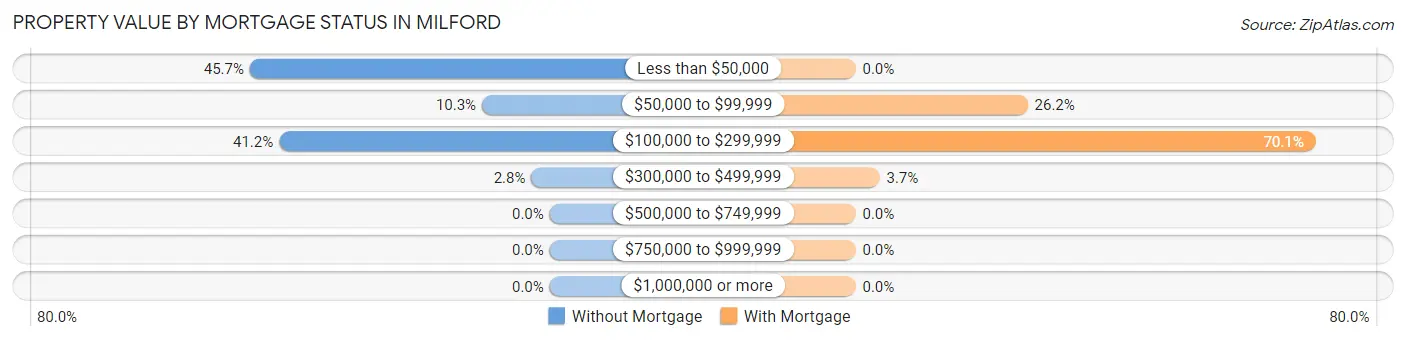
| Property Value | Without Mortgage | With Mortgage |
| Less than $50,000 | 164 (45.7%) | 0 (0.0%) |
| $50,000 to $99,999 | 37 (10.3%) | 129 (26.2%) |
| $100,000 to $299,999 | 148 (41.2%) | 345 (70.1%) |
| $300,000 to $499,999 | 10 (2.8%) | 18 (3.7%) |
| $500,000 to $749,999 | 0 (0.0%) | 0 (0.0%) |
| $750,000 to $999,999 | 0 (0.0%) | 0 (0.0%) |
| $1,000,000 or more | 0 (0.0%) | 0 (0.0%) |
| Total | 359 (100.0%) | 492 (100.0%) |
Household Income by Mortgage Status in Milford
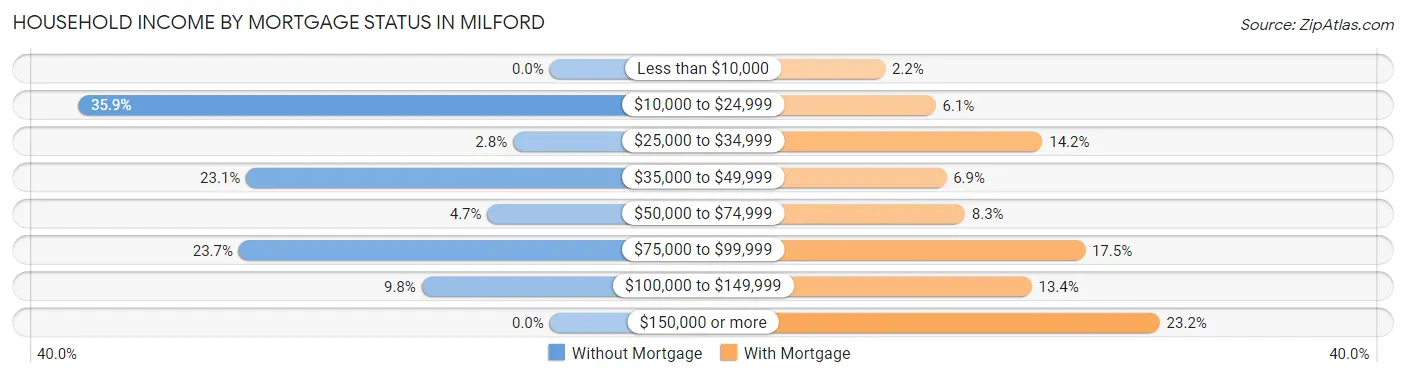
| Household Income | Without Mortgage | With Mortgage |
| Less than $10,000 | 0 (0.0%) | 11 (2.2%) |
| $10,000 to $24,999 | 129 (35.9%) | 30 (6.1%) |
| $25,000 to $34,999 | 10 (2.8%) | 70 (14.2%) |
| $35,000 to $49,999 | 83 (23.1%) | 34 (6.9%) |
| $50,000 to $74,999 | 17 (4.7%) | 41 (8.3%) |
| $75,000 to $99,999 | 85 (23.7%) | 86 (17.5%) |
| $100,000 to $149,999 | 35 (9.8%) | 66 (13.4%) |
| $150,000 or more | 0 (0.0%) | 114 (23.2%) |
| Total | 359 (100.0%) | 492 (100.0%) |
Property Value to Household Income Ratio in Milford
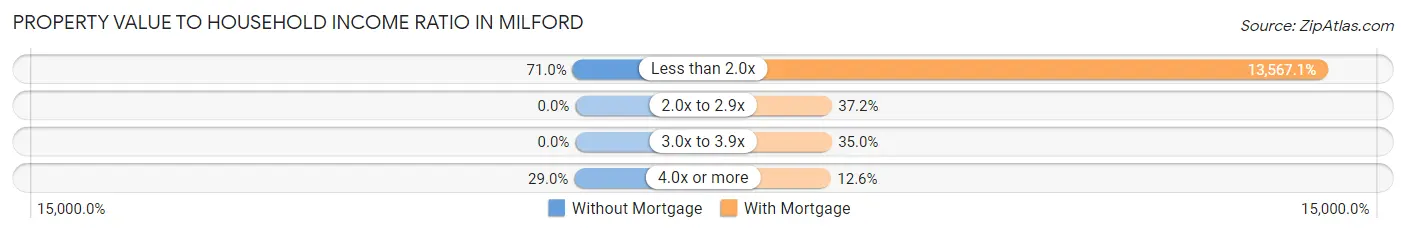
| Value-to-Income Ratio | Without Mortgage | With Mortgage |
| Less than 2.0x | 255 (71.0%) | 66,750 (13,567.1%) |
| 2.0x to 2.9x | 0 (0.0%) | 183 (37.2%) |
| 3.0x to 3.9x | 0 (0.0%) | 172 (35.0%) |
| 4.0x or more | 104 (29.0%) | 62 (12.6%) |
| Total | 359 (100.0%) | 492 (100.0%) |
Real Estate Taxes by Mortgage Status in Milford
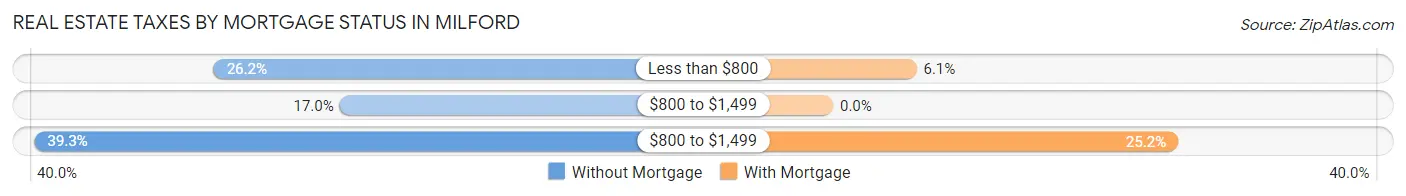
| Property Taxes | Without Mortgage | With Mortgage |
| Less than $800 | 94 (26.2%) | 30 (6.1%) |
| $800 to $1,499 | 61 (17.0%) | 0 (0.0%) |
| $800 to $1,499 | 141 (39.3%) | 124 (25.2%) |
| Total | 359 (100.0%) | 492 (100.0%) |
Health & Disability in Milford
Health Insurance Coverage by Age in Milford
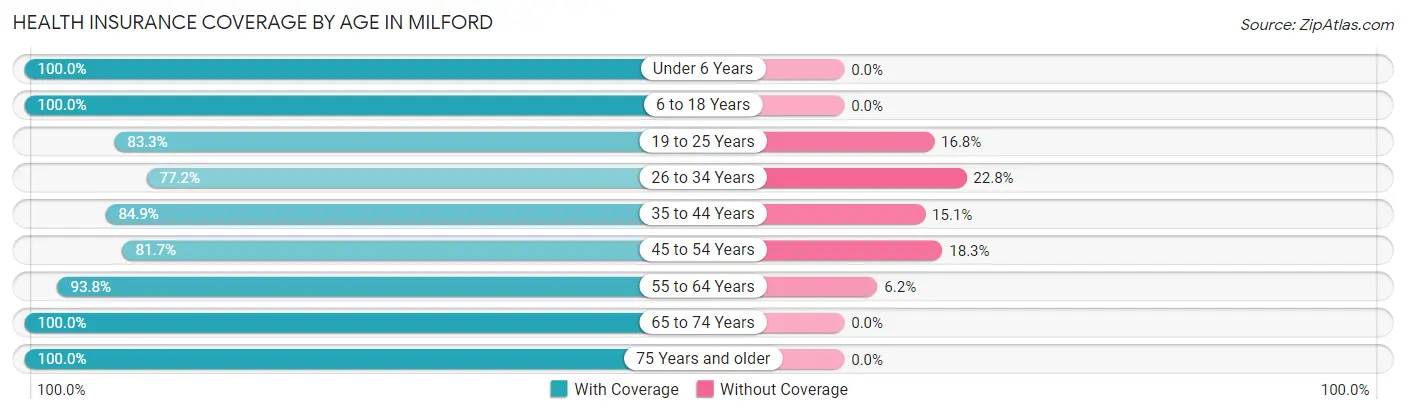
| Age Bracket | With Coverage | Without Coverage |
| Under 6 Years | 74 (100.0%) | 0 (0.0%) |
| 6 to 18 Years | 240 (100.0%) | 0 (0.0%) |
| 19 to 25 Years | 164 (83.3%) | 33 (16.8%) |
| 26 to 34 Years | 373 (77.2%) | 110 (22.8%) |
| 35 to 44 Years | 169 (84.9%) | 30 (15.1%) |
| 45 to 54 Years | 201 (81.7%) | 45 (18.3%) |
| 55 to 64 Years | 456 (93.8%) | 30 (6.2%) |
| 65 to 74 Years | 255 (100.0%) | 0 (0.0%) |
| 75 Years and older | 90 (100.0%) | 0 (0.0%) |
| Total | 2,022 (89.1%) | 248 (10.9%) |
Health Insurance Coverage by Citizenship Status in Milford
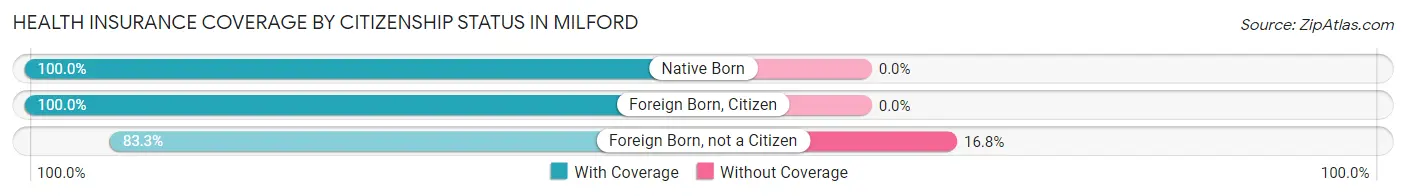
| Citizenship Status | With Coverage | Without Coverage |
| Native Born | 74 (100.0%) | 0 (0.0%) |
| Foreign Born, Citizen | 240 (100.0%) | 0 (0.0%) |
| Foreign Born, not a Citizen | 164 (83.3%) | 33 (16.8%) |
Health Insurance Coverage by Household Income in Milford
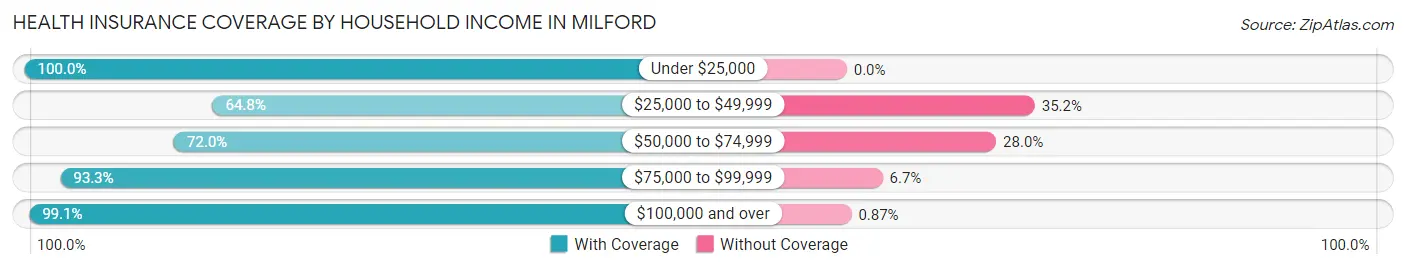
| Household Income | With Coverage | Without Coverage |
| Under $25,000 | 566 (100.0%) | 0 (0.0%) |
| $25,000 to $49,999 | 206 (64.8%) | 112 (35.2%) |
| $50,000 to $74,999 | 260 (72.0%) | 101 (28.0%) |
| $75,000 to $99,999 | 417 (93.3%) | 30 (6.7%) |
| $100,000 and over | 570 (99.1%) | 5 (0.9%) |
Public vs Private Health Insurance Coverage by Age in Milford
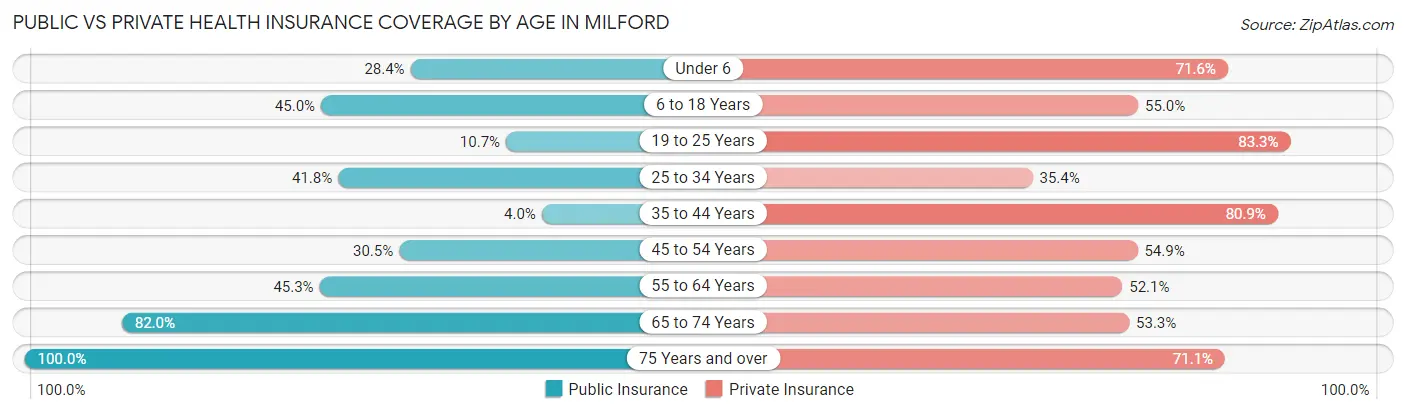
| Age Bracket | Public Insurance | Private Insurance |
| Under 6 | 21 (28.4%) | 53 (71.6%) |
| 6 to 18 Years | 108 (45.0%) | 132 (55.0%) |
| 19 to 25 Years | 21 (10.7%) | 164 (83.3%) |
| 25 to 34 Years | 202 (41.8%) | 171 (35.4%) |
| 35 to 44 Years | 8 (4.0%) | 161 (80.9%) |
| 45 to 54 Years | 75 (30.5%) | 135 (54.9%) |
| 55 to 64 Years | 220 (45.3%) | 253 (52.1%) |
| 65 to 74 Years | 209 (82.0%) | 136 (53.3%) |
| 75 Years and over | 90 (100.0%) | 64 (71.1%) |
| Total | 954 (42.0%) | 1,269 (55.9%) |
Disability Status by Sex by Age in Milford
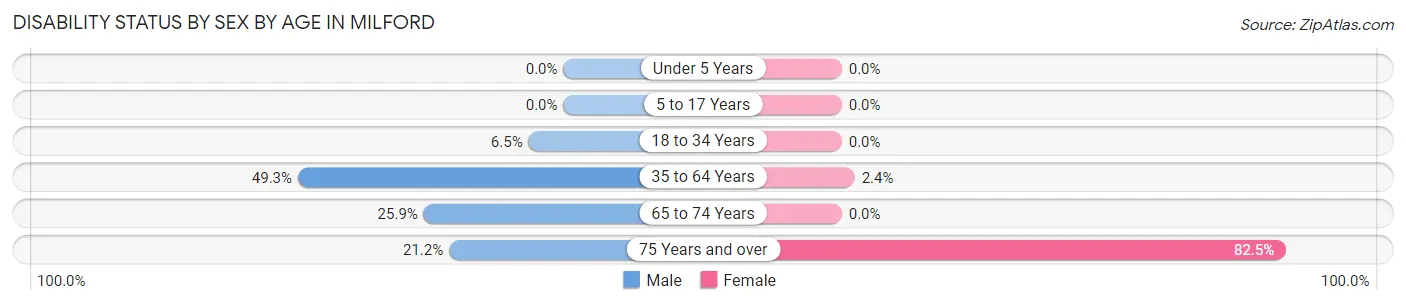
| Age Bracket | Male | Female |
| Under 5 Years | 0 (0.0%) | 0 (0.0%) |
| 5 to 17 Years | 0 (0.0%) | 0 (0.0%) |
| 18 to 34 Years | 33 (6.5%) | 0 (0.0%) |
| 35 to 64 Years | 274 (49.3%) | 9 (2.4%) |
| 65 to 74 Years | 21 (25.9%) | 0 (0.0%) |
| 75 Years and over | 7 (21.2%) | 47 (82.5%) |
Disability Class by Sex by Age in Milford
Disability Class: Hearing Difficulty
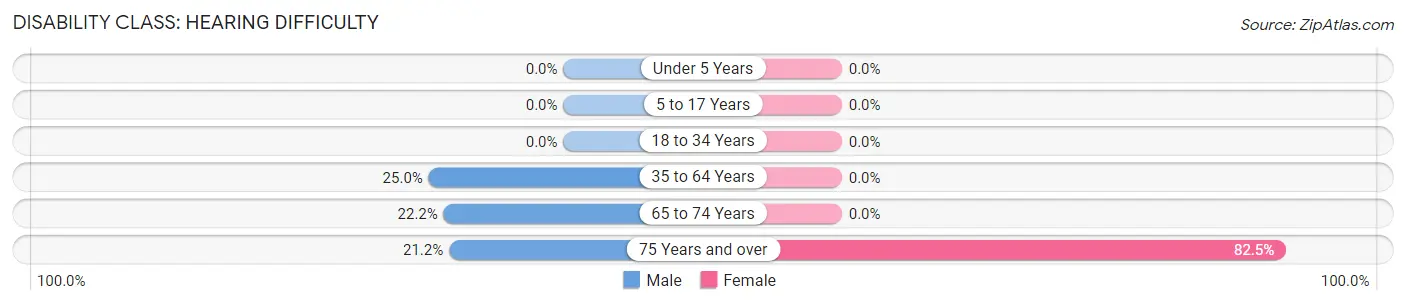
| Age Bracket | Male | Female |
| Under 5 Years | 0 (0.0%) | 0 (0.0%) |
| 5 to 17 Years | 0 (0.0%) | 0 (0.0%) |
| 18 to 34 Years | 0 (0.0%) | 0 (0.0%) |
| 35 to 64 Years | 139 (25.0%) | 0 (0.0%) |
| 65 to 74 Years | 18 (22.2%) | 0 (0.0%) |
| 75 Years and over | 7 (21.2%) | 47 (82.5%) |
Disability Class: Vision Difficulty
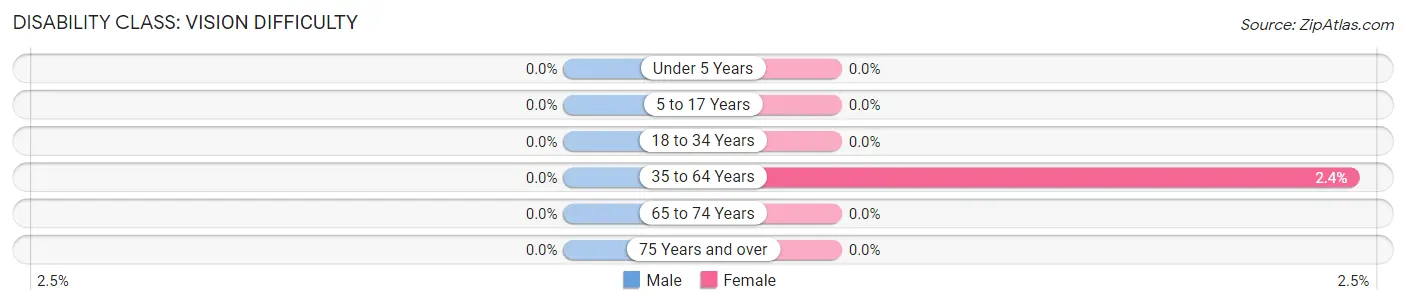
| Age Bracket | Male | Female |
| Under 5 Years | 0 (0.0%) | 0 (0.0%) |
| 5 to 17 Years | 0 (0.0%) | 0 (0.0%) |
| 18 to 34 Years | 0 (0.0%) | 0 (0.0%) |
| 35 to 64 Years | 0 (0.0%) | 9 (2.4%) |
| 65 to 74 Years | 0 (0.0%) | 0 (0.0%) |
| 75 Years and over | 0 (0.0%) | 0 (0.0%) |
Disability Class: Cognitive Difficulty
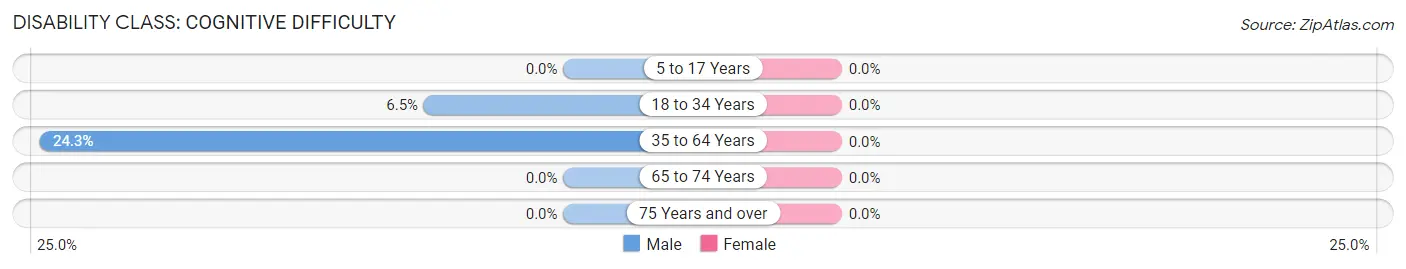
| Age Bracket | Male | Female |
| 5 to 17 Years | 0 (0.0%) | 0 (0.0%) |
| 18 to 34 Years | 33 (6.5%) | 0 (0.0%) |
| 35 to 64 Years | 135 (24.3%) | 0 (0.0%) |
| 65 to 74 Years | 0 (0.0%) | 0 (0.0%) |
| 75 Years and over | 0 (0.0%) | 0 (0.0%) |
Disability Class: Ambulatory Difficulty
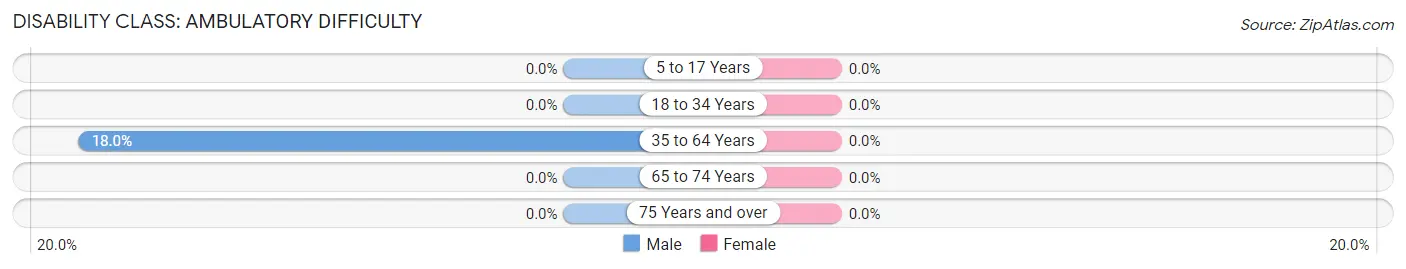
| Age Bracket | Male | Female |
| 5 to 17 Years | 0 (0.0%) | 0 (0.0%) |
| 18 to 34 Years | 0 (0.0%) | 0 (0.0%) |
| 35 to 64 Years | 100 (18.0%) | 0 (0.0%) |
| 65 to 74 Years | 0 (0.0%) | 0 (0.0%) |
| 75 Years and over | 0 (0.0%) | 0 (0.0%) |
Disability Class: Self-Care Difficulty
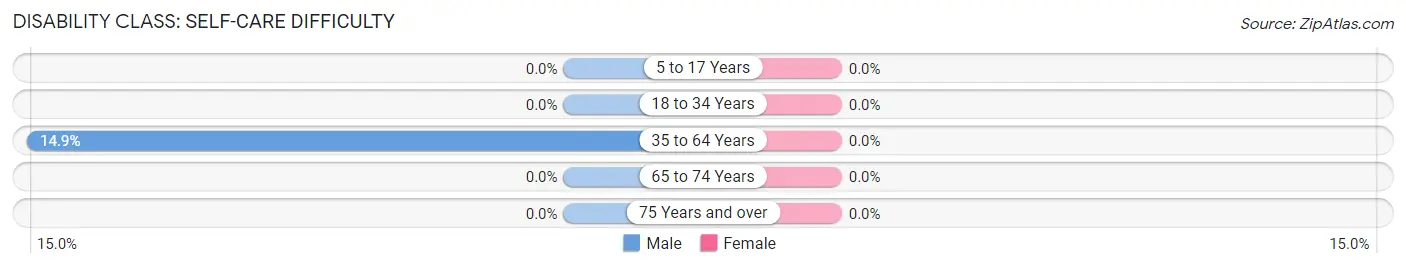
| Age Bracket | Male | Female |
| 5 to 17 Years | 0 (0.0%) | 0 (0.0%) |
| 18 to 34 Years | 0 (0.0%) | 0 (0.0%) |
| 35 to 64 Years | 83 (14.9%) | 0 (0.0%) |
| 65 to 74 Years | 0 (0.0%) | 0 (0.0%) |
| 75 Years and over | 0 (0.0%) | 0 (0.0%) |
Technology Access in Milford
Computing Device Access in Milford
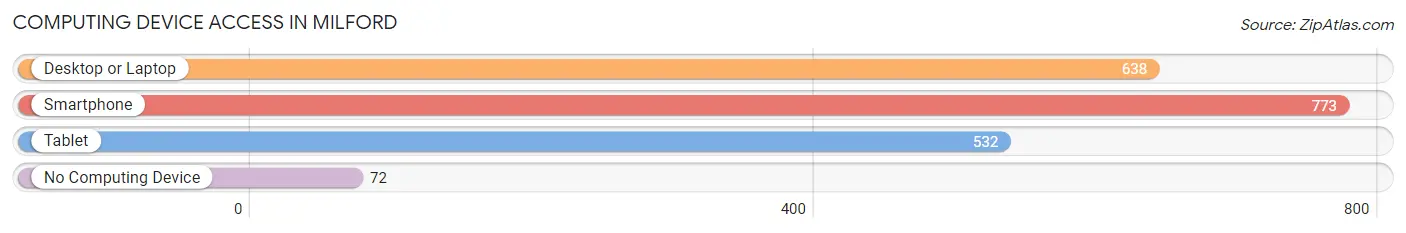
| Device Type | # Households | % Households |
| Desktop or Laptop | 638 | 66.8% |
| Smartphone | 773 | 80.9% |
| Tablet | 532 | 55.7% |
| No Computing Device | 72 | 7.5% |
| Total | 955 | 100.0% |
Internet Access in Milford
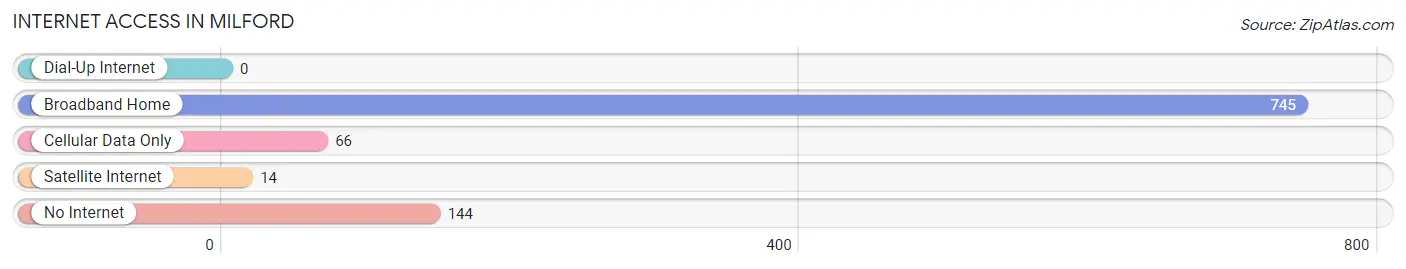
| Internet Type | # Households | % Households |
| Dial-Up Internet | 0 | 0.0% |
| Broadband Home | 745 | 78.0% |
| Cellular Data Only | 66 | 6.9% |
| Satellite Internet | 14 | 1.5% |
| No Internet | 144 | 15.1% |
| Total | 955 | 100.0% |
Milford Summary
Milford, Maine is a small town located in Penobscot County, in the state of Maine. It is situated on the banks of the Penobscot River, and is part of the Bangor metropolitan area. The town has a population of approximately 1,500 people, and is known for its rural charm and natural beauty.
History
The area that is now Milford was first settled in 1790 by a group of settlers from Massachusetts. The town was originally known as “Mudford”, due to the muddy conditions of the area. The name was changed to Milford in 1820, and the town was incorporated in 1824.
The town was primarily an agricultural community, with the main crops being potatoes, hay, and oats. The town also had a thriving lumber industry, and was home to several sawmills. The town also had a thriving shipbuilding industry, and was home to several shipyards.
Geography
Milford is located in Penobscot County, in the state of Maine. It is situated on the banks of the Penobscot River, and is part of the Bangor metropolitan area. The town has a total area of 8.3 square miles, of which 8.2 square miles is land and 0.1 square miles is water.
The town is located in a rural area, and is surrounded by forests and rolling hills. The town is home to several lakes, including Milford Pond, which is the largest lake in the area. The town is also home to several streams, including the Penobscot River.
Economy
The economy of Milford is primarily based on agriculture and tourism. The town is home to several farms, which produce a variety of crops, including potatoes, hay, and oats. The town is also home to several sawmills, which produce lumber for the local market.
The town is also home to several tourist attractions, including the Milford Historical Society Museum, the Milford Nature Center, and the Milford Drive-In Theater. The town is also home to several restaurants, shops, and other businesses.
Demographics
As of the 2010 census, the population of Milford was 1,521. The racial makeup of the town was 97.3% White, 0.7% African American, 0.2% Native American, 0.3% Asian, 0.1% from other races, and 1.4% from two or more races. Hispanic or Latino of any race were 0.7% of the population.
The median income for a household in the town was $41,250, and the median income for a family was $50,000. The per capita income for the town was $20,945. About 10.3% of families and 13.2% of the population were below the poverty line, including 16.2% of those under age 18 and 8.3% of those age 65 or over.
Common Questions
What is Per Capita Income in Milford?
Per Capita income in Milford is $29,023.
What is the Median Family Income in Milford?
Median Family Income in Milford is $73,932.
What is the Median Household income in Milford?
Median Household Income in Milford is $59,053.
What is Income or Wage Gap in Milford?
Income or Wage Gap in Milford is 5.4%.
Women in Milford earn 94.6 cents for every dollar earned by a man.
What is Inequality or Gini Index in Milford?
Inequality or Gini Index in Milford is 0.41.
What is the Total Population of Milford?
Total Population of Milford is 2,270.
What is the Total Male Population of Milford?
Total Male Population of Milford is 1,383.
What is the Total Female Population of Milford?
Total Female Population of Milford is 887.
What is the Ratio of Males per 100 Females in Milford?
There are 155.92 Males per 100 Females in Milford.
What is the Ratio of Females per 100 Males in Milford?
There are 64.14 Females per 100 Males in Milford.
What is the Median Population Age in Milford?
Median Population Age in Milford is 42.0 Years.
What is the Average Family Size in Milford
Average Family Size in Milford is 3.0 People.
What is the Average Household Size in Milford
Average Household Size in Milford is 2.4 People.
How Large is the Labor Force in Milford?
There are 1,196 People in the Labor Forcein in Milford.
What is the Percentage of People in the Labor Force in Milford?
60.5% of People are in the Labor Force in Milford.
What is the Unemployment Rate in Milford?
Unemployment Rate in Milford is 3.5%.