Gardiner, ME Map & Demographics
Gardiner Map
Gardiner Overview
$35,701
PER CAPITA INCOME
$86,250
AVG FAMILY INCOME
$57,329
AVG HOUSEHOLD INCOME
3.6%
WAGE / INCOME GAP [ % ]
96.4¢/ $1
WAGE / INCOME GAP [ $ ]
0.46
INEQUALITY / GINI INDEX
5,994
TOTAL POPULATION
3,148
MALE POPULATION
2,846
FEMALE POPULATION
110.61
MALES / 100 FEMALES
90.41
FEMALES / 100 MALES
43.2
MEDIAN AGE
3.0
AVG FAMILY SIZE
2.3
AVG HOUSEHOLD SIZE
2,874
LABOR FORCE [ PEOPLE ]
58.1%
PERCENT IN LABOR FORCE
10.2%
UNEMPLOYMENT RATE
Gardiner Zip Codes
Gardiner Area Codes
Income in Gardiner
Income Overview in Gardiner
Per Capita Income in Gardiner is $35,701, while median incomes of families and households are $86,250 and $57,329 respectively.
| Characteristic | Number | Measure |
| Per Capita Income | 5,994 | $35,701 |
| Median Family Income | 1,534 | $86,250 |
| Mean Family Income | 1,534 | $90,916 |
| Median Household Income | 2,612 | $57,329 |
| Mean Household Income | 2,612 | $78,777 |
| Income Deficit | 1,534 | $0 |
| Wage / Income Gap (%) | 5,994 | 3.60% |
| Wage / Income Gap ($) | 5,994 | 96.40¢ per $1 |
| Gini / Inequality Index | 5,994 | 0.46 |
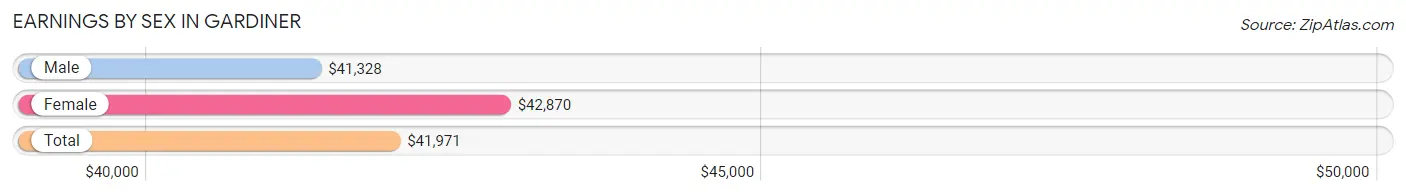
Earnings by Sex in Gardiner
Average Earnings in Gardiner are $41,971, $41,328 for men and $42,870 for women, a difference of 3.6%.
| Sex | Number | Average Earnings |
| Male | 1,644 (54.1%) | $41,328 |
| Female | 1,393 (45.9%) | $42,870 |
| Total | 3,037 (100.0%) | $41,971 |
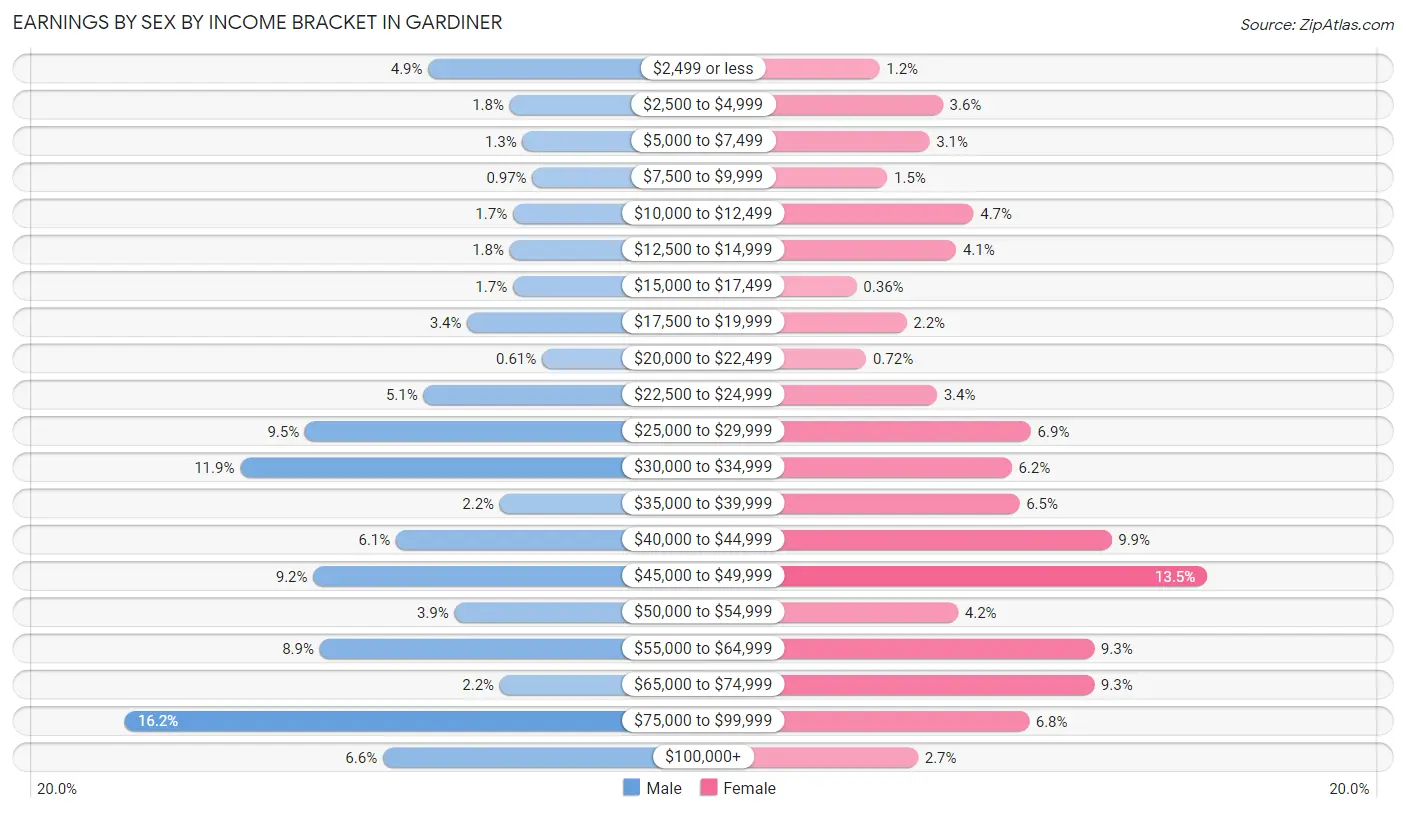
Earnings by Sex by Income Bracket in Gardiner
The most common earnings brackets in Gardiner are $75,000 to $99,999 for men (267 | 16.2%) and $45,000 to $49,999 for women (188 | 13.5%).
| Income | Male | Female |
| $2,499 or less | 80 (4.9%) | 17 (1.2%) |
| $2,500 to $4,999 | 30 (1.8%) | 50 (3.6%) |
| $5,000 to $7,499 | 22 (1.3%) | 43 (3.1%) |
| $7,500 to $9,999 | 16 (1.0%) | 21 (1.5%) |
| $10,000 to $12,499 | 28 (1.7%) | 66 (4.7%) |
| $12,500 to $14,999 | 30 (1.8%) | 57 (4.1%) |
| $15,000 to $17,499 | 28 (1.7%) | 5 (0.4%) |
| $17,500 to $19,999 | 56 (3.4%) | 31 (2.2%) |
| $20,000 to $22,499 | 10 (0.6%) | 10 (0.7%) |
| $22,500 to $24,999 | 83 (5.1%) | 47 (3.4%) |
| $25,000 to $29,999 | 156 (9.5%) | 96 (6.9%) |
| $30,000 to $34,999 | 196 (11.9%) | 86 (6.2%) |
| $35,000 to $39,999 | 36 (2.2%) | 90 (6.5%) |
| $40,000 to $44,999 | 100 (6.1%) | 138 (9.9%) |
| $45,000 to $49,999 | 151 (9.2%) | 188 (13.5%) |
| $50,000 to $54,999 | 64 (3.9%) | 58 (4.2%) |
| $55,000 to $64,999 | 147 (8.9%) | 129 (9.3%) |
| $65,000 to $74,999 | 36 (2.2%) | 129 (9.3%) |
| $75,000 to $99,999 | 267 (16.2%) | 95 (6.8%) |
| $100,000+ | 108 (6.6%) | 37 (2.7%) |
| Total | 1,644 (100.0%) | 1,393 (100.0%) |
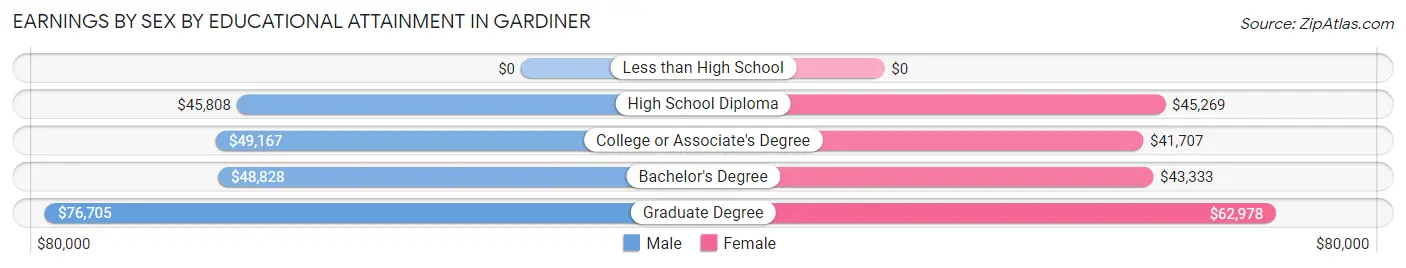
Earnings by Sex by Educational Attainment in Gardiner
Average earnings in Gardiner are $47,376 for men and $44,597 for women, a difference of 5.9%. Men with an educational attainment of graduate degree enjoy the highest average annual earnings of $76,705, while those with high school diploma education earn the least with $45,808. Women with an educational attainment of graduate degree earn the most with the average annual earnings of $62,978, while those with college or associate's degree education have the smallest earnings of $41,707.
| Educational Attainment | Male Income | Female Income |
| Less than High School | - | - |
| High School Diploma | $45,808 | $45,269 |
| College or Associate's Degree | $49,167 | $41,707 |
| Bachelor's Degree | $48,828 | $43,333 |
| Graduate Degree | $76,705 | $62,978 |
| Total | $47,376 | $44,597 |
Family Income in Gardiner
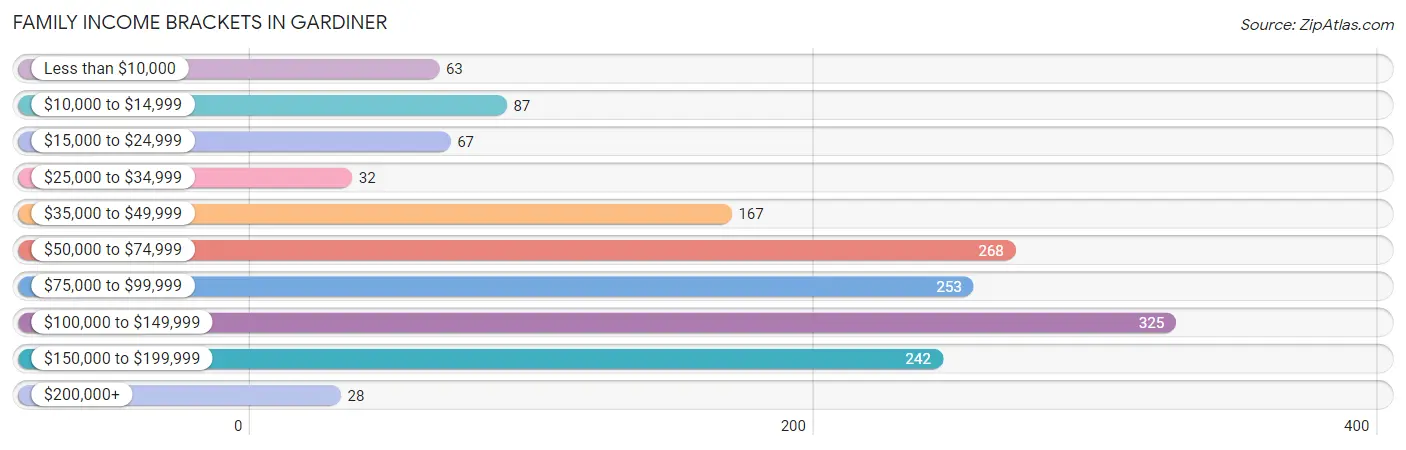
Family Income Brackets in Gardiner
According to the Gardiner family income data, there are 325 families falling into the $100,000 to $149,999 income range, which is the most common income bracket and makes up 21.2% of all families. Conversely, the $200,000+ income bracket is the least frequent group with only 28 families (1.8%) belonging to this category.
| Income Bracket | # Families | % Families |
| Less than $10,000 | 63 | 4.1% |
| $10,000 to $14,999 | 87 | 5.7% |
| $15,000 to $24,999 | 67 | 4.4% |
| $25,000 to $34,999 | 32 | 2.1% |
| $35,000 to $49,999 | 167 | 10.9% |
| $50,000 to $74,999 | 268 | 17.5% |
| $75,000 to $99,999 | 253 | 16.5% |
| $100,000 to $149,999 | 325 | 21.2% |
| $150,000 to $199,999 | 242 | 15.8% |
| $200,000+ | 28 | 1.8% |
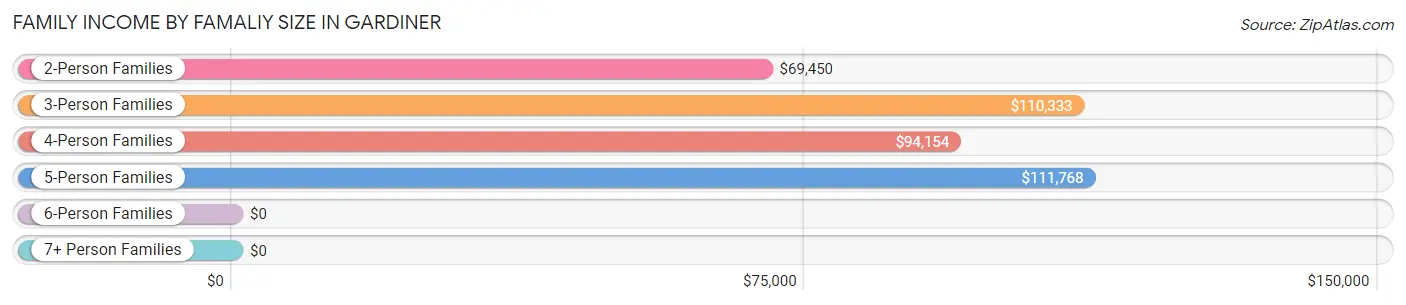
Family Income by Famaliy Size in Gardiner
5-person families (90 | 5.9%) account for the highest median family income in Gardiner with $111,768 per family, while 3-person families (236 | 15.4%) have the highest median income of $36,778 per family member.
| Income Bracket | # Families | Median Income |
| 2-Person Families | 907 (59.1%) | $69,450 |
| 3-Person Families | 236 (15.4%) | $110,333 |
| 4-Person Families | 241 (15.7%) | $94,154 |
| 5-Person Families | 90 (5.9%) | $111,768 |
| 6-Person Families | 37 (2.4%) | $0 |
| 7+ Person Families | 23 (1.5%) | $0 |
| Total | 1,534 (100.0%) | $86,250 |
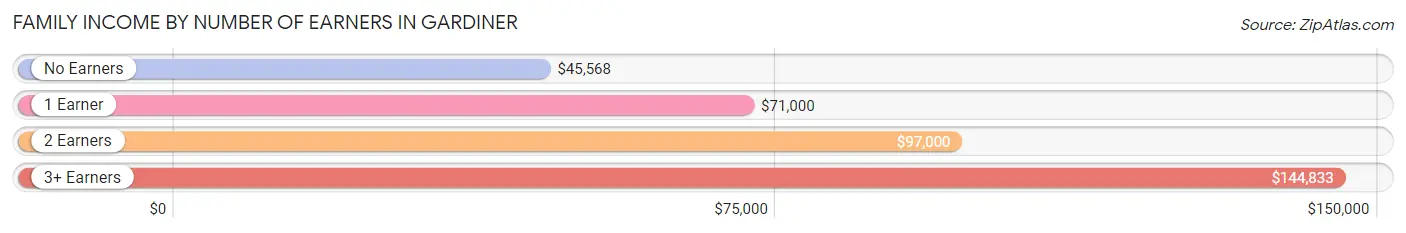
Family Income by Number of Earners in Gardiner
The median family income in Gardiner is $86,250, with families comprising 3+ earners (228) having the highest median family income of $144,833, while families with no earners (440) have the lowest median family income of $45,568, accounting for 14.9% and 28.7% of families, respectively.
| Number of Earners | # Families | Median Income |
| No Earners | 440 (28.7%) | $45,568 |
| 1 Earner | 380 (24.8%) | $71,000 |
| 2 Earners | 486 (31.7%) | $97,000 |
| 3+ Earners | 228 (14.9%) | $144,833 |
| Total | 1,534 (100.0%) | $86,250 |
Household Income in Gardiner
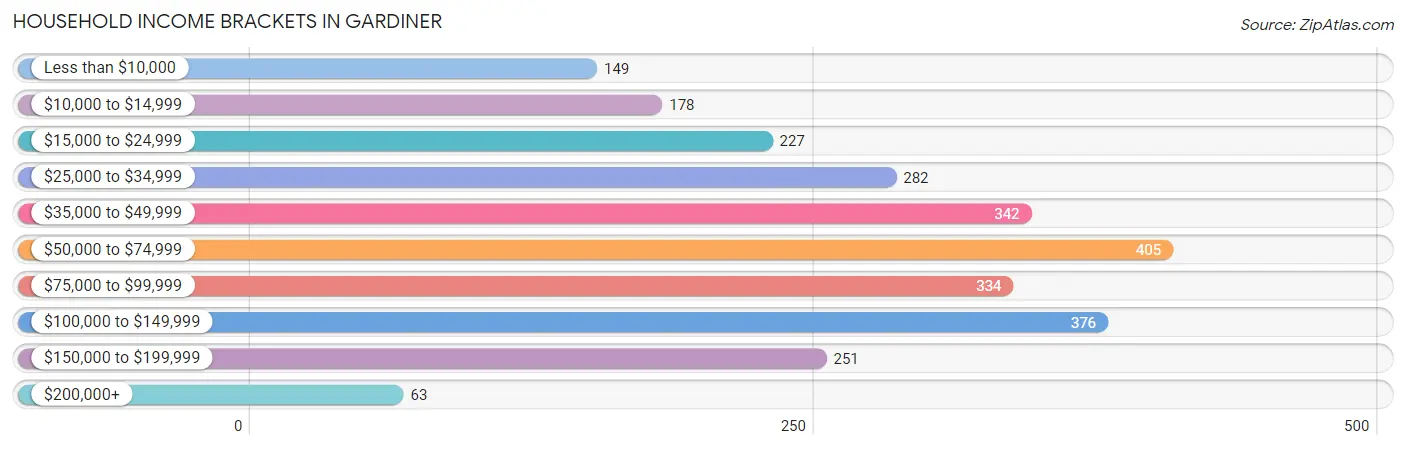
Household Income Brackets in Gardiner
With 405 households falling in the category, the $50,000 to $74,999 income range is the most frequent in Gardiner, accounting for 15.5% of all households. In contrast, only 63 households (2.4%) fall into the $200,000+ income bracket, making it the least populous group.
| Income Bracket | # Households | % Households |
| Less than $10,000 | 149 | 5.7% |
| $10,000 to $14,999 | 178 | 6.8% |
| $15,000 to $24,999 | 227 | 8.7% |
| $25,000 to $34,999 | 282 | 10.8% |
| $35,000 to $49,999 | 342 | 13.1% |
| $50,000 to $74,999 | 405 | 15.5% |
| $75,000 to $99,999 | 334 | 12.8% |
| $100,000 to $149,999 | 376 | 14.4% |
| $150,000 to $199,999 | 251 | 9.6% |
| $200,000+ | 63 | 2.4% |
Household Income by Householder Age in Gardiner
The median household income in Gardiner is $57,329, with the highest median household income of $88,320 found in the 45 to 64 years age bracket for the primary householder. A total of 793 households (30.4%) fall into this category. Meanwhile, the 15 to 24 years age bracket for the primary householder has the lowest median household income of $0, with 144 households (5.5%) in this group.
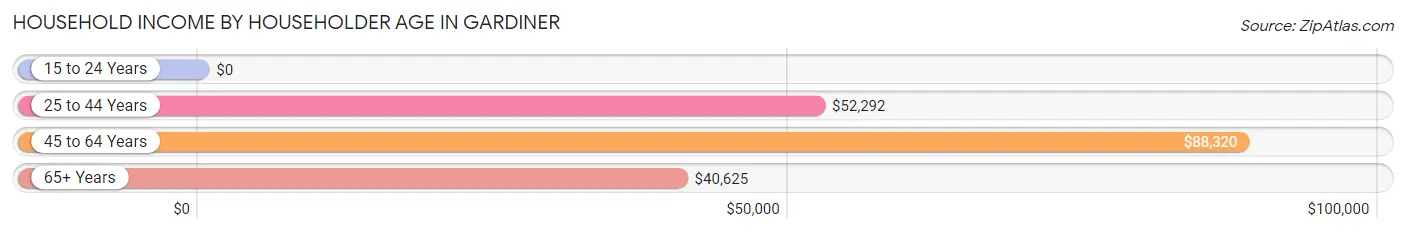
| Income Bracket | # Households | Median Income |
| 15 to 24 Years | 144 (5.5%) | $0 |
| 25 to 44 Years | 761 (29.1%) | $52,292 |
| 45 to 64 Years | 793 (30.4%) | $88,320 |
| 65+ Years | 914 (35.0%) | $40,625 |
| Total | 2,612 (100.0%) | $57,329 |
Poverty in Gardiner
Income Below Poverty by Sex and Age in Gardiner
With 11.4% poverty level for males and 15.8% for females among the residents of Gardiner, 12 to 14 year old males and 6 to 11 year old females are the most vulnerable to poverty, with 33 males (45.2%) and 78 females (35.0%) in their respective age groups living below the poverty level.
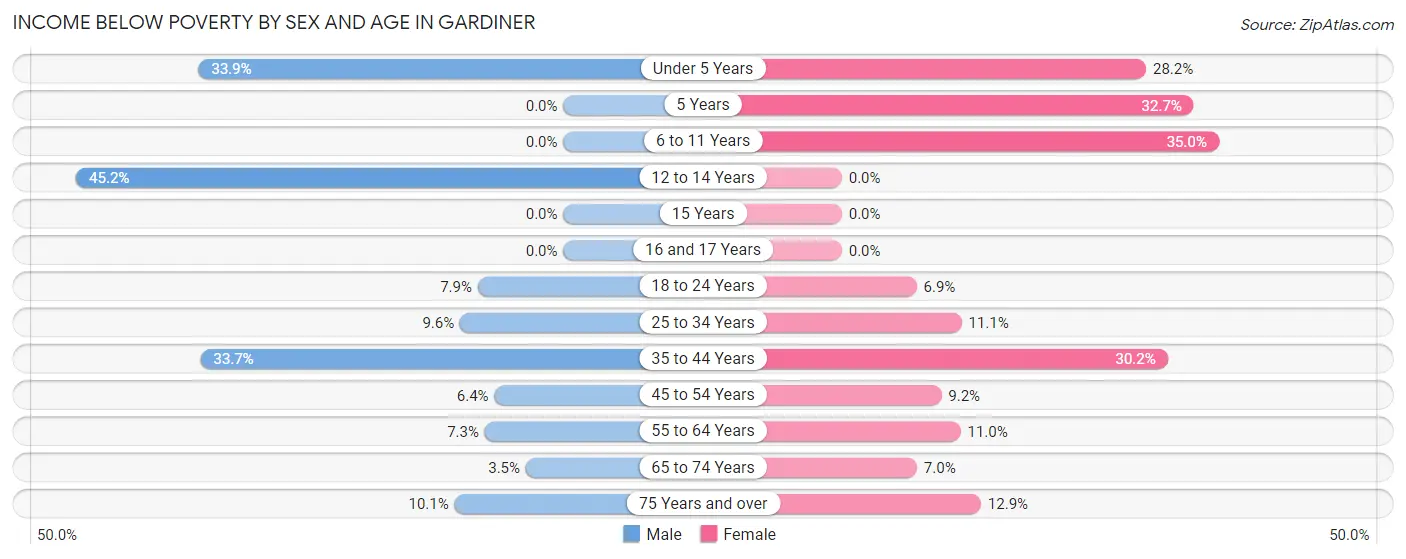
| Age Bracket | Male | Female |
| Under 5 Years | 62 (33.9%) | 24 (28.2%) |
| 5 Years | 0 (0.0%) | 32 (32.7%) |
| 6 to 11 Years | 0 (0.0%) | 78 (35.0%) |
| 12 to 14 Years | 33 (45.2%) | 0 (0.0%) |
| 15 Years | 0 (0.0%) | 0 (0.0%) |
| 16 and 17 Years | 0 (0.0%) | 0 (0.0%) |
| 18 to 24 Years | 34 (7.9%) | 10 (6.9%) |
| 25 to 34 Years | 37 (9.6%) | 35 (11.1%) |
| 35 to 44 Years | 96 (33.7%) | 120 (30.2%) |
| 45 to 54 Years | 31 (6.4%) | 33 (9.2%) |
| 55 to 64 Years | 25 (7.3%) | 39 (11.0%) |
| 65 to 74 Years | 13 (3.5%) | 26 (7.0%) |
| 75 Years and over | 21 (10.1%) | 47 (12.9%) |
| Total | 352 (11.4%) | 444 (15.8%) |
Income Above Poverty by Sex and Age in Gardiner
According to the poverty statistics in Gardiner, males aged 5 years and females aged 12 to 14 years are the age groups that are most secure financially, with 100.0% of males and 100.0% of females in these age groups living above the poverty line.
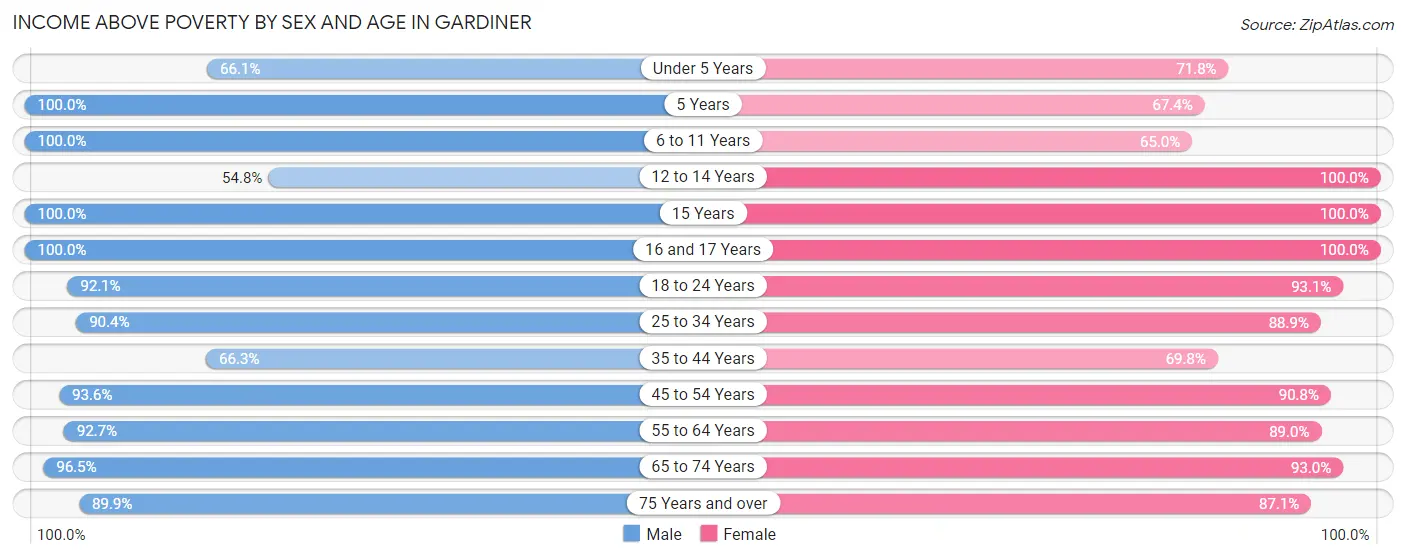
| Age Bracket | Male | Female |
| Under 5 Years | 121 (66.1%) | 61 (71.8%) |
| 5 Years | 33 (100.0%) | 66 (67.3%) |
| 6 to 11 Years | 186 (100.0%) | 145 (65.0%) |
| 12 to 14 Years | 40 (54.8%) | 47 (100.0%) |
| 15 Years | 35 (100.0%) | 14 (100.0%) |
| 16 and 17 Years | 60 (100.0%) | 36 (100.0%) |
| 18 to 24 Years | 394 (92.1%) | 134 (93.1%) |
| 25 to 34 Years | 349 (90.4%) | 280 (88.9%) |
| 35 to 44 Years | 189 (66.3%) | 277 (69.8%) |
| 45 to 54 Years | 453 (93.6%) | 324 (90.8%) |
| 55 to 64 Years | 318 (92.7%) | 315 (89.0%) |
| 65 to 74 Years | 361 (96.5%) | 347 (93.0%) |
| 75 Years and over | 187 (89.9%) | 317 (87.1%) |
| Total | 2,726 (88.6%) | 2,363 (84.2%) |
Income Below Poverty Among Married-Couple Families in Gardiner
The poverty statistics for married-couple families in Gardiner show that 7.2% or 83 of the total 1,157 families live below the poverty line. Families with 1 or 2 children have the highest poverty rate of 14.1%, comprising of 35 families. On the other hand, families with no children have the lowest poverty rate of 4.4%, which includes 36 families.
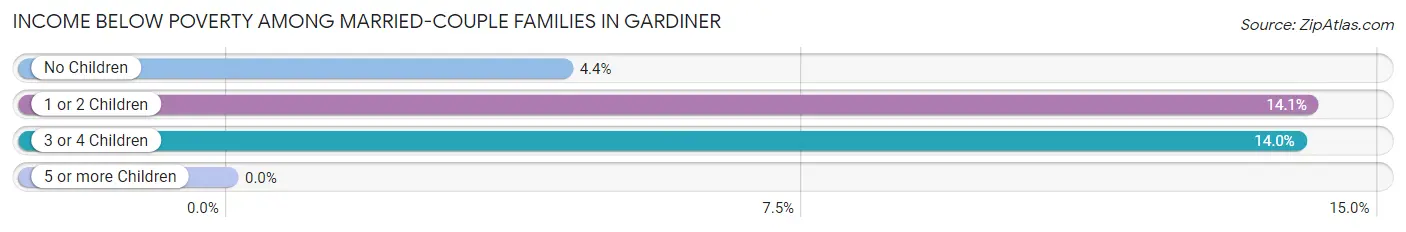
| Children | Above Poverty | Below Poverty |
| No Children | 787 (95.6%) | 36 (4.4%) |
| 1 or 2 Children | 213 (85.9%) | 35 (14.1%) |
| 3 or 4 Children | 74 (86.1%) | 12 (14.0%) |
| 5 or more Children | 0 (0.0%) | 0 (0.0%) |
| Total | 1,074 (92.8%) | 83 (7.2%) |
Income Below Poverty Among Single-Parent Households in Gardiner
According to the poverty data in Gardiner, 3.6% or 4 single-father households and 31.8% or 85 single-mother households are living below the poverty line. Among single-father households, those with no children have the highest poverty rate, with 4 households (4.1%) experiencing poverty. Likewise, among single-mother households, those with 1 or 2 children have the highest poverty rate, with 79 households (52.7%) falling below the poverty line.
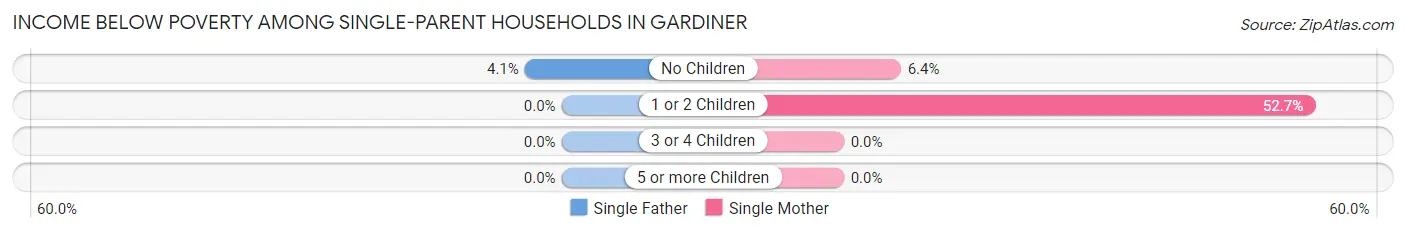
| Children | Single Father | Single Mother |
| No Children | 4 (4.1%) | 6 (6.4%) |
| 1 or 2 Children | 0 (0.0%) | 79 (52.7%) |
| 3 or 4 Children | 0 (0.0%) | 0 (0.0%) |
| 5 or more Children | 0 (0.0%) | 0 (0.0%) |
| Total | 4 (3.6%) | 85 (31.8%) |
Income Below Poverty Among Married-Couple vs Single-Parent Households in Gardiner
The poverty data for Gardiner shows that 83 of the married-couple family households (7.2%) and 89 of the single-parent households (23.6%) are living below the poverty level. Within the married-couple family households, those with 1 or 2 children have the highest poverty rate, with 35 households (14.1%) falling below the poverty line. Among the single-parent households, those with 1 or 2 children have the highest poverty rate, with 79 household (48.5%) living below poverty.
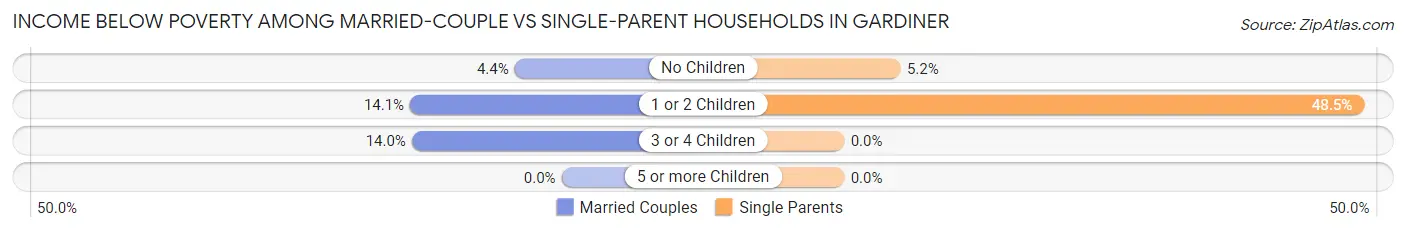
| Children | Married-Couple Families | Single-Parent Households |
| No Children | 36 (4.4%) | 10 (5.2%) |
| 1 or 2 Children | 35 (14.1%) | 79 (48.5%) |
| 3 or 4 Children | 12 (14.0%) | 0 (0.0%) |
| 5 or more Children | 0 (0.0%) | 0 (0.0%) |
| Total | 83 (7.2%) | 89 (23.6%) |
Race in Gardiner
The most populous races in Gardiner are White / Caucasian (5,664 | 94.5%), Two or more Races (192 | 3.2%), and Some other Race (91 | 1.5%).
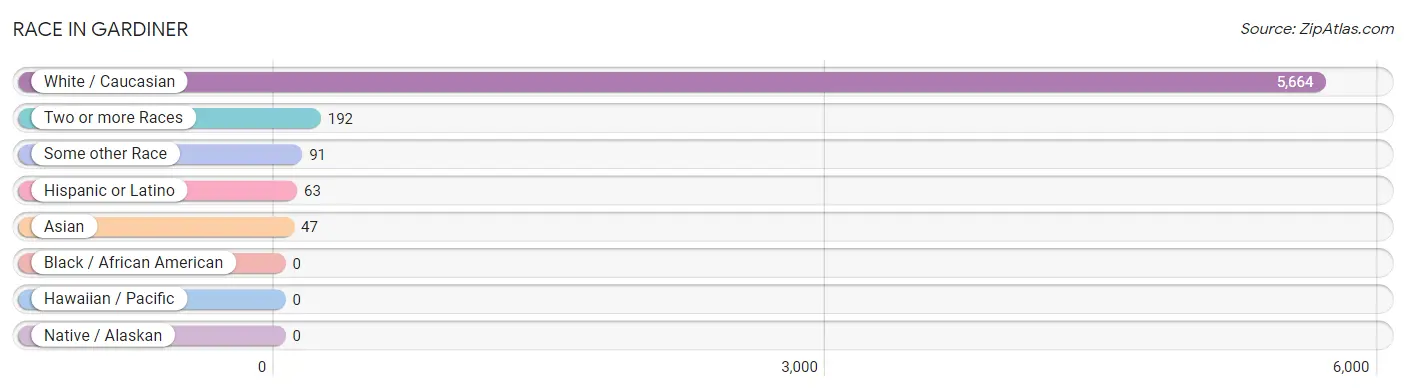
| Race | # Population | % Population |
| Asian | 47 | 0.8% |
| Black / African American | 0 | 0.0% |
| Hawaiian / Pacific | 0 | 0.0% |
| Hispanic or Latino | 63 | 1.1% |
| Native / Alaskan | 0 | 0.0% |
| White / Caucasian | 5,664 | 94.5% |
| Two or more Races | 192 | 3.2% |
| Some other Race | 91 | 1.5% |
| Total | 5,994 | 100.0% |
Ancestry in Gardiner
The most populous ancestries reported in Gardiner are English (1,097 | 18.3%), Irish (974 | 16.3%), French (582 | 9.7%), American (490 | 8.2%), and German (402 | 6.7%), together accounting for 59.1% of all Gardiner residents.
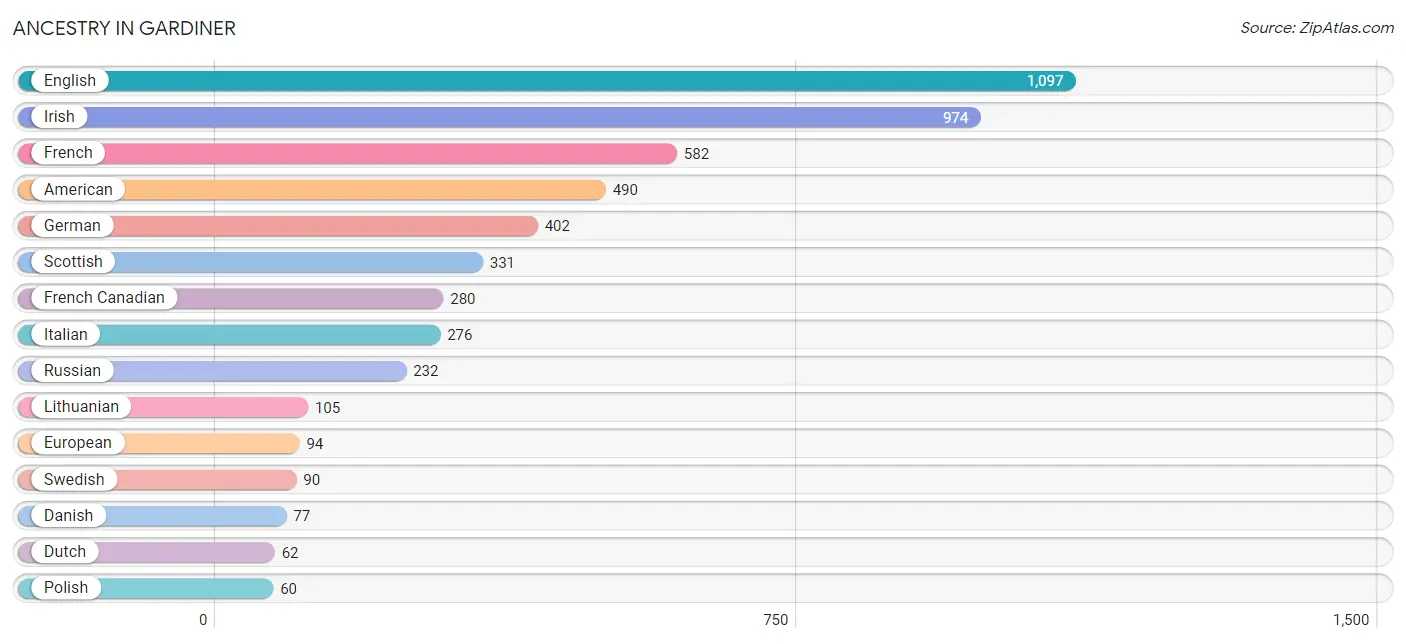
| Ancestry | # Population | % Population |
| American | 490 | 8.2% |
| Austrian | 15 | 0.3% |
| Bhutanese | 11 | 0.2% |
| British | 6 | 0.1% |
| Burmese | 9 | 0.2% |
| Canadian | 51 | 0.9% |
| Czechoslovakian | 10 | 0.2% |
| Danish | 77 | 1.3% |
| Dutch | 62 | 1.0% |
| English | 1,097 | 18.3% |
| European | 94 | 1.6% |
| Finnish | 21 | 0.4% |
| French | 582 | 9.7% |
| French Canadian | 280 | 4.7% |
| German | 402 | 6.7% |
| Greek | 58 | 1.0% |
| Hungarian | 49 | 0.8% |
| Indian (Asian) | 25 | 0.4% |
| Irish | 974 | 16.3% |
| Italian | 276 | 4.6% |
| Lithuanian | 105 | 1.8% |
| Mexican | 13 | 0.2% |
| Norwegian | 20 | 0.3% |
| Pakistani | 10 | 0.2% |
| Pennsylvania German | 24 | 0.4% |
| Peruvian | 50 | 0.8% |
| Polish | 60 | 1.0% |
| Portuguese | 11 | 0.2% |
| Russian | 232 | 3.9% |
| Scandinavian | 12 | 0.2% |
| Scotch-Irish | 59 | 1.0% |
| Scottish | 331 | 5.5% |
| Serbian | 9 | 0.2% |
| Slovene | 38 | 0.6% |
| South African | 26 | 0.4% |
| South American | 50 | 0.8% |
| Sri Lankan | 44 | 0.7% |
| Subsaharan African | 26 | 0.4% |
| Swedish | 90 | 1.5% |
| Swiss | 8 | 0.1% |
| Ukrainian | 10 | 0.2% |
| Welsh | 9 | 0.2% | View All 42 Rows |
Immigrants in Gardiner
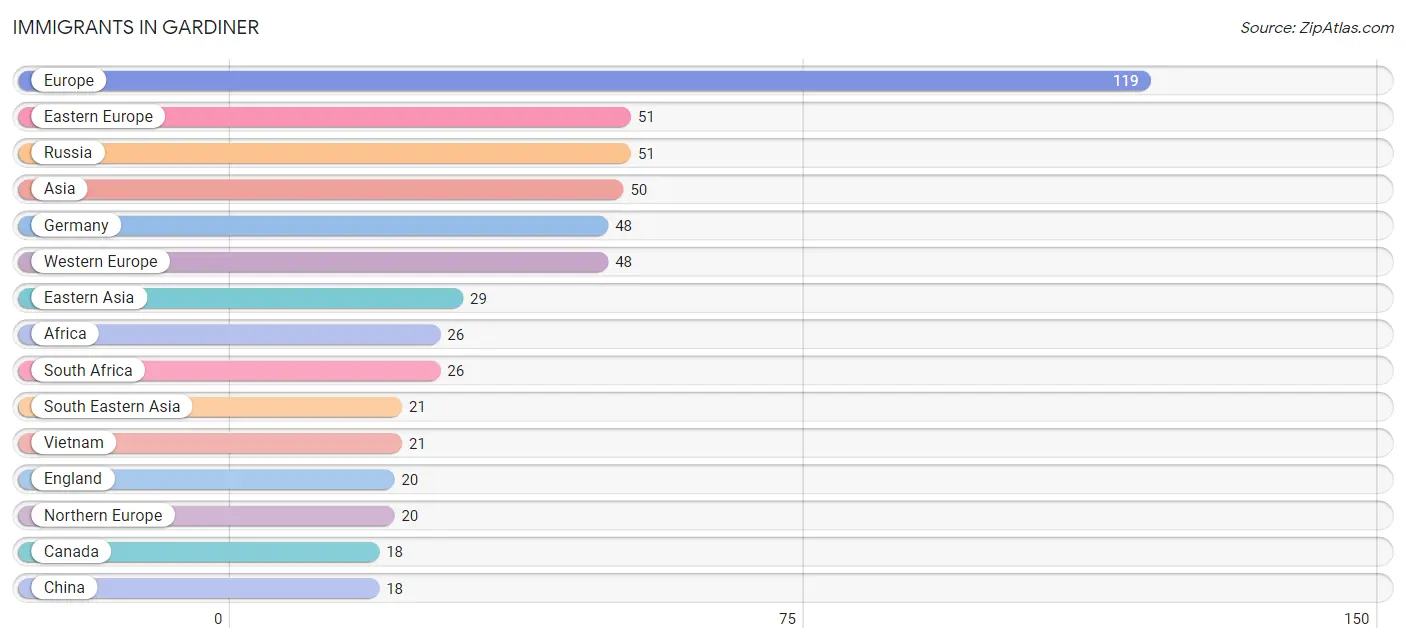
The most numerous immigrant groups reported in Gardiner came from Europe (119 | 2.0%), Eastern Europe (51 | 0.9%), Russia (51 | 0.9%), Asia (50 | 0.8%), and Germany (48 | 0.8%), together accounting for 5.3% of all Gardiner residents.
| Immigration Origin | # Population | % Population |
| Africa | 26 | 0.4% |
| Asia | 50 | 0.8% |
| Canada | 18 | 0.3% |
| China | 18 | 0.3% |
| Eastern Asia | 29 | 0.5% |
| Eastern Europe | 51 | 0.9% |
| England | 20 | 0.3% |
| Europe | 119 | 2.0% |
| Germany | 48 | 0.8% |
| Japan | 11 | 0.2% |
| Northern Europe | 20 | 0.3% |
| Russia | 51 | 0.9% |
| South Africa | 26 | 0.4% |
| South Eastern Asia | 21 | 0.4% |
| Vietnam | 21 | 0.4% |
| Western Europe | 48 | 0.8% | View All 16 Rows |
Sex and Age in Gardiner
Sex and Age in Gardiner
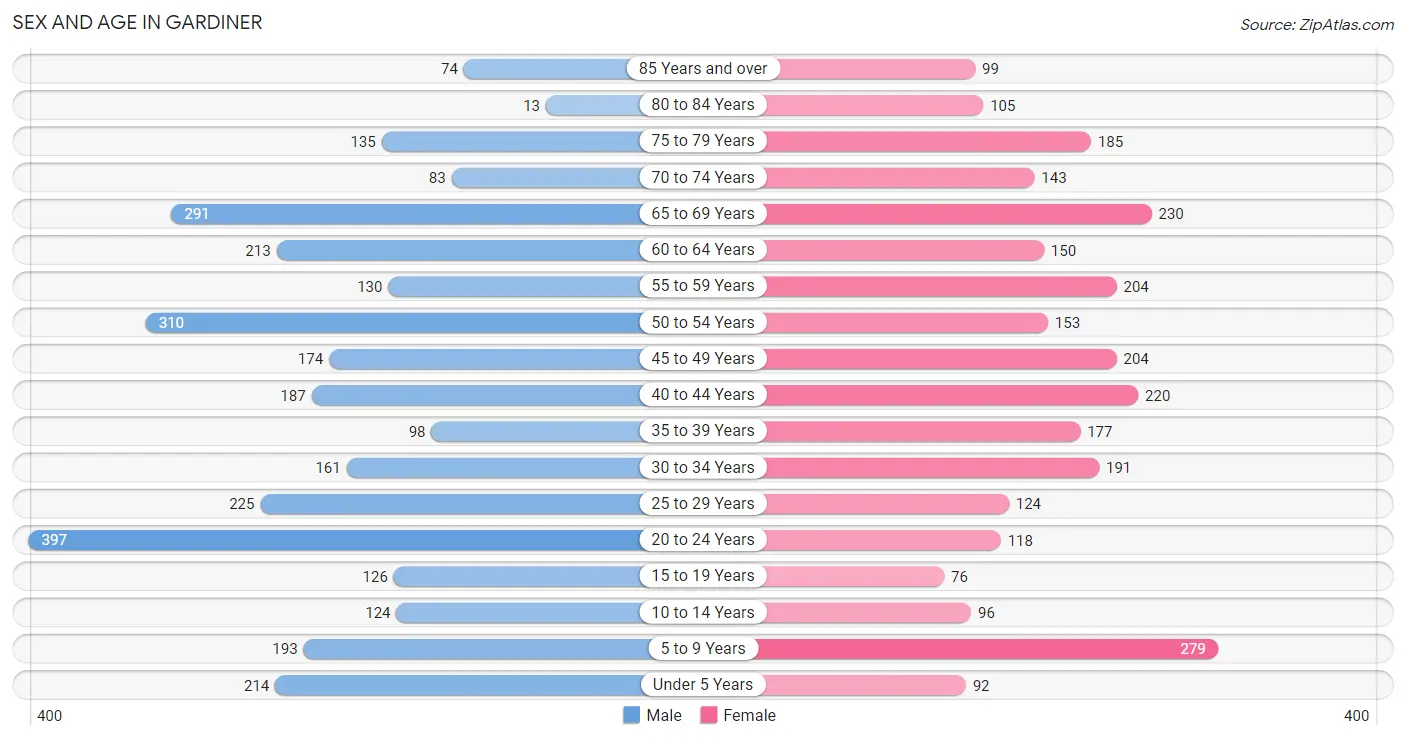
The most populous age groups in Gardiner are 20 to 24 Years (397 | 12.6%) for men and 5 to 9 Years (279 | 9.8%) for women.
| Age Bracket | Male | Female |
| Under 5 Years | 214 (6.8%) | 92 (3.2%) |
| 5 to 9 Years | 193 (6.1%) | 279 (9.8%) |
| 10 to 14 Years | 124 (3.9%) | 96 (3.4%) |
| 15 to 19 Years | 126 (4.0%) | 76 (2.7%) |
| 20 to 24 Years | 397 (12.6%) | 118 (4.2%) |
| 25 to 29 Years | 225 (7.1%) | 124 (4.4%) |
| 30 to 34 Years | 161 (5.1%) | 191 (6.7%) |
| 35 to 39 Years | 98 (3.1%) | 177 (6.2%) |
| 40 to 44 Years | 187 (5.9%) | 220 (7.7%) |
| 45 to 49 Years | 174 (5.5%) | 204 (7.2%) |
| 50 to 54 Years | 310 (9.9%) | 153 (5.4%) |
| 55 to 59 Years | 130 (4.1%) | 204 (7.2%) |
| 60 to 64 Years | 213 (6.8%) | 150 (5.3%) |
| 65 to 69 Years | 291 (9.2%) | 230 (8.1%) |
| 70 to 74 Years | 83 (2.6%) | 143 (5.0%) |
| 75 to 79 Years | 135 (4.3%) | 185 (6.5%) |
| 80 to 84 Years | 13 (0.4%) | 105 (3.7%) |
| 85 Years and over | 74 (2.4%) | 99 (3.5%) |
| Total | 3,148 (100.0%) | 2,846 (100.0%) |
Families and Households in Gardiner
Median Family Size in Gardiner
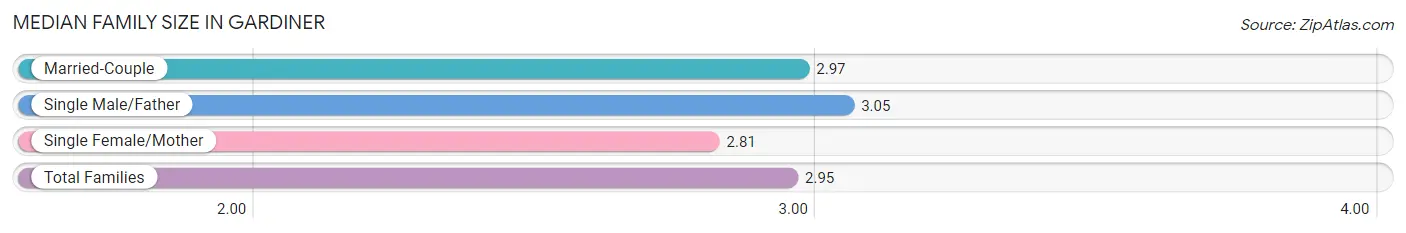
The median family size in Gardiner is 2.95 persons per family, with single male/father families (110 | 7.2%) accounting for the largest median family size of 3.05 persons per family. On the other hand, single female/mother families (267 | 17.4%) represent the smallest median family size with 2.81 persons per family.
| Family Type | # Families | Family Size |
| Married-Couple | 1,157 (75.4%) | 2.97 |
| Single Male/Father | 110 (7.2%) | 3.05 |
| Single Female/Mother | 267 (17.4%) | 2.81 |
| Total Families | 1,534 (100.0%) | 2.95 |
Median Household Size in Gardiner
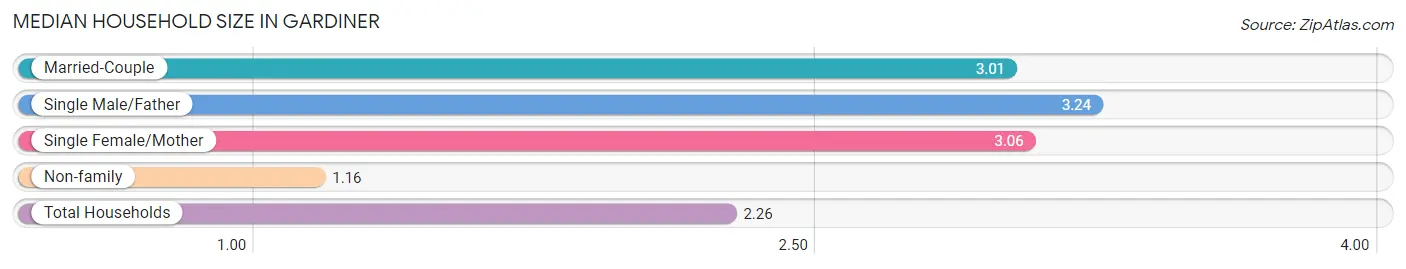
The median household size in Gardiner is 2.26 persons per household, with single male/father households (110 | 4.2%) accounting for the largest median household size of 3.24 persons per household. non-family households (1,078 | 41.3%) represent the smallest median household size with 1.16 persons per household.
| Household Type | # Households | Household Size |
| Married-Couple | 1,157 (44.3%) | 3.01 |
| Single Male/Father | 110 (4.2%) | 3.24 |
| Single Female/Mother | 267 (10.2%) | 3.06 |
| Non-family | 1,078 (41.3%) | 1.16 |
| Total Households | 2,612 (100.0%) | 2.26 |
Household Size by Marriage Status in Gardiner
Out of a total of 2,612 households in Gardiner, 1,534 (58.7%) are family households, while 1,078 (41.3%) are nonfamily households. The most numerous type of family households are 2-person households, comprising 858, and the most common type of nonfamily households are 1-person households, comprising 940.
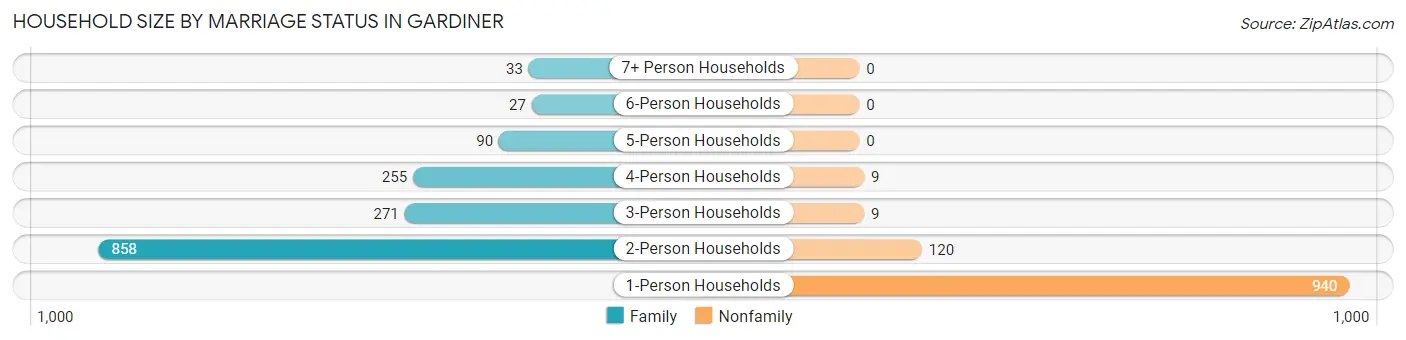
| Household Size | Family Households | Nonfamily Households |
| 1-Person Households | - | 940 (36.0%) |
| 2-Person Households | 858 (32.9%) | 120 (4.6%) |
| 3-Person Households | 271 (10.4%) | 9 (0.3%) |
| 4-Person Households | 255 (9.8%) | 9 (0.3%) |
| 5-Person Households | 90 (3.5%) | 0 (0.0%) |
| 6-Person Households | 27 (1.0%) | 0 (0.0%) |
| 7+ Person Households | 33 (1.3%) | 0 (0.0%) |
| Total | 1,534 (58.7%) | 1,078 (41.3%) |
Female Fertility in Gardiner
Fertility by Age in Gardiner
Average fertility rate in Gardiner is 31.0 births per 1,000 women. Women in the age bracket of 20 to 34 years have the highest fertility rate with 81.0 births per 1,000 women. Women in the age bracket of 20 to 34 years acount for 100.0% of all women with births.
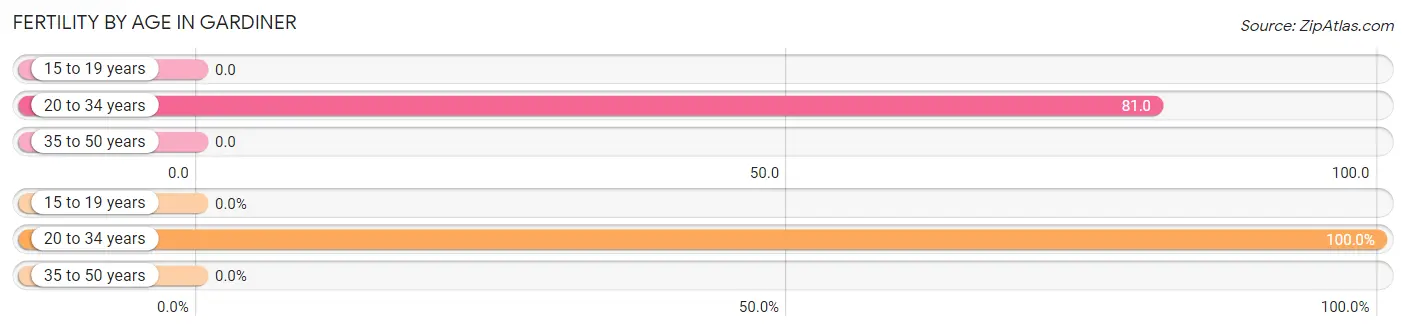
| Age Bracket | Women with Births | Births / 1,000 Women |
| 15 to 19 years | 0 (0.0%) | 0.0 |
| 20 to 34 years | 35 (100.0%) | 81.0 |
| 35 to 50 years | 0 (0.0%) | 0.0 |
| Total | 35 (100.0%) | 31.0 |
Fertility by Age by Marriage Status in Gardiner
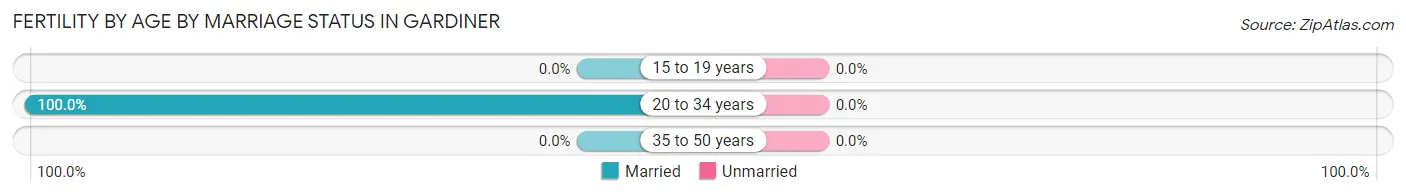
| Age Bracket | Married | Unmarried |
| 15 to 19 years | 0 (0.0%) | 0 (0.0%) |
| 20 to 34 years | 35 (100.0%) | 0 (0.0%) |
| 35 to 50 years | 0 (0.0%) | 0 (0.0%) |
| Total | 35 (100.0%) | 0 (0.0%) |
Fertility by Education in Gardiner
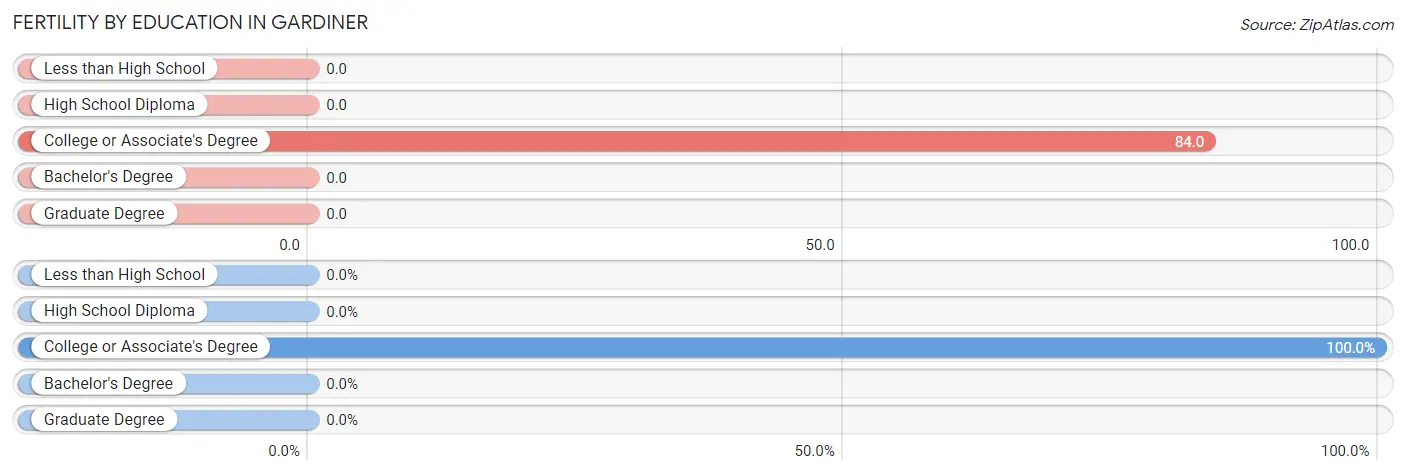
| Educational Attainment | Women with Births | Births / 1,000 Women |
| Less than High School | 0 (0.0%) | 0.0 |
| High School Diploma | 0 (0.0%) | 0.0 |
| College or Associate's Degree | 35 (100.0%) | 84.0 |
| Bachelor's Degree | 0 (0.0%) | 0.0 |
| Graduate Degree | 0 (0.0%) | 0.0 |
| Total | 35 (100.0%) | 31.0 |
Fertility by Education by Marriage Status in Gardiner
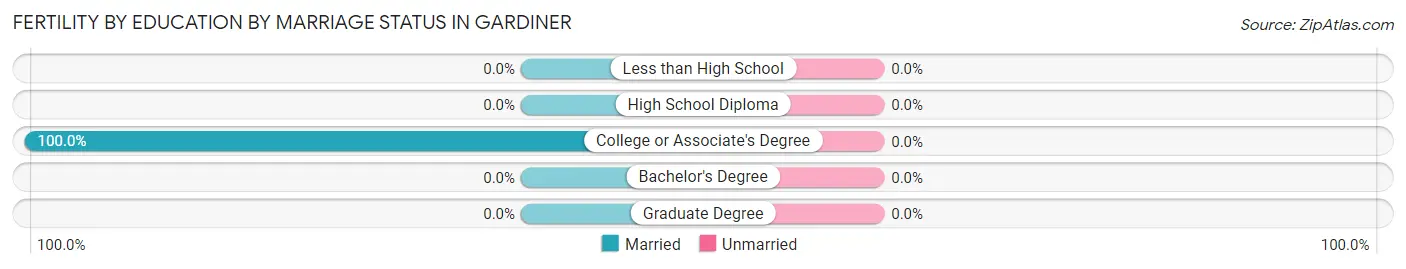
| Educational Attainment | Married | Unmarried |
| Less than High School | 0 (0.0%) | 0 (0.0%) |
| High School Diploma | 0 (0.0%) | 0 (0.0%) |
| College or Associate's Degree | 35 (100.0%) | 0 (0.0%) |
| Bachelor's Degree | 0 (0.0%) | 0 (0.0%) |
| Graduate Degree | 0 (0.0%) | 0 (0.0%) |
| Total | 35 (100.0%) | 0 (0.0%) |
Employment Characteristics in Gardiner
Employment by Class of Employer in Gardiner
Among the 2,548 employed individuals in Gardiner, private company employees (1,477 | 58.0%), state government employees (284 | 11.2%), and not-for-profit organizations (248 | 9.7%) make up the most common classes of employment.
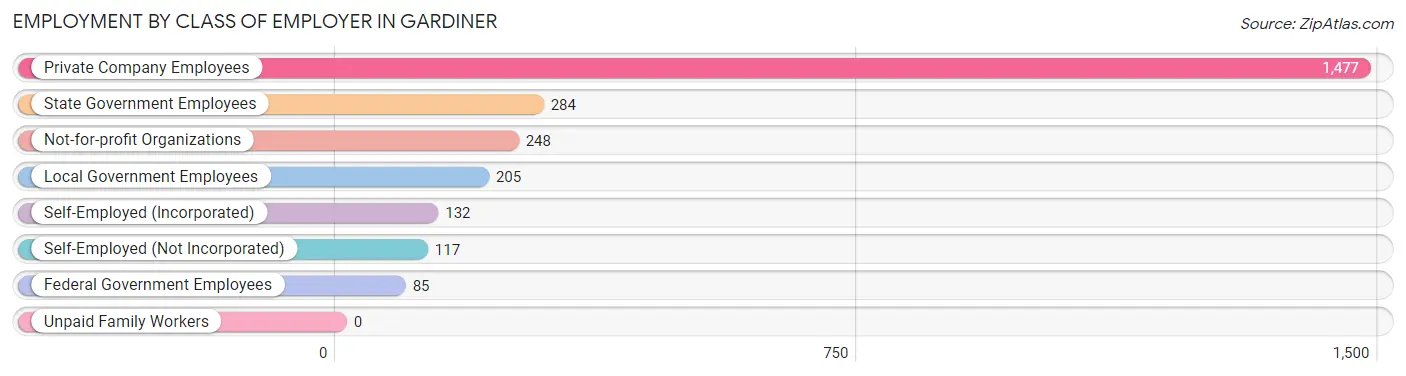
| Employer Class | # Employees | % Employees |
| Private Company Employees | 1,477 | 58.0% |
| Self-Employed (Incorporated) | 132 | 5.2% |
| Self-Employed (Not Incorporated) | 117 | 4.6% |
| Not-for-profit Organizations | 248 | 9.7% |
| Local Government Employees | 205 | 8.1% |
| State Government Employees | 284 | 11.2% |
| Federal Government Employees | 85 | 3.3% |
| Unpaid Family Workers | 0 | 0.0% |
| Total | 2,548 | 100.0% |
Employment Status by Age in Gardiner
According to the labor force statistics for Gardiner, out of the total population over 16 years of age (4,947), 58.1% or 2,874 individuals are in the labor force, with 10.2% or 293 of them unemployed. The age group with the highest labor force participation rate is 25 to 29 years, with 91.4% or 319 individuals in the labor force. Within the labor force, the 25 to 29 years age range has the highest percentage of unemployed individuals, with 24.5% or 78 of them being unemployed.
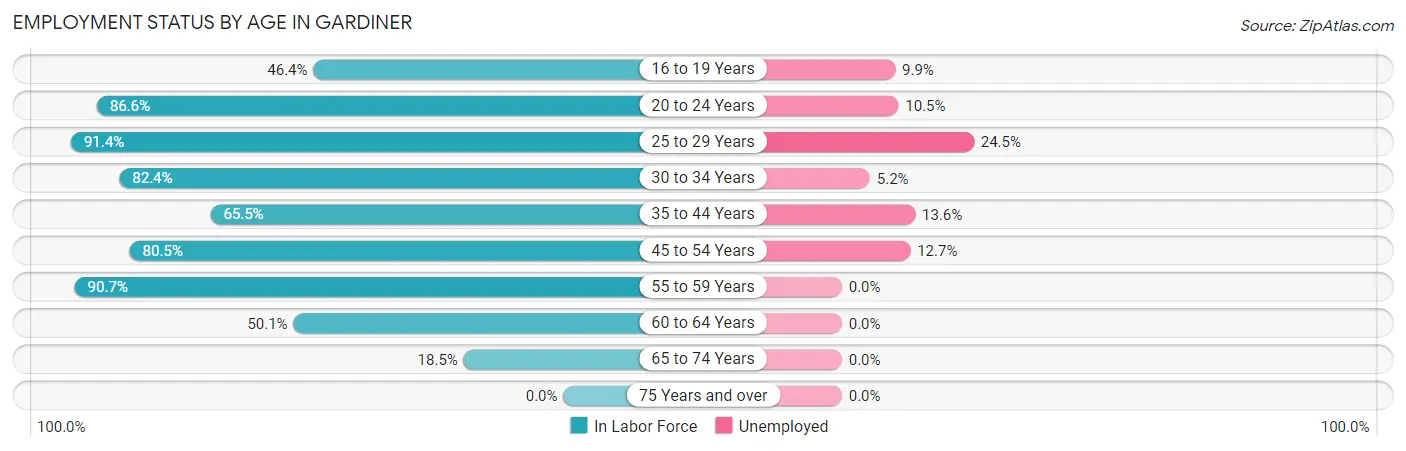
| Age Bracket | In Labor Force | Unemployed |
| 16 to 19 Years | 71 (46.4%) | 7 (9.9%) |
| 20 to 24 Years | 446 (86.6%) | 47 (10.5%) |
| 25 to 29 Years | 319 (91.4%) | 78 (24.5%) |
| 30 to 34 Years | 290 (82.4%) | 15 (5.2%) |
| 35 to 44 Years | 447 (65.5%) | 61 (13.6%) |
| 45 to 54 Years | 677 (80.5%) | 86 (12.7%) |
| 55 to 59 Years | 303 (90.7%) | 0 (0.0%) |
| 60 to 64 Years | 182 (50.1%) | 0 (0.0%) |
| 65 to 74 Years | 138 (18.5%) | 0 (0.0%) |
| 75 Years and over | 0 (0.0%) | 0 (0.0%) |
| Total | 2,874 (58.1%) | 293 (10.2%) |
Employment Status by Educational Attainment in Gardiner
According to labor force statistics for Gardiner, 75.9% of individuals (2,217) out of the total population between 25 and 64 years of age (2,921) are in the labor force, with 10.8% or 239 of them being unemployed. The group with the highest labor force participation rate are those with the educational attainment of bachelor's degree or higher, with 92.6% or 659 individuals in the labor force. Within the labor force, individuals with less than high school education have the highest percentage of unemployment, with 56.8% or 50 of them being unemployed.
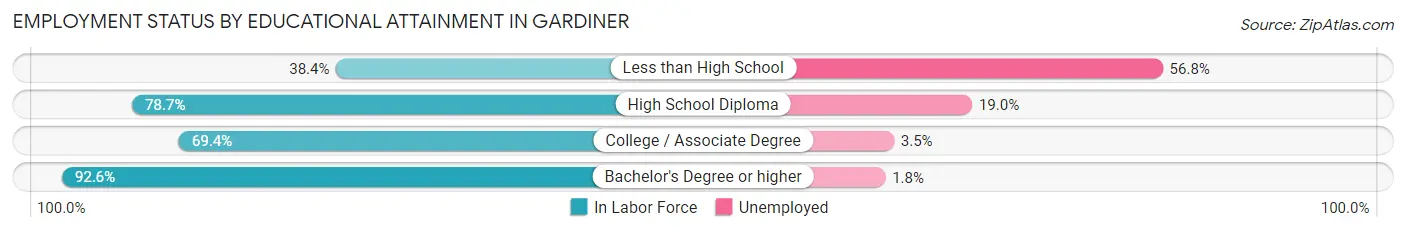
| Educational Attainment | In Labor Force | Unemployed |
| Less than High School | 88 (38.4%) | 130 (56.8%) |
| High School Diploma | 817 (78.7%) | 197 (19.0%) |
| College / Associate Degree | 654 (69.4%) | 33 (3.5%) |
| Bachelor's Degree or higher | 659 (92.6%) | 13 (1.8%) |
| Total | 2,217 (75.9%) | 315 (10.8%) |
Employment Occupations by Sex in Gardiner
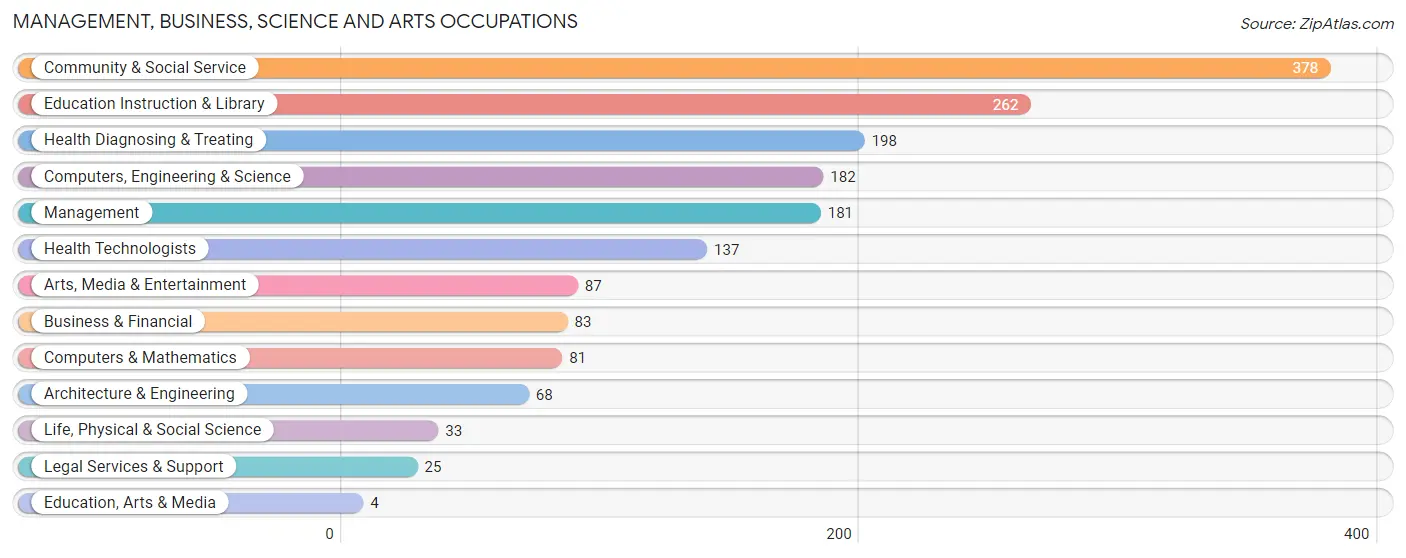
Management, Business, Science and Arts Occupations
The most common Management, Business, Science and Arts occupations in Gardiner are Community & Social Service (378 | 14.7%), Education Instruction & Library (262 | 10.2%), Health Diagnosing & Treating (198 | 7.7%), Computers, Engineering & Science (182 | 7.1%), and Management (181 | 7.0%).
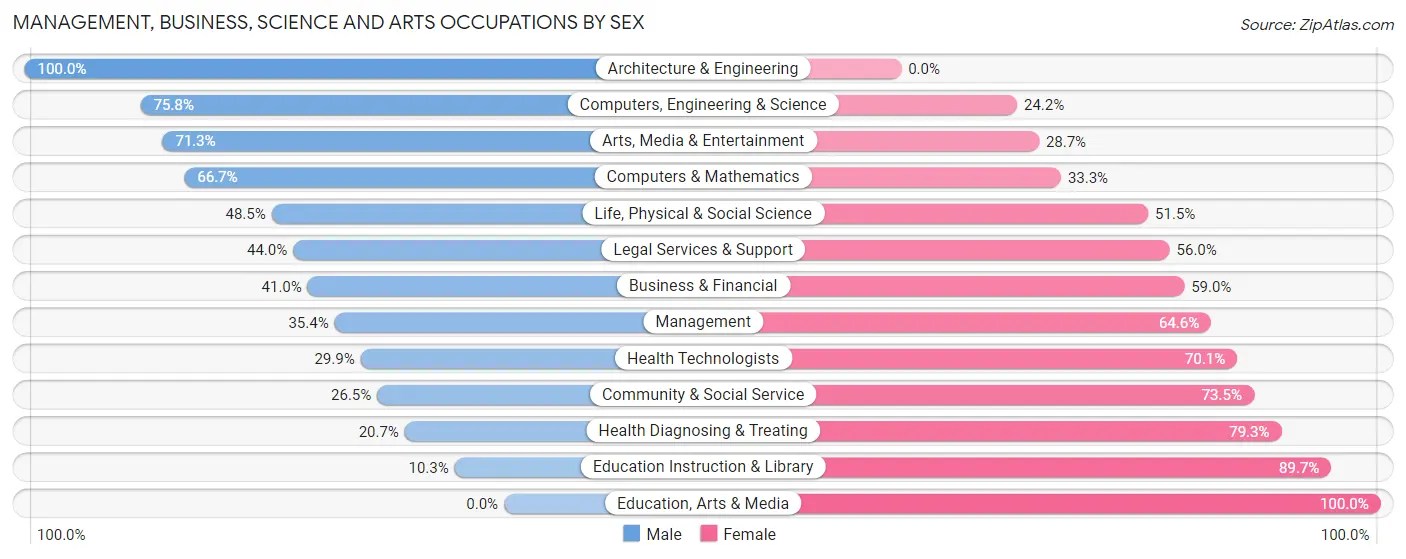
Management, Business, Science and Arts Occupations by Sex
Within the Management, Business, Science and Arts occupations in Gardiner, the most male-oriented occupations are Architecture & Engineering (100.0%), Computers, Engineering & Science (75.8%), and Arts, Media & Entertainment (71.3%), while the most female-oriented occupations are Education, Arts & Media (100.0%), Education Instruction & Library (89.7%), and Health Diagnosing & Treating (79.3%).
| Occupation | Male | Female |
| Management | 64 (35.4%) | 117 (64.6%) |
| Business & Financial | 34 (41.0%) | 49 (59.0%) |
| Computers, Engineering & Science | 138 (75.8%) | 44 (24.2%) |
| Computers & Mathematics | 54 (66.7%) | 27 (33.3%) |
| Architecture & Engineering | 68 (100.0%) | 0 (0.0%) |
| Life, Physical & Social Science | 16 (48.5%) | 17 (51.5%) |
| Community & Social Service | 100 (26.5%) | 278 (73.5%) |
| Education, Arts & Media | 0 (0.0%) | 4 (100.0%) |
| Legal Services & Support | 11 (44.0%) | 14 (56.0%) |
| Education Instruction & Library | 27 (10.3%) | 235 (89.7%) |
| Arts, Media & Entertainment | 62 (71.3%) | 25 (28.7%) |
| Health Diagnosing & Treating | 41 (20.7%) | 157 (79.3%) |
| Health Technologists | 41 (29.9%) | 96 (70.1%) |
| Total (Category) | 377 (36.9%) | 645 (63.1%) |
| Total (Overall) | 1,385 (53.7%) | 1,194 (46.3%) |
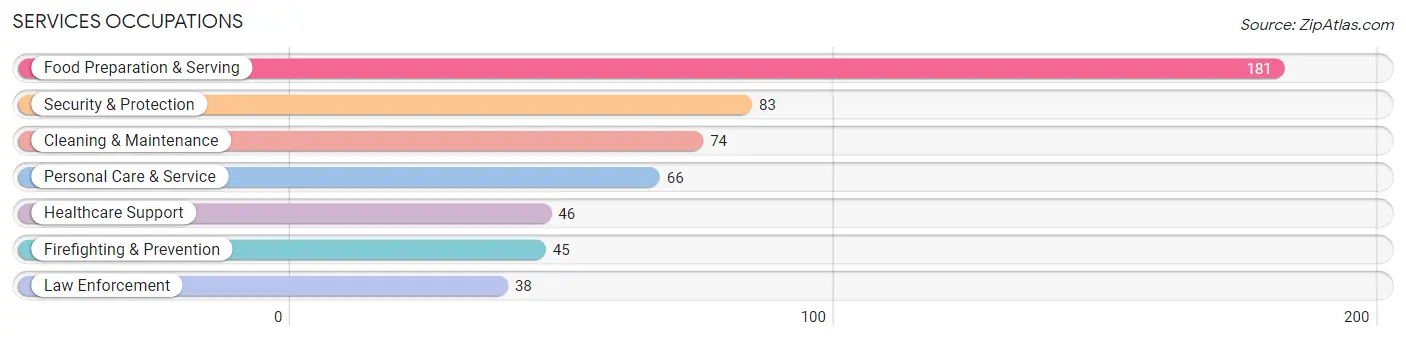
Services Occupations
The most common Services occupations in Gardiner are Food Preparation & Serving (181 | 7.0%), Security & Protection (83 | 3.2%), Cleaning & Maintenance (74 | 2.9%), Personal Care & Service (66 | 2.6%), and Healthcare Support (46 | 1.8%).
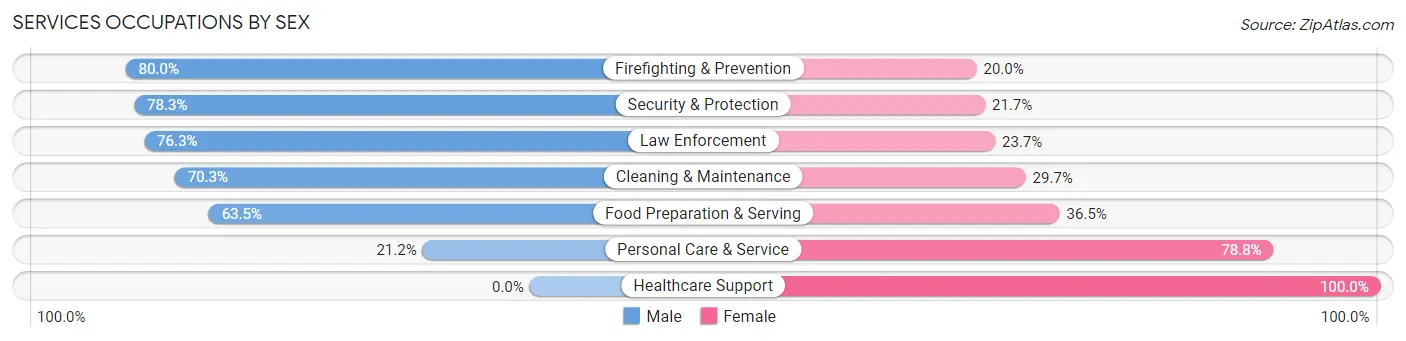
Services Occupations by Sex
Within the Services occupations in Gardiner, the most male-oriented occupations are Firefighting & Prevention (80.0%), Security & Protection (78.3%), and Law Enforcement (76.3%), while the most female-oriented occupations are Healthcare Support (100.0%), Personal Care & Service (78.8%), and Food Preparation & Serving (36.5%).
| Occupation | Male | Female |
| Healthcare Support | 0 (0.0%) | 46 (100.0%) |
| Security & Protection | 65 (78.3%) | 18 (21.7%) |
| Firefighting & Prevention | 36 (80.0%) | 9 (20.0%) |
| Law Enforcement | 29 (76.3%) | 9 (23.7%) |
| Food Preparation & Serving | 115 (63.5%) | 66 (36.5%) |
| Cleaning & Maintenance | 52 (70.3%) | 22 (29.7%) |
| Personal Care & Service | 14 (21.2%) | 52 (78.8%) |
| Total (Category) | 246 (54.7%) | 204 (45.3%) |
| Total (Overall) | 1,385 (53.7%) | 1,194 (46.3%) |
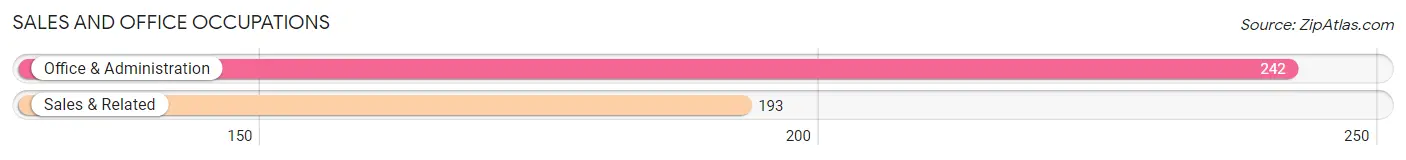
Sales and Office Occupations
The most common Sales and Office occupations in Gardiner are Office & Administration (242 | 9.4%), and Sales & Related (193 | 7.5%).
Sales and Office Occupations by Sex
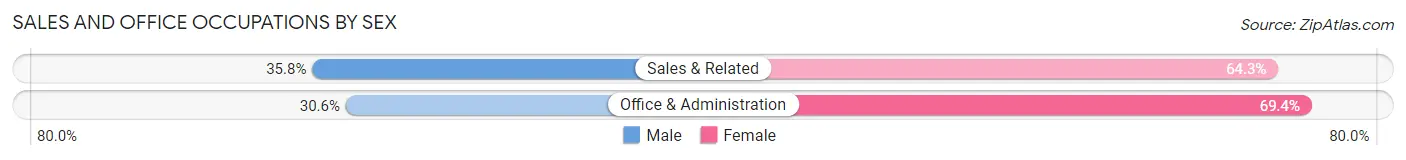
| Occupation | Male | Female |
| Sales & Related | 69 (35.7%) | 124 (64.2%) |
| Office & Administration | 74 (30.6%) | 168 (69.4%) |
| Total (Category) | 143 (32.9%) | 292 (67.1%) |
| Total (Overall) | 1,385 (53.7%) | 1,194 (46.3%) |
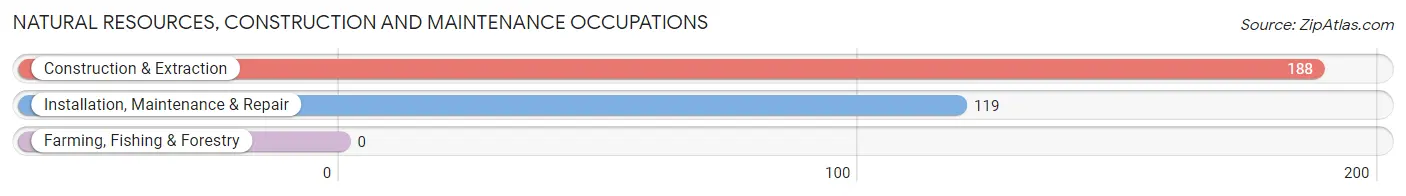
Natural Resources, Construction and Maintenance Occupations
The most common Natural Resources, Construction and Maintenance occupations in Gardiner are Construction & Extraction (188 | 7.3%), and Installation, Maintenance & Repair (119 | 4.6%).
Natural Resources, Construction and Maintenance Occupations by Sex
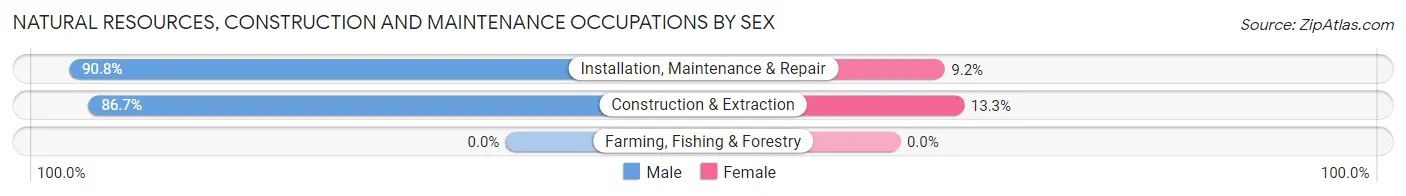
| Occupation | Male | Female |
| Farming, Fishing & Forestry | 0 (0.0%) | 0 (0.0%) |
| Construction & Extraction | 163 (86.7%) | 25 (13.3%) |
| Installation, Maintenance & Repair | 108 (90.8%) | 11 (9.2%) |
| Total (Category) | 271 (88.3%) | 36 (11.7%) |
| Total (Overall) | 1,385 (53.7%) | 1,194 (46.3%) |
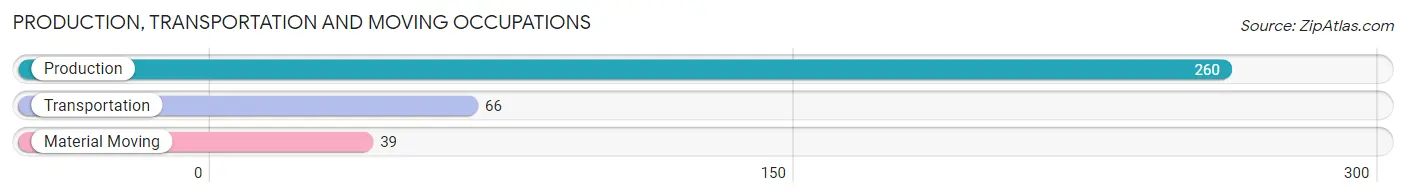
Production, Transportation and Moving Occupations
The most common Production, Transportation and Moving occupations in Gardiner are Production (260 | 10.1%), Transportation (66 | 2.6%), and Material Moving (39 | 1.5%).
Production, Transportation and Moving Occupations by Sex
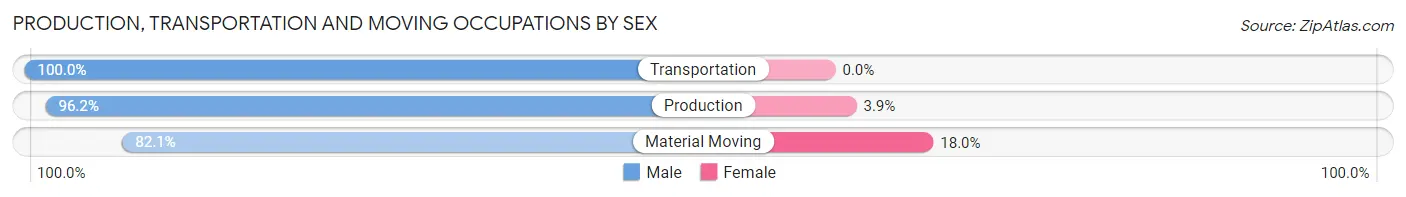
| Occupation | Male | Female |
| Production | 250 (96.2%) | 10 (3.8%) |
| Transportation | 66 (100.0%) | 0 (0.0%) |
| Material Moving | 32 (82.1%) | 7 (17.9%) |
| Total (Category) | 348 (95.3%) | 17 (4.7%) |
| Total (Overall) | 1,385 (53.7%) | 1,194 (46.3%) |
Employment Industries by Sex in Gardiner
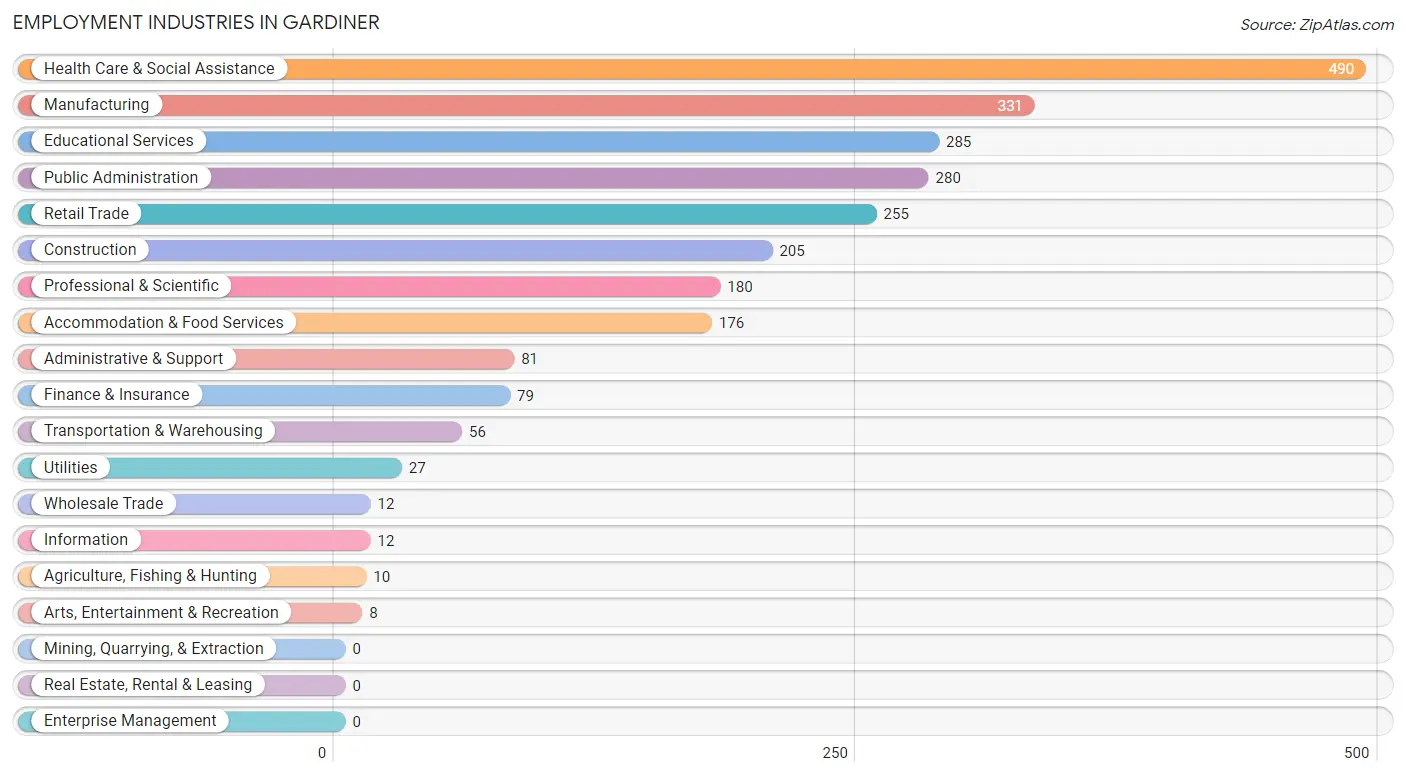
Employment Industries in Gardiner
The major employment industries in Gardiner include Health Care & Social Assistance (490 | 19.0%), Manufacturing (331 | 12.8%), Educational Services (285 | 11.1%), Public Administration (280 | 10.9%), and Retail Trade (255 | 9.9%).
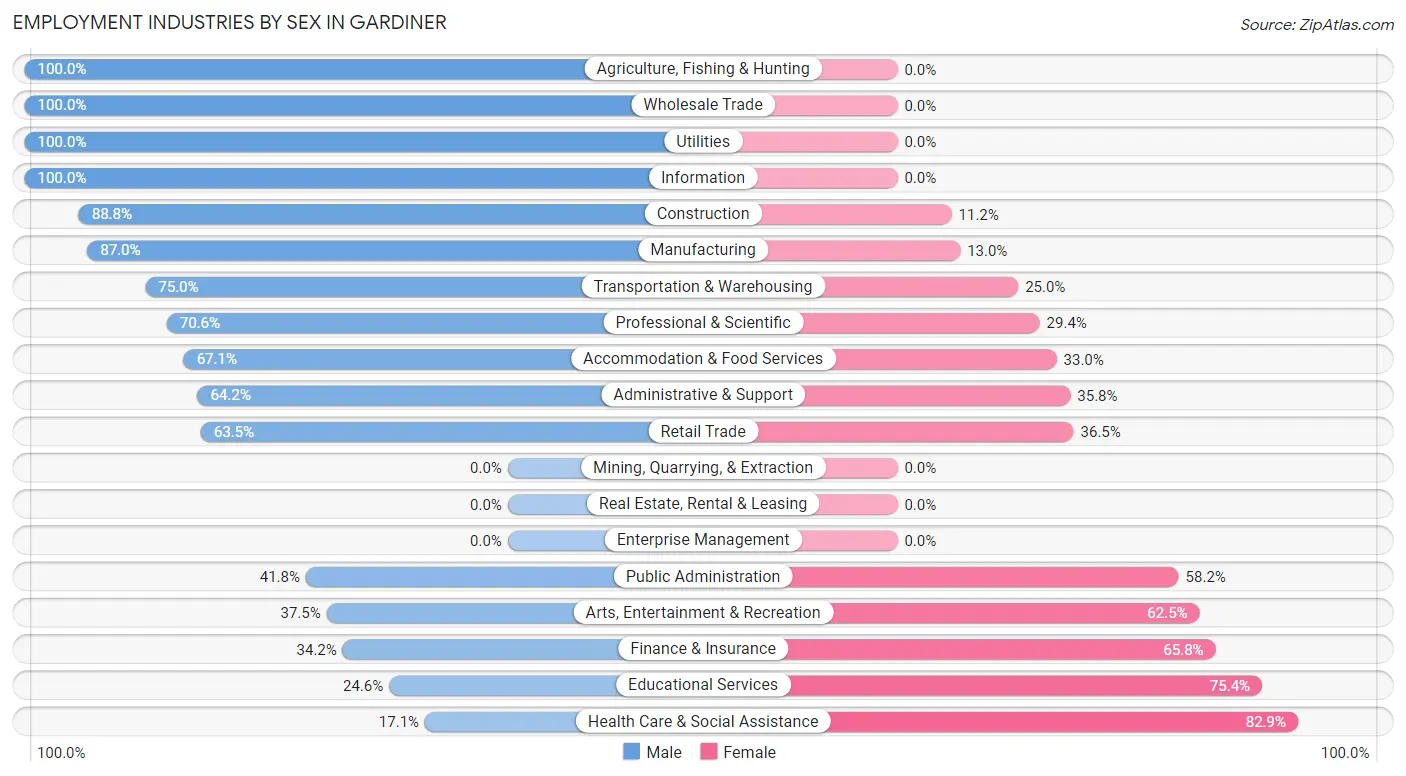
Employment Industries by Sex in Gardiner
The Gardiner industries that see more men than women are Agriculture, Fishing & Hunting (100.0%), Wholesale Trade (100.0%), and Utilities (100.0%), whereas the industries that tend to have a higher number of women are Health Care & Social Assistance (82.9%), Educational Services (75.4%), and Finance & Insurance (65.8%).
| Industry | Male | Female |
| Agriculture, Fishing & Hunting | 10 (100.0%) | 0 (0.0%) |
| Mining, Quarrying, & Extraction | 0 (0.0%) | 0 (0.0%) |
| Construction | 182 (88.8%) | 23 (11.2%) |
| Manufacturing | 288 (87.0%) | 43 (13.0%) |
| Wholesale Trade | 12 (100.0%) | 0 (0.0%) |
| Retail Trade | 162 (63.5%) | 93 (36.5%) |
| Transportation & Warehousing | 42 (75.0%) | 14 (25.0%) |
| Utilities | 27 (100.0%) | 0 (0.0%) |
| Information | 12 (100.0%) | 0 (0.0%) |
| Finance & Insurance | 27 (34.2%) | 52 (65.8%) |
| Real Estate, Rental & Leasing | 0 (0.0%) | 0 (0.0%) |
| Professional & Scientific | 127 (70.6%) | 53 (29.4%) |
| Enterprise Management | 0 (0.0%) | 0 (0.0%) |
| Administrative & Support | 52 (64.2%) | 29 (35.8%) |
| Educational Services | 70 (24.6%) | 215 (75.4%) |
| Health Care & Social Assistance | 84 (17.1%) | 406 (82.9%) |
| Arts, Entertainment & Recreation | 3 (37.5%) | 5 (62.5%) |
| Accommodation & Food Services | 118 (67.0%) | 58 (33.0%) |
| Public Administration | 117 (41.8%) | 163 (58.2%) |
| Total | 1,385 (53.7%) | 1,194 (46.3%) |
Education in Gardiner
School Enrollment in Gardiner
The most common levels of schooling among the 986 students in Gardiner are elementary school (270 | 27.4%), middle school (216 | 21.9%), and high school (184 | 18.7%).
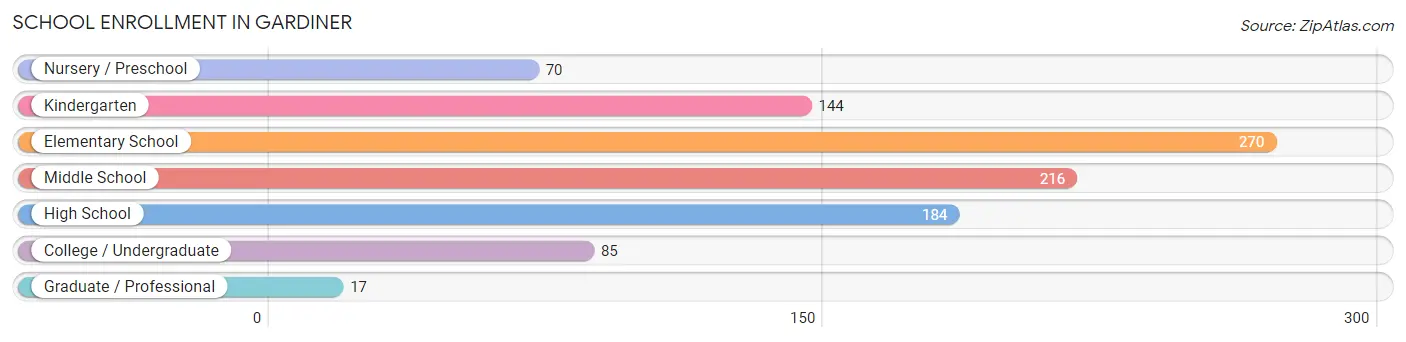
| School Level | # Students | % Students |
| Nursery / Preschool | 70 | 7.1% |
| Kindergarten | 144 | 14.6% |
| Elementary School | 270 | 27.4% |
| Middle School | 216 | 21.9% |
| High School | 184 | 18.7% |
| College / Undergraduate | 85 | 8.6% |
| Graduate / Professional | 17 | 1.7% |
| Total | 986 | 100.0% |
School Enrollment by Age by Funding Source in Gardiner
Out of a total of 986 students who are enrolled in schools in Gardiner, 75 (7.6%) attend a private institution, while the remaining 911 (92.4%) are enrolled in public schools. The age group of 25 to 34 year olds has the highest likelihood of being enrolled in private schools, with 17 (56.7% in the age bracket) enrolled. Conversely, the age group of 15 to 17 year olds has the lowest likelihood of being enrolled in a private school, with 145 (100.0% in the age bracket) attending a public institution.
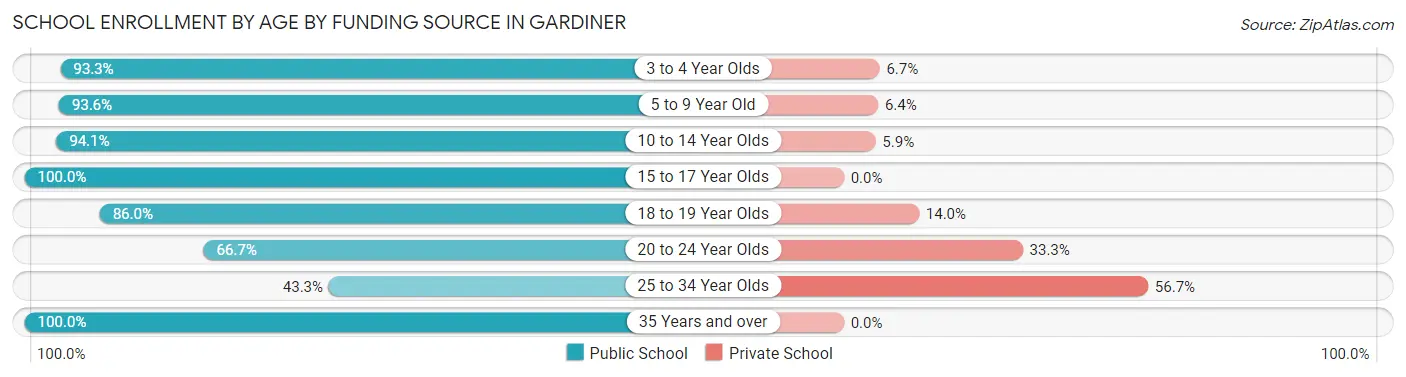
| Age Bracket | Public School | Private School |
| 3 to 4 Year Olds | 28 (93.3%) | 2 (6.7%) |
| 5 to 9 Year Old | 425 (93.6%) | 29 (6.4%) |
| 10 to 14 Year Olds | 207 (94.1%) | 13 (5.9%) |
| 15 to 17 Year Olds | 145 (100.0%) | 0 (0.0%) |
| 18 to 19 Year Olds | 43 (86.0%) | 7 (14.0%) |
| 20 to 24 Year Olds | 14 (66.7%) | 7 (33.3%) |
| 25 to 34 Year Olds | 13 (43.3%) | 17 (56.7%) |
| 35 Years and over | 36 (100.0%) | 0 (0.0%) |
| Total | 911 (92.4%) | 75 (7.6%) |
Educational Attainment by Field of Study in Gardiner
Business (210 | 17.0%), education (151 | 12.2%), visual & performing arts (151 | 12.2%), science & technology (123 | 9.9%), and engineering (103 | 8.3%) are the most common fields of study among 1,237 individuals in Gardiner who have obtained a bachelor's degree or higher.
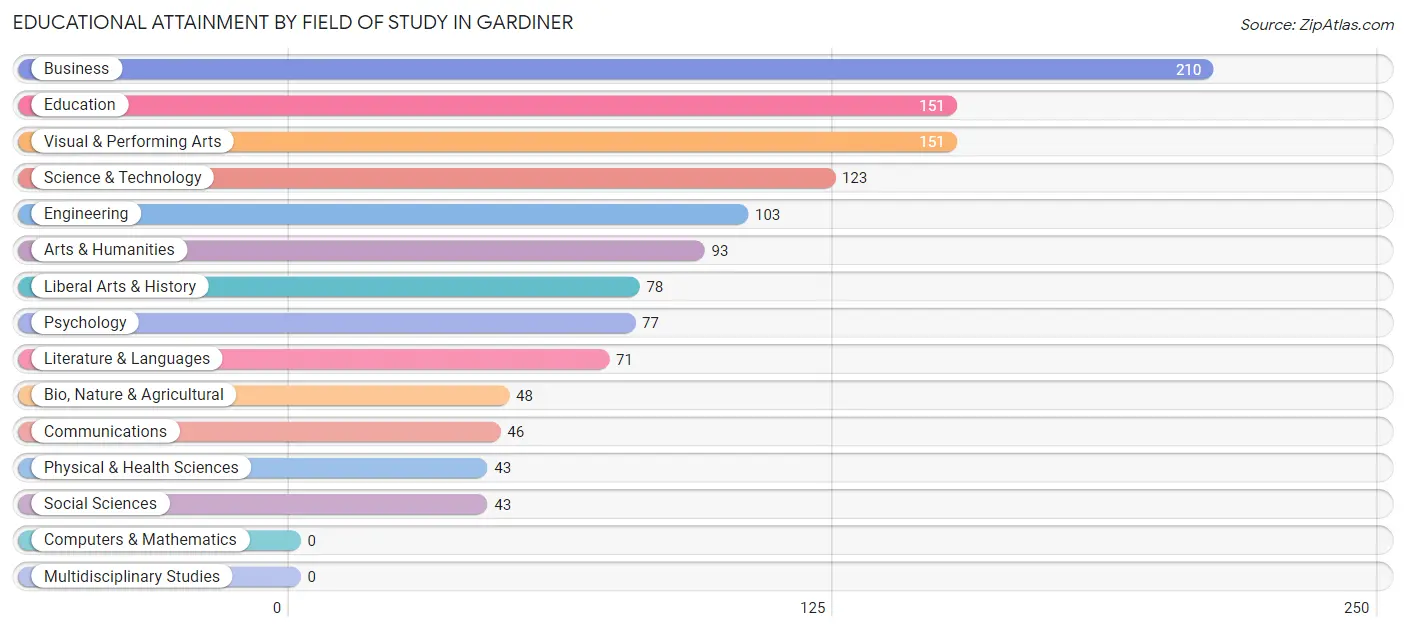
| Field of Study | # Graduates | % Graduates |
| Computers & Mathematics | 0 | 0.0% |
| Bio, Nature & Agricultural | 48 | 3.9% |
| Physical & Health Sciences | 43 | 3.5% |
| Psychology | 77 | 6.2% |
| Social Sciences | 43 | 3.5% |
| Engineering | 103 | 8.3% |
| Multidisciplinary Studies | 0 | 0.0% |
| Science & Technology | 123 | 9.9% |
| Business | 210 | 17.0% |
| Education | 151 | 12.2% |
| Literature & Languages | 71 | 5.7% |
| Liberal Arts & History | 78 | 6.3% |
| Visual & Performing Arts | 151 | 12.2% |
| Communications | 46 | 3.7% |
| Arts & Humanities | 93 | 7.5% |
| Total | 1,237 | 100.0% |
Transportation & Commute in Gardiner
Vehicle Availability by Sex in Gardiner
The most prevalent vehicle ownership categories in Gardiner are males with 3 vehicles (551, accounting for 40.5%) and females with 3 vehicles (335, making up 46.8%).
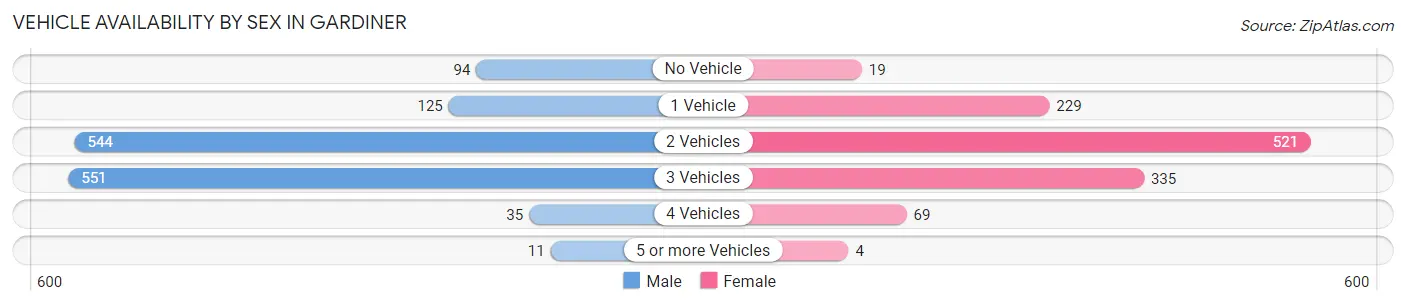
| Vehicles Available | Male | Female |
| No Vehicle | 94 (6.9%) | 19 (1.6%) |
| 1 Vehicle | 125 (9.2%) | 229 (19.5%) |
| 2 Vehicles | 544 (40.0%) | 521 (44.3%) |
| 3 Vehicles | 551 (40.5%) | 335 (28.5%) |
| 4 Vehicles | 35 (2.6%) | 69 (5.9%) |
| 5 or more Vehicles | 11 (0.8%) | 4 (0.3%) |
| Total | 1,360 (100.0%) | 1,177 (100.0%) |
Commute Time in Gardiner
The most frequently occuring commute durations in Gardiner are 30 to 34 minutes (589 commuters, 25.3%), 20 to 24 minutes (318 commuters, 13.6%), and 15 to 19 minutes (245 commuters, 10.5%).
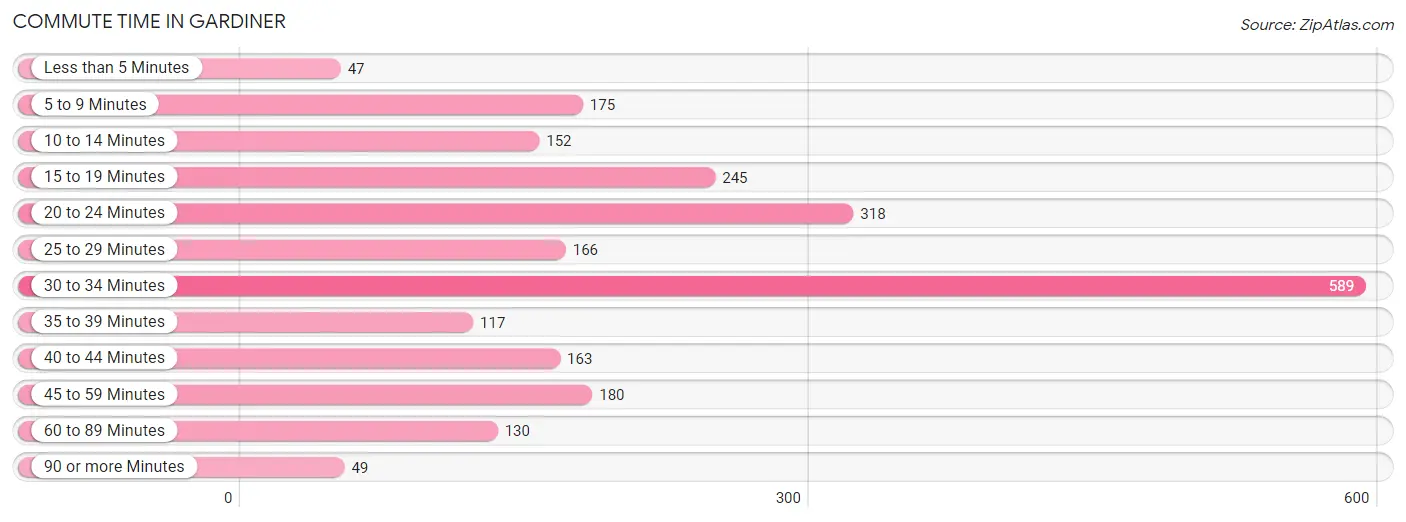
| Commute Time | # Commuters | % Commuters |
| Less than 5 Minutes | 47 | 2.0% |
| 5 to 9 Minutes | 175 | 7.5% |
| 10 to 14 Minutes | 152 | 6.5% |
| 15 to 19 Minutes | 245 | 10.5% |
| 20 to 24 Minutes | 318 | 13.6% |
| 25 to 29 Minutes | 166 | 7.1% |
| 30 to 34 Minutes | 589 | 25.3% |
| 35 to 39 Minutes | 117 | 5.0% |
| 40 to 44 Minutes | 163 | 7.0% |
| 45 to 59 Minutes | 180 | 7.7% |
| 60 to 89 Minutes | 130 | 5.6% |
| 90 or more Minutes | 49 | 2.1% |
Commute Time by Sex in Gardiner
The most common commute times in Gardiner are 30 to 34 minutes (392 commuters, 30.1%) for males and 30 to 34 minutes (197 commuters, 19.2%) for females.
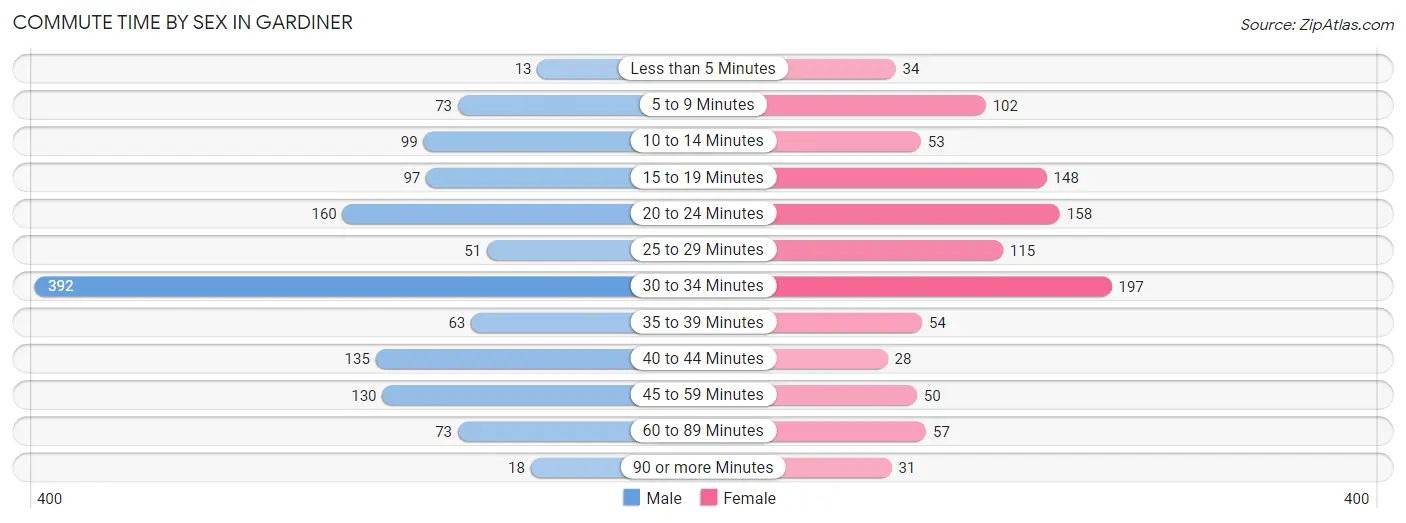
| Commute Time | Male | Female |
| Less than 5 Minutes | 13 (1.0%) | 34 (3.3%) |
| 5 to 9 Minutes | 73 (5.6%) | 102 (9.9%) |
| 10 to 14 Minutes | 99 (7.6%) | 53 (5.2%) |
| 15 to 19 Minutes | 97 (7.4%) | 148 (14.4%) |
| 20 to 24 Minutes | 160 (12.3%) | 158 (15.4%) |
| 25 to 29 Minutes | 51 (3.9%) | 115 (11.2%) |
| 30 to 34 Minutes | 392 (30.1%) | 197 (19.2%) |
| 35 to 39 Minutes | 63 (4.8%) | 54 (5.3%) |
| 40 to 44 Minutes | 135 (10.3%) | 28 (2.7%) |
| 45 to 59 Minutes | 130 (10.0%) | 50 (4.9%) |
| 60 to 89 Minutes | 73 (5.6%) | 57 (5.6%) |
| 90 or more Minutes | 18 (1.4%) | 31 (3.0%) |
Time of Departure to Work by Sex in Gardiner
The most frequent times of departure to work in Gardiner are 6:00 AM to 6:29 AM (229, 17.6%) for males and 7:00 AM to 7:29 AM (234, 22.8%) for females.
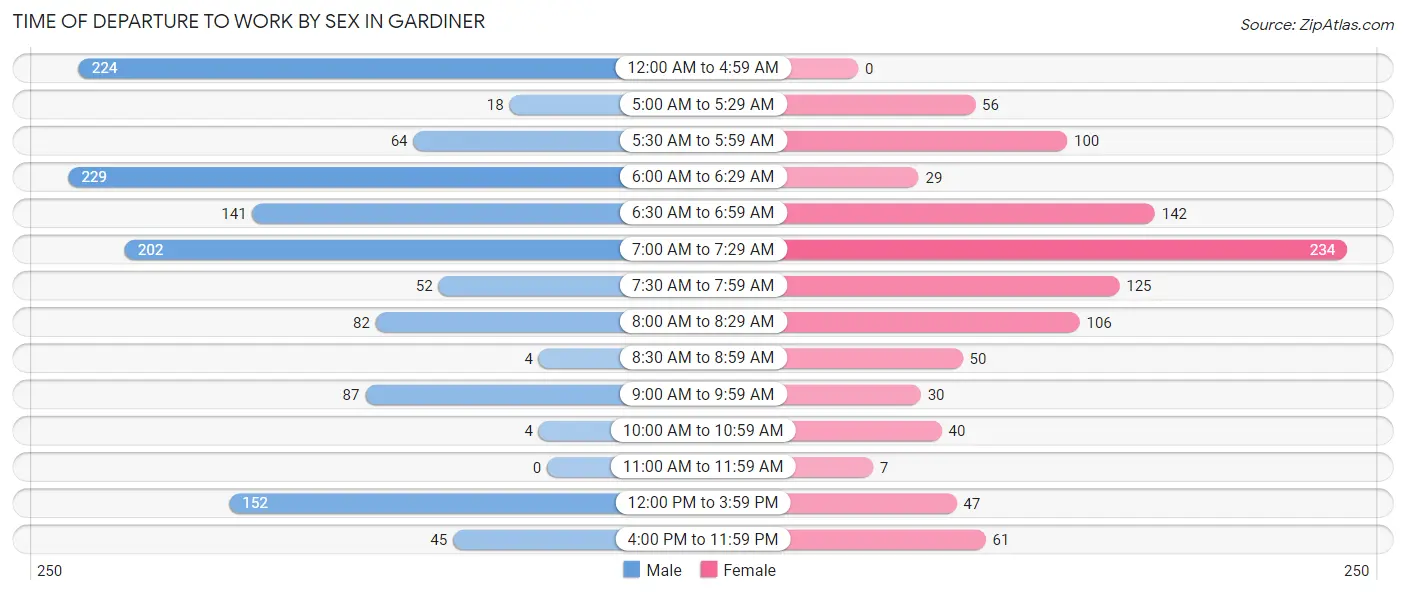
| Time of Departure | Male | Female |
| 12:00 AM to 4:59 AM | 224 (17.2%) | 0 (0.0%) |
| 5:00 AM to 5:29 AM | 18 (1.4%) | 56 (5.4%) |
| 5:30 AM to 5:59 AM | 64 (4.9%) | 100 (9.7%) |
| 6:00 AM to 6:29 AM | 229 (17.6%) | 29 (2.8%) |
| 6:30 AM to 6:59 AM | 141 (10.8%) | 142 (13.8%) |
| 7:00 AM to 7:29 AM | 202 (15.5%) | 234 (22.8%) |
| 7:30 AM to 7:59 AM | 52 (4.0%) | 125 (12.2%) |
| 8:00 AM to 8:29 AM | 82 (6.3%) | 106 (10.3%) |
| 8:30 AM to 8:59 AM | 4 (0.3%) | 50 (4.9%) |
| 9:00 AM to 9:59 AM | 87 (6.7%) | 30 (2.9%) |
| 10:00 AM to 10:59 AM | 4 (0.3%) | 40 (3.9%) |
| 11:00 AM to 11:59 AM | 0 (0.0%) | 7 (0.7%) |
| 12:00 PM to 3:59 PM | 152 (11.7%) | 47 (4.6%) |
| 4:00 PM to 11:59 PM | 45 (3.5%) | 61 (5.9%) |
| Total | 1,304 (100.0%) | 1,027 (100.0%) |
Housing Occupancy in Gardiner
Occupancy by Ownership in Gardiner
Of the total 2,612 dwellings in Gardiner, owner-occupied units account for 1,744 (66.8%), while renter-occupied units make up 868 (33.2%).
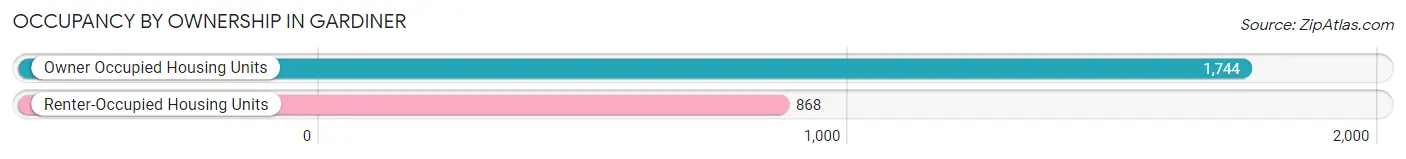
| Occupancy | # Housing Units | % Housing Units |
| Owner Occupied Housing Units | 1,744 | 66.8% |
| Renter-Occupied Housing Units | 868 | 33.2% |
| Total Occupied Housing Units | 2,612 | 100.0% |
Occupancy by Household Size in Gardiner
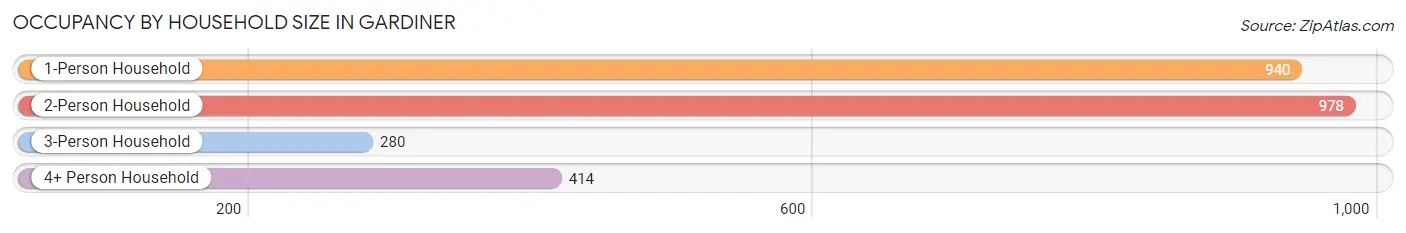
| Household Size | # Housing Units | % Housing Units |
| 1-Person Household | 940 | 36.0% |
| 2-Person Household | 978 | 37.4% |
| 3-Person Household | 280 | 10.7% |
| 4+ Person Household | 414 | 15.9% |
| Total Housing Units | 2,612 | 100.0% |
Occupancy by Ownership by Household Size in Gardiner
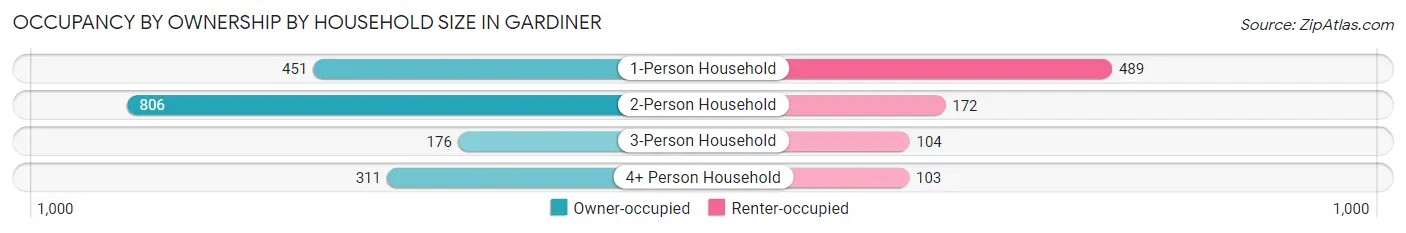
| Household Size | Owner-occupied | Renter-occupied |
| 1-Person Household | 451 (48.0%) | 489 (52.0%) |
| 2-Person Household | 806 (82.4%) | 172 (17.6%) |
| 3-Person Household | 176 (62.9%) | 104 (37.1%) |
| 4+ Person Household | 311 (75.1%) | 103 (24.9%) |
| Total Housing Units | 1,744 (66.8%) | 868 (33.2%) |
Occupancy by Educational Attainment in Gardiner
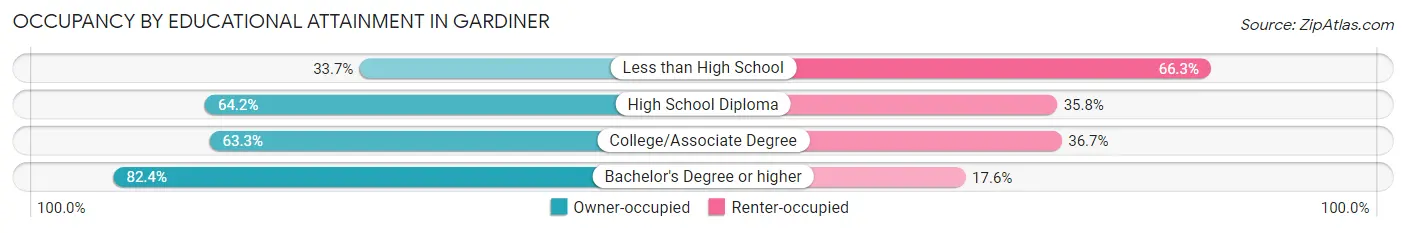
| Household Size | Owner-occupied | Renter-occupied |
| Less than High School | 69 (33.7%) | 136 (66.3%) |
| High School Diploma | 540 (64.2%) | 301 (35.8%) |
| College/Associate Degree | 514 (63.3%) | 298 (36.7%) |
| Bachelor's Degree or higher | 621 (82.4%) | 133 (17.6%) |
Occupancy by Age of Householder in Gardiner
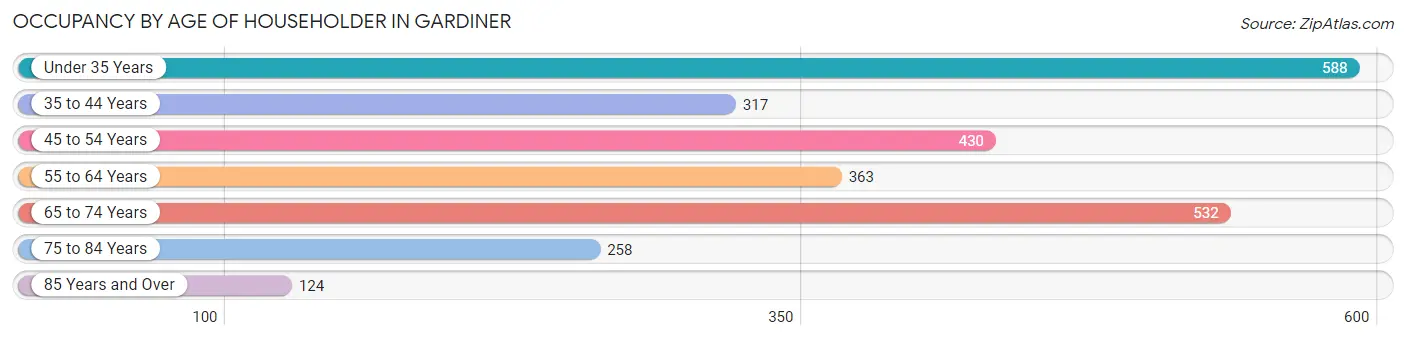
| Age Bracket | # Households | % Households |
| Under 35 Years | 588 | 22.5% |
| 35 to 44 Years | 317 | 12.1% |
| 45 to 54 Years | 430 | 16.5% |
| 55 to 64 Years | 363 | 13.9% |
| 65 to 74 Years | 532 | 20.4% |
| 75 to 84 Years | 258 | 9.9% |
| 85 Years and Over | 124 | 4.8% |
| Total | 2,612 | 100.0% |
Housing Finances in Gardiner
Median Income by Occupancy in Gardiner
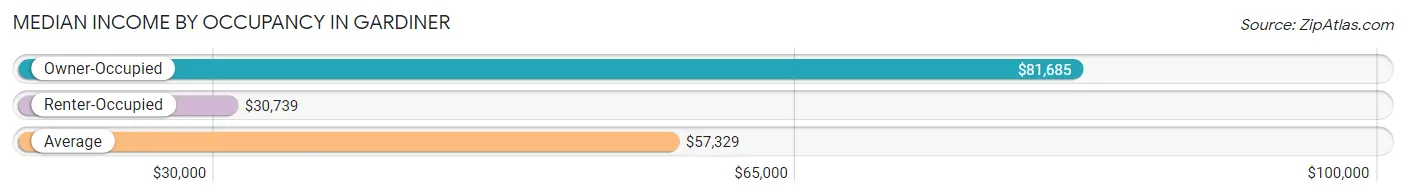
| Occupancy Type | # Households | Median Income |
| Owner-Occupied | 1,744 (66.8%) | $81,685 |
| Renter-Occupied | 868 (33.2%) | $30,739 |
| Average | 2,612 (100.0%) | $57,329 |
Occupancy by Householder Income Bracket in Gardiner
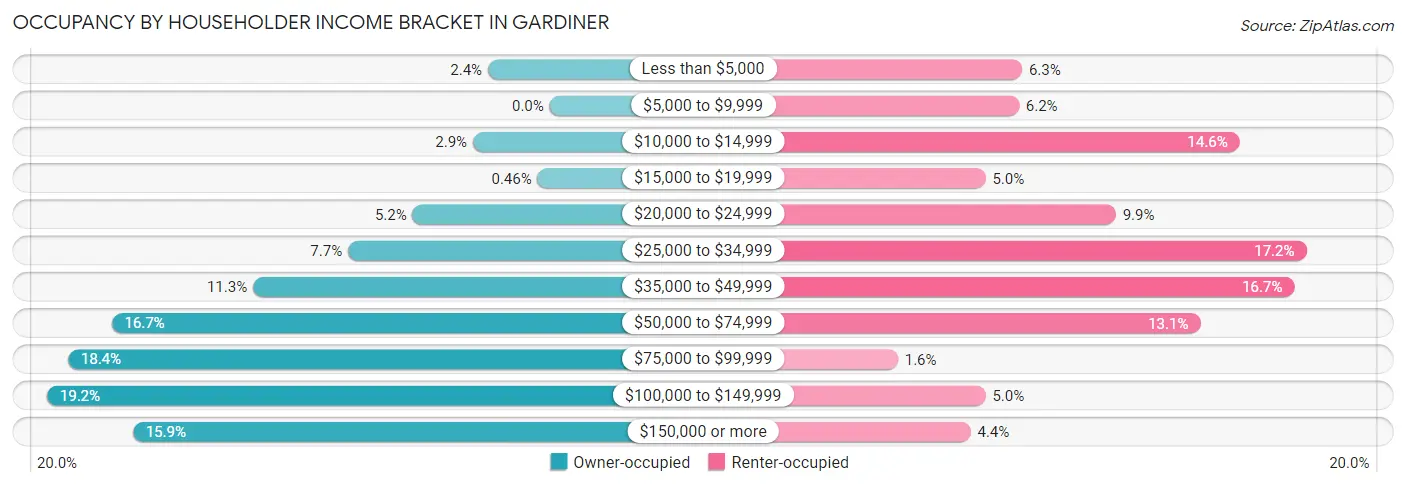
| Income Bracket | Owner-occupied | Renter-occupied |
| Less than $5,000 | 41 (2.4%) | 55 (6.3%) |
| $5,000 to $9,999 | 0 (0.0%) | 54 (6.2%) |
| $10,000 to $14,999 | 51 (2.9%) | 127 (14.6%) |
| $15,000 to $19,999 | 8 (0.5%) | 43 (5.0%) |
| $20,000 to $24,999 | 91 (5.2%) | 86 (9.9%) |
| $25,000 to $34,999 | 134 (7.7%) | 149 (17.2%) |
| $35,000 to $49,999 | 197 (11.3%) | 145 (16.7%) |
| $50,000 to $74,999 | 291 (16.7%) | 114 (13.1%) |
| $75,000 to $99,999 | 320 (18.3%) | 14 (1.6%) |
| $100,000 to $149,999 | 334 (19.2%) | 43 (5.0%) |
| $150,000 or more | 277 (15.9%) | 38 (4.4%) |
| Total | 1,744 (100.0%) | 868 (100.0%) |
Monthly Housing Cost Tiers in Gardiner
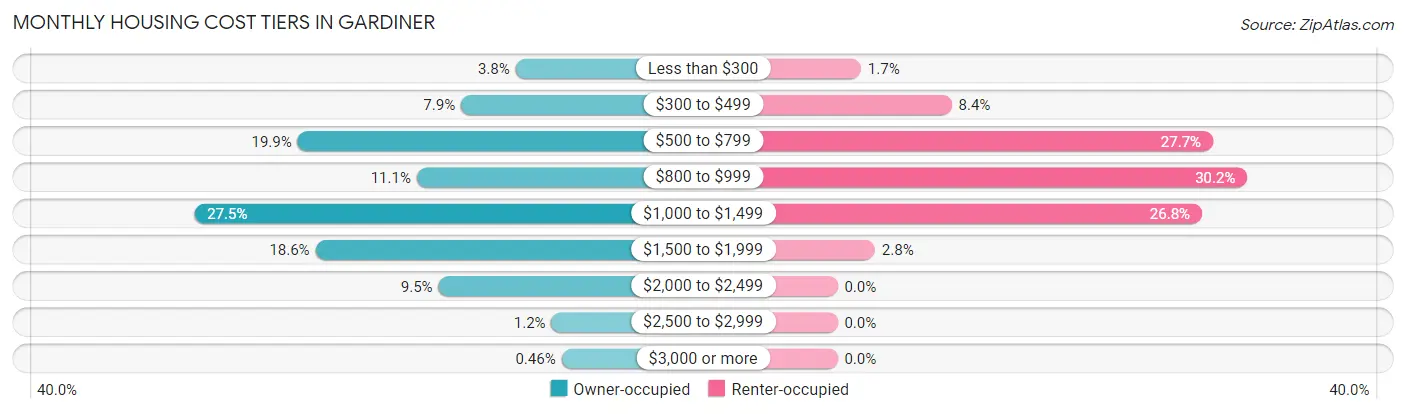
| Monthly Cost | Owner-occupied | Renter-occupied |
| Less than $300 | 67 (3.8%) | 15 (1.7%) |
| $300 to $499 | 137 (7.9%) | 73 (8.4%) |
| $500 to $799 | 347 (19.9%) | 240 (27.7%) |
| $800 to $999 | 194 (11.1%) | 262 (30.2%) |
| $1,000 to $1,499 | 480 (27.5%) | 233 (26.8%) |
| $1,500 to $1,999 | 324 (18.6%) | 24 (2.8%) |
| $2,000 to $2,499 | 166 (9.5%) | 0 (0.0%) |
| $2,500 to $2,999 | 21 (1.2%) | 0 (0.0%) |
| $3,000 or more | 8 (0.5%) | 0 (0.0%) |
| Total | 1,744 (100.0%) | 868 (100.0%) |
Physical Housing Characteristics in Gardiner
Housing Structures in Gardiner
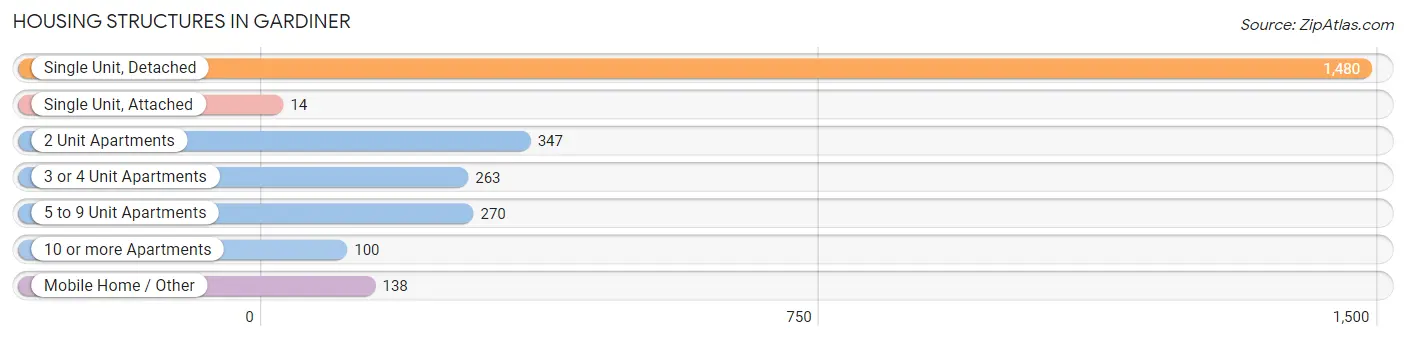
| Structure Type | # Housing Units | % Housing Units |
| Single Unit, Detached | 1,480 | 56.7% |
| Single Unit, Attached | 14 | 0.5% |
| 2 Unit Apartments | 347 | 13.3% |
| 3 or 4 Unit Apartments | 263 | 10.1% |
| 5 to 9 Unit Apartments | 270 | 10.3% |
| 10 or more Apartments | 100 | 3.8% |
| Mobile Home / Other | 138 | 5.3% |
| Total | 2,612 | 100.0% |
Housing Structures by Occupancy in Gardiner
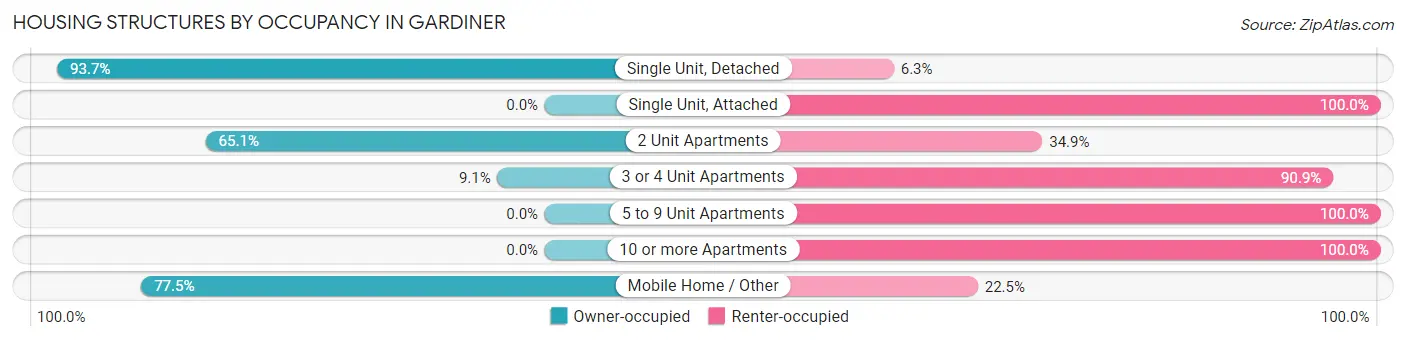
| Structure Type | Owner-occupied | Renter-occupied |
| Single Unit, Detached | 1,387 (93.7%) | 93 (6.3%) |
| Single Unit, Attached | 0 (0.0%) | 14 (100.0%) |
| 2 Unit Apartments | 226 (65.1%) | 121 (34.9%) |
| 3 or 4 Unit Apartments | 24 (9.1%) | 239 (90.9%) |
| 5 to 9 Unit Apartments | 0 (0.0%) | 270 (100.0%) |
| 10 or more Apartments | 0 (0.0%) | 100 (100.0%) |
| Mobile Home / Other | 107 (77.5%) | 31 (22.5%) |
| Total | 1,744 (66.8%) | 868 (33.2%) |
Housing Structures by Number of Rooms in Gardiner
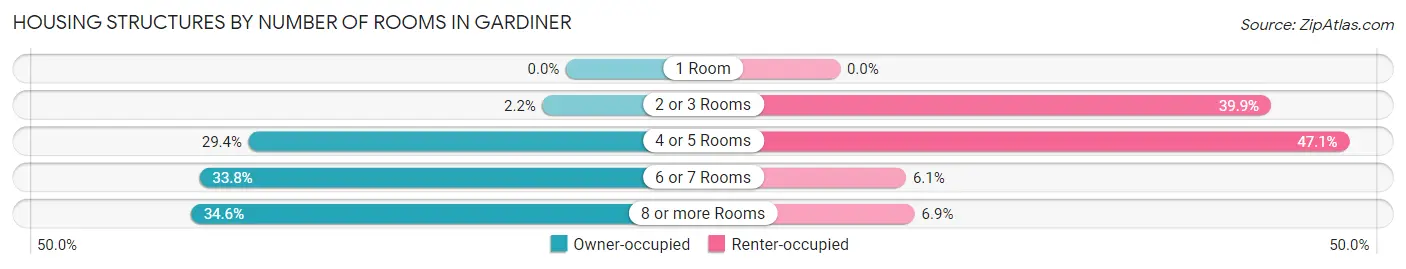
| Number of Rooms | Owner-occupied | Renter-occupied |
| 1 Room | 0 (0.0%) | 0 (0.0%) |
| 2 or 3 Rooms | 38 (2.2%) | 346 (39.9%) |
| 4 or 5 Rooms | 512 (29.4%) | 409 (47.1%) |
| 6 or 7 Rooms | 590 (33.8%) | 53 (6.1%) |
| 8 or more Rooms | 604 (34.6%) | 60 (6.9%) |
| Total | 1,744 (100.0%) | 868 (100.0%) |
Housing Structure by Heating Type in Gardiner
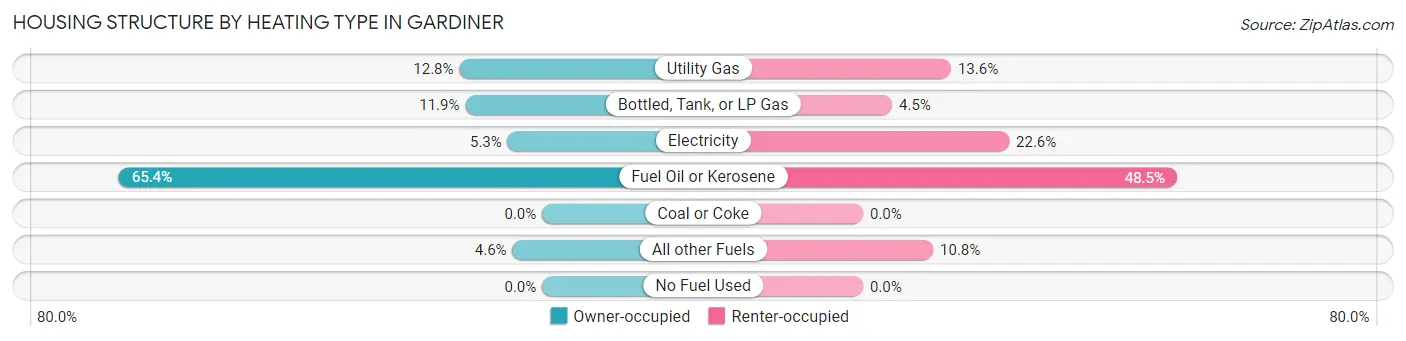
| Heating Type | Owner-occupied | Renter-occupied |
| Utility Gas | 223 (12.8%) | 118 (13.6%) |
| Bottled, Tank, or LP Gas | 207 (11.9%) | 39 (4.5%) |
| Electricity | 93 (5.3%) | 196 (22.6%) |
| Fuel Oil or Kerosene | 1,141 (65.4%) | 421 (48.5%) |
| Coal or Coke | 0 (0.0%) | 0 (0.0%) |
| All other Fuels | 80 (4.6%) | 94 (10.8%) |
| No Fuel Used | 0 (0.0%) | 0 (0.0%) |
| Total | 1,744 (100.0%) | 868 (100.0%) |
Household Vehicle Usage in Gardiner
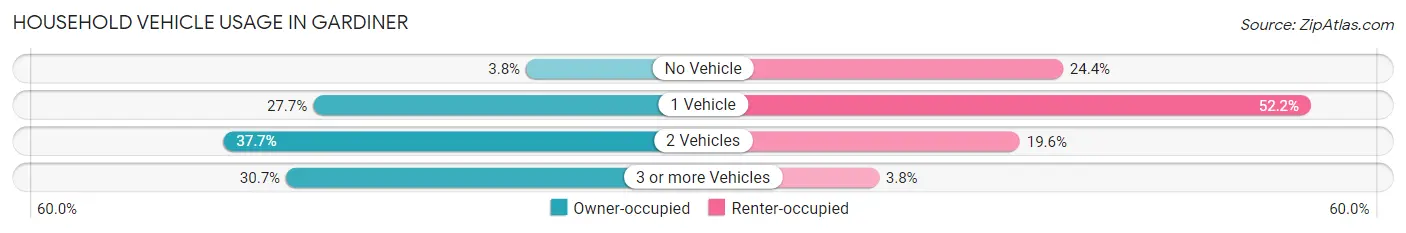
| Vehicles per Household | Owner-occupied | Renter-occupied |
| No Vehicle | 67 (3.8%) | 212 (24.4%) |
| 1 Vehicle | 483 (27.7%) | 453 (52.2%) |
| 2 Vehicles | 658 (37.7%) | 170 (19.6%) |
| 3 or more Vehicles | 536 (30.7%) | 33 (3.8%) |
| Total | 1,744 (100.0%) | 868 (100.0%) |
Real Estate & Mortgages in Gardiner
Real Estate and Mortgage Overview in Gardiner
| Characteristic | Without Mortgage | With Mortgage |
| Housing Units | 644 | 1,100 |
| Median Property Value | $160,900 | $188,100 |
| Median Household Income | $55,671 | $198 |
| Monthly Housing Costs | $598 | $8 |
| Real Estate Taxes | $2,490 | $0 |
Property Value by Mortgage Status in Gardiner
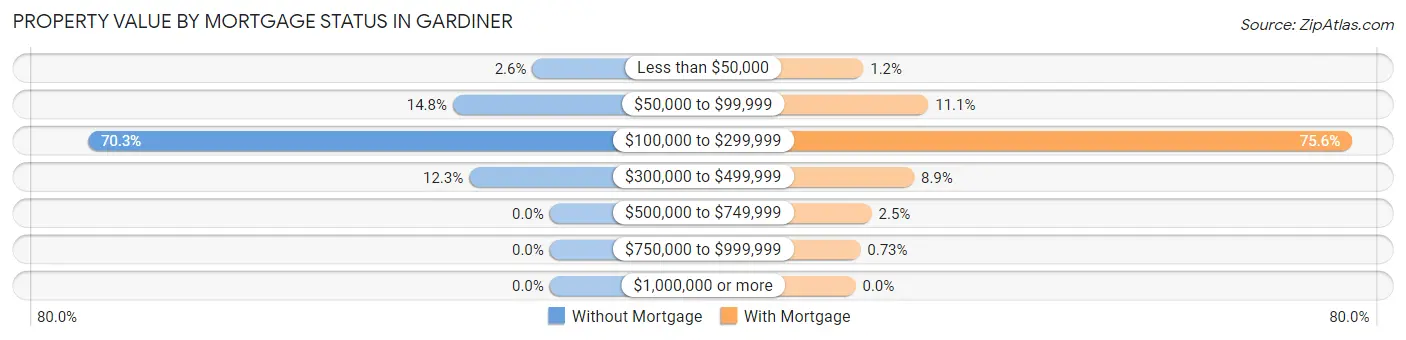
| Property Value | Without Mortgage | With Mortgage |
| Less than $50,000 | 17 (2.6%) | 13 (1.2%) |
| $50,000 to $99,999 | 95 (14.7%) | 122 (11.1%) |
| $100,000 to $299,999 | 453 (70.3%) | 832 (75.6%) |
| $300,000 to $499,999 | 79 (12.3%) | 98 (8.9%) |
| $500,000 to $749,999 | 0 (0.0%) | 27 (2.5%) |
| $750,000 to $999,999 | 0 (0.0%) | 8 (0.7%) |
| $1,000,000 or more | 0 (0.0%) | 0 (0.0%) |
| Total | 644 (100.0%) | 1,100 (100.0%) |
Household Income by Mortgage Status in Gardiner
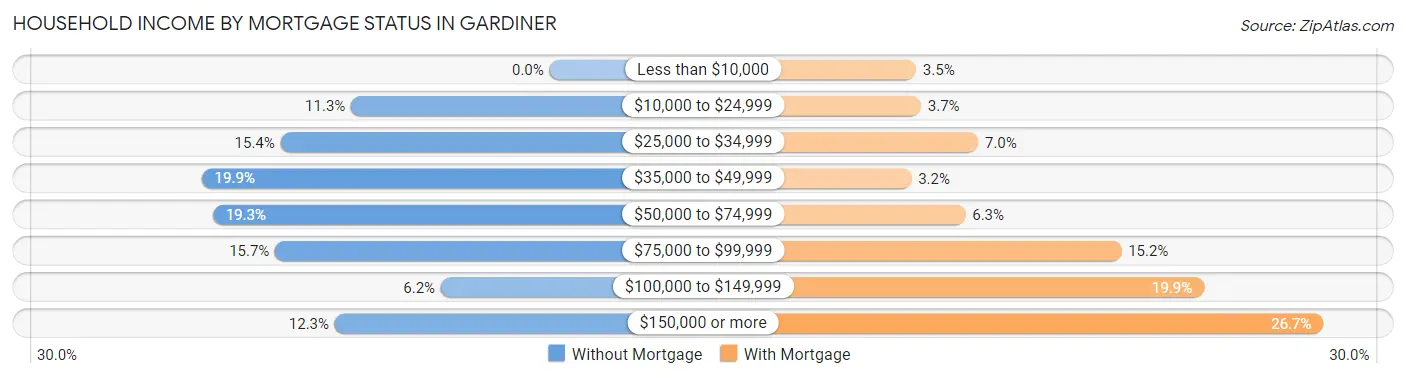
| Household Income | Without Mortgage | With Mortgage |
| Less than $10,000 | 0 (0.0%) | 38 (3.5%) |
| $10,000 to $24,999 | 73 (11.3%) | 41 (3.7%) |
| $25,000 to $34,999 | 99 (15.4%) | 77 (7.0%) |
| $35,000 to $49,999 | 128 (19.9%) | 35 (3.2%) |
| $50,000 to $74,999 | 124 (19.3%) | 69 (6.3%) |
| $75,000 to $99,999 | 101 (15.7%) | 167 (15.2%) |
| $100,000 to $149,999 | 40 (6.2%) | 219 (19.9%) |
| $150,000 or more | 79 (12.3%) | 294 (26.7%) |
| Total | 644 (100.0%) | 1,100 (100.0%) |
Property Value to Household Income Ratio in Gardiner
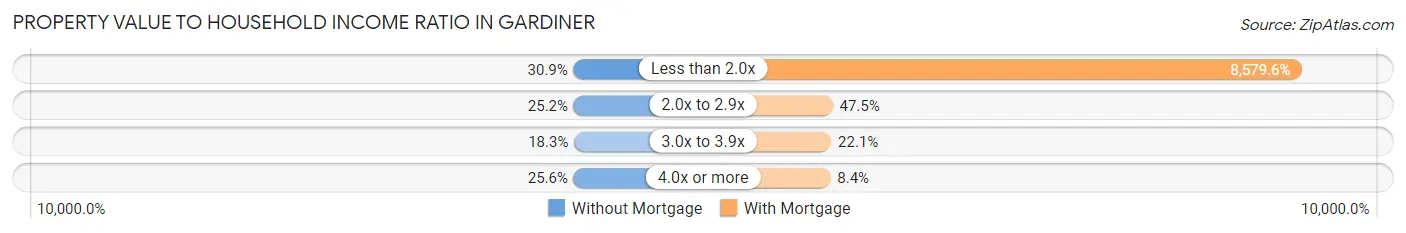
| Value-to-Income Ratio | Without Mortgage | With Mortgage |
| Less than 2.0x | 199 (30.9%) | 94,375 (8,579.6%) |
| 2.0x to 2.9x | 162 (25.2%) | 522 (47.4%) |
| 3.0x to 3.9x | 118 (18.3%) | 243 (22.1%) |
| 4.0x or more | 165 (25.6%) | 92 (8.4%) |
| Total | 644 (100.0%) | 1,100 (100.0%) |
Real Estate Taxes by Mortgage Status in Gardiner
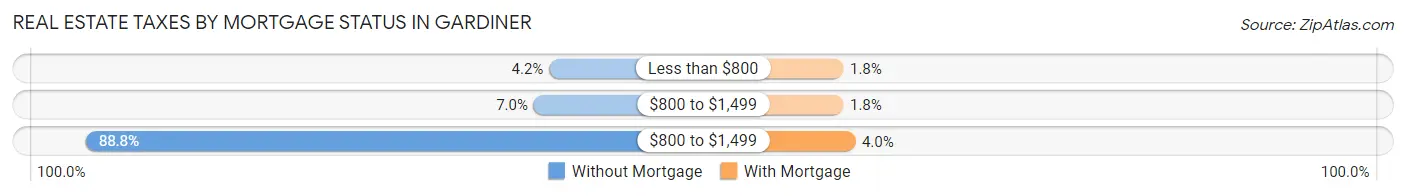
| Property Taxes | Without Mortgage | With Mortgage |
| Less than $800 | 27 (4.2%) | 20 (1.8%) |
| $800 to $1,499 | 45 (7.0%) | 20 (1.8%) |
| $800 to $1,499 | 572 (88.8%) | 44 (4.0%) |
| Total | 644 (100.0%) | 1,100 (100.0%) |
Health & Disability in Gardiner
Health Insurance Coverage by Age in Gardiner
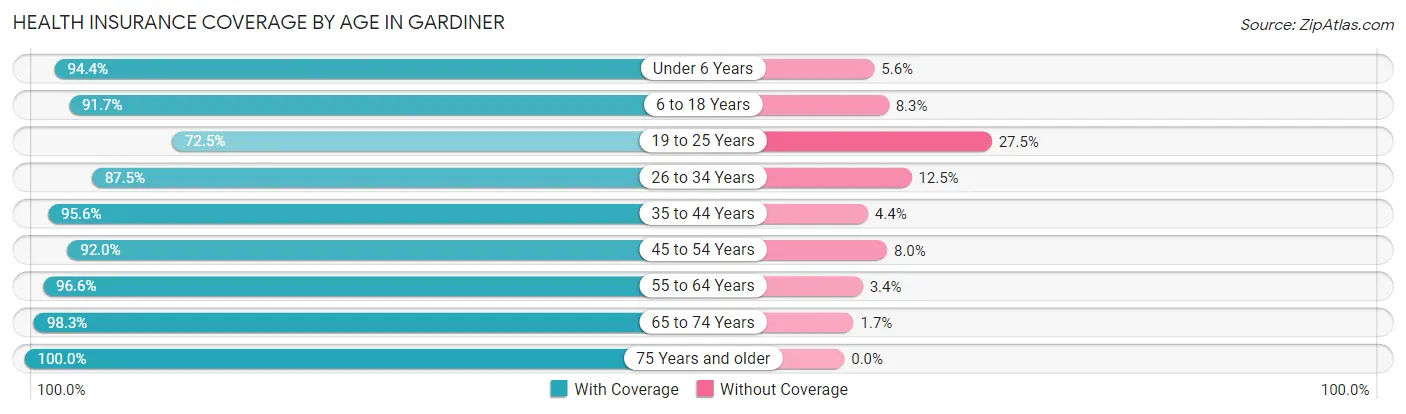
| Age Bracket | With Coverage | Without Coverage |
| Under 6 Years | 421 (94.4%) | 25 (5.6%) |
| 6 to 18 Years | 665 (91.7%) | 60 (8.3%) |
| 19 to 25 Years | 451 (72.5%) | 171 (27.5%) |
| 26 to 34 Years | 545 (87.5%) | 78 (12.5%) |
| 35 to 44 Years | 652 (95.6%) | 30 (4.4%) |
| 45 to 54 Years | 774 (92.0%) | 67 (8.0%) |
| 55 to 64 Years | 673 (96.6%) | 24 (3.4%) |
| 65 to 74 Years | 734 (98.3%) | 13 (1.7%) |
| 75 Years and older | 572 (100.0%) | 0 (0.0%) |
| Total | 5,487 (92.1%) | 468 (7.9%) |
Health Insurance Coverage by Citizenship Status in Gardiner
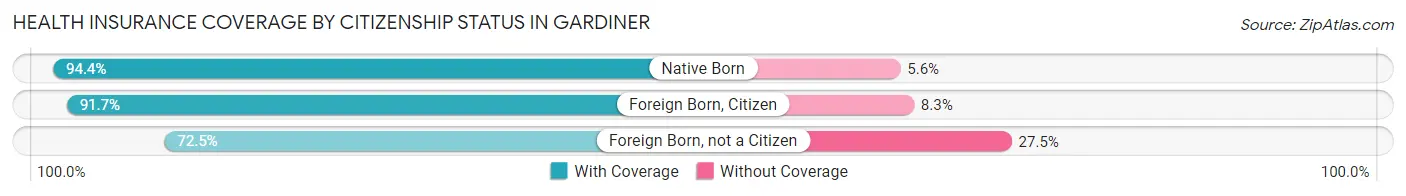
| Citizenship Status | With Coverage | Without Coverage |
| Native Born | 421 (94.4%) | 25 (5.6%) |
| Foreign Born, Citizen | 665 (91.7%) | 60 (8.3%) |
| Foreign Born, not a Citizen | 451 (72.5%) | 171 (27.5%) |
Health Insurance Coverage by Household Income in Gardiner
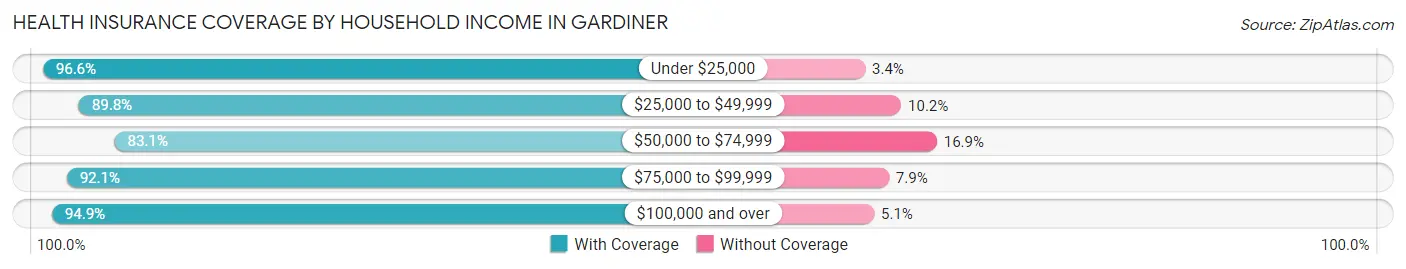
| Household Income | With Coverage | Without Coverage |
| Under $25,000 | 928 (96.6%) | 33 (3.4%) |
| $25,000 to $49,999 | 759 (89.8%) | 86 (10.2%) |
| $50,000 to $74,999 | 809 (83.1%) | 164 (16.9%) |
| $75,000 to $99,999 | 840 (92.1%) | 72 (7.9%) |
| $100,000 and over | 2,096 (94.9%) | 113 (5.1%) |
Public vs Private Health Insurance Coverage by Age in Gardiner
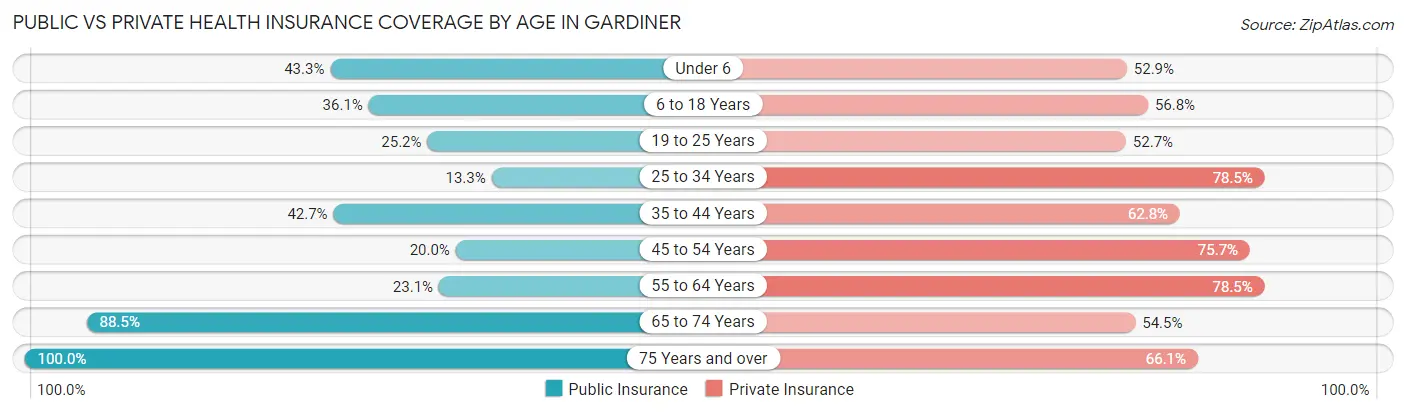
| Age Bracket | Public Insurance | Private Insurance |
| Under 6 | 193 (43.3%) | 236 (52.9%) |
| 6 to 18 Years | 262 (36.1%) | 412 (56.8%) |
| 19 to 25 Years | 157 (25.2%) | 328 (52.7%) |
| 25 to 34 Years | 83 (13.3%) | 489 (78.5%) |
| 35 to 44 Years | 291 (42.7%) | 428 (62.8%) |
| 45 to 54 Years | 168 (20.0%) | 637 (75.7%) |
| 55 to 64 Years | 161 (23.1%) | 547 (78.5%) |
| 65 to 74 Years | 661 (88.5%) | 407 (54.5%) |
| 75 Years and over | 572 (100.0%) | 378 (66.1%) |
| Total | 2,548 (42.8%) | 3,862 (64.8%) |
Disability Status by Sex by Age in Gardiner
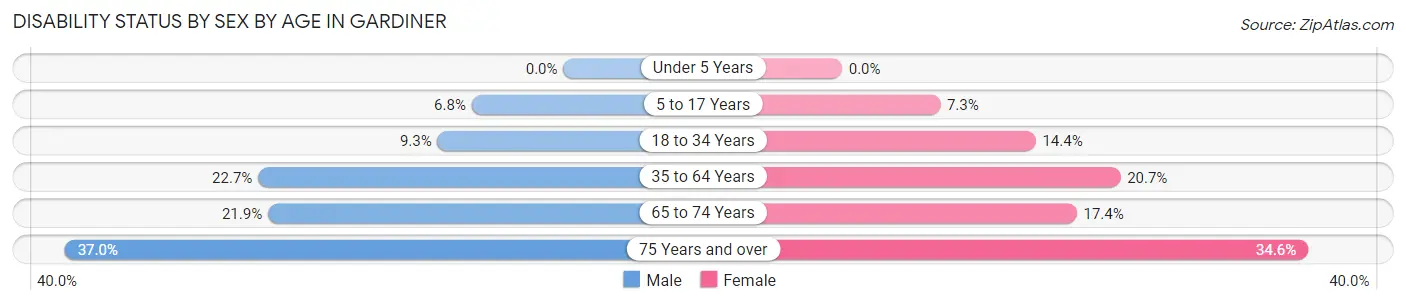
| Age Bracket | Male | Female |
| Under 5 Years | 0 (0.0%) | 0 (0.0%) |
| 5 to 17 Years | 28 (6.8%) | 31 (7.3%) |
| 18 to 34 Years | 76 (9.3%) | 66 (14.4%) |
| 35 to 64 Years | 252 (22.7%) | 229 (20.7%) |
| 65 to 74 Years | 82 (21.9%) | 65 (17.4%) |
| 75 Years and over | 77 (37.0%) | 126 (34.6%) |
Disability Class by Sex by Age in Gardiner
Disability Class: Hearing Difficulty
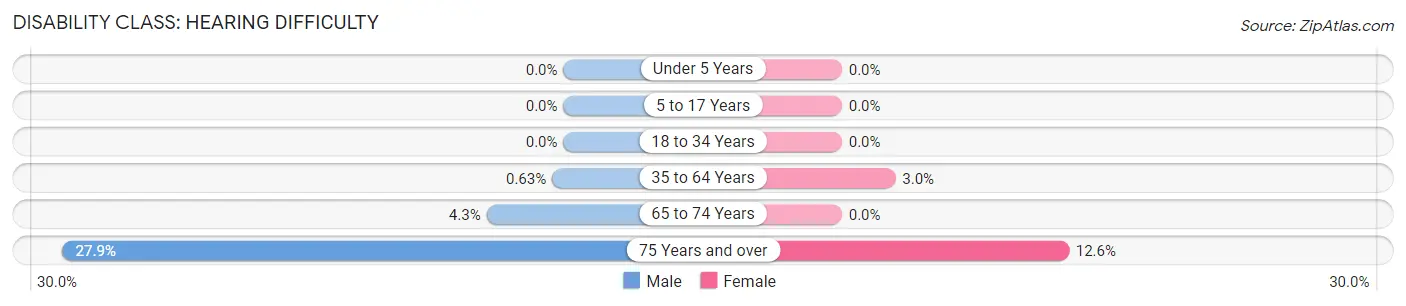
| Age Bracket | Male | Female |
| Under 5 Years | 0 (0.0%) | 0 (0.0%) |
| 5 to 17 Years | 0 (0.0%) | 0 (0.0%) |
| 18 to 34 Years | 0 (0.0%) | 0 (0.0%) |
| 35 to 64 Years | 7 (0.6%) | 33 (3.0%) |
| 65 to 74 Years | 16 (4.3%) | 0 (0.0%) |
| 75 Years and over | 58 (27.9%) | 46 (12.6%) |
Disability Class: Vision Difficulty
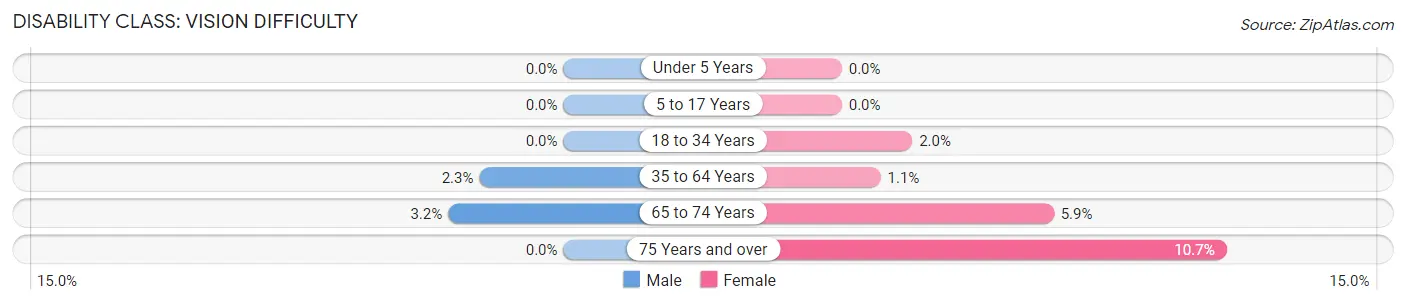
| Age Bracket | Male | Female |
| Under 5 Years | 0 (0.0%) | 0 (0.0%) |
| 5 to 17 Years | 0 (0.0%) | 0 (0.0%) |
| 18 to 34 Years | 0 (0.0%) | 9 (2.0%) |
| 35 to 64 Years | 26 (2.3%) | 12 (1.1%) |
| 65 to 74 Years | 12 (3.2%) | 22 (5.9%) |
| 75 Years and over | 0 (0.0%) | 39 (10.7%) |
Disability Class: Cognitive Difficulty
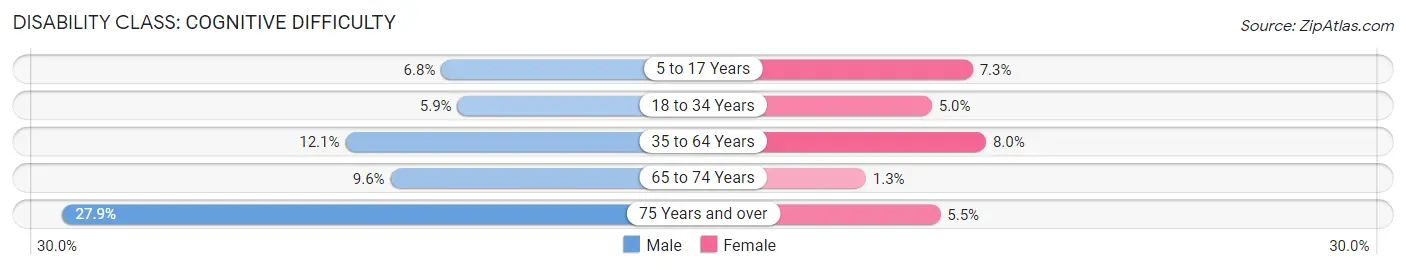
| Age Bracket | Male | Female |
| 5 to 17 Years | 28 (6.8%) | 31 (7.3%) |
| 18 to 34 Years | 48 (5.9%) | 23 (5.0%) |
| 35 to 64 Years | 135 (12.1%) | 89 (8.0%) |
| 65 to 74 Years | 36 (9.6%) | 5 (1.3%) |
| 75 Years and over | 58 (27.9%) | 20 (5.5%) |
Disability Class: Ambulatory Difficulty
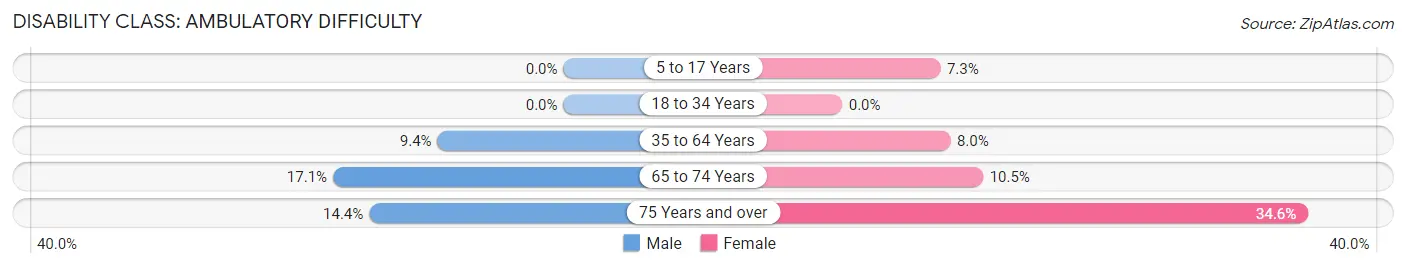
| Age Bracket | Male | Female |
| 5 to 17 Years | 0 (0.0%) | 31 (7.3%) |
| 18 to 34 Years | 0 (0.0%) | 0 (0.0%) |
| 35 to 64 Years | 104 (9.3%) | 89 (8.0%) |
| 65 to 74 Years | 64 (17.1%) | 39 (10.5%) |
| 75 Years and over | 30 (14.4%) | 126 (34.6%) |
Disability Class: Self-Care Difficulty
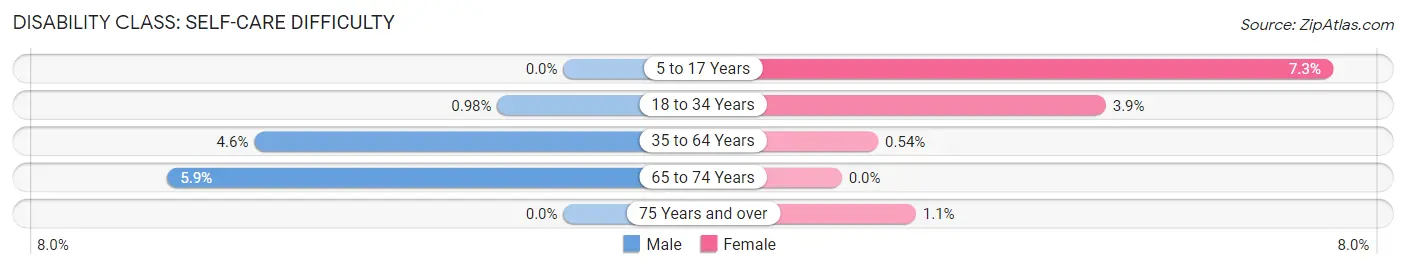
| Age Bracket | Male | Female |
| 5 to 17 Years | 0 (0.0%) | 31 (7.3%) |
| 18 to 34 Years | 8 (1.0%) | 18 (3.9%) |
| 35 to 64 Years | 51 (4.6%) | 6 (0.5%) |
| 65 to 74 Years | 22 (5.9%) | 0 (0.0%) |
| 75 Years and over | 0 (0.0%) | 4 (1.1%) |
Technology Access in Gardiner
Computing Device Access in Gardiner
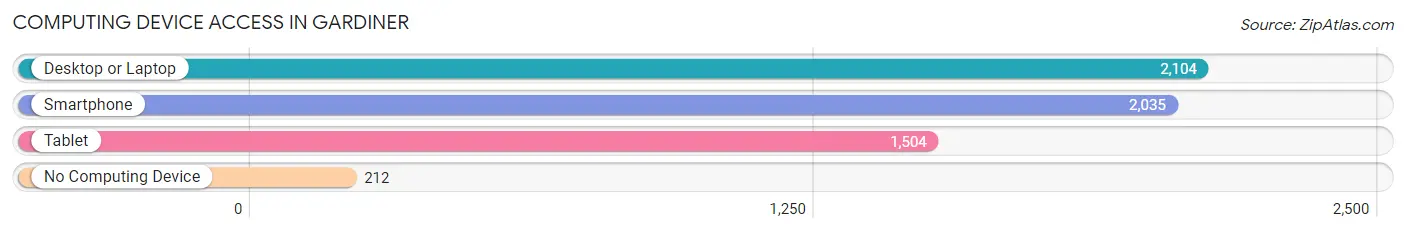
| Device Type | # Households | % Households |
| Desktop or Laptop | 2,104 | 80.5% |
| Smartphone | 2,035 | 77.9% |
| Tablet | 1,504 | 57.6% |
| No Computing Device | 212 | 8.1% |
| Total | 2,612 | 100.0% |
Internet Access in Gardiner
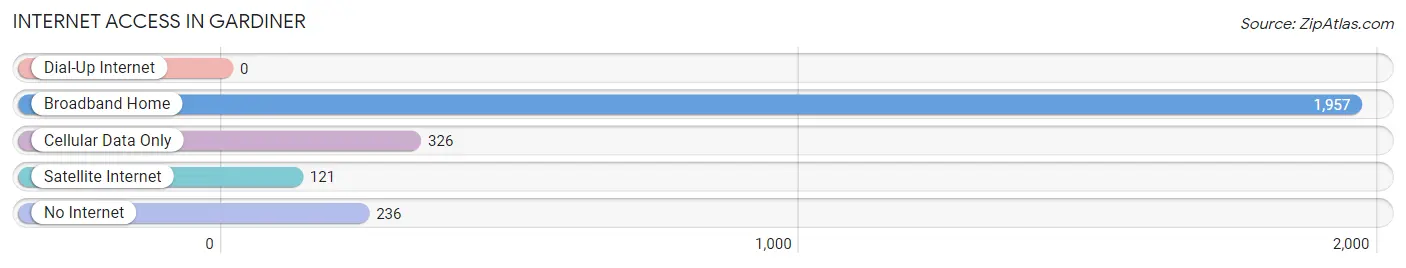
| Internet Type | # Households | % Households |
| Dial-Up Internet | 0 | 0.0% |
| Broadband Home | 1,957 | 74.9% |
| Cellular Data Only | 326 | 12.5% |
| Satellite Internet | 121 | 4.6% |
| No Internet | 236 | 9.0% |
| Total | 2,612 | 100.0% |
Gardiner Summary
Gardiner, Maine is a city located in Kennebec County, in the state of Maine. It is situated on the banks of the Kennebec River, and is part of the Augusta-Waterville metropolitan area. The city has a population of 5,800 people, according to the 2010 census.
History
Gardiner was first settled in 1754 by Dr. Silvester Gardiner, a physician from Boston. He purchased the land from the local Native American tribes, and established a trading post. The town was incorporated in 1760, and was named after Dr. Gardiner.
In the early 19th century, Gardiner became an important port for the lumber industry. The city was also a major center for shipbuilding, and was home to several shipyards. The city was also a major center for the textile industry, and was home to several mills.
In the late 19th century, Gardiner became a popular tourist destination. The city was home to several hotels, and was a popular destination for summer vacationers.
Geography
Gardiner is located in central Maine, on the banks of the Kennebec River. The city is situated in the Kennebec Valley, and is surrounded by rolling hills and forests. The city is located approximately 25 miles north of Augusta, the state capital.
The city has a total area of 8.2 square miles, of which 8.1 square miles is land and 0.1 square miles is water. The city is located at an elevation of approximately 100 feet above sea level.
Economy
Gardiner’s economy is largely based on the service industry. The city is home to several restaurants, hotels, and retail stores. The city is also home to several manufacturing companies, including a paper mill and a wood products plant.
The city is also home to several educational institutions, including the University of Maine at Augusta and Kennebec Valley Community College.
Demographics
According to the 2010 census, the population of Gardiner was 5,800 people. The racial makeup of the city was 94.3% White, 1.3% African American, 0.7% Native American, 0.7% Asian, 0.2% Pacific Islander, and 2.1% from other races.
The median household income in Gardiner was $37,941, and the median family income was $45,941. The per capita income in the city was $20,845. Approximately 16.3% of the population was below the poverty line.
Gardiner is a small city with a rich history and a diverse economy. The city is home to several educational institutions, and is a popular tourist destination. The city has a population of 5,800 people, and is a great place to live and work.
Common Questions
What is Per Capita Income in Gardiner?
Per Capita income in Gardiner is $35,701.
What is the Median Family Income in Gardiner?
Median Family Income in Gardiner is $86,250.
What is the Median Household income in Gardiner?
Median Household Income in Gardiner is $57,329.
What is Income or Wage Gap in Gardiner?
Income or Wage Gap in Gardiner is 3.6%.
Women in Gardiner earn 96.4 cents for every dollar earned by a man.
What is Inequality or Gini Index in Gardiner?
Inequality or Gini Index in Gardiner is 0.46.
What is the Total Population of Gardiner?
Total Population of Gardiner is 5,994.
What is the Total Male Population of Gardiner?
Total Male Population of Gardiner is 3,148.
What is the Total Female Population of Gardiner?
Total Female Population of Gardiner is 2,846.
What is the Ratio of Males per 100 Females in Gardiner?
There are 110.61 Males per 100 Females in Gardiner.
What is the Ratio of Females per 100 Males in Gardiner?
There are 90.41 Females per 100 Males in Gardiner.
What is the Median Population Age in Gardiner?
Median Population Age in Gardiner is 43.2 Years.
What is the Average Family Size in Gardiner
Average Family Size in Gardiner is 3.0 People.
What is the Average Household Size in Gardiner
Average Household Size in Gardiner is 2.3 People.
How Large is the Labor Force in Gardiner?
There are 2,874 People in the Labor Forcein in Gardiner.
What is the Percentage of People in the Labor Force in Gardiner?
58.1% of People are in the Labor Force in Gardiner.
What is the Unemployment Rate in Gardiner?
Unemployment Rate in Gardiner is 10.2%.