Caribou, ME Map & Demographics
Caribou Map
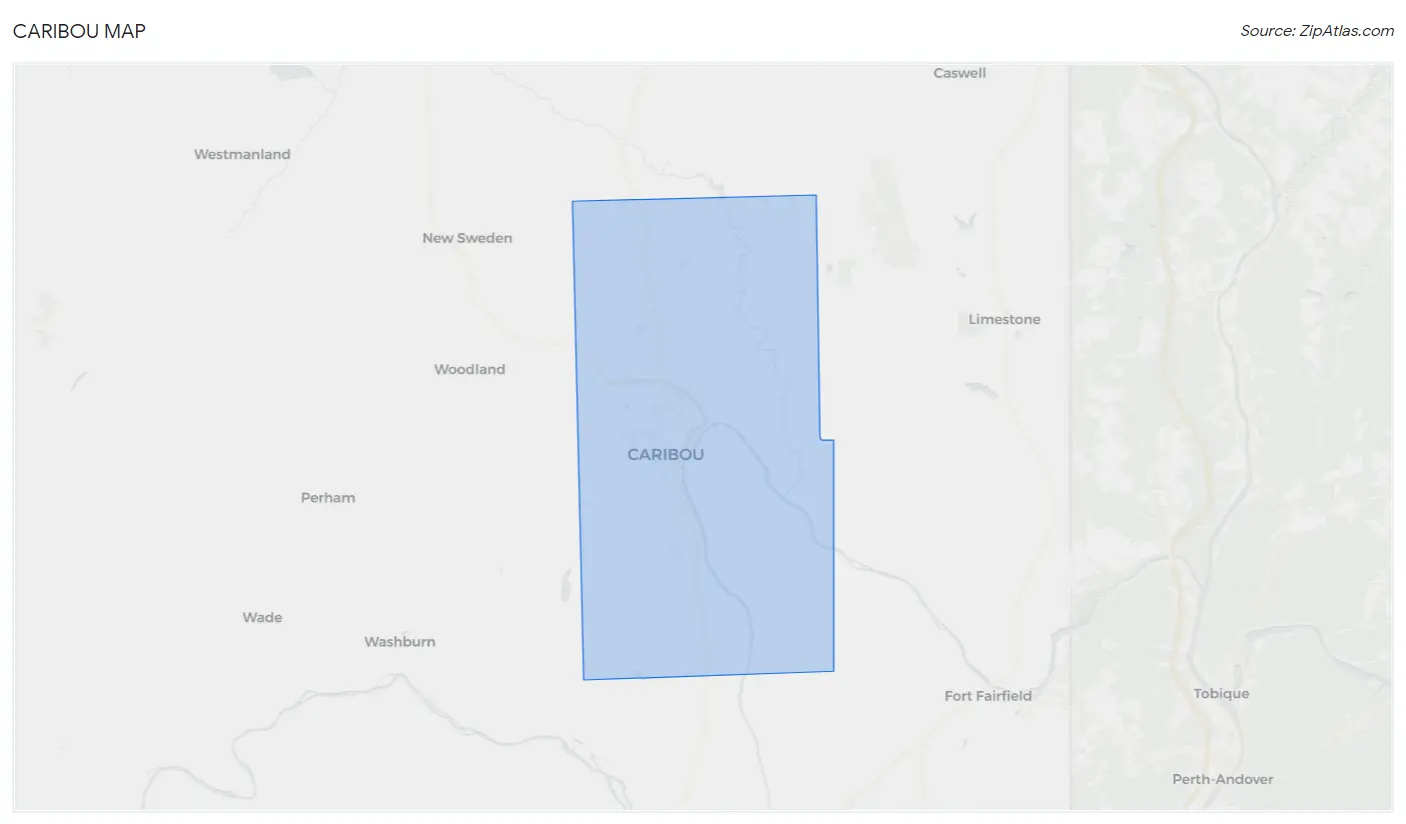
Caribou Overview
$33,605
PER CAPITA INCOME
$69,625
AVG FAMILY INCOME
$47,803
AVG HOUSEHOLD INCOME
11.7%
WAGE / INCOME GAP [ % ]
88.3¢/ $1
WAGE / INCOME GAP [ $ ]
0.48
INEQUALITY / GINI INDEX
7,454
TOTAL POPULATION
3,862
MALE POPULATION
3,592
FEMALE POPULATION
107.52
MALES / 100 FEMALES
93.01
FEMALES / 100 MALES
52.2
MEDIAN AGE
2.7
AVG FAMILY SIZE
2.1
AVG HOUSEHOLD SIZE
3,506
LABOR FORCE [ PEOPLE ]
54.0%
PERCENT IN LABOR FORCE
2.0%
UNEMPLOYMENT RATE
Caribou Zip Codes
Caribou Area Codes
Income in Caribou
Income Overview in Caribou
Per Capita Income in Caribou is $33,605, while median incomes of families and households are $69,625 and $47,803 respectively.
| Characteristic | Number | Measure |
| Per Capita Income | 7,454 | $33,605 |
| Median Family Income | 1,850 | $69,625 |
| Mean Family Income | 1,850 | $89,689 |
| Median Household Income | 3,526 | $47,803 |
| Mean Household Income | 3,526 | $68,934 |
| Income Deficit | 1,850 | $0 |
| Wage / Income Gap (%) | 7,454 | 11.71% |
| Wage / Income Gap ($) | 7,454 | 88.29¢ per $1 |
| Gini / Inequality Index | 7,454 | 0.48 |
Earnings by Sex in Caribou
Average Earnings in Caribou are $39,329, $41,261 for men and $36,431 for women, a difference of 11.7%.
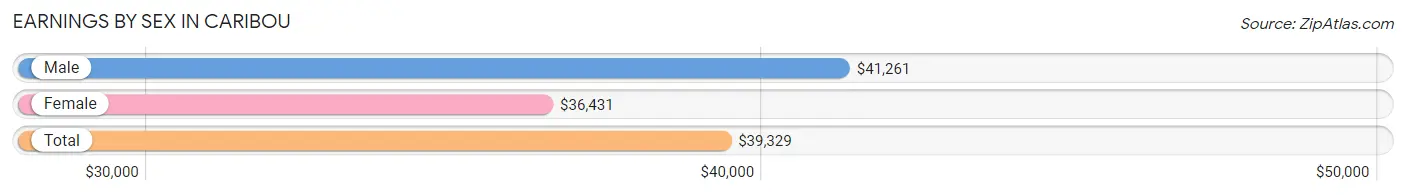
| Sex | Number | Average Earnings |
| Male | 1,910 (52.8%) | $41,261 |
| Female | 1,707 (47.2%) | $36,431 |
| Total | 3,617 (100.0%) | $39,329 |
Earnings by Sex by Income Bracket in Caribou
The most common earnings brackets in Caribou are $55,000 to $64,999 for men (246 | 12.9%) and $55,000 to $64,999 for women (203 | 11.9%).
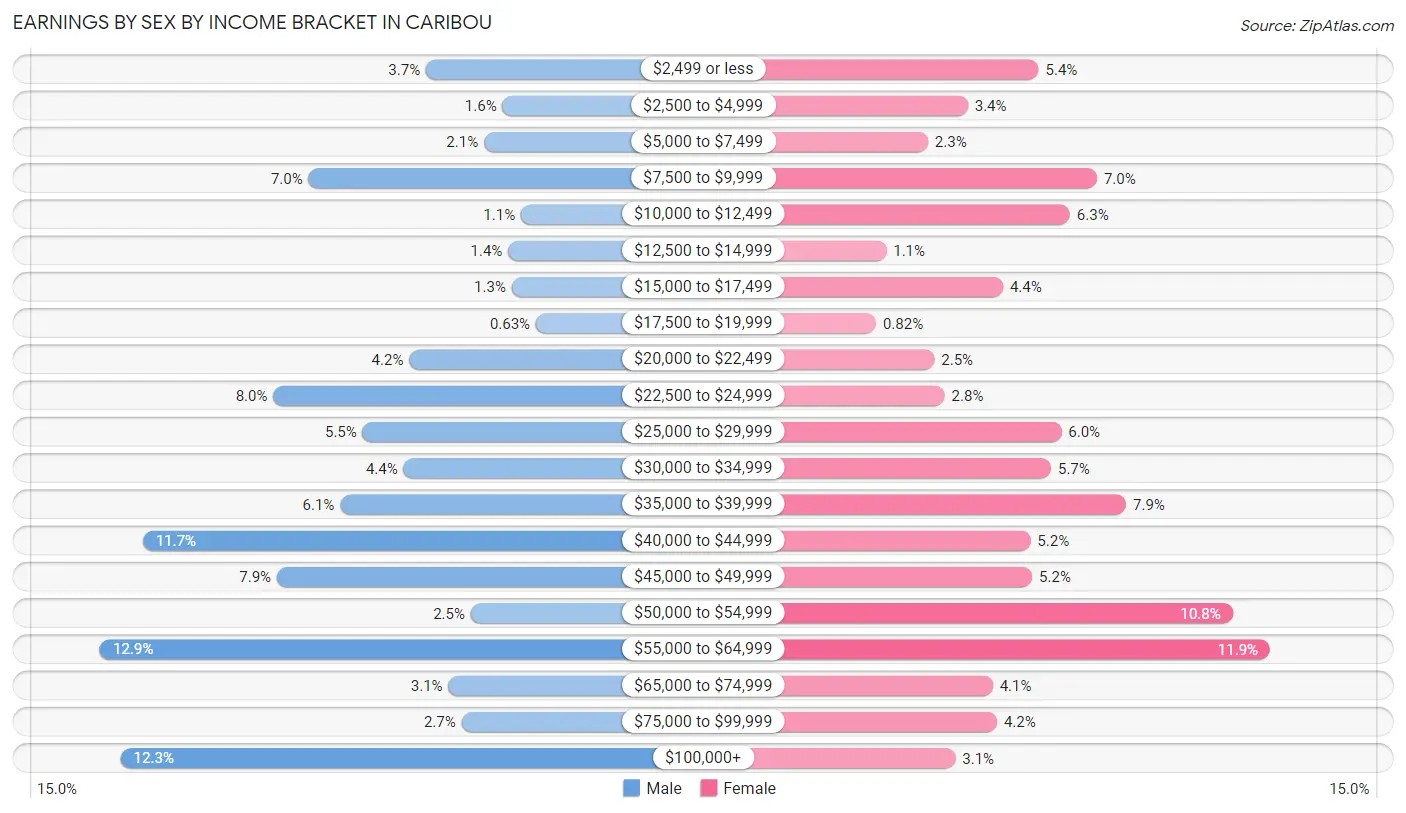
| Income | Male | Female |
| $2,499 or less | 71 (3.7%) | 92 (5.4%) |
| $2,500 to $4,999 | 30 (1.6%) | 58 (3.4%) |
| $5,000 to $7,499 | 40 (2.1%) | 39 (2.3%) |
| $7,500 to $9,999 | 134 (7.0%) | 120 (7.0%) |
| $10,000 to $12,499 | 20 (1.1%) | 107 (6.3%) |
| $12,500 to $14,999 | 27 (1.4%) | 19 (1.1%) |
| $15,000 to $17,499 | 25 (1.3%) | 75 (4.4%) |
| $17,500 to $19,999 | 12 (0.6%) | 14 (0.8%) |
| $20,000 to $22,499 | 80 (4.2%) | 42 (2.5%) |
| $22,500 to $24,999 | 153 (8.0%) | 47 (2.8%) |
| $25,000 to $29,999 | 105 (5.5%) | 103 (6.0%) |
| $30,000 to $34,999 | 83 (4.3%) | 98 (5.7%) |
| $35,000 to $39,999 | 117 (6.1%) | 134 (7.9%) |
| $40,000 to $44,999 | 223 (11.7%) | 88 (5.2%) |
| $45,000 to $49,999 | 151 (7.9%) | 89 (5.2%) |
| $50,000 to $54,999 | 47 (2.5%) | 185 (10.8%) |
| $55,000 to $64,999 | 246 (12.9%) | 203 (11.9%) |
| $65,000 to $74,999 | 59 (3.1%) | 70 (4.1%) |
| $75,000 to $99,999 | 52 (2.7%) | 72 (4.2%) |
| $100,000+ | 235 (12.3%) | 52 (3.0%) |
| Total | 1,910 (100.0%) | 1,707 (100.0%) |
Earnings by Sex by Educational Attainment in Caribou
Average earnings in Caribou are $44,203 for men and $42,055 for women, a difference of 4.9%. Men with an educational attainment of graduate degree enjoy the highest average annual earnings of $107,917, while those with high school diploma education earn the least with $29,531. Women with an educational attainment of graduate degree earn the most with the average annual earnings of $58,725, while those with college or associate's degree education have the smallest earnings of $33,511.
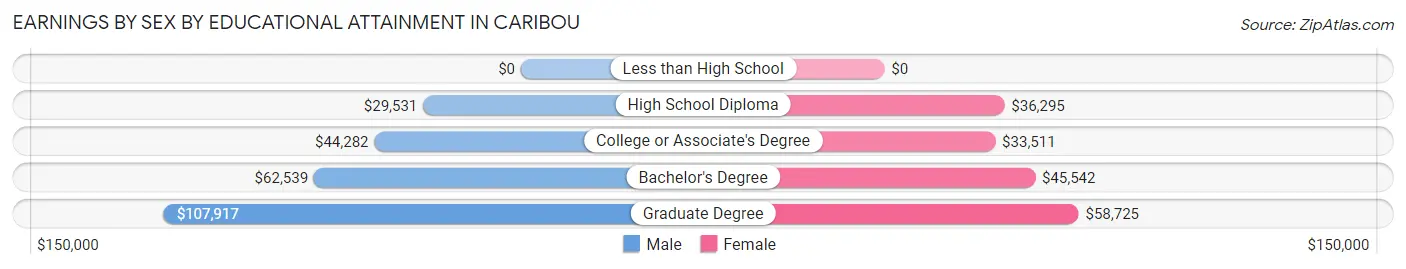
| Educational Attainment | Male Income | Female Income |
| Less than High School | - | - |
| High School Diploma | $29,531 | $36,295 |
| College or Associate's Degree | $44,282 | $33,511 |
| Bachelor's Degree | $62,539 | $45,542 |
| Graduate Degree | $107,917 | $58,725 |
| Total | $44,203 | $42,055 |
Family Income in Caribou
Family Income Brackets in Caribou
According to the Caribou family income data, there are 411 families falling into the $100,000 to $149,999 income range, which is the most common income bracket and makes up 22.2% of all families. Conversely, the less than $10,000 income bracket is the least frequent group with only 30 families (1.6%) belonging to this category.
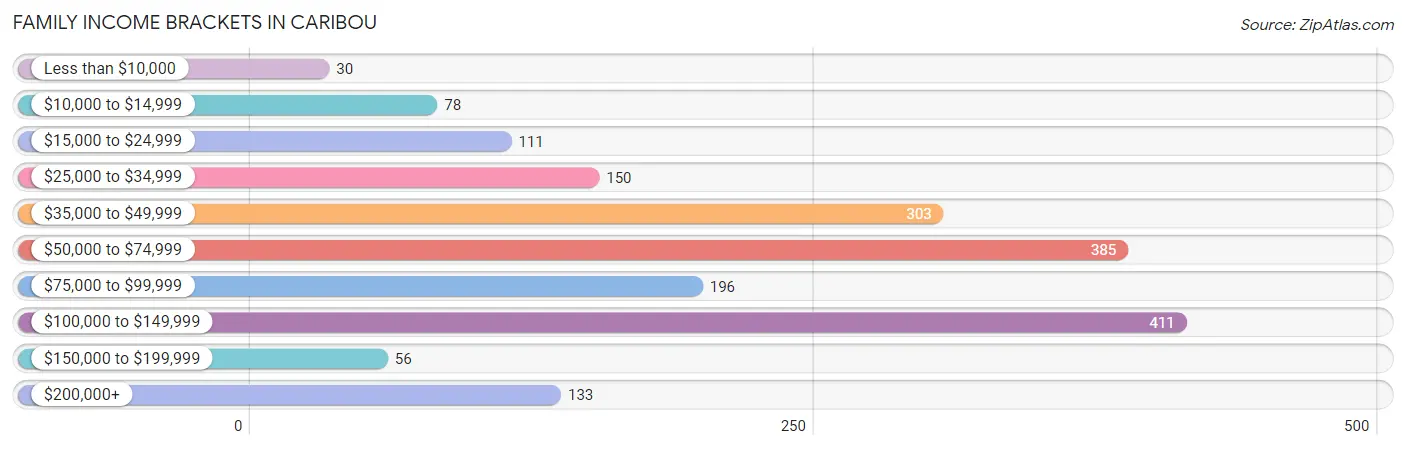
| Income Bracket | # Families | % Families |
| Less than $10,000 | 30 | 1.6% |
| $10,000 to $14,999 | 78 | 4.2% |
| $15,000 to $24,999 | 111 | 6.0% |
| $25,000 to $34,999 | 150 | 8.1% |
| $35,000 to $49,999 | 303 | 16.4% |
| $50,000 to $74,999 | 385 | 20.8% |
| $75,000 to $99,999 | 196 | 10.6% |
| $100,000 to $149,999 | 411 | 22.2% |
| $150,000 to $199,999 | 56 | 3.0% |
| $200,000+ | 133 | 7.2% |
Family Income by Famaliy Size in Caribou
5-person families (74 | 4.0%) account for the highest median family income in Caribou with $126,346 per family, while 3-person families (293 | 15.8%) have the highest median income of $32,208 per family member.
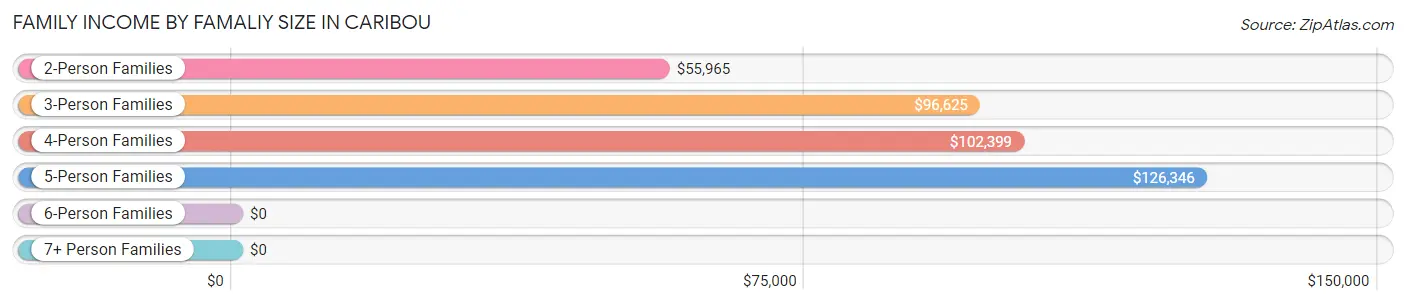
| Income Bracket | # Families | Median Income |
| 2-Person Families | 1,140 (61.6%) | $55,965 |
| 3-Person Families | 293 (15.8%) | $96,625 |
| 4-Person Families | 277 (15.0%) | $102,399 |
| 5-Person Families | 74 (4.0%) | $126,346 |
| 6-Person Families | 5 (0.3%) | $0 |
| 7+ Person Families | 61 (3.3%) | $0 |
| Total | 1,850 (100.0%) | $69,625 |
Family Income by Number of Earners in Caribou
The median family income in Caribou is $69,625, with families comprising 3+ earners (176) having the highest median family income of $114,000, while families with no earners (524) have the lowest median family income of $37,931, accounting for 9.5% and 28.3% of families, respectively.
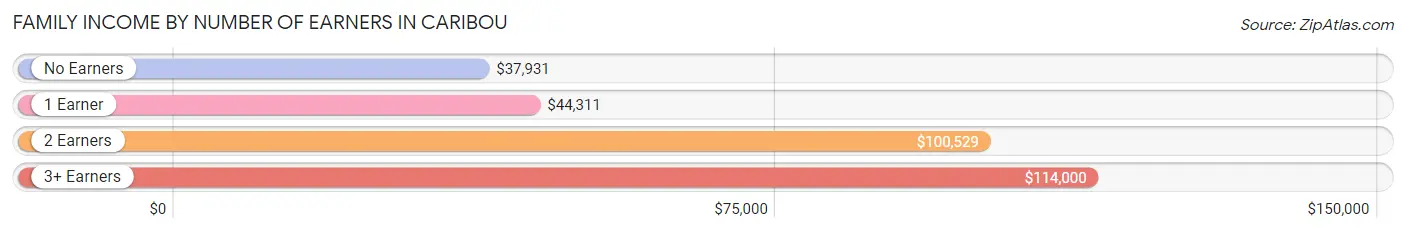
| Number of Earners | # Families | Median Income |
| No Earners | 524 (28.3%) | $37,931 |
| 1 Earner | 423 (22.9%) | $44,311 |
| 2 Earners | 727 (39.3%) | $100,529 |
| 3+ Earners | 176 (9.5%) | $114,000 |
| Total | 1,850 (100.0%) | $69,625 |
Household Income in Caribou
Household Income Brackets in Caribou
With 652 households falling in the category, the $50,000 to $74,999 income range is the most frequent in Caribou, accounting for 18.5% of all households. In contrast, only 99 households (2.8%) fall into the $150,000 to $199,999 income bracket, making it the least populous group.
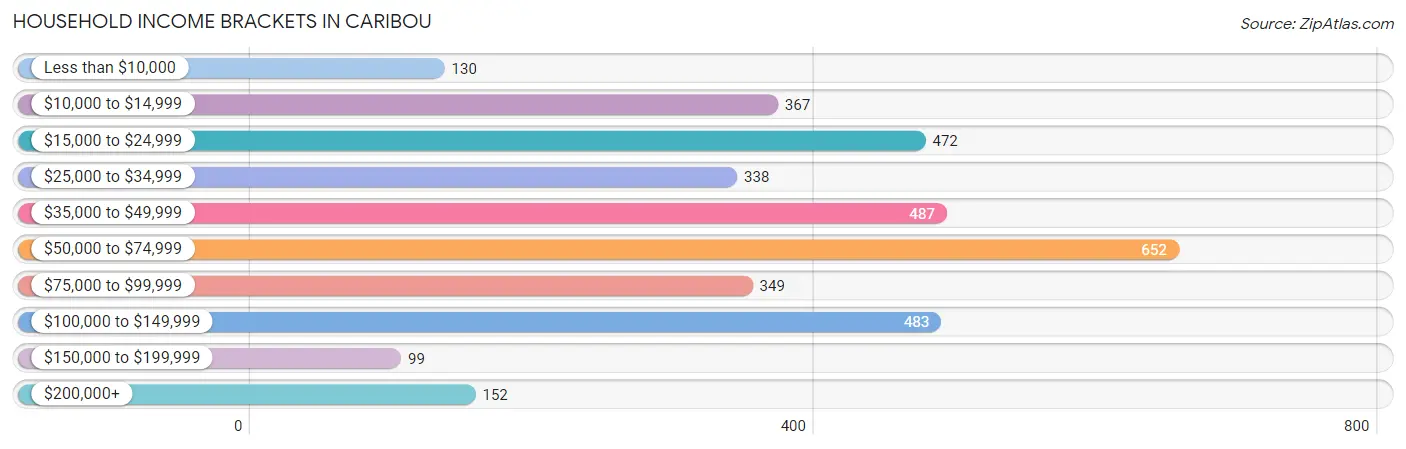
| Income Bracket | # Households | % Households |
| Less than $10,000 | 130 | 3.7% |
| $10,000 to $14,999 | 367 | 10.4% |
| $15,000 to $24,999 | 472 | 13.4% |
| $25,000 to $34,999 | 338 | 9.6% |
| $35,000 to $49,999 | 487 | 13.8% |
| $50,000 to $74,999 | 652 | 18.5% |
| $75,000 to $99,999 | 349 | 9.9% |
| $100,000 to $149,999 | 483 | 13.7% |
| $150,000 to $199,999 | 99 | 2.8% |
| $200,000+ | 152 | 4.3% |
Household Income by Householder Age in Caribou
The median household income in Caribou is $47,803, with the highest median household income of $83,972 found in the 25 to 44 years age bracket for the primary householder. A total of 713 households (20.2%) fall into this category. Meanwhile, the 65+ years age bracket for the primary householder has the lowest median household income of $31,433, with 1,301 households (36.9%) in this group.
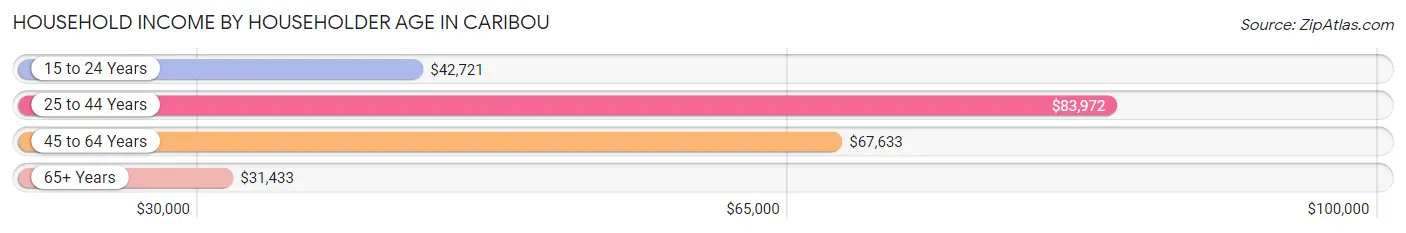
| Income Bracket | # Households | Median Income |
| 15 to 24 Years | 139 (3.9%) | $42,721 |
| 25 to 44 Years | 713 (20.2%) | $83,972 |
| 45 to 64 Years | 1,373 (38.9%) | $67,633 |
| 65+ Years | 1,301 (36.9%) | $31,433 |
| Total | 3,526 (100.0%) | $47,803 |
Poverty in Caribou
Income Below Poverty by Sex and Age in Caribou
With 12.0% poverty level for males and 15.3% for females among the residents of Caribou, 18 to 24 year old males and 18 to 24 year old females are the most vulnerable to poverty, with 118 males (33.6%) and 152 females (49.8%) in their respective age groups living below the poverty level.
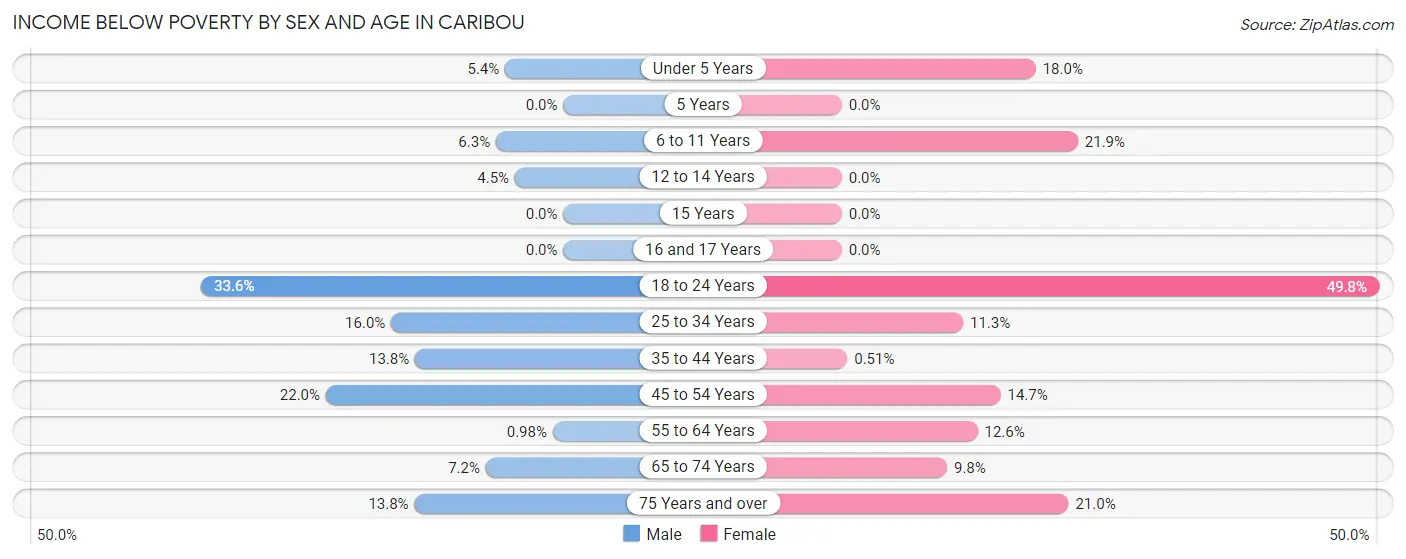
| Age Bracket | Male | Female |
| Under 5 Years | 10 (5.4%) | 27 (18.0%) |
| 5 Years | 0 (0.0%) | 0 (0.0%) |
| 6 to 11 Years | 9 (6.2%) | 39 (21.9%) |
| 12 to 14 Years | 4 (4.5%) | 0 (0.0%) |
| 15 Years | 0 (0.0%) | 0 (0.0%) |
| 16 and 17 Years | 0 (0.0%) | 0 (0.0%) |
| 18 to 24 Years | 118 (33.6%) | 152 (49.8%) |
| 25 to 34 Years | 58 (16.0%) | 37 (11.3%) |
| 35 to 44 Years | 49 (13.8%) | 2 (0.5%) |
| 45 to 54 Years | 108 (22.0%) | 57 (14.7%) |
| 55 to 64 Years | 7 (1.0%) | 79 (12.6%) |
| 65 to 74 Years | 45 (7.2%) | 34 (9.8%) |
| 75 Years and over | 51 (13.8%) | 105 (21.0%) |
| Total | 459 (12.0%) | 532 (15.3%) |
Income Above Poverty by Sex and Age in Caribou
According to the poverty statistics in Caribou, males aged 5 years and females aged 5 years are the age groups that are most secure financially, with 100.0% of males and 100.0% of females in these age groups living above the poverty line.
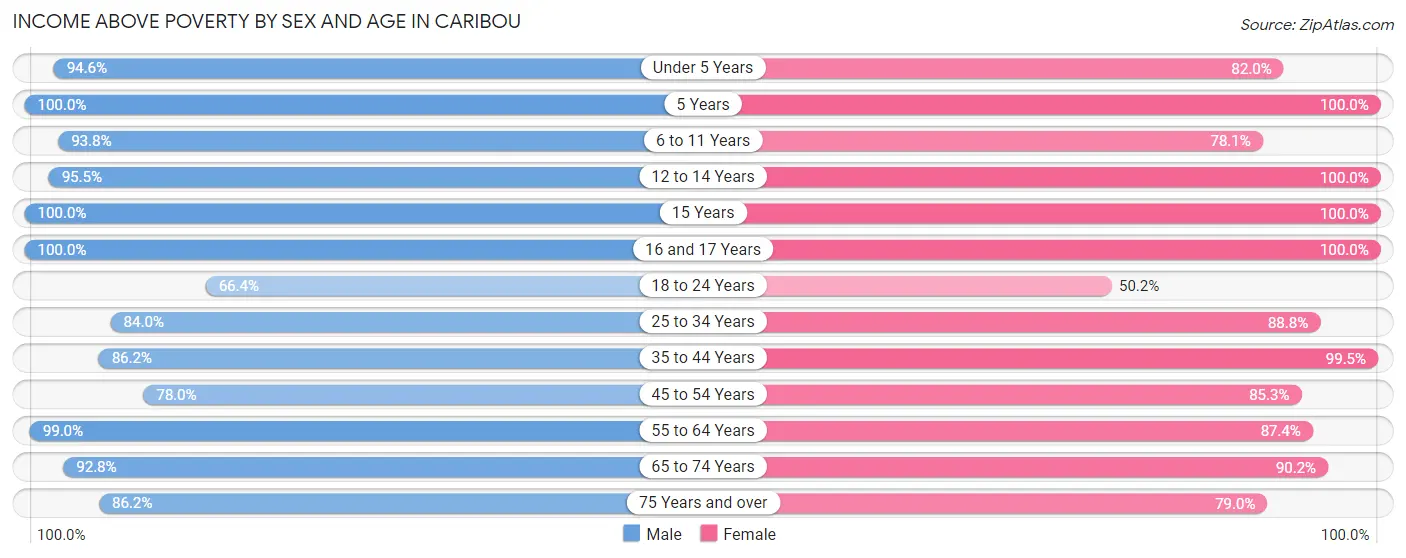
| Age Bracket | Male | Female |
| Under 5 Years | 175 (94.6%) | 123 (82.0%) |
| 5 Years | 8 (100.0%) | 55 (100.0%) |
| 6 to 11 Years | 135 (93.8%) | 139 (78.1%) |
| 12 to 14 Years | 85 (95.5%) | 84 (100.0%) |
| 15 Years | 26 (100.0%) | 42 (100.0%) |
| 16 and 17 Years | 95 (100.0%) | 81 (100.0%) |
| 18 to 24 Years | 233 (66.4%) | 153 (50.2%) |
| 25 to 34 Years | 305 (84.0%) | 292 (88.7%) |
| 35 to 44 Years | 307 (86.2%) | 392 (99.5%) |
| 45 to 54 Years | 382 (78.0%) | 330 (85.3%) |
| 55 to 64 Years | 707 (99.0%) | 548 (87.4%) |
| 65 to 74 Years | 580 (92.8%) | 314 (90.2%) |
| 75 Years and over | 318 (86.2%) | 394 (79.0%) |
| Total | 3,356 (88.0%) | 2,947 (84.7%) |
Income Below Poverty Among Married-Couple Families in Caribou
The poverty statistics for married-couple families in Caribou show that 2.2% or 33 of the total 1,479 families live below the poverty line. Families with no children have the highest poverty rate of 2.6%, comprising of 26 families. On the other hand, families with 3 or 4 children have the lowest poverty rate of 0.0%, which includes 0 families.
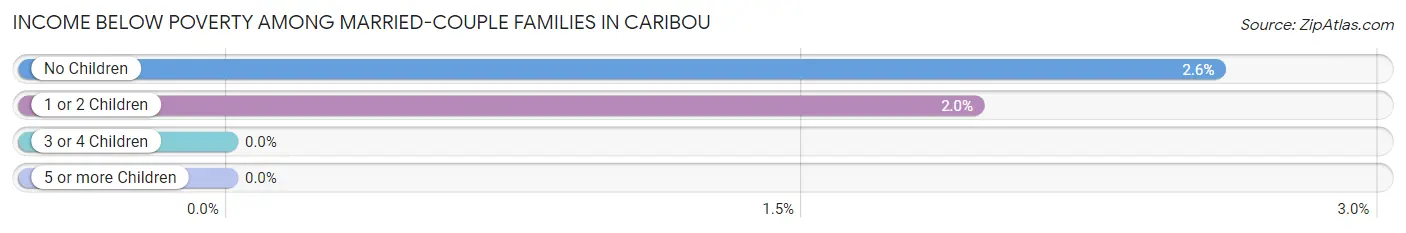
| Children | Above Poverty | Below Poverty |
| No Children | 983 (97.4%) | 26 (2.6%) |
| 1 or 2 Children | 352 (98.1%) | 7 (1.9%) |
| 3 or 4 Children | 88 (100.0%) | 0 (0.0%) |
| 5 or more Children | 23 (100.0%) | 0 (0.0%) |
| Total | 1,446 (97.8%) | 33 (2.2%) |
Income Below Poverty Among Single-Parent Households in Caribou
According to the poverty data in Caribou, 33.3% or 43 single-father households and 28.9% or 70 single-mother households are living below the poverty line. Among single-father households, those with 1 or 2 children have the highest poverty rate, with 43 households (39.5%) experiencing poverty. Likewise, among single-mother households, those with 1 or 2 children have the highest poverty rate, with 25 households (36.8%) falling below the poverty line.
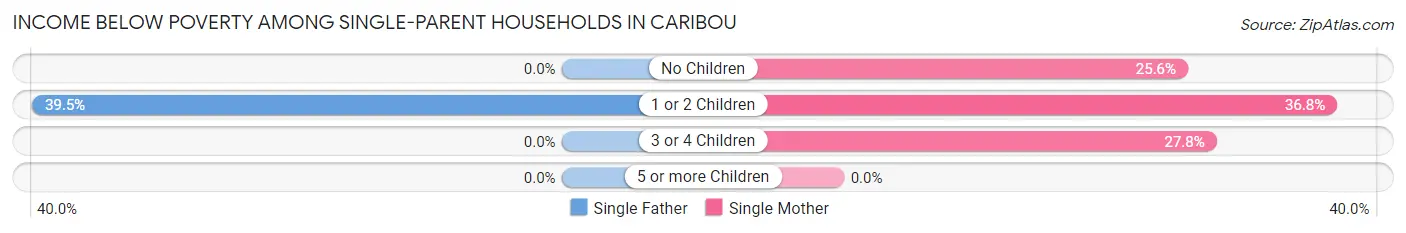
| Children | Single Father | Single Mother |
| No Children | 0 (0.0%) | 40 (25.6%) |
| 1 or 2 Children | 43 (39.5%) | 25 (36.8%) |
| 3 or 4 Children | 0 (0.0%) | 5 (27.8%) |
| 5 or more Children | 0 (0.0%) | 0 (0.0%) |
| Total | 43 (33.3%) | 70 (28.9%) |
Income Below Poverty Among Married-Couple vs Single-Parent Households in Caribou
The poverty data for Caribou shows that 33 of the married-couple family households (2.2%) and 113 of the single-parent households (30.5%) are living below the poverty level. Within the married-couple family households, those with no children have the highest poverty rate, with 26 households (2.6%) falling below the poverty line. Among the single-parent households, those with 1 or 2 children have the highest poverty rate, with 68 household (38.4%) living below poverty.
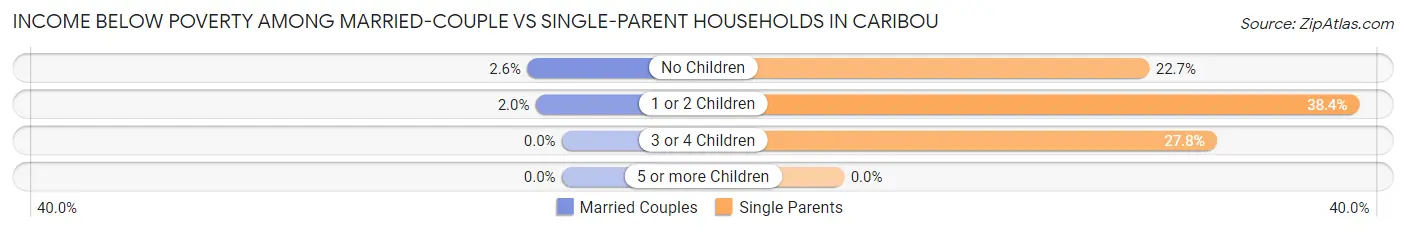
| Children | Married-Couple Families | Single-Parent Households |
| No Children | 26 (2.6%) | 40 (22.7%) |
| 1 or 2 Children | 7 (1.9%) | 68 (38.4%) |
| 3 or 4 Children | 0 (0.0%) | 5 (27.8%) |
| 5 or more Children | 0 (0.0%) | 0 (0.0%) |
| Total | 33 (2.2%) | 113 (30.5%) |
Race in Caribou
The most populous races in Caribou are White / Caucasian (6,887 | 92.4%), Two or more Races (417 | 5.6%), and Native / Alaskan (107 | 1.4%).
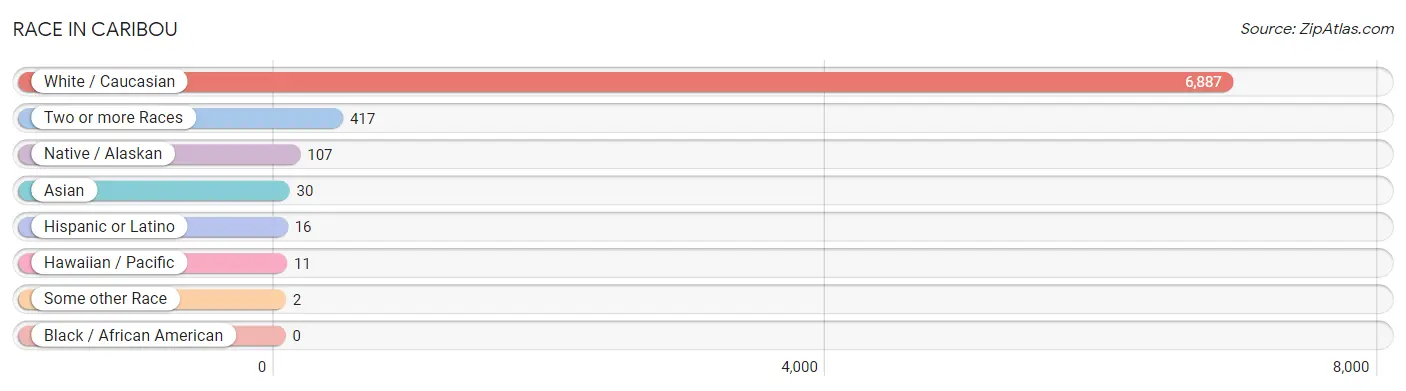
| Race | # Population | % Population |
| Asian | 30 | 0.4% |
| Black / African American | 0 | 0.0% |
| Hawaiian / Pacific | 11 | 0.2% |
| Hispanic or Latino | 16 | 0.2% |
| Native / Alaskan | 107 | 1.4% |
| White / Caucasian | 6,887 | 92.4% |
| Two or more Races | 417 | 5.6% |
| Some other Race | 2 | 0.0% |
| Total | 7,454 | 100.0% |
Ancestry in Caribou
The most populous ancestries reported in Caribou are French (2,045 | 27.4%), English (1,002 | 13.4%), French Canadian (814 | 10.9%), Irish (761 | 10.2%), and American (654 | 8.8%), together accounting for 70.8% of all Caribou residents.
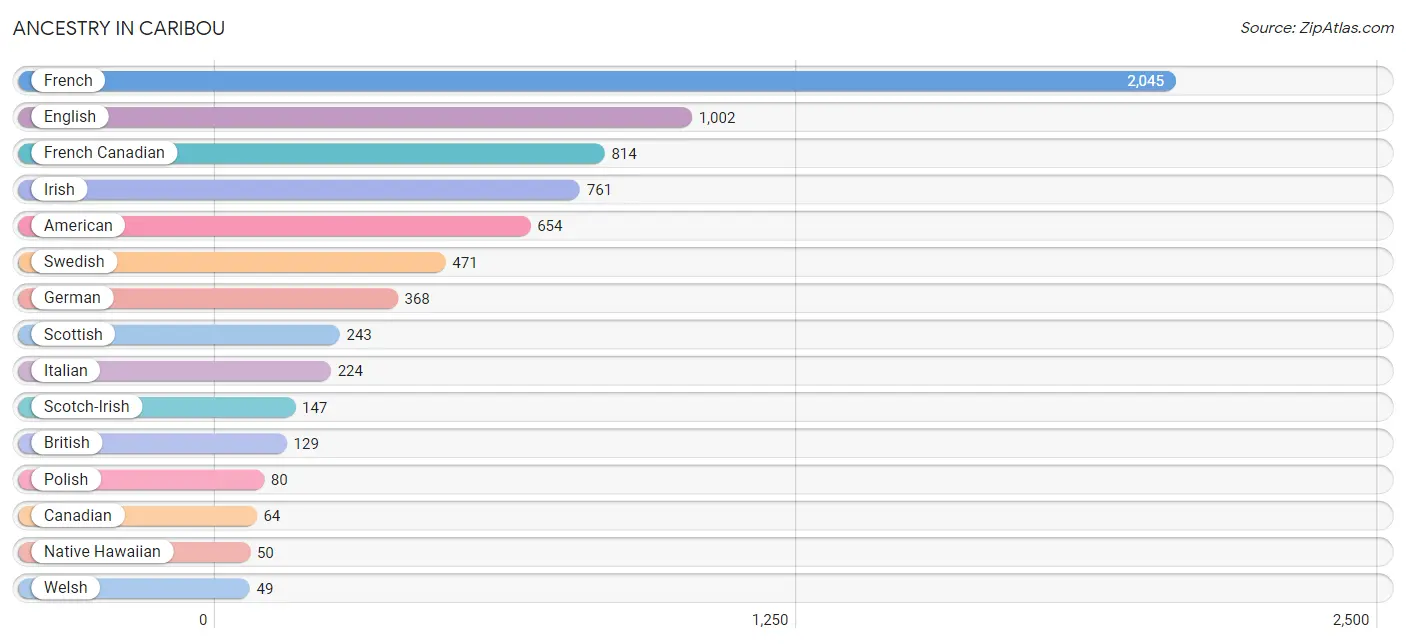
| Ancestry | # Population | % Population |
| American | 654 | 8.8% |
| Arab | 5 | 0.1% |
| Bhutanese | 4 | 0.1% |
| British | 129 | 1.7% |
| Burmese | 9 | 0.1% |
| Cajun | 23 | 0.3% |
| Canadian | 64 | 0.9% |
| Celtic | 2 | 0.0% |
| Cherokee | 13 | 0.2% |
| Czech | 47 | 0.6% |
| Danish | 3 | 0.0% |
| Dutch | 26 | 0.4% |
| English | 1,002 | 13.4% |
| European | 37 | 0.5% |
| French | 2,045 | 27.4% |
| French American Indian | 10 | 0.1% |
| French Canadian | 814 | 10.9% |
| German | 368 | 4.9% |
| Indian (Asian) | 10 | 0.1% |
| Irish | 761 | 10.2% |
| Italian | 224 | 3.0% |
| Korean | 48 | 0.6% |
| Latvian | 8 | 0.1% |
| Lebanese | 5 | 0.1% |
| Mexican | 4 | 0.1% |
| Native Hawaiian | 50 | 0.7% |
| New Zealander | 3 | 0.0% |
| Pakistani | 27 | 0.4% |
| Polish | 80 | 1.1% |
| Portuguese | 24 | 0.3% |
| Puerto Rican | 4 | 0.1% |
| Russian | 22 | 0.3% |
| Scandinavian | 15 | 0.2% |
| Scotch-Irish | 147 | 2.0% |
| Scottish | 243 | 3.3% |
| Spaniard | 8 | 0.1% |
| Swedish | 471 | 6.3% |
| Welsh | 49 | 0.7% | View All 38 Rows |
Immigrants in Caribou
The most numerous immigrant groups reported in Caribou came from Canada (234 | 3.1%), Europe (55 | 0.7%), Czechoslovakia (47 | 0.6%), Eastern Europe (47 | 0.6%), and Asia (13 | 0.2%), together accounting for 5.3% of all Caribou residents.
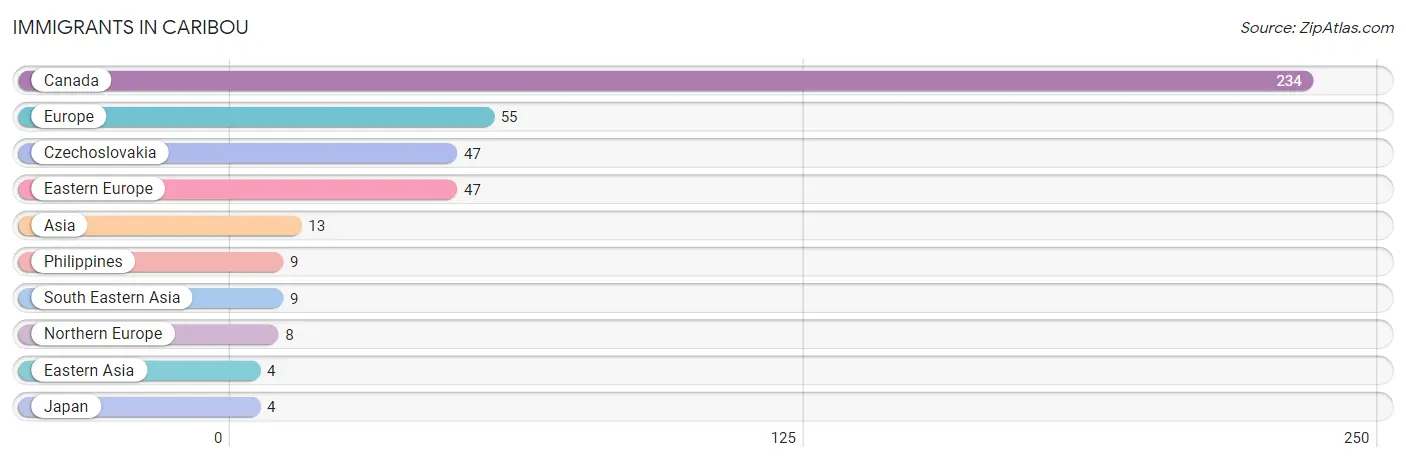
| Immigration Origin | # Population | % Population |
| Asia | 13 | 0.2% |
| Canada | 234 | 3.1% |
| Czechoslovakia | 47 | 0.6% |
| Eastern Asia | 4 | 0.1% |
| Eastern Europe | 47 | 0.6% |
| Europe | 55 | 0.7% |
| Japan | 4 | 0.1% |
| Northern Europe | 8 | 0.1% |
| Philippines | 9 | 0.1% |
| South Eastern Asia | 9 | 0.1% | View All 10 Rows |
Sex and Age in Caribou
Sex and Age in Caribou
The most populous age groups in Caribou are 55 to 59 Years (503 | 13.0%) for men and 55 to 59 Years (390 | 10.9%) for women.
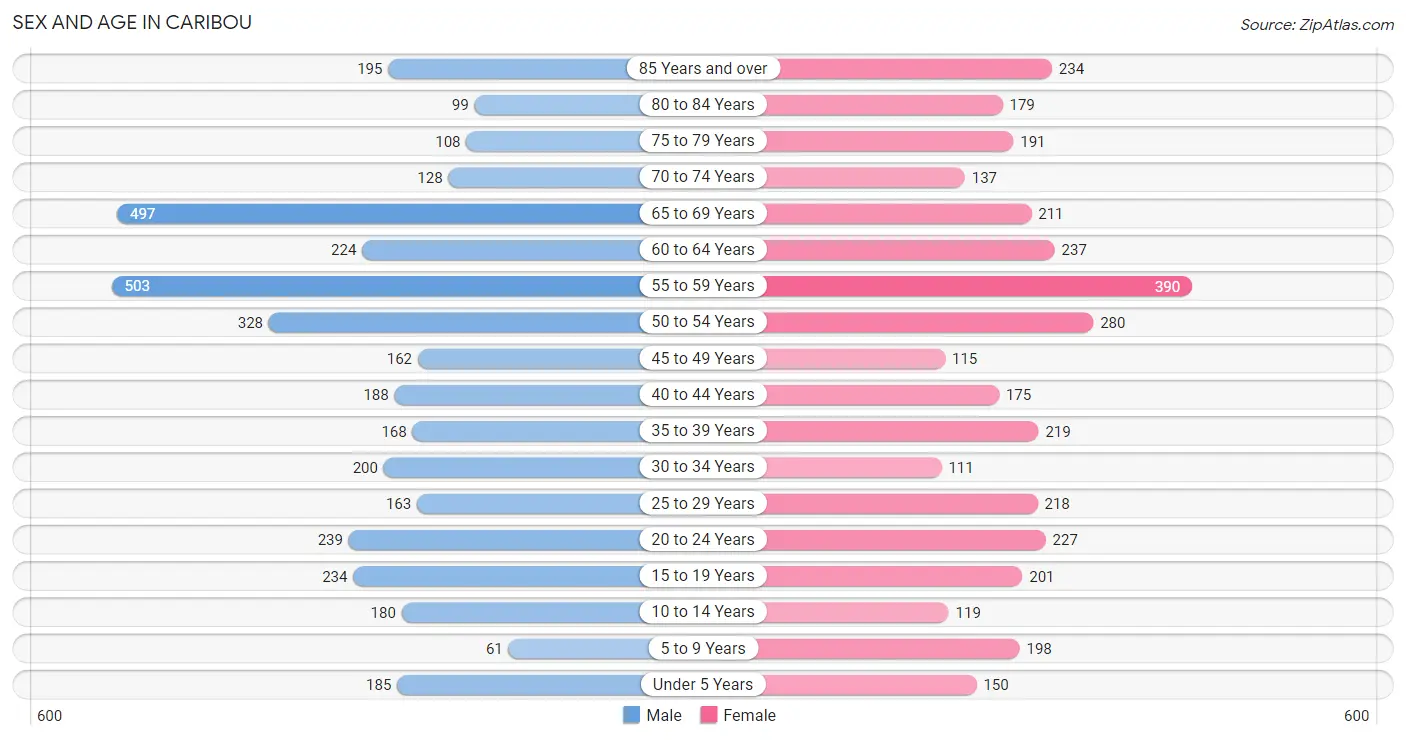
| Age Bracket | Male | Female |
| Under 5 Years | 185 (4.8%) | 150 (4.2%) |
| 5 to 9 Years | 61 (1.6%) | 198 (5.5%) |
| 10 to 14 Years | 180 (4.7%) | 119 (3.3%) |
| 15 to 19 Years | 234 (6.1%) | 201 (5.6%) |
| 20 to 24 Years | 239 (6.2%) | 227 (6.3%) |
| 25 to 29 Years | 163 (4.2%) | 218 (6.1%) |
| 30 to 34 Years | 200 (5.2%) | 111 (3.1%) |
| 35 to 39 Years | 168 (4.3%) | 219 (6.1%) |
| 40 to 44 Years | 188 (4.9%) | 175 (4.9%) |
| 45 to 49 Years | 162 (4.2%) | 115 (3.2%) |
| 50 to 54 Years | 328 (8.5%) | 280 (7.8%) |
| 55 to 59 Years | 503 (13.0%) | 390 (10.9%) |
| 60 to 64 Years | 224 (5.8%) | 237 (6.6%) |
| 65 to 69 Years | 497 (12.9%) | 211 (5.9%) |
| 70 to 74 Years | 128 (3.3%) | 137 (3.8%) |
| 75 to 79 Years | 108 (2.8%) | 191 (5.3%) |
| 80 to 84 Years | 99 (2.6%) | 179 (5.0%) |
| 85 Years and over | 195 (5.1%) | 234 (6.5%) |
| Total | 3,862 (100.0%) | 3,592 (100.0%) |
Families and Households in Caribou
Median Family Size in Caribou
The median family size in Caribou is 2.74 persons per family, with single female/mother families (242 | 13.1%) accounting for the largest median family size of 2.93 persons per family. On the other hand, single male/father families (129 | 7.0%) represent the smallest median family size with 2.12 persons per family.
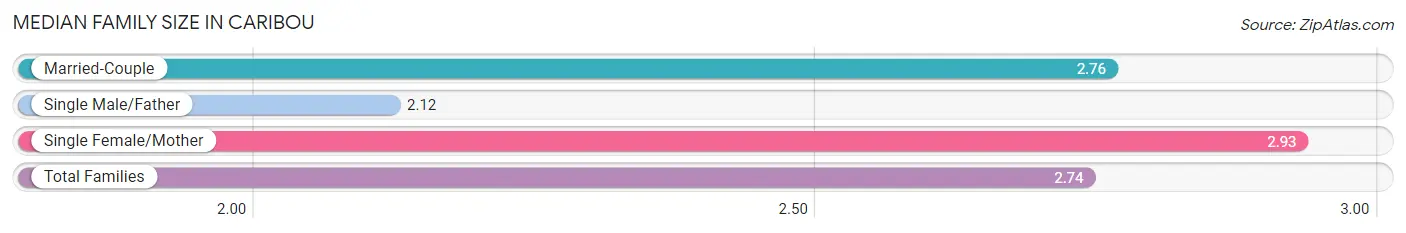
| Family Type | # Families | Family Size |
| Married-Couple | 1,479 (79.9%) | 2.76 |
| Single Male/Father | 129 (7.0%) | 2.12 |
| Single Female/Mother | 242 (13.1%) | 2.93 |
| Total Families | 1,850 (100.0%) | 2.74 |
Median Household Size in Caribou
The median household size in Caribou is 2.06 persons per household, with single female/mother households (242 | 6.9%) accounting for the largest median household size of 2.98 persons per household. non-family households (1,676 | 47.5%) represent the smallest median household size with 1.29 persons per household.
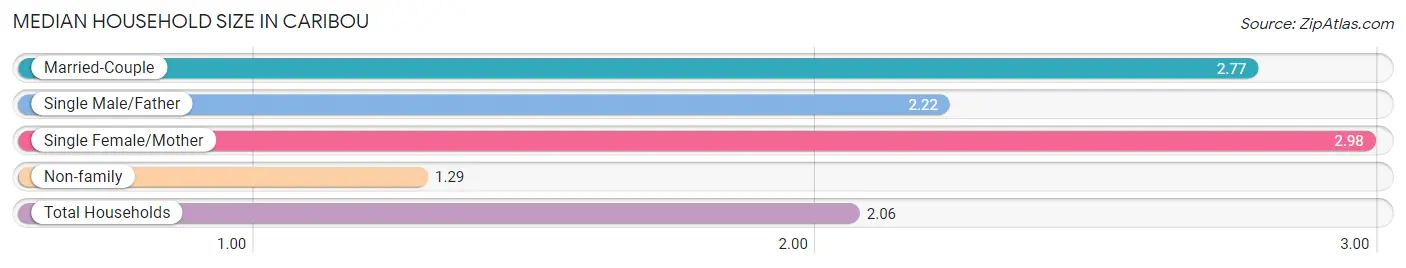
| Household Type | # Households | Household Size |
| Married-Couple | 1,479 (41.9%) | 2.77 |
| Single Male/Father | 129 (3.7%) | 2.22 |
| Single Female/Mother | 242 (6.9%) | 2.98 |
| Non-family | 1,676 (47.5%) | 1.29 |
| Total Households | 3,526 (100.0%) | 2.06 |
Household Size by Marriage Status in Caribou
Out of a total of 3,526 households in Caribou, 1,850 (52.5%) are family households, while 1,676 (47.5%) are nonfamily households. The most numerous type of family households are 2-person households, comprising 1,129, and the most common type of nonfamily households are 1-person households, comprising 1,419.
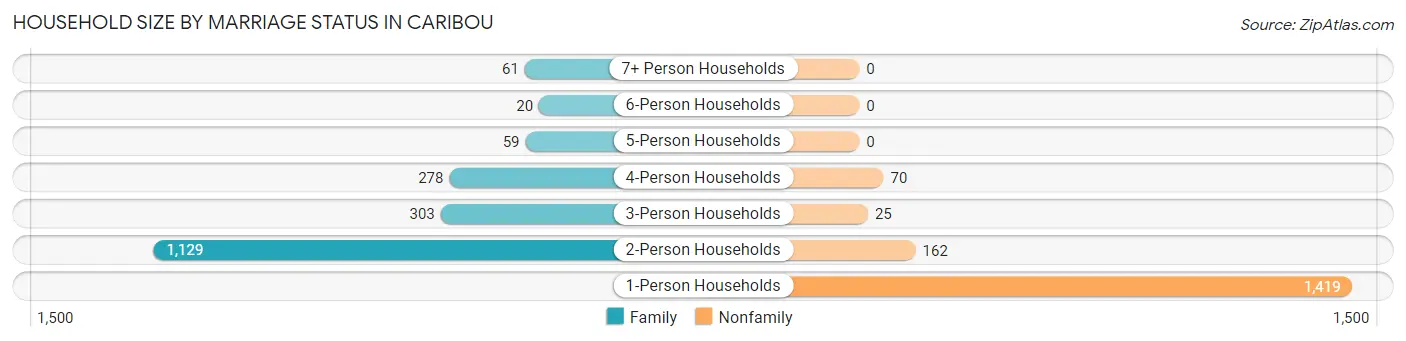
| Household Size | Family Households | Nonfamily Households |
| 1-Person Households | - | 1,419 (40.2%) |
| 2-Person Households | 1,129 (32.0%) | 162 (4.6%) |
| 3-Person Households | 303 (8.6%) | 25 (0.7%) |
| 4-Person Households | 278 (7.9%) | 70 (2.0%) |
| 5-Person Households | 59 (1.7%) | 0 (0.0%) |
| 6-Person Households | 20 (0.6%) | 0 (0.0%) |
| 7+ Person Households | 61 (1.7%) | 0 (0.0%) |
| Total | 1,850 (52.5%) | 1,676 (47.5%) |
Female Fertility in Caribou
Fertility by Age in Caribou
Average fertility rate in Caribou is 82.0 births per 1,000 women. Women in the age bracket of 20 to 34 years have the highest fertility rate with 138.0 births per 1,000 women. Women in the age bracket of 20 to 34 years acount for 73.3% of all women with births.
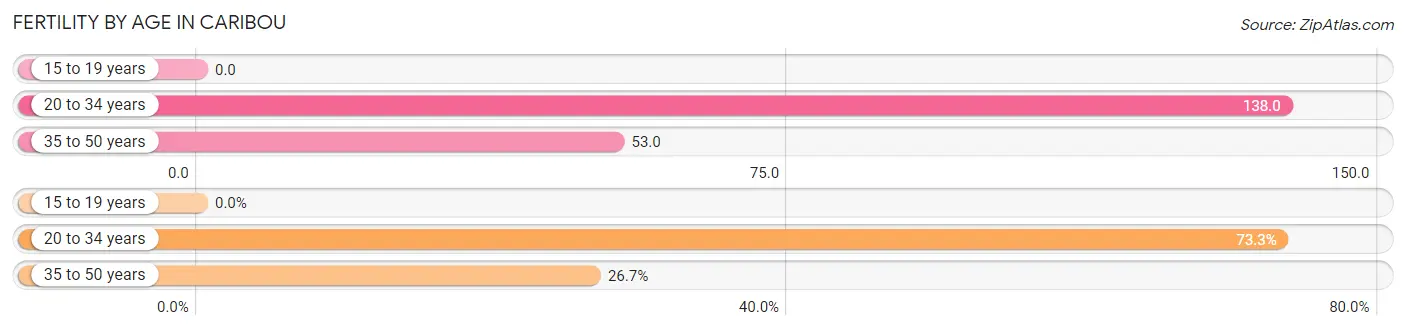
| Age Bracket | Women with Births | Births / 1,000 Women |
| 15 to 19 years | 0 (0.0%) | 0.0 |
| 20 to 34 years | 77 (73.3%) | 138.0 |
| 35 to 50 years | 28 (26.7%) | 53.0 |
| Total | 105 (100.0%) | 82.0 |
Fertility by Age by Marriage Status in Caribou
59.0% of women with births (105) in Caribou are married. The highest percentage of unmarried women with births falls into 20 to 34 years age bracket with 55.8% of them unmarried at the time of birth, while the lowest percentage of unmarried women with births belong to 35 to 50 years age bracket with 0.0% of them unmarried.
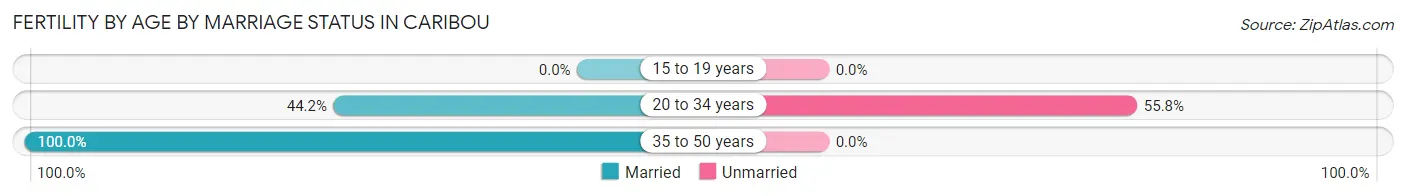
| Age Bracket | Married | Unmarried |
| 15 to 19 years | 0 (0.0%) | 0 (0.0%) |
| 20 to 34 years | 34 (44.2%) | 43 (55.8%) |
| 35 to 50 years | 28 (100.0%) | 0 (0.0%) |
| Total | 62 (59.1%) | 43 (40.9%) |
Fertility by Education in Caribou
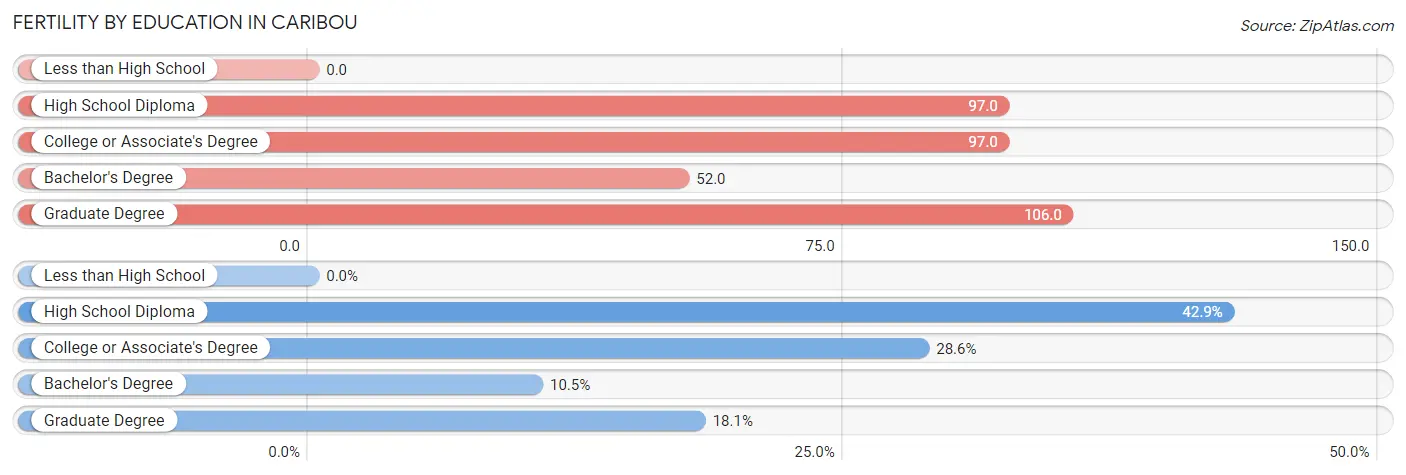
| Educational Attainment | Women with Births | Births / 1,000 Women |
| Less than High School | 0 (0.0%) | 0.0 |
| High School Diploma | 45 (42.9%) | 97.0 |
| College or Associate's Degree | 30 (28.6%) | 97.0 |
| Bachelor's Degree | 11 (10.5%) | 52.0 |
| Graduate Degree | 19 (18.1%) | 106.0 |
| Total | 105 (100.0%) | 82.0 |
Fertility by Education by Marriage Status in Caribou
40.9% of women with births in Caribou are unmarried. Women with the educational attainment of bachelor's degree are most likely to be married with 100.0% of them married at childbirth, while women with the educational attainment of college or associate's degree are least likely to be married with 100.0% of them unmarried at childbirth.
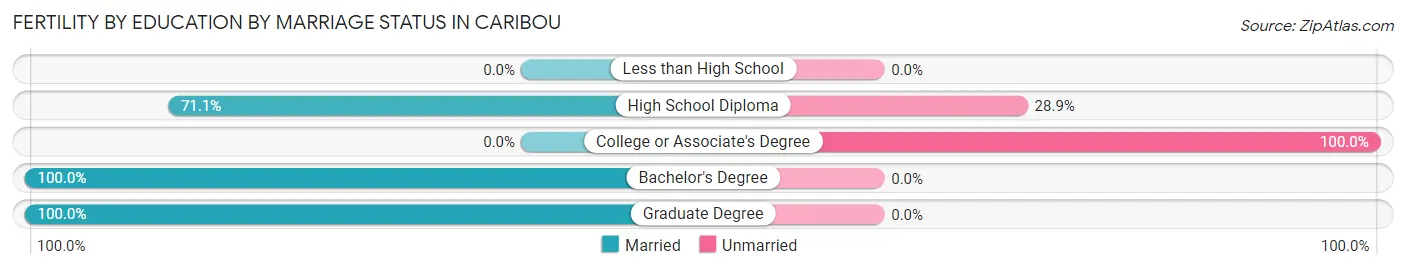
| Educational Attainment | Married | Unmarried |
| Less than High School | 0 (0.0%) | 0 (0.0%) |
| High School Diploma | 32 (71.1%) | 13 (28.9%) |
| College or Associate's Degree | 0 (0.0%) | 30 (100.0%) |
| Bachelor's Degree | 11 (100.0%) | 0 (0.0%) |
| Graduate Degree | 19 (100.0%) | 0 (0.0%) |
| Total | 62 (59.1%) | 43 (40.9%) |
Employment Characteristics in Caribou
Employment by Class of Employer in Caribou
Among the 3,409 employed individuals in Caribou, private company employees (1,822 | 53.4%), not-for-profit organizations (519 | 15.2%), and federal government employees (314 | 9.2%) make up the most common classes of employment.
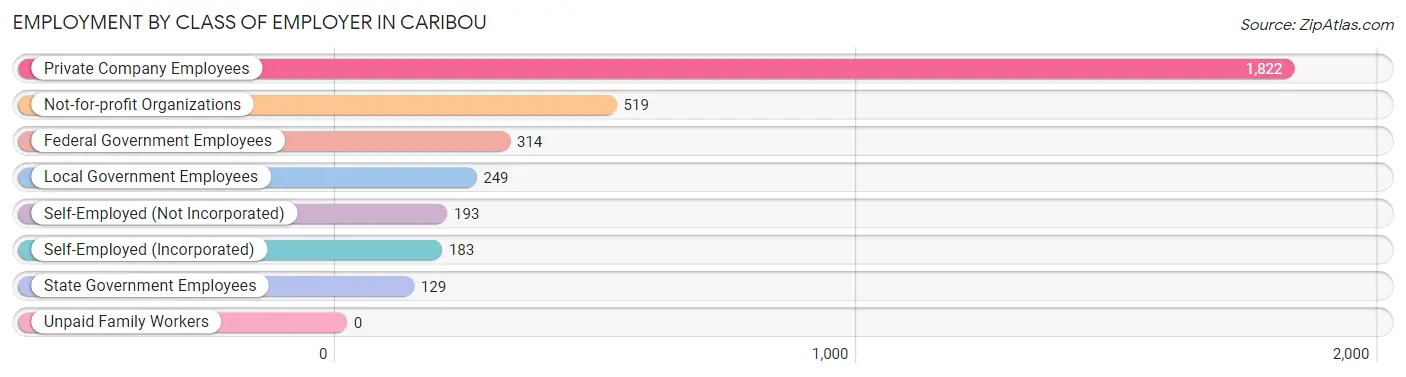
| Employer Class | # Employees | % Employees |
| Private Company Employees | 1,822 | 53.4% |
| Self-Employed (Incorporated) | 183 | 5.4% |
| Self-Employed (Not Incorporated) | 193 | 5.7% |
| Not-for-profit Organizations | 519 | 15.2% |
| Local Government Employees | 249 | 7.3% |
| State Government Employees | 129 | 3.8% |
| Federal Government Employees | 314 | 9.2% |
| Unpaid Family Workers | 0 | 0.0% |
| Total | 3,409 | 100.0% |
Employment Status by Age in Caribou
According to the labor force statistics for Caribou, out of the total population over 16 years of age (6,493), 54.0% or 3,506 individuals are in the labor force, with 2.0% or 70 of them unemployed. The age group with the highest labor force participation rate is 35 to 44 years, with 88.7% or 665 individuals in the labor force. Within the labor force, the 35 to 44 years age range has the highest percentage of unemployed individuals, with 6.6% or 44 of them being unemployed.
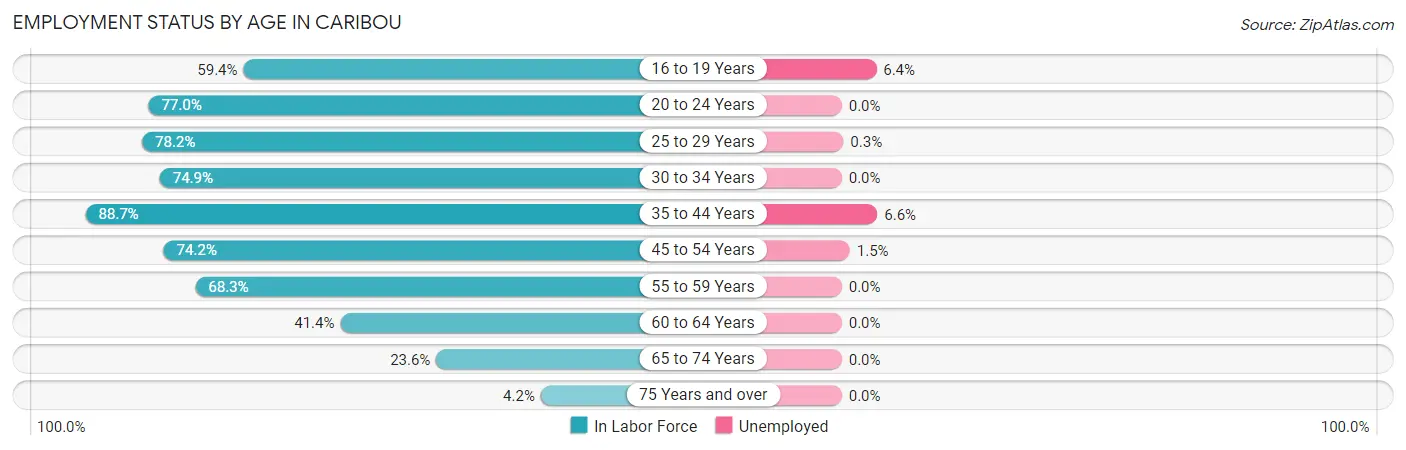
| Age Bracket | In Labor Force | Unemployed |
| 16 to 19 Years | 218 (59.4%) | 14 (6.4%) |
| 20 to 24 Years | 359 (77.0%) | 0 (0.0%) |
| 25 to 29 Years | 298 (78.2%) | 1 (0.3%) |
| 30 to 34 Years | 233 (74.9%) | 0 (0.0%) |
| 35 to 44 Years | 665 (88.7%) | 44 (6.6%) |
| 45 to 54 Years | 657 (74.2%) | 10 (1.5%) |
| 55 to 59 Years | 610 (68.3%) | 0 (0.0%) |
| 60 to 64 Years | 191 (41.4%) | 0 (0.0%) |
| 65 to 74 Years | 230 (23.6%) | 0 (0.0%) |
| 75 Years and over | 42 (4.2%) | 0 (0.0%) |
| Total | 3,506 (54.0%) | 70 (2.0%) |
Employment Status by Educational Attainment in Caribou
According to labor force statistics for Caribou, 72.1% of individuals (2,654) out of the total population between 25 and 64 years of age (3,681) are in the labor force, with 2.1% or 56 of them being unemployed. The group with the highest labor force participation rate are those with the educational attainment of bachelor's degree or higher, with 88.0% or 964 individuals in the labor force. Within the labor force, individuals with college / associate degree education have the highest percentage of unemployment, with 4.6% or 43 of them being unemployed.
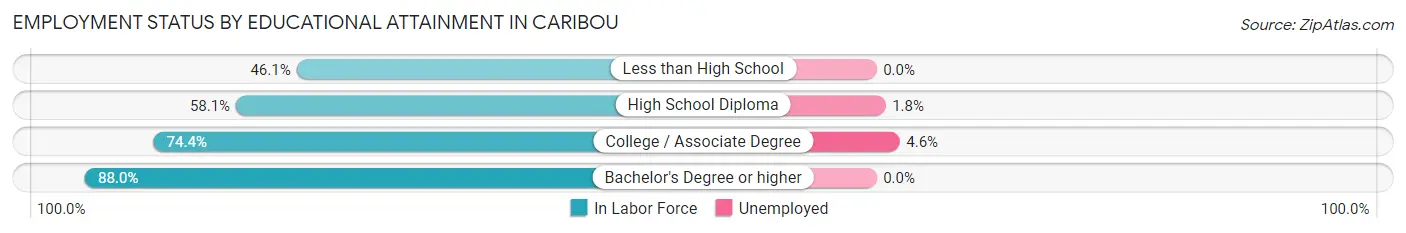
| Educational Attainment | In Labor Force | Unemployed |
| Less than High School | 71 (46.1%) | 0 (0.0%) |
| High School Diploma | 680 (58.1%) | 21 (1.8%) |
| College / Associate Degree | 937 (74.4%) | 58 (4.6%) |
| Bachelor's Degree or higher | 964 (88.0%) | 0 (0.0%) |
| Total | 2,654 (72.1%) | 77 (2.1%) |
Employment Occupations by Sex in Caribou
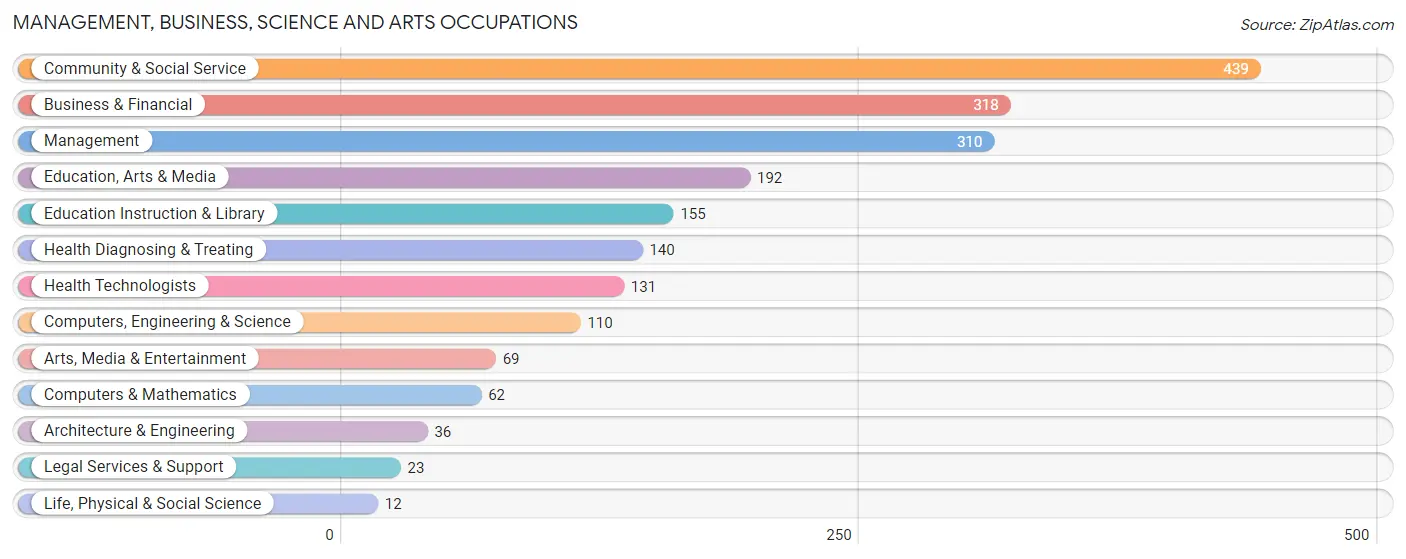
Management, Business, Science and Arts Occupations
The most common Management, Business, Science and Arts occupations in Caribou are Community & Social Service (439 | 12.8%), Business & Financial (318 | 9.3%), Management (310 | 9.0%), Education, Arts & Media (192 | 5.6%), and Education Instruction & Library (155 | 4.5%).
Management, Business, Science and Arts Occupations by Sex
Within the Management, Business, Science and Arts occupations in Caribou, the most male-oriented occupations are Architecture & Engineering (100.0%), Computers, Engineering & Science (66.4%), and Legal Services & Support (65.2%), while the most female-oriented occupations are Education, Arts & Media (76.0%), Education Instruction & Library (74.8%), and Community & Social Service (68.6%).
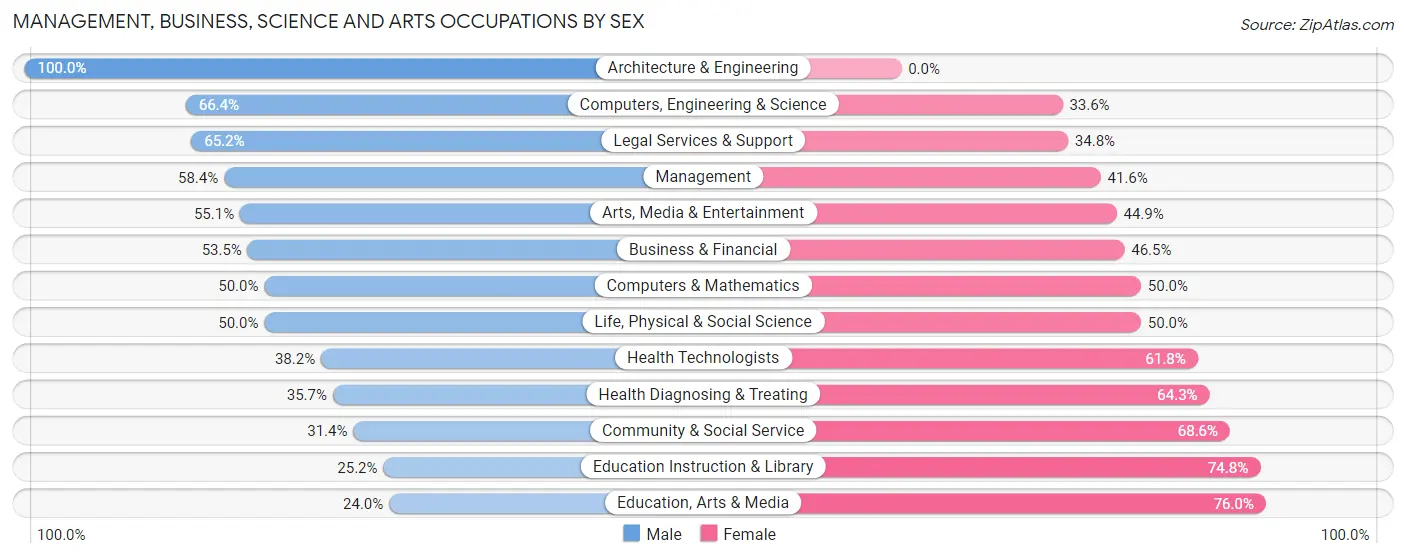
| Occupation | Male | Female |
| Management | 181 (58.4%) | 129 (41.6%) |
| Business & Financial | 170 (53.5%) | 148 (46.5%) |
| Computers, Engineering & Science | 73 (66.4%) | 37 (33.6%) |
| Computers & Mathematics | 31 (50.0%) | 31 (50.0%) |
| Architecture & Engineering | 36 (100.0%) | 0 (0.0%) |
| Life, Physical & Social Science | 6 (50.0%) | 6 (50.0%) |
| Community & Social Service | 138 (31.4%) | 301 (68.6%) |
| Education, Arts & Media | 46 (24.0%) | 146 (76.0%) |
| Legal Services & Support | 15 (65.2%) | 8 (34.8%) |
| Education Instruction & Library | 39 (25.2%) | 116 (74.8%) |
| Arts, Media & Entertainment | 38 (55.1%) | 31 (44.9%) |
| Health Diagnosing & Treating | 50 (35.7%) | 90 (64.3%) |
| Health Technologists | 50 (38.2%) | 81 (61.8%) |
| Total (Category) | 612 (46.5%) | 705 (53.5%) |
| Total (Overall) | 1,808 (52.6%) | 1,626 (47.3%) |
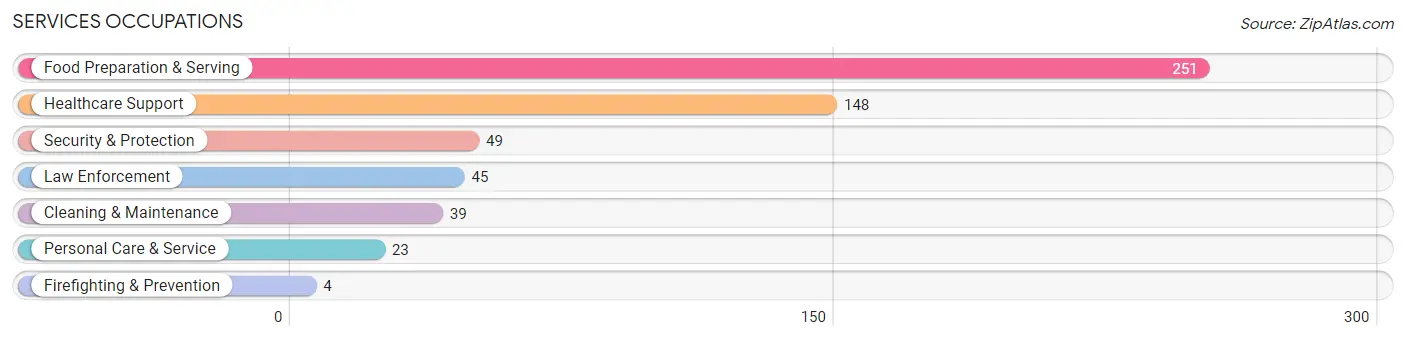
Services Occupations
The most common Services occupations in Caribou are Food Preparation & Serving (251 | 7.3%), Healthcare Support (148 | 4.3%), Security & Protection (49 | 1.4%), Law Enforcement (45 | 1.3%), and Cleaning & Maintenance (39 | 1.1%).
Services Occupations by Sex
Within the Services occupations in Caribou, the most male-oriented occupations are Law Enforcement (100.0%), Security & Protection (91.8%), and Personal Care & Service (69.6%), while the most female-oriented occupations are Firefighting & Prevention (100.0%), Healthcare Support (97.3%), and Cleaning & Maintenance (74.4%).
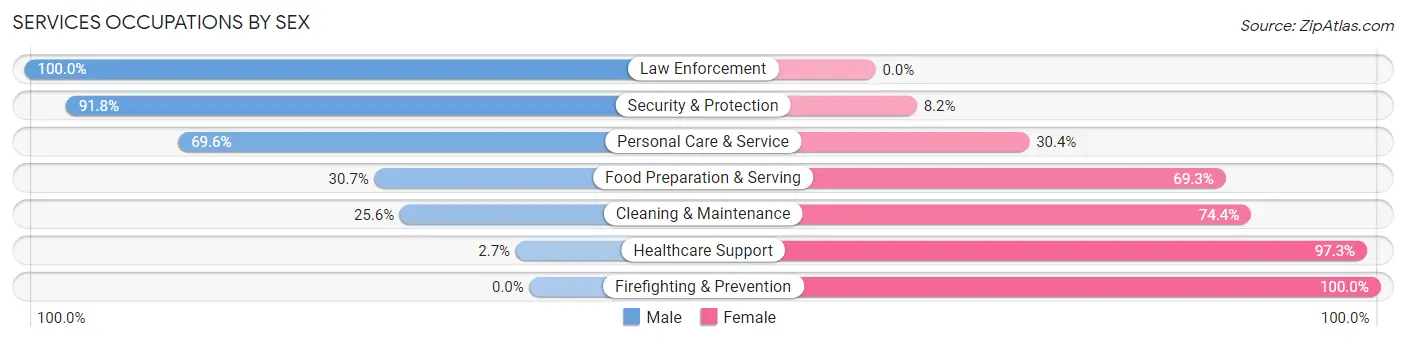
| Occupation | Male | Female |
| Healthcare Support | 4 (2.7%) | 144 (97.3%) |
| Security & Protection | 45 (91.8%) | 4 (8.2%) |
| Firefighting & Prevention | 0 (0.0%) | 4 (100.0%) |
| Law Enforcement | 45 (100.0%) | 0 (0.0%) |
| Food Preparation & Serving | 77 (30.7%) | 174 (69.3%) |
| Cleaning & Maintenance | 10 (25.6%) | 29 (74.4%) |
| Personal Care & Service | 16 (69.6%) | 7 (30.4%) |
| Total (Category) | 152 (29.8%) | 358 (70.2%) |
| Total (Overall) | 1,808 (52.6%) | 1,626 (47.3%) |
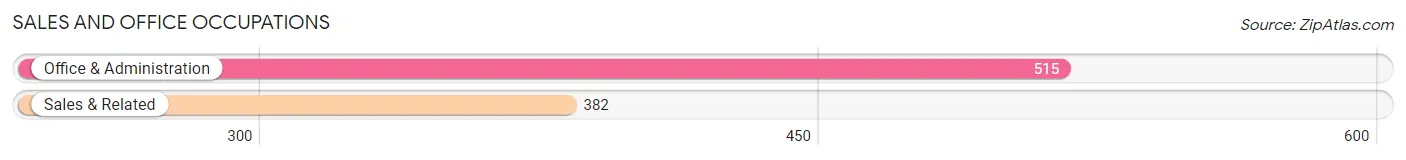
Sales and Office Occupations
The most common Sales and Office occupations in Caribou are Office & Administration (515 | 15.0%), and Sales & Related (382 | 11.1%).
Sales and Office Occupations by Sex
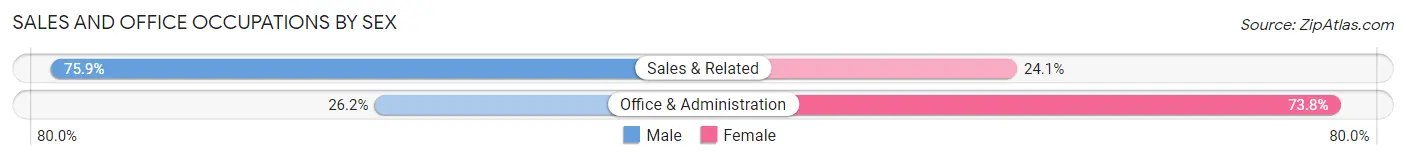
| Occupation | Male | Female |
| Sales & Related | 290 (75.9%) | 92 (24.1%) |
| Office & Administration | 135 (26.2%) | 380 (73.8%) |
| Total (Category) | 425 (47.4%) | 472 (52.6%) |
| Total (Overall) | 1,808 (52.6%) | 1,626 (47.3%) |
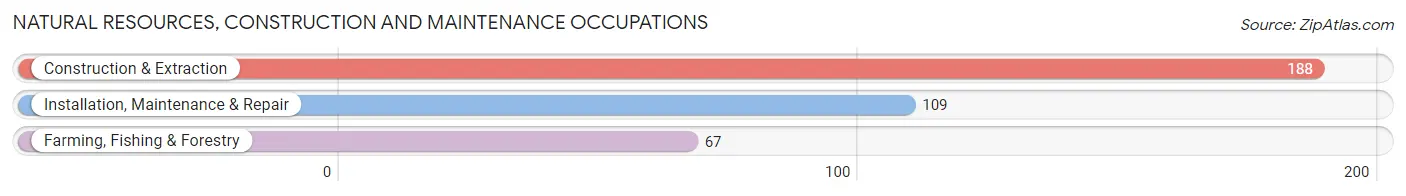
Natural Resources, Construction and Maintenance Occupations
The most common Natural Resources, Construction and Maintenance occupations in Caribou are Construction & Extraction (188 | 5.5%), Installation, Maintenance & Repair (109 | 3.2%), and Farming, Fishing & Forestry (67 | 1.9%).
Natural Resources, Construction and Maintenance Occupations by Sex
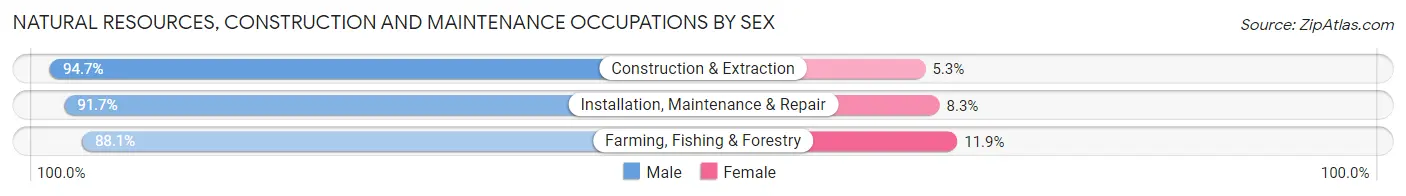
| Occupation | Male | Female |
| Farming, Fishing & Forestry | 59 (88.1%) | 8 (11.9%) |
| Construction & Extraction | 178 (94.7%) | 10 (5.3%) |
| Installation, Maintenance & Repair | 100 (91.7%) | 9 (8.3%) |
| Total (Category) | 337 (92.6%) | 27 (7.4%) |
| Total (Overall) | 1,808 (52.6%) | 1,626 (47.3%) |
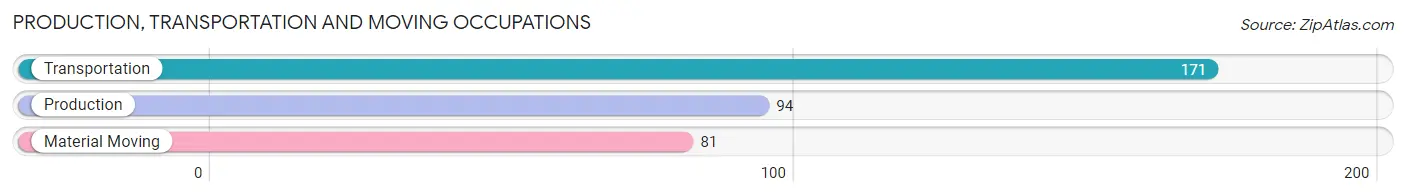
Production, Transportation and Moving Occupations
The most common Production, Transportation and Moving occupations in Caribou are Transportation (171 | 5.0%), Production (94 | 2.7%), and Material Moving (81 | 2.4%).
Production, Transportation and Moving Occupations by Sex
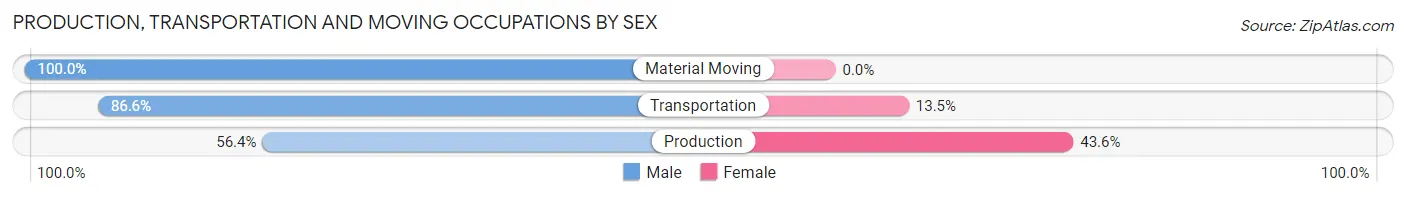
| Occupation | Male | Female |
| Production | 53 (56.4%) | 41 (43.6%) |
| Transportation | 148 (86.6%) | 23 (13.5%) |
| Material Moving | 81 (100.0%) | 0 (0.0%) |
| Total (Category) | 282 (81.5%) | 64 (18.5%) |
| Total (Overall) | 1,808 (52.6%) | 1,626 (47.3%) |
Employment Industries by Sex in Caribou
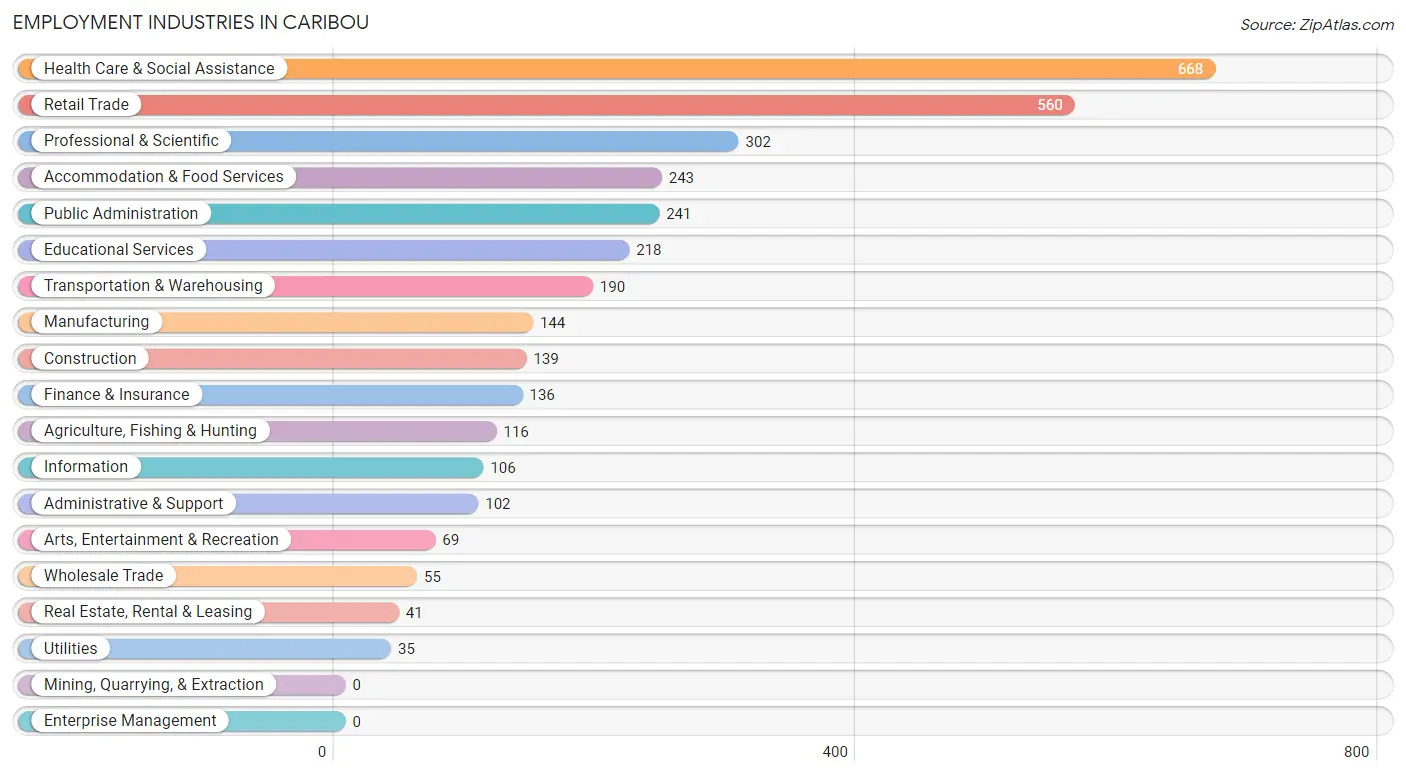
Employment Industries in Caribou
The major employment industries in Caribou include Health Care & Social Assistance (668 | 19.5%), Retail Trade (560 | 16.3%), Professional & Scientific (302 | 8.8%), Accommodation & Food Services (243 | 7.1%), and Public Administration (241 | 7.0%).
Employment Industries by Sex in Caribou
The Caribou industries that see more men than women are Construction (100.0%), Wholesale Trade (100.0%), and Utilities (100.0%), whereas the industries that tend to have a higher number of women are Arts, Entertainment & Recreation (76.8%), Accommodation & Food Services (74.5%), and Educational Services (71.6%).
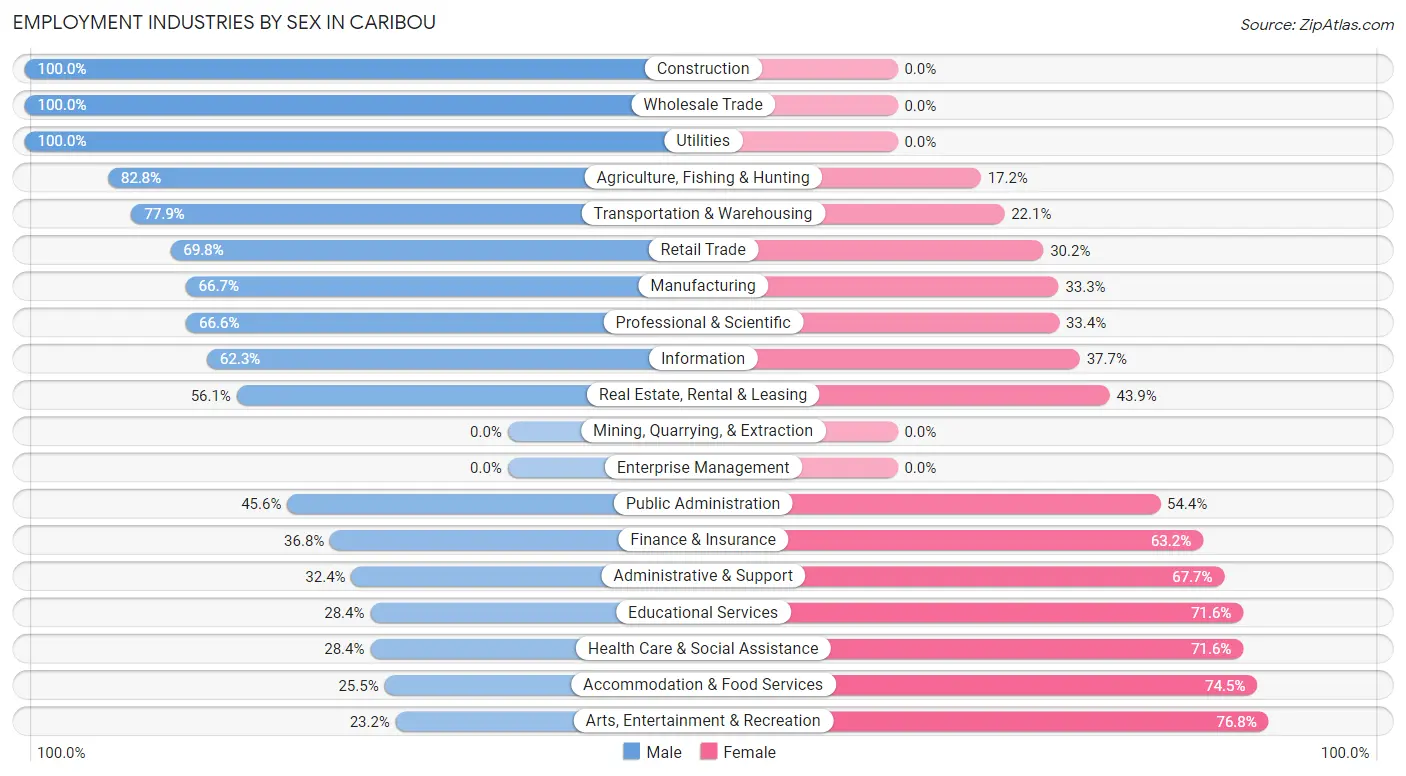
| Industry | Male | Female |
| Agriculture, Fishing & Hunting | 96 (82.8%) | 20 (17.2%) |
| Mining, Quarrying, & Extraction | 0 (0.0%) | 0 (0.0%) |
| Construction | 139 (100.0%) | 0 (0.0%) |
| Manufacturing | 96 (66.7%) | 48 (33.3%) |
| Wholesale Trade | 55 (100.0%) | 0 (0.0%) |
| Retail Trade | 391 (69.8%) | 169 (30.2%) |
| Transportation & Warehousing | 148 (77.9%) | 42 (22.1%) |
| Utilities | 35 (100.0%) | 0 (0.0%) |
| Information | 66 (62.3%) | 40 (37.7%) |
| Finance & Insurance | 50 (36.8%) | 86 (63.2%) |
| Real Estate, Rental & Leasing | 23 (56.1%) | 18 (43.9%) |
| Professional & Scientific | 201 (66.6%) | 101 (33.4%) |
| Enterprise Management | 0 (0.0%) | 0 (0.0%) |
| Administrative & Support | 33 (32.4%) | 69 (67.6%) |
| Educational Services | 62 (28.4%) | 156 (71.6%) |
| Health Care & Social Assistance | 190 (28.4%) | 478 (71.6%) |
| Arts, Entertainment & Recreation | 16 (23.2%) | 53 (76.8%) |
| Accommodation & Food Services | 62 (25.5%) | 181 (74.5%) |
| Public Administration | 110 (45.6%) | 131 (54.4%) |
| Total | 1,808 (52.6%) | 1,626 (47.3%) |
Education in Caribou
School Enrollment in Caribou
The most common levels of schooling among the 1,145 students in Caribou are high school (436 | 38.1%), elementary school (245 | 21.4%), and middle school (193 | 16.9%).
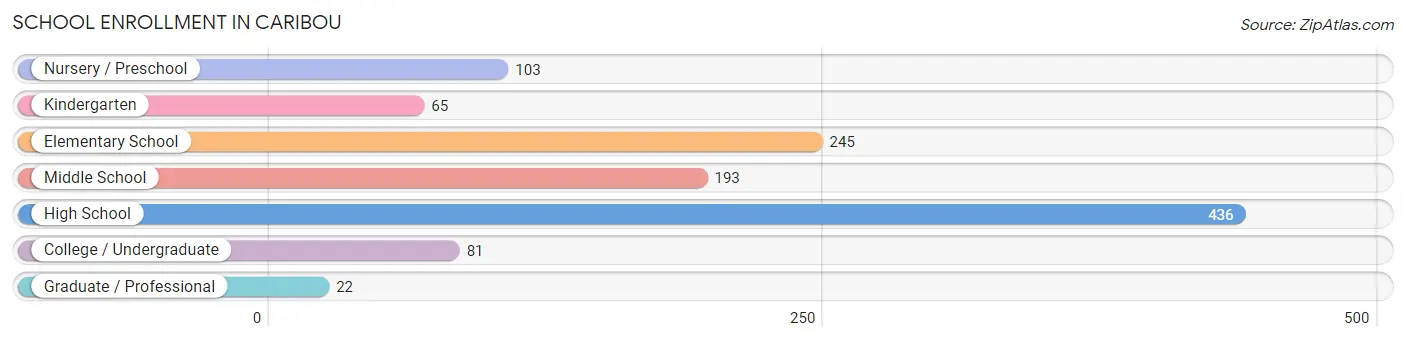
| School Level | # Students | % Students |
| Nursery / Preschool | 103 | 9.0% |
| Kindergarten | 65 | 5.7% |
| Elementary School | 245 | 21.4% |
| Middle School | 193 | 16.9% |
| High School | 436 | 38.1% |
| College / Undergraduate | 81 | 7.1% |
| Graduate / Professional | 22 | 1.9% |
| Total | 1,145 | 100.0% |
School Enrollment by Age by Funding Source in Caribou
Out of a total of 1,145 students who are enrolled in schools in Caribou, 152 (13.3%) attend a private institution, while the remaining 993 (86.7%) are enrolled in public schools. The age group of 3 to 4 year olds has the highest likelihood of being enrolled in private schools, with 73 (67.6% in the age bracket) enrolled. Conversely, the age group of 15 to 17 year olds has the lowest likelihood of being enrolled in a private school, with 245 (100.0% in the age bracket) attending a public institution.
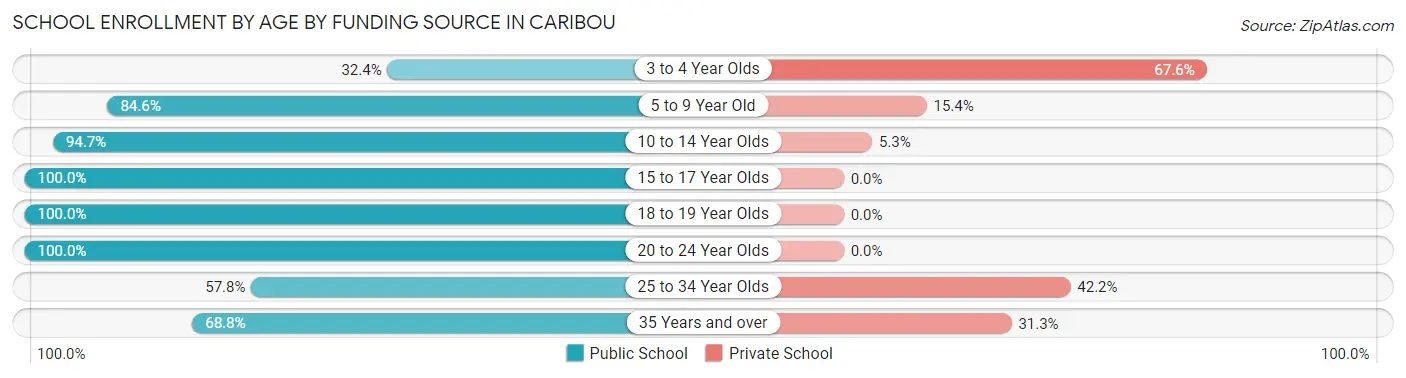
| Age Bracket | Public School | Private School |
| 3 to 4 Year Olds | 35 (32.4%) | 73 (67.6%) |
| 5 to 9 Year Old | 219 (84.6%) | 40 (15.4%) |
| 10 to 14 Year Olds | 269 (94.7%) | 15 (5.3%) |
| 15 to 17 Year Olds | 245 (100.0%) | 0 (0.0%) |
| 18 to 19 Year Olds | 154 (100.0%) | 0 (0.0%) |
| 20 to 24 Year Olds | 34 (100.0%) | 0 (0.0%) |
| 25 to 34 Year Olds | 26 (57.8%) | 19 (42.2%) |
| 35 Years and over | 11 (68.8%) | 5 (31.2%) |
| Total | 993 (86.7%) | 152 (13.3%) |
Educational Attainment by Field of Study in Caribou
Business (396 | 25.3%), arts & humanities (236 | 15.1%), education (232 | 14.8%), bio, nature & agricultural (222 | 14.2%), and science & technology (137 | 8.8%) are the most common fields of study among 1,563 individuals in Caribou who have obtained a bachelor's degree or higher.
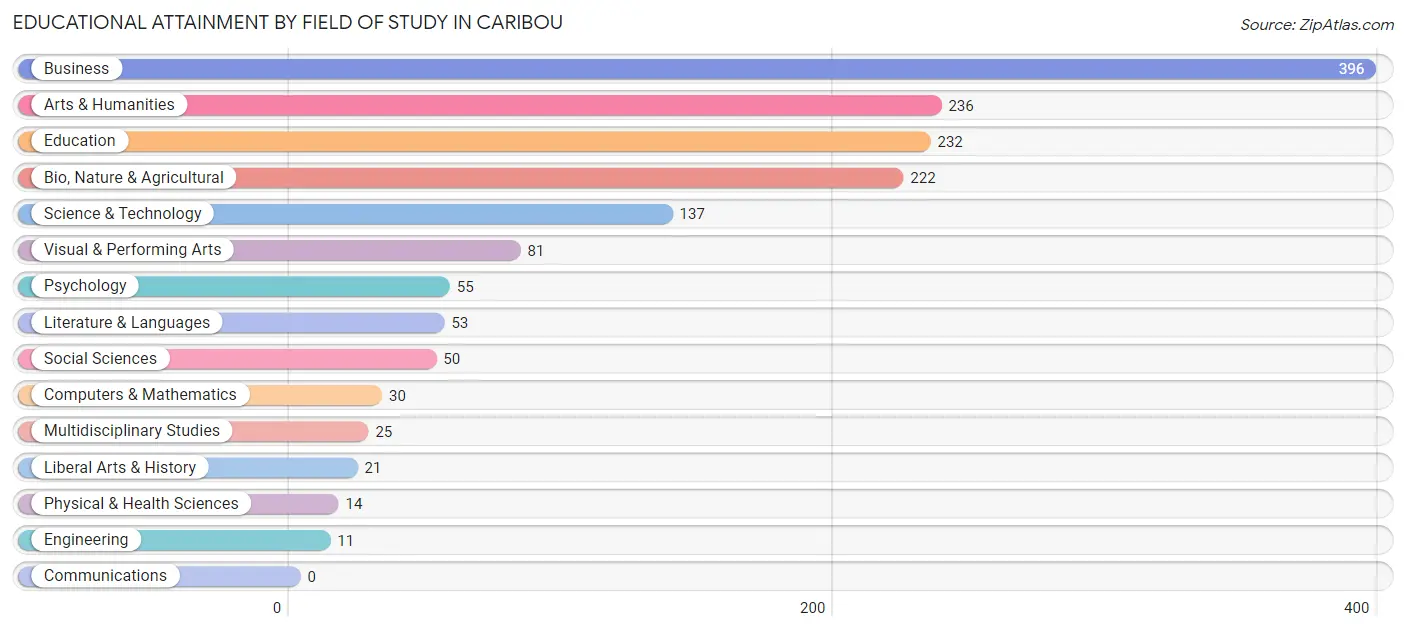
| Field of Study | # Graduates | % Graduates |
| Computers & Mathematics | 30 | 1.9% |
| Bio, Nature & Agricultural | 222 | 14.2% |
| Physical & Health Sciences | 14 | 0.9% |
| Psychology | 55 | 3.5% |
| Social Sciences | 50 | 3.2% |
| Engineering | 11 | 0.7% |
| Multidisciplinary Studies | 25 | 1.6% |
| Science & Technology | 137 | 8.8% |
| Business | 396 | 25.3% |
| Education | 232 | 14.8% |
| Literature & Languages | 53 | 3.4% |
| Liberal Arts & History | 21 | 1.3% |
| Visual & Performing Arts | 81 | 5.2% |
| Communications | 0 | 0.0% |
| Arts & Humanities | 236 | 15.1% |
| Total | 1,563 | 100.0% |
Transportation & Commute in Caribou
Vehicle Availability by Sex in Caribou
The most prevalent vehicle ownership categories in Caribou are males with 2 vehicles (934, accounting for 52.4%) and females with 2 vehicles (798, making up 57.6%).
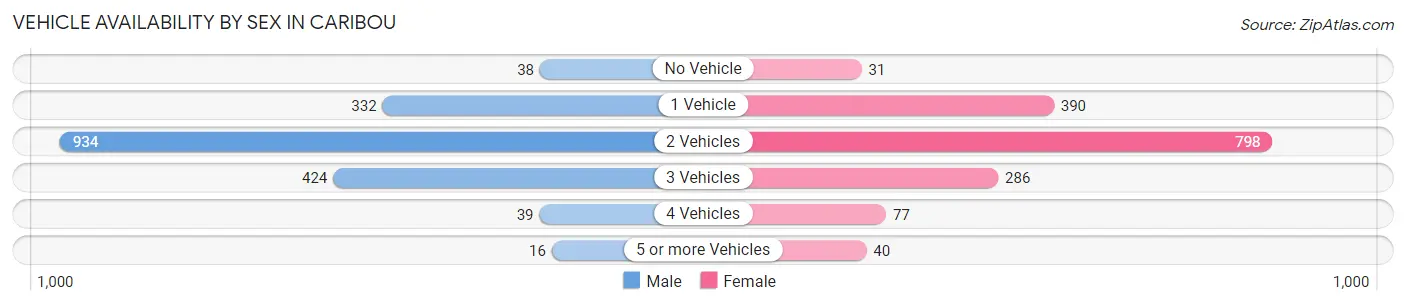
| Vehicles Available | Male | Female |
| No Vehicle | 38 (2.1%) | 31 (1.9%) |
| 1 Vehicle | 332 (18.6%) | 390 (24.0%) |
| 2 Vehicles | 934 (52.4%) | 798 (49.2%) |
| 3 Vehicles | 424 (23.8%) | 286 (17.6%) |
| 4 Vehicles | 39 (2.2%) | 77 (4.8%) |
| 5 or more Vehicles | 16 (0.9%) | 40 (2.5%) |
| Total | 1,783 (100.0%) | 1,622 (100.0%) |
Commute Time in Caribou
The most frequently occuring commute durations in Caribou are 5 to 9 minutes (759 commuters, 23.7%), 10 to 14 minutes (741 commuters, 23.2%), and 20 to 24 minutes (474 commuters, 14.8%).
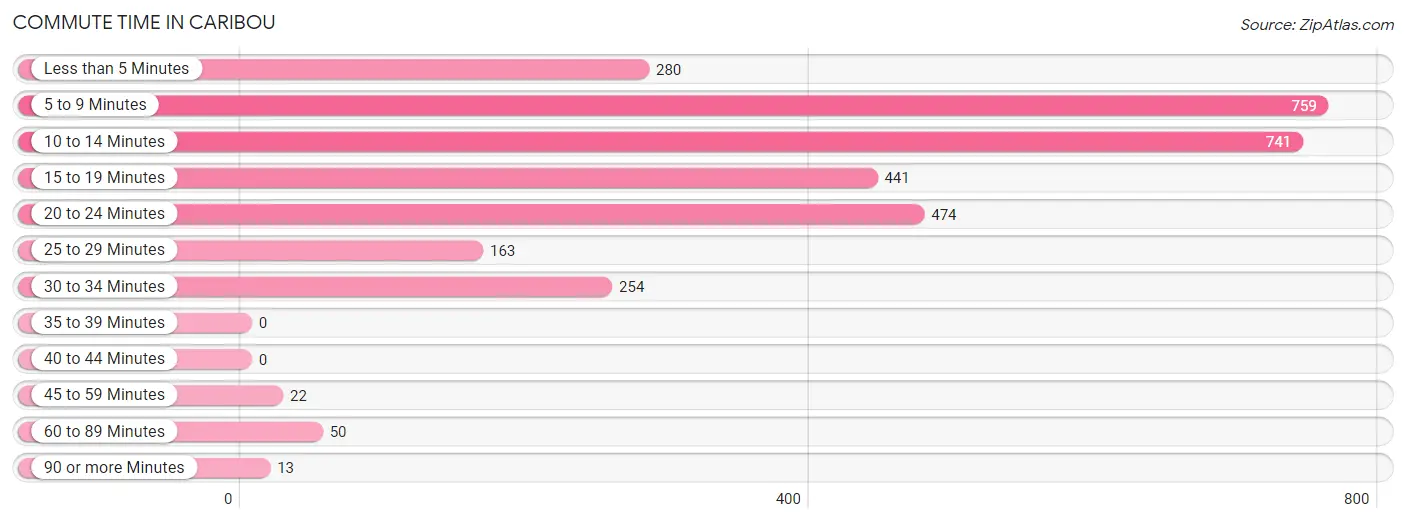
| Commute Time | # Commuters | % Commuters |
| Less than 5 Minutes | 280 | 8.8% |
| 5 to 9 Minutes | 759 | 23.7% |
| 10 to 14 Minutes | 741 | 23.2% |
| 15 to 19 Minutes | 441 | 13.8% |
| 20 to 24 Minutes | 474 | 14.8% |
| 25 to 29 Minutes | 163 | 5.1% |
| 30 to 34 Minutes | 254 | 7.9% |
| 35 to 39 Minutes | 0 | 0.0% |
| 40 to 44 Minutes | 0 | 0.0% |
| 45 to 59 Minutes | 22 | 0.7% |
| 60 to 89 Minutes | 50 | 1.6% |
| 90 or more Minutes | 13 | 0.4% |
Commute Time by Sex in Caribou
The most common commute times in Caribou are 10 to 14 minutes (428 commuters, 25.0%) for males and 5 to 9 minutes (375 commuters, 25.3%) for females.
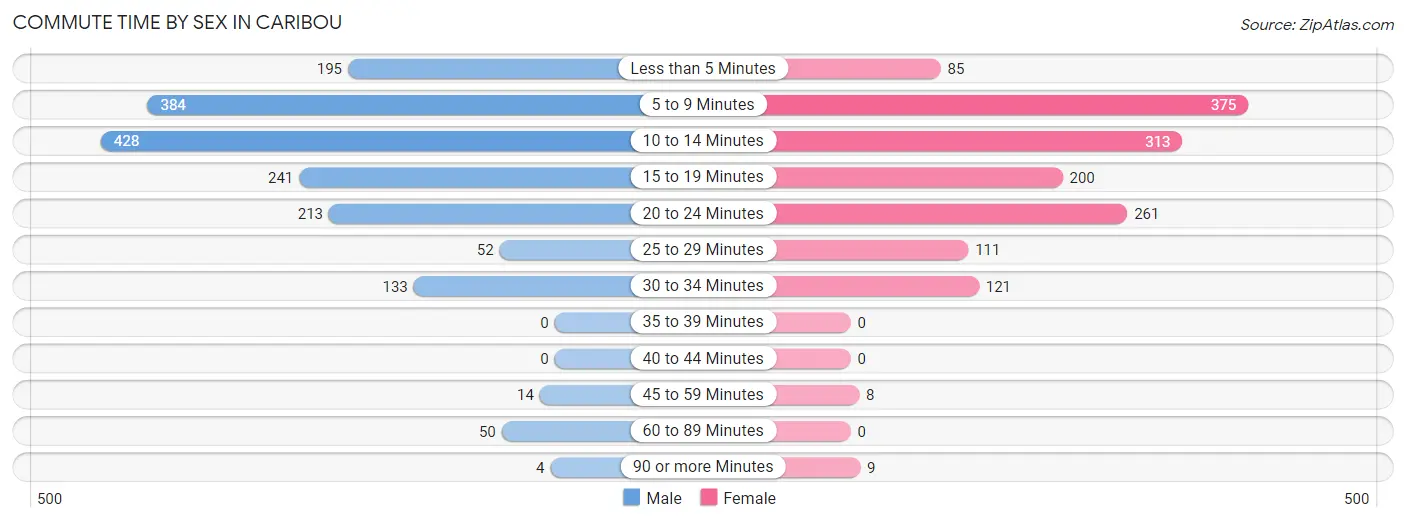
| Commute Time | Male | Female |
| Less than 5 Minutes | 195 (11.4%) | 85 (5.7%) |
| 5 to 9 Minutes | 384 (22.4%) | 375 (25.3%) |
| 10 to 14 Minutes | 428 (25.0%) | 313 (21.1%) |
| 15 to 19 Minutes | 241 (14.1%) | 200 (13.5%) |
| 20 to 24 Minutes | 213 (12.4%) | 261 (17.6%) |
| 25 to 29 Minutes | 52 (3.0%) | 111 (7.5%) |
| 30 to 34 Minutes | 133 (7.8%) | 121 (8.2%) |
| 35 to 39 Minutes | 0 (0.0%) | 0 (0.0%) |
| 40 to 44 Minutes | 0 (0.0%) | 0 (0.0%) |
| 45 to 59 Minutes | 14 (0.8%) | 8 (0.5%) |
| 60 to 89 Minutes | 50 (2.9%) | 0 (0.0%) |
| 90 or more Minutes | 4 (0.2%) | 9 (0.6%) |
Time of Departure to Work by Sex in Caribou
The most frequent times of departure to work in Caribou are 7:00 AM to 7:29 AM (243, 14.2%) for males and 7:30 AM to 7:59 AM (357, 24.1%) for females.
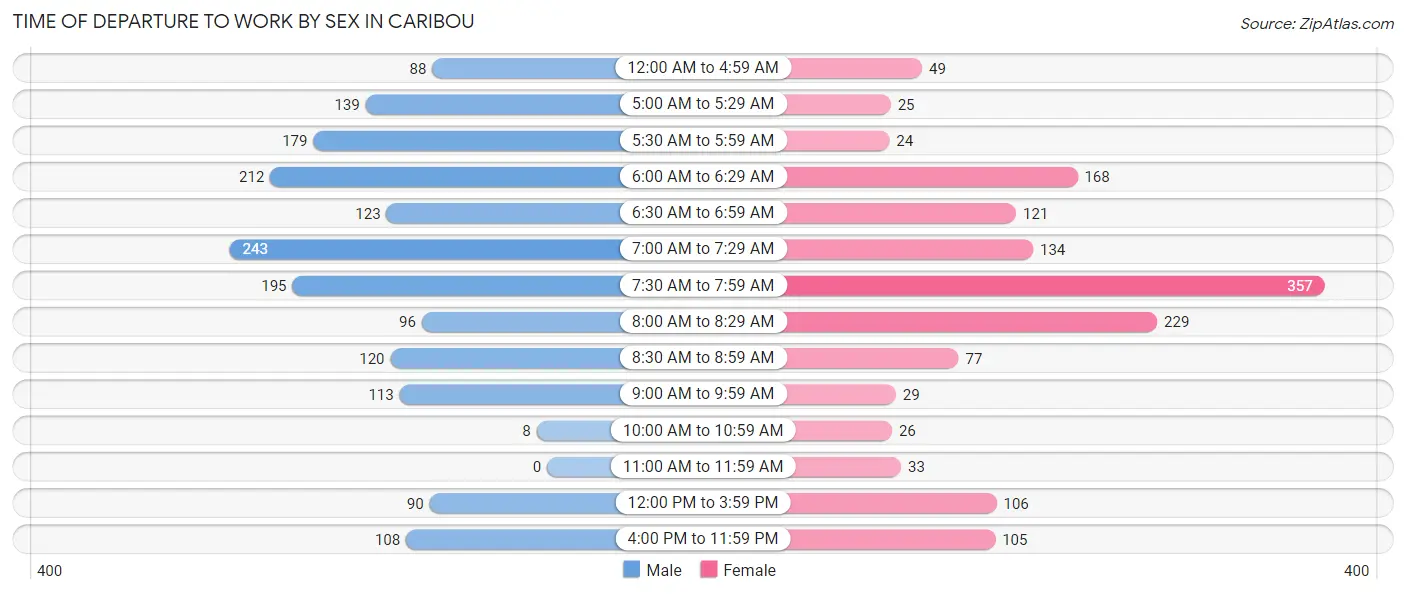
| Time of Departure | Male | Female |
| 12:00 AM to 4:59 AM | 88 (5.1%) | 49 (3.3%) |
| 5:00 AM to 5:29 AM | 139 (8.1%) | 25 (1.7%) |
| 5:30 AM to 5:59 AM | 179 (10.4%) | 24 (1.6%) |
| 6:00 AM to 6:29 AM | 212 (12.4%) | 168 (11.3%) |
| 6:30 AM to 6:59 AM | 123 (7.2%) | 121 (8.2%) |
| 7:00 AM to 7:29 AM | 243 (14.2%) | 134 (9.0%) |
| 7:30 AM to 7:59 AM | 195 (11.4%) | 357 (24.1%) |
| 8:00 AM to 8:29 AM | 96 (5.6%) | 229 (15.4%) |
| 8:30 AM to 8:59 AM | 120 (7.0%) | 77 (5.2%) |
| 9:00 AM to 9:59 AM | 113 (6.6%) | 29 (2.0%) |
| 10:00 AM to 10:59 AM | 8 (0.5%) | 26 (1.8%) |
| 11:00 AM to 11:59 AM | 0 (0.0%) | 33 (2.2%) |
| 12:00 PM to 3:59 PM | 90 (5.2%) | 106 (7.1%) |
| 4:00 PM to 11:59 PM | 108 (6.3%) | 105 (7.1%) |
| Total | 1,714 (100.0%) | 1,483 (100.0%) |
Housing Occupancy in Caribou
Occupancy by Ownership in Caribou
Of the total 3,526 dwellings in Caribou, owner-occupied units account for 2,498 (70.9%), while renter-occupied units make up 1,028 (29.1%).
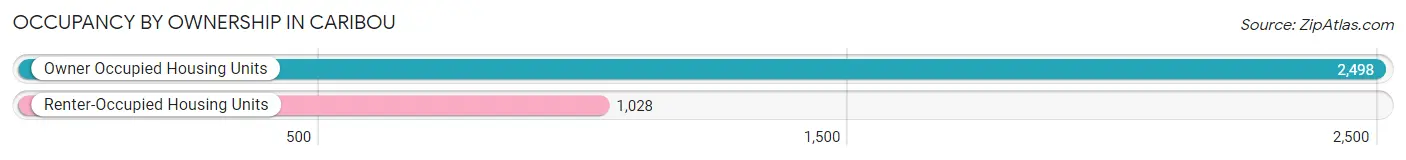
| Occupancy | # Housing Units | % Housing Units |
| Owner Occupied Housing Units | 2,498 | 70.9% |
| Renter-Occupied Housing Units | 1,028 | 29.1% |
| Total Occupied Housing Units | 3,526 | 100.0% |
Occupancy by Household Size in Caribou
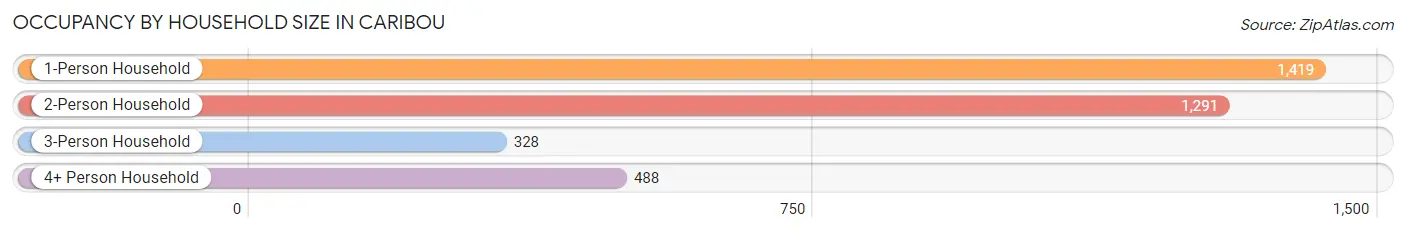
| Household Size | # Housing Units | % Housing Units |
| 1-Person Household | 1,419 | 40.2% |
| 2-Person Household | 1,291 | 36.6% |
| 3-Person Household | 328 | 9.3% |
| 4+ Person Household | 488 | 13.8% |
| Total Housing Units | 3,526 | 100.0% |
Occupancy by Ownership by Household Size in Caribou
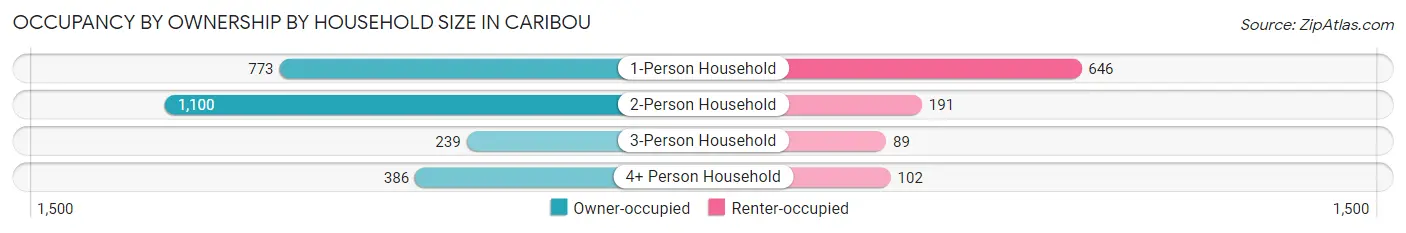
| Household Size | Owner-occupied | Renter-occupied |
| 1-Person Household | 773 (54.5%) | 646 (45.5%) |
| 2-Person Household | 1,100 (85.2%) | 191 (14.8%) |
| 3-Person Household | 239 (72.9%) | 89 (27.1%) |
| 4+ Person Household | 386 (79.1%) | 102 (20.9%) |
| Total Housing Units | 2,498 (70.9%) | 1,028 (29.1%) |
Occupancy by Educational Attainment in Caribou
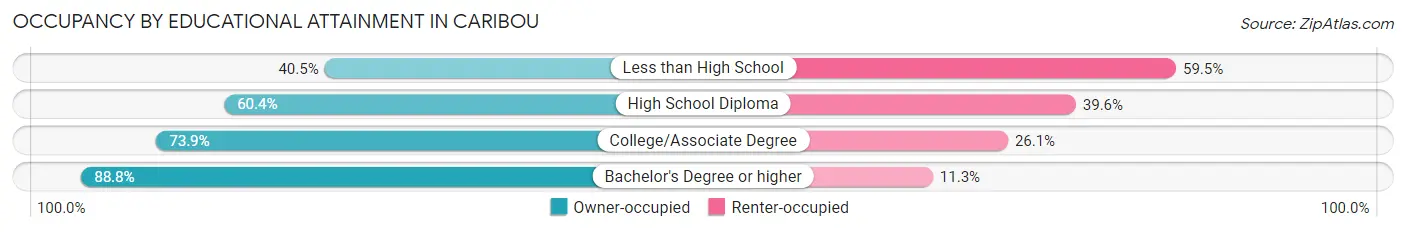
| Household Size | Owner-occupied | Renter-occupied |
| Less than High School | 105 (40.5%) | 154 (59.5%) |
| High School Diploma | 673 (60.4%) | 441 (39.6%) |
| College/Associate Degree | 947 (73.9%) | 335 (26.1%) |
| Bachelor's Degree or higher | 773 (88.7%) | 98 (11.3%) |
Occupancy by Age of Householder in Caribou
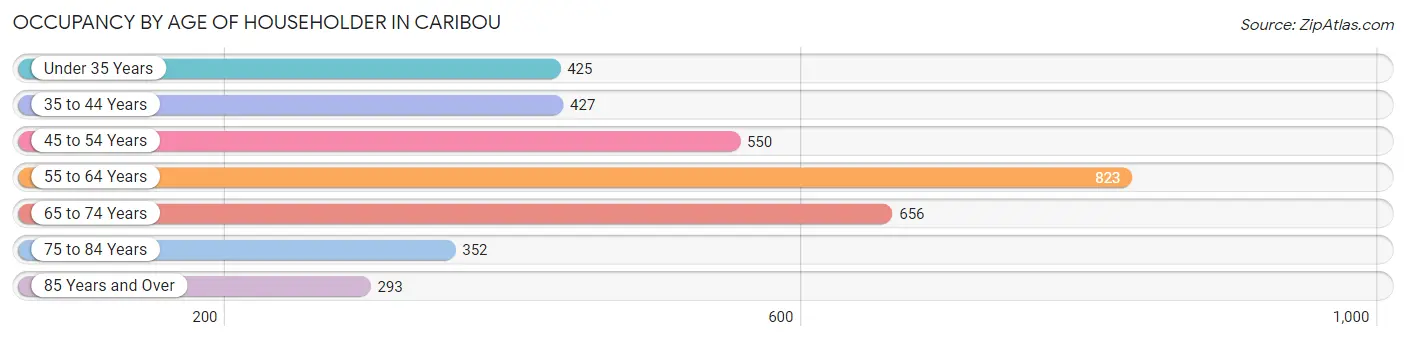
| Age Bracket | # Households | % Households |
| Under 35 Years | 425 | 12.0% |
| 35 to 44 Years | 427 | 12.1% |
| 45 to 54 Years | 550 | 15.6% |
| 55 to 64 Years | 823 | 23.3% |
| 65 to 74 Years | 656 | 18.6% |
| 75 to 84 Years | 352 | 10.0% |
| 85 Years and Over | 293 | 8.3% |
| Total | 3,526 | 100.0% |
Housing Finances in Caribou
Median Income by Occupancy in Caribou
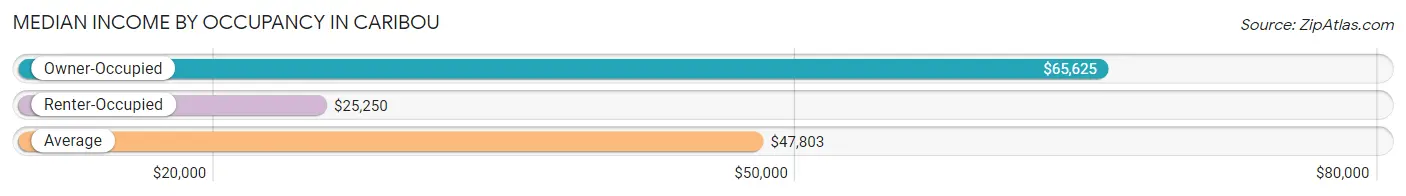
| Occupancy Type | # Households | Median Income |
| Owner-Occupied | 2,498 (70.9%) | $65,625 |
| Renter-Occupied | 1,028 (29.1%) | $25,250 |
| Average | 3,526 (100.0%) | $47,803 |
Occupancy by Householder Income Bracket in Caribou
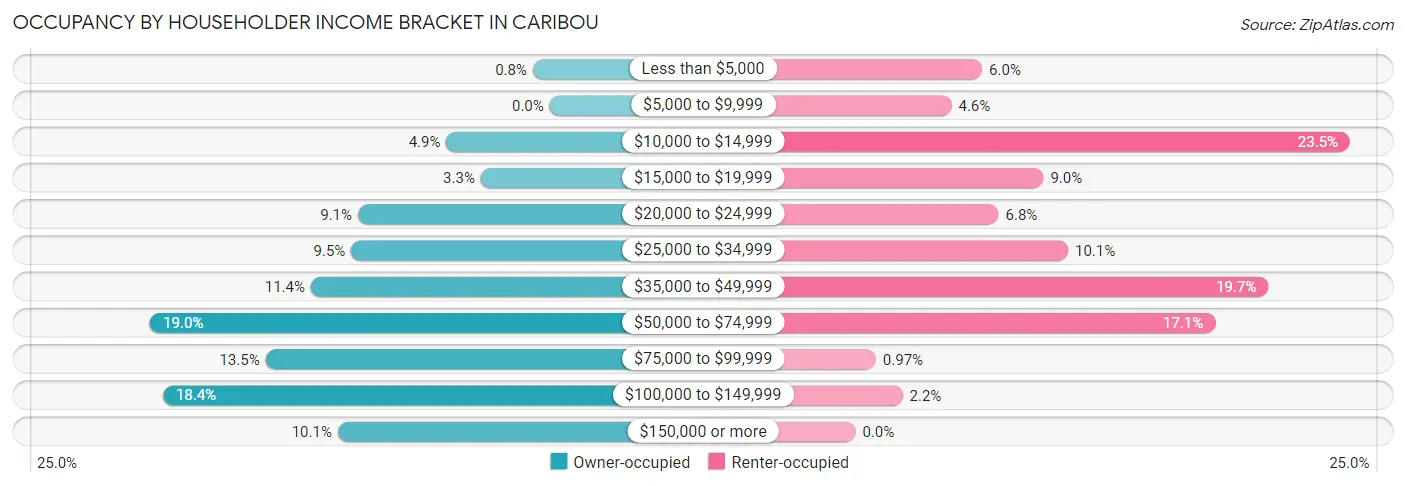
| Income Bracket | Owner-occupied | Renter-occupied |
| Less than $5,000 | 20 (0.8%) | 62 (6.0%) |
| $5,000 to $9,999 | 0 (0.0%) | 47 (4.6%) |
| $10,000 to $14,999 | 123 (4.9%) | 242 (23.5%) |
| $15,000 to $19,999 | 82 (3.3%) | 92 (8.9%) |
| $20,000 to $24,999 | 228 (9.1%) | 70 (6.8%) |
| $25,000 to $34,999 | 236 (9.5%) | 104 (10.1%) |
| $35,000 to $49,999 | 284 (11.4%) | 202 (19.7%) |
| $50,000 to $74,999 | 475 (19.0%) | 176 (17.1%) |
| $75,000 to $99,999 | 338 (13.5%) | 10 (1.0%) |
| $100,000 to $149,999 | 460 (18.4%) | 23 (2.2%) |
| $150,000 or more | 252 (10.1%) | 0 (0.0%) |
| Total | 2,498 (100.0%) | 1,028 (100.0%) |
Monthly Housing Cost Tiers in Caribou
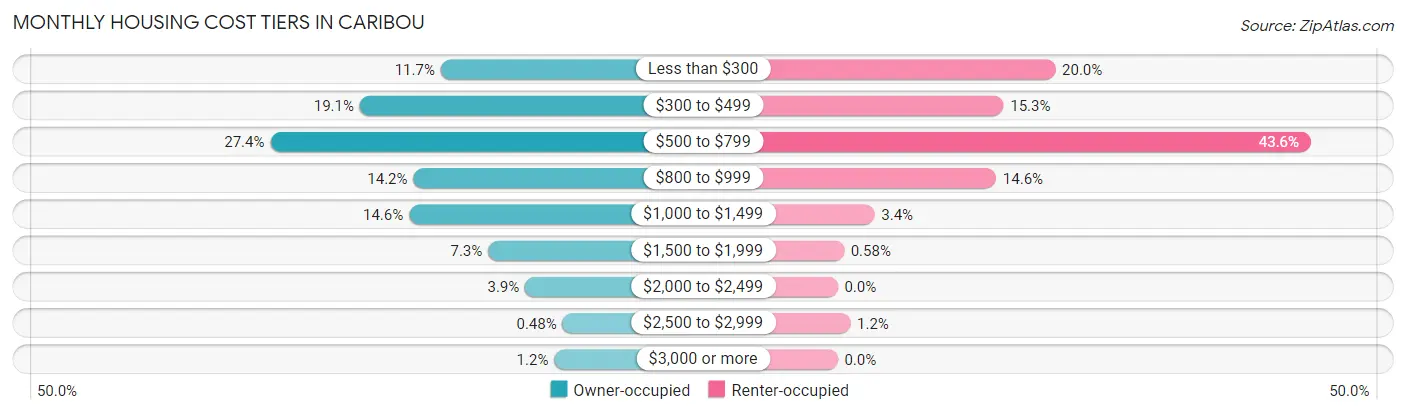
| Monthly Cost | Owner-occupied | Renter-occupied |
| Less than $300 | 292 (11.7%) | 206 (20.0%) |
| $300 to $499 | 478 (19.1%) | 157 (15.3%) |
| $500 to $799 | 684 (27.4%) | 448 (43.6%) |
| $800 to $999 | 355 (14.2%) | 150 (14.6%) |
| $1,000 to $1,499 | 365 (14.6%) | 35 (3.4%) |
| $1,500 to $1,999 | 183 (7.3%) | 6 (0.6%) |
| $2,000 to $2,499 | 98 (3.9%) | 0 (0.0%) |
| $2,500 to $2,999 | 12 (0.5%) | 12 (1.2%) |
| $3,000 or more | 31 (1.2%) | 0 (0.0%) |
| Total | 2,498 (100.0%) | 1,028 (100.0%) |
Physical Housing Characteristics in Caribou
Housing Structures in Caribou
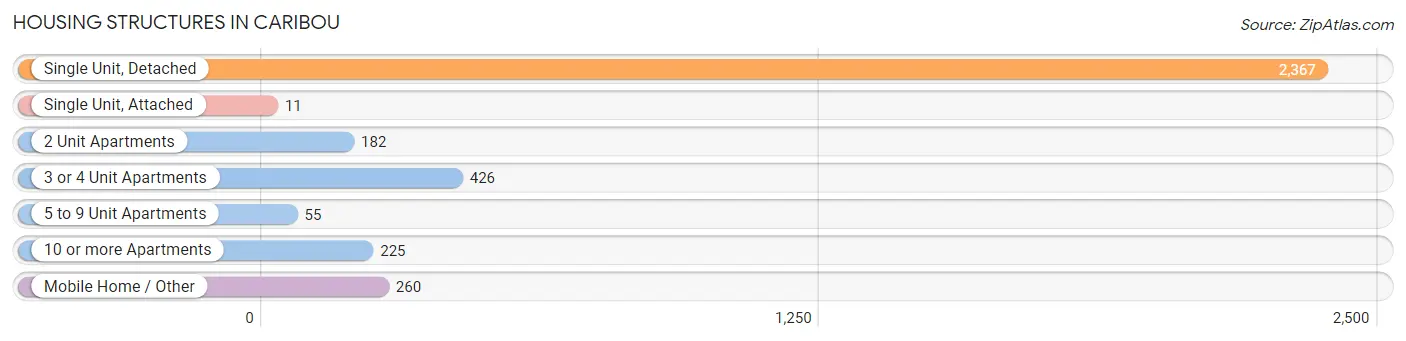
| Structure Type | # Housing Units | % Housing Units |
| Single Unit, Detached | 2,367 | 67.1% |
| Single Unit, Attached | 11 | 0.3% |
| 2 Unit Apartments | 182 | 5.2% |
| 3 or 4 Unit Apartments | 426 | 12.1% |
| 5 to 9 Unit Apartments | 55 | 1.6% |
| 10 or more Apartments | 225 | 6.4% |
| Mobile Home / Other | 260 | 7.4% |
| Total | 3,526 | 100.0% |
Housing Structures by Occupancy in Caribou
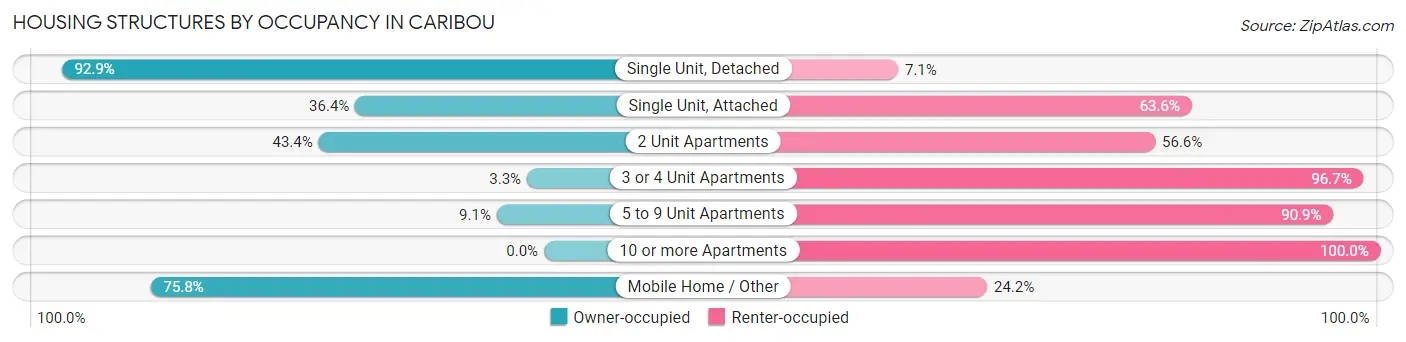
| Structure Type | Owner-occupied | Renter-occupied |
| Single Unit, Detached | 2,199 (92.9%) | 168 (7.1%) |
| Single Unit, Attached | 4 (36.4%) | 7 (63.6%) |
| 2 Unit Apartments | 79 (43.4%) | 103 (56.6%) |
| 3 or 4 Unit Apartments | 14 (3.3%) | 412 (96.7%) |
| 5 to 9 Unit Apartments | 5 (9.1%) | 50 (90.9%) |
| 10 or more Apartments | 0 (0.0%) | 225 (100.0%) |
| Mobile Home / Other | 197 (75.8%) | 63 (24.2%) |
| Total | 2,498 (70.9%) | 1,028 (29.1%) |
Housing Structures by Number of Rooms in Caribou
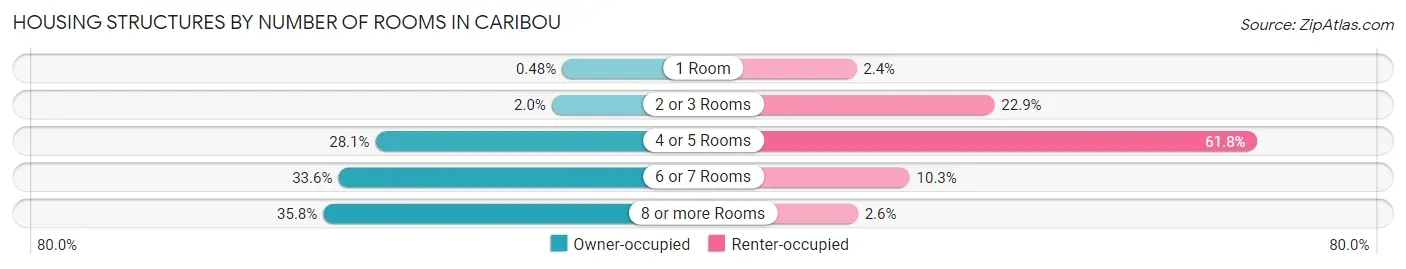
| Number of Rooms | Owner-occupied | Renter-occupied |
| 1 Room | 12 (0.5%) | 25 (2.4%) |
| 2 or 3 Rooms | 50 (2.0%) | 235 (22.9%) |
| 4 or 5 Rooms | 702 (28.1%) | 635 (61.8%) |
| 6 or 7 Rooms | 839 (33.6%) | 106 (10.3%) |
| 8 or more Rooms | 895 (35.8%) | 27 (2.6%) |
| Total | 2,498 (100.0%) | 1,028 (100.0%) |
Housing Structure by Heating Type in Caribou
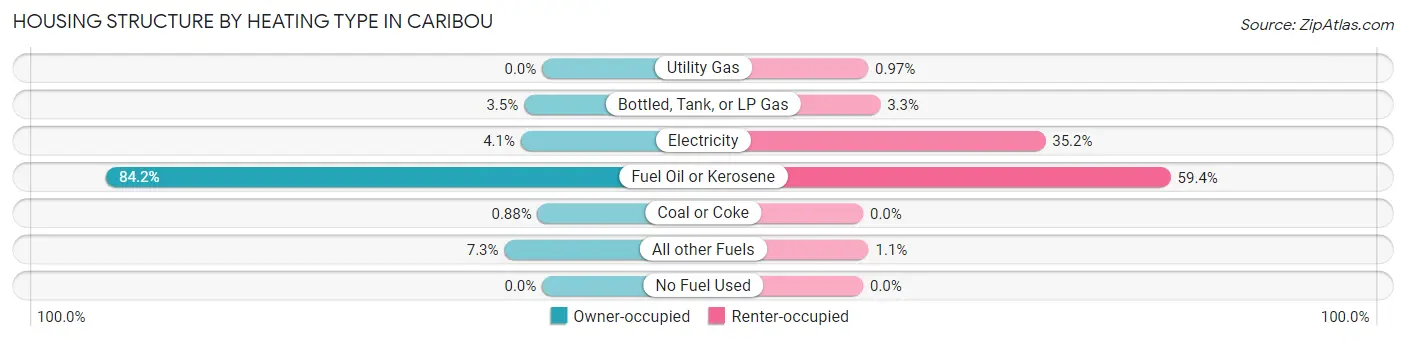
| Heating Type | Owner-occupied | Renter-occupied |
| Utility Gas | 0 (0.0%) | 10 (1.0%) |
| Bottled, Tank, or LP Gas | 87 (3.5%) | 34 (3.3%) |
| Electricity | 103 (4.1%) | 362 (35.2%) |
| Fuel Oil or Kerosene | 2,104 (84.2%) | 611 (59.4%) |
| Coal or Coke | 22 (0.9%) | 0 (0.0%) |
| All other Fuels | 182 (7.3%) | 11 (1.1%) |
| No Fuel Used | 0 (0.0%) | 0 (0.0%) |
| Total | 2,498 (100.0%) | 1,028 (100.0%) |
Household Vehicle Usage in Caribou
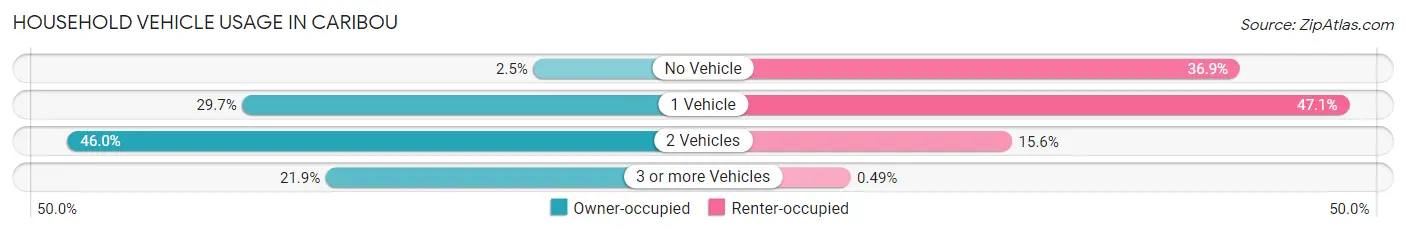
| Vehicles per Household | Owner-occupied | Renter-occupied |
| No Vehicle | 62 (2.5%) | 379 (36.9%) |
| 1 Vehicle | 741 (29.7%) | 484 (47.1%) |
| 2 Vehicles | 1,149 (46.0%) | 160 (15.6%) |
| 3 or more Vehicles | 546 (21.9%) | 5 (0.5%) |
| Total | 2,498 (100.0%) | 1,028 (100.0%) |
Real Estate & Mortgages in Caribou
Real Estate and Mortgage Overview in Caribou
| Characteristic | Without Mortgage | With Mortgage |
| Housing Units | 1,224 | 1,274 |
| Median Property Value | $99,500 | $128,800 |
| Median Household Income | $44,674 | $190 |
| Monthly Housing Costs | $452 | $3 |
| Real Estate Taxes | $1,567 | $0 |
Property Value by Mortgage Status in Caribou
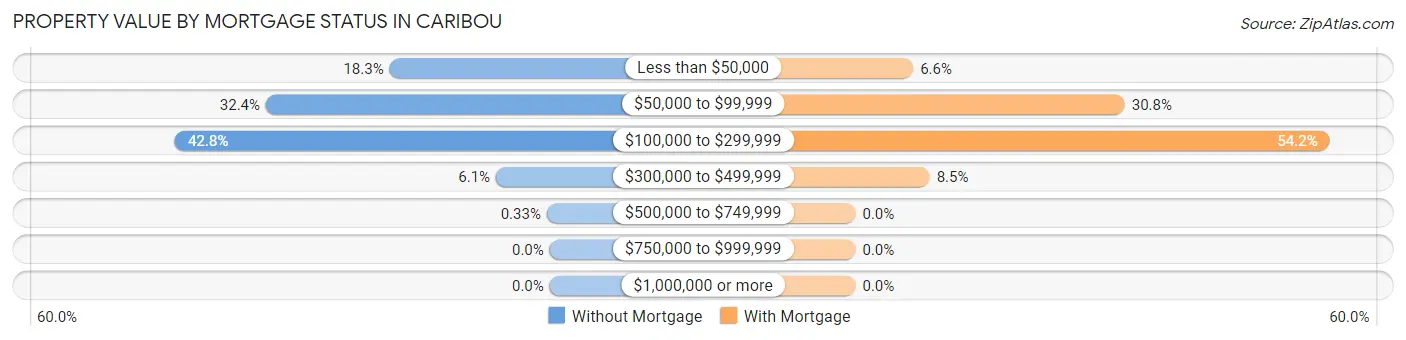
| Property Value | Without Mortgage | With Mortgage |
| Less than $50,000 | 224 (18.3%) | 84 (6.6%) |
| $50,000 to $99,999 | 397 (32.4%) | 392 (30.8%) |
| $100,000 to $299,999 | 524 (42.8%) | 690 (54.2%) |
| $300,000 to $499,999 | 75 (6.1%) | 108 (8.5%) |
| $500,000 to $749,999 | 4 (0.3%) | 0 (0.0%) |
| $750,000 to $999,999 | 0 (0.0%) | 0 (0.0%) |
| $1,000,000 or more | 0 (0.0%) | 0 (0.0%) |
| Total | 1,224 (100.0%) | 1,274 (100.0%) |
Household Income by Mortgage Status in Caribou
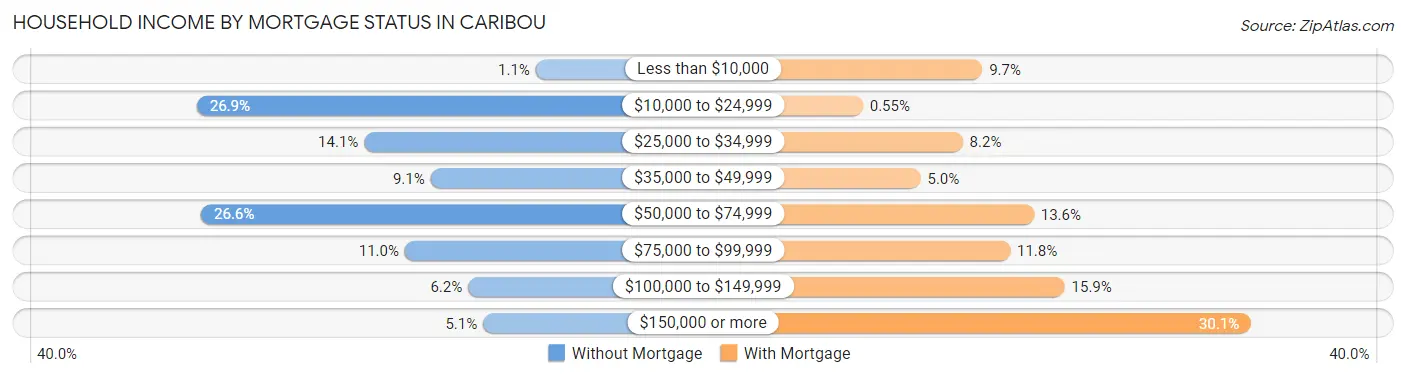
| Household Income | Without Mortgage | With Mortgage |
| Less than $10,000 | 13 (1.1%) | 123 (9.7%) |
| $10,000 to $24,999 | 329 (26.9%) | 7 (0.5%) |
| $25,000 to $34,999 | 173 (14.1%) | 104 (8.2%) |
| $35,000 to $49,999 | 111 (9.1%) | 63 (5.0%) |
| $50,000 to $74,999 | 325 (26.6%) | 173 (13.6%) |
| $75,000 to $99,999 | 135 (11.0%) | 150 (11.8%) |
| $100,000 to $149,999 | 76 (6.2%) | 203 (15.9%) |
| $150,000 or more | 62 (5.1%) | 384 (30.1%) |
| Total | 1,224 (100.0%) | 1,274 (100.0%) |
Property Value to Household Income Ratio in Caribou
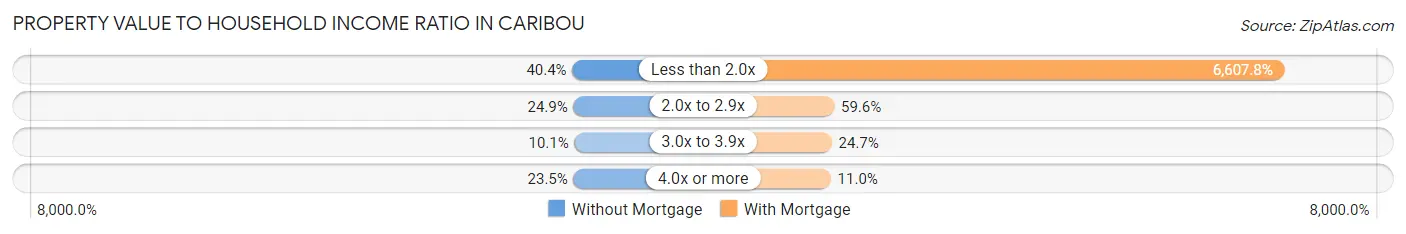
| Value-to-Income Ratio | Without Mortgage | With Mortgage |
| Less than 2.0x | 494 (40.4%) | 84,183 (6,607.8%) |
| 2.0x to 2.9x | 305 (24.9%) | 759 (59.6%) |
| 3.0x to 3.9x | 124 (10.1%) | 314 (24.6%) |
| 4.0x or more | 288 (23.5%) | 140 (11.0%) |
| Total | 1,224 (100.0%) | 1,274 (100.0%) |
Real Estate Taxes by Mortgage Status in Caribou
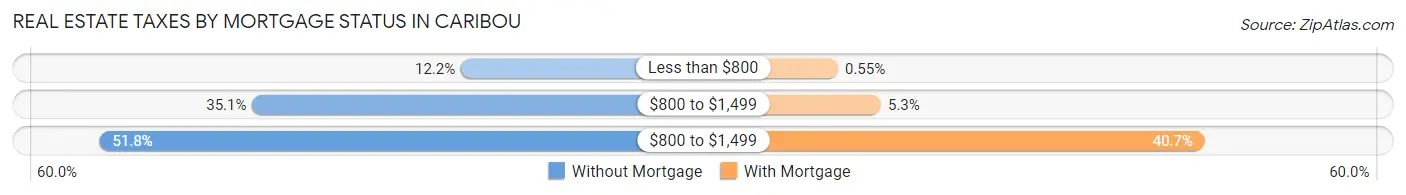
| Property Taxes | Without Mortgage | With Mortgage |
| Less than $800 | 149 (12.2%) | 7 (0.5%) |
| $800 to $1,499 | 429 (35.0%) | 67 (5.3%) |
| $800 to $1,499 | 634 (51.8%) | 519 (40.7%) |
| Total | 1,224 (100.0%) | 1,274 (100.0%) |
Health & Disability in Caribou
Health Insurance Coverage by Age in Caribou
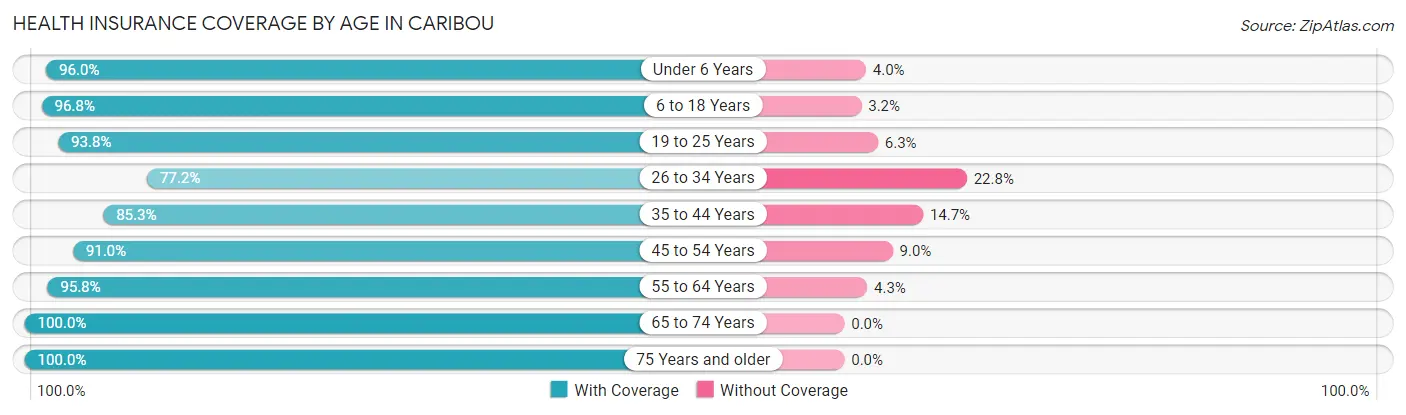
| Age Bracket | With Coverage | Without Coverage |
| Under 6 Years | 382 (96.0%) | 16 (4.0%) |
| 6 to 18 Years | 886 (96.8%) | 29 (3.2%) |
| 19 to 25 Years | 495 (93.8%) | 33 (6.2%) |
| 26 to 34 Years | 497 (77.2%) | 147 (22.8%) |
| 35 to 44 Years | 640 (85.3%) | 110 (14.7%) |
| 45 to 54 Years | 798 (91.0%) | 79 (9.0%) |
| 55 to 64 Years | 1,284 (95.8%) | 57 (4.3%) |
| 65 to 74 Years | 973 (100.0%) | 0 (0.0%) |
| 75 Years and older | 868 (100.0%) | 0 (0.0%) |
| Total | 6,823 (93.5%) | 471 (6.5%) |
Health Insurance Coverage by Citizenship Status in Caribou
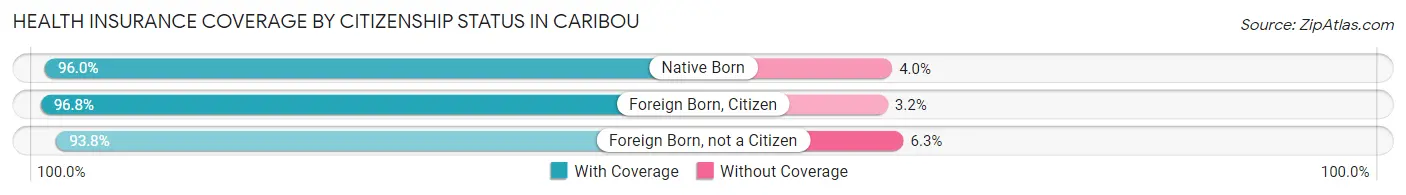
| Citizenship Status | With Coverage | Without Coverage |
| Native Born | 382 (96.0%) | 16 (4.0%) |
| Foreign Born, Citizen | 886 (96.8%) | 29 (3.2%) |
| Foreign Born, not a Citizen | 495 (93.8%) | 33 (6.2%) |
Health Insurance Coverage by Household Income in Caribou
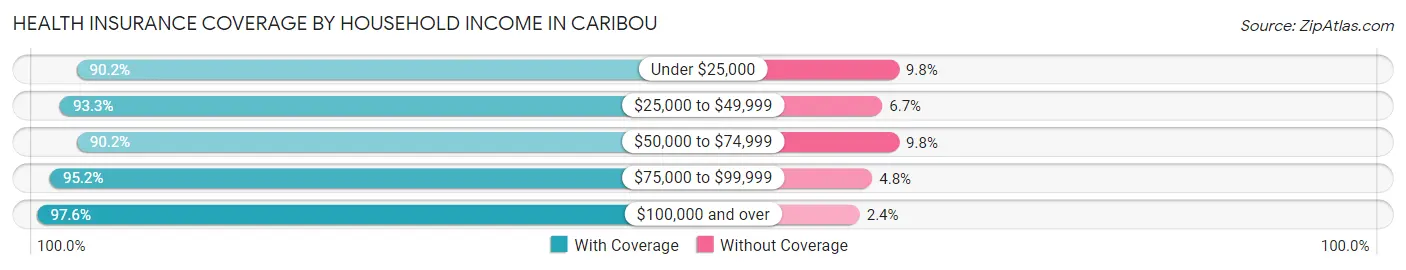
| Household Income | With Coverage | Without Coverage |
| Under $25,000 | 1,119 (90.2%) | 121 (9.8%) |
| $25,000 to $49,999 | 1,542 (93.3%) | 110 (6.7%) |
| $50,000 to $74,999 | 1,360 (90.2%) | 148 (9.8%) |
| $75,000 to $99,999 | 697 (95.2%) | 35 (4.8%) |
| $100,000 and over | 2,087 (97.6%) | 52 (2.4%) |
Public vs Private Health Insurance Coverage by Age in Caribou
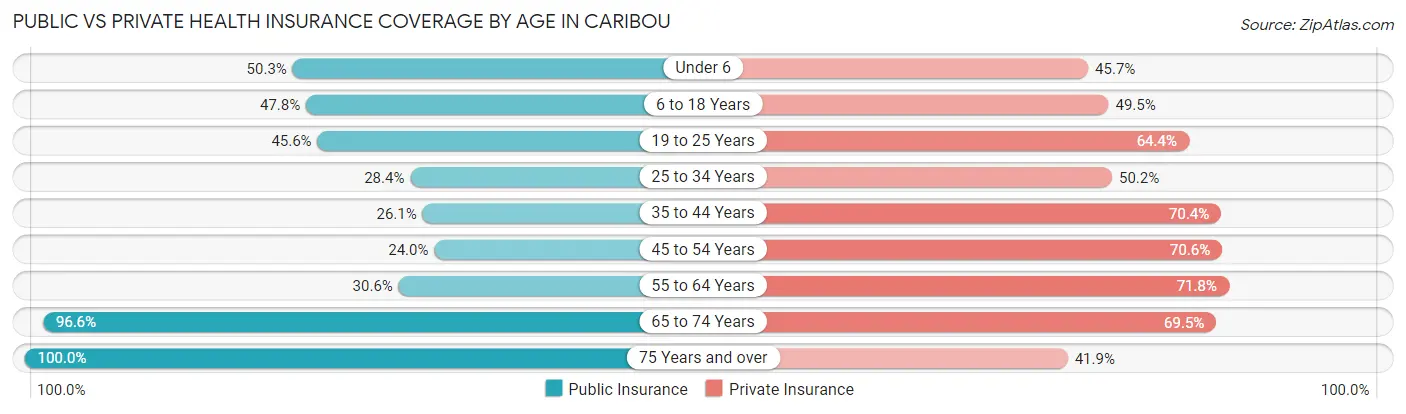
| Age Bracket | Public Insurance | Private Insurance |
| Under 6 | 200 (50.2%) | 182 (45.7%) |
| 6 to 18 Years | 437 (47.8%) | 453 (49.5%) |
| 19 to 25 Years | 241 (45.6%) | 340 (64.4%) |
| 25 to 34 Years | 183 (28.4%) | 323 (50.2%) |
| 35 to 44 Years | 196 (26.1%) | 528 (70.4%) |
| 45 to 54 Years | 210 (23.9%) | 619 (70.6%) |
| 55 to 64 Years | 410 (30.6%) | 963 (71.8%) |
| 65 to 74 Years | 940 (96.6%) | 676 (69.5%) |
| 75 Years and over | 868 (100.0%) | 364 (41.9%) |
| Total | 3,685 (50.5%) | 4,448 (61.0%) |
Disability Status by Sex by Age in Caribou
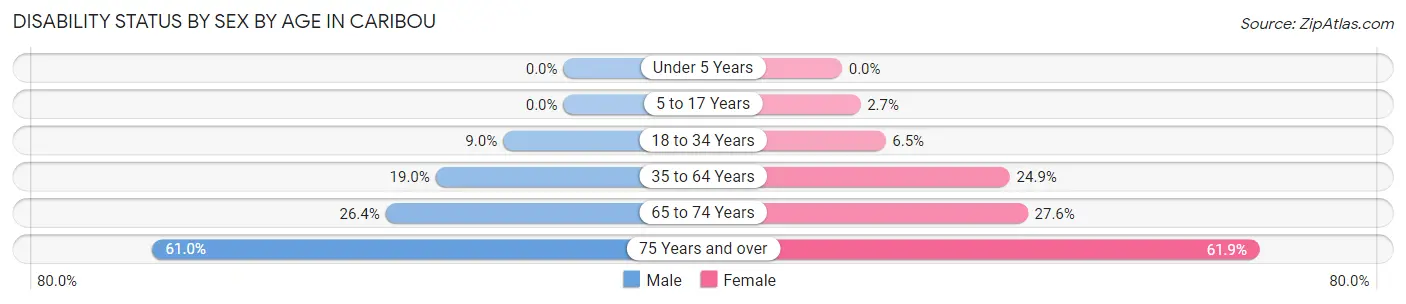
| Age Bracket | Male | Female |
| Under 5 Years | 0 (0.0%) | 0 (0.0%) |
| 5 to 17 Years | 0 (0.0%) | 12 (2.7%) |
| 18 to 34 Years | 64 (9.0%) | 41 (6.5%) |
| 35 to 64 Years | 296 (19.0%) | 351 (24.9%) |
| 65 to 74 Years | 165 (26.4%) | 96 (27.6%) |
| 75 Years and over | 225 (61.0%) | 309 (61.9%) |
Disability Class by Sex by Age in Caribou
Disability Class: Hearing Difficulty
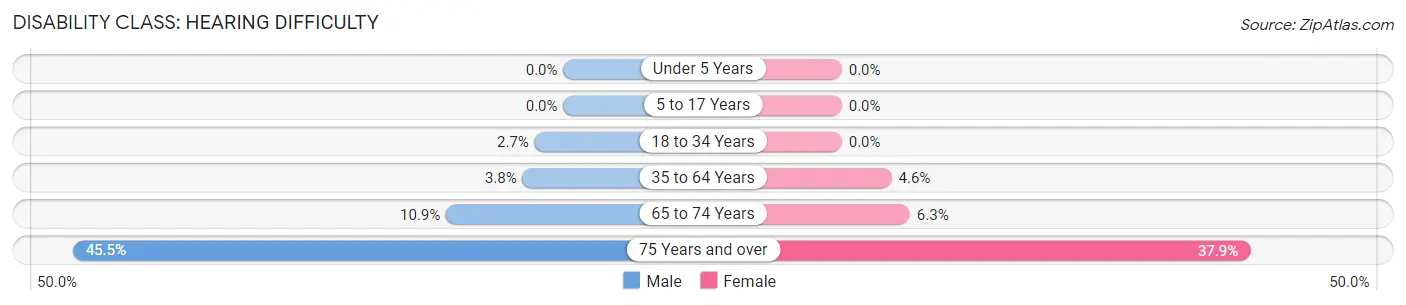
| Age Bracket | Male | Female |
| Under 5 Years | 0 (0.0%) | 0 (0.0%) |
| 5 to 17 Years | 0 (0.0%) | 0 (0.0%) |
| 18 to 34 Years | 19 (2.7%) | 0 (0.0%) |
| 35 to 64 Years | 59 (3.8%) | 65 (4.6%) |
| 65 to 74 Years | 68 (10.9%) | 22 (6.3%) |
| 75 Years and over | 168 (45.5%) | 189 (37.9%) |
Disability Class: Vision Difficulty
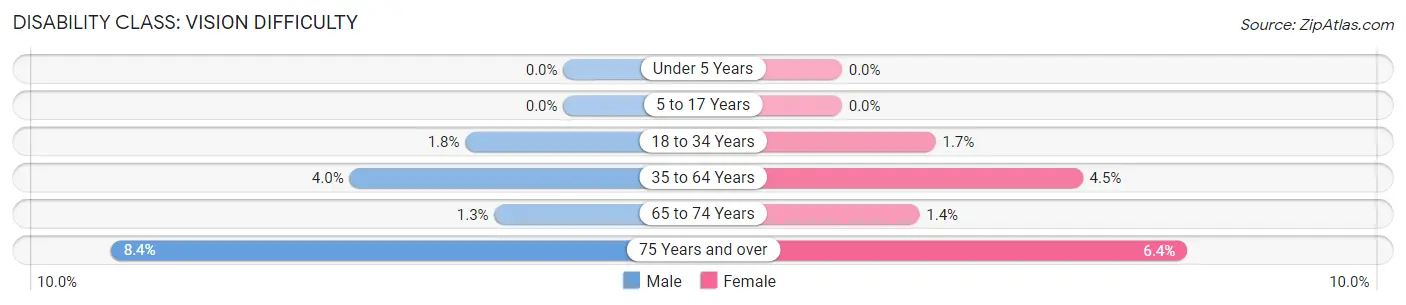
| Age Bracket | Male | Female |
| Under 5 Years | 0 (0.0%) | 0 (0.0%) |
| 5 to 17 Years | 0 (0.0%) | 0 (0.0%) |
| 18 to 34 Years | 13 (1.8%) | 11 (1.7%) |
| 35 to 64 Years | 62 (4.0%) | 63 (4.5%) |
| 65 to 74 Years | 8 (1.3%) | 5 (1.4%) |
| 75 Years and over | 31 (8.4%) | 32 (6.4%) |
Disability Class: Cognitive Difficulty
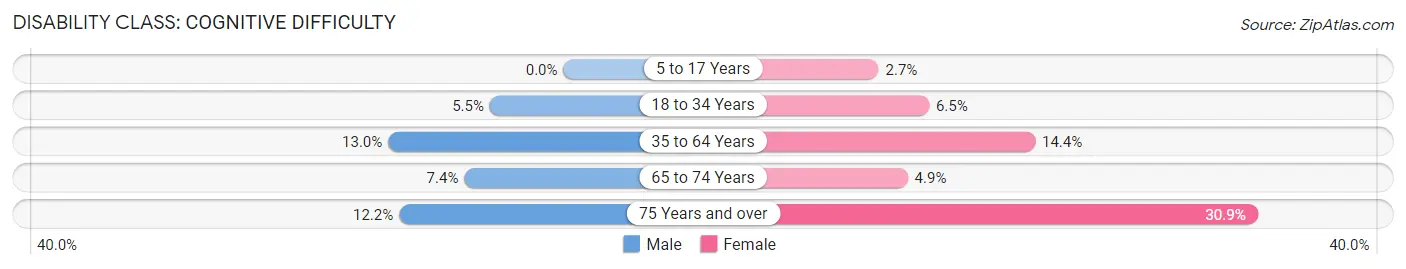
| Age Bracket | Male | Female |
| 5 to 17 Years | 0 (0.0%) | 12 (2.7%) |
| 18 to 34 Years | 39 (5.5%) | 41 (6.5%) |
| 35 to 64 Years | 203 (13.0%) | 202 (14.3%) |
| 65 to 74 Years | 46 (7.4%) | 17 (4.9%) |
| 75 Years and over | 45 (12.2%) | 154 (30.9%) |
Disability Class: Ambulatory Difficulty
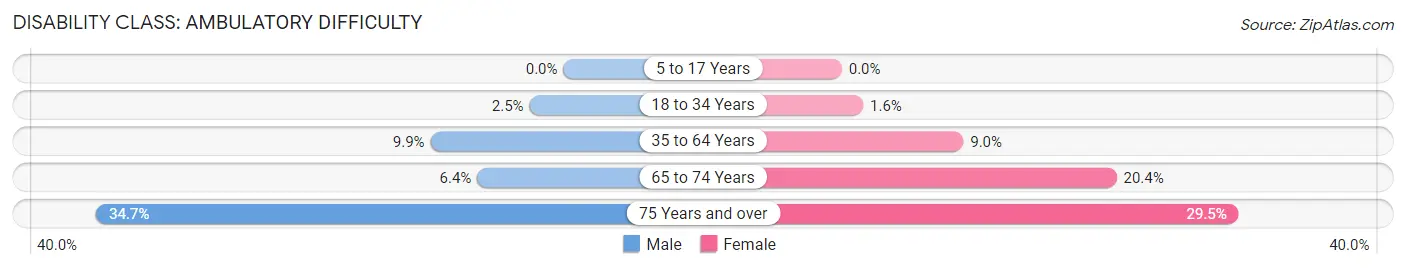
| Age Bracket | Male | Female |
| 5 to 17 Years | 0 (0.0%) | 0 (0.0%) |
| 18 to 34 Years | 18 (2.5%) | 10 (1.6%) |
| 35 to 64 Years | 154 (9.9%) | 127 (9.0%) |
| 65 to 74 Years | 40 (6.4%) | 71 (20.4%) |
| 75 Years and over | 128 (34.7%) | 147 (29.5%) |
Disability Class: Self-Care Difficulty
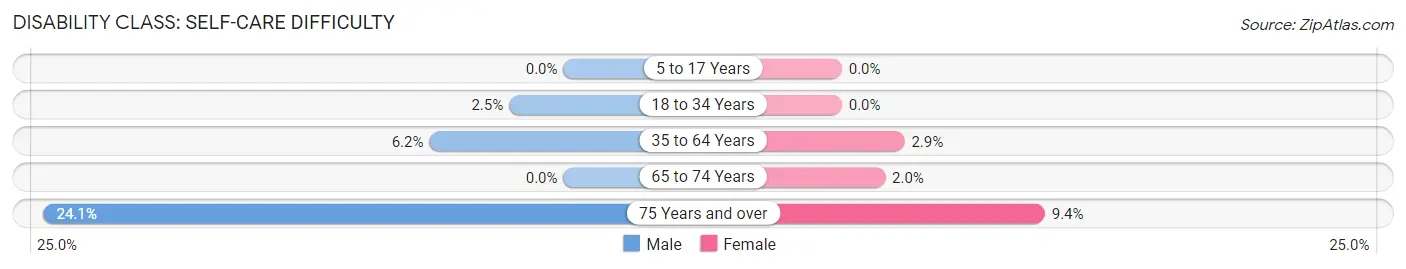
| Age Bracket | Male | Female |
| 5 to 17 Years | 0 (0.0%) | 0 (0.0%) |
| 18 to 34 Years | 18 (2.5%) | 0 (0.0%) |
| 35 to 64 Years | 97 (6.2%) | 41 (2.9%) |
| 65 to 74 Years | 0 (0.0%) | 7 (2.0%) |
| 75 Years and over | 89 (24.1%) | 47 (9.4%) |
Technology Access in Caribou
Computing Device Access in Caribou
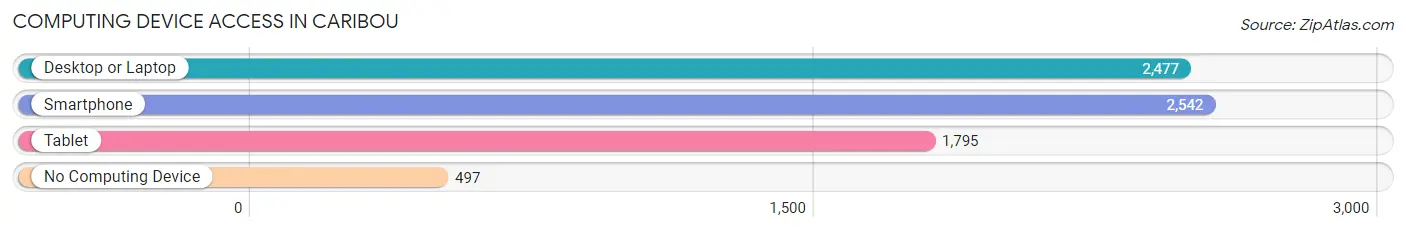
| Device Type | # Households | % Households |
| Desktop or Laptop | 2,477 | 70.3% |
| Smartphone | 2,542 | 72.1% |
| Tablet | 1,795 | 50.9% |
| No Computing Device | 497 | 14.1% |
| Total | 3,526 | 100.0% |
Internet Access in Caribou
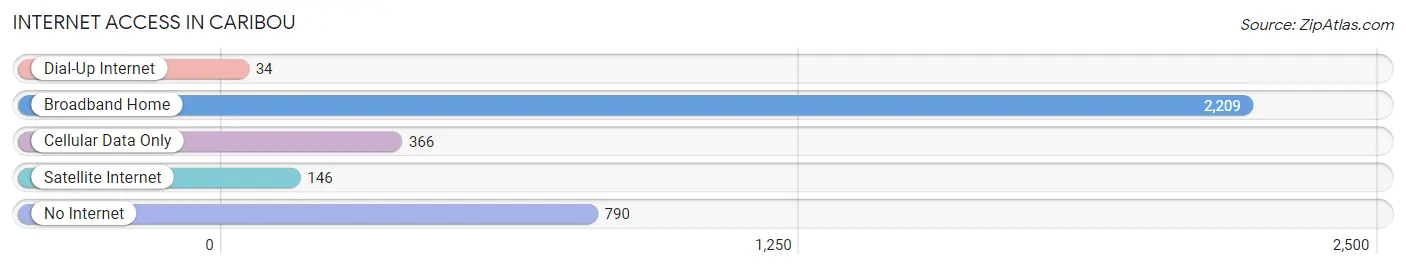
| Internet Type | # Households | % Households |
| Dial-Up Internet | 34 | 1.0% |
| Broadband Home | 2,209 | 62.6% |
| Cellular Data Only | 366 | 10.4% |
| Satellite Internet | 146 | 4.1% |
| No Internet | 790 | 22.4% |
| Total | 3,526 | 100.0% |
Caribou Summary
Caribou, Maine is a city located in Aroostook County, in the northernmost part of the state. It is the largest city in the county and the second largest in the state, with a population of 8,189 as of the 2010 census. The city is situated on the Aroostook River, which flows through the city and is a major source of recreation and economic activity.
History
The area that is now Caribou was first settled in the early 1800s by French-Canadian immigrants. The city was originally known as Lower Aroostook, and was incorporated as a town in 1859. The name was changed to Caribou in 1875, after the caribou that were abundant in the area.
In the late 1800s, the city became a major center for the lumber industry, with several sawmills and logging camps in the area. The city also became a major railroad hub, with the Bangor and Aroostook Railroad running through the city.
The city experienced a period of rapid growth in the early 1900s, with the population increasing from 1,000 in 1900 to over 5,000 by 1920. This growth was largely due to the influx of French-Canadian immigrants, who came to work in the lumber and railroad industries.
Geography
Caribou is located in northern Maine, in Aroostook County. It is situated on the Aroostook River, which flows through the city and is a major source of recreation and economic activity. The city is located at the intersection of U.S. Route 1 and Maine State Route 89.
The city has a total area of 16.2 square miles, of which 15.9 square miles is land and 0.3 square miles is water. The city is located in a hilly region, with several small lakes and ponds in the area.
Economy
The economy of Caribou is largely based on the lumber and paper industries. The city is home to several sawmills and paper mills, which employ a large number of people in the area. The city is also a major center for the potato industry, with several potato processing plants in the area.
In addition to the lumber and paper industries, Caribou is also home to several retail stores, restaurants, and other businesses. The city is also a major center for tourism, with several hotels, campgrounds, and other attractions in the area.
Demographics
As of the 2010 census, the population of Caribou was 8,189. The racial makeup of the city was 95.3% White, 0.7% African American, 0.5% Native American, 0.7% Asian, 0.1% Pacific Islander, 0.7% from other races, and 1.8% from two or more races. Hispanic or Latino of any race were 1.7% of the population.
The median income for a household in the city was $37,917, and the median income for a family was $45,938. The per capita income for the city was $19,945. About 11.3% of families and 14.2% of the population were below the poverty line, including 19.2% of those under age 18 and 8.2% of those age 65 or over.
Common Questions
What is Per Capita Income in Caribou?
Per Capita income in Caribou is $33,605.
What is the Median Family Income in Caribou?
Median Family Income in Caribou is $69,625.
What is the Median Household income in Caribou?
Median Household Income in Caribou is $47,803.
What is Income or Wage Gap in Caribou?
Income or Wage Gap in Caribou is 11.7%.
Women in Caribou earn 88.3 cents for every dollar earned by a man.
What is Inequality or Gini Index in Caribou?
Inequality or Gini Index in Caribou is 0.48.
What is the Total Population of Caribou?
Total Population of Caribou is 7,454.
What is the Total Male Population of Caribou?
Total Male Population of Caribou is 3,862.
What is the Total Female Population of Caribou?
Total Female Population of Caribou is 3,592.
What is the Ratio of Males per 100 Females in Caribou?
There are 107.52 Males per 100 Females in Caribou.
What is the Ratio of Females per 100 Males in Caribou?
There are 93.01 Females per 100 Males in Caribou.
What is the Median Population Age in Caribou?
Median Population Age in Caribou is 52.2 Years.
What is the Average Family Size in Caribou
Average Family Size in Caribou is 2.7 People.
What is the Average Household Size in Caribou
Average Household Size in Caribou is 2.1 People.
How Large is the Labor Force in Caribou?
There are 3,506 People in the Labor Forcein in Caribou.
What is the Percentage of People in the Labor Force in Caribou?
54.0% of People are in the Labor Force in Caribou.
What is the Unemployment Rate in Caribou?
Unemployment Rate in Caribou is 2.0%.