Boothbay Harbor, ME Map & Demographics
Boothbay Harbor Map
Boothbay Harbor Overview
$38,399
PER CAPITA INCOME
$85,833
AVG FAMILY INCOME
$65,795
AVG HOUSEHOLD INCOME
7.6%
WAGE / INCOME GAP [ % ]
92.4¢/ $1
WAGE / INCOME GAP [ $ ]
0.45
INEQUALITY / GINI INDEX
982
TOTAL POPULATION
375
MALE POPULATION
607
FEMALE POPULATION
61.78
MALES / 100 FEMALES
161.87
FEMALES / 100 MALES
55.5
MEDIAN AGE
2.9
AVG FAMILY SIZE
2.1
AVG HOUSEHOLD SIZE
494
LABOR FORCE [ PEOPLE ]
54.9%
PERCENT IN LABOR FORCE
1.8%
UNEMPLOYMENT RATE
Boothbay Harbor Zip Codes
Boothbay Harbor Area Codes
Income in Boothbay Harbor
Income Overview in Boothbay Harbor
Per Capita Income in Boothbay Harbor is $38,399, while median incomes of families and households are $85,833 and $65,795 respectively.
| Characteristic | Number | Measure |
| Per Capita Income | 982 | $38,399 |
| Median Family Income | 232 | $85,833 |
| Mean Family Income | 232 | $112,294 |
| Median Household Income | 470 | $65,795 |
| Mean Household Income | 470 | $76,609 |
| Income Deficit | 232 | $0 |
| Wage / Income Gap (%) | 982 | 7.64% |
| Wage / Income Gap ($) | 982 | 92.36¢ per $1 |
| Gini / Inequality Index | 982 | 0.45 |
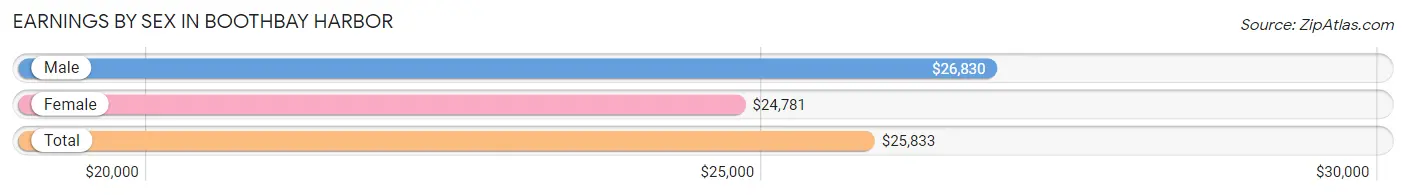
Earnings by Sex in Boothbay Harbor
Average Earnings in Boothbay Harbor are $25,833, $26,830 for men and $24,781 for women, a difference of 7.6%.
| Sex | Number | Average Earnings |
| Male | 263 (42.4%) | $26,830 |
| Female | 357 (57.6%) | $24,781 |
| Total | 620 (100.0%) | $25,833 |
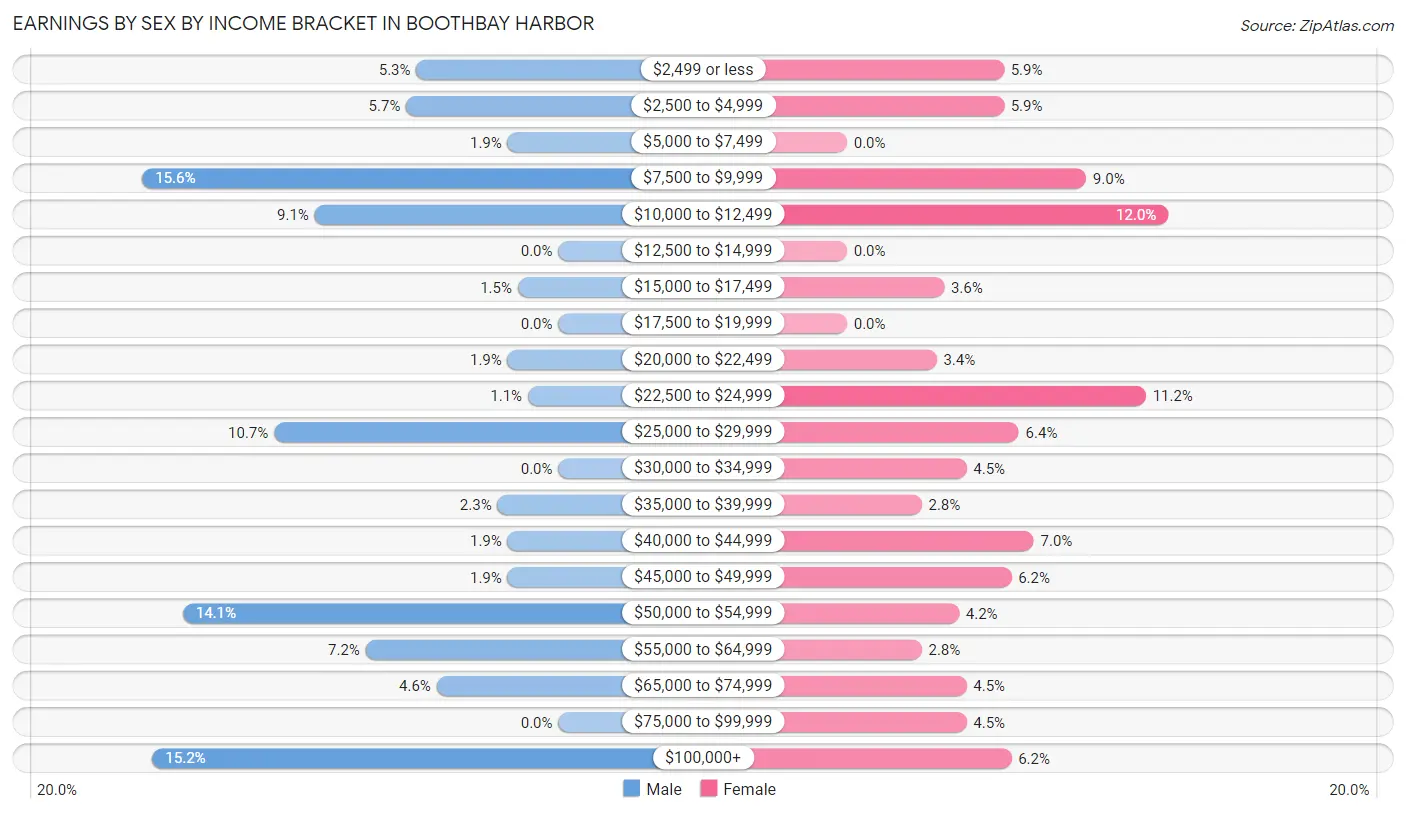
Earnings by Sex by Income Bracket in Boothbay Harbor
The most common earnings brackets in Boothbay Harbor are $7,500 to $9,999 for men (41 | 15.6%) and $10,000 to $12,499 for women (43 | 12.0%).
| Income | Male | Female |
| $2,499 or less | 14 (5.3%) | 21 (5.9%) |
| $2,500 to $4,999 | 15 (5.7%) | 21 (5.9%) |
| $5,000 to $7,499 | 5 (1.9%) | 0 (0.0%) |
| $7,500 to $9,999 | 41 (15.6%) | 32 (9.0%) |
| $10,000 to $12,499 | 24 (9.1%) | 43 (12.0%) |
| $12,500 to $14,999 | 0 (0.0%) | 0 (0.0%) |
| $15,000 to $17,499 | 4 (1.5%) | 13 (3.6%) |
| $17,500 to $19,999 | 0 (0.0%) | 0 (0.0%) |
| $20,000 to $22,499 | 5 (1.9%) | 12 (3.4%) |
| $22,500 to $24,999 | 3 (1.1%) | 40 (11.2%) |
| $25,000 to $29,999 | 28 (10.6%) | 23 (6.4%) |
| $30,000 to $34,999 | 0 (0.0%) | 16 (4.5%) |
| $35,000 to $39,999 | 6 (2.3%) | 10 (2.8%) |
| $40,000 to $44,999 | 5 (1.9%) | 25 (7.0%) |
| $45,000 to $49,999 | 5 (1.9%) | 22 (6.2%) |
| $50,000 to $54,999 | 37 (14.1%) | 15 (4.2%) |
| $55,000 to $64,999 | 19 (7.2%) | 10 (2.8%) |
| $65,000 to $74,999 | 12 (4.6%) | 16 (4.5%) |
| $75,000 to $99,999 | 0 (0.0%) | 16 (4.5%) |
| $100,000+ | 40 (15.2%) | 22 (6.2%) |
| Total | 263 (100.0%) | 357 (100.0%) |
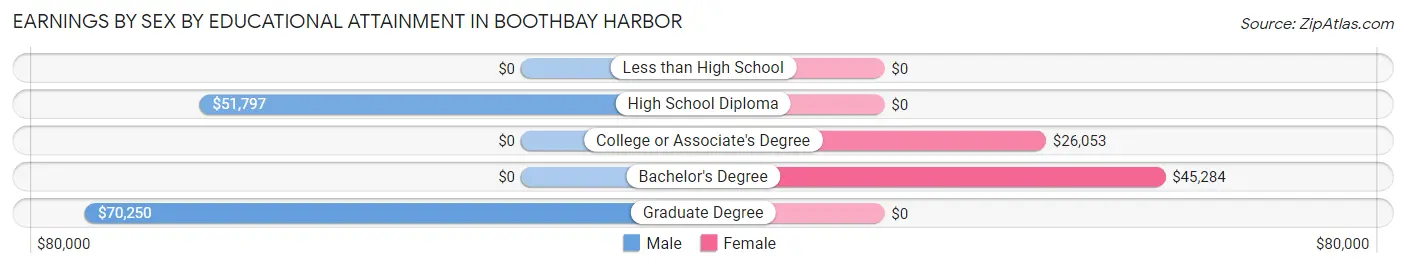
Earnings by Sex by Educational Attainment in Boothbay Harbor
Average earnings in Boothbay Harbor are $46,000 for men and $25,652 for women, a difference of 44.2%. Men with an educational attainment of graduate degree enjoy the highest average annual earnings of $70,250, while those with high school diploma education earn the least with $51,797. Women with an educational attainment of bachelor's degree earn the most with the average annual earnings of $45,284, while those with college or associate's degree education have the smallest earnings of $26,053.
| Educational Attainment | Male Income | Female Income |
| Less than High School | - | - |
| High School Diploma | $51,797 | $0 |
| College or Associate's Degree | - | - |
| Bachelor's Degree | - | - |
| Graduate Degree | $70,250 | $0 |
| Total | $46,000 | $25,652 |
Family Income in Boothbay Harbor
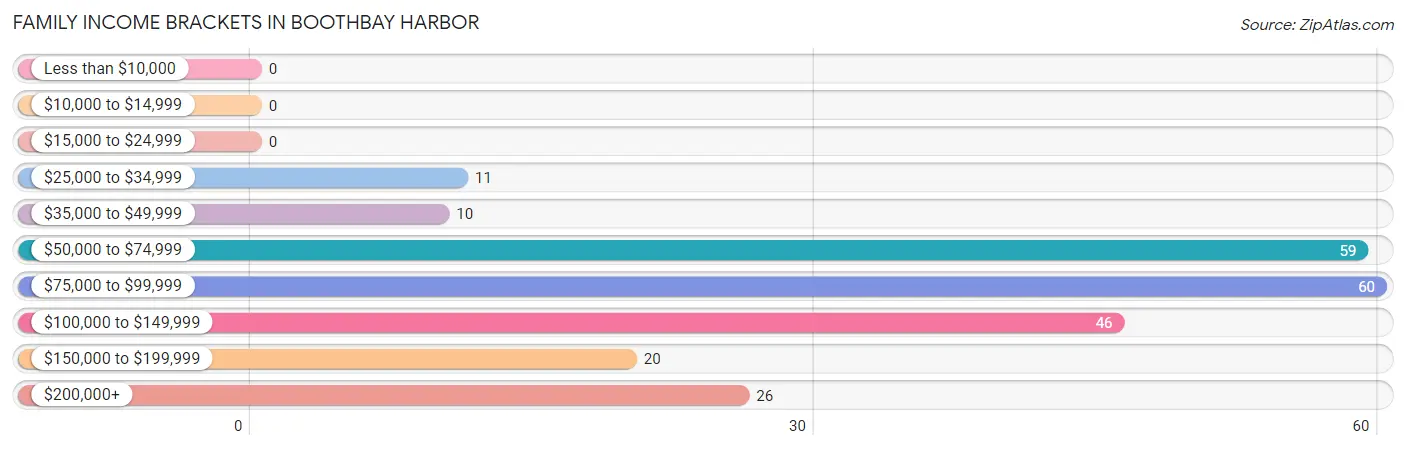
Family Income Brackets in Boothbay Harbor
According to the Boothbay Harbor family income data, there are 60 families falling into the $75,000 to $99,999 income range, which is the most common income bracket and makes up 25.9% of all families.
| Income Bracket | # Families | % Families |
| Less than $10,000 | 0 | 0.0% |
| $10,000 to $14,999 | 0 | 0.0% |
| $15,000 to $24,999 | 0 | 0.0% |
| $25,000 to $34,999 | 11 | 4.7% |
| $35,000 to $49,999 | 10 | 4.3% |
| $50,000 to $74,999 | 59 | 25.4% |
| $75,000 to $99,999 | 60 | 25.9% |
| $100,000 to $149,999 | 46 | 19.8% |
| $150,000 to $199,999 | 20 | 8.6% |
| $200,000+ | 26 | 11.2% |
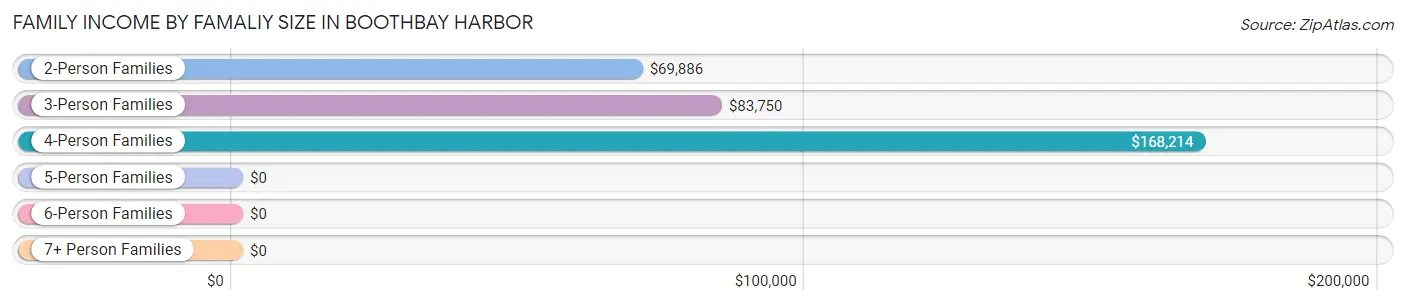
Family Income by Famaliy Size in Boothbay Harbor
4-person families (32 | 13.8%) account for the highest median family income in Boothbay Harbor with $168,214 per family, while 4-person families (32 | 13.8%) have the highest median income of $42,054 per family member.
| Income Bracket | # Families | Median Income |
| 2-Person Families | 159 (68.5%) | $69,886 |
| 3-Person Families | 35 (15.1%) | $83,750 |
| 4-Person Families | 32 (13.8%) | $168,214 |
| 5-Person Families | 6 (2.6%) | $0 |
| 6-Person Families | 0 (0.0%) | $0 |
| 7+ Person Families | 0 (0.0%) | $0 |
| Total | 232 (100.0%) | $85,833 |
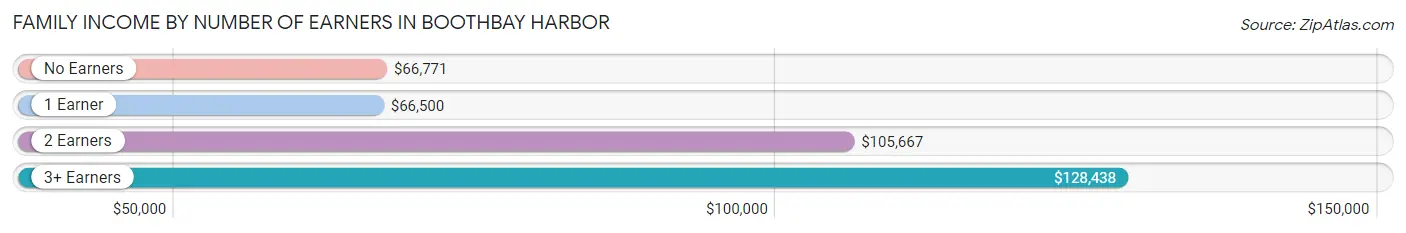
Family Income by Number of Earners in Boothbay Harbor
The median family income in Boothbay Harbor is $85,833, with families comprising 3+ earners (55) having the highest median family income of $128,438, while families with 1 earner (58) have the lowest median family income of $66,500, accounting for 23.7% and 25.0% of families, respectively.
| Number of Earners | # Families | Median Income |
| No Earners | 47 (20.3%) | $66,771 |
| 1 Earner | 58 (25.0%) | $66,500 |
| 2 Earners | 72 (31.0%) | $105,667 |
| 3+ Earners | 55 (23.7%) | $128,438 |
| Total | 232 (100.0%) | $85,833 |
Household Income in Boothbay Harbor
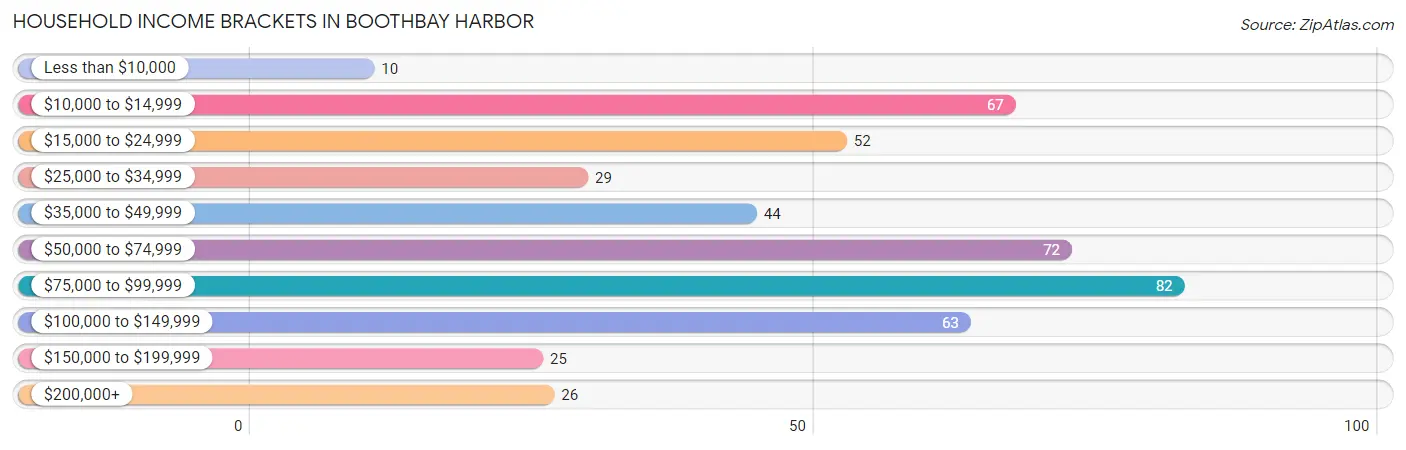
Household Income Brackets in Boothbay Harbor
With 82 households falling in the category, the $75,000 to $99,999 income range is the most frequent in Boothbay Harbor, accounting for 17.4% of all households. In contrast, only 10 households (2.1%) fall into the less than $10,000 income bracket, making it the least populous group.
| Income Bracket | # Households | % Households |
| Less than $10,000 | 10 | 2.1% |
| $10,000 to $14,999 | 67 | 14.3% |
| $15,000 to $24,999 | 52 | 11.1% |
| $25,000 to $34,999 | 29 | 6.2% |
| $35,000 to $49,999 | 44 | 9.4% |
| $50,000 to $74,999 | 72 | 15.3% |
| $75,000 to $99,999 | 82 | 17.4% |
| $100,000 to $149,999 | 63 | 13.4% |
| $150,000 to $199,999 | 25 | 5.3% |
| $200,000+ | 26 | 5.5% |
Household Income by Householder Age in Boothbay Harbor
The median household income in Boothbay Harbor is $65,795, with the highest median household income of $79,167 found in the 45 to 64 years age bracket for the primary householder. A total of 140 households (29.8%) fall into this category. Meanwhile, the 15 to 24 years age bracket for the primary householder has the lowest median household income of $0, with 10 households (2.1%) in this group.
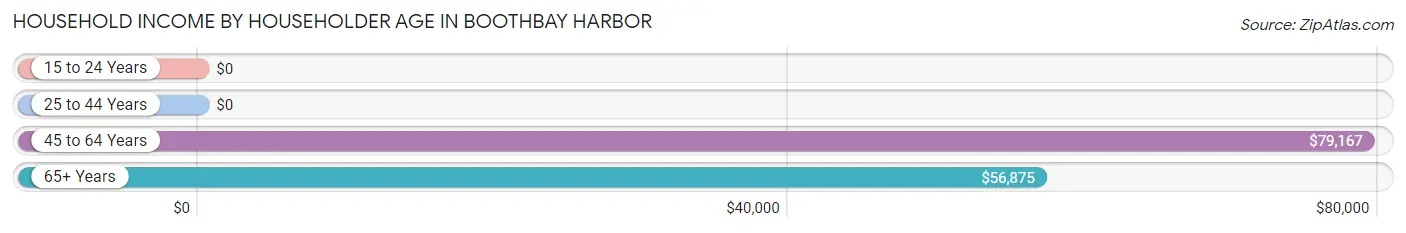
| Income Bracket | # Households | Median Income |
| 15 to 24 Years | 10 (2.1%) | $0 |
| 25 to 44 Years | 102 (21.7%) | $0 |
| 45 to 64 Years | 140 (29.8%) | $79,167 |
| 65+ Years | 218 (46.4%) | $56,875 |
| Total | 470 (100.0%) | $65,795 |
Poverty in Boothbay Harbor
Income Below Poverty by Sex and Age in Boothbay Harbor
With 6.1% poverty level for males and 15.5% for females among the residents of Boothbay Harbor, 18 to 24 year old males and 25 to 34 year old females are the most vulnerable to poverty, with 10 males (33.3%) and 56 females (38.4%) in their respective age groups living below the poverty level.
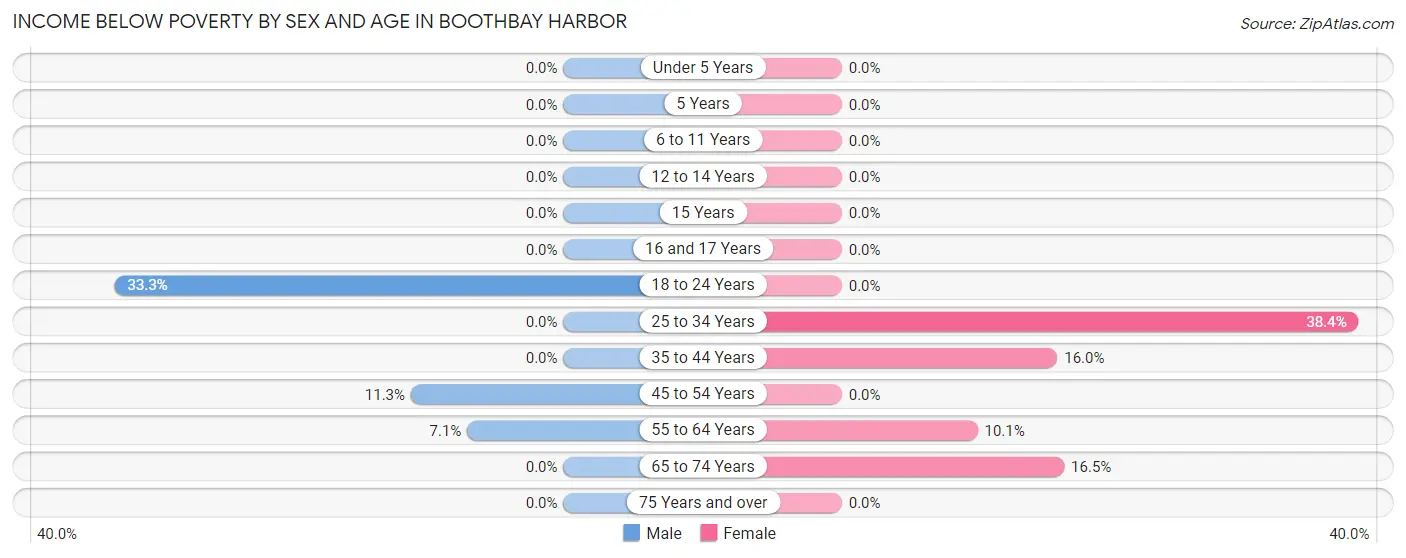
| Age Bracket | Male | Female |
| Under 5 Years | 0 (0.0%) | 0 (0.0%) |
| 5 Years | 0 (0.0%) | 0 (0.0%) |
| 6 to 11 Years | 0 (0.0%) | 0 (0.0%) |
| 12 to 14 Years | 0 (0.0%) | 0 (0.0%) |
| 15 Years | 0 (0.0%) | 0 (0.0%) |
| 16 and 17 Years | 0 (0.0%) | 0 (0.0%) |
| 18 to 24 Years | 10 (33.3%) | 0 (0.0%) |
| 25 to 34 Years | 0 (0.0%) | 56 (38.4%) |
| 35 to 44 Years | 0 (0.0%) | 8 (16.0%) |
| 45 to 54 Years | 6 (11.3%) | 0 (0.0%) |
| 55 to 64 Years | 6 (7.1%) | 12 (10.1%) |
| 65 to 74 Years | 0 (0.0%) | 18 (16.5%) |
| 75 Years and over | 0 (0.0%) | 0 (0.0%) |
| Total | 22 (6.1%) | 94 (15.5%) |
Income Above Poverty by Sex and Age in Boothbay Harbor
According to the poverty statistics in Boothbay Harbor, males aged under 5 years and females aged 6 to 11 years are the age groups that are most secure financially, with 100.0% of males and 100.0% of females in these age groups living above the poverty line.
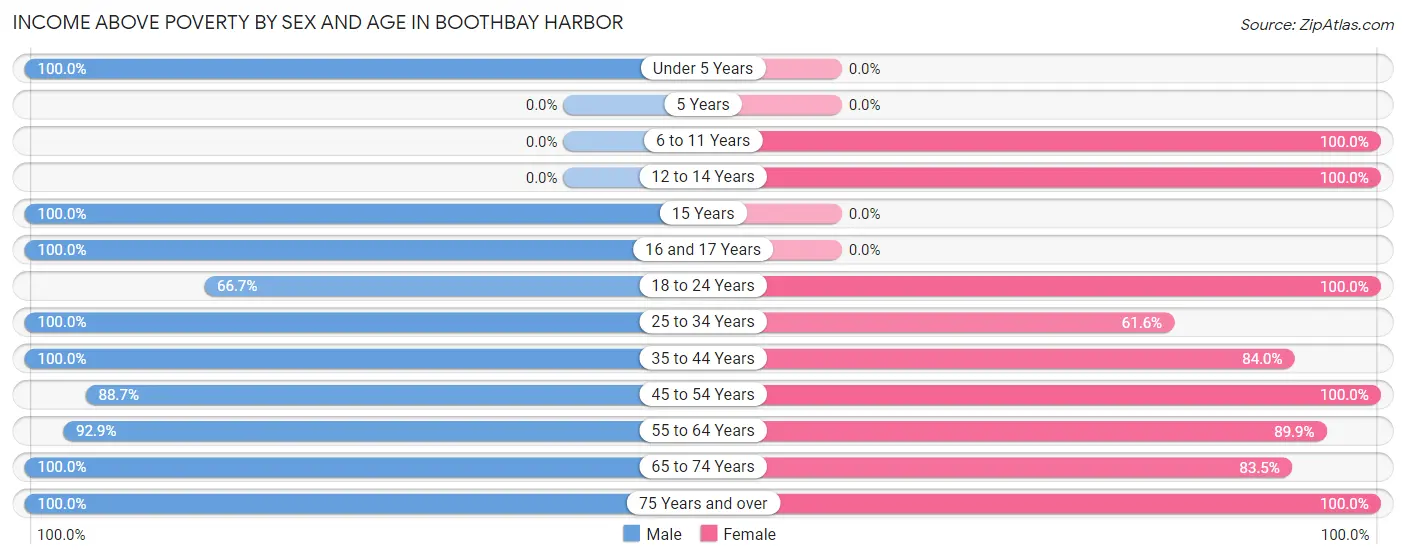
| Age Bracket | Male | Female |
| Under 5 Years | 6 (100.0%) | 0 (0.0%) |
| 5 Years | 0 (0.0%) | 0 (0.0%) |
| 6 to 11 Years | 0 (0.0%) | 7 (100.0%) |
| 12 to 14 Years | 0 (0.0%) | 42 (100.0%) |
| 15 Years | 14 (100.0%) | 0 (0.0%) |
| 16 and 17 Years | 11 (100.0%) | 0 (0.0%) |
| 18 to 24 Years | 20 (66.7%) | 31 (100.0%) |
| 25 to 34 Years | 38 (100.0%) | 90 (61.6%) |
| 35 to 44 Years | 26 (100.0%) | 42 (84.0%) |
| 45 to 54 Years | 47 (88.7%) | 17 (100.0%) |
| 55 to 64 Years | 78 (92.9%) | 107 (89.9%) |
| 65 to 74 Years | 67 (100.0%) | 91 (83.5%) |
| 75 Years and over | 33 (100.0%) | 86 (100.0%) |
| Total | 340 (93.9%) | 513 (84.5%) |
Income Below Poverty Among Married-Couple Families in Boothbay Harbor
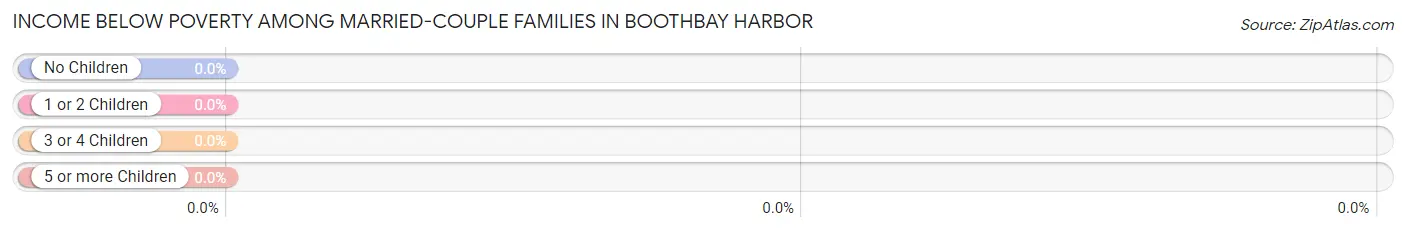
| Children | Above Poverty | Below Poverty |
| No Children | 142 (100.0%) | 0 (0.0%) |
| 1 or 2 Children | 38 (100.0%) | 0 (0.0%) |
| 3 or 4 Children | 0 (0.0%) | 0 (0.0%) |
| 5 or more Children | 0 (0.0%) | 0 (0.0%) |
| Total | 180 (100.0%) | 0 (0.0%) |
Income Below Poverty Among Single-Parent Households in Boothbay Harbor
| Children | Single Father | Single Mother |
| No Children | 0 (0.0%) | 0 (0.0%) |
| 1 or 2 Children | 0 (0.0%) | 0 (0.0%) |
| 3 or 4 Children | 0 (0.0%) | 0 (0.0%) |
| 5 or more Children | 0 (0.0%) | 0 (0.0%) |
| Total | 0 (0.0%) | 0 (0.0%) |
Income Below Poverty Among Married-Couple vs Single-Parent Households in Boothbay Harbor
| Children | Married-Couple Families | Single-Parent Households |
| No Children | 0 (0.0%) | 0 (0.0%) |
| 1 or 2 Children | 0 (0.0%) | 0 (0.0%) |
| 3 or 4 Children | 0 (0.0%) | 0 (0.0%) |
| 5 or more Children | 0 (0.0%) | 0 (0.0%) |
| Total | 0 (0.0%) | 0 (0.0%) |
Race in Boothbay Harbor
The most populous races in Boothbay Harbor are White / Caucasian (879 | 89.5%), Hispanic or Latino (47 | 4.8%), and Asian (43 | 4.4%).
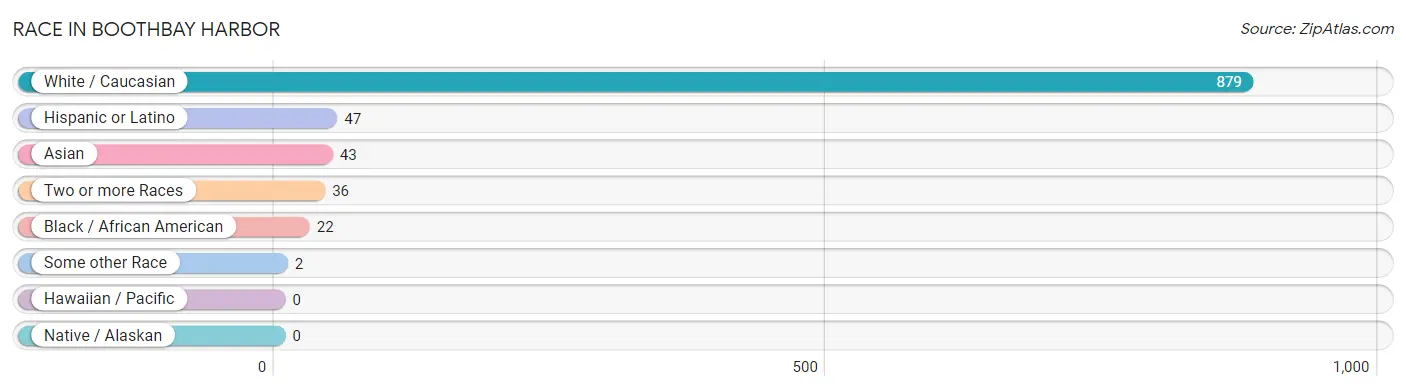
| Race | # Population | % Population |
| Asian | 43 | 4.4% |
| Black / African American | 22 | 2.2% |
| Hawaiian / Pacific | 0 | 0.0% |
| Hispanic or Latino | 47 | 4.8% |
| Native / Alaskan | 0 | 0.0% |
| White / Caucasian | 879 | 89.5% |
| Two or more Races | 36 | 3.7% |
| Some other Race | 2 | 0.2% |
| Total | 982 | 100.0% |
Ancestry in Boothbay Harbor
The most populous ancestries reported in Boothbay Harbor are English (257 | 26.2%), French (158 | 16.1%), Irish (140 | 14.3%), German (86 | 8.8%), and American (83 | 8.5%), together accounting for 73.7% of all Boothbay Harbor residents.
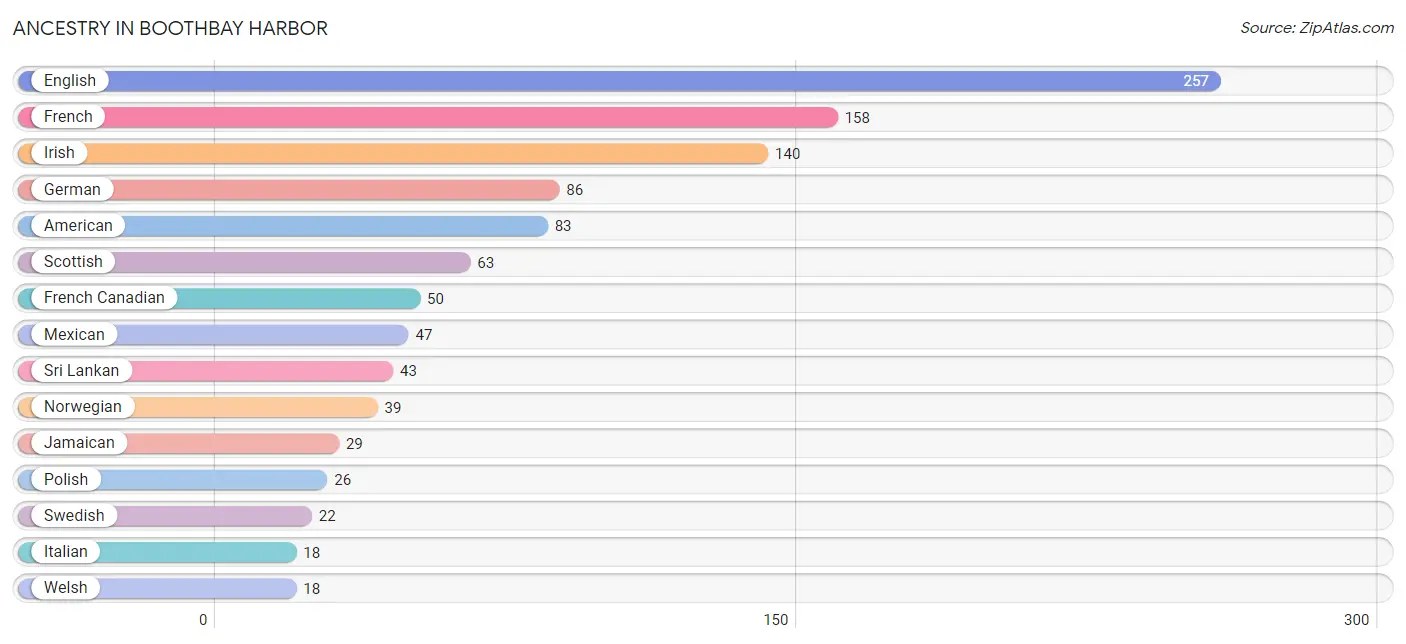
| Ancestry | # Population | % Population |
| American | 83 | 8.5% |
| Belgian | 10 | 1.0% |
| British | 15 | 1.5% |
| Canadian | 4 | 0.4% |
| Croatian | 6 | 0.6% |
| Dutch | 4 | 0.4% |
| English | 257 | 26.2% |
| French | 158 | 16.1% |
| French Canadian | 50 | 5.1% |
| German | 86 | 8.8% |
| Greek | 16 | 1.6% |
| Indian (Asian) | 10 | 1.0% |
| Irish | 140 | 14.3% |
| Italian | 18 | 1.8% |
| Jamaican | 29 | 2.9% |
| Lithuanian | 10 | 1.0% |
| Mexican | 47 | 4.8% |
| Northern European | 10 | 1.0% |
| Norwegian | 39 | 4.0% |
| Polish | 26 | 2.6% |
| Scotch-Irish | 9 | 0.9% |
| Scottish | 63 | 6.4% |
| Slovak | 7 | 0.7% |
| Sri Lankan | 43 | 4.4% |
| Swedish | 22 | 2.2% |
| Welsh | 18 | 1.8% | View All 26 Rows |
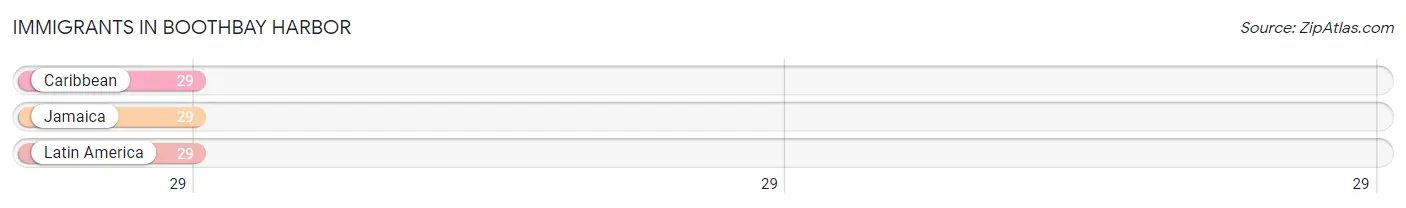
Immigrants in Boothbay Harbor
The most numerous immigrant groups reported in Boothbay Harbor came from Caribbean (29 | 2.9%), Jamaica (29 | 2.9%), and Latin America (29 | 2.9%), together accounting for 8.8% of all Boothbay Harbor residents.
| Immigration Origin | # Population | % Population |
| Caribbean | 29 | 2.9% |
| Jamaica | 29 | 2.9% |
| Latin America | 29 | 2.9% | View All 3 Rows |
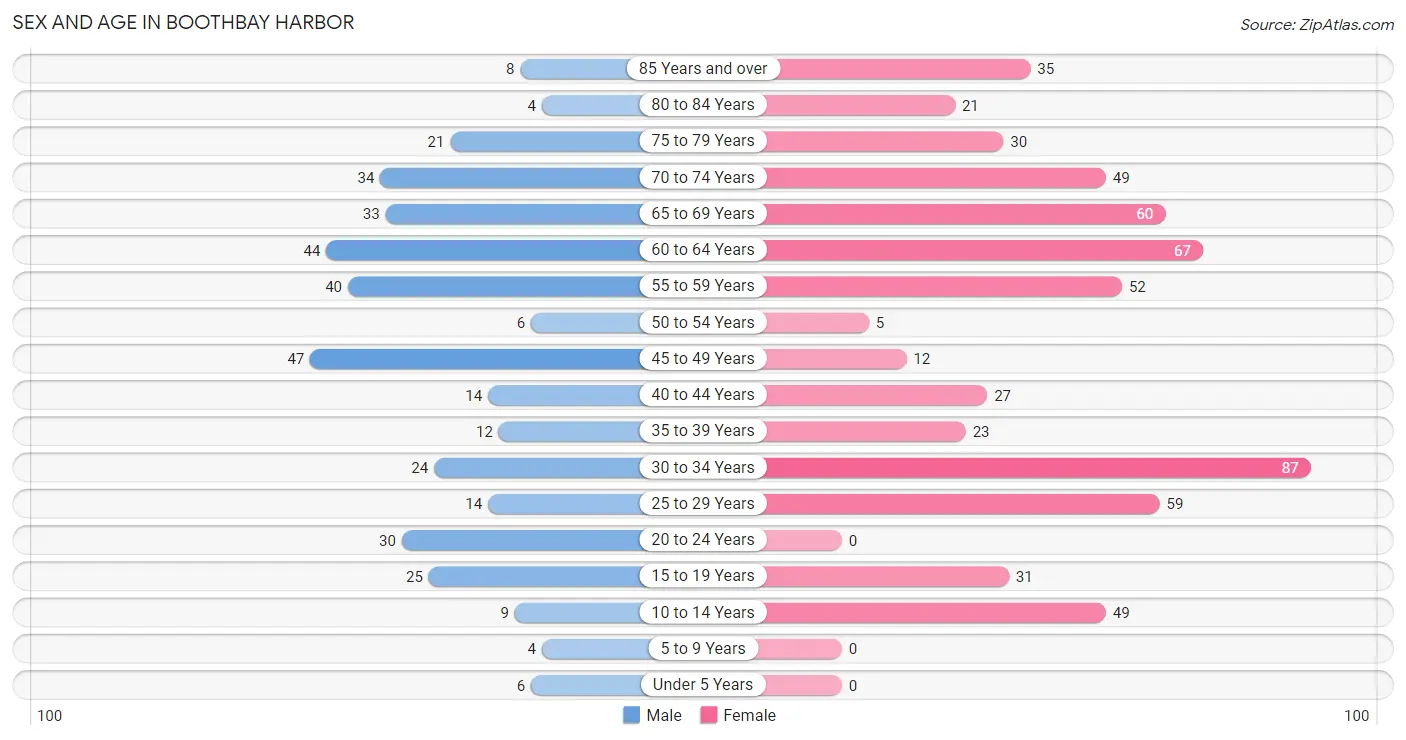
Sex and Age in Boothbay Harbor
Sex and Age in Boothbay Harbor
The most populous age groups in Boothbay Harbor are 45 to 49 Years (47 | 12.5%) for men and 30 to 34 Years (87 | 14.3%) for women.
| Age Bracket | Male | Female |
| Under 5 Years | 6 (1.6%) | 0 (0.0%) |
| 5 to 9 Years | 4 (1.1%) | 0 (0.0%) |
| 10 to 14 Years | 9 (2.4%) | 49 (8.1%) |
| 15 to 19 Years | 25 (6.7%) | 31 (5.1%) |
| 20 to 24 Years | 30 (8.0%) | 0 (0.0%) |
| 25 to 29 Years | 14 (3.7%) | 59 (9.7%) |
| 30 to 34 Years | 24 (6.4%) | 87 (14.3%) |
| 35 to 39 Years | 12 (3.2%) | 23 (3.8%) |
| 40 to 44 Years | 14 (3.7%) | 27 (4.4%) |
| 45 to 49 Years | 47 (12.5%) | 12 (2.0%) |
| 50 to 54 Years | 6 (1.6%) | 5 (0.8%) |
| 55 to 59 Years | 40 (10.7%) | 52 (8.6%) |
| 60 to 64 Years | 44 (11.7%) | 67 (11.0%) |
| 65 to 69 Years | 33 (8.8%) | 60 (9.9%) |
| 70 to 74 Years | 34 (9.1%) | 49 (8.1%) |
| 75 to 79 Years | 21 (5.6%) | 30 (4.9%) |
| 80 to 84 Years | 4 (1.1%) | 21 (3.5%) |
| 85 Years and over | 8 (2.1%) | 35 (5.8%) |
| Total | 375 (100.0%) | 607 (100.0%) |
Families and Households in Boothbay Harbor
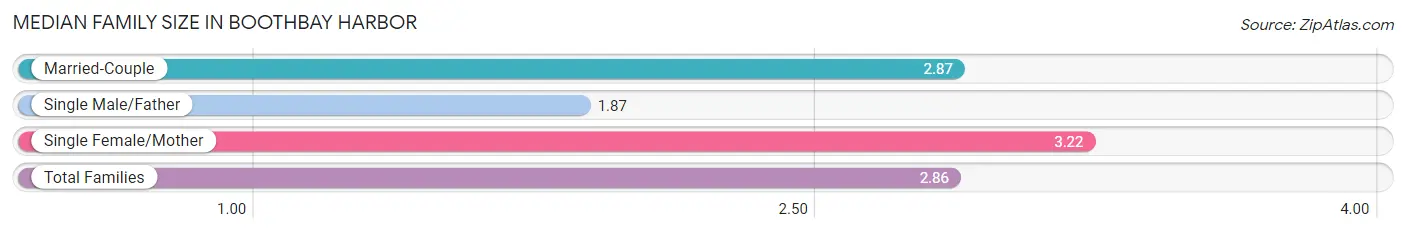
Median Family Size in Boothbay Harbor
The median family size in Boothbay Harbor is 2.86 persons per family, with single female/mother families (37 | 16.0%) accounting for the largest median family size of 3.22 persons per family. On the other hand, single male/father families (15 | 6.5%) represent the smallest median family size with 1.87 persons per family.
| Family Type | # Families | Family Size |
| Married-Couple | 180 (77.6%) | 2.87 |
| Single Male/Father | 15 (6.5%) | 1.87 |
| Single Female/Mother | 37 (16.0%) | 3.22 |
| Total Families | 232 (100.0%) | 2.86 |
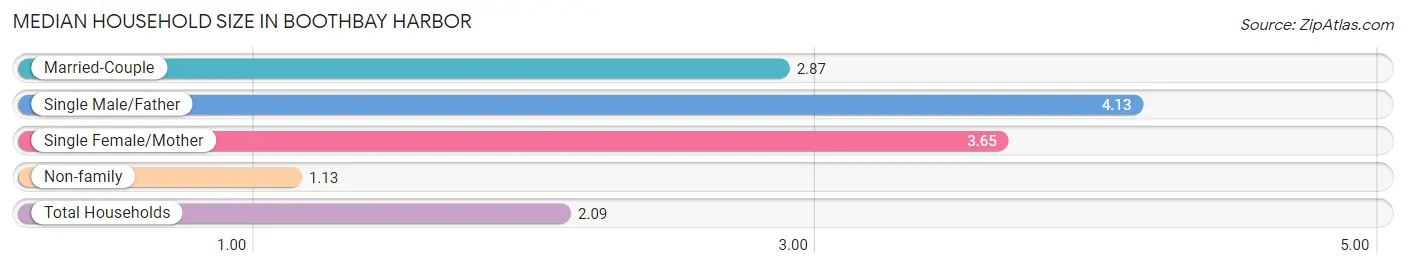
Median Household Size in Boothbay Harbor
The median household size in Boothbay Harbor is 2.09 persons per household, with single male/father households (15 | 3.2%) accounting for the largest median household size of 4.13 persons per household. non-family households (238 | 50.6%) represent the smallest median household size with 1.13 persons per household.
| Household Type | # Households | Household Size |
| Married-Couple | 180 (38.3%) | 2.87 |
| Single Male/Father | 15 (3.2%) | 4.13 |
| Single Female/Mother | 37 (7.9%) | 3.65 |
| Non-family | 238 (50.6%) | 1.13 |
| Total Households | 470 (100.0%) | 2.09 |
Household Size by Marriage Status in Boothbay Harbor
Out of a total of 470 households in Boothbay Harbor, 232 (49.4%) are family households, while 238 (50.6%) are nonfamily households. The most numerous type of family households are 2-person households, comprising 133, and the most common type of nonfamily households are 1-person households, comprising 215.
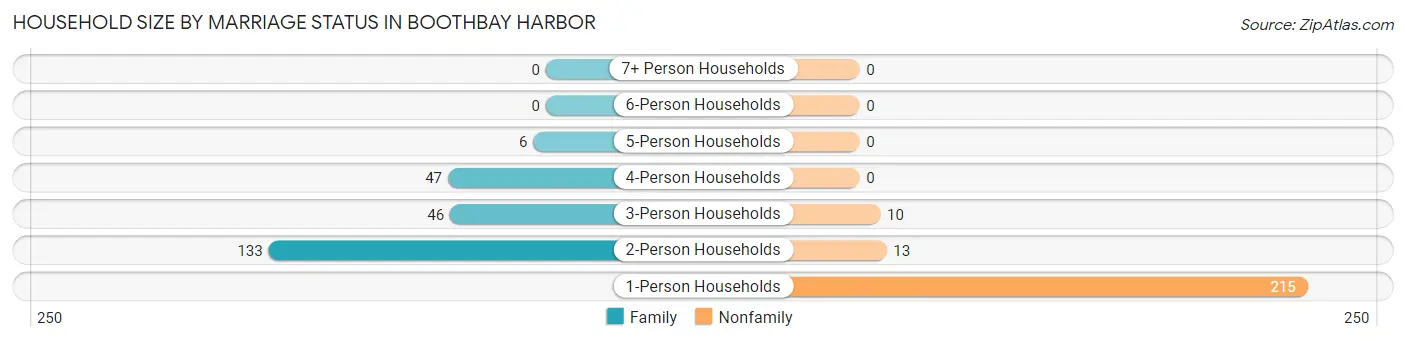
| Household Size | Family Households | Nonfamily Households |
| 1-Person Households | - | 215 (45.7%) |
| 2-Person Households | 133 (28.3%) | 13 (2.8%) |
| 3-Person Households | 46 (9.8%) | 10 (2.1%) |
| 4-Person Households | 47 (10.0%) | 0 (0.0%) |
| 5-Person Households | 6 (1.3%) | 0 (0.0%) |
| 6-Person Households | 0 (0.0%) | 0 (0.0%) |
| 7+ Person Households | 0 (0.0%) | 0 (0.0%) |
| Total | 232 (49.4%) | 238 (50.6%) |
Female Fertility in Boothbay Harbor
Fertility by Age in Boothbay Harbor
| Age Bracket | Women with Births | Births / 1,000 Women |
| 15 to 19 years | 0 (0.0%) | 0.0 |
| 20 to 34 years | 0 (0.0%) | 0.0 |
| 35 to 50 years | 0 (0.0%) | 0.0 |
| Total | 0 (0.0%) | 0.0 |
Fertility by Age by Marriage Status in Boothbay Harbor
| Age Bracket | Married | Unmarried |
| 15 to 19 years | 0 (0.0%) | 0 (0.0%) |
| 20 to 34 years | 0 (0.0%) | 0 (0.0%) |
| 35 to 50 years | 0 (0.0%) | 0 (0.0%) |
| Total | 0 (0.0%) | 0 (0.0%) |
Fertility by Education in Boothbay Harbor
| Educational Attainment | Women with Births | Births / 1,000 Women |
| Less than High School | 0 (0.0%) | 0.0 |
| High School Diploma | 0 (0.0%) | 0.0 |
| College or Associate's Degree | 0 (0.0%) | 0.0 |
| Bachelor's Degree | 0 (0.0%) | 0.0 |
| Graduate Degree | 0 (0.0%) | 0.0 |
| Total | 0 (0.0%) | 0.0 |
Fertility by Education by Marriage Status in Boothbay Harbor
| Educational Attainment | Married | Unmarried |
| Less than High School | 0 (0.0%) | 0 (0.0%) |
| High School Diploma | 0 (0.0%) | 0 (0.0%) |
| College or Associate's Degree | 0 (0.0%) | 0 (0.0%) |
| Bachelor's Degree | 0 (0.0%) | 0 (0.0%) |
| Graduate Degree | 0 (0.0%) | 0 (0.0%) |
| Total | 0 (0.0%) | 0 (0.0%) |
Employment Characteristics in Boothbay Harbor
Employment by Class of Employer in Boothbay Harbor
Among the 476 employed individuals in Boothbay Harbor, private company employees (277 | 58.2%), self-employed (not incorporated) (65 | 13.7%), and state government employees (42 | 8.8%) make up the most common classes of employment.
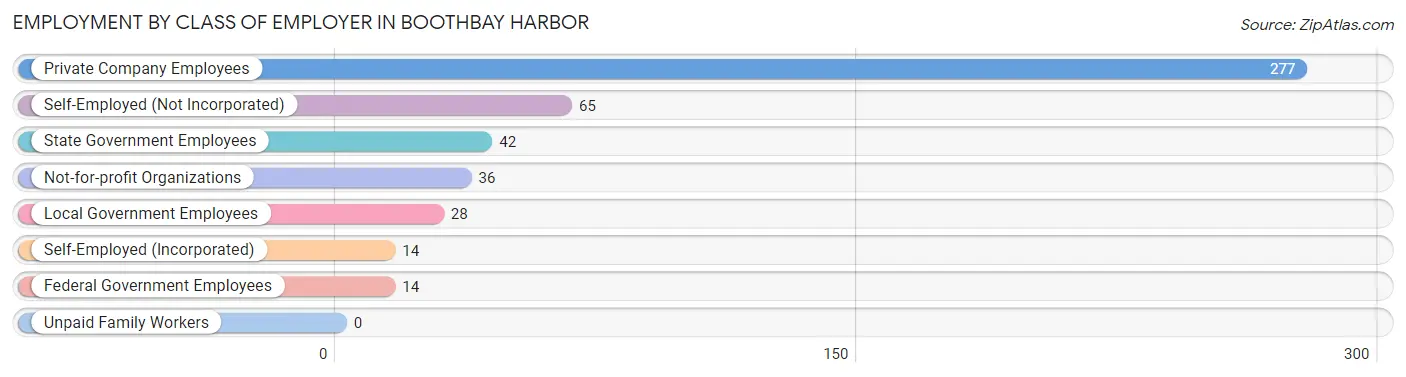
| Employer Class | # Employees | % Employees |
| Private Company Employees | 277 | 58.2% |
| Self-Employed (Incorporated) | 14 | 2.9% |
| Self-Employed (Not Incorporated) | 65 | 13.7% |
| Not-for-profit Organizations | 36 | 7.6% |
| Local Government Employees | 28 | 5.9% |
| State Government Employees | 42 | 8.8% |
| Federal Government Employees | 14 | 2.9% |
| Unpaid Family Workers | 0 | 0.0% |
| Total | 476 | 100.0% |
Employment Status by Age in Boothbay Harbor
According to the labor force statistics for Boothbay Harbor, out of the total population over 16 years of age (900), 54.9% or 494 individuals are in the labor force, with 1.8% or 9 of them unemployed. The age group with the highest labor force participation rate is 45 to 54 years, with 100.0% or 70 individuals in the labor force. Within the labor force, the 55 to 59 years age range has the highest percentage of unemployed individuals, with 8.3% or 5 of them being unemployed.
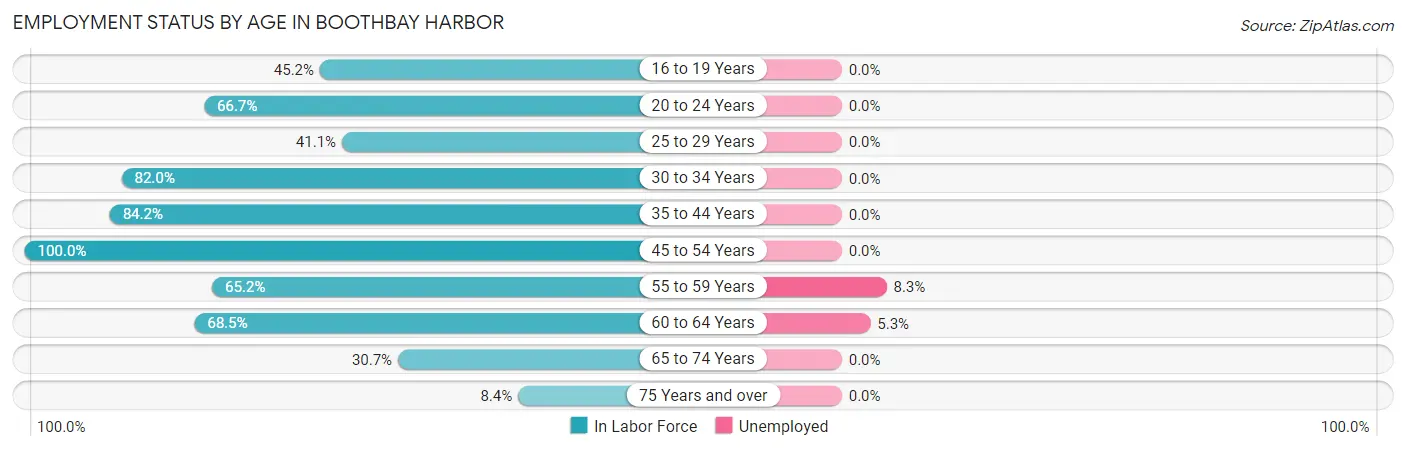
| Age Bracket | In Labor Force | Unemployed |
| 16 to 19 Years | 19 (45.2%) | 0 (0.0%) |
| 20 to 24 Years | 20 (66.7%) | 0 (0.0%) |
| 25 to 29 Years | 30 (41.1%) | 0 (0.0%) |
| 30 to 34 Years | 91 (82.0%) | 0 (0.0%) |
| 35 to 44 Years | 64 (84.2%) | 0 (0.0%) |
| 45 to 54 Years | 70 (100.0%) | 0 (0.0%) |
| 55 to 59 Years | 60 (65.2%) | 5 (8.3%) |
| 60 to 64 Years | 76 (68.5%) | 4 (5.3%) |
| 65 to 74 Years | 54 (30.7%) | 0 (0.0%) |
| 75 Years and over | 10 (8.4%) | 0 (0.0%) |
| Total | 494 (54.9%) | 9 (1.8%) |
Employment Status by Educational Attainment in Boothbay Harbor
According to labor force statistics for Boothbay Harbor, 73.4% of individuals (391) out of the total population between 25 and 64 years of age (533) are in the labor force, with 2.3% or 9 of them being unemployed. The group with the highest labor force participation rate are those with the educational attainment of bachelor's degree or higher, with 93.0% or 200 individuals in the labor force. Within the labor force, individuals with high school diploma education have the highest percentage of unemployment, with 3.0% or 4 of them being unemployed.
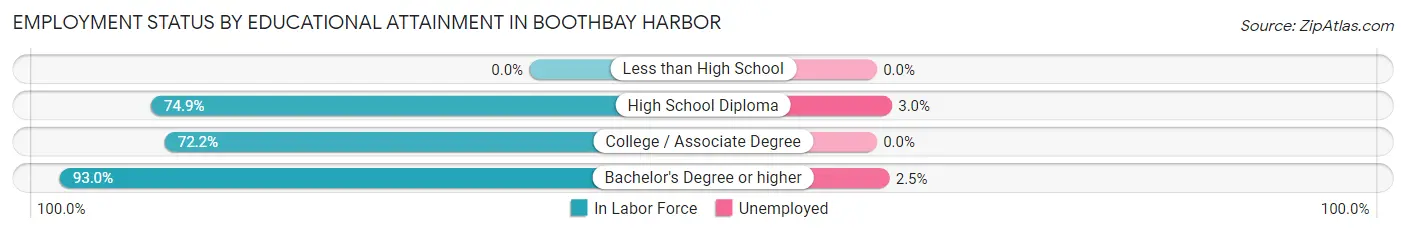
| Educational Attainment | In Labor Force | Unemployed |
| Less than High School | 0 (0.0%) | 0 (0.0%) |
| High School Diploma | 134 (74.9%) | 5 (3.0%) |
| College / Associate Degree | 57 (72.2%) | 0 (0.0%) |
| Bachelor's Degree or higher | 200 (93.0%) | 5 (2.5%) |
| Total | 391 (73.4%) | 12 (2.3%) |
Employment Occupations by Sex in Boothbay Harbor
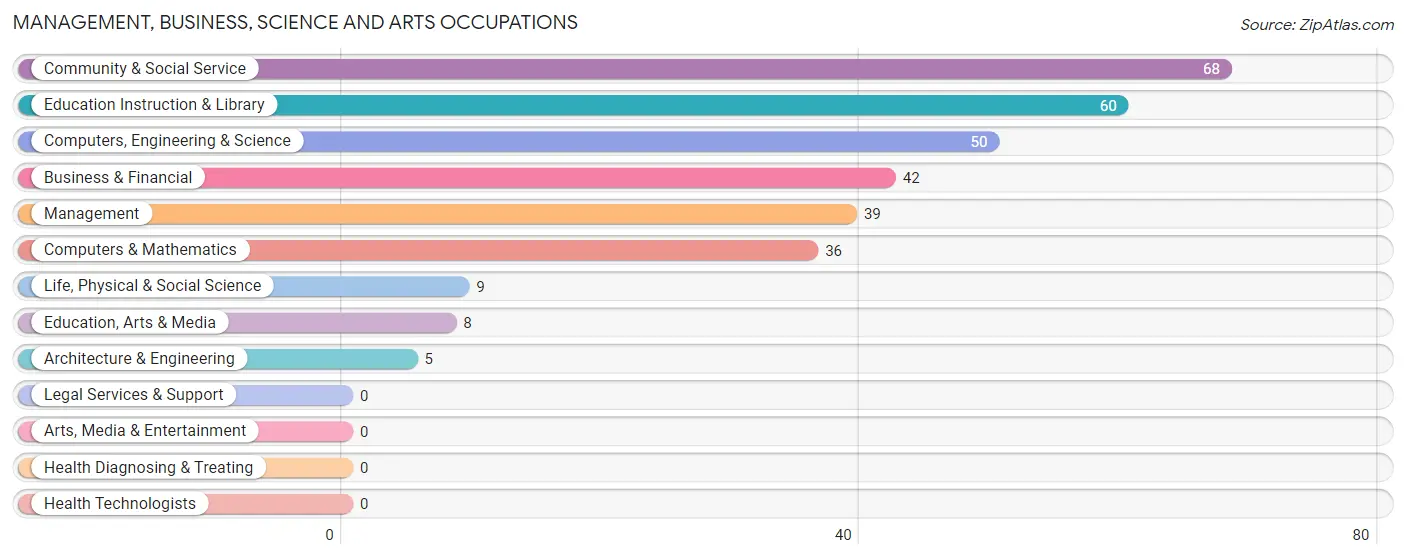
Management, Business, Science and Arts Occupations
The most common Management, Business, Science and Arts occupations in Boothbay Harbor are Community & Social Service (68 | 14.0%), Education Instruction & Library (60 | 12.4%), Computers, Engineering & Science (50 | 10.3%), Business & Financial (42 | 8.7%), and Management (39 | 8.0%).
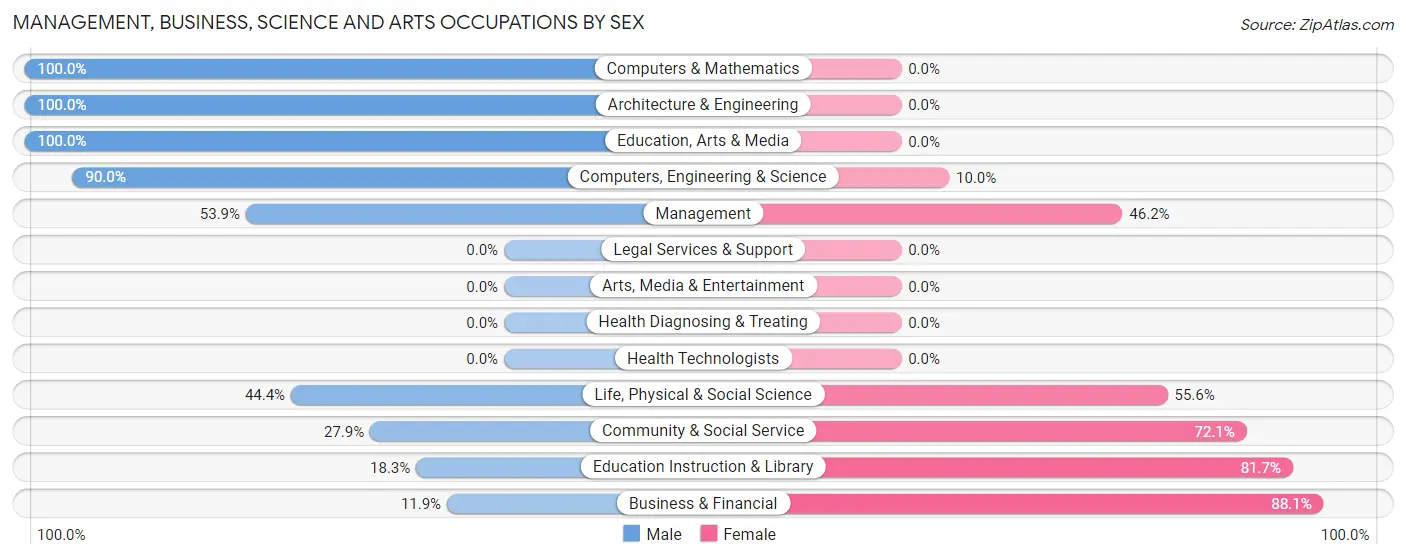
Management, Business, Science and Arts Occupations by Sex
Within the Management, Business, Science and Arts occupations in Boothbay Harbor, the most male-oriented occupations are Computers & Mathematics (100.0%), Architecture & Engineering (100.0%), and Education, Arts & Media (100.0%), while the most female-oriented occupations are Business & Financial (88.1%), Education Instruction & Library (81.7%), and Community & Social Service (72.1%).
| Occupation | Male | Female |
| Management | 21 (53.8%) | 18 (46.2%) |
| Business & Financial | 5 (11.9%) | 37 (88.1%) |
| Computers, Engineering & Science | 45 (90.0%) | 5 (10.0%) |
| Computers & Mathematics | 36 (100.0%) | 0 (0.0%) |
| Architecture & Engineering | 5 (100.0%) | 0 (0.0%) |
| Life, Physical & Social Science | 4 (44.4%) | 5 (55.6%) |
| Community & Social Service | 19 (27.9%) | 49 (72.1%) |
| Education, Arts & Media | 8 (100.0%) | 0 (0.0%) |
| Legal Services & Support | 0 (0.0%) | 0 (0.0%) |
| Education Instruction & Library | 11 (18.3%) | 49 (81.7%) |
| Arts, Media & Entertainment | 0 (0.0%) | 0 (0.0%) |
| Health Diagnosing & Treating | 0 (0.0%) | 0 (0.0%) |
| Health Technologists | 0 (0.0%) | 0 (0.0%) |
| Total (Category) | 90 (45.2%) | 109 (54.8%) |
| Total (Overall) | 210 (43.3%) | 275 (56.7%) |
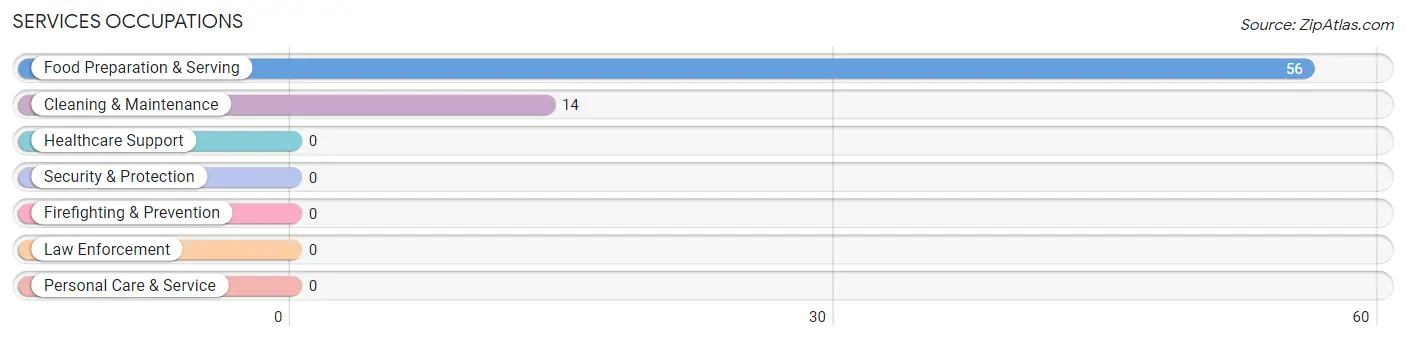
Services Occupations
The most common Services occupations in Boothbay Harbor are Food Preparation & Serving (56 | 11.6%), and Cleaning & Maintenance (14 | 2.9%).
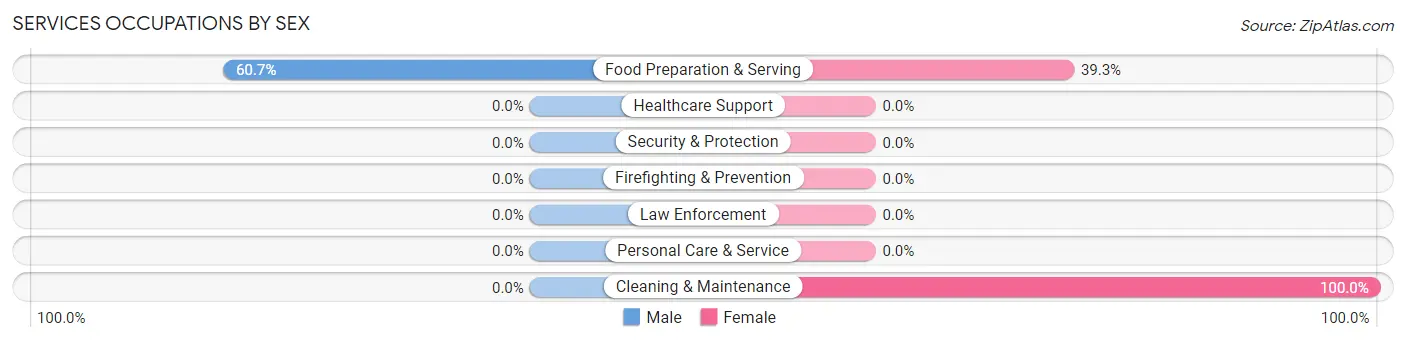
Services Occupations by Sex
| Occupation | Male | Female |
| Healthcare Support | 0 (0.0%) | 0 (0.0%) |
| Security & Protection | 0 (0.0%) | 0 (0.0%) |
| Firefighting & Prevention | 0 (0.0%) | 0 (0.0%) |
| Law Enforcement | 0 (0.0%) | 0 (0.0%) |
| Food Preparation & Serving | 34 (60.7%) | 22 (39.3%) |
| Cleaning & Maintenance | 0 (0.0%) | 14 (100.0%) |
| Personal Care & Service | 0 (0.0%) | 0 (0.0%) |
| Total (Category) | 34 (48.6%) | 36 (51.4%) |
| Total (Overall) | 210 (43.3%) | 275 (56.7%) |
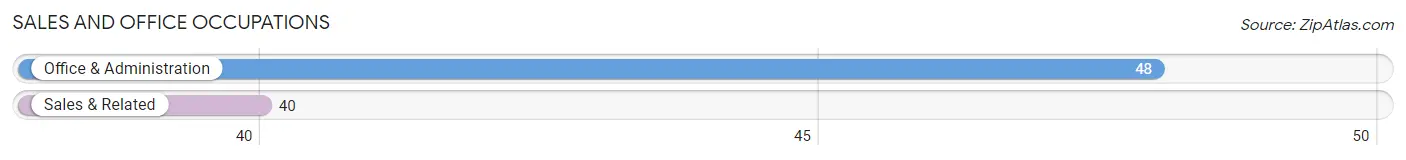
Sales and Office Occupations
The most common Sales and Office occupations in Boothbay Harbor are Office & Administration (48 | 9.9%), and Sales & Related (40 | 8.3%).
Sales and Office Occupations by Sex
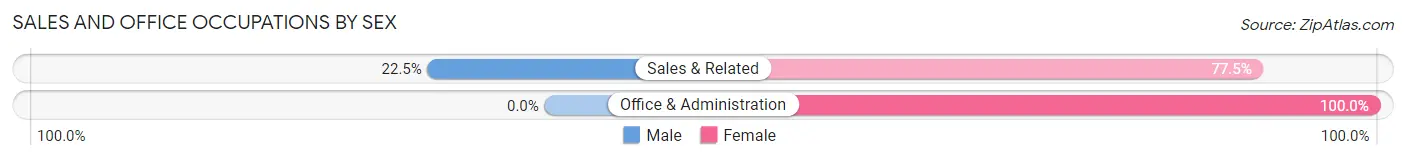
| Occupation | Male | Female |
| Sales & Related | 9 (22.5%) | 31 (77.5%) |
| Office & Administration | 0 (0.0%) | 48 (100.0%) |
| Total (Category) | 9 (10.2%) | 79 (89.8%) |
| Total (Overall) | 210 (43.3%) | 275 (56.7%) |
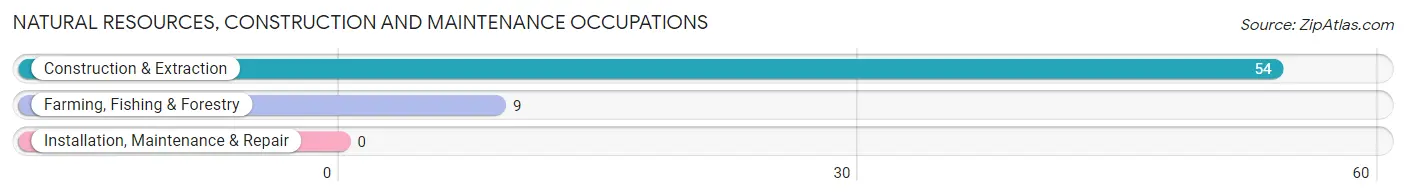
Natural Resources, Construction and Maintenance Occupations
The most common Natural Resources, Construction and Maintenance occupations in Boothbay Harbor are Construction & Extraction (54 | 11.1%), and Farming, Fishing & Forestry (9 | 1.9%).
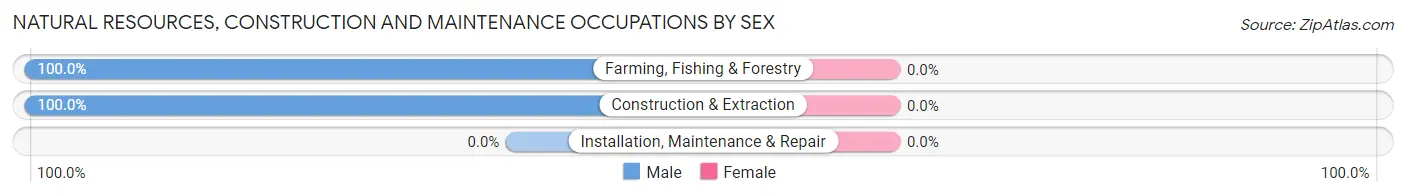
Natural Resources, Construction and Maintenance Occupations by Sex
| Occupation | Male | Female |
| Farming, Fishing & Forestry | 9 (100.0%) | 0 (0.0%) |
| Construction & Extraction | 54 (100.0%) | 0 (0.0%) |
| Installation, Maintenance & Repair | 0 (0.0%) | 0 (0.0%) |
| Total (Category) | 63 (100.0%) | 0 (0.0%) |
| Total (Overall) | 210 (43.3%) | 275 (56.7%) |
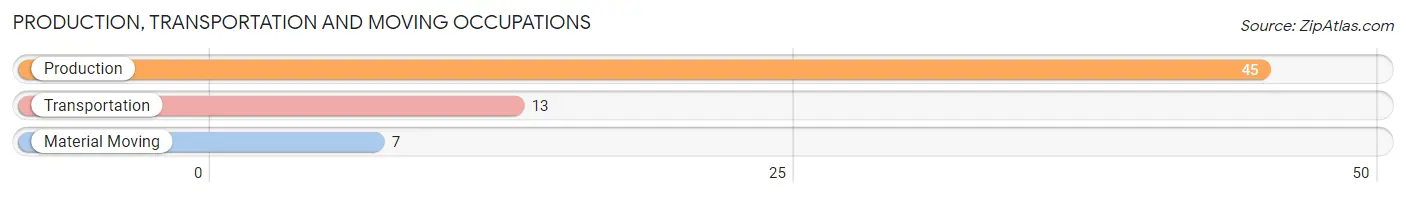
Production, Transportation and Moving Occupations
The most common Production, Transportation and Moving occupations in Boothbay Harbor are Production (45 | 9.3%), Transportation (13 | 2.7%), and Material Moving (7 | 1.4%).
Production, Transportation and Moving Occupations by Sex
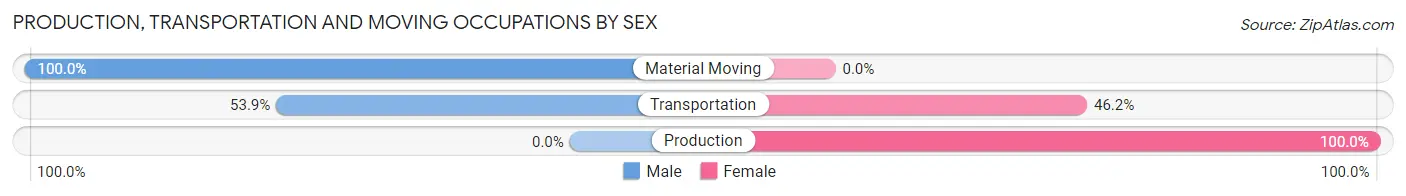
| Occupation | Male | Female |
| Production | 0 (0.0%) | 45 (100.0%) |
| Transportation | 7 (53.8%) | 6 (46.2%) |
| Material Moving | 7 (100.0%) | 0 (0.0%) |
| Total (Category) | 14 (21.5%) | 51 (78.5%) |
| Total (Overall) | 210 (43.3%) | 275 (56.7%) |
Employment Industries by Sex in Boothbay Harbor
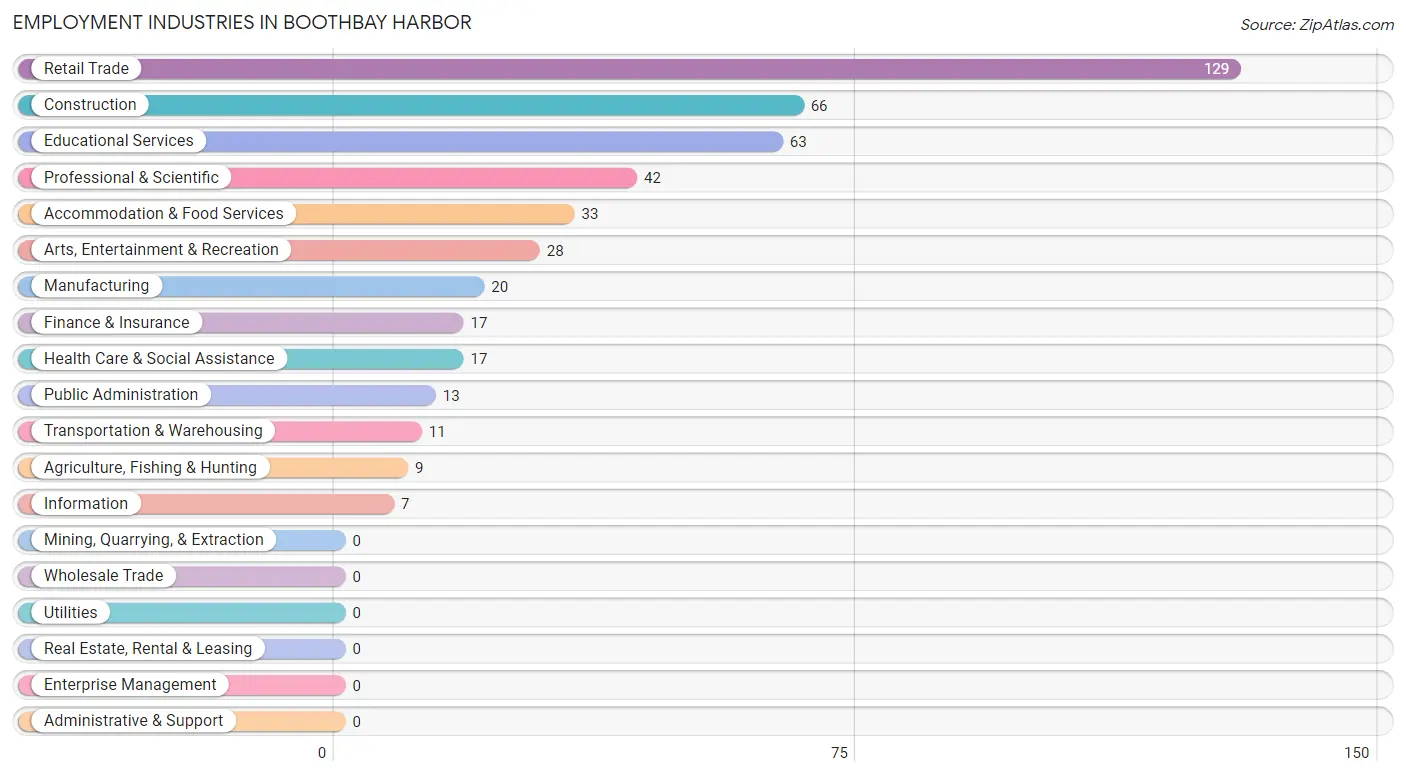
Employment Industries in Boothbay Harbor
The major employment industries in Boothbay Harbor include Retail Trade (129 | 26.6%), Construction (66 | 13.6%), Educational Services (63 | 13.0%), Professional & Scientific (42 | 8.7%), and Accommodation & Food Services (33 | 6.8%).
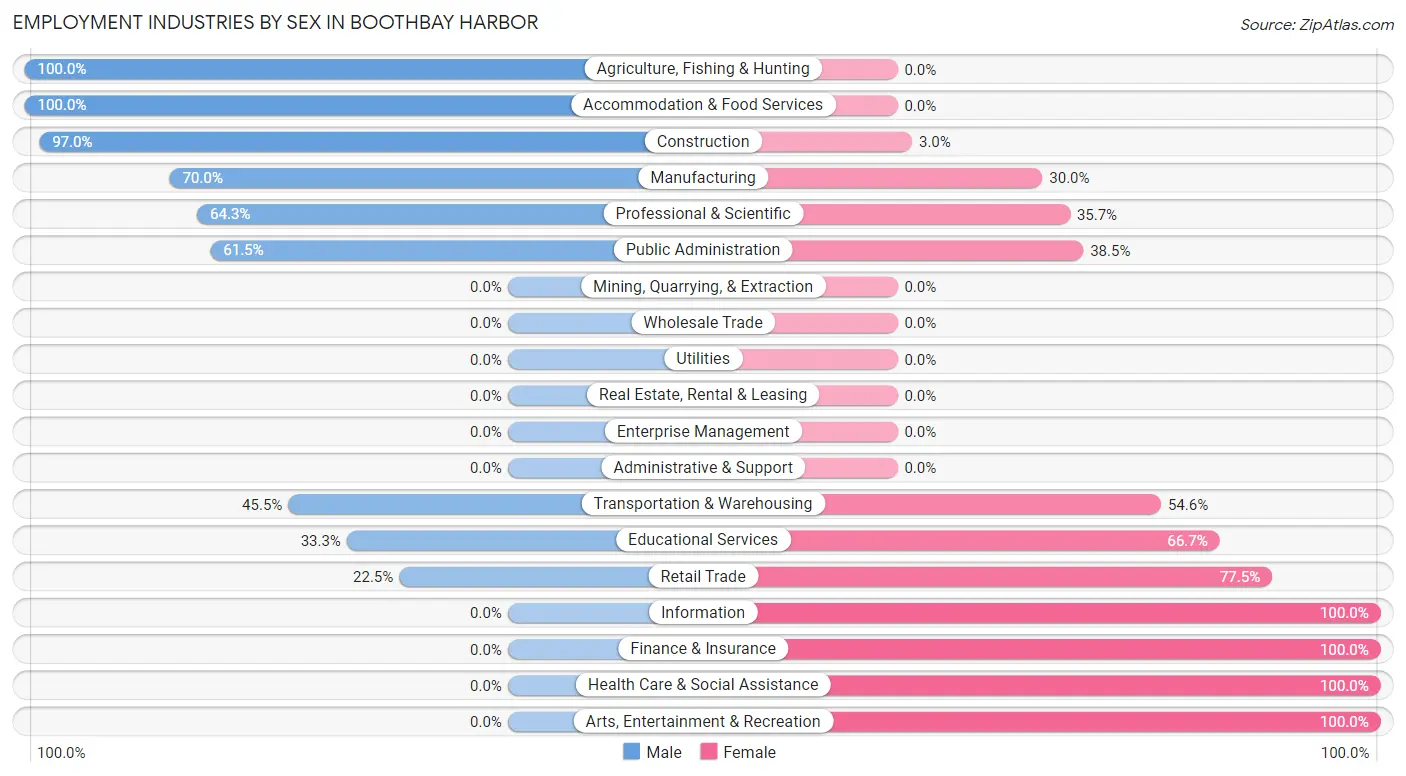
Employment Industries by Sex in Boothbay Harbor
The Boothbay Harbor industries that see more men than women are Agriculture, Fishing & Hunting (100.0%), Accommodation & Food Services (100.0%), and Construction (97.0%), whereas the industries that tend to have a higher number of women are Information (100.0%), Finance & Insurance (100.0%), and Health Care & Social Assistance (100.0%).
| Industry | Male | Female |
| Agriculture, Fishing & Hunting | 9 (100.0%) | 0 (0.0%) |
| Mining, Quarrying, & Extraction | 0 (0.0%) | 0 (0.0%) |
| Construction | 64 (97.0%) | 2 (3.0%) |
| Manufacturing | 14 (70.0%) | 6 (30.0%) |
| Wholesale Trade | 0 (0.0%) | 0 (0.0%) |
| Retail Trade | 29 (22.5%) | 100 (77.5%) |
| Transportation & Warehousing | 5 (45.5%) | 6 (54.5%) |
| Utilities | 0 (0.0%) | 0 (0.0%) |
| Information | 0 (0.0%) | 7 (100.0%) |
| Finance & Insurance | 0 (0.0%) | 17 (100.0%) |
| Real Estate, Rental & Leasing | 0 (0.0%) | 0 (0.0%) |
| Professional & Scientific | 27 (64.3%) | 15 (35.7%) |
| Enterprise Management | 0 (0.0%) | 0 (0.0%) |
| Administrative & Support | 0 (0.0%) | 0 (0.0%) |
| Educational Services | 21 (33.3%) | 42 (66.7%) |
| Health Care & Social Assistance | 0 (0.0%) | 17 (100.0%) |
| Arts, Entertainment & Recreation | 0 (0.0%) | 28 (100.0%) |
| Accommodation & Food Services | 33 (100.0%) | 0 (0.0%) |
| Public Administration | 8 (61.5%) | 5 (38.5%) |
| Total | 210 (43.3%) | 275 (56.7%) |
Education in Boothbay Harbor
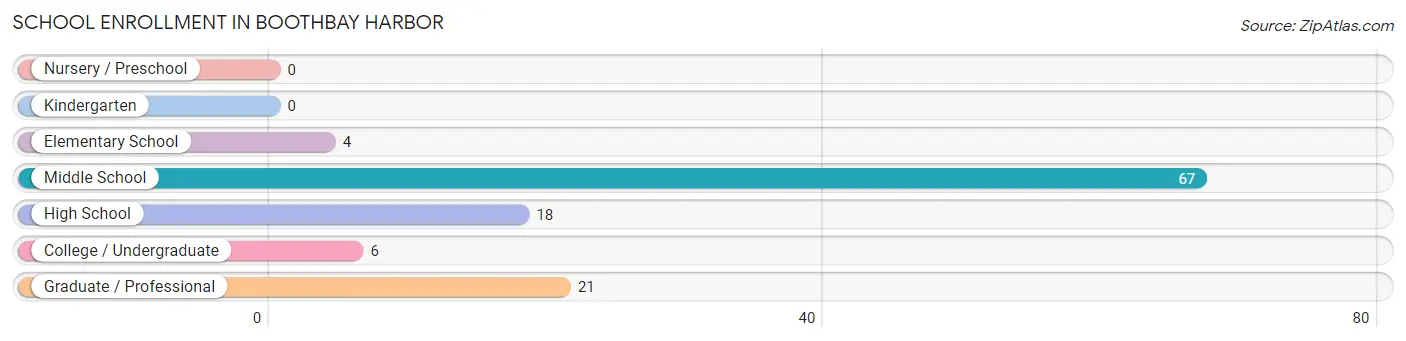
School Enrollment in Boothbay Harbor
The most common levels of schooling among the 116 students in Boothbay Harbor are middle school (67 | 57.8%), graduate / professional (21 | 18.1%), and high school (18 | 15.5%).
| School Level | # Students | % Students |
| Nursery / Preschool | 0 | 0.0% |
| Kindergarten | 0 | 0.0% |
| Elementary School | 4 | 3.5% |
| Middle School | 67 | 57.8% |
| High School | 18 | 15.5% |
| College / Undergraduate | 6 | 5.2% |
| Graduate / Professional | 21 | 18.1% |
| Total | 116 | 100.0% |
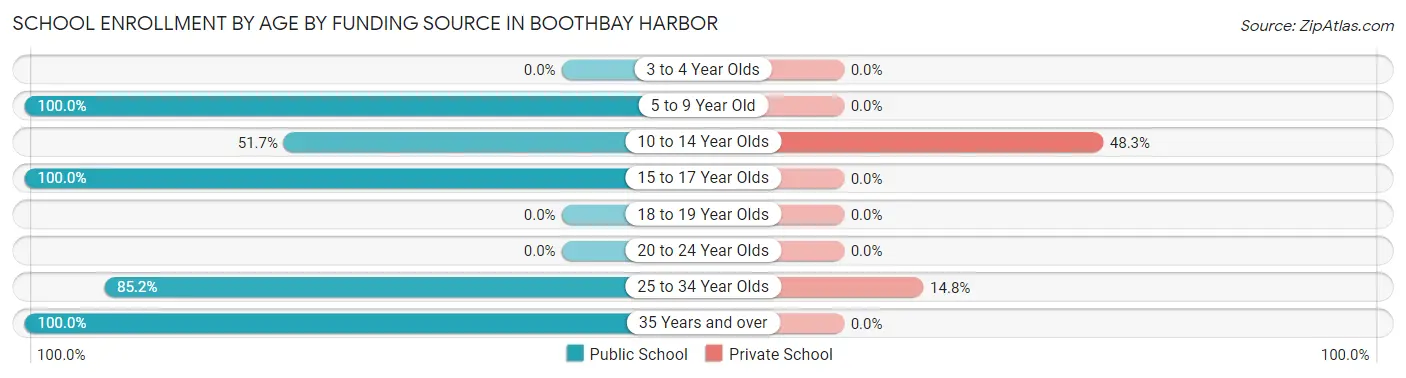
School Enrollment by Age by Funding Source in Boothbay Harbor
Out of a total of 116 students who are enrolled in schools in Boothbay Harbor, 32 (27.6%) attend a private institution, while the remaining 84 (72.4%) are enrolled in public schools. The age group of 10 to 14 year olds has the highest likelihood of being enrolled in private schools, with 28 (48.3% in the age bracket) enrolled. Conversely, the age group of 5 to 9 year old has the lowest likelihood of being enrolled in a private school, with 4 (100.0% in the age bracket) attending a public institution.
| Age Bracket | Public School | Private School |
| 3 to 4 Year Olds | 0 (0.0%) | 0 (0.0%) |
| 5 to 9 Year Old | 4 (100.0%) | 0 (0.0%) |
| 10 to 14 Year Olds | 30 (51.7%) | 28 (48.3%) |
| 15 to 17 Year Olds | 25 (100.0%) | 0 (0.0%) |
| 18 to 19 Year Olds | 0 (0.0%) | 0 (0.0%) |
| 20 to 24 Year Olds | 0 (0.0%) | 0 (0.0%) |
| 25 to 34 Year Olds | 23 (85.2%) | 4 (14.8%) |
| 35 Years and over | 2 (100.0%) | 0 (0.0%) |
| Total | 84 (72.4%) | 32 (27.6%) |
Educational Attainment by Field of Study in Boothbay Harbor
Business (110 | 24.0%), communications (68 | 14.8%), visual & performing arts (62 | 13.5%), social sciences (53 | 11.6%), and education (47 | 10.2%) are the most common fields of study among 459 individuals in Boothbay Harbor who have obtained a bachelor's degree or higher.
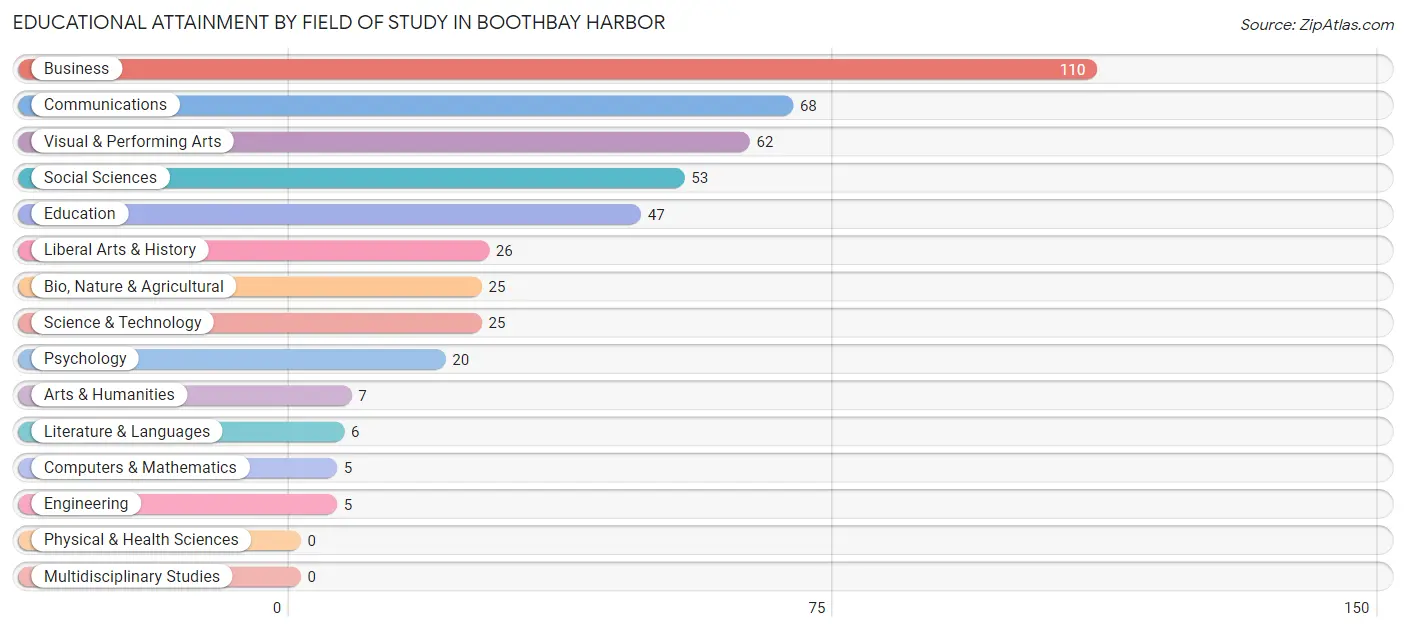
| Field of Study | # Graduates | % Graduates |
| Computers & Mathematics | 5 | 1.1% |
| Bio, Nature & Agricultural | 25 | 5.4% |
| Physical & Health Sciences | 0 | 0.0% |
| Psychology | 20 | 4.4% |
| Social Sciences | 53 | 11.6% |
| Engineering | 5 | 1.1% |
| Multidisciplinary Studies | 0 | 0.0% |
| Science & Technology | 25 | 5.4% |
| Business | 110 | 24.0% |
| Education | 47 | 10.2% |
| Literature & Languages | 6 | 1.3% |
| Liberal Arts & History | 26 | 5.7% |
| Visual & Performing Arts | 62 | 13.5% |
| Communications | 68 | 14.8% |
| Arts & Humanities | 7 | 1.5% |
| Total | 459 | 100.0% |
Transportation & Commute in Boothbay Harbor
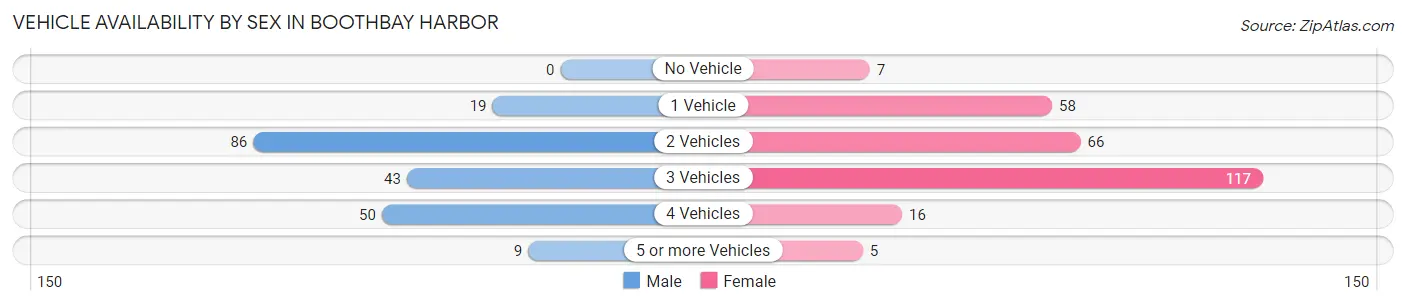
Vehicle Availability by Sex in Boothbay Harbor
The most prevalent vehicle ownership categories in Boothbay Harbor are males with 2 vehicles (86, accounting for 41.5%) and females with 2 vehicles (66, making up 32.0%).
| Vehicles Available | Male | Female |
| No Vehicle | 0 (0.0%) | 7 (2.6%) |
| 1 Vehicle | 19 (9.2%) | 58 (21.6%) |
| 2 Vehicles | 86 (41.5%) | 66 (24.5%) |
| 3 Vehicles | 43 (20.8%) | 117 (43.5%) |
| 4 Vehicles | 50 (24.1%) | 16 (5.9%) |
| 5 or more Vehicles | 9 (4.3%) | 5 (1.9%) |
| Total | 207 (100.0%) | 269 (100.0%) |
Commute Time in Boothbay Harbor
The most frequently occuring commute durations in Boothbay Harbor are 5 to 9 minutes (140 commuters, 33.8%), 10 to 14 minutes (74 commuters, 17.9%), and 20 to 24 minutes (48 commuters, 11.6%).
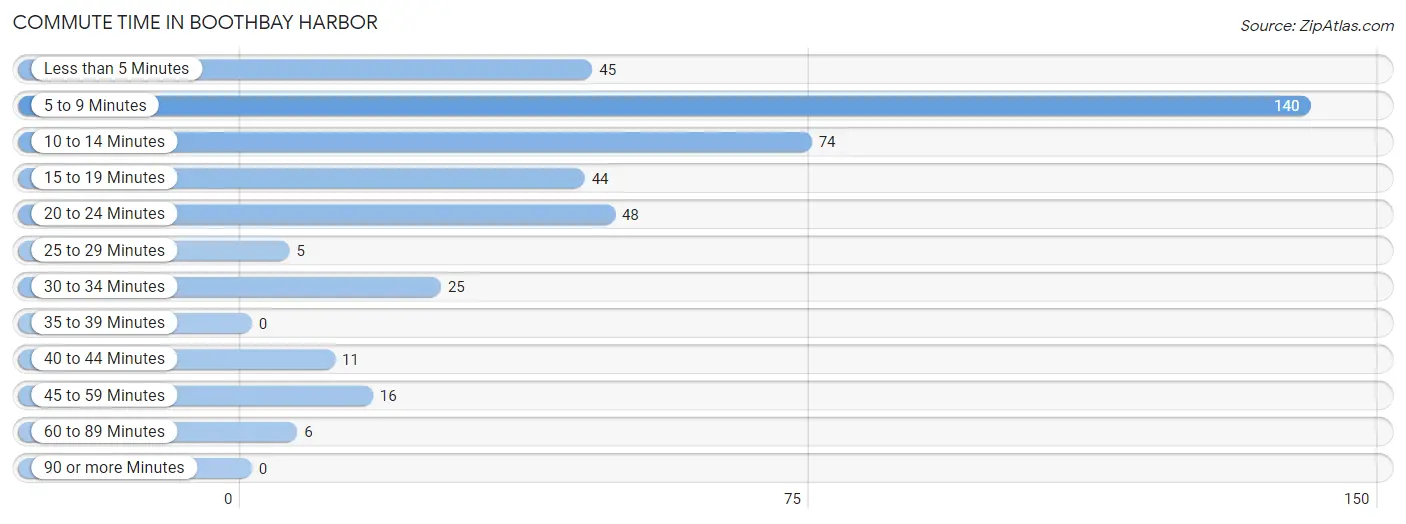
| Commute Time | # Commuters | % Commuters |
| Less than 5 Minutes | 45 | 10.9% |
| 5 to 9 Minutes | 140 | 33.8% |
| 10 to 14 Minutes | 74 | 17.9% |
| 15 to 19 Minutes | 44 | 10.6% |
| 20 to 24 Minutes | 48 | 11.6% |
| 25 to 29 Minutes | 5 | 1.2% |
| 30 to 34 Minutes | 25 | 6.0% |
| 35 to 39 Minutes | 0 | 0.0% |
| 40 to 44 Minutes | 11 | 2.7% |
| 45 to 59 Minutes | 16 | 3.9% |
| 60 to 89 Minutes | 6 | 1.5% |
| 90 or more Minutes | 0 | 0.0% |
Commute Time by Sex in Boothbay Harbor
The most common commute times in Boothbay Harbor are 5 to 9 minutes (69 commuters, 35.4%) for males and 5 to 9 minutes (71 commuters, 32.4%) for females.
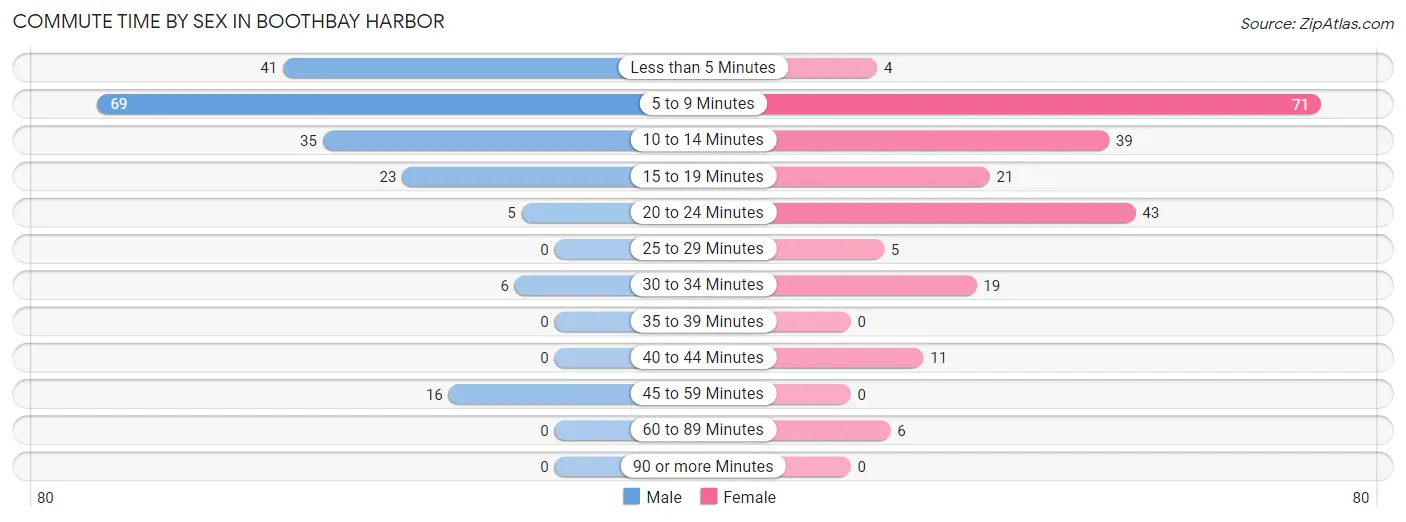
| Commute Time | Male | Female |
| Less than 5 Minutes | 41 (21.0%) | 4 (1.8%) |
| 5 to 9 Minutes | 69 (35.4%) | 71 (32.4%) |
| 10 to 14 Minutes | 35 (17.9%) | 39 (17.8%) |
| 15 to 19 Minutes | 23 (11.8%) | 21 (9.6%) |
| 20 to 24 Minutes | 5 (2.6%) | 43 (19.6%) |
| 25 to 29 Minutes | 0 (0.0%) | 5 (2.3%) |
| 30 to 34 Minutes | 6 (3.1%) | 19 (8.7%) |
| 35 to 39 Minutes | 0 (0.0%) | 0 (0.0%) |
| 40 to 44 Minutes | 0 (0.0%) | 11 (5.0%) |
| 45 to 59 Minutes | 16 (8.2%) | 0 (0.0%) |
| 60 to 89 Minutes | 0 (0.0%) | 6 (2.7%) |
| 90 or more Minutes | 0 (0.0%) | 0 (0.0%) |
Time of Departure to Work by Sex in Boothbay Harbor
The most frequent times of departure to work in Boothbay Harbor are 6:00 AM to 6:29 AM (51, 26.2%) for males and 8:30 AM to 8:59 AM (75, 34.3%) for females.
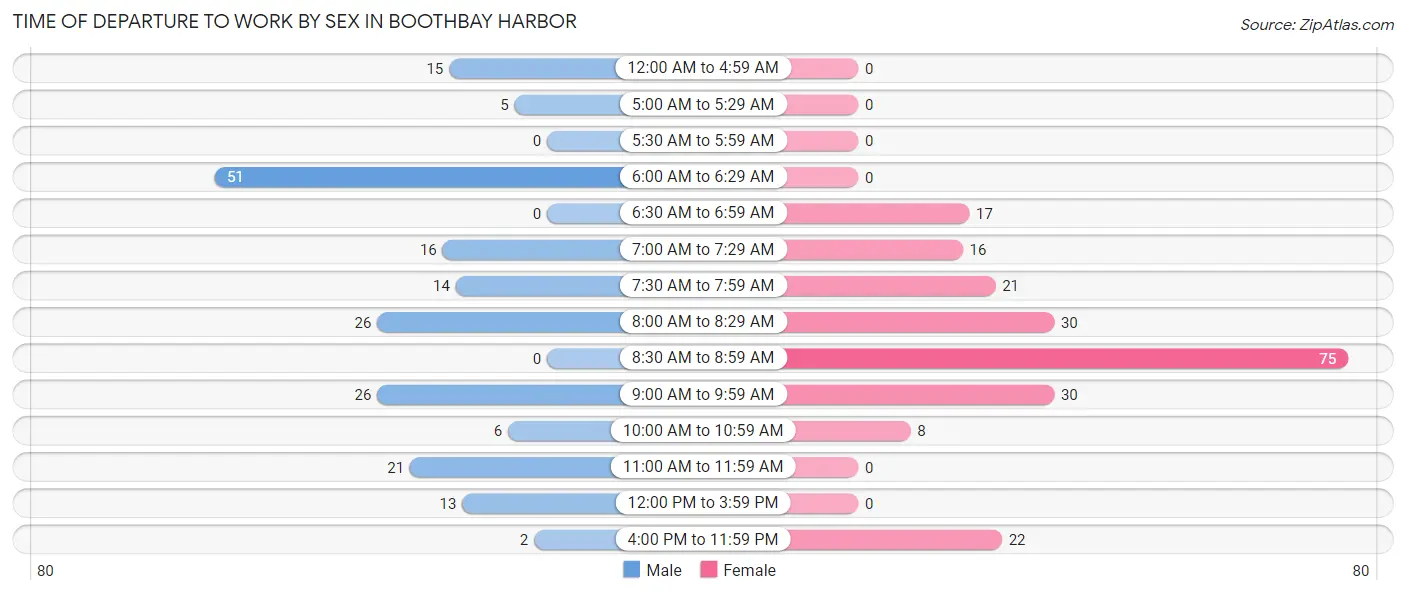
| Time of Departure | Male | Female |
| 12:00 AM to 4:59 AM | 15 (7.7%) | 0 (0.0%) |
| 5:00 AM to 5:29 AM | 5 (2.6%) | 0 (0.0%) |
| 5:30 AM to 5:59 AM | 0 (0.0%) | 0 (0.0%) |
| 6:00 AM to 6:29 AM | 51 (26.2%) | 0 (0.0%) |
| 6:30 AM to 6:59 AM | 0 (0.0%) | 17 (7.8%) |
| 7:00 AM to 7:29 AM | 16 (8.2%) | 16 (7.3%) |
| 7:30 AM to 7:59 AM | 14 (7.2%) | 21 (9.6%) |
| 8:00 AM to 8:29 AM | 26 (13.3%) | 30 (13.7%) |
| 8:30 AM to 8:59 AM | 0 (0.0%) | 75 (34.3%) |
| 9:00 AM to 9:59 AM | 26 (13.3%) | 30 (13.7%) |
| 10:00 AM to 10:59 AM | 6 (3.1%) | 8 (3.6%) |
| 11:00 AM to 11:59 AM | 21 (10.8%) | 0 (0.0%) |
| 12:00 PM to 3:59 PM | 13 (6.7%) | 0 (0.0%) |
| 4:00 PM to 11:59 PM | 2 (1.0%) | 22 (10.1%) |
| Total | 195 (100.0%) | 219 (100.0%) |
Housing Occupancy in Boothbay Harbor
Occupancy by Ownership in Boothbay Harbor
Of the total 470 dwellings in Boothbay Harbor, owner-occupied units account for 337 (71.7%), while renter-occupied units make up 133 (28.3%).
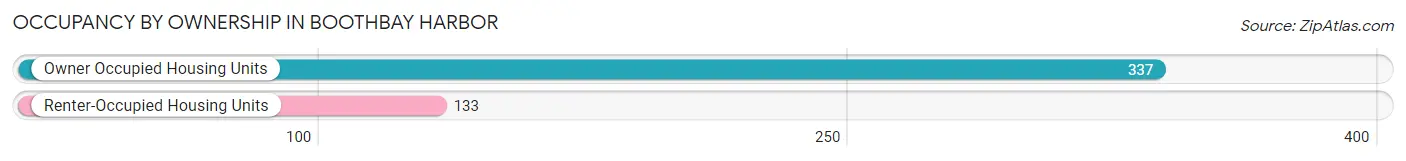
| Occupancy | # Housing Units | % Housing Units |
| Owner Occupied Housing Units | 337 | 71.7% |
| Renter-Occupied Housing Units | 133 | 28.3% |
| Total Occupied Housing Units | 470 | 100.0% |
Occupancy by Household Size in Boothbay Harbor
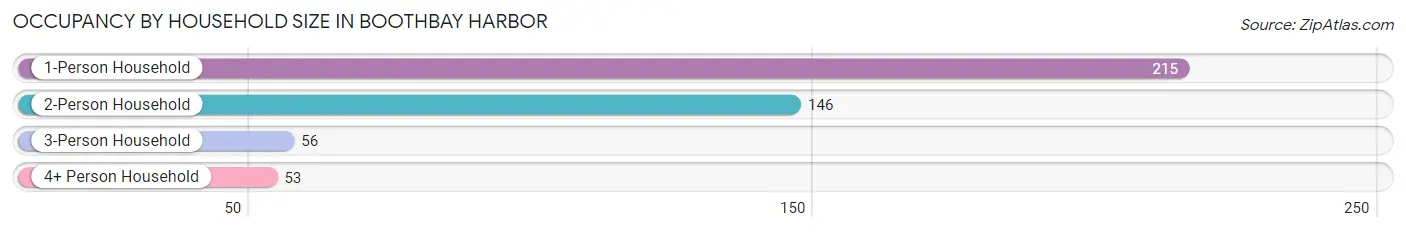
| Household Size | # Housing Units | % Housing Units |
| 1-Person Household | 215 | 45.7% |
| 2-Person Household | 146 | 31.1% |
| 3-Person Household | 56 | 11.9% |
| 4+ Person Household | 53 | 11.3% |
| Total Housing Units | 470 | 100.0% |
Occupancy by Ownership by Household Size in Boothbay Harbor
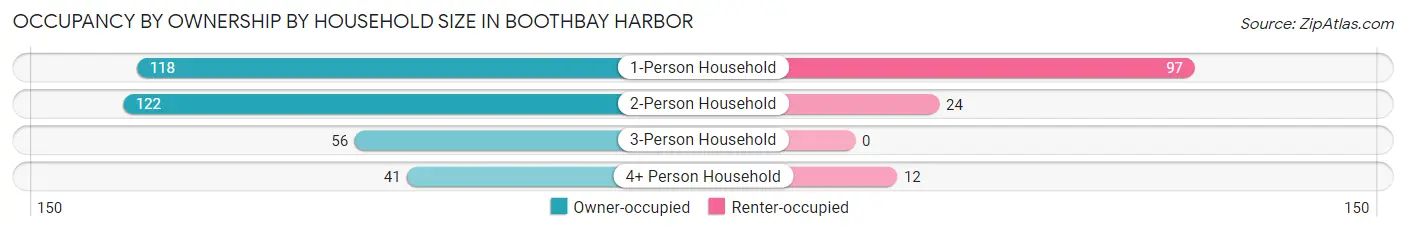
| Household Size | Owner-occupied | Renter-occupied |
| 1-Person Household | 118 (54.9%) | 97 (45.1%) |
| 2-Person Household | 122 (83.6%) | 24 (16.4%) |
| 3-Person Household | 56 (100.0%) | 0 (0.0%) |
| 4+ Person Household | 41 (77.4%) | 12 (22.6%) |
| Total Housing Units | 337 (71.7%) | 133 (28.3%) |
Occupancy by Educational Attainment in Boothbay Harbor
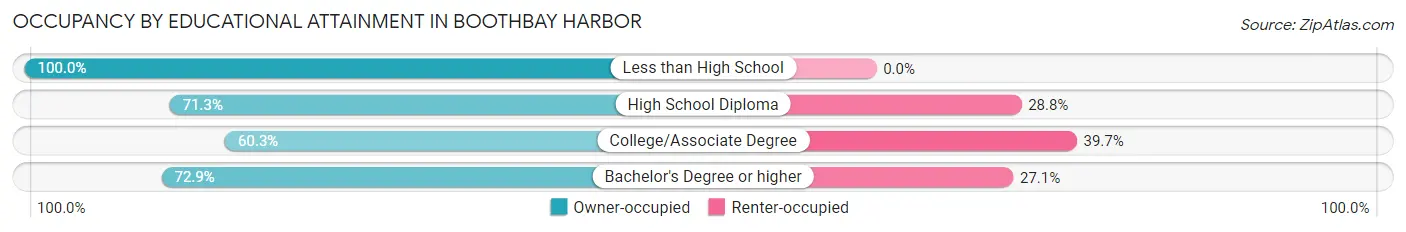
| Household Size | Owner-occupied | Renter-occupied |
| Less than High School | 50 (100.0%) | 0 (0.0%) |
| High School Diploma | 57 (71.3%) | 23 (28.7%) |
| College/Associate Degree | 85 (60.3%) | 56 (39.7%) |
| Bachelor's Degree or higher | 145 (72.9%) | 54 (27.1%) |
Occupancy by Age of Householder in Boothbay Harbor
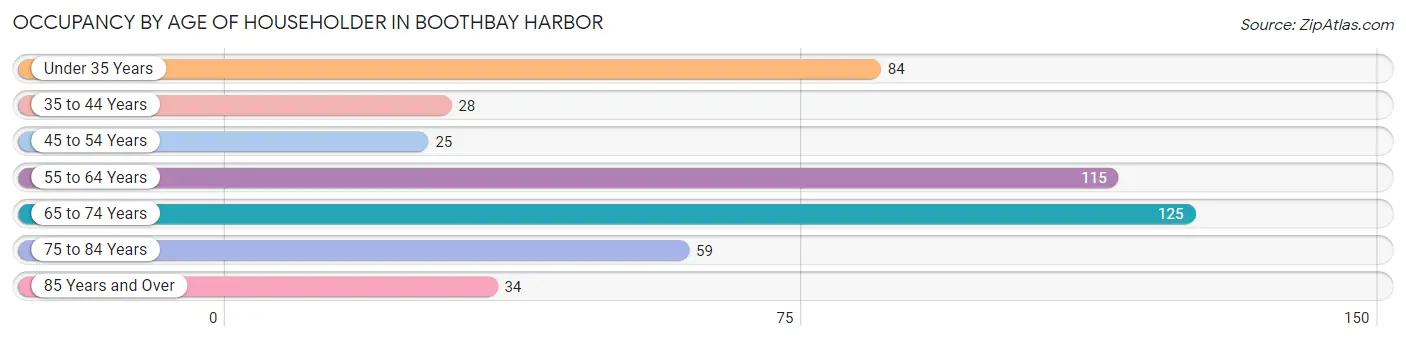
| Age Bracket | # Households | % Households |
| Under 35 Years | 84 | 17.9% |
| 35 to 44 Years | 28 | 6.0% |
| 45 to 54 Years | 25 | 5.3% |
| 55 to 64 Years | 115 | 24.5% |
| 65 to 74 Years | 125 | 26.6% |
| 75 to 84 Years | 59 | 12.6% |
| 85 Years and Over | 34 | 7.2% |
| Total | 470 | 100.0% |
Housing Finances in Boothbay Harbor
Median Income by Occupancy in Boothbay Harbor
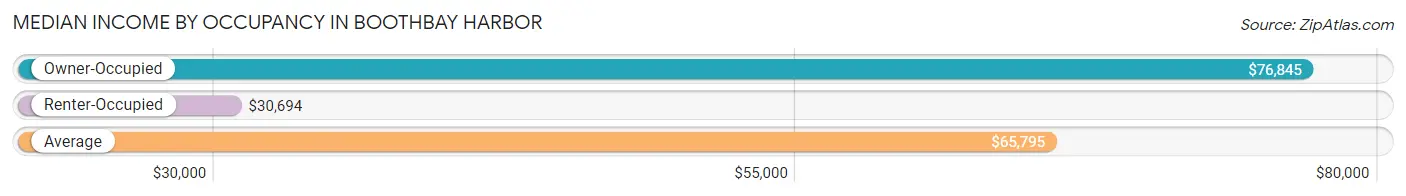
| Occupancy Type | # Households | Median Income |
| Owner-Occupied | 337 (71.7%) | $76,845 |
| Renter-Occupied | 133 (28.3%) | $30,694 |
| Average | 470 (100.0%) | $65,795 |
Occupancy by Householder Income Bracket in Boothbay Harbor
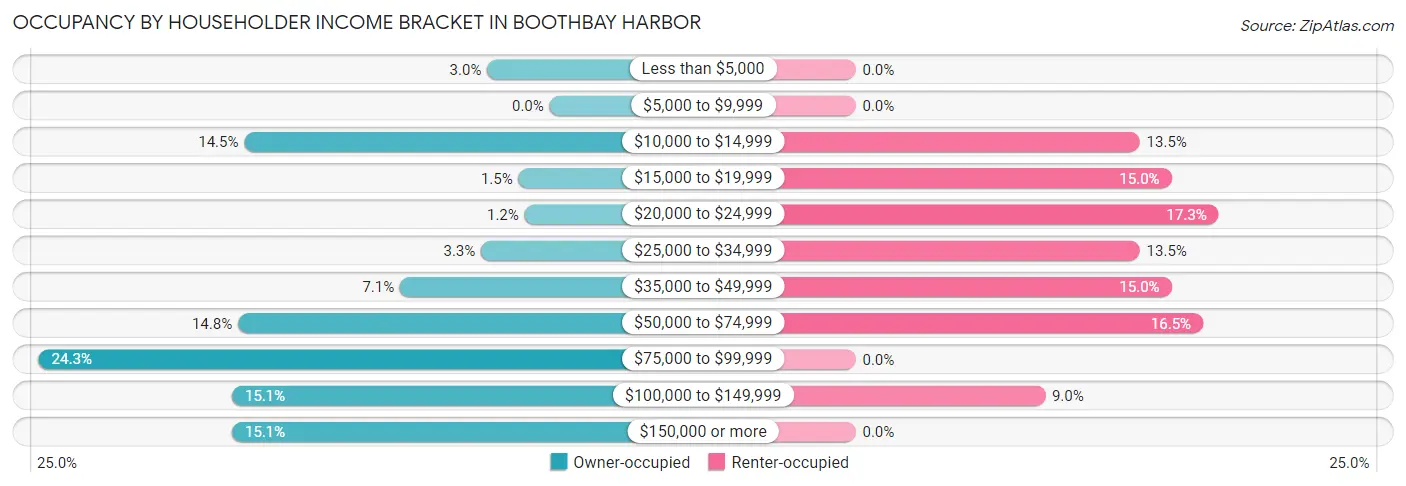
| Income Bracket | Owner-occupied | Renter-occupied |
| Less than $5,000 | 10 (3.0%) | 0 (0.0%) |
| $5,000 to $9,999 | 0 (0.0%) | 0 (0.0%) |
| $10,000 to $14,999 | 49 (14.5%) | 18 (13.5%) |
| $15,000 to $19,999 | 5 (1.5%) | 20 (15.0%) |
| $20,000 to $24,999 | 4 (1.2%) | 23 (17.3%) |
| $25,000 to $34,999 | 11 (3.3%) | 18 (13.5%) |
| $35,000 to $49,999 | 24 (7.1%) | 20 (15.0%) |
| $50,000 to $74,999 | 50 (14.8%) | 22 (16.5%) |
| $75,000 to $99,999 | 82 (24.3%) | 0 (0.0%) |
| $100,000 to $149,999 | 51 (15.1%) | 12 (9.0%) |
| $150,000 or more | 51 (15.1%) | 0 (0.0%) |
| Total | 337 (100.0%) | 133 (100.0%) |
Monthly Housing Cost Tiers in Boothbay Harbor
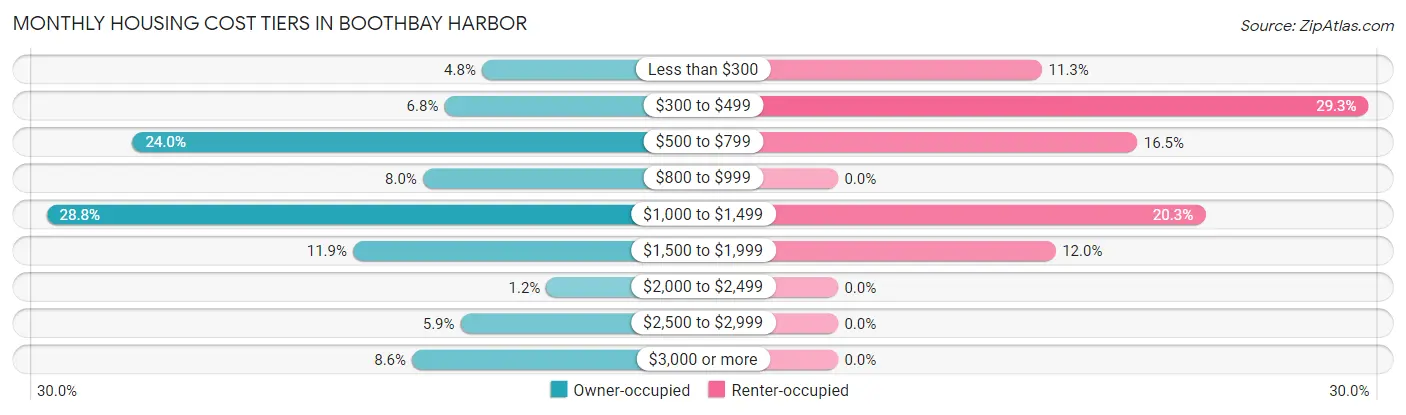
| Monthly Cost | Owner-occupied | Renter-occupied |
| Less than $300 | 16 (4.8%) | 15 (11.3%) |
| $300 to $499 | 23 (6.8%) | 39 (29.3%) |
| $500 to $799 | 81 (24.0%) | 22 (16.5%) |
| $800 to $999 | 27 (8.0%) | 0 (0.0%) |
| $1,000 to $1,499 | 97 (28.8%) | 27 (20.3%) |
| $1,500 to $1,999 | 40 (11.9%) | 16 (12.0%) |
| $2,000 to $2,499 | 4 (1.2%) | 0 (0.0%) |
| $2,500 to $2,999 | 20 (5.9%) | 0 (0.0%) |
| $3,000 or more | 29 (8.6%) | 0 (0.0%) |
| Total | 337 (100.0%) | 133 (100.0%) |
Physical Housing Characteristics in Boothbay Harbor
Housing Structures in Boothbay Harbor
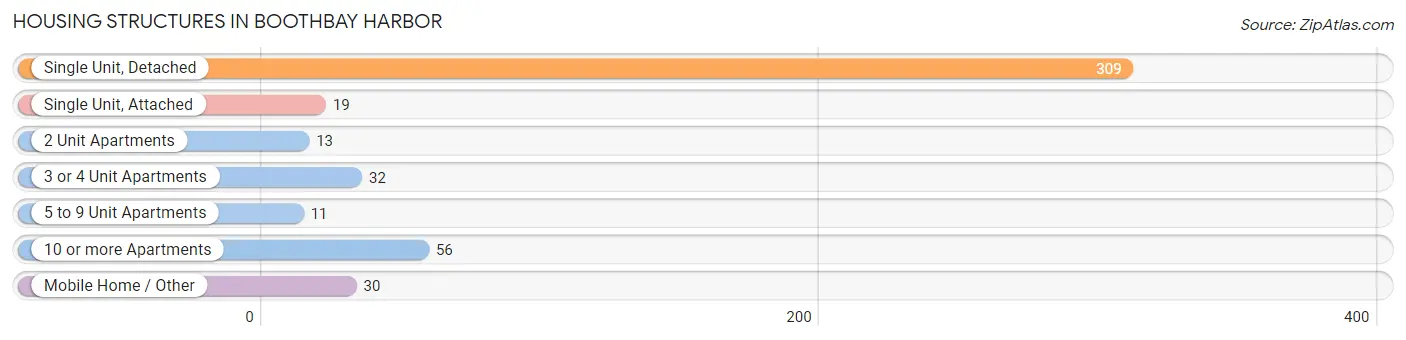
| Structure Type | # Housing Units | % Housing Units |
| Single Unit, Detached | 309 | 65.7% |
| Single Unit, Attached | 19 | 4.0% |
| 2 Unit Apartments | 13 | 2.8% |
| 3 or 4 Unit Apartments | 32 | 6.8% |
| 5 to 9 Unit Apartments | 11 | 2.3% |
| 10 or more Apartments | 56 | 11.9% |
| Mobile Home / Other | 30 | 6.4% |
| Total | 470 | 100.0% |
Housing Structures by Occupancy in Boothbay Harbor
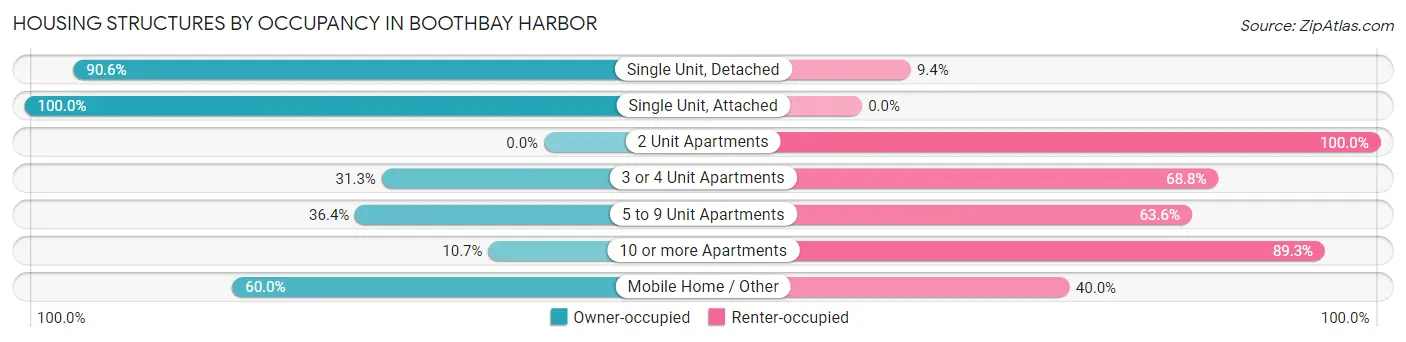
| Structure Type | Owner-occupied | Renter-occupied |
| Single Unit, Detached | 280 (90.6%) | 29 (9.4%) |
| Single Unit, Attached | 19 (100.0%) | 0 (0.0%) |
| 2 Unit Apartments | 0 (0.0%) | 13 (100.0%) |
| 3 or 4 Unit Apartments | 10 (31.2%) | 22 (68.8%) |
| 5 to 9 Unit Apartments | 4 (36.4%) | 7 (63.6%) |
| 10 or more Apartments | 6 (10.7%) | 50 (89.3%) |
| Mobile Home / Other | 18 (60.0%) | 12 (40.0%) |
| Total | 337 (71.7%) | 133 (28.3%) |
Housing Structures by Number of Rooms in Boothbay Harbor
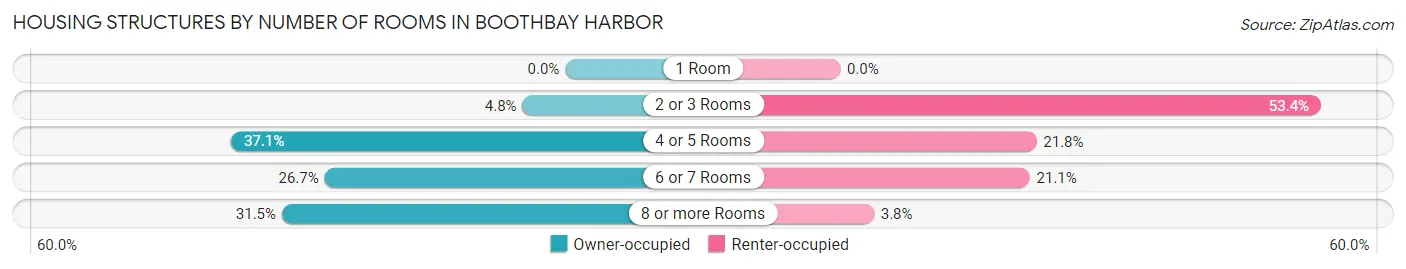
| Number of Rooms | Owner-occupied | Renter-occupied |
| 1 Room | 0 (0.0%) | 0 (0.0%) |
| 2 or 3 Rooms | 16 (4.8%) | 71 (53.4%) |
| 4 or 5 Rooms | 125 (37.1%) | 29 (21.8%) |
| 6 or 7 Rooms | 90 (26.7%) | 28 (21.0%) |
| 8 or more Rooms | 106 (31.5%) | 5 (3.8%) |
| Total | 337 (100.0%) | 133 (100.0%) |
Housing Structure by Heating Type in Boothbay Harbor
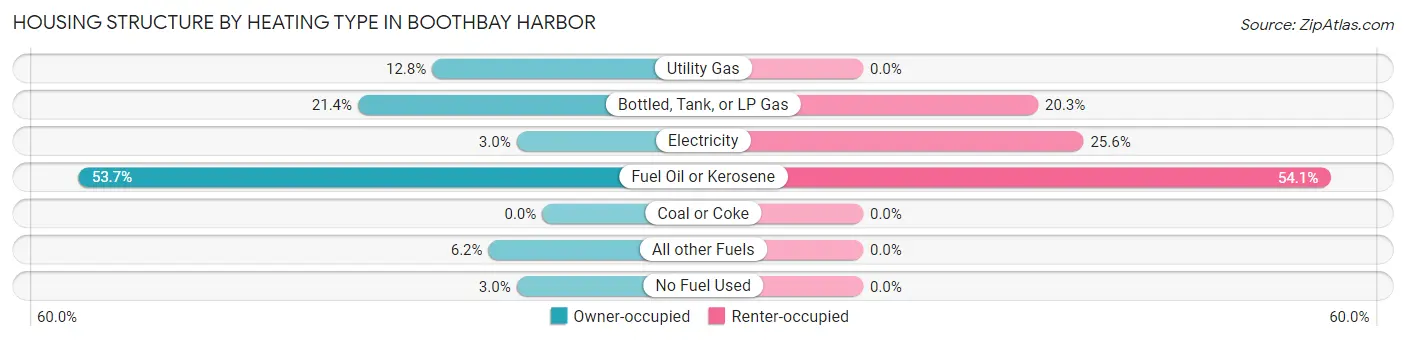
| Heating Type | Owner-occupied | Renter-occupied |
| Utility Gas | 43 (12.8%) | 0 (0.0%) |
| Bottled, Tank, or LP Gas | 72 (21.4%) | 27 (20.3%) |
| Electricity | 10 (3.0%) | 34 (25.6%) |
| Fuel Oil or Kerosene | 181 (53.7%) | 72 (54.1%) |
| Coal or Coke | 0 (0.0%) | 0 (0.0%) |
| All other Fuels | 21 (6.2%) | 0 (0.0%) |
| No Fuel Used | 10 (3.0%) | 0 (0.0%) |
| Total | 337 (100.0%) | 133 (100.0%) |
Household Vehicle Usage in Boothbay Harbor
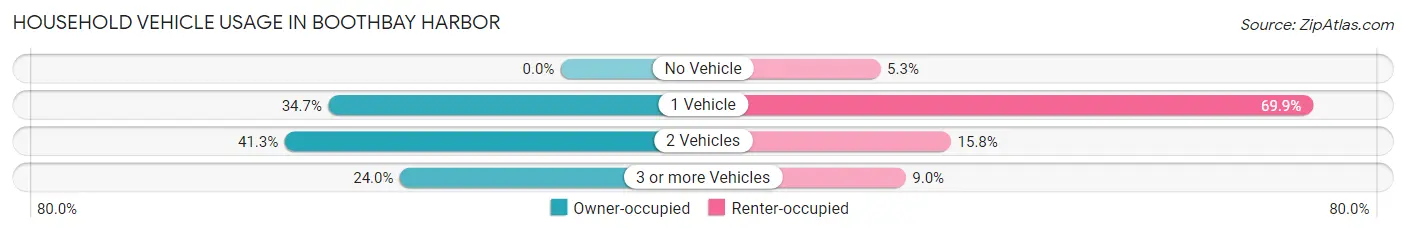
| Vehicles per Household | Owner-occupied | Renter-occupied |
| No Vehicle | 0 (0.0%) | 7 (5.3%) |
| 1 Vehicle | 117 (34.7%) | 93 (69.9%) |
| 2 Vehicles | 139 (41.2%) | 21 (15.8%) |
| 3 or more Vehicles | 81 (24.0%) | 12 (9.0%) |
| Total | 337 (100.0%) | 133 (100.0%) |
Real Estate & Mortgages in Boothbay Harbor
Real Estate and Mortgage Overview in Boothbay Harbor
| Characteristic | Without Mortgage | With Mortgage |
| Housing Units | 166 | 171 |
| Median Property Value | $243,400 | $364,300 |
| Median Household Income | $45,000 | $46 |
| Monthly Housing Costs | $734 | $29 |
| Real Estate Taxes | $2,169 | $0 |
Property Value by Mortgage Status in Boothbay Harbor
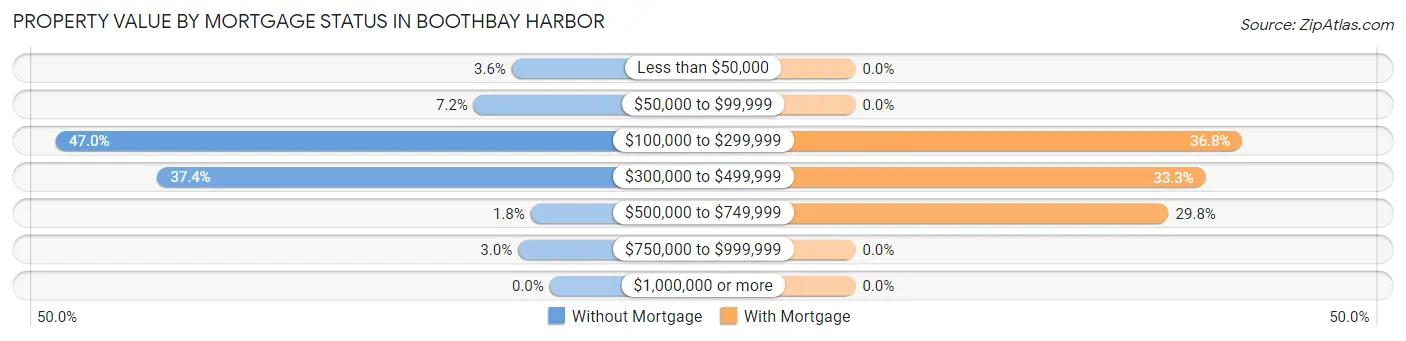
| Property Value | Without Mortgage | With Mortgage |
| Less than $50,000 | 6 (3.6%) | 0 (0.0%) |
| $50,000 to $99,999 | 12 (7.2%) | 0 (0.0%) |
| $100,000 to $299,999 | 78 (47.0%) | 63 (36.8%) |
| $300,000 to $499,999 | 62 (37.3%) | 57 (33.3%) |
| $500,000 to $749,999 | 3 (1.8%) | 51 (29.8%) |
| $750,000 to $999,999 | 5 (3.0%) | 0 (0.0%) |
| $1,000,000 or more | 0 (0.0%) | 0 (0.0%) |
| Total | 166 (100.0%) | 171 (100.0%) |
Household Income by Mortgage Status in Boothbay Harbor
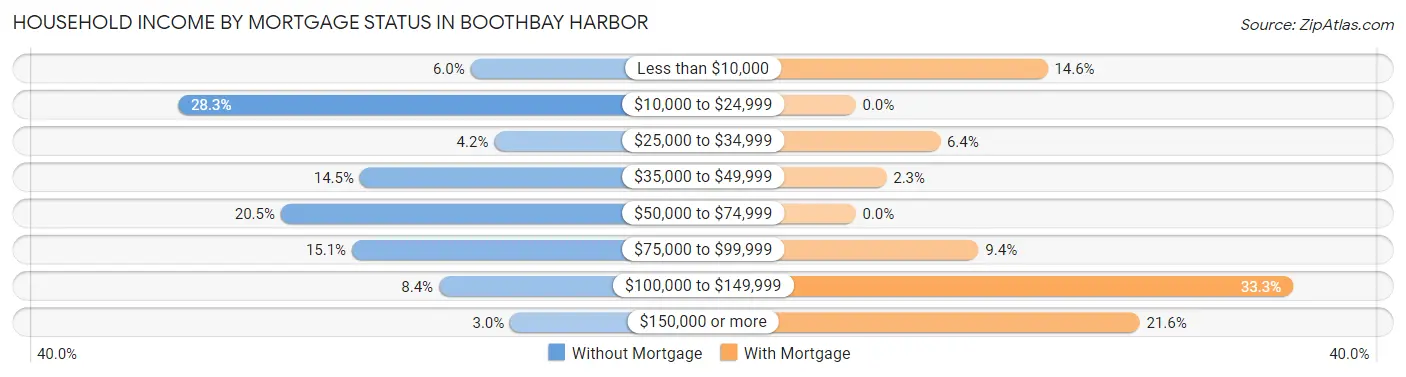
| Household Income | Without Mortgage | With Mortgage |
| Less than $10,000 | 10 (6.0%) | 25 (14.6%) |
| $10,000 to $24,999 | 47 (28.3%) | 0 (0.0%) |
| $25,000 to $34,999 | 7 (4.2%) | 11 (6.4%) |
| $35,000 to $49,999 | 24 (14.5%) | 4 (2.3%) |
| $50,000 to $74,999 | 34 (20.5%) | 0 (0.0%) |
| $75,000 to $99,999 | 25 (15.1%) | 16 (9.4%) |
| $100,000 to $149,999 | 14 (8.4%) | 57 (33.3%) |
| $150,000 or more | 5 (3.0%) | 37 (21.6%) |
| Total | 166 (100.0%) | 171 (100.0%) |
Property Value to Household Income Ratio in Boothbay Harbor
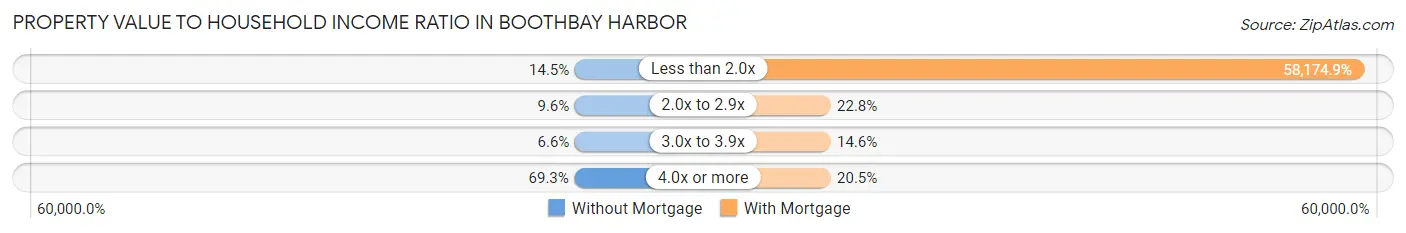
| Value-to-Income Ratio | Without Mortgage | With Mortgage |
| Less than 2.0x | 24 (14.5%) | 99,479 (58,174.9%) |
| 2.0x to 2.9x | 16 (9.6%) | 39 (22.8%) |
| 3.0x to 3.9x | 11 (6.6%) | 25 (14.6%) |
| 4.0x or more | 115 (69.3%) | 35 (20.5%) |
| Total | 166 (100.0%) | 171 (100.0%) |
Real Estate Taxes by Mortgage Status in Boothbay Harbor
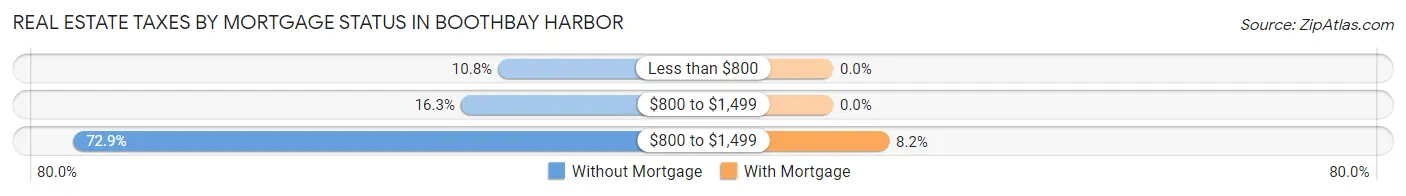
| Property Taxes | Without Mortgage | With Mortgage |
| Less than $800 | 18 (10.8%) | 0 (0.0%) |
| $800 to $1,499 | 27 (16.3%) | 0 (0.0%) |
| $800 to $1,499 | 121 (72.9%) | 14 (8.2%) |
| Total | 166 (100.0%) | 171 (100.0%) |
Health & Disability in Boothbay Harbor
Health Insurance Coverage by Age in Boothbay Harbor
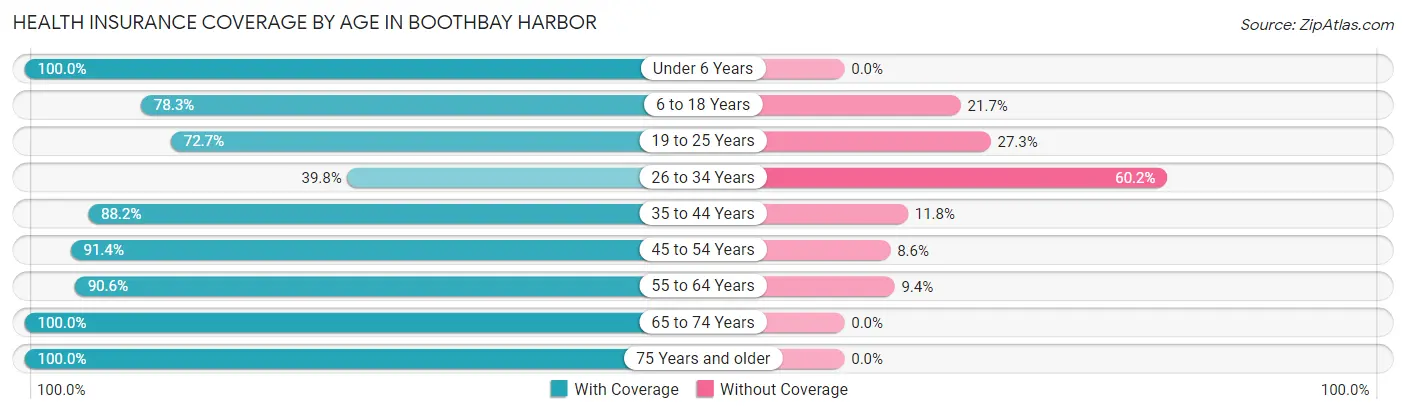
| Age Bracket | With Coverage | Without Coverage |
| Under 6 Years | 6 (100.0%) | 0 (0.0%) |
| 6 to 18 Years | 83 (78.3%) | 23 (21.7%) |
| 19 to 25 Years | 40 (72.7%) | 15 (27.3%) |
| 26 to 34 Years | 68 (39.8%) | 103 (60.2%) |
| 35 to 44 Years | 67 (88.2%) | 9 (11.8%) |
| 45 to 54 Years | 64 (91.4%) | 6 (8.6%) |
| 55 to 64 Years | 184 (90.6%) | 19 (9.4%) |
| 65 to 74 Years | 176 (100.0%) | 0 (0.0%) |
| 75 Years and older | 119 (100.0%) | 0 (0.0%) |
| Total | 807 (82.2%) | 175 (17.8%) |
Health Insurance Coverage by Citizenship Status in Boothbay Harbor
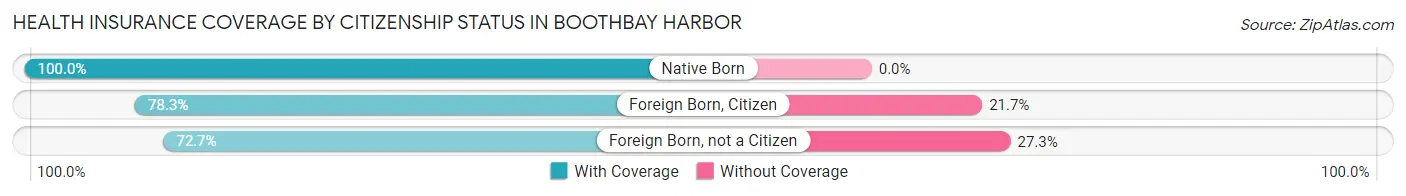
| Citizenship Status | With Coverage | Without Coverage |
| Native Born | 6 (100.0%) | 0 (0.0%) |
| Foreign Born, Citizen | 83 (78.3%) | 23 (21.7%) |
| Foreign Born, not a Citizen | 40 (72.7%) | 15 (27.3%) |
Health Insurance Coverage by Household Income in Boothbay Harbor
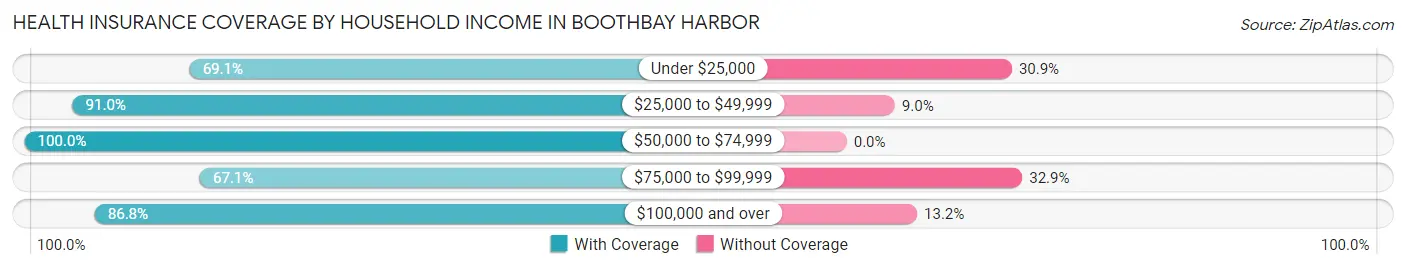
| Household Income | With Coverage | Without Coverage |
| Under $25,000 | 96 (69.1%) | 43 (30.9%) |
| $25,000 to $49,999 | 101 (91.0%) | 10 (9.0%) |
| $50,000 to $74,999 | 138 (100.0%) | 0 (0.0%) |
| $75,000 to $99,999 | 149 (67.1%) | 73 (32.9%) |
| $100,000 and over | 323 (86.8%) | 49 (13.2%) |
Public vs Private Health Insurance Coverage by Age in Boothbay Harbor
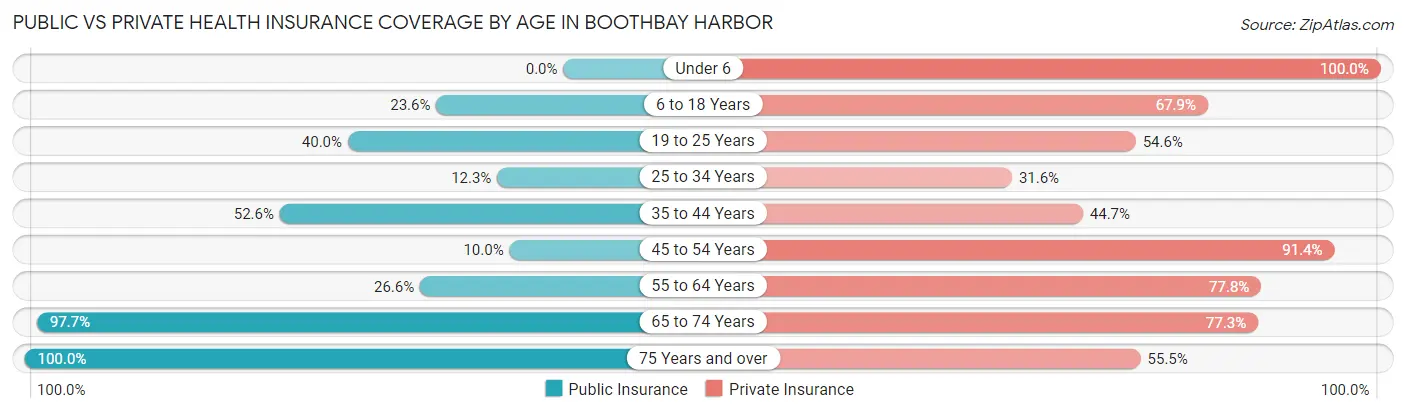
| Age Bracket | Public Insurance | Private Insurance |
| Under 6 | 0 (0.0%) | 6 (100.0%) |
| 6 to 18 Years | 25 (23.6%) | 72 (67.9%) |
| 19 to 25 Years | 22 (40.0%) | 30 (54.5%) |
| 25 to 34 Years | 21 (12.3%) | 54 (31.6%) |
| 35 to 44 Years | 40 (52.6%) | 34 (44.7%) |
| 45 to 54 Years | 7 (10.0%) | 64 (91.4%) |
| 55 to 64 Years | 54 (26.6%) | 158 (77.8%) |
| 65 to 74 Years | 172 (97.7%) | 136 (77.3%) |
| 75 Years and over | 119 (100.0%) | 66 (55.5%) |
| Total | 460 (46.8%) | 620 (63.1%) |
Disability Status by Sex by Age in Boothbay Harbor
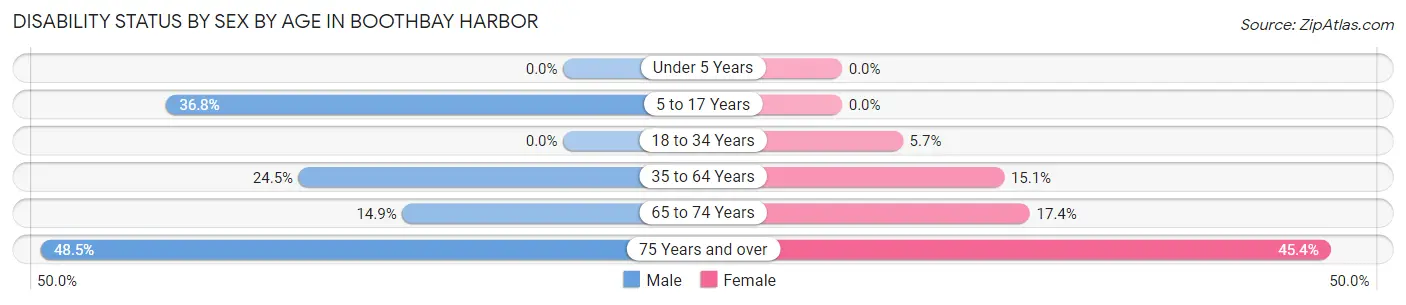
| Age Bracket | Male | Female |
| Under 5 Years | 0 (0.0%) | 0 (0.0%) |
| 5 to 17 Years | 14 (36.8%) | 0 (0.0%) |
| 18 to 34 Years | 0 (0.0%) | 10 (5.7%) |
| 35 to 64 Years | 40 (24.5%) | 28 (15.0%) |
| 65 to 74 Years | 10 (14.9%) | 19 (17.4%) |
| 75 Years and over | 16 (48.5%) | 39 (45.4%) |
Disability Class by Sex by Age in Boothbay Harbor
Disability Class: Hearing Difficulty
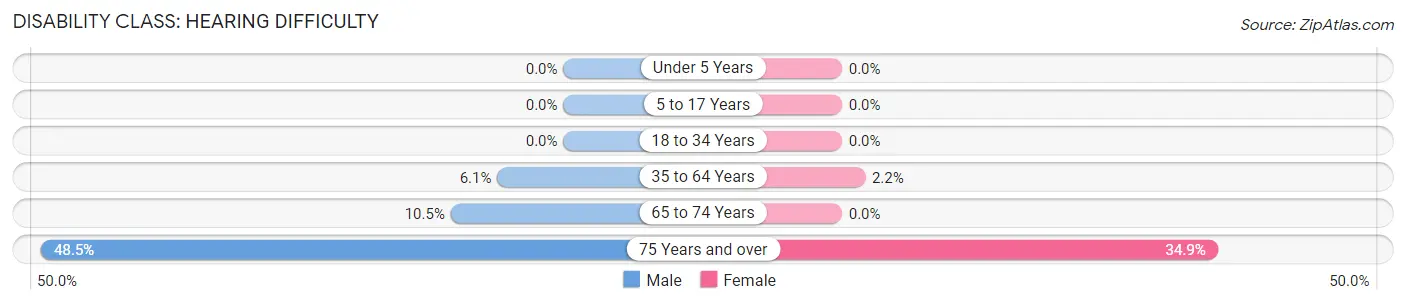
| Age Bracket | Male | Female |
| Under 5 Years | 0 (0.0%) | 0 (0.0%) |
| 5 to 17 Years | 0 (0.0%) | 0 (0.0%) |
| 18 to 34 Years | 0 (0.0%) | 0 (0.0%) |
| 35 to 64 Years | 10 (6.1%) | 4 (2.1%) |
| 65 to 74 Years | 7 (10.4%) | 0 (0.0%) |
| 75 Years and over | 16 (48.5%) | 30 (34.9%) |
Disability Class: Vision Difficulty
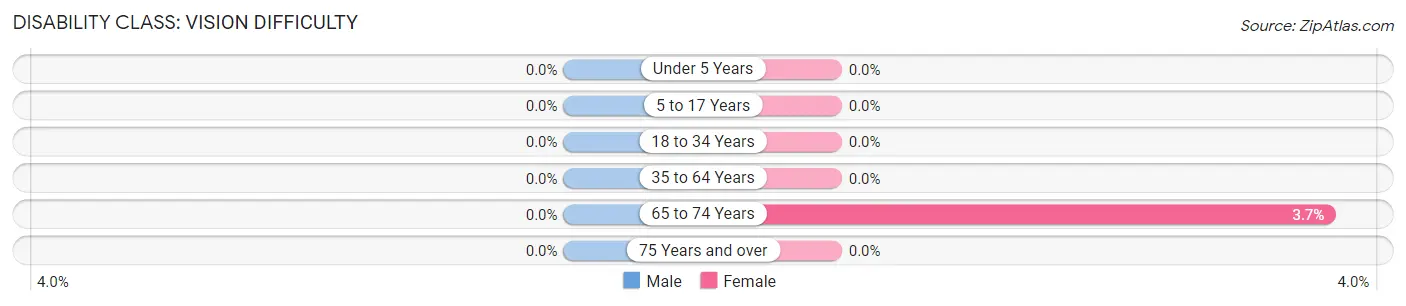
| Age Bracket | Male | Female |
| Under 5 Years | 0 (0.0%) | 0 (0.0%) |
| 5 to 17 Years | 0 (0.0%) | 0 (0.0%) |
| 18 to 34 Years | 0 (0.0%) | 0 (0.0%) |
| 35 to 64 Years | 0 (0.0%) | 0 (0.0%) |
| 65 to 74 Years | 0 (0.0%) | 4 (3.7%) |
| 75 Years and over | 0 (0.0%) | 0 (0.0%) |
Disability Class: Cognitive Difficulty
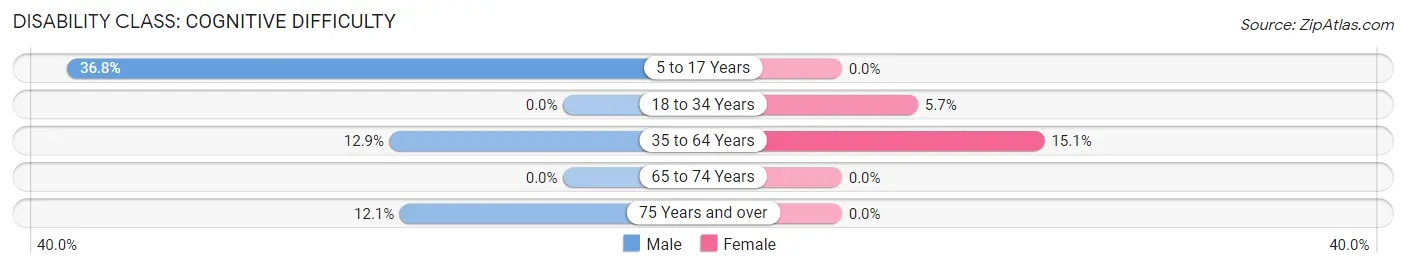
| Age Bracket | Male | Female |
| 5 to 17 Years | 14 (36.8%) | 0 (0.0%) |
| 18 to 34 Years | 0 (0.0%) | 10 (5.7%) |
| 35 to 64 Years | 21 (12.9%) | 28 (15.0%) |
| 65 to 74 Years | 0 (0.0%) | 0 (0.0%) |
| 75 Years and over | 4 (12.1%) | 0 (0.0%) |
Disability Class: Ambulatory Difficulty
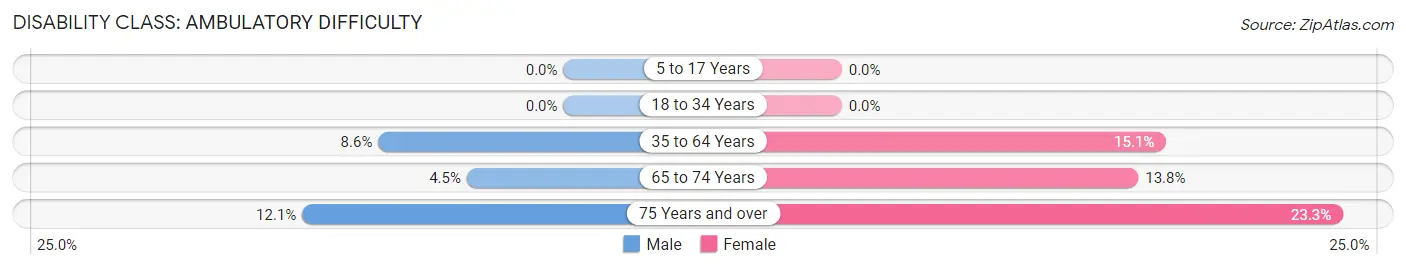
| Age Bracket | Male | Female |
| 5 to 17 Years | 0 (0.0%) | 0 (0.0%) |
| 18 to 34 Years | 0 (0.0%) | 0 (0.0%) |
| 35 to 64 Years | 14 (8.6%) | 28 (15.0%) |
| 65 to 74 Years | 3 (4.5%) | 15 (13.8%) |
| 75 Years and over | 4 (12.1%) | 20 (23.3%) |
Disability Class: Self-Care Difficulty
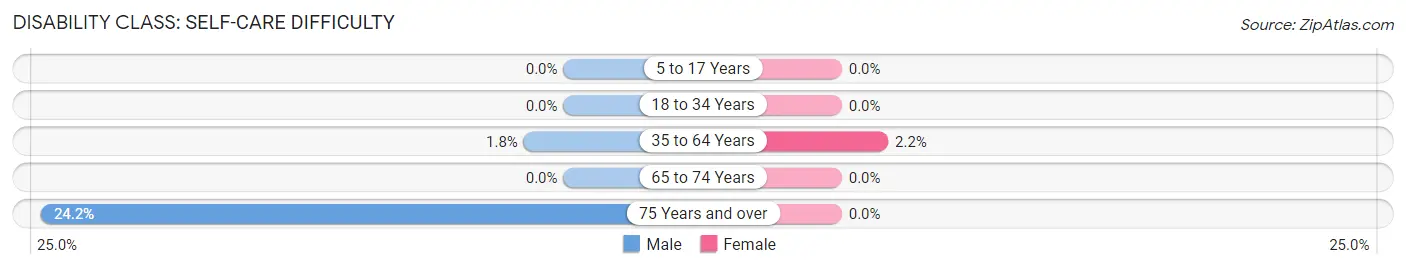
| Age Bracket | Male | Female |
| 5 to 17 Years | 0 (0.0%) | 0 (0.0%) |
| 18 to 34 Years | 0 (0.0%) | 0 (0.0%) |
| 35 to 64 Years | 3 (1.8%) | 4 (2.1%) |
| 65 to 74 Years | 0 (0.0%) | 0 (0.0%) |
| 75 Years and over | 8 (24.2%) | 0 (0.0%) |
Technology Access in Boothbay Harbor
Computing Device Access in Boothbay Harbor
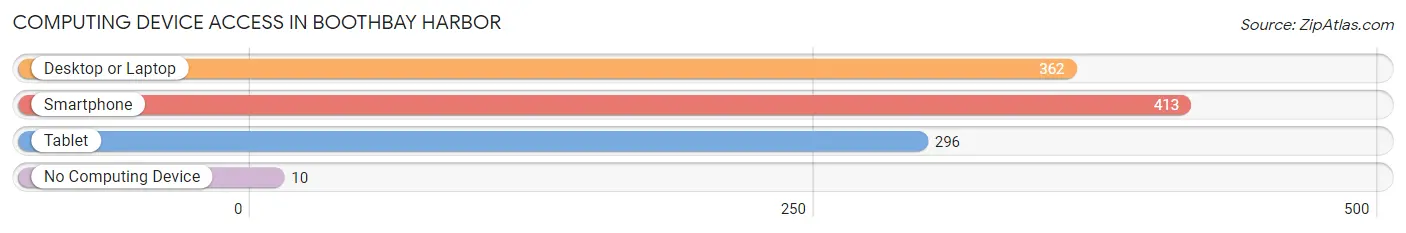
| Device Type | # Households | % Households |
| Desktop or Laptop | 362 | 77.0% |
| Smartphone | 413 | 87.9% |
| Tablet | 296 | 63.0% |
| No Computing Device | 10 | 2.1% |
| Total | 470 | 100.0% |
Internet Access in Boothbay Harbor
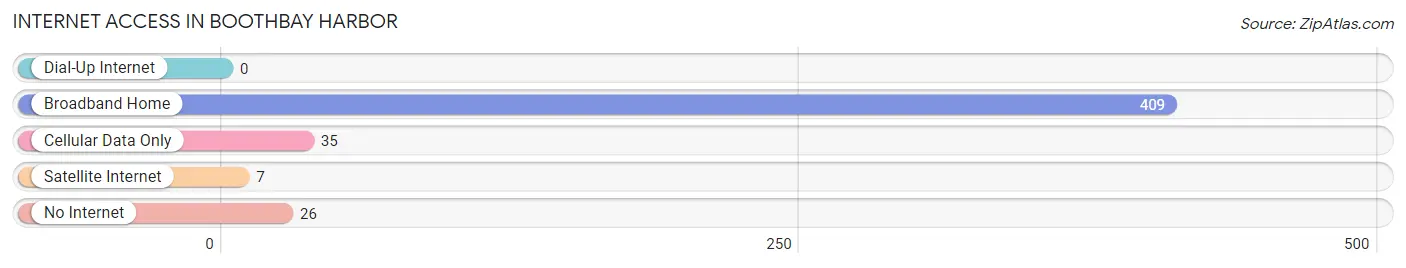
| Internet Type | # Households | % Households |
| Dial-Up Internet | 0 | 0.0% |
| Broadband Home | 409 | 87.0% |
| Cellular Data Only | 35 | 7.4% |
| Satellite Internet | 7 | 1.5% |
| No Internet | 26 | 5.5% |
| Total | 470 | 100.0% |
Boothbay Harbor Summary
Boothbay Harbor is a town located in Lincoln County, Maine, United States. It is situated along the Atlantic Ocean, approximately 30 miles south of Portland. The town is a popular tourist destination, known for its picturesque harbor, quaint shops, and seafood restaurants. The population was 2,165 at the 2010 census.
History
The area that is now Boothbay Harbor was first settled in the early 1700s by English settlers. The town was incorporated in 1764 and named after the Boothbay region of England. The town quickly became a center of shipbuilding and fishing, and by the mid-1800s, it was a major port of call for ships traveling between Boston and Portland.
In the late 1800s, Boothbay Harbor began to attract tourists, and the town soon became a popular summer destination. The town was home to several grand hotels, including the Boothbay Harbor Hotel, which was built in 1883 and was one of the largest hotels in the state.
In the early 1900s, the town began to develop a reputation as an artists’ colony, and many prominent artists, including Edward Hopper, Winslow Homer, and Childe Hassam, spent time in Boothbay Harbor.
Geography
Boothbay Harbor is located at 43°54′N 69°38′W (43.9000, -69.6333). According to the United States Census Bureau, the town has a total area of 8.2 square miles (21.2 km2), of which, 6.2 square miles (16.1 km2) of it is land and 2.0 square miles (5.1 km2) is water.
The town is situated on a peninsula that juts out into the Atlantic Ocean. The harbor is protected by a breakwater, and the town is surrounded by several islands, including Monhegan Island, Damariscove Island, and Squirrel Island.
Economy
Boothbay Harbor is a popular tourist destination, and the town’s economy is largely dependent on tourism. The town is home to several hotels, restaurants, and shops, and it is also a popular destination for boating and fishing.
The town is also home to several marinas, including the Boothbay Harbor Marina, which is the largest marina in the state. The marina offers a variety of services, including boat storage, boat repair, and boat rentals.
Demographics
As of the 2010 census, there were 2,165 people, 1,039 households, and 545 families residing in the town. The population density was 348.2 people per square mile (134.3/km2). There were 1,541 housing units at an average density of 249.3 per square mile (96.3/km2). The racial makeup of the town was 97.3% White, 0.3% African American, 0.3% Native American, 0.5% Asian, 0.1% Pacific Islander, 0.2% from other races, and 1.3% from two or more races. Hispanic or Latino of any race were 0.9% of the population.
There were 1,039 households, out of which 19.2% had children under the age of 18 living with them, 44.2% were married couples living together, 8.3% had a female householder with no husband present, and 44.2% were non-families. 37.2% of all households were made up of individuals, and 16.2% had someone living alone who was 65 years of age or older. The average household size was 2.06 and the average family size was 2.67.
In the town, the population was spread out, with 17.2% under the age of 18, 5.2% from 18 to 24, 22.2% from 25 to 44, 32.2% from 45 to 64, and 23.2% who were 65 years of age or older. The median age was 48 years. For every 100 females, there were 91.2 males. For every 100 females age 18 and over, there were 88.2 males.
The median income for a household in the town was $41,944, and the median income for a family was $51,964. Males had a median income of $36,250 versus $27,500 for females. The per capita income for the town was $25,945. About 5.2% of families and 8.2% of the population were below the poverty line, including 10.2% of those under age 18 and 6.2% of those age 65 or over.
Common Questions
What is Per Capita Income in Boothbay Harbor?
Per Capita income in Boothbay Harbor is $38,399.
What is the Median Family Income in Boothbay Harbor?
Median Family Income in Boothbay Harbor is $85,833.
What is the Median Household income in Boothbay Harbor?
Median Household Income in Boothbay Harbor is $65,795.
What is Income or Wage Gap in Boothbay Harbor?
Income or Wage Gap in Boothbay Harbor is 7.6%.
Women in Boothbay Harbor earn 92.4 cents for every dollar earned by a man.
What is Inequality or Gini Index in Boothbay Harbor?
Inequality or Gini Index in Boothbay Harbor is 0.45.
What is the Total Population of Boothbay Harbor?
Total Population of Boothbay Harbor is 982.
What is the Total Male Population of Boothbay Harbor?
Total Male Population of Boothbay Harbor is 375.
What is the Total Female Population of Boothbay Harbor?
Total Female Population of Boothbay Harbor is 607.
What is the Ratio of Males per 100 Females in Boothbay Harbor?
There are 61.78 Males per 100 Females in Boothbay Harbor.
What is the Ratio of Females per 100 Males in Boothbay Harbor?
There are 161.87 Females per 100 Males in Boothbay Harbor.
What is the Median Population Age in Boothbay Harbor?
Median Population Age in Boothbay Harbor is 55.5 Years.
What is the Average Family Size in Boothbay Harbor
Average Family Size in Boothbay Harbor is 2.9 People.
What is the Average Household Size in Boothbay Harbor
Average Household Size in Boothbay Harbor is 2.1 People.
How Large is the Labor Force in Boothbay Harbor?
There are 494 People in the Labor Forcein in Boothbay Harbor.
What is the Percentage of People in the Labor Force in Boothbay Harbor?
54.9% of People are in the Labor Force in Boothbay Harbor.
What is the Unemployment Rate in Boothbay Harbor?
Unemployment Rate in Boothbay Harbor is 1.8%.