Auburn, ME Map & Demographics
Auburn Map
Auburn Overview
$37,416
PER CAPITA INCOME
$83,101
AVG FAMILY INCOME
$59,659
AVG HOUSEHOLD INCOME
20.2%
WAGE / INCOME GAP [ % ]
79.8¢/ $1
WAGE / INCOME GAP [ $ ]
0.48
INEQUALITY / GINI INDEX
24,038
TOTAL POPULATION
11,538
MALE POPULATION
12,500
FEMALE POPULATION
92.30
MALES / 100 FEMALES
108.34
FEMALES / 100 MALES
39.4
MEDIAN AGE
3.0
AVG FAMILY SIZE
2.3
AVG HOUSEHOLD SIZE
13,119
LABOR FORCE [ PEOPLE ]
66.9%
PERCENT IN LABOR FORCE
6.5%
UNEMPLOYMENT RATE
Auburn Zip Codes
Auburn Area Codes
Income in Auburn
Income Overview in Auburn
Per Capita Income in Auburn is $37,416, while median incomes of families and households are $83,101 and $59,659 respectively.
| Characteristic | Number | Measure |
| Per Capita Income | 24,038 | $37,416 |
| Median Family Income | 5,448 | $83,101 |
| Mean Family Income | 5,448 | $115,411 |
| Median Household Income | 10,309 | $59,659 |
| Mean Household Income | 10,309 | $86,853 |
| Income Deficit | 5,448 | $0 |
| Wage / Income Gap (%) | 24,038 | 20.19% |
| Wage / Income Gap ($) | 24,038 | 79.81¢ per $1 |
| Gini / Inequality Index | 24,038 | 0.48 |
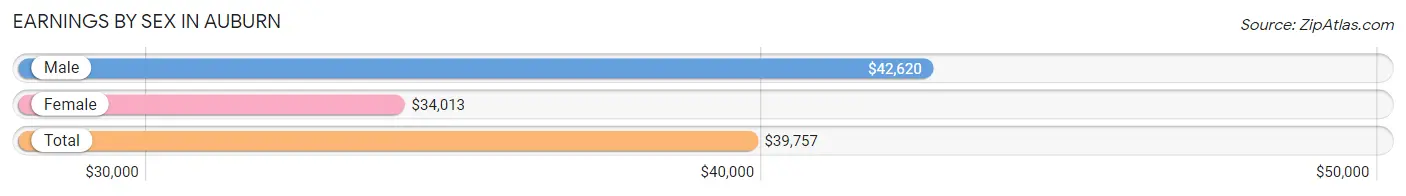
Earnings by Sex in Auburn
Average Earnings in Auburn are $39,757, $42,620 for men and $34,013 for women, a difference of 20.2%.
| Sex | Number | Average Earnings |
| Male | 7,089 (51.8%) | $42,620 |
| Female | 6,586 (48.2%) | $34,013 |
| Total | 13,675 (100.0%) | $39,757 |
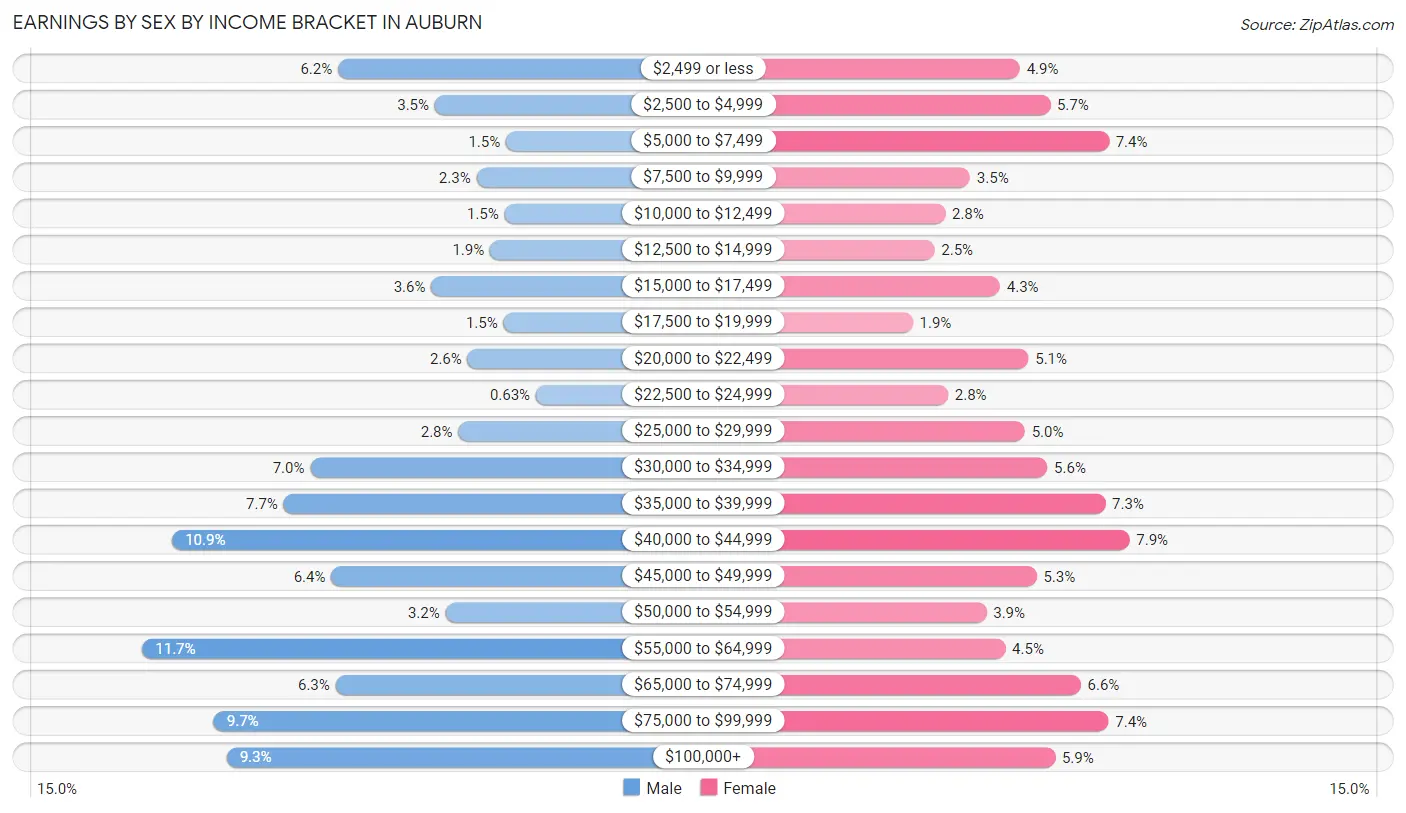
Earnings by Sex by Income Bracket in Auburn
The most common earnings brackets in Auburn are $55,000 to $64,999 for men (829 | 11.7%) and $40,000 to $44,999 for women (523 | 7.9%).
| Income | Male | Female |
| $2,499 or less | 439 (6.2%) | 320 (4.9%) |
| $2,500 to $4,999 | 246 (3.5%) | 376 (5.7%) |
| $5,000 to $7,499 | 104 (1.5%) | 485 (7.4%) |
| $7,500 to $9,999 | 163 (2.3%) | 228 (3.5%) |
| $10,000 to $12,499 | 107 (1.5%) | 182 (2.8%) |
| $12,500 to $14,999 | 136 (1.9%) | 162 (2.5%) |
| $15,000 to $17,499 | 253 (3.6%) | 283 (4.3%) |
| $17,500 to $19,999 | 109 (1.5%) | 122 (1.8%) |
| $20,000 to $22,499 | 181 (2.5%) | 336 (5.1%) |
| $22,500 to $24,999 | 45 (0.6%) | 187 (2.8%) |
| $25,000 to $29,999 | 199 (2.8%) | 329 (5.0%) |
| $30,000 to $34,999 | 494 (7.0%) | 371 (5.6%) |
| $35,000 to $39,999 | 547 (7.7%) | 478 (7.3%) |
| $40,000 to $44,999 | 769 (10.8%) | 523 (7.9%) |
| $45,000 to $49,999 | 452 (6.4%) | 351 (5.3%) |
| $50,000 to $54,999 | 225 (3.2%) | 258 (3.9%) |
| $55,000 to $64,999 | 829 (11.7%) | 293 (4.4%) |
| $65,000 to $74,999 | 444 (6.3%) | 433 (6.6%) |
| $75,000 to $99,999 | 686 (9.7%) | 484 (7.3%) |
| $100,000+ | 661 (9.3%) | 385 (5.9%) |
| Total | 7,089 (100.0%) | 6,586 (100.0%) |
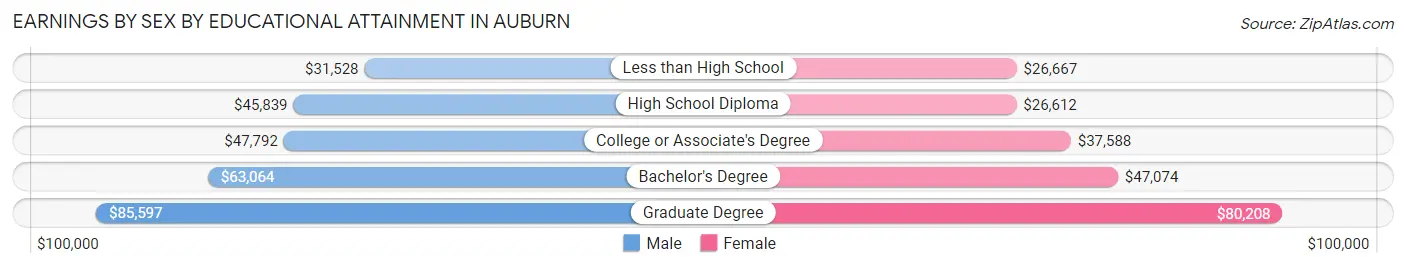
Earnings by Sex by Educational Attainment in Auburn
Average earnings in Auburn are $48,976 for men and $40,911 for women, a difference of 16.5%. Men with an educational attainment of graduate degree enjoy the highest average annual earnings of $85,597, while those with less than high school education earn the least with $31,528. Women with an educational attainment of graduate degree earn the most with the average annual earnings of $80,208, while those with high school diploma education have the smallest earnings of $26,612.
| Educational Attainment | Male Income | Female Income |
| Less than High School | $31,528 | $26,667 |
| High School Diploma | $45,839 | $26,612 |
| College or Associate's Degree | $47,792 | $37,588 |
| Bachelor's Degree | $63,064 | $47,074 |
| Graduate Degree | $85,597 | $80,208 |
| Total | $48,976 | $40,911 |
Family Income in Auburn
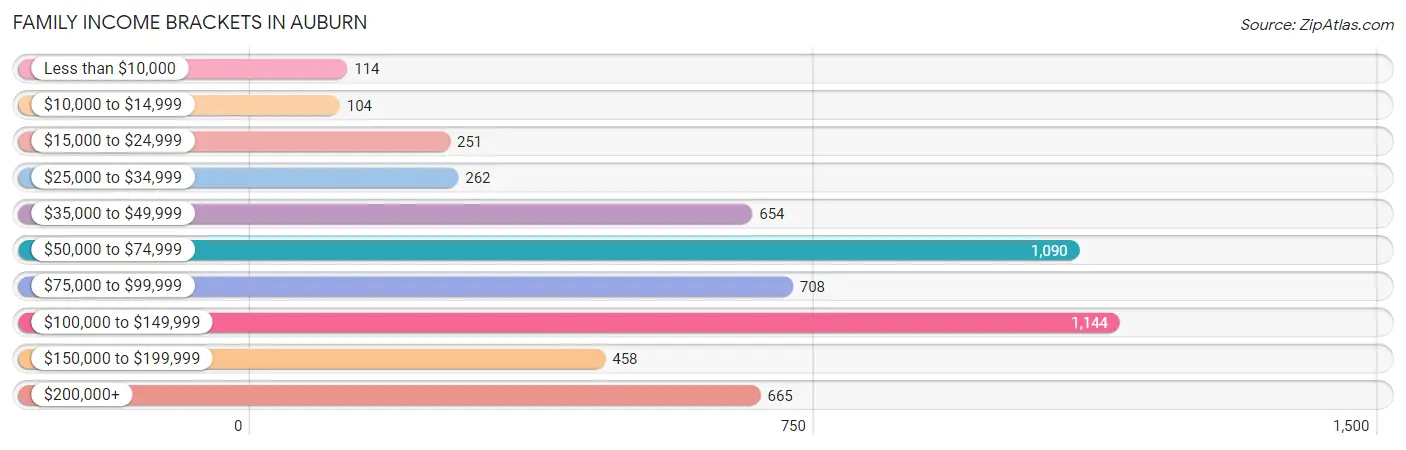
Family Income Brackets in Auburn
According to the Auburn family income data, there are 1,144 families falling into the $100,000 to $149,999 income range, which is the most common income bracket and makes up 21.0% of all families. Conversely, the $10,000 to $14,999 income bracket is the least frequent group with only 104 families (1.9%) belonging to this category.
| Income Bracket | # Families | % Families |
| Less than $10,000 | 114 | 2.1% |
| $10,000 to $14,999 | 104 | 1.9% |
| $15,000 to $24,999 | 251 | 4.6% |
| $25,000 to $34,999 | 262 | 4.8% |
| $35,000 to $49,999 | 654 | 12.0% |
| $50,000 to $74,999 | 1,090 | 20.0% |
| $75,000 to $99,999 | 708 | 13.0% |
| $100,000 to $149,999 | 1,144 | 21.0% |
| $150,000 to $199,999 | 458 | 8.4% |
| $200,000+ | 665 | 12.2% |
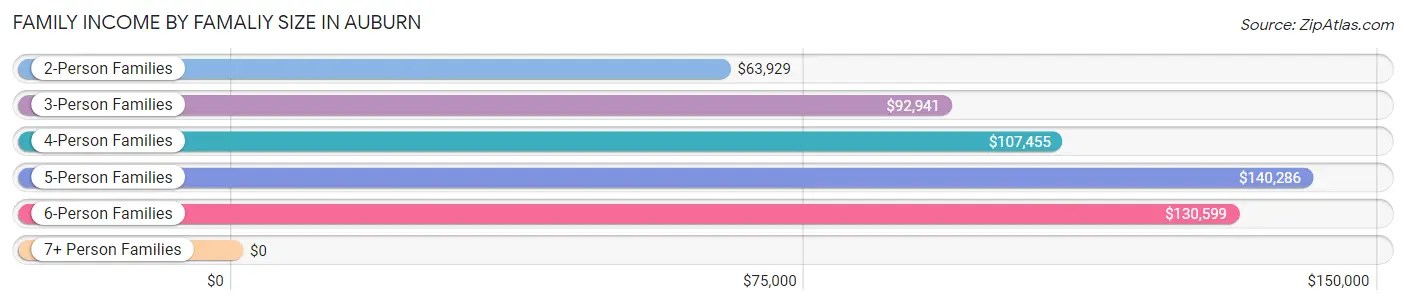
Family Income by Famaliy Size in Auburn
5-person families (238 | 4.4%) account for the highest median family income in Auburn with $140,286 per family, while 2-person families (3,028 | 55.6%) have the highest median income of $31,964 per family member.
| Income Bracket | # Families | Median Income |
| 2-Person Families | 3,028 (55.6%) | $63,929 |
| 3-Person Families | 1,018 (18.7%) | $92,941 |
| 4-Person Families | 786 (14.4%) | $107,455 |
| 5-Person Families | 238 (4.4%) | $140,286 |
| 6-Person Families | 295 (5.4%) | $130,599 |
| 7+ Person Families | 83 (1.5%) | $0 |
| Total | 5,448 (100.0%) | $83,101 |
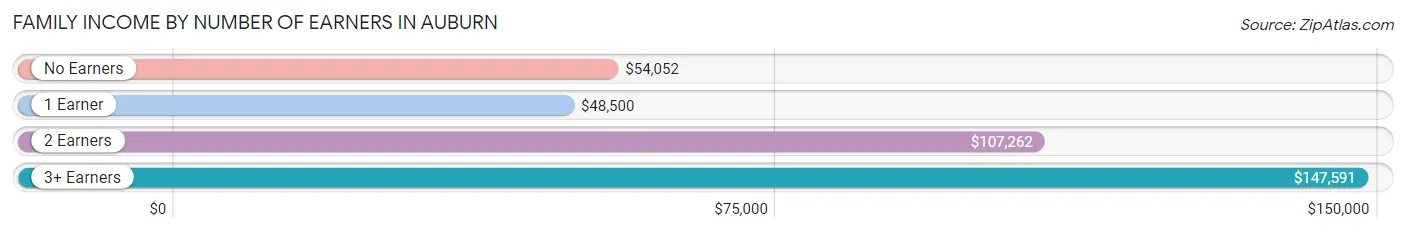
Family Income by Number of Earners in Auburn
The median family income in Auburn is $83,101, with families comprising 3+ earners (793) having the highest median family income of $147,591, while families with 1 earner (1,556) have the lowest median family income of $48,500, accounting for 14.6% and 28.6% of families, respectively.
| Number of Earners | # Families | Median Income |
| No Earners | 797 (14.6%) | $54,052 |
| 1 Earner | 1,556 (28.6%) | $48,500 |
| 2 Earners | 2,302 (42.2%) | $107,262 |
| 3+ Earners | 793 (14.6%) | $147,591 |
| Total | 5,448 (100.0%) | $83,101 |
Household Income in Auburn
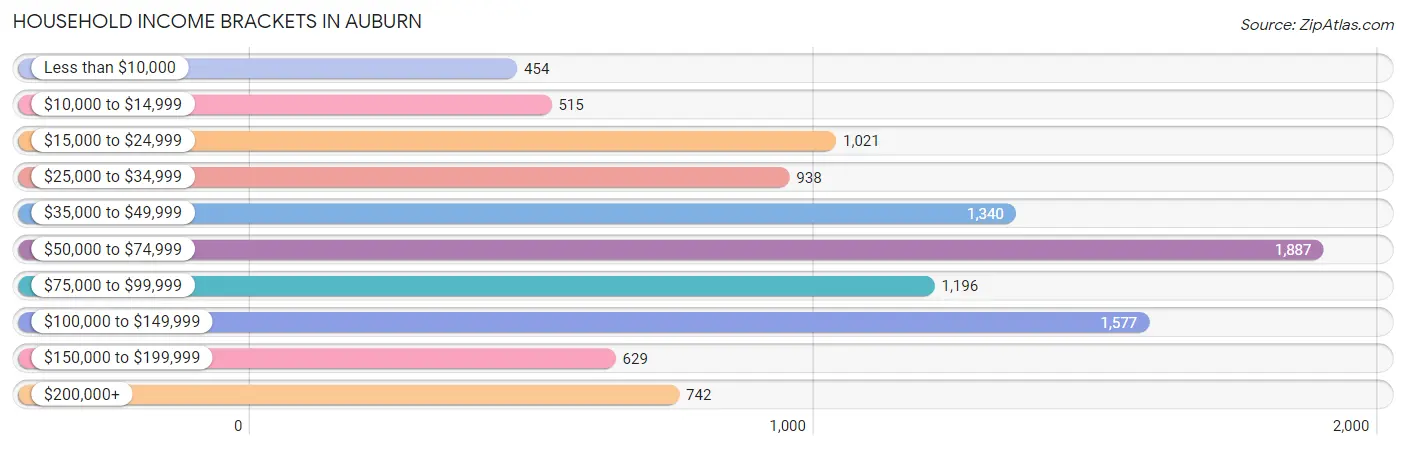
Household Income Brackets in Auburn
With 1,887 households falling in the category, the $50,000 to $74,999 income range is the most frequent in Auburn, accounting for 18.3% of all households. In contrast, only 454 households (4.4%) fall into the less than $10,000 income bracket, making it the least populous group.
| Income Bracket | # Households | % Households |
| Less than $10,000 | 454 | 4.4% |
| $10,000 to $14,999 | 515 | 5.0% |
| $15,000 to $24,999 | 1,021 | 9.9% |
| $25,000 to $34,999 | 938 | 9.1% |
| $35,000 to $49,999 | 1,340 | 13.0% |
| $50,000 to $74,999 | 1,887 | 18.3% |
| $75,000 to $99,999 | 1,196 | 11.6% |
| $100,000 to $149,999 | 1,577 | 15.3% |
| $150,000 to $199,999 | 629 | 6.1% |
| $200,000+ | 742 | 7.2% |
Household Income by Householder Age in Auburn
The median household income in Auburn is $59,659, with the highest median household income of $67,194 found in the 25 to 44 years age bracket for the primary householder. A total of 3,288 households (31.9%) fall into this category. Meanwhile, the 65+ years age bracket for the primary householder has the lowest median household income of $50,050, with 2,845 households (27.6%) in this group.
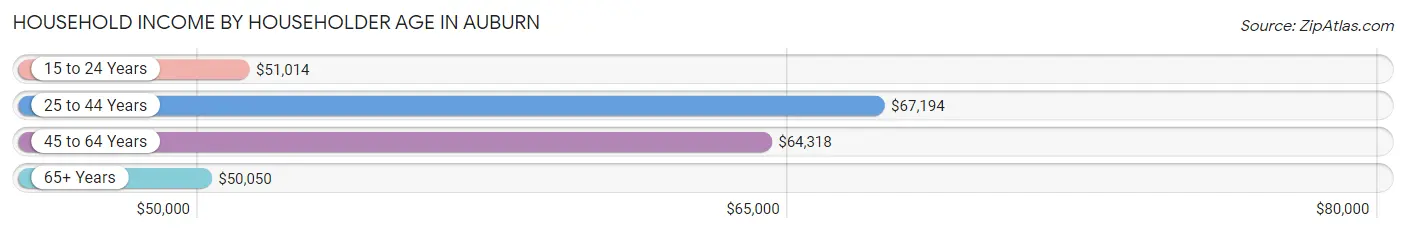
| Income Bracket | # Households | Median Income |
| 15 to 24 Years | 490 (4.8%) | $51,014 |
| 25 to 44 Years | 3,288 (31.9%) | $67,194 |
| 45 to 64 Years | 3,686 (35.8%) | $64,318 |
| 65+ Years | 2,845 (27.6%) | $50,050 |
| Total | 10,309 (100.0%) | $59,659 |
Poverty in Auburn
Income Below Poverty by Sex and Age in Auburn
With 10.3% poverty level for males and 12.5% for females among the residents of Auburn, 5 year old males and 18 to 24 year old females are the most vulnerable to poverty, with 25 males (34.7%) and 336 females (25.4%) in their respective age groups living below the poverty level.
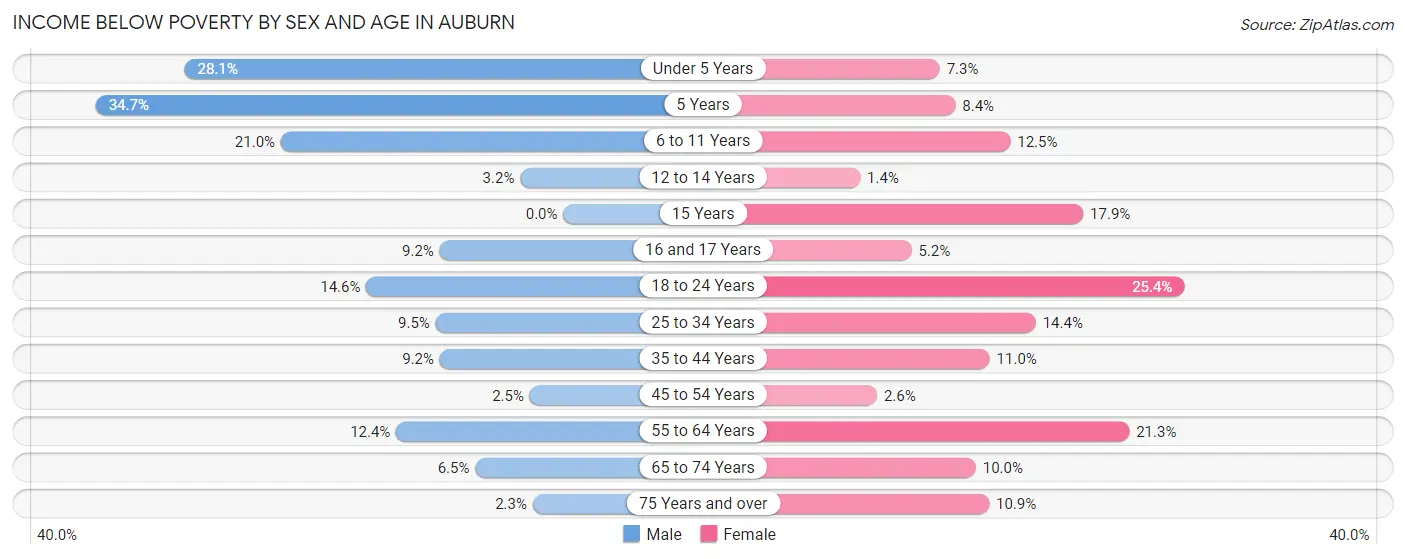
| Age Bracket | Male | Female |
| Under 5 Years | 142 (28.1%) | 37 (7.3%) |
| 5 Years | 25 (34.7%) | 14 (8.4%) |
| 6 to 11 Years | 147 (21.0%) | 113 (12.5%) |
| 12 to 14 Years | 17 (3.2%) | 8 (1.4%) |
| 15 Years | 0 (0.0%) | 31 (17.9%) |
| 16 and 17 Years | 27 (9.2%) | 17 (5.2%) |
| 18 to 24 Years | 172 (14.6%) | 336 (25.4%) |
| 25 to 34 Years | 132 (9.5%) | 191 (14.4%) |
| 35 to 44 Years | 136 (9.2%) | 161 (11.0%) |
| 45 to 54 Years | 36 (2.5%) | 35 (2.6%) |
| 55 to 64 Years | 215 (12.4%) | 316 (21.3%) |
| 65 to 74 Years | 65 (6.5%) | 163 (10.0%) |
| 75 Years and over | 12 (2.3%) | 113 (10.9%) |
| Total | 1,126 (10.3%) | 1,535 (12.5%) |
Income Above Poverty by Sex and Age in Auburn
According to the poverty statistics in Auburn, males aged 15 years and females aged 12 to 14 years are the age groups that are most secure financially, with 100.0% of males and 98.6% of females in these age groups living above the poverty line.
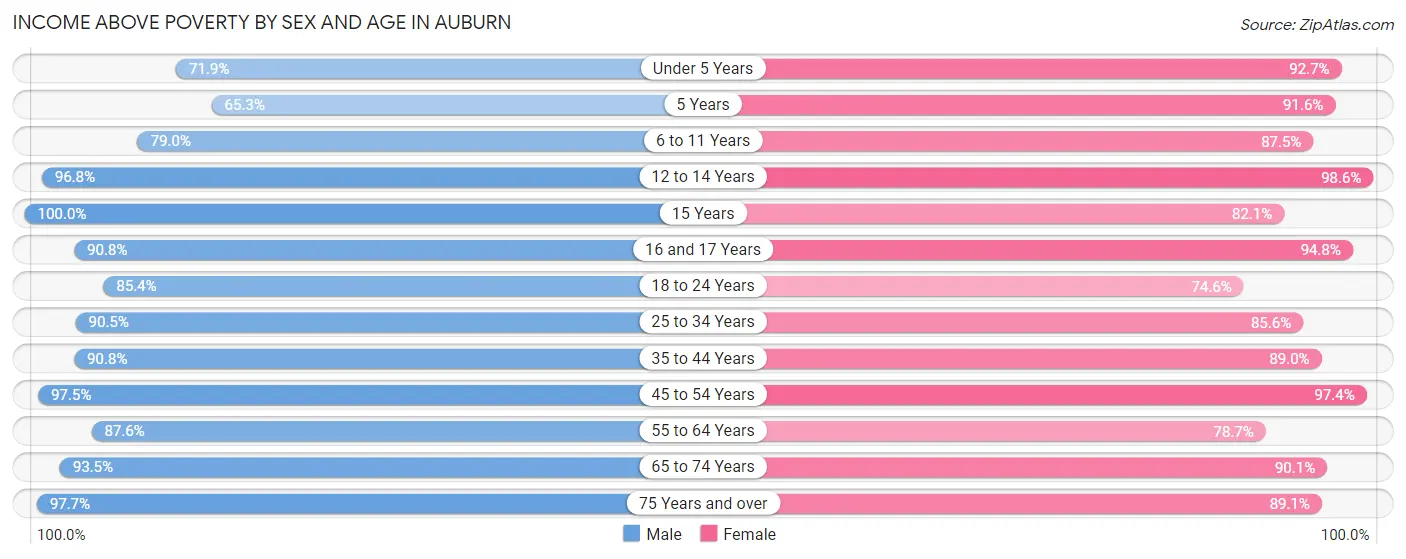
| Age Bracket | Male | Female |
| Under 5 Years | 363 (71.9%) | 472 (92.7%) |
| 5 Years | 47 (65.3%) | 152 (91.6%) |
| 6 to 11 Years | 554 (79.0%) | 790 (87.5%) |
| 12 to 14 Years | 515 (96.8%) | 580 (98.6%) |
| 15 Years | 109 (100.0%) | 142 (82.1%) |
| 16 and 17 Years | 267 (90.8%) | 312 (94.8%) |
| 18 to 24 Years | 1,004 (85.4%) | 986 (74.6%) |
| 25 to 34 Years | 1,260 (90.5%) | 1,135 (85.6%) |
| 35 to 44 Years | 1,347 (90.8%) | 1,305 (89.0%) |
| 45 to 54 Years | 1,410 (97.5%) | 1,305 (97.4%) |
| 55 to 64 Years | 1,517 (87.6%) | 1,165 (78.7%) |
| 65 to 74 Years | 929 (93.5%) | 1,476 (90.0%) |
| 75 Years and over | 517 (97.7%) | 921 (89.1%) |
| Total | 9,839 (89.7%) | 10,741 (87.5%) |
Income Below Poverty Among Married-Couple Families in Auburn
The poverty statistics for married-couple families in Auburn show that 2.0% or 82 of the total 4,056 families live below the poverty line. Families with 5 or more children have the highest poverty rate of 100.0%, comprising of 27 families. On the other hand, families with 1 or 2 children have the lowest poverty rate of 0.2%, which includes 2 families.
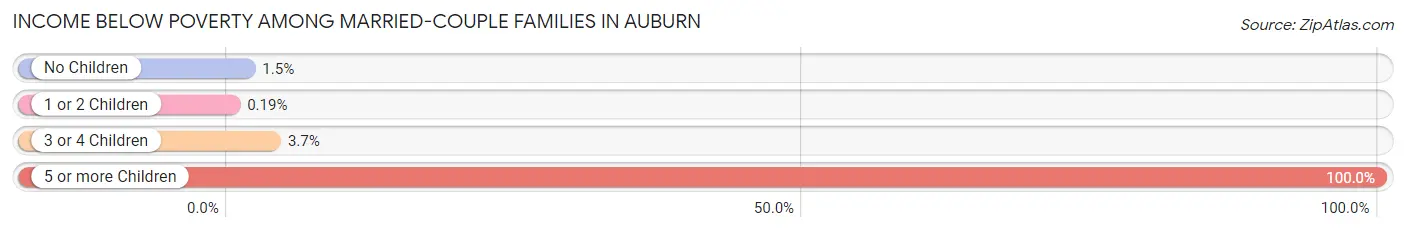
| Children | Above Poverty | Below Poverty |
| No Children | 2,539 (98.5%) | 39 (1.5%) |
| 1 or 2 Children | 1,075 (99.8%) | 2 (0.2%) |
| 3 or 4 Children | 360 (96.3%) | 14 (3.7%) |
| 5 or more Children | 0 (0.0%) | 27 (100.0%) |
| Total | 3,974 (98.0%) | 82 (2.0%) |
Income Below Poverty Among Single-Parent Households in Auburn
According to the poverty data in Auburn, 6.7% or 31 single-father households and 25.2% or 234 single-mother households are living below the poverty line. Among single-father households, those with no children have the highest poverty rate, with 27 households (13.9%) experiencing poverty. Likewise, among single-mother households, those with 1 or 2 children have the highest poverty rate, with 193 households (32.6%) falling below the poverty line.
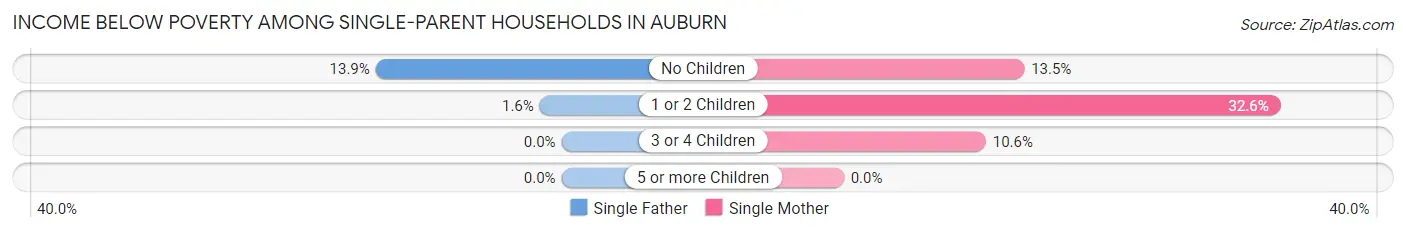
| Children | Single Father | Single Mother |
| No Children | 27 (13.9%) | 32 (13.5%) |
| 1 or 2 Children | 4 (1.6%) | 193 (32.6%) |
| 3 or 4 Children | 0 (0.0%) | 9 (10.6%) |
| 5 or more Children | 0 (0.0%) | 0 (0.0%) |
| Total | 31 (6.7%) | 234 (25.2%) |
Income Below Poverty Among Married-Couple vs Single-Parent Households in Auburn
The poverty data for Auburn shows that 82 of the married-couple family households (2.0%) and 265 of the single-parent households (19.0%) are living below the poverty level. Within the married-couple family households, those with 5 or more children have the highest poverty rate, with 27 households (100.0%) falling below the poverty line. Among the single-parent households, those with 1 or 2 children have the highest poverty rate, with 197 household (23.5%) living below poverty.
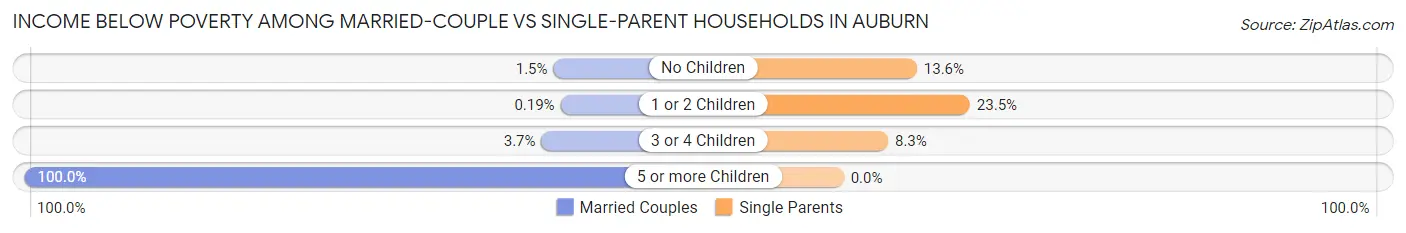
| Children | Married-Couple Families | Single-Parent Households |
| No Children | 39 (1.5%) | 59 (13.6%) |
| 1 or 2 Children | 2 (0.2%) | 197 (23.5%) |
| 3 or 4 Children | 14 (3.7%) | 9 (8.3%) |
| 5 or more Children | 27 (100.0%) | 0 (0.0%) |
| Total | 82 (2.0%) | 265 (19.0%) |
Race in Auburn
The most populous races in Auburn are White / Caucasian (22,249 | 92.6%), Two or more Races (1,076 | 4.5%), and Black / African American (529 | 2.2%).
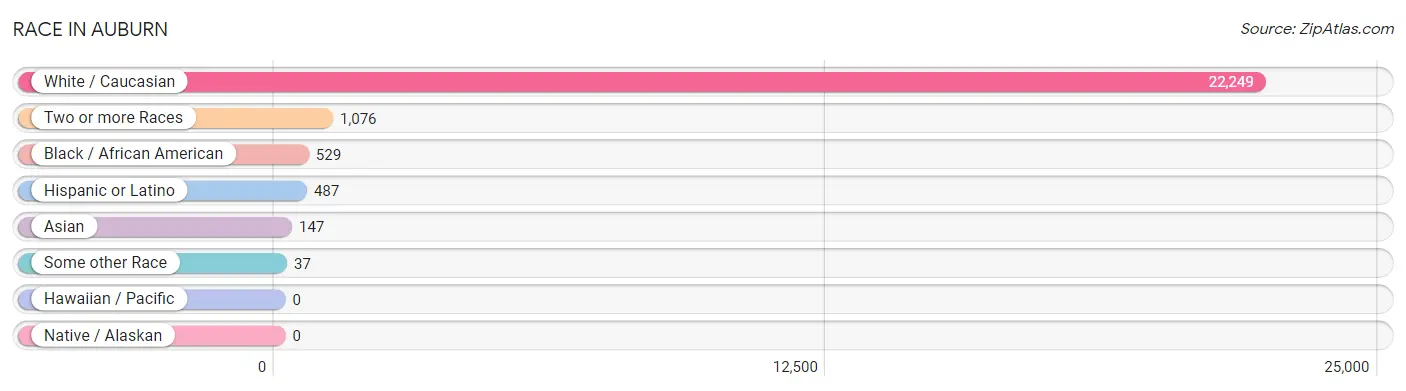
| Race | # Population | % Population |
| Asian | 147 | 0.6% |
| Black / African American | 529 | 2.2% |
| Hawaiian / Pacific | 0 | 0.0% |
| Hispanic or Latino | 487 | 2.0% |
| Native / Alaskan | 0 | 0.0% |
| White / Caucasian | 22,249 | 92.6% |
| Two or more Races | 1,076 | 4.5% |
| Some other Race | 37 | 0.2% |
| Total | 24,038 | 100.0% |
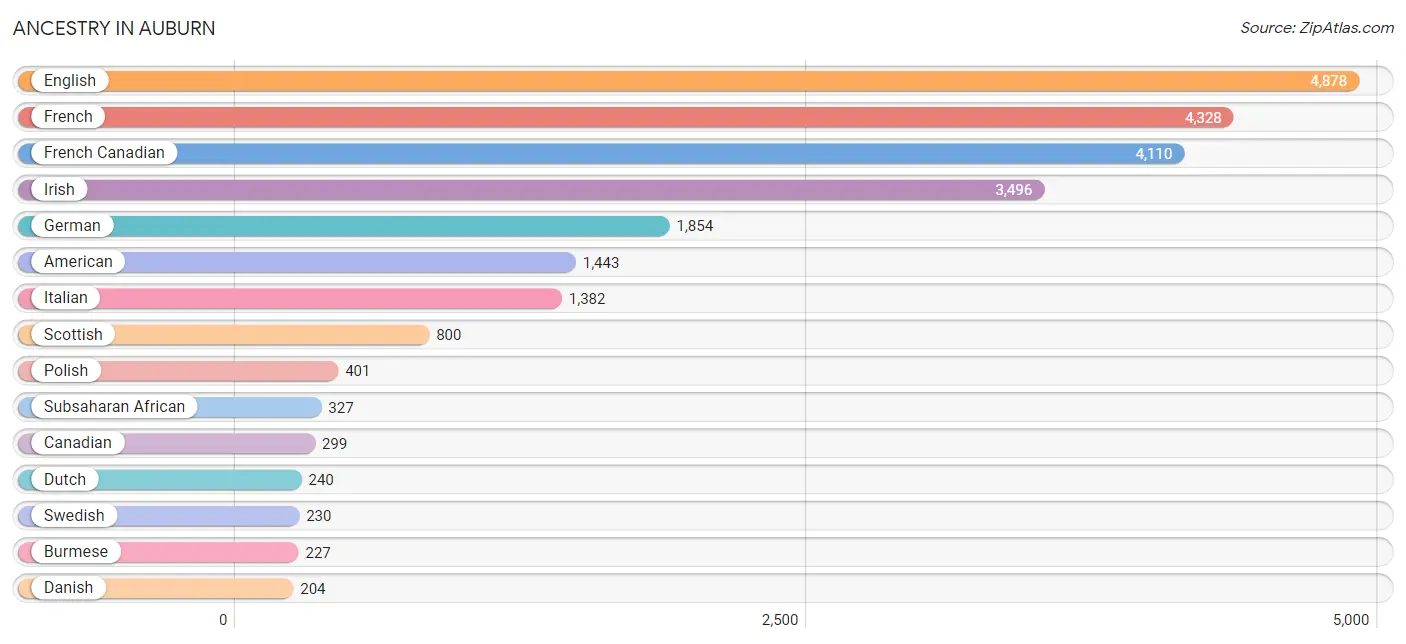
Ancestry in Auburn
The most populous ancestries reported in Auburn are English (4,878 | 20.3%), French (4,328 | 18.0%), French Canadian (4,110 | 17.1%), Irish (3,496 | 14.5%), and German (1,854 | 7.7%), together accounting for 77.6% of all Auburn residents.
| Ancestry | # Population | % Population |
| Afghan | 5 | 0.0% |
| African | 92 | 0.4% |
| American | 1,443 | 6.0% |
| Arab | 62 | 0.3% |
| Australian | 26 | 0.1% |
| Austrian | 65 | 0.3% |
| Bhutanese | 18 | 0.1% |
| Blackfeet | 6 | 0.0% |
| British | 125 | 0.5% |
| Burmese | 227 | 0.9% |
| Cajun | 6 | 0.0% |
| Canadian | 299 | 1.2% |
| Central American | 19 | 0.1% |
| Cherokee | 23 | 0.1% |
| Chickasaw | 7 | 0.0% |
| Chilean | 35 | 0.2% |
| Chippewa | 2 | 0.0% |
| Colombian | 32 | 0.1% |
| Costa Rican | 16 | 0.1% |
| Croatian | 28 | 0.1% |
| Cuban | 55 | 0.2% |
| Czech | 15 | 0.1% |
| Czechoslovakian | 2 | 0.0% |
| Danish | 204 | 0.9% |
| Dutch | 240 | 1.0% |
| Eastern European | 92 | 0.4% |
| Ecuadorian | 119 | 0.5% |
| English | 4,878 | 20.3% |
| European | 138 | 0.6% |
| Finnish | 148 | 0.6% |
| French | 4,328 | 18.0% |
| French American Indian | 2 | 0.0% |
| French Canadian | 4,110 | 17.1% |
| German | 1,854 | 7.7% |
| Greek | 148 | 0.6% |
| Guyanese | 60 | 0.3% |
| Honduran | 3 | 0.0% |
| Hungarian | 64 | 0.3% |
| Indian (Asian) | 59 | 0.3% |
| Inupiat | 4 | 0.0% |
| Irish | 3,496 | 14.5% |
| Iroquois | 24 | 0.1% |
| Italian | 1,382 | 5.8% |
| Jamaican | 43 | 0.2% |
| Kenyan | 7 | 0.0% |
| Korean | 55 | 0.2% |
| Lebanese | 62 | 0.3% |
| Lithuanian | 39 | 0.2% |
| Mexican | 54 | 0.2% |
| Nigerian | 153 | 0.6% |
| Northern European | 32 | 0.1% |
| Norwegian | 44 | 0.2% |
| Pennsylvania German | 4 | 0.0% |
| Polish | 401 | 1.7% |
| Portuguese | 62 | 0.3% |
| Puerto Rican | 162 | 0.7% |
| Romanian | 9 | 0.0% |
| Russian | 115 | 0.5% |
| Scandinavian | 80 | 0.3% |
| Scotch-Irish | 201 | 0.8% |
| Scottish | 800 | 3.3% |
| Serbian | 45 | 0.2% |
| Somali | 14 | 0.1% |
| South American | 187 | 0.8% |
| South American Indian | 35 | 0.2% |
| Spanish | 7 | 0.0% |
| Sri Lankan | 3 | 0.0% |
| Subsaharan African | 327 | 1.4% |
| Swedish | 230 | 1.0% |
| Swiss | 7 | 0.0% |
| Thai | 2 | 0.0% |
| Ukrainian | 78 | 0.3% |
| Venezuelan | 1 | 0.0% |
| Welsh | 141 | 0.6% | View All 74 Rows |
Immigrants in Auburn
The most numerous immigrant groups reported in Auburn came from Canada (239 | 1.0%), Africa (237 | 1.0%), Europe (156 | 0.6%), Western Africa (138 | 0.6%), and Asia (117 | 0.5%), together accounting for 3.7% of all Auburn residents.
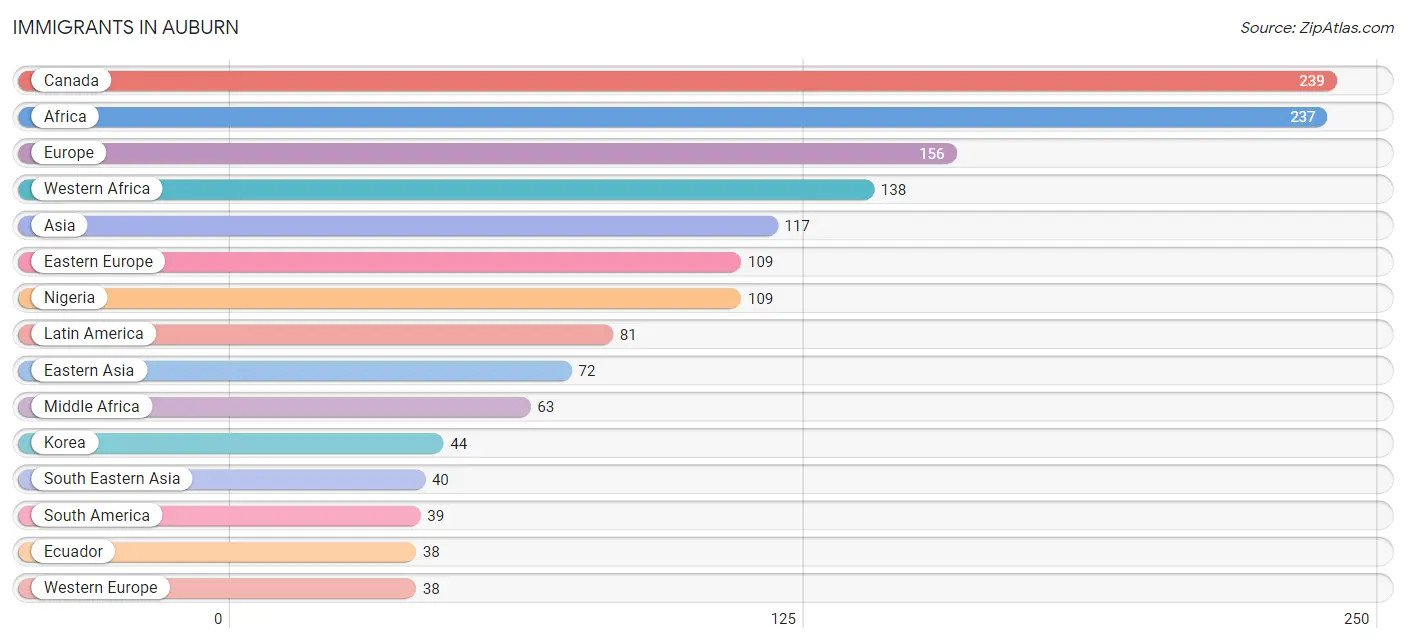
| Immigration Origin | # Population | % Population |
| Afghanistan | 5 | 0.0% |
| Africa | 237 | 1.0% |
| Asia | 117 | 0.5% |
| Canada | 239 | 1.0% |
| Caribbean | 24 | 0.1% |
| Central America | 18 | 0.1% |
| China | 28 | 0.1% |
| Costa Rica | 7 | 0.0% |
| Eastern Africa | 24 | 0.1% |
| Eastern Asia | 72 | 0.3% |
| Eastern Europe | 109 | 0.4% |
| Ecuador | 38 | 0.2% |
| El Salvador | 3 | 0.0% |
| Ethiopia | 9 | 0.0% |
| Europe | 156 | 0.6% |
| Germany | 17 | 0.1% |
| Ghana | 29 | 0.1% |
| Greece | 9 | 0.0% |
| Jamaica | 2 | 0.0% |
| Kenya | 12 | 0.1% |
| Korea | 44 | 0.2% |
| Latin America | 81 | 0.3% |
| Mexico | 8 | 0.0% |
| Middle Africa | 63 | 0.3% |
| Netherlands | 21 | 0.1% |
| Nigeria | 109 | 0.4% |
| Philippines | 18 | 0.1% |
| Poland | 31 | 0.1% |
| South America | 39 | 0.2% |
| South Central Asia | 5 | 0.0% |
| South Eastern Asia | 40 | 0.2% |
| Southern Europe | 9 | 0.0% |
| St. Vincent and the Grenadines | 22 | 0.1% |
| Taiwan | 14 | 0.1% |
| Ukraine | 19 | 0.1% |
| Venezuela | 1 | 0.0% |
| Vietnam | 3 | 0.0% |
| Western Africa | 138 | 0.6% |
| Western Europe | 38 | 0.2% | View All 39 Rows |
Sex and Age in Auburn
Sex and Age in Auburn
The most populous age groups in Auburn are 35 to 39 Years (1,013 | 8.8%) for men and 65 to 69 Years (1,006 | 8.1%) for women.
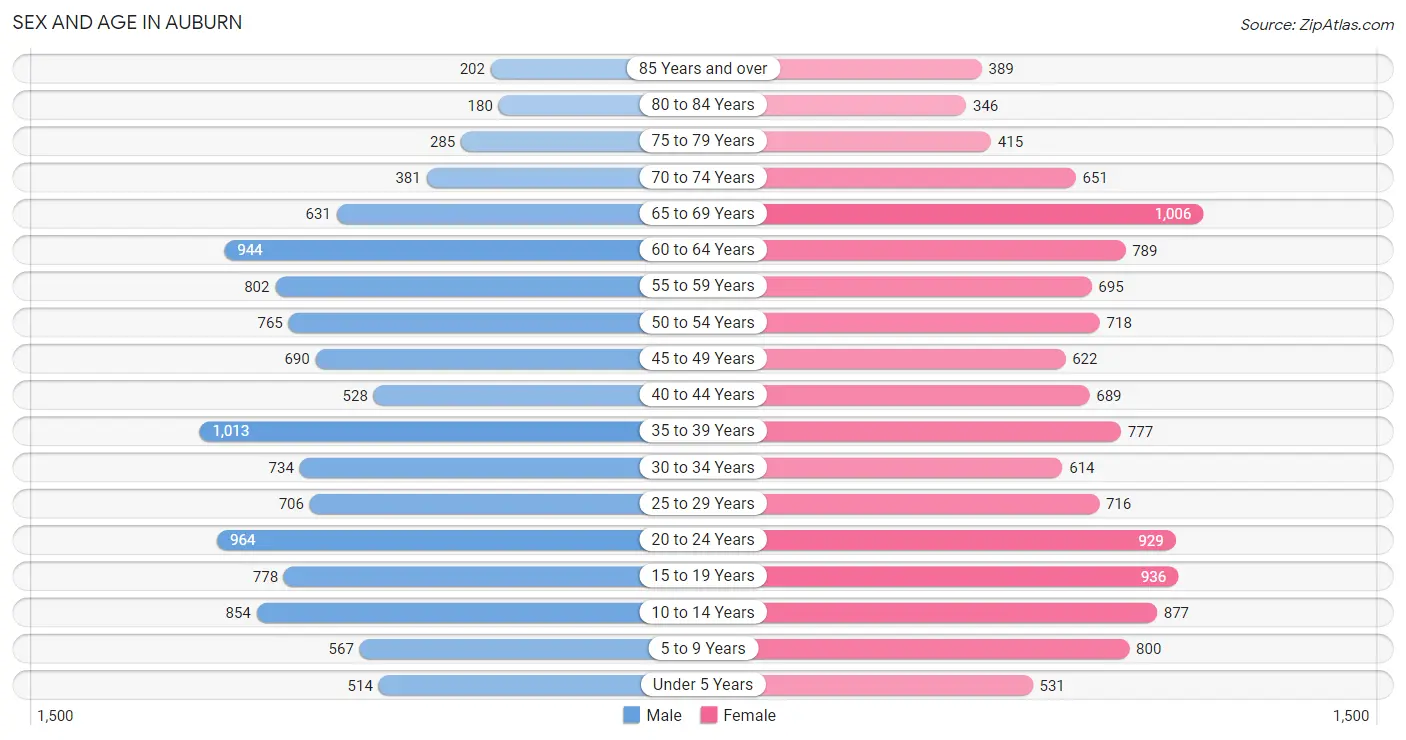
| Age Bracket | Male | Female |
| Under 5 Years | 514 (4.4%) | 531 (4.3%) |
| 5 to 9 Years | 567 (4.9%) | 800 (6.4%) |
| 10 to 14 Years | 854 (7.4%) | 877 (7.0%) |
| 15 to 19 Years | 778 (6.7%) | 936 (7.5%) |
| 20 to 24 Years | 964 (8.4%) | 929 (7.4%) |
| 25 to 29 Years | 706 (6.1%) | 716 (5.7%) |
| 30 to 34 Years | 734 (6.4%) | 614 (4.9%) |
| 35 to 39 Years | 1,013 (8.8%) | 777 (6.2%) |
| 40 to 44 Years | 528 (4.6%) | 689 (5.5%) |
| 45 to 49 Years | 690 (6.0%) | 622 (5.0%) |
| 50 to 54 Years | 765 (6.6%) | 718 (5.7%) |
| 55 to 59 Years | 802 (7.0%) | 695 (5.6%) |
| 60 to 64 Years | 944 (8.2%) | 789 (6.3%) |
| 65 to 69 Years | 631 (5.5%) | 1,006 (8.1%) |
| 70 to 74 Years | 381 (3.3%) | 651 (5.2%) |
| 75 to 79 Years | 285 (2.5%) | 415 (3.3%) |
| 80 to 84 Years | 180 (1.6%) | 346 (2.8%) |
| 85 Years and over | 202 (1.8%) | 389 (3.1%) |
| Total | 11,538 (100.0%) | 12,500 (100.0%) |
Families and Households in Auburn
Median Family Size in Auburn
The median family size in Auburn is 3.03 persons per family, with married-couple families (4,056 | 74.5%) accounting for the largest median family size of 3.14 persons per family. On the other hand, single male/father families (464 | 8.5%) represent the smallest median family size with 2.41 persons per family.
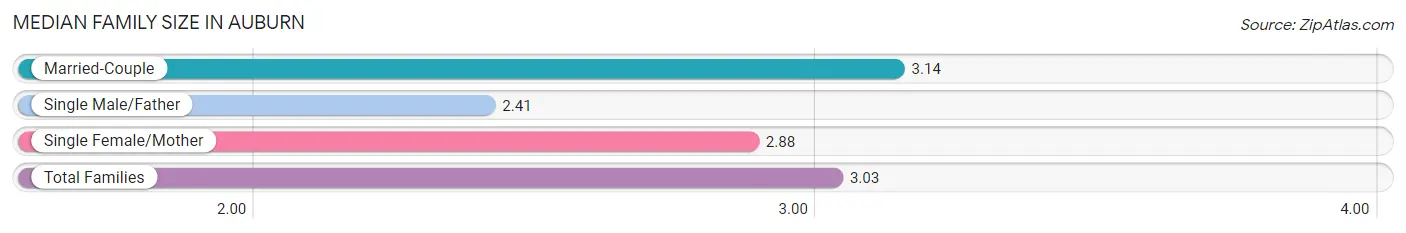
| Family Type | # Families | Family Size |
| Married-Couple | 4,056 (74.5%) | 3.14 |
| Single Male/Father | 464 (8.5%) | 2.41 |
| Single Female/Mother | 928 (17.0%) | 2.88 |
| Total Families | 5,448 (100.0%) | 3.03 |
Median Household Size in Auburn
The median household size in Auburn is 2.26 persons per household, with single female/mother households (928 | 9.0%) accounting for the largest median household size of 3.21 persons per household. non-family households (4,861 | 47.1%) represent the smallest median household size with 1.25 persons per household.
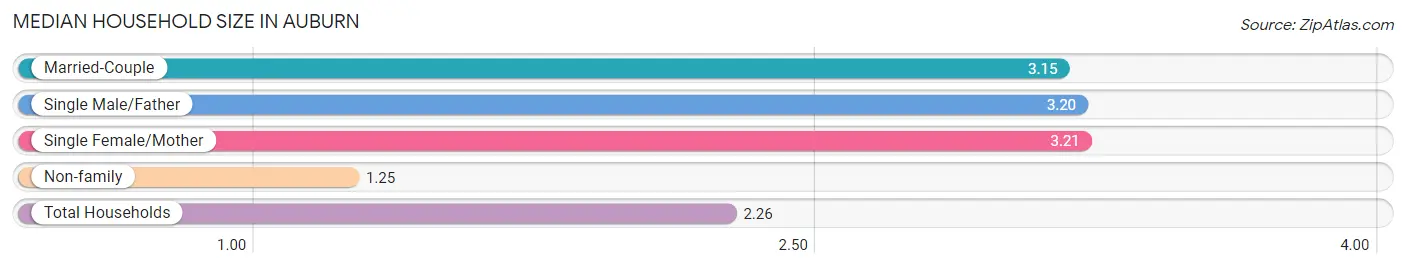
| Household Type | # Households | Household Size |
| Married-Couple | 4,056 (39.3%) | 3.15 |
| Single Male/Father | 464 (4.5%) | 3.20 |
| Single Female/Mother | 928 (9.0%) | 3.21 |
| Non-family | 4,861 (47.1%) | 1.25 |
| Total Households | 10,309 (100.0%) | 2.26 |
Household Size by Marriage Status in Auburn
Out of a total of 10,309 households in Auburn, 5,448 (52.8%) are family households, while 4,861 (47.1%) are nonfamily households. The most numerous type of family households are 2-person households, comprising 2,705, and the most common type of nonfamily households are 1-person households, comprising 3,807.
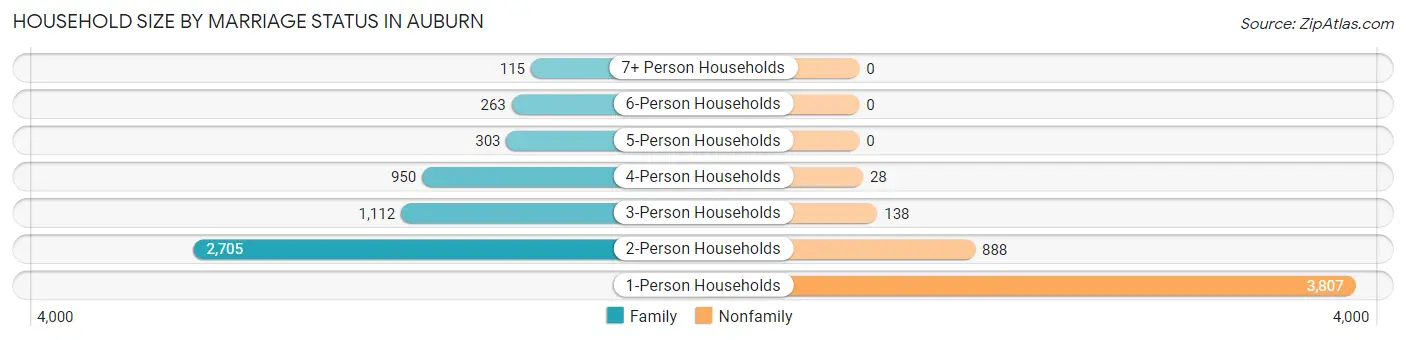
| Household Size | Family Households | Nonfamily Households |
| 1-Person Households | - | 3,807 (36.9%) |
| 2-Person Households | 2,705 (26.2%) | 888 (8.6%) |
| 3-Person Households | 1,112 (10.8%) | 138 (1.3%) |
| 4-Person Households | 950 (9.2%) | 28 (0.3%) |
| 5-Person Households | 303 (2.9%) | 0 (0.0%) |
| 6-Person Households | 263 (2.5%) | 0 (0.0%) |
| 7+ Person Households | 115 (1.1%) | 0 (0.0%) |
| Total | 5,448 (52.8%) | 4,861 (47.1%) |
Female Fertility in Auburn
Fertility by Age in Auburn
Average fertility rate in Auburn is 37.0 births per 1,000 women. Women in the age bracket of 20 to 34 years have the highest fertility rate with 86.0 births per 1,000 women. Women in the age bracket of 20 to 34 years acount for 96.1% of all women with births.
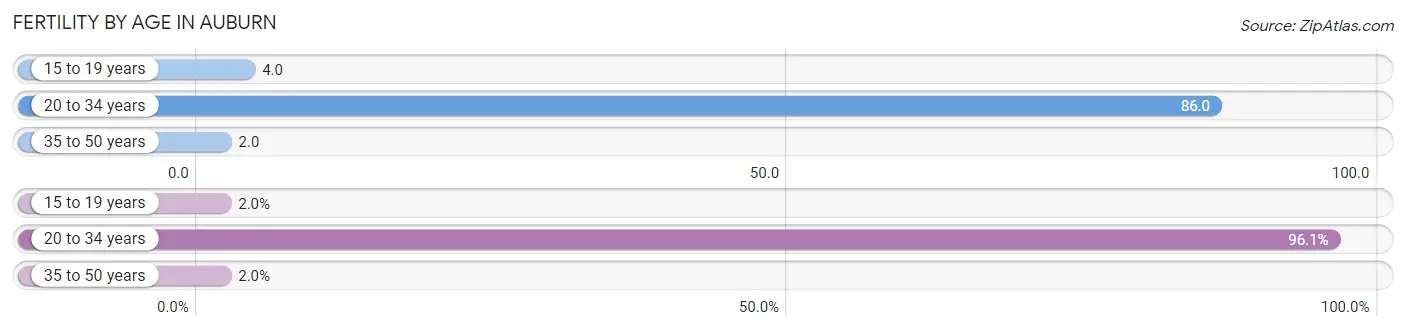
| Age Bracket | Women with Births | Births / 1,000 Women |
| 15 to 19 years | 4 (2.0%) | 4.0 |
| 20 to 34 years | 195 (96.1%) | 86.0 |
| 35 to 50 years | 4 (2.0%) | 2.0 |
| Total | 203 (100.0%) | 37.0 |
Fertility by Age by Marriage Status in Auburn
49.8% of women with births (203) in Auburn are married. The highest percentage of unmarried women with births falls into 15 to 19 years age bracket with 100.0% of them unmarried at the time of birth, while the lowest percentage of unmarried women with births belong to 35 to 50 years age bracket with 0.0% of them unmarried.
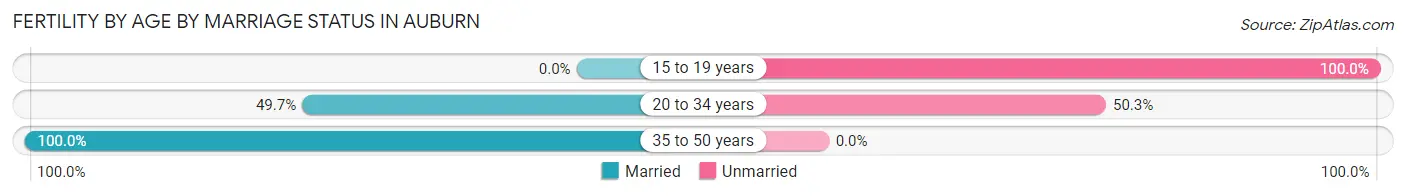
| Age Bracket | Married | Unmarried |
| 15 to 19 years | 0 (0.0%) | 4 (100.0%) |
| 20 to 34 years | 97 (49.7%) | 98 (50.3%) |
| 35 to 50 years | 4 (100.0%) | 0 (0.0%) |
| Total | 101 (49.7%) | 102 (50.2%) |
Fertility by Education in Auburn
Average fertility rate in Auburn is 37.0 births per 1,000 women. Women with the education attainment of bachelor's degree have the highest fertility rate of 71.0 births per 1,000 women, while women with the education attainment of less than high school have the lowest fertility at 16.0 births per 1,000 women. Women with the education attainment of bachelor's degree represent 39.9% of all women with births.
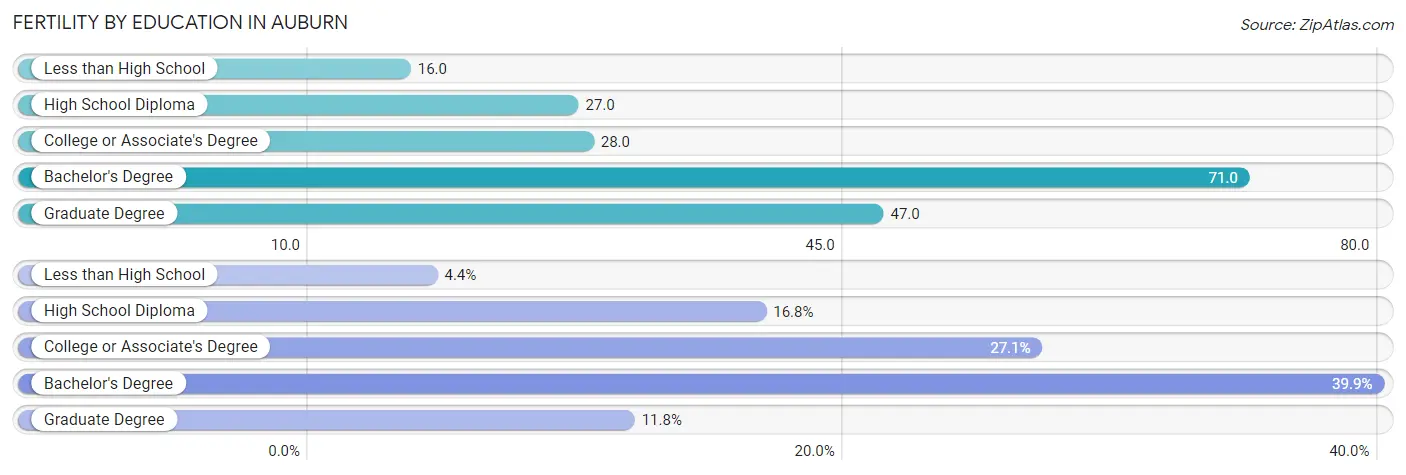
| Educational Attainment | Women with Births | Births / 1,000 Women |
| Less than High School | 9 (4.4%) | 16.0 |
| High School Diploma | 34 (16.8%) | 27.0 |
| College or Associate's Degree | 55 (27.1%) | 28.0 |
| Bachelor's Degree | 81 (39.9%) | 71.0 |
| Graduate Degree | 24 (11.8%) | 47.0 |
| Total | 203 (100.0%) | 37.0 |
Fertility by Education by Marriage Status in Auburn
50.2% of women with births in Auburn are unmarried. Women with the educational attainment of graduate degree are most likely to be married with 100.0% of them married at childbirth, while women with the educational attainment of less than high school are least likely to be married with 100.0% of them unmarried at childbirth.
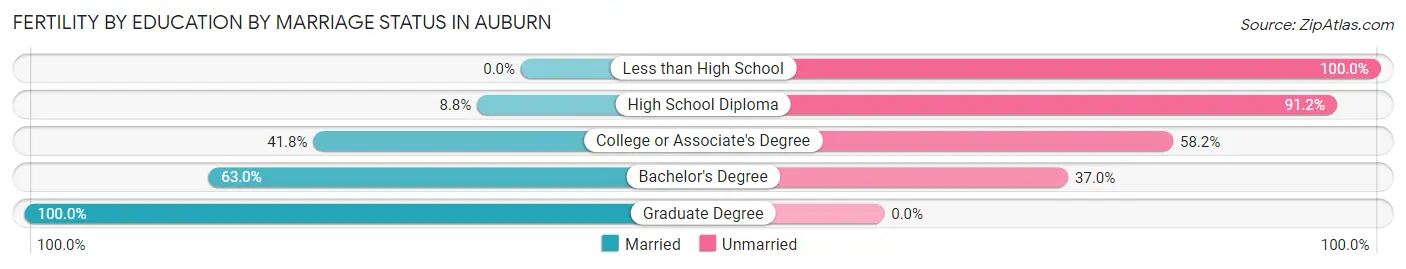
| Educational Attainment | Married | Unmarried |
| Less than High School | 0 (0.0%) | 9 (100.0%) |
| High School Diploma | 3 (8.8%) | 31 (91.2%) |
| College or Associate's Degree | 23 (41.8%) | 32 (58.2%) |
| Bachelor's Degree | 51 (63.0%) | 30 (37.0%) |
| Graduate Degree | 24 (100.0%) | 0 (0.0%) |
| Total | 101 (49.7%) | 102 (50.2%) |
Employment Characteristics in Auburn
Employment by Class of Employer in Auburn
Among the 11,698 employed individuals in Auburn, private company employees (7,803 | 66.7%), not-for-profit organizations (1,287 | 11.0%), and self-employed (not incorporated) (734 | 6.3%) make up the most common classes of employment.
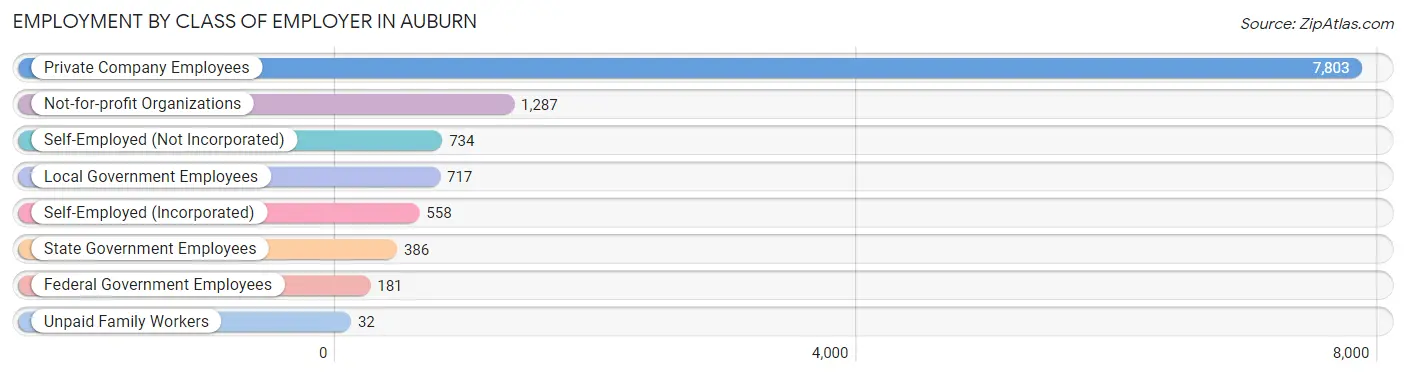
| Employer Class | # Employees | % Employees |
| Private Company Employees | 7,803 | 66.7% |
| Self-Employed (Incorporated) | 558 | 4.8% |
| Self-Employed (Not Incorporated) | 734 | 6.3% |
| Not-for-profit Organizations | 1,287 | 11.0% |
| Local Government Employees | 717 | 6.1% |
| State Government Employees | 386 | 3.3% |
| Federal Government Employees | 181 | 1.5% |
| Unpaid Family Workers | 32 | 0.3% |
| Total | 11,698 | 100.0% |
Employment Status by Age in Auburn
According to the labor force statistics for Auburn, out of the total population over 16 years of age (19,610), 66.9% or 13,119 individuals are in the labor force, with 6.5% or 853 of them unemployed. The age group with the highest labor force participation rate is 30 to 34 years, with 95.3% or 1,285 individuals in the labor force. Within the labor force, the 16 to 19 years age range has the highest percentage of unemployed individuals, with 21.3% or 201 of them being unemployed.
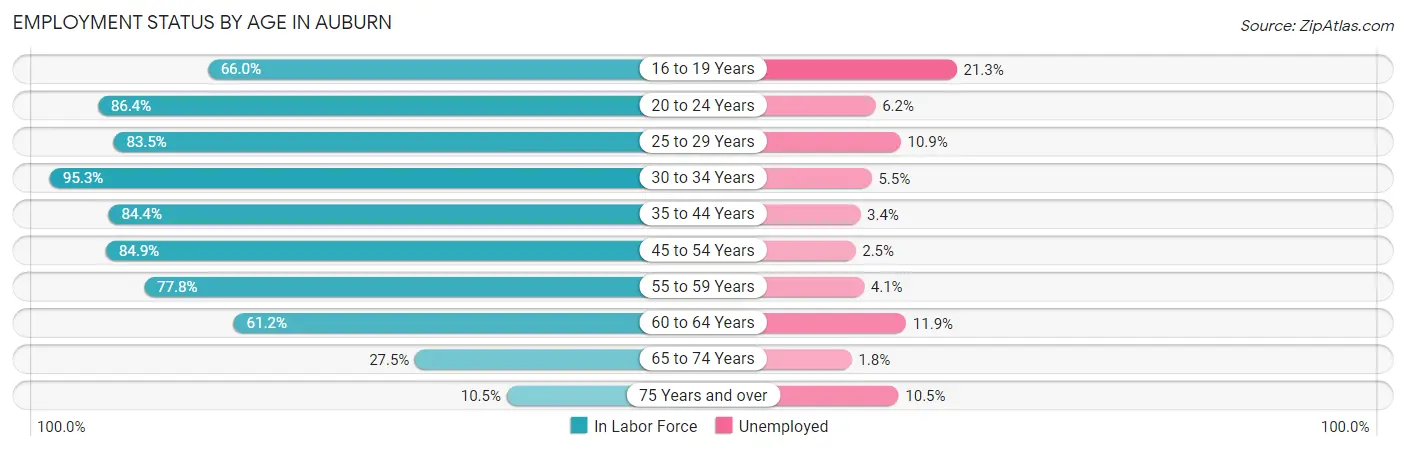
| Age Bracket | In Labor Force | Unemployed |
| 16 to 19 Years | 943 (66.0%) | 201 (21.3%) |
| 20 to 24 Years | 1,636 (86.4%) | 101 (6.2%) |
| 25 to 29 Years | 1,187 (83.5%) | 129 (10.9%) |
| 30 to 34 Years | 1,285 (95.3%) | 71 (5.5%) |
| 35 to 44 Years | 2,538 (84.4%) | 86 (3.4%) |
| 45 to 54 Years | 2,373 (84.9%) | 59 (2.5%) |
| 55 to 59 Years | 1,165 (77.8%) | 48 (4.1%) |
| 60 to 64 Years | 1,061 (61.2%) | 126 (11.9%) |
| 65 to 74 Years | 734 (27.5%) | 13 (1.8%) |
| 75 Years and over | 191 (10.5%) | 20 (10.5%) |
| Total | 13,119 (66.9%) | 853 (6.5%) |
Employment Status by Educational Attainment in Auburn
According to labor force statistics for Auburn, 81.4% of individuals (9,607) out of the total population between 25 and 64 years of age (11,802) are in the labor force, with 5.4% or 519 of them being unemployed. The group with the highest labor force participation rate are those with the educational attainment of bachelor's degree or higher, with 88.8% or 2,927 individuals in the labor force. Within the labor force, individuals with high school diploma education have the highest percentage of unemployment, with 9.0% or 233 of them being unemployed.
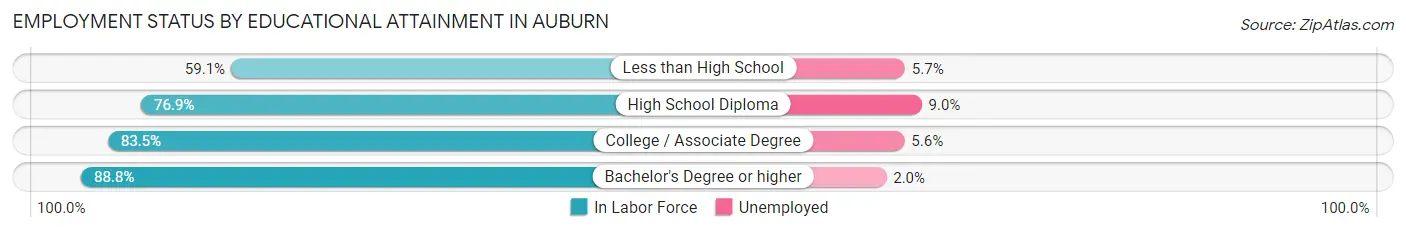
| Educational Attainment | In Labor Force | Unemployed |
| Less than High School | 474 (59.1%) | 46 (5.7%) |
| High School Diploma | 2,592 (76.9%) | 303 (9.0%) |
| College / Associate Degree | 3,618 (83.5%) | 243 (5.6%) |
| Bachelor's Degree or higher | 2,927 (88.8%) | 66 (2.0%) |
| Total | 9,607 (81.4%) | 637 (5.4%) |
Employment Occupations by Sex in Auburn
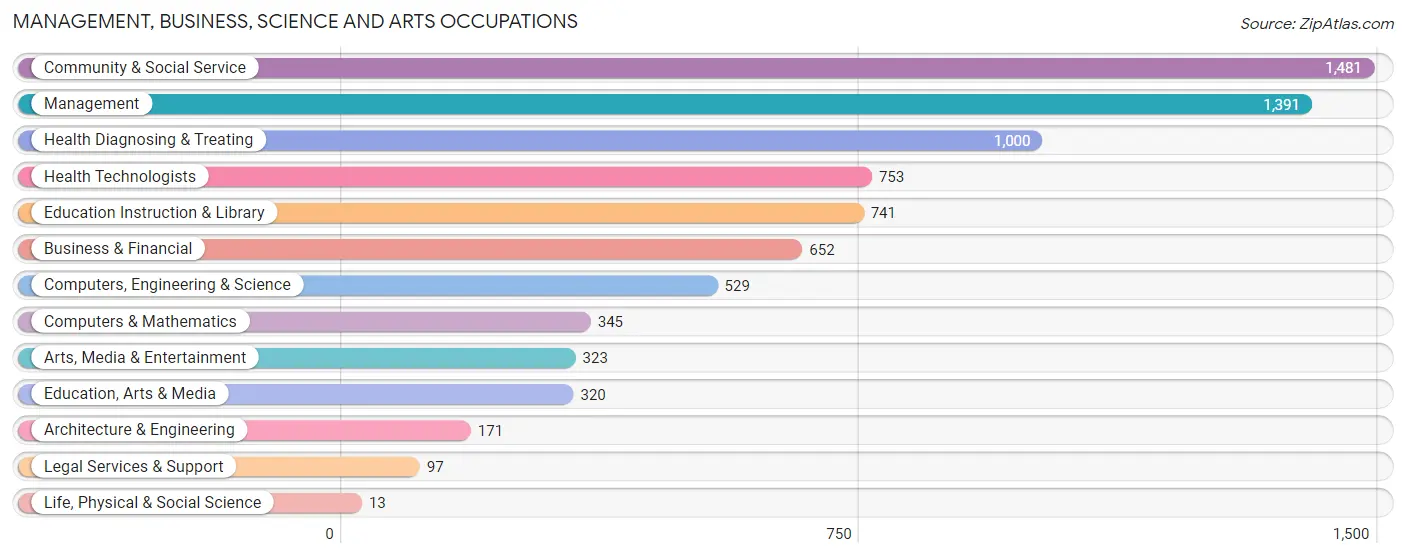
Management, Business, Science and Arts Occupations
The most common Management, Business, Science and Arts occupations in Auburn are Community & Social Service (1,481 | 12.1%), Management (1,391 | 11.4%), Health Diagnosing & Treating (1,000 | 8.2%), Health Technologists (753 | 6.2%), and Education Instruction & Library (741 | 6.1%).
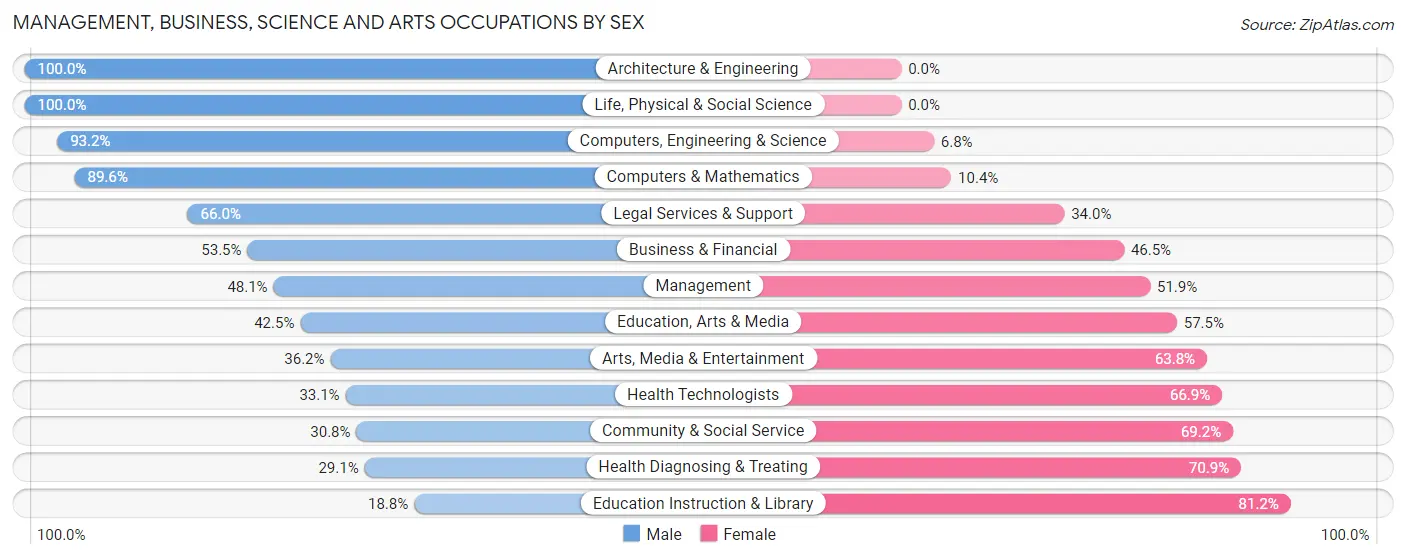
Management, Business, Science and Arts Occupations by Sex
Within the Management, Business, Science and Arts occupations in Auburn, the most male-oriented occupations are Architecture & Engineering (100.0%), Life, Physical & Social Science (100.0%), and Computers, Engineering & Science (93.2%), while the most female-oriented occupations are Education Instruction & Library (81.2%), Health Diagnosing & Treating (70.9%), and Community & Social Service (69.2%).
| Occupation | Male | Female |
| Management | 669 (48.1%) | 722 (51.9%) |
| Business & Financial | 349 (53.5%) | 303 (46.5%) |
| Computers, Engineering & Science | 493 (93.2%) | 36 (6.8%) |
| Computers & Mathematics | 309 (89.6%) | 36 (10.4%) |
| Architecture & Engineering | 171 (100.0%) | 0 (0.0%) |
| Life, Physical & Social Science | 13 (100.0%) | 0 (0.0%) |
| Community & Social Service | 456 (30.8%) | 1,025 (69.2%) |
| Education, Arts & Media | 136 (42.5%) | 184 (57.5%) |
| Legal Services & Support | 64 (66.0%) | 33 (34.0%) |
| Education Instruction & Library | 139 (18.8%) | 602 (81.2%) |
| Arts, Media & Entertainment | 117 (36.2%) | 206 (63.8%) |
| Health Diagnosing & Treating | 291 (29.1%) | 709 (70.9%) |
| Health Technologists | 249 (33.1%) | 504 (66.9%) |
| Total (Category) | 2,258 (44.7%) | 2,795 (55.3%) |
| Total (Overall) | 6,413 (52.5%) | 5,804 (47.5%) |
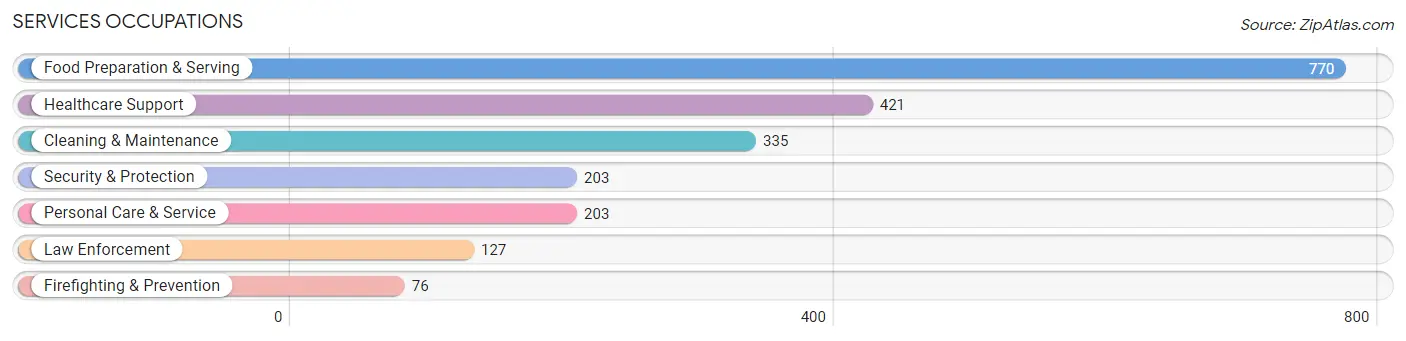
Services Occupations
The most common Services occupations in Auburn are Food Preparation & Serving (770 | 6.3%), Healthcare Support (421 | 3.5%), Cleaning & Maintenance (335 | 2.7%), Security & Protection (203 | 1.7%), and Personal Care & Service (203 | 1.7%).
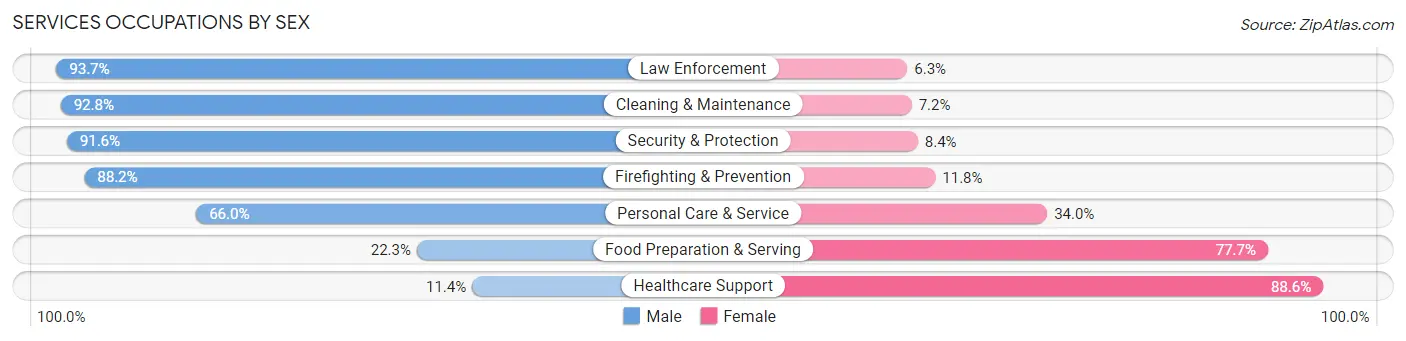
Services Occupations by Sex
Within the Services occupations in Auburn, the most male-oriented occupations are Law Enforcement (93.7%), Cleaning & Maintenance (92.8%), and Security & Protection (91.6%), while the most female-oriented occupations are Healthcare Support (88.6%), Food Preparation & Serving (77.7%), and Personal Care & Service (34.0%).
| Occupation | Male | Female |
| Healthcare Support | 48 (11.4%) | 373 (88.6%) |
| Security & Protection | 186 (91.6%) | 17 (8.4%) |
| Firefighting & Prevention | 67 (88.2%) | 9 (11.8%) |
| Law Enforcement | 119 (93.7%) | 8 (6.3%) |
| Food Preparation & Serving | 172 (22.3%) | 598 (77.7%) |
| Cleaning & Maintenance | 311 (92.8%) | 24 (7.2%) |
| Personal Care & Service | 134 (66.0%) | 69 (34.0%) |
| Total (Category) | 851 (44.1%) | 1,081 (55.9%) |
| Total (Overall) | 6,413 (52.5%) | 5,804 (47.5%) |
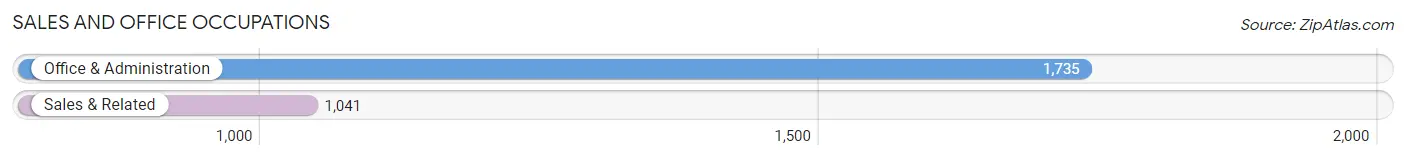
Sales and Office Occupations
The most common Sales and Office occupations in Auburn are Office & Administration (1,735 | 14.2%), and Sales & Related (1,041 | 8.5%).
Sales and Office Occupations by Sex
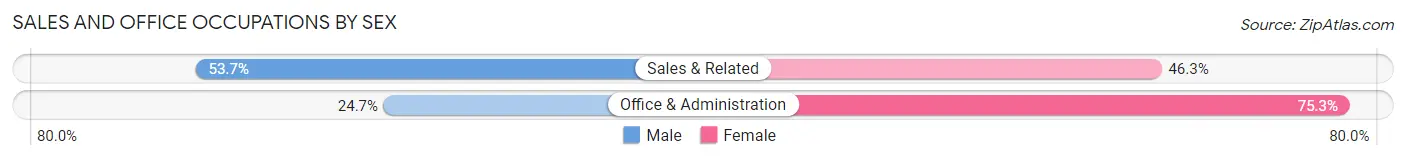
| Occupation | Male | Female |
| Sales & Related | 559 (53.7%) | 482 (46.3%) |
| Office & Administration | 429 (24.7%) | 1,306 (75.3%) |
| Total (Category) | 988 (35.6%) | 1,788 (64.4%) |
| Total (Overall) | 6,413 (52.5%) | 5,804 (47.5%) |
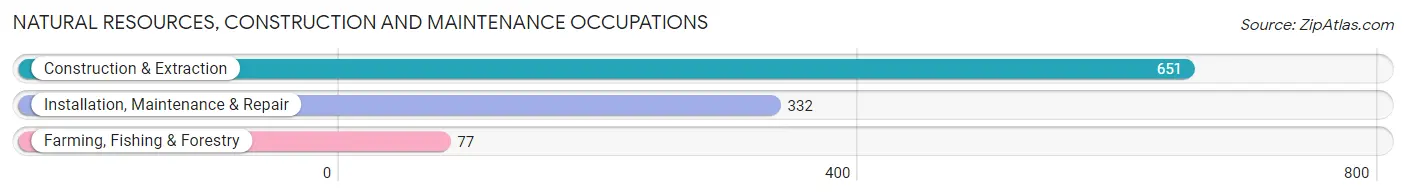
Natural Resources, Construction and Maintenance Occupations
The most common Natural Resources, Construction and Maintenance occupations in Auburn are Construction & Extraction (651 | 5.3%), Installation, Maintenance & Repair (332 | 2.7%), and Farming, Fishing & Forestry (77 | 0.6%).
Natural Resources, Construction and Maintenance Occupations by Sex
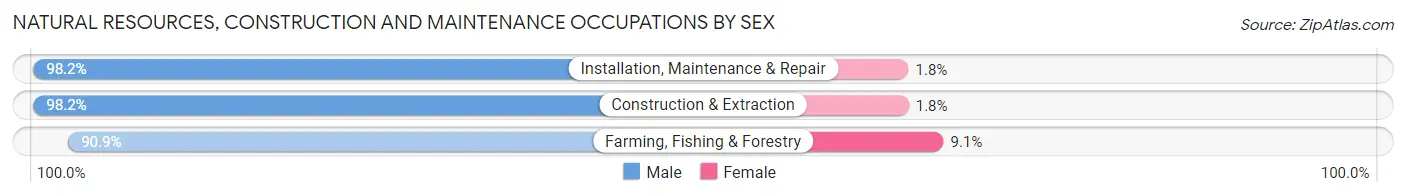
| Occupation | Male | Female |
| Farming, Fishing & Forestry | 70 (90.9%) | 7 (9.1%) |
| Construction & Extraction | 639 (98.2%) | 12 (1.8%) |
| Installation, Maintenance & Repair | 326 (98.2%) | 6 (1.8%) |
| Total (Category) | 1,035 (97.6%) | 25 (2.4%) |
| Total (Overall) | 6,413 (52.5%) | 5,804 (47.5%) |
Production, Transportation and Moving Occupations
The most common Production, Transportation and Moving occupations in Auburn are Production (633 | 5.2%), Material Moving (439 | 3.6%), and Transportation (324 | 2.6%).
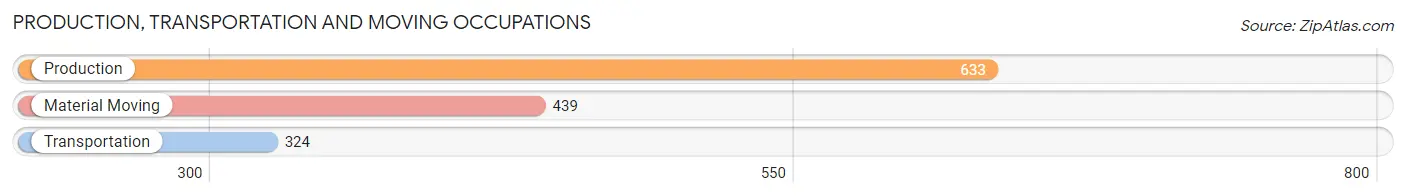
Production, Transportation and Moving Occupations by Sex
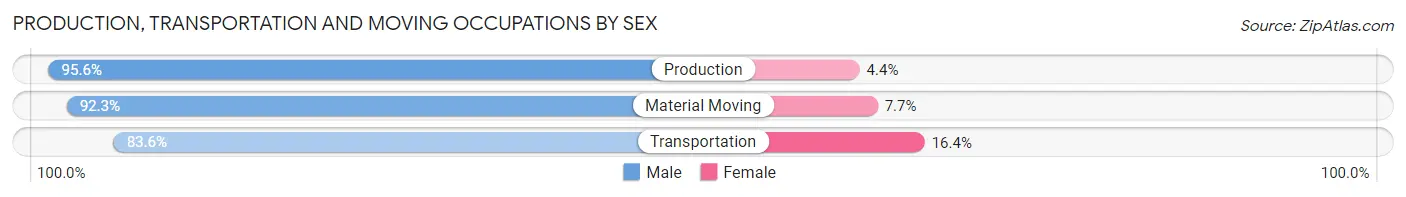
| Occupation | Male | Female |
| Production | 605 (95.6%) | 28 (4.4%) |
| Transportation | 271 (83.6%) | 53 (16.4%) |
| Material Moving | 405 (92.3%) | 34 (7.7%) |
| Total (Category) | 1,281 (91.8%) | 115 (8.2%) |
| Total (Overall) | 6,413 (52.5%) | 5,804 (47.5%) |
Employment Industries by Sex in Auburn
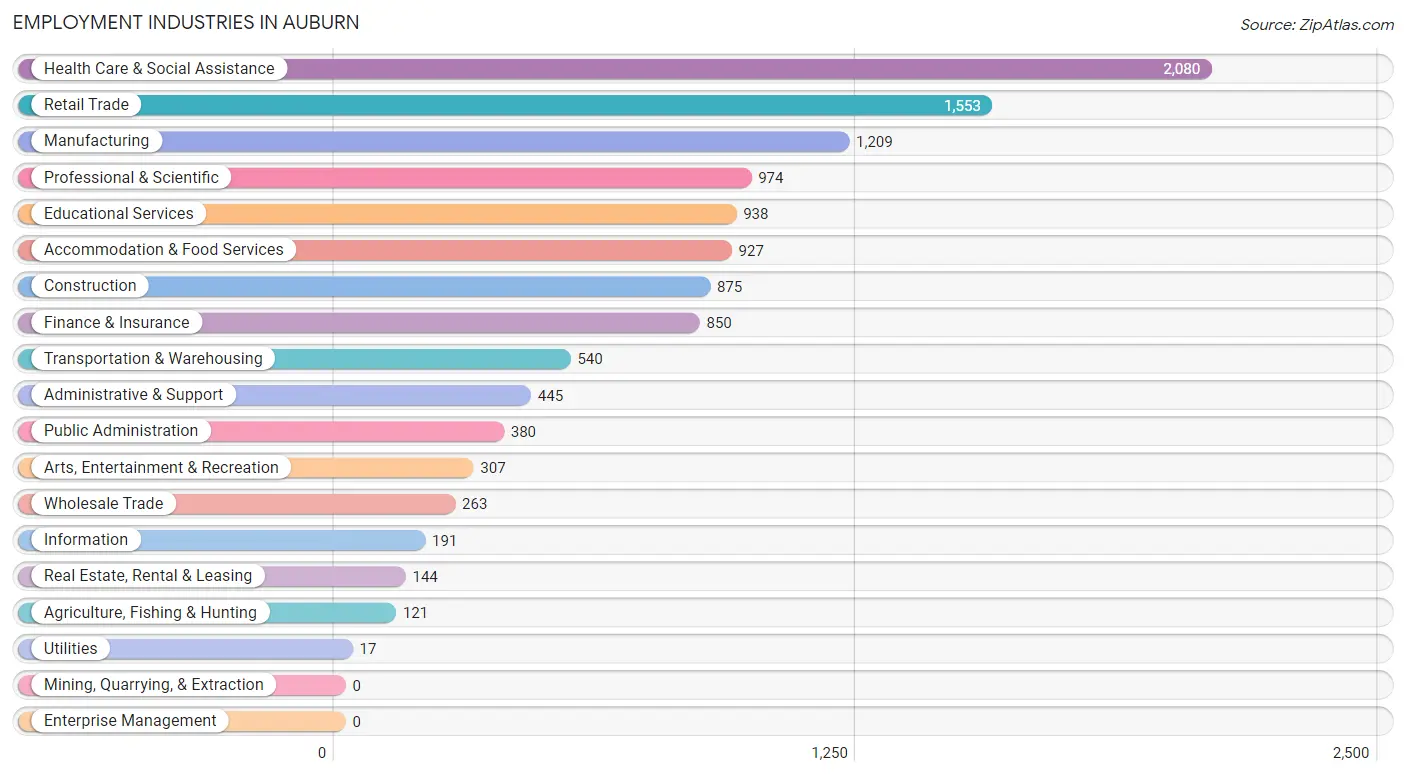
Employment Industries in Auburn
The major employment industries in Auburn include Health Care & Social Assistance (2,080 | 17.0%), Retail Trade (1,553 | 12.7%), Manufacturing (1,209 | 9.9%), Professional & Scientific (974 | 8.0%), and Educational Services (938 | 7.7%).
Employment Industries by Sex in Auburn
The Auburn industries that see more men than women are Agriculture, Fishing & Hunting (100.0%), Utilities (100.0%), and Construction (96.2%), whereas the industries that tend to have a higher number of women are Health Care & Social Assistance (84.6%), Educational Services (78.1%), and Accommodation & Food Services (67.5%).
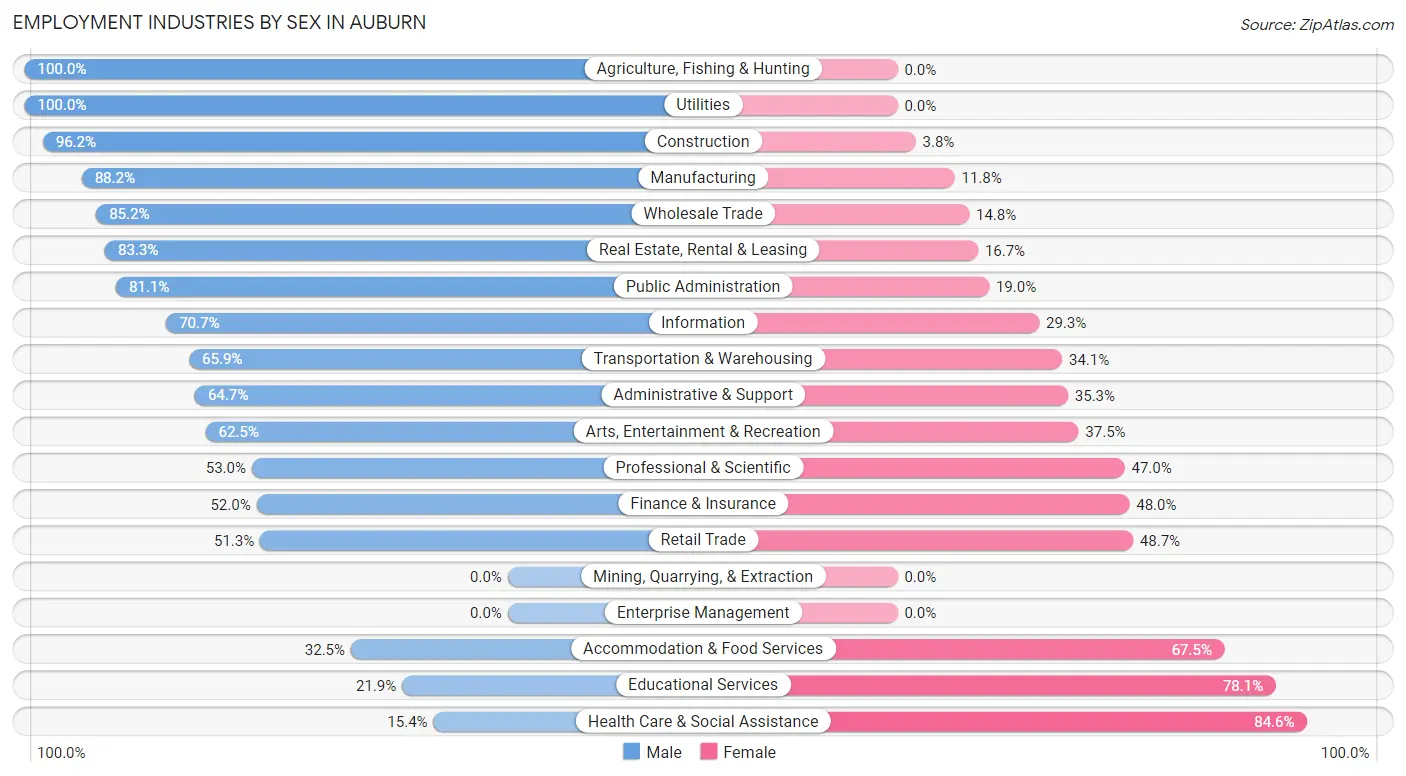
| Industry | Male | Female |
| Agriculture, Fishing & Hunting | 121 (100.0%) | 0 (0.0%) |
| Mining, Quarrying, & Extraction | 0 (0.0%) | 0 (0.0%) |
| Construction | 842 (96.2%) | 33 (3.8%) |
| Manufacturing | 1,066 (88.2%) | 143 (11.8%) |
| Wholesale Trade | 224 (85.2%) | 39 (14.8%) |
| Retail Trade | 796 (51.3%) | 757 (48.7%) |
| Transportation & Warehousing | 356 (65.9%) | 184 (34.1%) |
| Utilities | 17 (100.0%) | 0 (0.0%) |
| Information | 135 (70.7%) | 56 (29.3%) |
| Finance & Insurance | 442 (52.0%) | 408 (48.0%) |
| Real Estate, Rental & Leasing | 120 (83.3%) | 24 (16.7%) |
| Professional & Scientific | 516 (53.0%) | 458 (47.0%) |
| Enterprise Management | 0 (0.0%) | 0 (0.0%) |
| Administrative & Support | 288 (64.7%) | 157 (35.3%) |
| Educational Services | 205 (21.9%) | 733 (78.1%) |
| Health Care & Social Assistance | 320 (15.4%) | 1,760 (84.6%) |
| Arts, Entertainment & Recreation | 192 (62.5%) | 115 (37.5%) |
| Accommodation & Food Services | 301 (32.5%) | 626 (67.5%) |
| Public Administration | 308 (81.0%) | 72 (19.0%) |
| Total | 6,413 (52.5%) | 5,804 (47.5%) |
Education in Auburn
School Enrollment in Auburn
The most common levels of schooling among the 5,572 students in Auburn are middle school (1,426 | 25.6%), college / undergraduate (1,297 | 23.3%), and high school (1,157 | 20.8%).
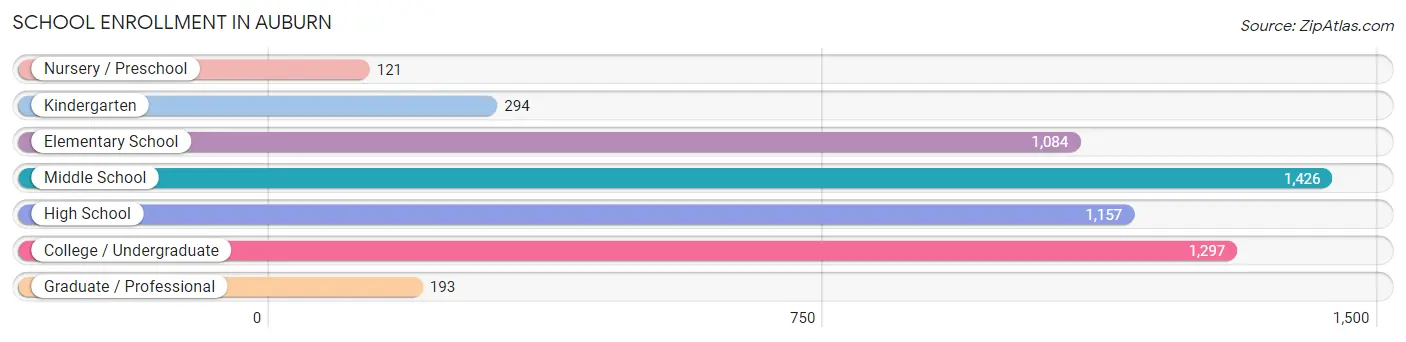
| School Level | # Students | % Students |
| Nursery / Preschool | 121 | 2.2% |
| Kindergarten | 294 | 5.3% |
| Elementary School | 1,084 | 19.5% |
| Middle School | 1,426 | 25.6% |
| High School | 1,157 | 20.8% |
| College / Undergraduate | 1,297 | 23.3% |
| Graduate / Professional | 193 | 3.5% |
| Total | 5,572 | 100.0% |
School Enrollment by Age by Funding Source in Auburn
Out of a total of 5,572 students who are enrolled in schools in Auburn, 1,337 (24.0%) attend a private institution, while the remaining 4,235 (76.0%) are enrolled in public schools. The age group of 35 years and over has the highest likelihood of being enrolled in private schools, with 107 (36.9% in the age bracket) enrolled. Conversely, the age group of 15 to 17 year olds has the lowest likelihood of being enrolled in a private school, with 779 (90.8% in the age bracket) attending a public institution.
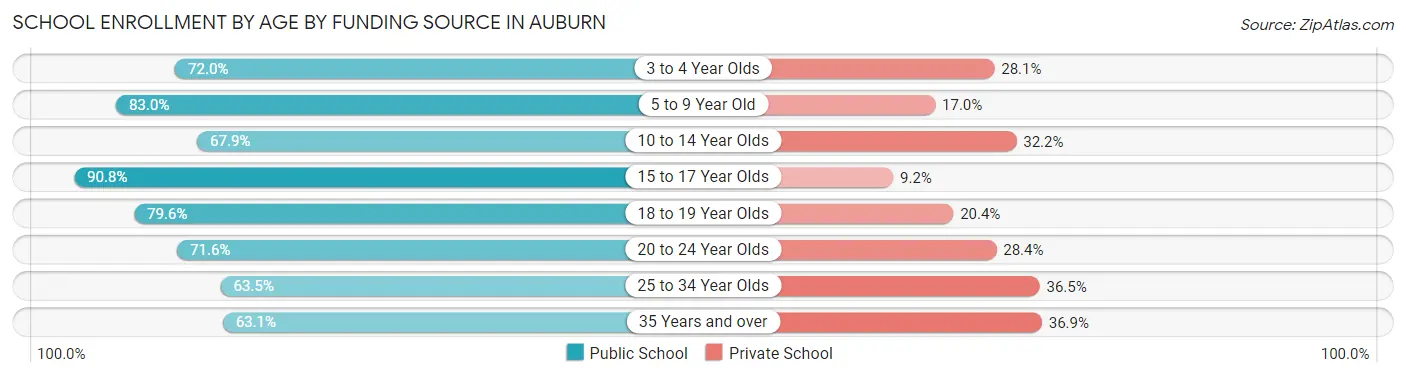
| Age Bracket | Public School | Private School |
| 3 to 4 Year Olds | 59 (72.0%) | 23 (28.1%) |
| 5 to 9 Year Old | 1,057 (83.0%) | 217 (17.0%) |
| 10 to 14 Year Olds | 1,131 (67.8%) | 536 (32.2%) |
| 15 to 17 Year Olds | 779 (90.8%) | 79 (9.2%) |
| 18 to 19 Year Olds | 437 (79.6%) | 112 (20.4%) |
| 20 to 24 Year Olds | 398 (71.6%) | 158 (28.4%) |
| 25 to 34 Year Olds | 188 (63.5%) | 108 (36.5%) |
| 35 Years and over | 183 (63.1%) | 107 (36.9%) |
| Total | 4,235 (76.0%) | 1,337 (24.0%) |
Educational Attainment by Field of Study in Auburn
Business (712 | 14.9%), education (603 | 12.6%), science & technology (478 | 10.0%), social sciences (437 | 9.1%), and literature & languages (377 | 7.9%) are the most common fields of study among 4,788 individuals in Auburn who have obtained a bachelor's degree or higher.
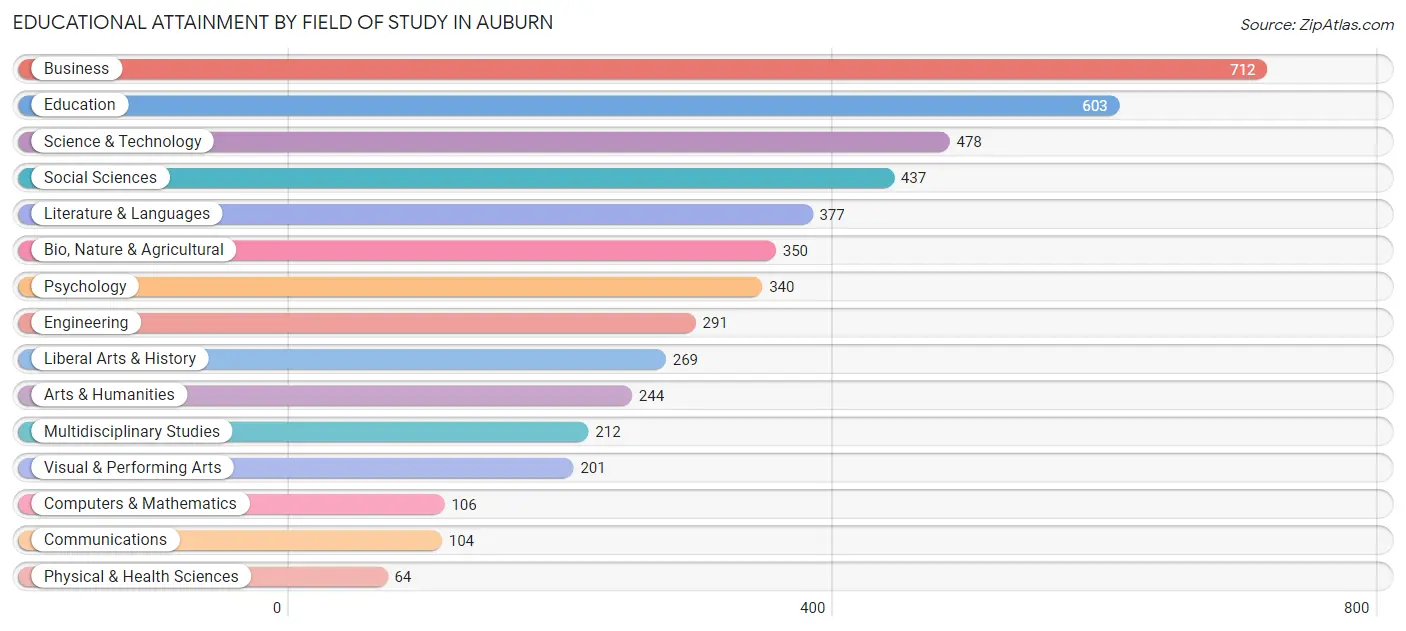
| Field of Study | # Graduates | % Graduates |
| Computers & Mathematics | 106 | 2.2% |
| Bio, Nature & Agricultural | 350 | 7.3% |
| Physical & Health Sciences | 64 | 1.3% |
| Psychology | 340 | 7.1% |
| Social Sciences | 437 | 9.1% |
| Engineering | 291 | 6.1% |
| Multidisciplinary Studies | 212 | 4.4% |
| Science & Technology | 478 | 10.0% |
| Business | 712 | 14.9% |
| Education | 603 | 12.6% |
| Literature & Languages | 377 | 7.9% |
| Liberal Arts & History | 269 | 5.6% |
| Visual & Performing Arts | 201 | 4.2% |
| Communications | 104 | 2.2% |
| Arts & Humanities | 244 | 5.1% |
| Total | 4,788 | 100.0% |
Transportation & Commute in Auburn
Vehicle Availability by Sex in Auburn
The most prevalent vehicle ownership categories in Auburn are males with 2 vehicles (2,612, accounting for 42.7%) and females with 2 vehicles (2,269, making up 47.2%).
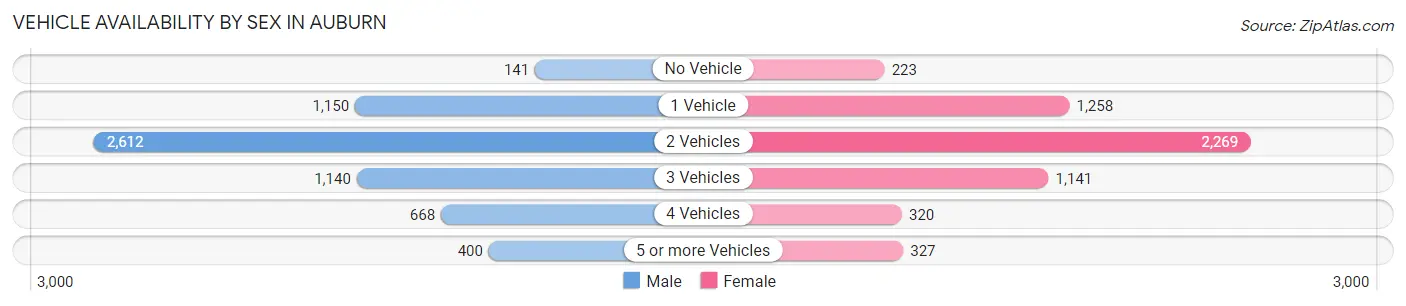
| Vehicles Available | Male | Female |
| No Vehicle | 141 (2.3%) | 223 (4.0%) |
| 1 Vehicle | 1,150 (18.8%) | 1,258 (22.7%) |
| 2 Vehicles | 2,612 (42.7%) | 2,269 (41.0%) |
| 3 Vehicles | 1,140 (18.6%) | 1,141 (20.6%) |
| 4 Vehicles | 668 (10.9%) | 320 (5.8%) |
| 5 or more Vehicles | 400 (6.6%) | 327 (5.9%) |
| Total | 6,111 (100.0%) | 5,538 (100.0%) |
Commute Time in Auburn
The most frequently occuring commute durations in Auburn are 10 to 14 minutes (2,365 commuters, 22.5%), 5 to 9 minutes (1,748 commuters, 16.6%), and 15 to 19 minutes (1,701 commuters, 16.2%).
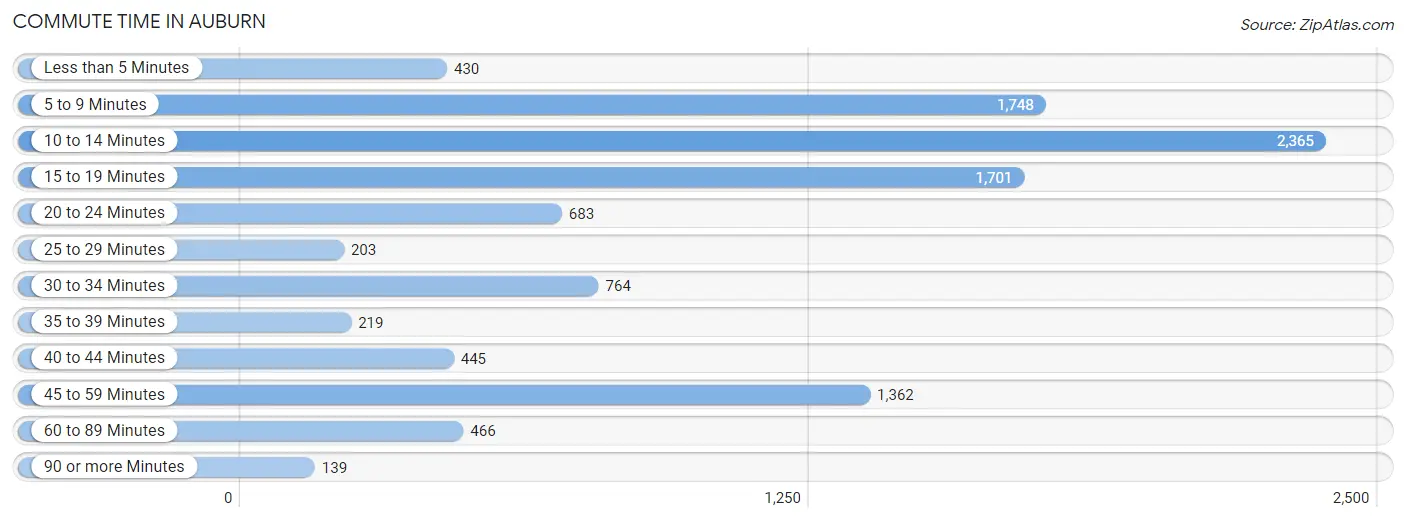
| Commute Time | # Commuters | % Commuters |
| Less than 5 Minutes | 430 | 4.1% |
| 5 to 9 Minutes | 1,748 | 16.6% |
| 10 to 14 Minutes | 2,365 | 22.5% |
| 15 to 19 Minutes | 1,701 | 16.2% |
| 20 to 24 Minutes | 683 | 6.5% |
| 25 to 29 Minutes | 203 | 1.9% |
| 30 to 34 Minutes | 764 | 7.3% |
| 35 to 39 Minutes | 219 | 2.1% |
| 40 to 44 Minutes | 445 | 4.2% |
| 45 to 59 Minutes | 1,362 | 12.9% |
| 60 to 89 Minutes | 466 | 4.4% |
| 90 or more Minutes | 139 | 1.3% |
Commute Time by Sex in Auburn
The most common commute times in Auburn are 10 to 14 minutes (1,234 commuters, 21.6%) for males and 10 to 14 minutes (1,131 commuters, 23.5%) for females.
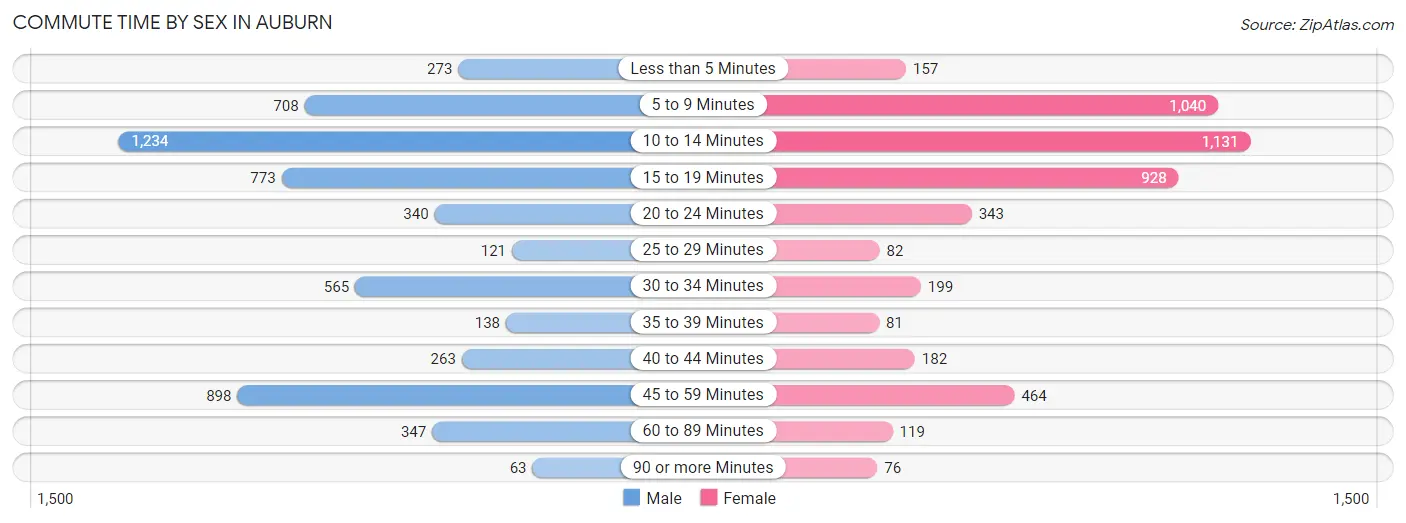
| Commute Time | Male | Female |
| Less than 5 Minutes | 273 (4.8%) | 157 (3.3%) |
| 5 to 9 Minutes | 708 (12.4%) | 1,040 (21.7%) |
| 10 to 14 Minutes | 1,234 (21.6%) | 1,131 (23.5%) |
| 15 to 19 Minutes | 773 (13.5%) | 928 (19.3%) |
| 20 to 24 Minutes | 340 (5.9%) | 343 (7.1%) |
| 25 to 29 Minutes | 121 (2.1%) | 82 (1.7%) |
| 30 to 34 Minutes | 565 (9.9%) | 199 (4.1%) |
| 35 to 39 Minutes | 138 (2.4%) | 81 (1.7%) |
| 40 to 44 Minutes | 263 (4.6%) | 182 (3.8%) |
| 45 to 59 Minutes | 898 (15.7%) | 464 (9.7%) |
| 60 to 89 Minutes | 347 (6.1%) | 119 (2.5%) |
| 90 or more Minutes | 63 (1.1%) | 76 (1.6%) |
Time of Departure to Work by Sex in Auburn
The most frequent times of departure to work in Auburn are 7:00 AM to 7:29 AM (955, 16.7%) for males and 7:30 AM to 7:59 AM (803, 16.7%) for females.
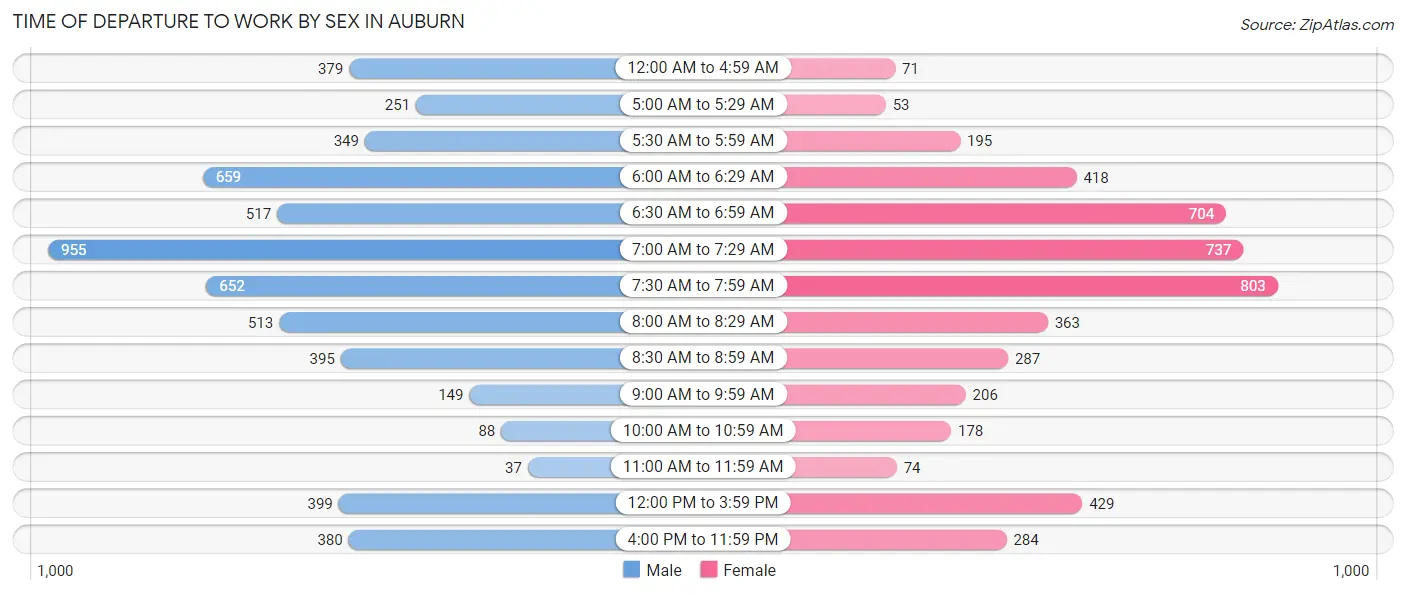
| Time of Departure | Male | Female |
| 12:00 AM to 4:59 AM | 379 (6.6%) | 71 (1.5%) |
| 5:00 AM to 5:29 AM | 251 (4.4%) | 53 (1.1%) |
| 5:30 AM to 5:59 AM | 349 (6.1%) | 195 (4.1%) |
| 6:00 AM to 6:29 AM | 659 (11.5%) | 418 (8.7%) |
| 6:30 AM to 6:59 AM | 517 (9.0%) | 704 (14.7%) |
| 7:00 AM to 7:29 AM | 955 (16.7%) | 737 (15.3%) |
| 7:30 AM to 7:59 AM | 652 (11.4%) | 803 (16.7%) |
| 8:00 AM to 8:29 AM | 513 (9.0%) | 363 (7.6%) |
| 8:30 AM to 8:59 AM | 395 (6.9%) | 287 (6.0%) |
| 9:00 AM to 9:59 AM | 149 (2.6%) | 206 (4.3%) |
| 10:00 AM to 10:59 AM | 88 (1.5%) | 178 (3.7%) |
| 11:00 AM to 11:59 AM | 37 (0.6%) | 74 (1.5%) |
| 12:00 PM to 3:59 PM | 399 (7.0%) | 429 (8.9%) |
| 4:00 PM to 11:59 PM | 380 (6.6%) | 284 (5.9%) |
| Total | 5,723 (100.0%) | 4,802 (100.0%) |
Housing Occupancy in Auburn
Occupancy by Ownership in Auburn
Of the total 10,309 dwellings in Auburn, owner-occupied units account for 6,048 (58.7%), while renter-occupied units make up 4,261 (41.3%).
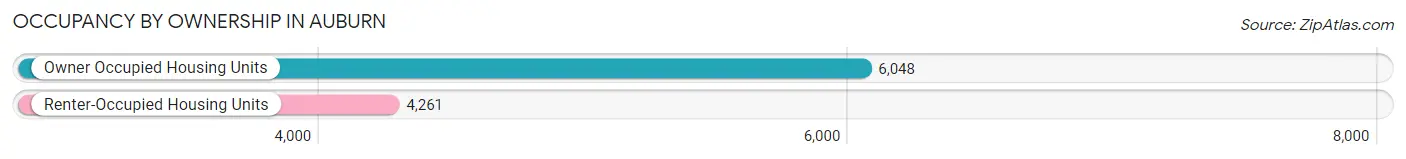
| Occupancy | # Housing Units | % Housing Units |
| Owner Occupied Housing Units | 6,048 | 58.7% |
| Renter-Occupied Housing Units | 4,261 | 41.3% |
| Total Occupied Housing Units | 10,309 | 100.0% |
Occupancy by Household Size in Auburn
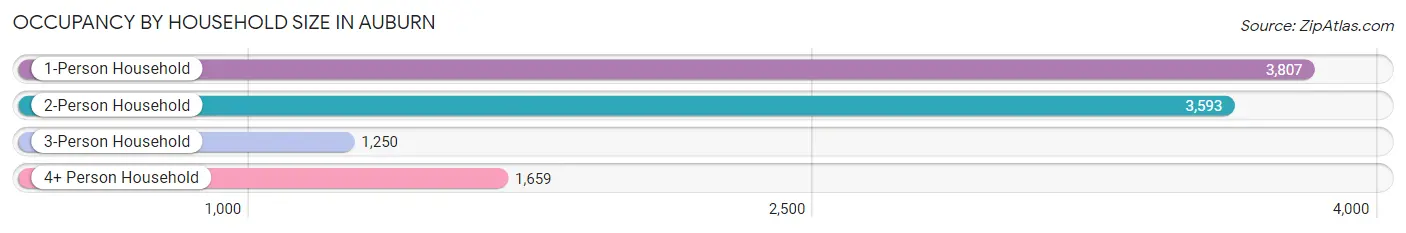
| Household Size | # Housing Units | % Housing Units |
| 1-Person Household | 3,807 | 36.9% |
| 2-Person Household | 3,593 | 34.8% |
| 3-Person Household | 1,250 | 12.1% |
| 4+ Person Household | 1,659 | 16.1% |
| Total Housing Units | 10,309 | 100.0% |
Occupancy by Ownership by Household Size in Auburn
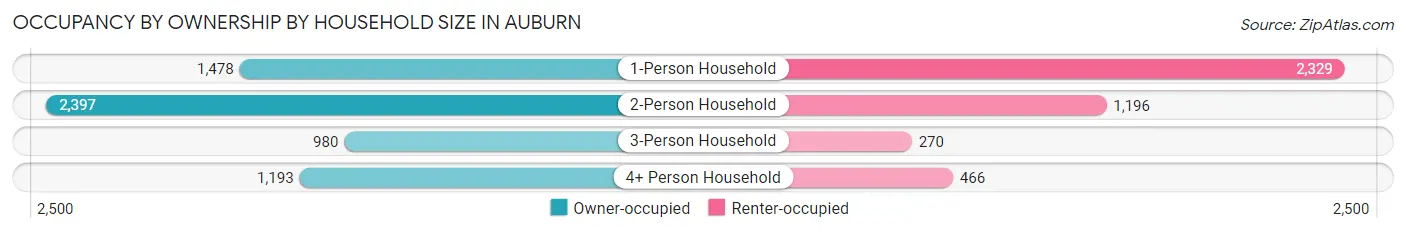
| Household Size | Owner-occupied | Renter-occupied |
| 1-Person Household | 1,478 (38.8%) | 2,329 (61.2%) |
| 2-Person Household | 2,397 (66.7%) | 1,196 (33.3%) |
| 3-Person Household | 980 (78.4%) | 270 (21.6%) |
| 4+ Person Household | 1,193 (71.9%) | 466 (28.1%) |
| Total Housing Units | 6,048 (58.7%) | 4,261 (41.3%) |
Occupancy by Educational Attainment in Auburn
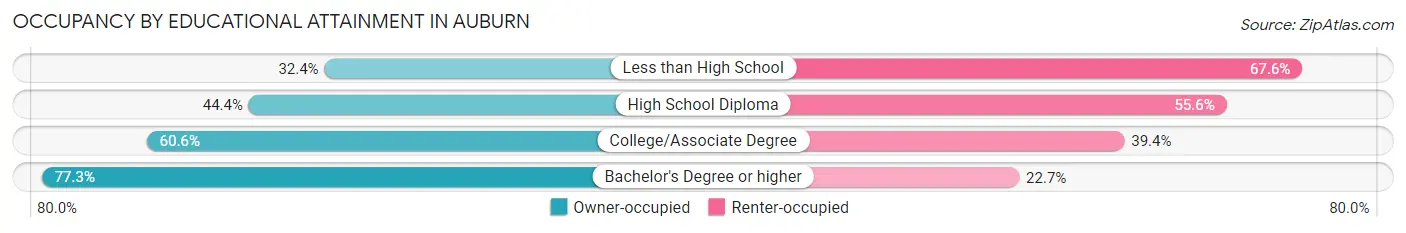
| Household Size | Owner-occupied | Renter-occupied |
| Less than High School | 206 (32.4%) | 429 (67.6%) |
| High School Diploma | 1,452 (44.4%) | 1,815 (55.6%) |
| College/Associate Degree | 2,051 (60.6%) | 1,331 (39.4%) |
| Bachelor's Degree or higher | 2,339 (77.3%) | 686 (22.7%) |
Occupancy by Age of Householder in Auburn
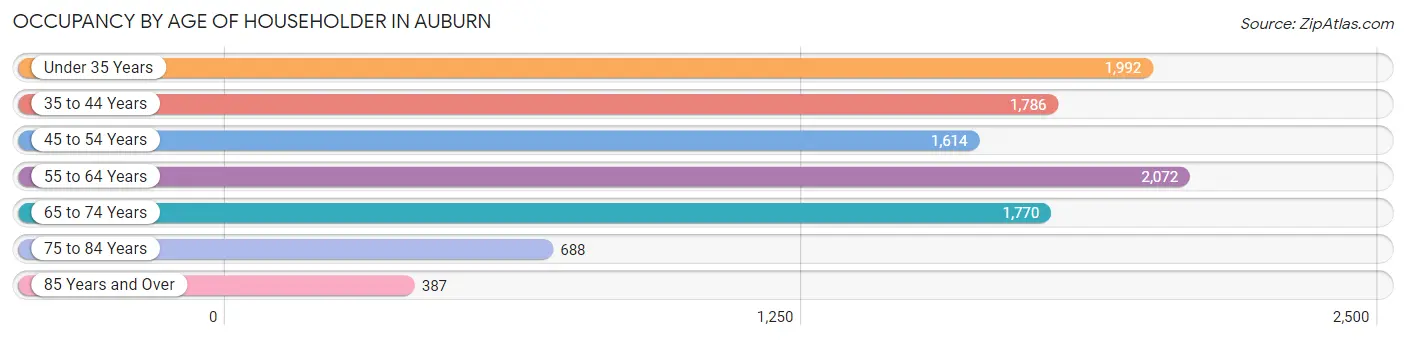
| Age Bracket | # Households | % Households |
| Under 35 Years | 1,992 | 19.3% |
| 35 to 44 Years | 1,786 | 17.3% |
| 45 to 54 Years | 1,614 | 15.7% |
| 55 to 64 Years | 2,072 | 20.1% |
| 65 to 74 Years | 1,770 | 17.2% |
| 75 to 84 Years | 688 | 6.7% |
| 85 Years and Over | 387 | 3.7% |
| Total | 10,309 | 100.0% |
Housing Finances in Auburn
Median Income by Occupancy in Auburn
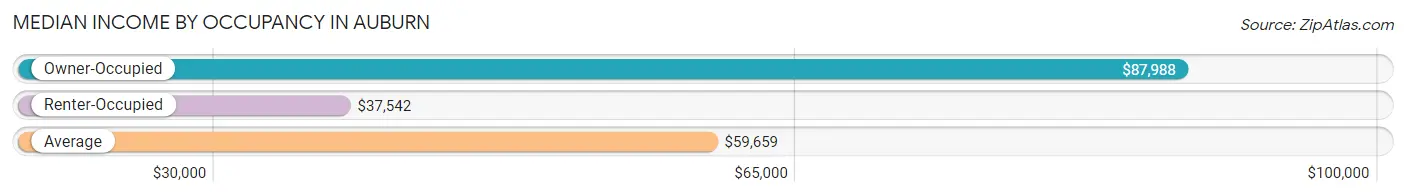
| Occupancy Type | # Households | Median Income |
| Owner-Occupied | 6,048 (58.7%) | $87,988 |
| Renter-Occupied | 4,261 (41.3%) | $37,542 |
| Average | 10,309 (100.0%) | $59,659 |
Occupancy by Householder Income Bracket in Auburn
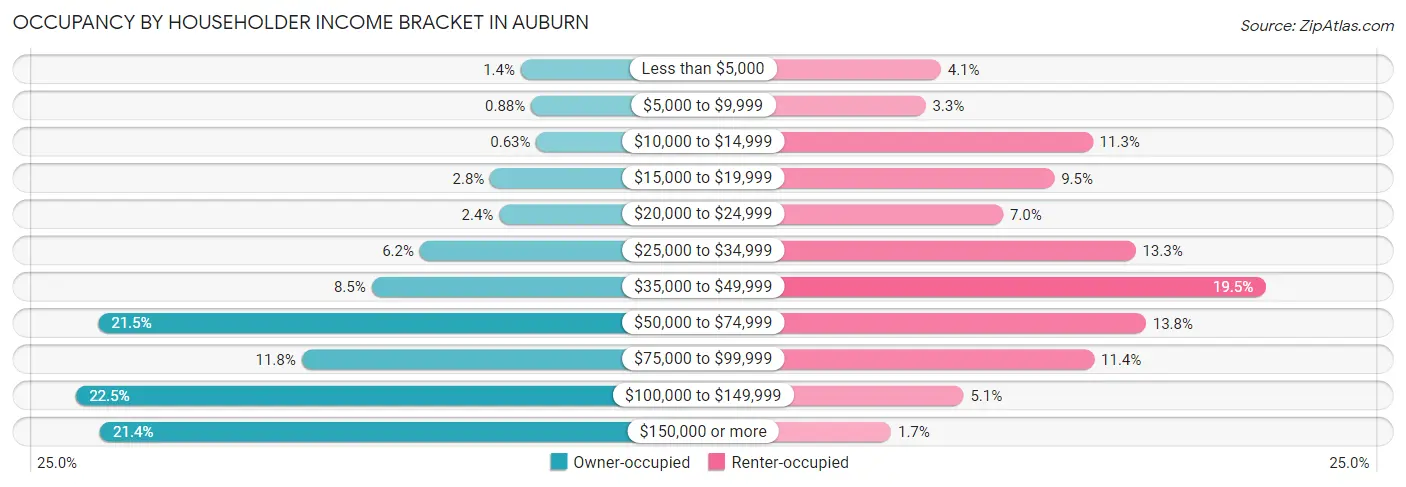
| Income Bracket | Owner-occupied | Renter-occupied |
| Less than $5,000 | 83 (1.4%) | 173 (4.1%) |
| $5,000 to $9,999 | 53 (0.9%) | 142 (3.3%) |
| $10,000 to $14,999 | 38 (0.6%) | 481 (11.3%) |
| $15,000 to $19,999 | 171 (2.8%) | 403 (9.5%) |
| $20,000 to $24,999 | 145 (2.4%) | 299 (7.0%) |
| $25,000 to $34,999 | 374 (6.2%) | 568 (13.3%) |
| $35,000 to $49,999 | 513 (8.5%) | 831 (19.5%) |
| $50,000 to $74,999 | 1,300 (21.5%) | 589 (13.8%) |
| $75,000 to $99,999 | 714 (11.8%) | 484 (11.4%) |
| $100,000 to $149,999 | 1,363 (22.5%) | 219 (5.1%) |
| $150,000 or more | 1,294 (21.4%) | 72 (1.7%) |
| Total | 6,048 (100.0%) | 4,261 (100.0%) |
Monthly Housing Cost Tiers in Auburn
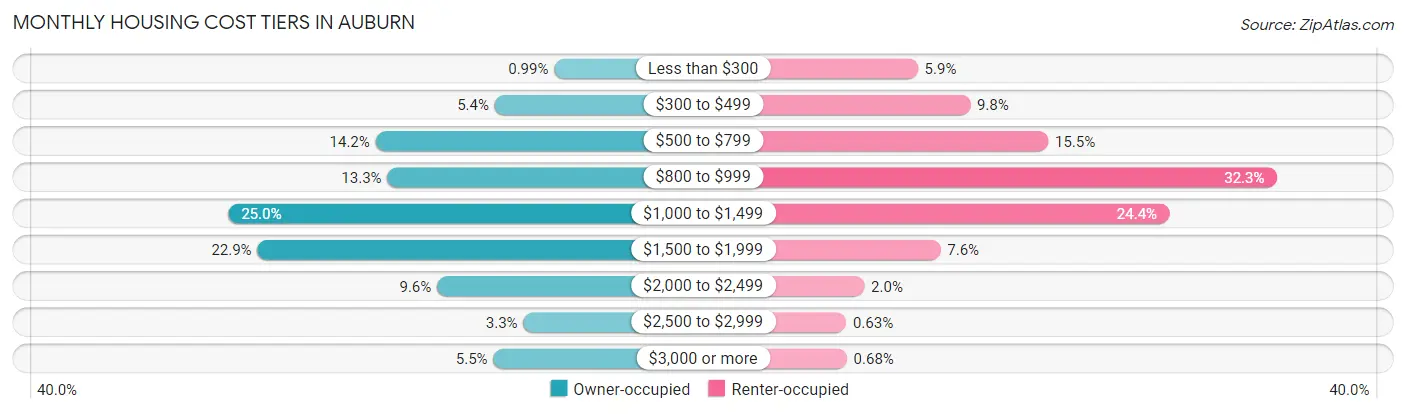
| Monthly Cost | Owner-occupied | Renter-occupied |
| Less than $300 | 60 (1.0%) | 252 (5.9%) |
| $300 to $499 | 325 (5.4%) | 416 (9.8%) |
| $500 to $799 | 856 (14.1%) | 661 (15.5%) |
| $800 to $999 | 803 (13.3%) | 1,377 (32.3%) |
| $1,000 to $1,499 | 1,512 (25.0%) | 1,040 (24.4%) |
| $1,500 to $1,999 | 1,382 (22.9%) | 323 (7.6%) |
| $2,000 to $2,499 | 582 (9.6%) | 84 (2.0%) |
| $2,500 to $2,999 | 197 (3.3%) | 27 (0.6%) |
| $3,000 or more | 331 (5.5%) | 29 (0.7%) |
| Total | 6,048 (100.0%) | 4,261 (100.0%) |
Physical Housing Characteristics in Auburn
Housing Structures in Auburn
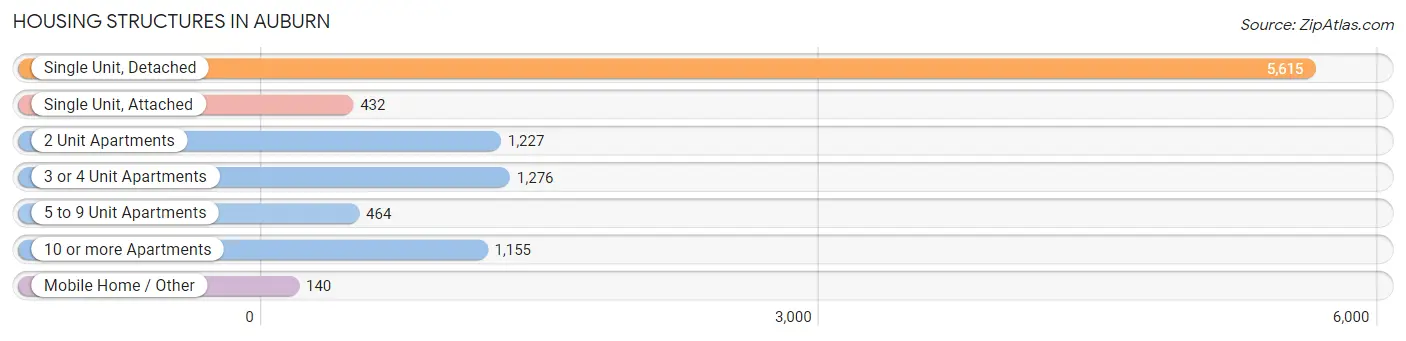
| Structure Type | # Housing Units | % Housing Units |
| Single Unit, Detached | 5,615 | 54.5% |
| Single Unit, Attached | 432 | 4.2% |
| 2 Unit Apartments | 1,227 | 11.9% |
| 3 or 4 Unit Apartments | 1,276 | 12.4% |
| 5 to 9 Unit Apartments | 464 | 4.5% |
| 10 or more Apartments | 1,155 | 11.2% |
| Mobile Home / Other | 140 | 1.4% |
| Total | 10,309 | 100.0% |
Housing Structures by Occupancy in Auburn
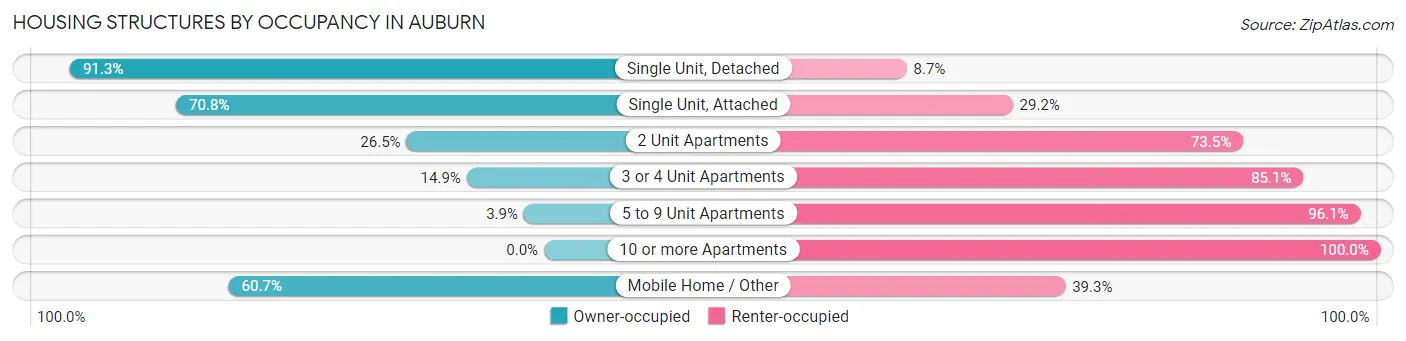
| Structure Type | Owner-occupied | Renter-occupied |
| Single Unit, Detached | 5,124 (91.3%) | 491 (8.7%) |
| Single Unit, Attached | 306 (70.8%) | 126 (29.2%) |
| 2 Unit Apartments | 325 (26.5%) | 902 (73.5%) |
| 3 or 4 Unit Apartments | 190 (14.9%) | 1,086 (85.1%) |
| 5 to 9 Unit Apartments | 18 (3.9%) | 446 (96.1%) |
| 10 or more Apartments | 0 (0.0%) | 1,155 (100.0%) |
| Mobile Home / Other | 85 (60.7%) | 55 (39.3%) |
| Total | 6,048 (58.7%) | 4,261 (41.3%) |
Housing Structures by Number of Rooms in Auburn
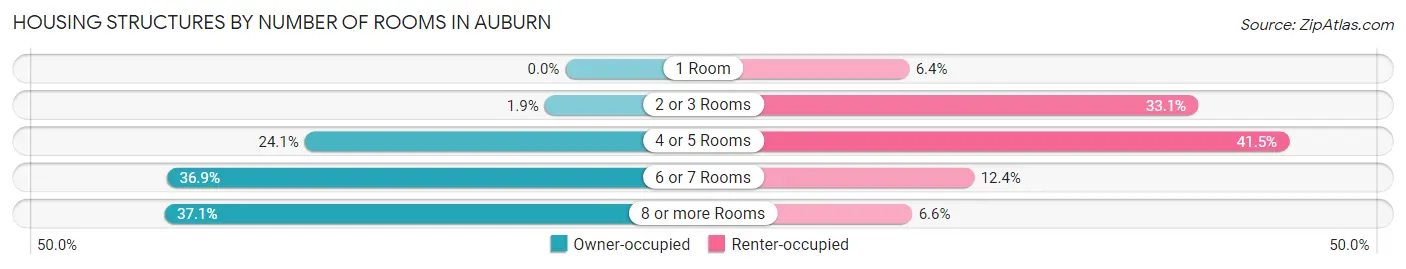
| Number of Rooms | Owner-occupied | Renter-occupied |
| 1 Room | 0 (0.0%) | 271 (6.4%) |
| 2 or 3 Rooms | 116 (1.9%) | 1,411 (33.1%) |
| 4 or 5 Rooms | 1,458 (24.1%) | 1,769 (41.5%) |
| 6 or 7 Rooms | 2,230 (36.9%) | 527 (12.4%) |
| 8 or more Rooms | 2,244 (37.1%) | 283 (6.6%) |
| Total | 6,048 (100.0%) | 4,261 (100.0%) |
Housing Structure by Heating Type in Auburn
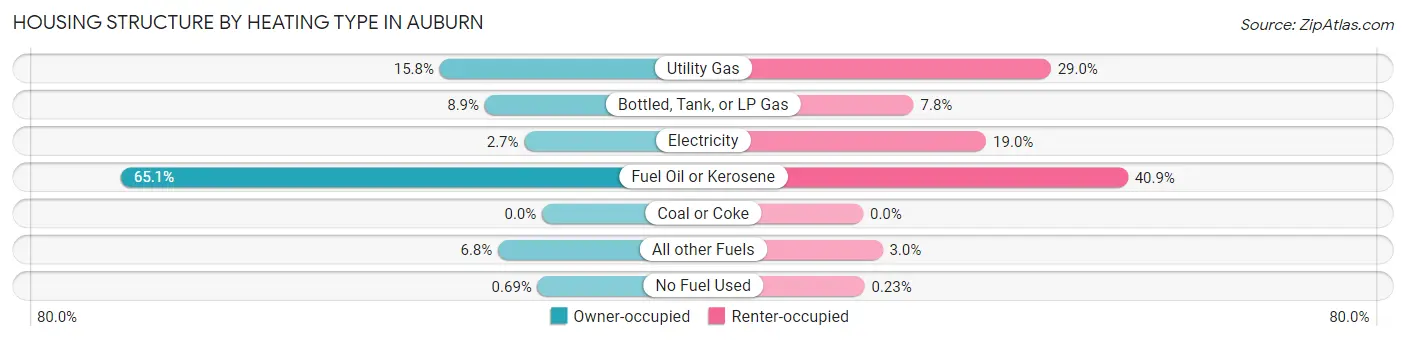
| Heating Type | Owner-occupied | Renter-occupied |
| Utility Gas | 956 (15.8%) | 1,236 (29.0%) |
| Bottled, Tank, or LP Gas | 535 (8.8%) | 333 (7.8%) |
| Electricity | 166 (2.7%) | 811 (19.0%) |
| Fuel Oil or Kerosene | 3,938 (65.1%) | 1,743 (40.9%) |
| Coal or Coke | 0 (0.0%) | 0 (0.0%) |
| All other Fuels | 411 (6.8%) | 128 (3.0%) |
| No Fuel Used | 42 (0.7%) | 10 (0.2%) |
| Total | 6,048 (100.0%) | 4,261 (100.0%) |
Household Vehicle Usage in Auburn
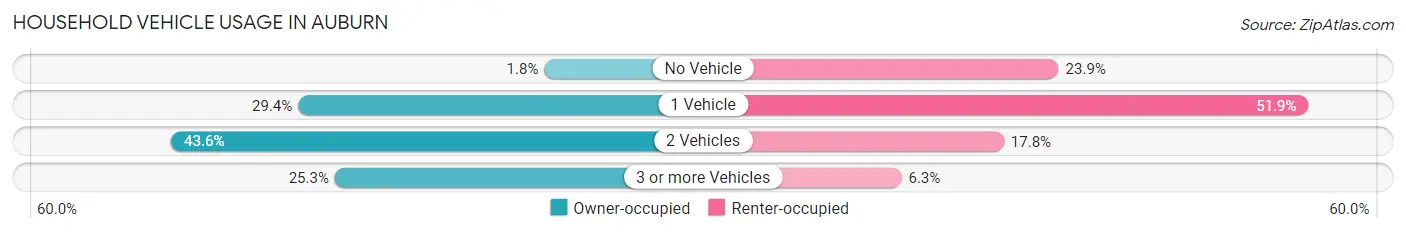
| Vehicles per Household | Owner-occupied | Renter-occupied |
| No Vehicle | 108 (1.8%) | 1,020 (23.9%) |
| 1 Vehicle | 1,776 (29.4%) | 2,212 (51.9%) |
| 2 Vehicles | 2,636 (43.6%) | 759 (17.8%) |
| 3 or more Vehicles | 1,528 (25.3%) | 270 (6.3%) |
| Total | 6,048 (100.0%) | 4,261 (100.0%) |
Real Estate & Mortgages in Auburn
Real Estate and Mortgage Overview in Auburn
| Characteristic | Without Mortgage | With Mortgage |
| Housing Units | 1,991 | 4,057 |
| Median Property Value | $226,400 | $227,800 |
| Median Household Income | $68,510 | $932 |
| Monthly Housing Costs | $734 | $331 |
| Real Estate Taxes | $3,715 | $32 |
Property Value by Mortgage Status in Auburn
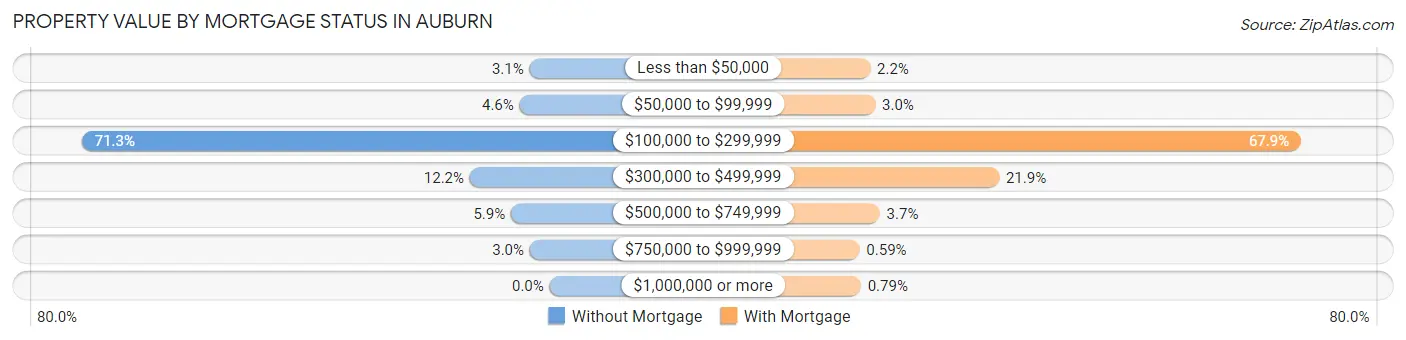
| Property Value | Without Mortgage | With Mortgage |
| Less than $50,000 | 61 (3.1%) | 90 (2.2%) |
| $50,000 to $99,999 | 91 (4.6%) | 121 (3.0%) |
| $100,000 to $299,999 | 1,420 (71.3%) | 2,754 (67.9%) |
| $300,000 to $499,999 | 242 (12.1%) | 887 (21.9%) |
| $500,000 to $749,999 | 117 (5.9%) | 149 (3.7%) |
| $750,000 to $999,999 | 60 (3.0%) | 24 (0.6%) |
| $1,000,000 or more | 0 (0.0%) | 32 (0.8%) |
| Total | 1,991 (100.0%) | 4,057 (100.0%) |
Household Income by Mortgage Status in Auburn
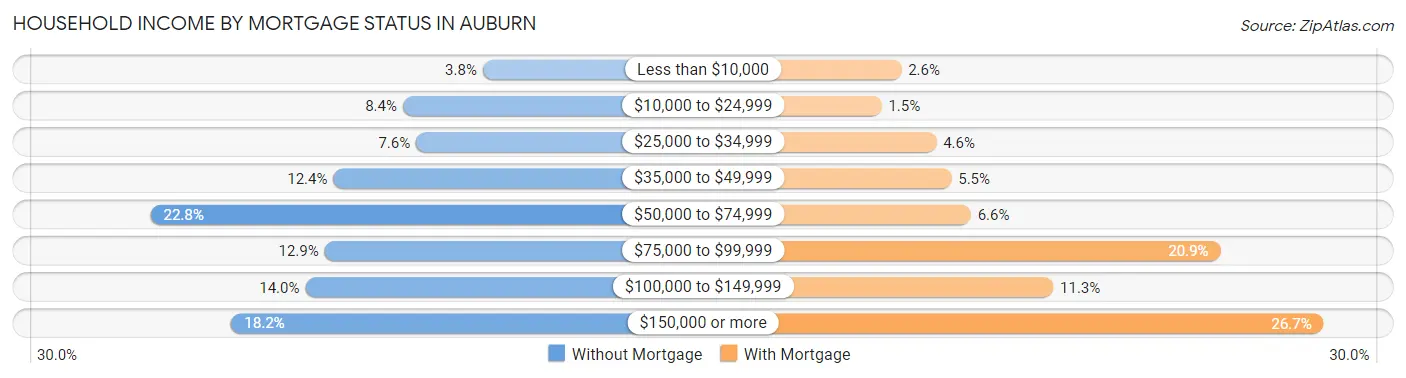
| Household Income | Without Mortgage | With Mortgage |
| Less than $10,000 | 76 (3.8%) | 106 (2.6%) |
| $10,000 to $24,999 | 167 (8.4%) | 60 (1.5%) |
| $25,000 to $34,999 | 152 (7.6%) | 187 (4.6%) |
| $35,000 to $49,999 | 246 (12.4%) | 222 (5.5%) |
| $50,000 to $74,999 | 454 (22.8%) | 267 (6.6%) |
| $75,000 to $99,999 | 256 (12.9%) | 846 (20.8%) |
| $100,000 to $149,999 | 278 (14.0%) | 458 (11.3%) |
| $150,000 or more | 362 (18.2%) | 1,085 (26.7%) |
| Total | 1,991 (100.0%) | 4,057 (100.0%) |
Property Value to Household Income Ratio in Auburn
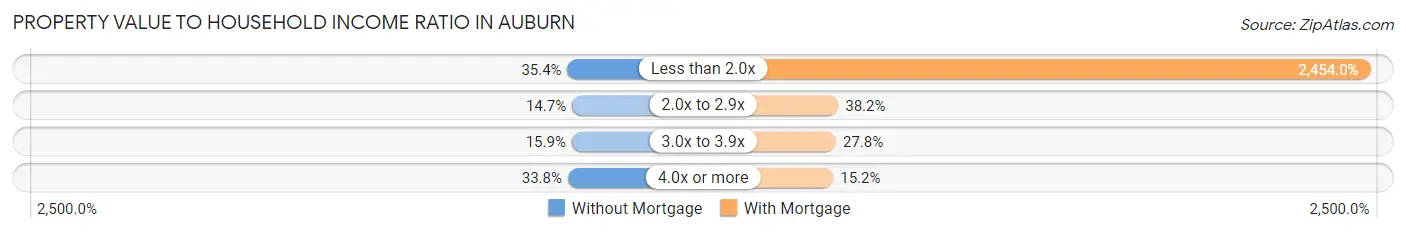
| Value-to-Income Ratio | Without Mortgage | With Mortgage |
| Less than 2.0x | 704 (35.4%) | 99,558 (2,454.0%) |
| 2.0x to 2.9x | 292 (14.7%) | 1,550 (38.2%) |
| 3.0x to 3.9x | 316 (15.9%) | 1,128 (27.8%) |
| 4.0x or more | 673 (33.8%) | 618 (15.2%) |
| Total | 1,991 (100.0%) | 4,057 (100.0%) |
Real Estate Taxes by Mortgage Status in Auburn
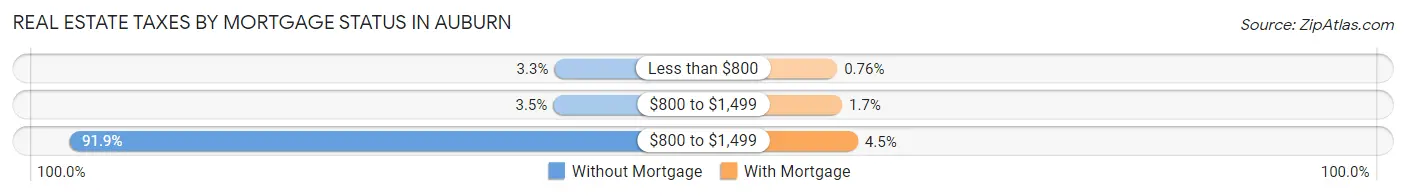
| Property Taxes | Without Mortgage | With Mortgage |
| Less than $800 | 65 (3.3%) | 31 (0.8%) |
| $800 to $1,499 | 69 (3.5%) | 67 (1.7%) |
| $800 to $1,499 | 1,829 (91.9%) | 184 (4.5%) |
| Total | 1,991 (100.0%) | 4,057 (100.0%) |
Health & Disability in Auburn
Health Insurance Coverage by Age in Auburn
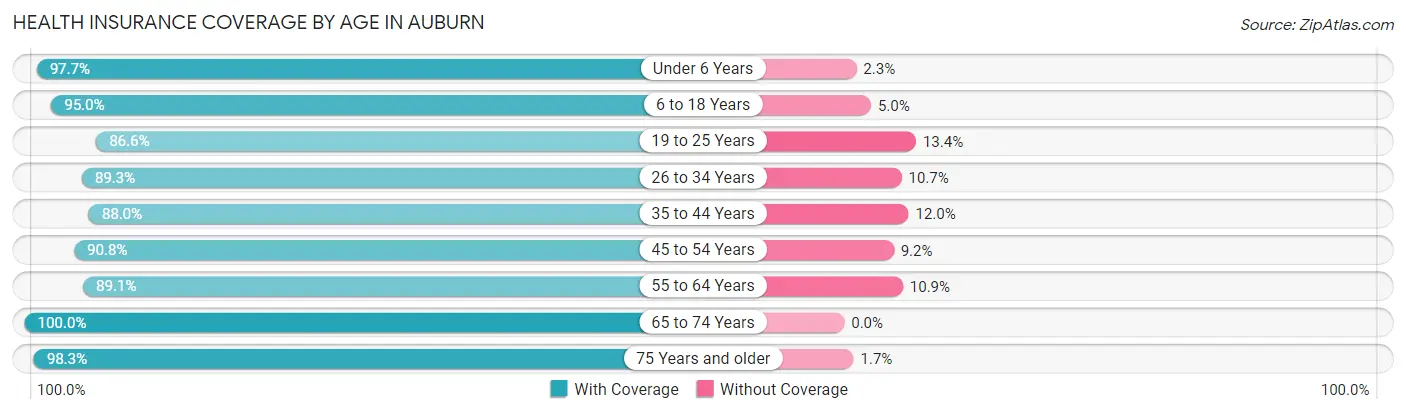
| Age Bracket | With Coverage | Without Coverage |
| Under 6 Years | 1,254 (97.7%) | 29 (2.3%) |
| 6 to 18 Years | 4,042 (95.0%) | 212 (5.0%) |
| 19 to 25 Years | 2,183 (86.6%) | 337 (13.4%) |
| 26 to 34 Years | 2,092 (89.3%) | 250 (10.7%) |
| 35 to 44 Years | 2,584 (88.0%) | 352 (12.0%) |
| 45 to 54 Years | 2,529 (90.8%) | 257 (9.2%) |
| 55 to 64 Years | 2,862 (89.1%) | 351 (10.9%) |
| 65 to 74 Years | 2,633 (100.0%) | 0 (0.0%) |
| 75 Years and older | 1,536 (98.3%) | 27 (1.7%) |
| Total | 21,715 (92.3%) | 1,815 (7.7%) |
Health Insurance Coverage by Citizenship Status in Auburn
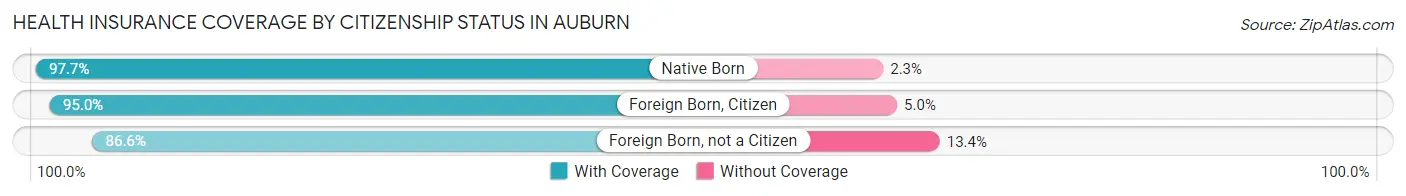
| Citizenship Status | With Coverage | Without Coverage |
| Native Born | 1,254 (97.7%) | 29 (2.3%) |
| Foreign Born, Citizen | 4,042 (95.0%) | 212 (5.0%) |
| Foreign Born, not a Citizen | 2,183 (86.6%) | 337 (13.4%) |
Health Insurance Coverage by Household Income in Auburn
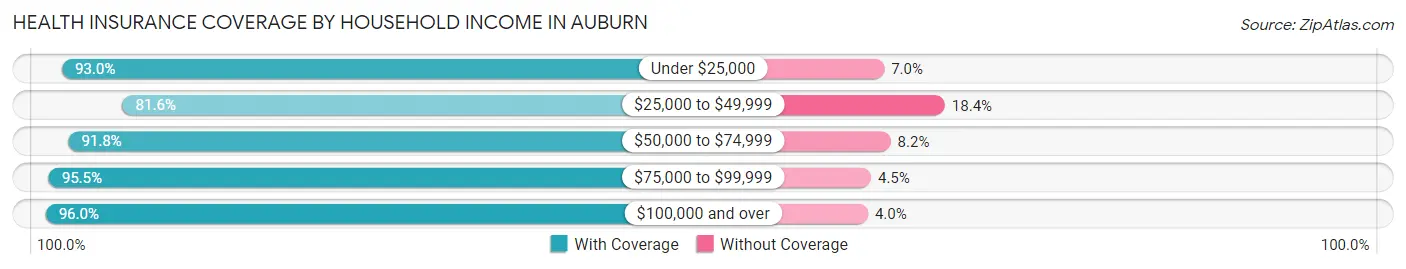
| Household Income | With Coverage | Without Coverage |
| Under $25,000 | 2,415 (93.0%) | 182 (7.0%) |
| $25,000 to $49,999 | 3,490 (81.6%) | 786 (18.4%) |
| $50,000 to $74,999 | 3,494 (91.8%) | 313 (8.2%) |
| $75,000 to $99,999 | 3,092 (95.5%) | 147 (4.5%) |
| $100,000 and over | 8,979 (96.0%) | 370 (4.0%) |
Public vs Private Health Insurance Coverage by Age in Auburn
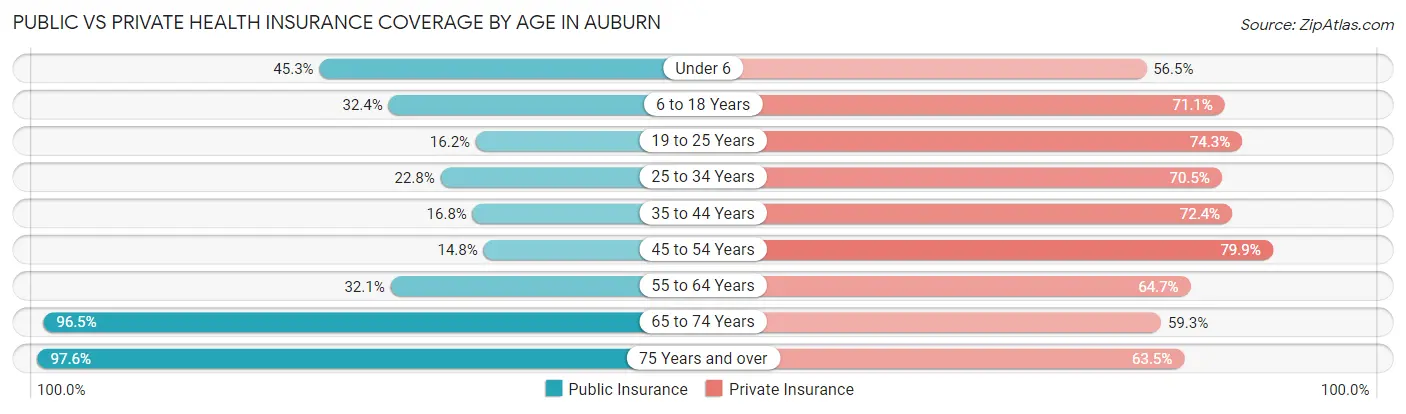
| Age Bracket | Public Insurance | Private Insurance |
| Under 6 | 581 (45.3%) | 725 (56.5%) |
| 6 to 18 Years | 1,380 (32.4%) | 3,023 (71.1%) |
| 19 to 25 Years | 409 (16.2%) | 1,872 (74.3%) |
| 25 to 34 Years | 534 (22.8%) | 1,651 (70.5%) |
| 35 to 44 Years | 494 (16.8%) | 2,126 (72.4%) |
| 45 to 54 Years | 413 (14.8%) | 2,227 (79.9%) |
| 55 to 64 Years | 1,031 (32.1%) | 2,079 (64.7%) |
| 65 to 74 Years | 2,541 (96.5%) | 1,560 (59.3%) |
| 75 Years and over | 1,525 (97.6%) | 993 (63.5%) |
| Total | 8,908 (37.9%) | 16,256 (69.1%) |
Disability Status by Sex by Age in Auburn
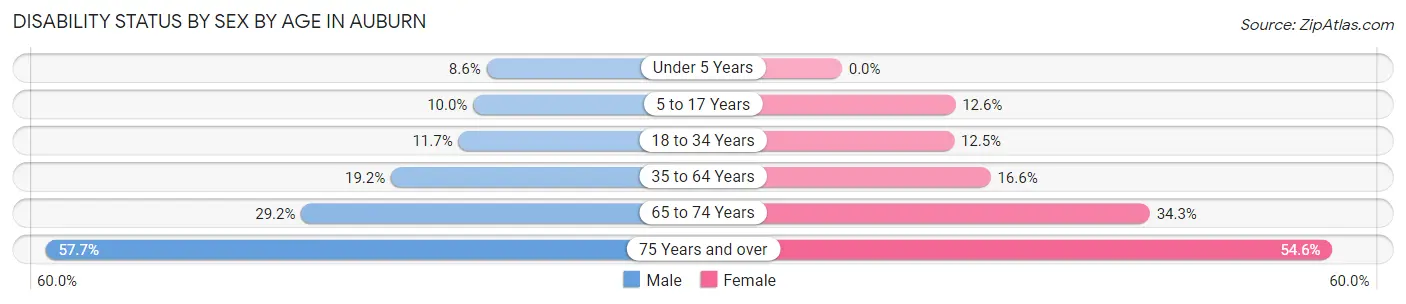
| Age Bracket | Male | Female |
| Under 5 Years | 44 (8.6%) | 0 (0.0%) |
| 5 to 17 Years | 183 (10.0%) | 274 (12.6%) |
| 18 to 34 Years | 313 (11.7%) | 335 (12.5%) |
| 35 to 64 Years | 892 (19.2%) | 710 (16.6%) |
| 65 to 74 Years | 290 (29.2%) | 562 (34.3%) |
| 75 Years and over | 305 (57.7%) | 565 (54.6%) |
Disability Class by Sex by Age in Auburn
Disability Class: Hearing Difficulty
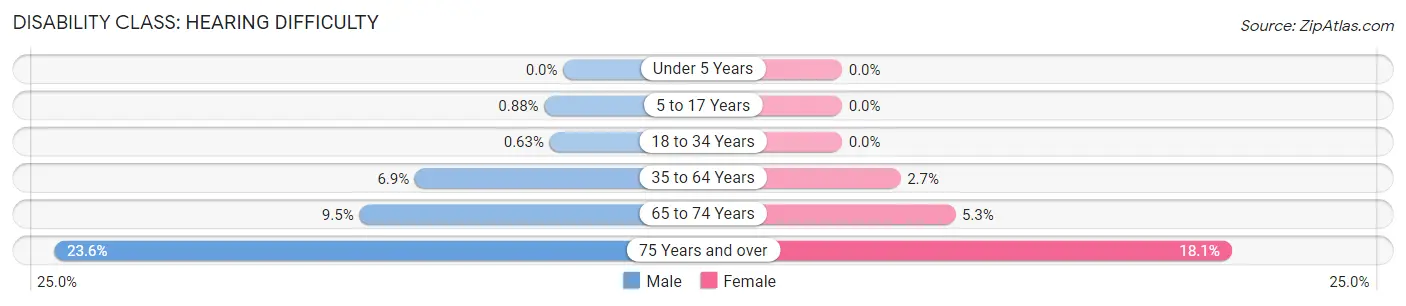
| Age Bracket | Male | Female |
| Under 5 Years | 0 (0.0%) | 0 (0.0%) |
| 5 to 17 Years | 16 (0.9%) | 0 (0.0%) |
| 18 to 34 Years | 17 (0.6%) | 0 (0.0%) |
| 35 to 64 Years | 320 (6.9%) | 116 (2.7%) |
| 65 to 74 Years | 94 (9.5%) | 86 (5.2%) |
| 75 Years and over | 125 (23.6%) | 187 (18.1%) |
Disability Class: Vision Difficulty
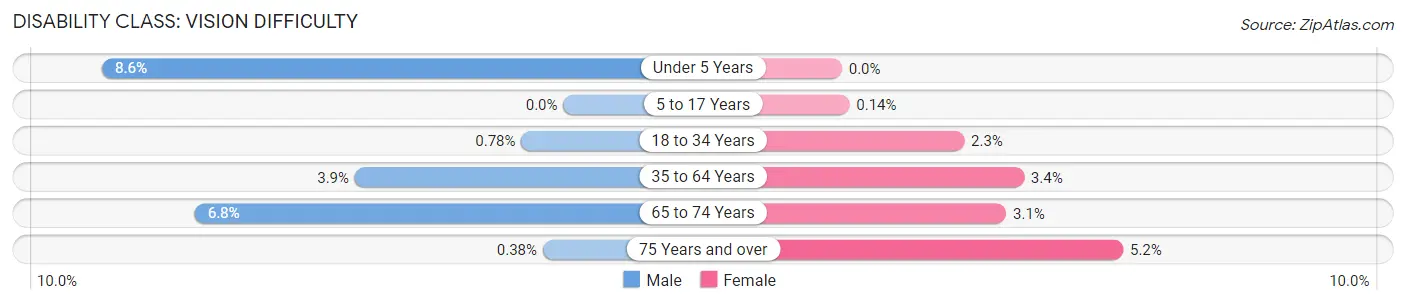
| Age Bracket | Male | Female |
| Under 5 Years | 44 (8.6%) | 0 (0.0%) |
| 5 to 17 Years | 0 (0.0%) | 3 (0.1%) |
| 18 to 34 Years | 21 (0.8%) | 61 (2.3%) |
| 35 to 64 Years | 180 (3.9%) | 145 (3.4%) |
| 65 to 74 Years | 68 (6.8%) | 50 (3.0%) |
| 75 Years and over | 2 (0.4%) | 54 (5.2%) |
Disability Class: Cognitive Difficulty
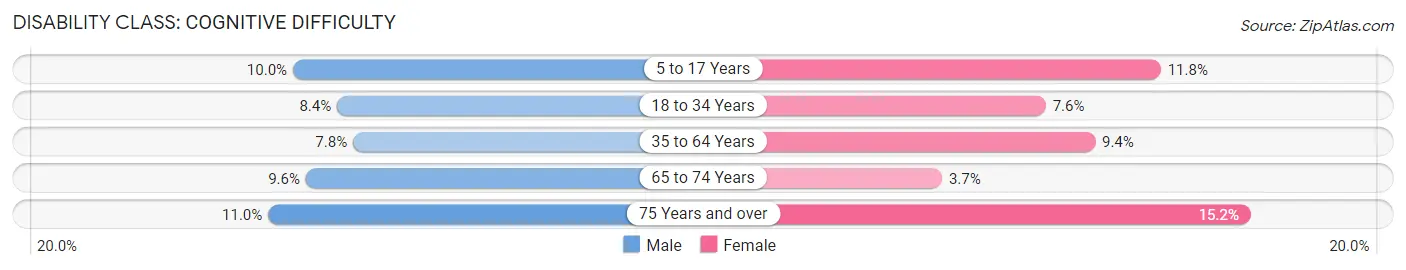
| Age Bracket | Male | Female |
| 5 to 17 Years | 183 (10.0%) | 257 (11.8%) |
| 18 to 34 Years | 225 (8.4%) | 203 (7.6%) |
| 35 to 64 Years | 363 (7.8%) | 403 (9.4%) |
| 65 to 74 Years | 95 (9.6%) | 61 (3.7%) |
| 75 Years and over | 58 (11.0%) | 157 (15.2%) |
Disability Class: Ambulatory Difficulty
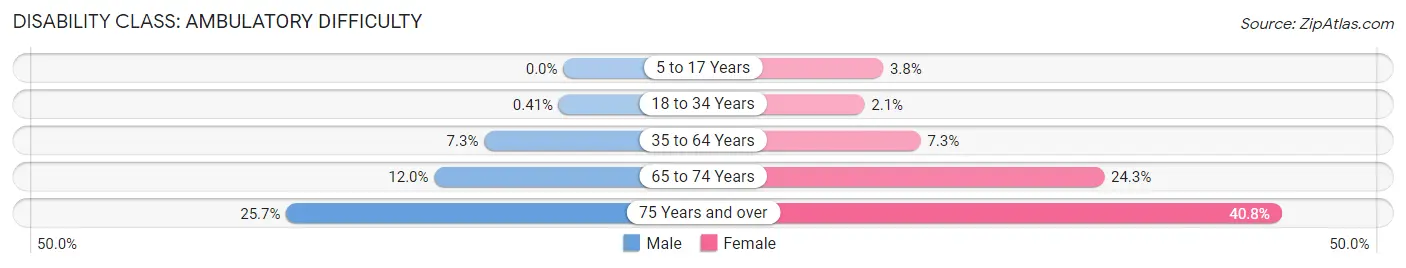
| Age Bracket | Male | Female |
| 5 to 17 Years | 0 (0.0%) | 83 (3.8%) |
| 18 to 34 Years | 11 (0.4%) | 56 (2.1%) |
| 35 to 64 Years | 341 (7.3%) | 313 (7.3%) |
| 65 to 74 Years | 119 (12.0%) | 399 (24.3%) |
| 75 Years and over | 136 (25.7%) | 422 (40.8%) |
Disability Class: Self-Care Difficulty
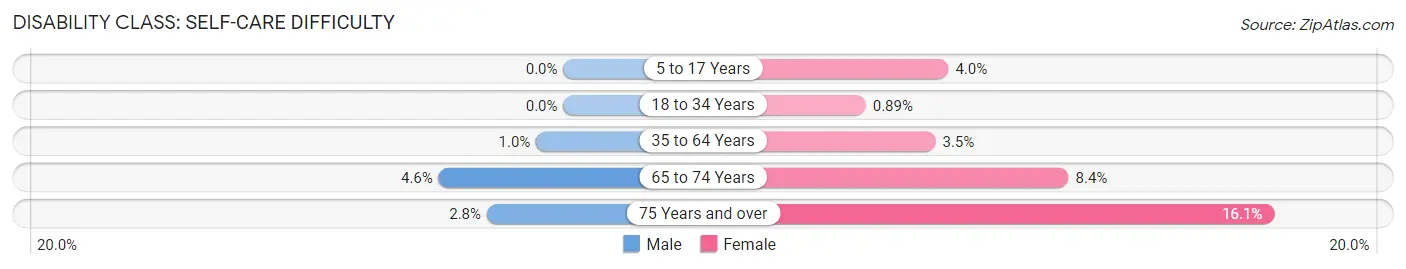
| Age Bracket | Male | Female |
| 5 to 17 Years | 0 (0.0%) | 86 (4.0%) |
| 18 to 34 Years | 0 (0.0%) | 24 (0.9%) |
| 35 to 64 Years | 47 (1.0%) | 149 (3.5%) |
| 65 to 74 Years | 46 (4.6%) | 138 (8.4%) |
| 75 Years and over | 15 (2.8%) | 166 (16.1%) |
Technology Access in Auburn
Computing Device Access in Auburn
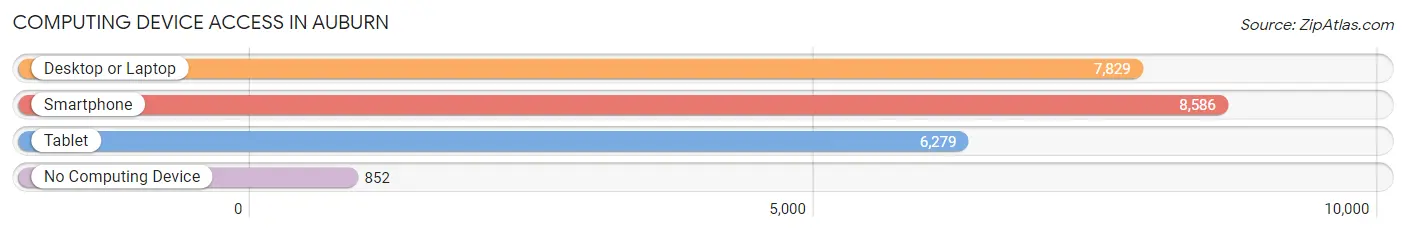
| Device Type | # Households | % Households |
| Desktop or Laptop | 7,829 | 75.9% |
| Smartphone | 8,586 | 83.3% |
| Tablet | 6,279 | 60.9% |
| No Computing Device | 852 | 8.3% |
| Total | 10,309 | 100.0% |
Internet Access in Auburn
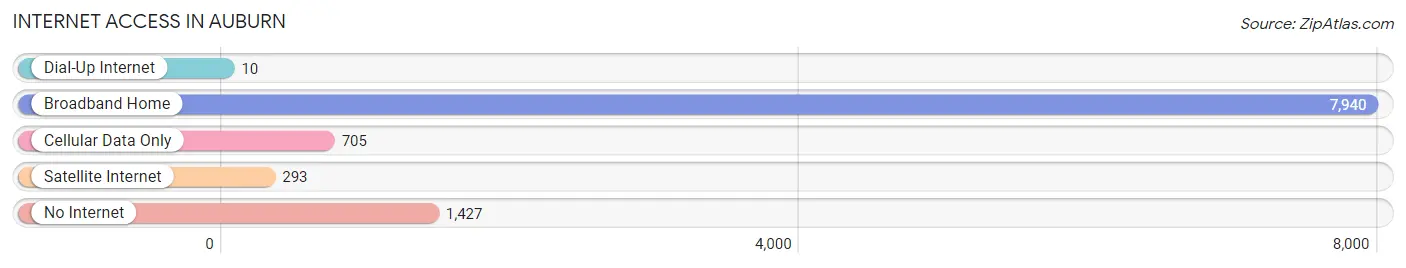
| Internet Type | # Households | % Households |
| Dial-Up Internet | 10 | 0.1% |
| Broadband Home | 7,940 | 77.0% |
| Cellular Data Only | 705 | 6.8% |
| Satellite Internet | 293 | 2.8% |
| No Internet | 1,427 | 13.8% |
| Total | 10,309 | 100.0% |
Auburn Summary
Auburn, Maine is a city located in Androscoggin County in the state of Maine. It is the second largest city in the state, with a population of 23,055 as of the 2010 census. Auburn is located on the banks of the Androscoggin River, and is part of the Lewiston-Auburn Metropolitan Statistical Area.
History
The area that is now Auburn was originally inhabited by the Abenaki people, who called the area “Apalan”, meaning “open land”. The first European settlers arrived in the area in 1786, and the town was officially incorporated in 1793. The town was named after Auburn, New York, which was the hometown of one of the original settlers.
In the 19th century, Auburn became an important industrial center, with several mills and factories located along the Androscoggin River. The city was also home to several shoe factories, which were a major source of employment for the city’s residents.
Geography
Auburn is located in the western part of Androscoggin County, at the confluence of the Androscoggin and Little Androscoggin Rivers. The city covers an area of 24.3 square miles, and is bordered by the towns of Lewiston, Turner, Minot, and Poland.
The city is located in a hilly region, with elevations ranging from 200 to 500 feet above sea level. The highest point in the city is the summit of Mount Apalachee, which has an elevation of 590 feet.
Economy
Auburn’s economy is largely based on manufacturing and services. The city is home to several large manufacturing companies, including Auburn Manufacturing, Inc., which produces industrial fabrics and textiles, and Auburn Shoe Company, which produces footwear.
The city is also home to several healthcare facilities, including Central Maine Medical Center and St. Mary’s Regional Medical Center. In addition, the city is home to several retail stores, restaurants, and other businesses.
Demographics
As of the 2010 census, the population of Auburn was 23,055. The racial makeup of the city was 94.3% White, 1.3% African American, 0.5% Native American, 1.2% Asian, 0.1% Pacific Islander, 0.7% from other races, and 1.9% from two or more races. Hispanic or Latino of any race were 2.2% of the population.
The median household income in Auburn was $41,945, and the median family income was $50,945. The per capita income for the city was $20,945. About 11.3% of families and 14.2% of the population were below the poverty line, including 19.2% of those under age 18 and 8.2% of those age 65 or over.
Common Questions
What is Per Capita Income in Auburn?
Per Capita income in Auburn is $37,416.
What is the Median Family Income in Auburn?
Median Family Income in Auburn is $83,101.
What is the Median Household income in Auburn?
Median Household Income in Auburn is $59,659.
What is Income or Wage Gap in Auburn?
Income or Wage Gap in Auburn is 20.2%.
Women in Auburn earn 79.8 cents for every dollar earned by a man.
What is Inequality or Gini Index in Auburn?
Inequality or Gini Index in Auburn is 0.48.
What is the Total Population of Auburn?
Total Population of Auburn is 24,038.
What is the Total Male Population of Auburn?
Total Male Population of Auburn is 11,538.
What is the Total Female Population of Auburn?
Total Female Population of Auburn is 12,500.
What is the Ratio of Males per 100 Females in Auburn?
There are 92.30 Males per 100 Females in Auburn.
What is the Ratio of Females per 100 Males in Auburn?
There are 108.34 Females per 100 Males in Auburn.
What is the Median Population Age in Auburn?
Median Population Age in Auburn is 39.4 Years.
What is the Average Family Size in Auburn
Average Family Size in Auburn is 3.0 People.
What is the Average Household Size in Auburn
Average Household Size in Auburn is 2.3 People.
How Large is the Labor Force in Auburn?
There are 13,119 People in the Labor Forcein in Auburn.
What is the Percentage of People in the Labor Force in Auburn?
66.9% of People are in the Labor Force in Auburn.
What is the Unemployment Rate in Auburn?
Unemployment Rate in Auburn is 6.5%.