Berwick, ME Map & Demographics
Berwick Map
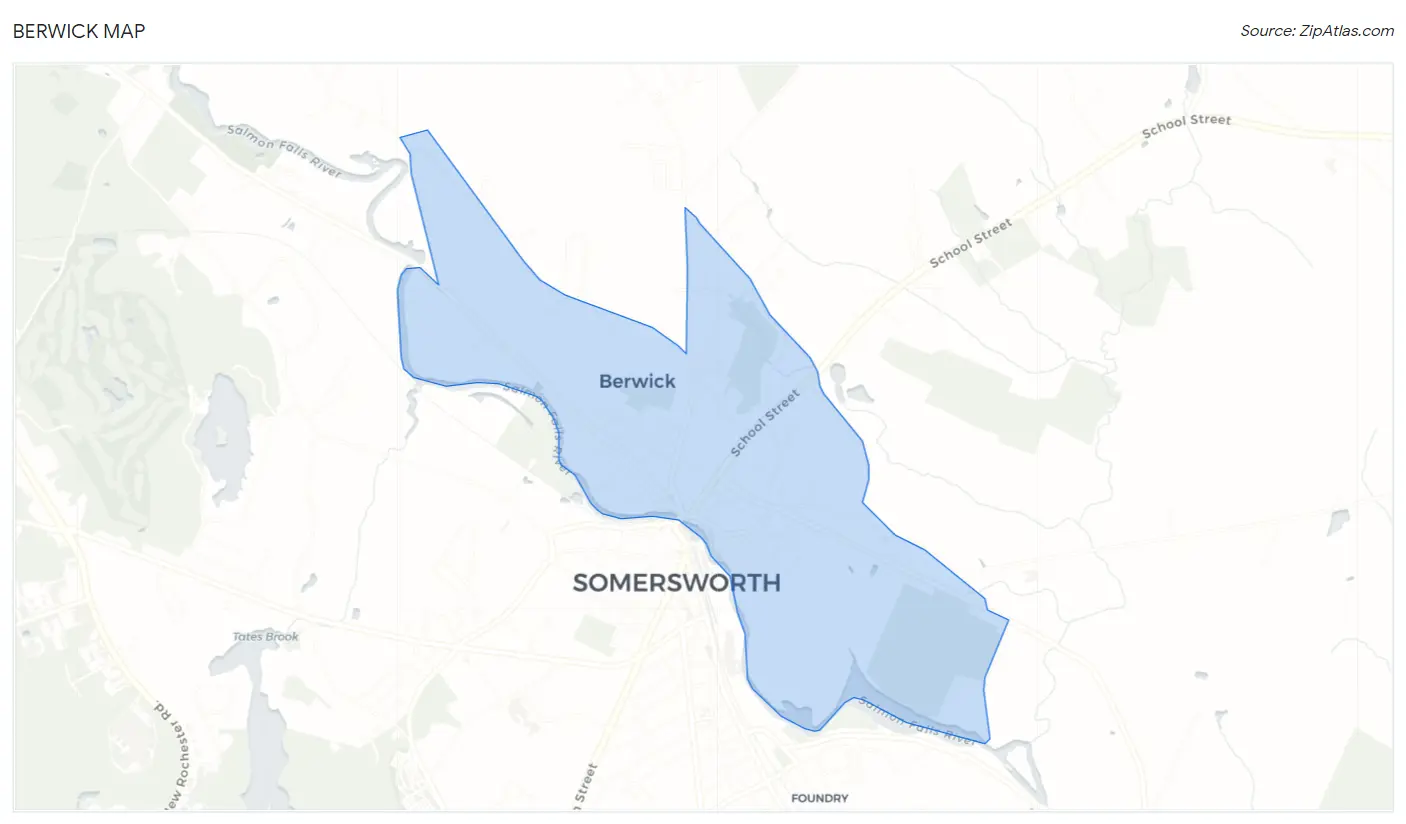
Berwick Overview
$35,801
PER CAPITA INCOME
$96,841
AVG FAMILY INCOME
$63,199
AVG HOUSEHOLD INCOME
43.6%
WAGE / INCOME GAP [ % ]
56.4¢/ $1
WAGE / INCOME GAP [ $ ]
0.41
INEQUALITY / GINI INDEX
2,050
TOTAL POPULATION
859
MALE POPULATION
1,191
FEMALE POPULATION
72.12
MALES / 100 FEMALES
138.65
FEMALES / 100 MALES
44.1
MEDIAN AGE
2.8
AVG FAMILY SIZE
2.1
AVG HOUSEHOLD SIZE
940
LABOR FORCE [ PEOPLE ]
56.1%
PERCENT IN LABOR FORCE
5.0%
UNEMPLOYMENT RATE
Berwick Zip Codes
Berwick Area Codes
Income in Berwick
Income Overview in Berwick
Per Capita Income in Berwick is $35,801, while median incomes of families and households are $96,841 and $63,199 respectively.
| Characteristic | Number | Measure |
| Per Capita Income | 2,050 | $35,801 |
| Median Family Income | 545 | $96,841 |
| Mean Family Income | 545 | $105,187 |
| Median Household Income | 985 | $63,199 |
| Mean Household Income | 985 | $74,090 |
| Income Deficit | 545 | $0 |
| Wage / Income Gap (%) | 2,050 | 43.64% |
| Wage / Income Gap ($) | 2,050 | 56.36¢ per $1 |
| Gini / Inequality Index | 2,050 | 0.41 |
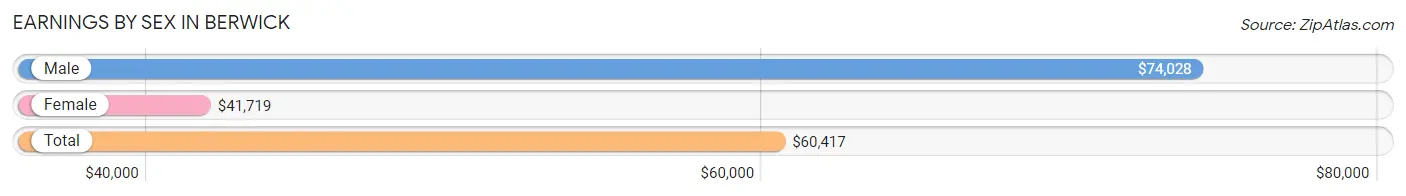
Earnings by Sex in Berwick
Average Earnings in Berwick are $60,417, $74,028 for men and $41,719 for women, a difference of 43.6%.
| Sex | Number | Average Earnings |
| Male | 499 (52.3%) | $74,028 |
| Female | 455 (47.7%) | $41,719 |
| Total | 954 (100.0%) | $60,417 |
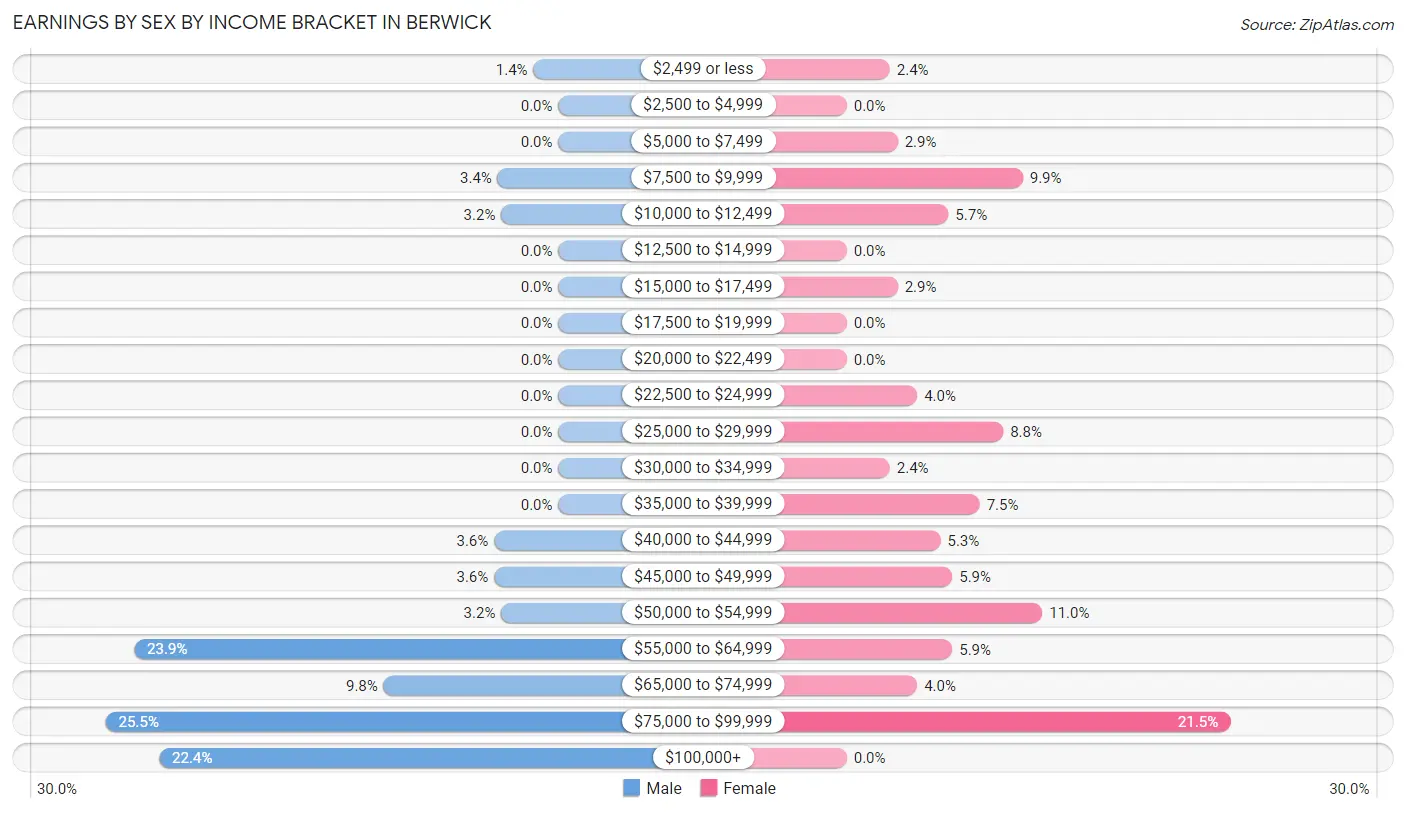
Earnings by Sex by Income Bracket in Berwick
The most common earnings brackets in Berwick are $75,000 to $99,999 for men (127 | 25.5%) and $75,000 to $99,999 for women (98 | 21.5%).
| Income | Male | Female |
| $2,499 or less | 7 (1.4%) | 11 (2.4%) |
| $2,500 to $4,999 | 0 (0.0%) | 0 (0.0%) |
| $5,000 to $7,499 | 0 (0.0%) | 13 (2.9%) |
| $7,500 to $9,999 | 17 (3.4%) | 45 (9.9%) |
| $10,000 to $12,499 | 16 (3.2%) | 26 (5.7%) |
| $12,500 to $14,999 | 0 (0.0%) | 0 (0.0%) |
| $15,000 to $17,499 | 0 (0.0%) | 13 (2.9%) |
| $17,500 to $19,999 | 0 (0.0%) | 0 (0.0%) |
| $20,000 to $22,499 | 0 (0.0%) | 0 (0.0%) |
| $22,500 to $24,999 | 0 (0.0%) | 18 (4.0%) |
| $25,000 to $29,999 | 0 (0.0%) | 40 (8.8%) |
| $30,000 to $34,999 | 0 (0.0%) | 11 (2.4%) |
| $35,000 to $39,999 | 0 (0.0%) | 34 (7.5%) |
| $40,000 to $44,999 | 18 (3.6%) | 24 (5.3%) |
| $45,000 to $49,999 | 18 (3.6%) | 27 (5.9%) |
| $50,000 to $54,999 | 16 (3.2%) | 50 (11.0%) |
| $55,000 to $64,999 | 119 (23.8%) | 27 (5.9%) |
| $65,000 to $74,999 | 49 (9.8%) | 18 (4.0%) |
| $75,000 to $99,999 | 127 (25.5%) | 98 (21.5%) |
| $100,000+ | 112 (22.4%) | 0 (0.0%) |
| Total | 499 (100.0%) | 455 (100.0%) |
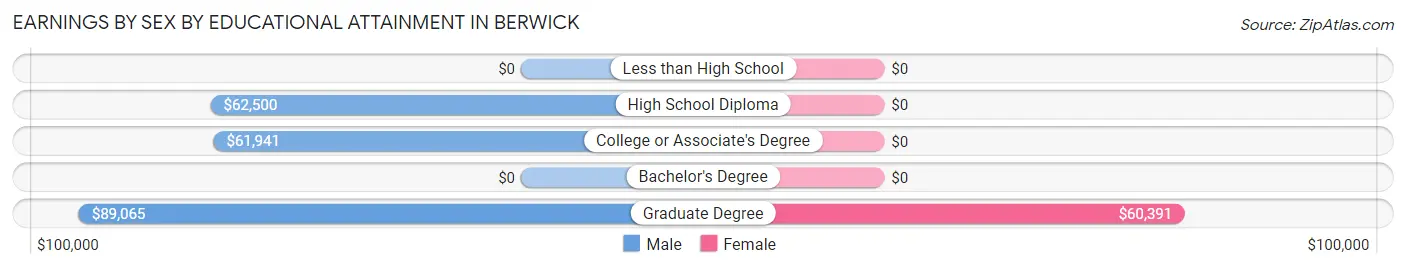
Earnings by Sex by Educational Attainment in Berwick
Average earnings in Berwick are $88,091 for men and $42,396 for women, a difference of 51.9%. Men with an educational attainment of graduate degree enjoy the highest average annual earnings of $89,065, while those with college or associate's degree education earn the least with $61,941. Women with an educational attainment of graduate degree earn the most with the average annual earnings of $60,391, while those with graduate degree education have the smallest earnings of $60,391.
| Educational Attainment | Male Income | Female Income |
| Less than High School | - | - |
| High School Diploma | $62,500 | $0 |
| College or Associate's Degree | $61,941 | $0 |
| Bachelor's Degree | - | - |
| Graduate Degree | $89,065 | $60,391 |
| Total | $88,091 | $42,396 |
Family Income in Berwick
Family Income Brackets in Berwick
According to the Berwick family income data, there are 156 families falling into the $75,000 to $99,999 income range, which is the most common income bracket and makes up 28.6% of all families.
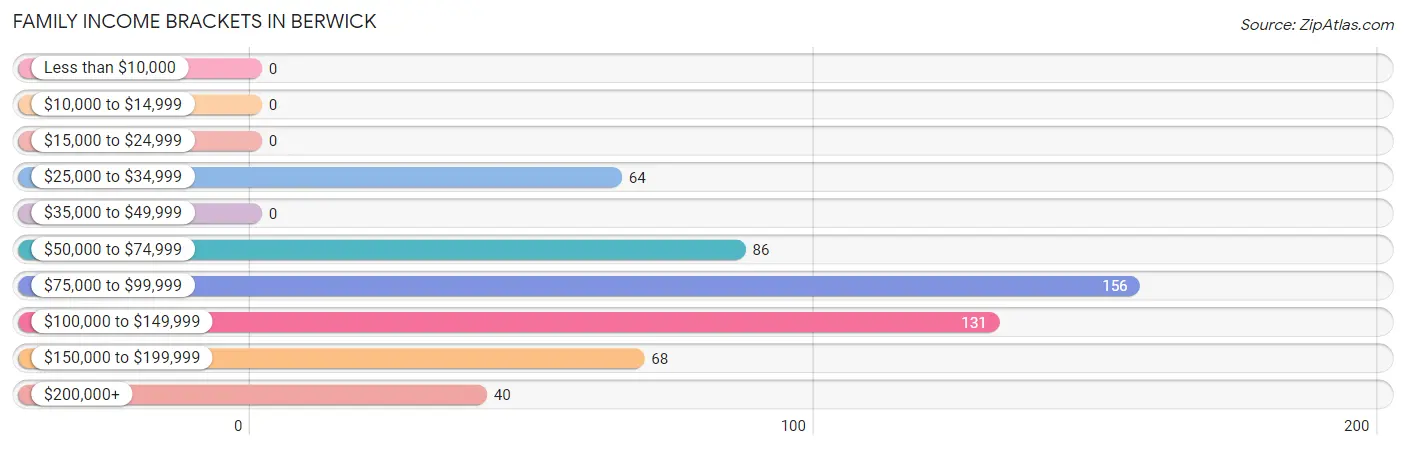
| Income Bracket | # Families | % Families |
| Less than $10,000 | 0 | 0.0% |
| $10,000 to $14,999 | 0 | 0.0% |
| $15,000 to $24,999 | 0 | 0.0% |
| $25,000 to $34,999 | 64 | 11.7% |
| $35,000 to $49,999 | 0 | 0.0% |
| $50,000 to $74,999 | 86 | 15.8% |
| $75,000 to $99,999 | 156 | 28.6% |
| $100,000 to $149,999 | 131 | 24.0% |
| $150,000 to $199,999 | 68 | 12.5% |
| $200,000+ | 40 | 7.3% |
Family Income by Famaliy Size in Berwick
4-person families (109 | 20.0%) account for the highest median family income in Berwick with $130,038 per family, while 2-person families (206 | 37.8%) have the highest median income of $56,094 per family member.
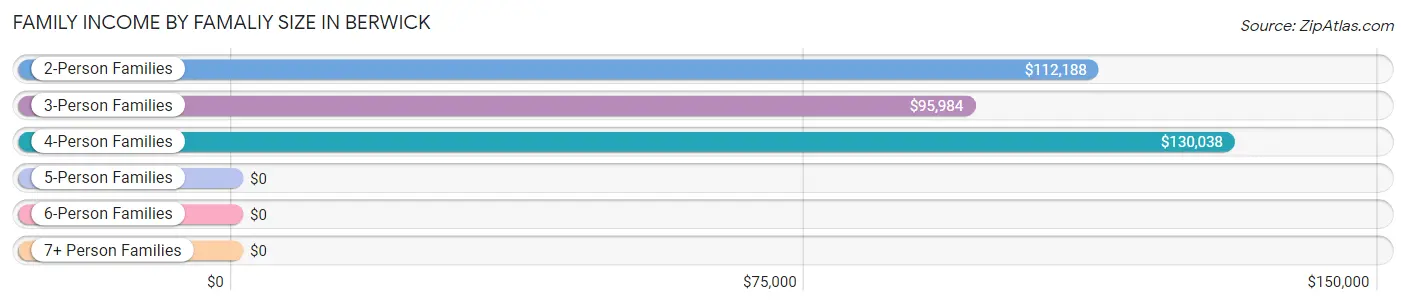
| Income Bracket | # Families | Median Income |
| 2-Person Families | 206 (37.8%) | $112,188 |
| 3-Person Families | 230 (42.2%) | $95,984 |
| 4-Person Families | 109 (20.0%) | $130,038 |
| 5-Person Families | 0 (0.0%) | $0 |
| 6-Person Families | 0 (0.0%) | $0 |
| 7+ Person Families | 0 (0.0%) | $0 |
| Total | 545 (100.0%) | $96,841 |
Family Income by Number of Earners in Berwick
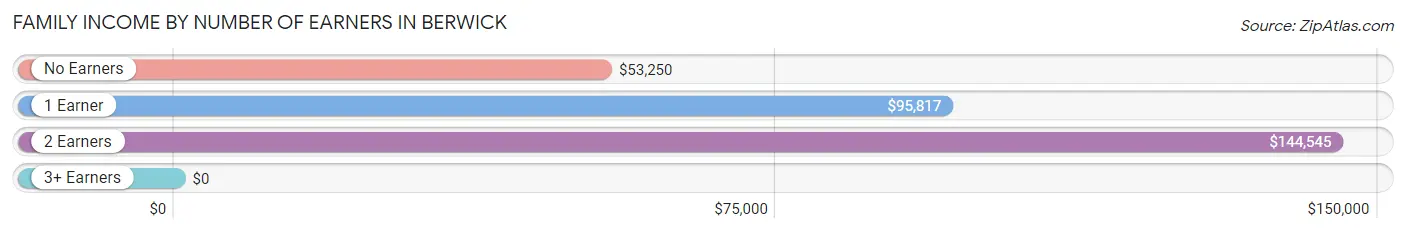
| Number of Earners | # Families | Median Income |
| No Earners | 84 (15.4%) | $53,250 |
| 1 Earner | 237 (43.5%) | $95,817 |
| 2 Earners | 224 (41.1%) | $144,545 |
| 3+ Earners | 0 (0.0%) | $0 |
| Total | 545 (100.0%) | $96,841 |
Household Income in Berwick
Household Income Brackets in Berwick
With 194 households falling in the category, the $50,000 to $74,999 income range is the most frequent in Berwick, accounting for 19.7% of all households. In contrast, only 34 households (3.5%) fall into the $35,000 to $49,999 income bracket, making it the least populous group.
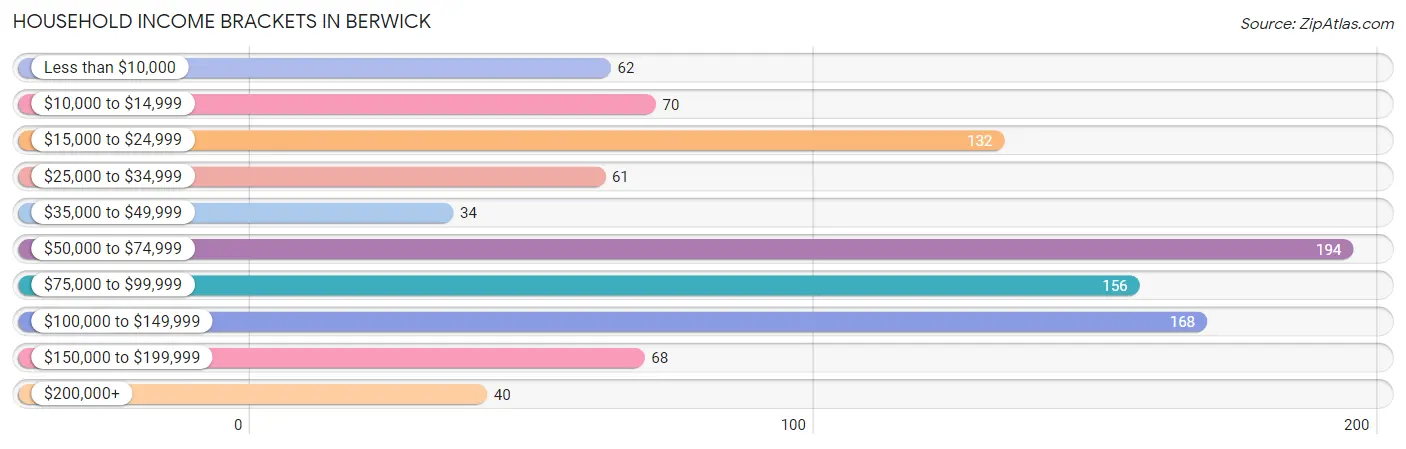
| Income Bracket | # Households | % Households |
| Less than $10,000 | 62 | 6.3% |
| $10,000 to $14,999 | 70 | 7.1% |
| $15,000 to $24,999 | 132 | 13.4% |
| $25,000 to $34,999 | 61 | 6.2% |
| $35,000 to $49,999 | 34 | 3.5% |
| $50,000 to $74,999 | 194 | 19.7% |
| $75,000 to $99,999 | 156 | 15.8% |
| $100,000 to $149,999 | 168 | 17.1% |
| $150,000 to $199,999 | 68 | 6.9% |
| $200,000+ | 40 | 4.1% |
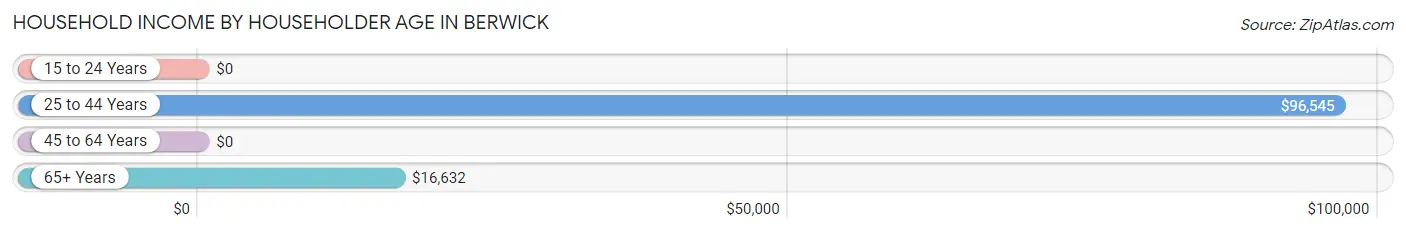
Household Income by Householder Age in Berwick
The median household income in Berwick is $63,199, with the highest median household income of $96,545 found in the 25 to 44 years age bracket for the primary householder. A total of 333 households (33.8%) fall into this category. Meanwhile, the 15 to 24 years age bracket for the primary householder has the lowest median household income of $0, with 81 households (8.2%) in this group.
| Income Bracket | # Households | Median Income |
| 15 to 24 Years | 81 (8.2%) | $0 |
| 25 to 44 Years | 333 (33.8%) | $96,545 |
| 45 to 64 Years | 312 (31.7%) | $0 |
| 65+ Years | 259 (26.3%) | $16,632 |
| Total | 985 (100.0%) | $63,199 |
Poverty in Berwick
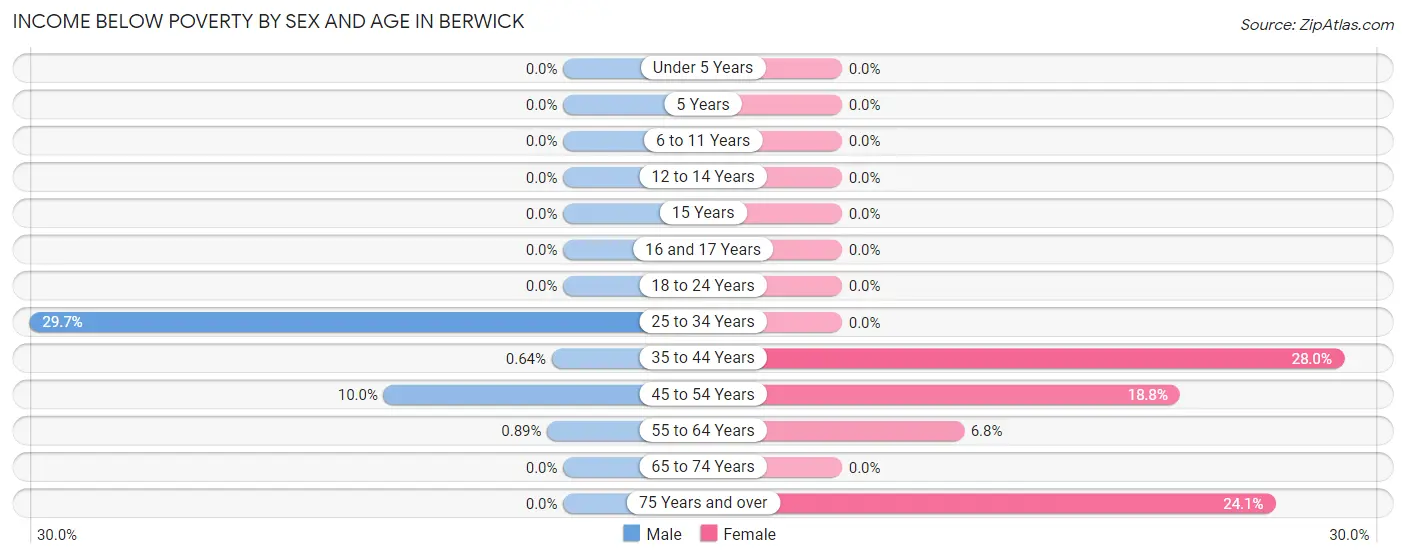
Income Below Poverty by Sex and Age in Berwick
With 3.1% poverty level for males and 10.9% for females among the residents of Berwick, 25 to 34 year old males and 35 to 44 year old females are the most vulnerable to poverty, with 22 males (29.7%) and 45 females (28.0%) in their respective age groups living below the poverty level.
| Age Bracket | Male | Female |
| Under 5 Years | 0 (0.0%) | 0 (0.0%) |
| 5 Years | 0 (0.0%) | 0 (0.0%) |
| 6 to 11 Years | 0 (0.0%) | 0 (0.0%) |
| 12 to 14 Years | 0 (0.0%) | 0 (0.0%) |
| 15 Years | 0 (0.0%) | 0 (0.0%) |
| 16 and 17 Years | 0 (0.0%) | 0 (0.0%) |
| 18 to 24 Years | 0 (0.0%) | 0 (0.0%) |
| 25 to 34 Years | 22 (29.7%) | 0 (0.0%) |
| 35 to 44 Years | 2 (0.6%) | 45 (28.0%) |
| 45 to 54 Years | 2 (10.0%) | 32 (18.8%) |
| 55 to 64 Years | 1 (0.9%) | 11 (6.8%) |
| 65 to 74 Years | 0 (0.0%) | 0 (0.0%) |
| 75 Years and over | 0 (0.0%) | 42 (24.1%) |
| Total | 27 (3.1%) | 130 (10.9%) |
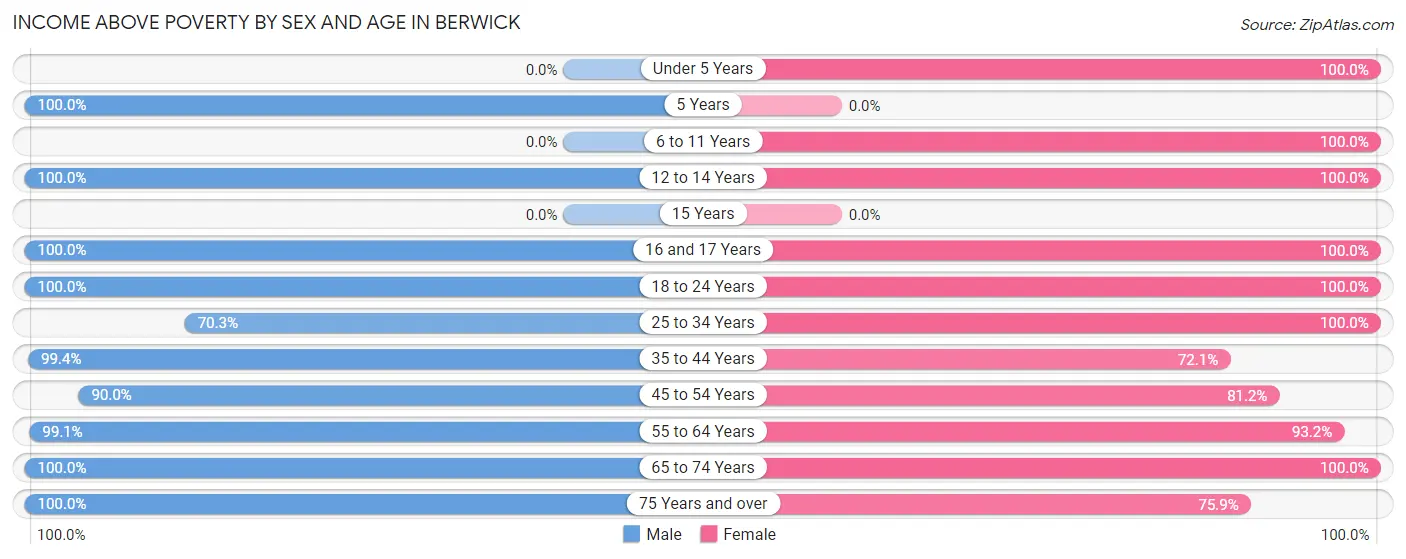
Income Above Poverty by Sex and Age in Berwick
According to the poverty statistics in Berwick, males aged 5 years and females aged under 5 years are the age groups that are most secure financially, with 100.0% of males and 100.0% of females in these age groups living above the poverty line.
| Age Bracket | Male | Female |
| Under 5 Years | 0 (0.0%) | 28 (100.0%) |
| 5 Years | 25 (100.0%) | 0 (0.0%) |
| 6 to 11 Years | 0 (0.0%) | 74 (100.0%) |
| 12 to 14 Years | 31 (100.0%) | 217 (100.0%) |
| 15 Years | 0 (0.0%) | 0 (0.0%) |
| 16 and 17 Years | 31 (100.0%) | 81 (100.0%) |
| 18 to 24 Years | 116 (100.0%) | 43 (100.0%) |
| 25 to 34 Years | 52 (70.3%) | 13 (100.0%) |
| 35 to 44 Years | 312 (99.4%) | 116 (72.1%) |
| 45 to 54 Years | 18 (90.0%) | 138 (81.2%) |
| 55 to 64 Years | 111 (99.1%) | 151 (93.2%) |
| 65 to 74 Years | 93 (100.0%) | 68 (100.0%) |
| 75 Years and over | 43 (100.0%) | 132 (75.9%) |
| Total | 832 (96.9%) | 1,061 (89.1%) |
Income Below Poverty Among Married-Couple Families in Berwick
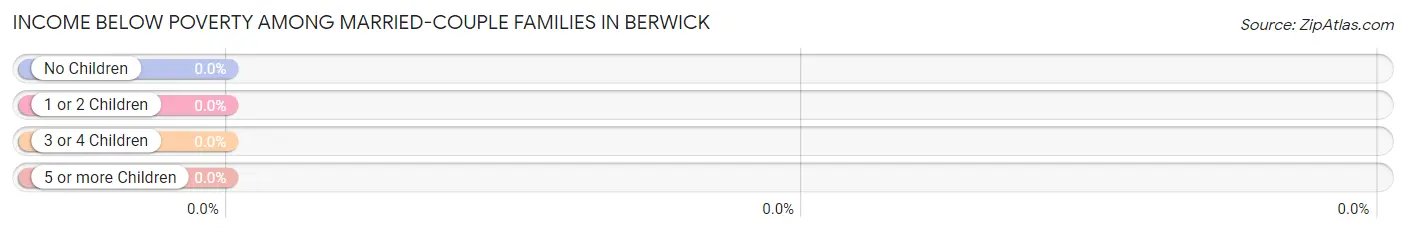
| Children | Above Poverty | Below Poverty |
| No Children | 160 (100.0%) | 0 (0.0%) |
| 1 or 2 Children | 87 (100.0%) | 0 (0.0%) |
| 3 or 4 Children | 0 (0.0%) | 0 (0.0%) |
| 5 or more Children | 0 (0.0%) | 0 (0.0%) |
| Total | 247 (100.0%) | 0 (0.0%) |
Income Below Poverty Among Single-Parent Households in Berwick
| Children | Single Father | Single Mother |
| No Children | 0 (0.0%) | 0 (0.0%) |
| 1 or 2 Children | 0 (0.0%) | 0 (0.0%) |
| 3 or 4 Children | 0 (0.0%) | 0 (0.0%) |
| 5 or more Children | 0 (0.0%) | 0 (0.0%) |
| Total | 0 (0.0%) | 0 (0.0%) |
Income Below Poverty Among Married-Couple vs Single-Parent Households in Berwick
| Children | Married-Couple Families | Single-Parent Households |
| No Children | 0 (0.0%) | 0 (0.0%) |
| 1 or 2 Children | 0 (0.0%) | 0 (0.0%) |
| 3 or 4 Children | 0 (0.0%) | 0 (0.0%) |
| 5 or more Children | 0 (0.0%) | 0 (0.0%) |
| Total | 0 (0.0%) | 0 (0.0%) |
Race in Berwick
The most populous races in Berwick are White / Caucasian (1,903 | 92.8%), Asian (95 | 4.6%), and Two or more Races (52 | 2.5%).
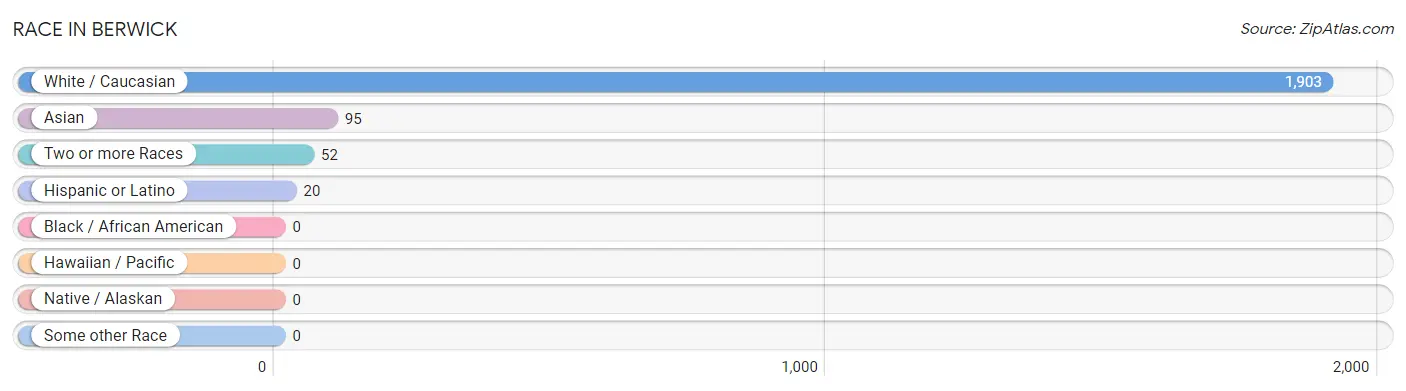
| Race | # Population | % Population |
| Asian | 95 | 4.6% |
| Black / African American | 0 | 0.0% |
| Hawaiian / Pacific | 0 | 0.0% |
| Hispanic or Latino | 20 | 1.0% |
| Native / Alaskan | 0 | 0.0% |
| White / Caucasian | 1,903 | 92.8% |
| Two or more Races | 52 | 2.5% |
| Some other Race | 0 | 0.0% |
| Total | 2,050 | 100.0% |
Ancestry in Berwick
The most populous ancestries reported in Berwick are English (580 | 28.3%), German (533 | 26.0%), Irish (499 | 24.3%), Italian (220 | 10.7%), and French Canadian (145 | 7.1%), together accounting for 96.4% of all Berwick residents.
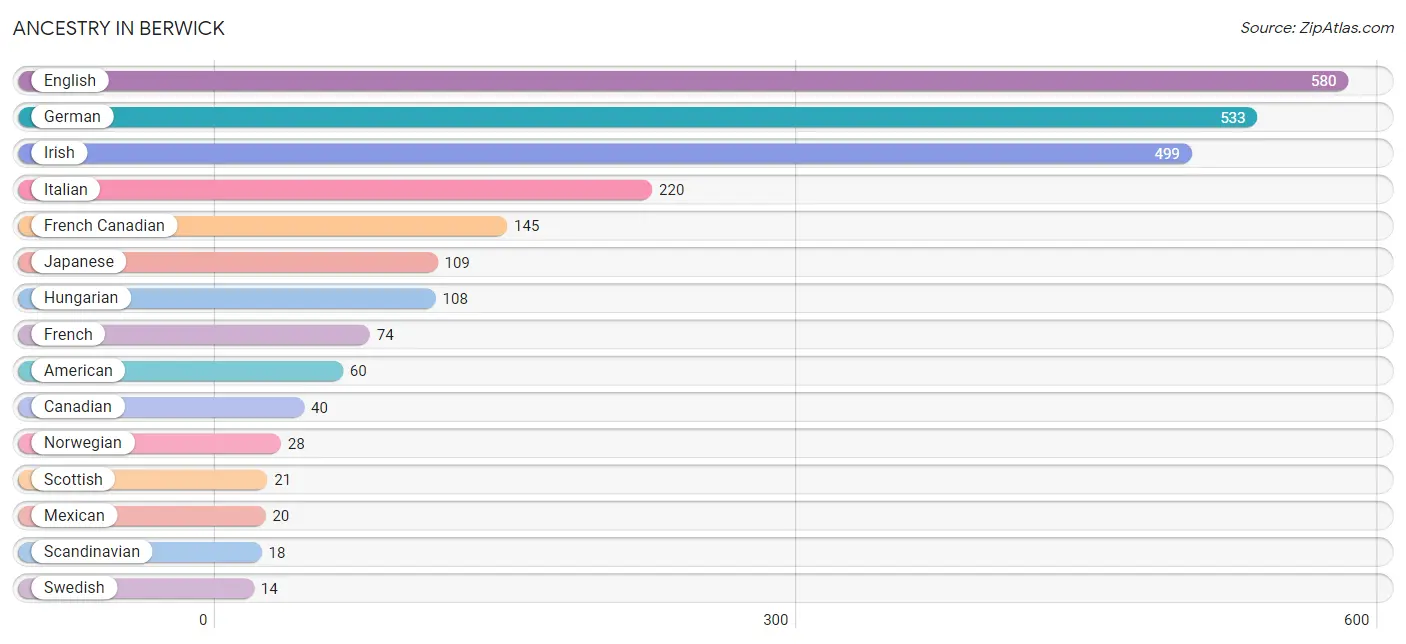
| Ancestry | # Population | % Population |
| American | 60 | 2.9% |
| Canadian | 40 | 1.9% |
| Dutch | 10 | 0.5% |
| English | 580 | 28.3% |
| French | 74 | 3.6% |
| French Canadian | 145 | 7.1% |
| German | 533 | 26.0% |
| Hungarian | 108 | 5.3% |
| Irish | 499 | 24.3% |
| Italian | 220 | 10.7% |
| Japanese | 109 | 5.3% |
| Mexican | 20 | 1.0% |
| Norwegian | 28 | 1.4% |
| Scandinavian | 18 | 0.9% |
| Scottish | 21 | 1.0% |
| Swedish | 14 | 0.7% | View All 16 Rows |
Immigrants in Berwick
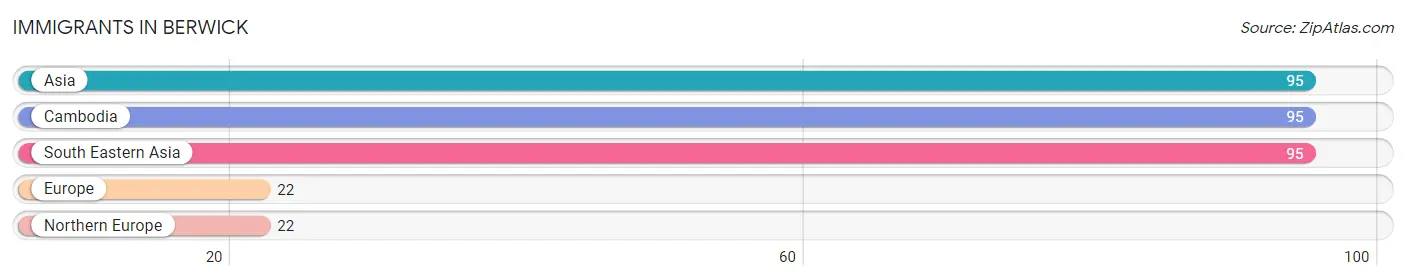
The most numerous immigrant groups reported in Berwick came from Asia (95 | 4.6%), Cambodia (95 | 4.6%), South Eastern Asia (95 | 4.6%), Europe (22 | 1.1%), and Northern Europe (22 | 1.1%), together accounting for 16.0% of all Berwick residents.
| Immigration Origin | # Population | % Population |
| Asia | 95 | 4.6% |
| Cambodia | 95 | 4.6% |
| Europe | 22 | 1.1% |
| Northern Europe | 22 | 1.1% |
| South Eastern Asia | 95 | 4.6% | View All 5 Rows |
Sex and Age in Berwick
Sex and Age in Berwick
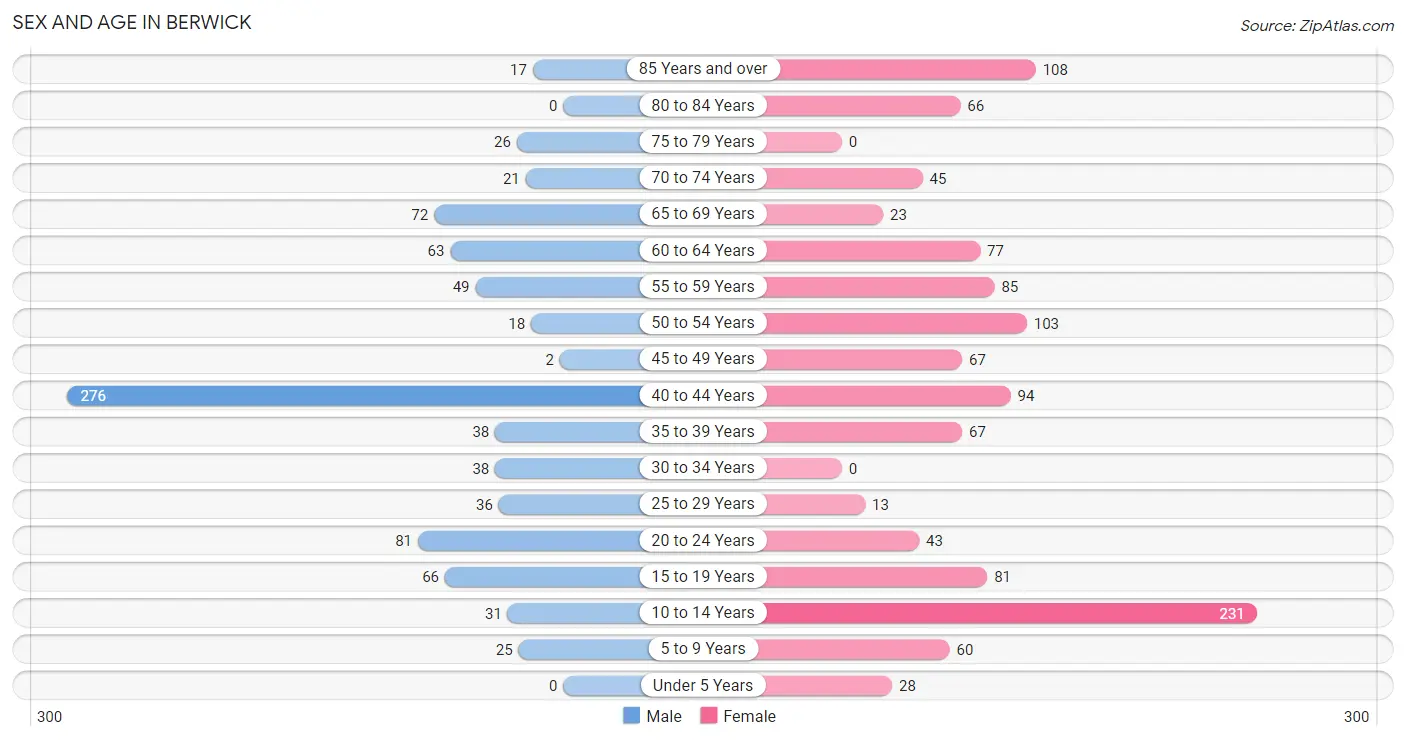
The most populous age groups in Berwick are 40 to 44 Years (276 | 32.1%) for men and 10 to 14 Years (231 | 19.4%) for women.
| Age Bracket | Male | Female |
| Under 5 Years | 0 (0.0%) | 28 (2.4%) |
| 5 to 9 Years | 25 (2.9%) | 60 (5.0%) |
| 10 to 14 Years | 31 (3.6%) | 231 (19.4%) |
| 15 to 19 Years | 66 (7.7%) | 81 (6.8%) |
| 20 to 24 Years | 81 (9.4%) | 43 (3.6%) |
| 25 to 29 Years | 36 (4.2%) | 13 (1.1%) |
| 30 to 34 Years | 38 (4.4%) | 0 (0.0%) |
| 35 to 39 Years | 38 (4.4%) | 67 (5.6%) |
| 40 to 44 Years | 276 (32.1%) | 94 (7.9%) |
| 45 to 49 Years | 2 (0.2%) | 67 (5.6%) |
| 50 to 54 Years | 18 (2.1%) | 103 (8.6%) |
| 55 to 59 Years | 49 (5.7%) | 85 (7.1%) |
| 60 to 64 Years | 63 (7.3%) | 77 (6.5%) |
| 65 to 69 Years | 72 (8.4%) | 23 (1.9%) |
| 70 to 74 Years | 21 (2.4%) | 45 (3.8%) |
| 75 to 79 Years | 26 (3.0%) | 0 (0.0%) |
| 80 to 84 Years | 0 (0.0%) | 66 (5.5%) |
| 85 Years and over | 17 (2.0%) | 108 (9.1%) |
| Total | 859 (100.0%) | 1,191 (100.0%) |
Families and Households in Berwick
Median Family Size in Berwick
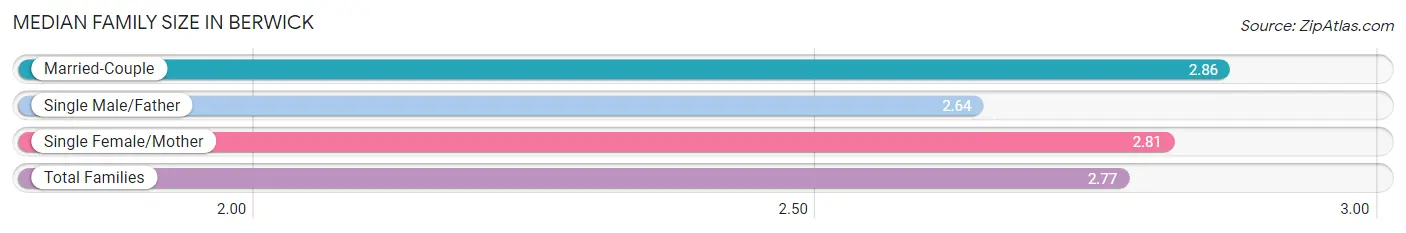
The median family size in Berwick is 2.77 persons per family, with married-couple families (247 | 45.3%) accounting for the largest median family size of 2.86 persons per family. On the other hand, single male/father families (187 | 34.3%) represent the smallest median family size with 2.64 persons per family.
| Family Type | # Families | Family Size |
| Married-Couple | 247 (45.3%) | 2.86 |
| Single Male/Father | 187 (34.3%) | 2.64 |
| Single Female/Mother | 111 (20.4%) | 2.81 |
| Total Families | 545 (100.0%) | 2.77 |
Median Household Size in Berwick
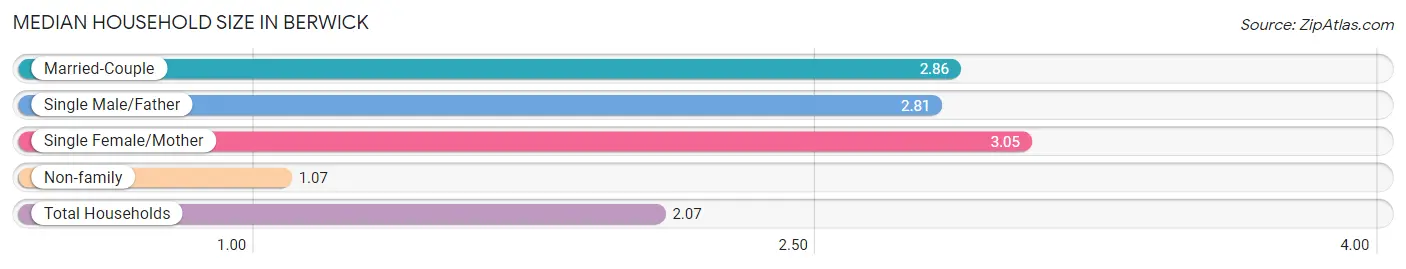
The median household size in Berwick is 2.07 persons per household, with single female/mother households (111 | 11.3%) accounting for the largest median household size of 3.05 persons per household. non-family households (440 | 44.7%) represent the smallest median household size with 1.07 persons per household.
| Household Type | # Households | Household Size |
| Married-Couple | 247 (25.1%) | 2.86 |
| Single Male/Father | 187 (19.0%) | 2.81 |
| Single Female/Mother | 111 (11.3%) | 3.05 |
| Non-family | 440 (44.7%) | 1.07 |
| Total Households | 985 (100.0%) | 2.07 |
Household Size by Marriage Status in Berwick
Out of a total of 985 households in Berwick, 545 (55.3%) are family households, while 440 (44.7%) are nonfamily households. The most numerous type of family households are 2-person households, comprising 206, and the most common type of nonfamily households are 1-person households, comprising 409.
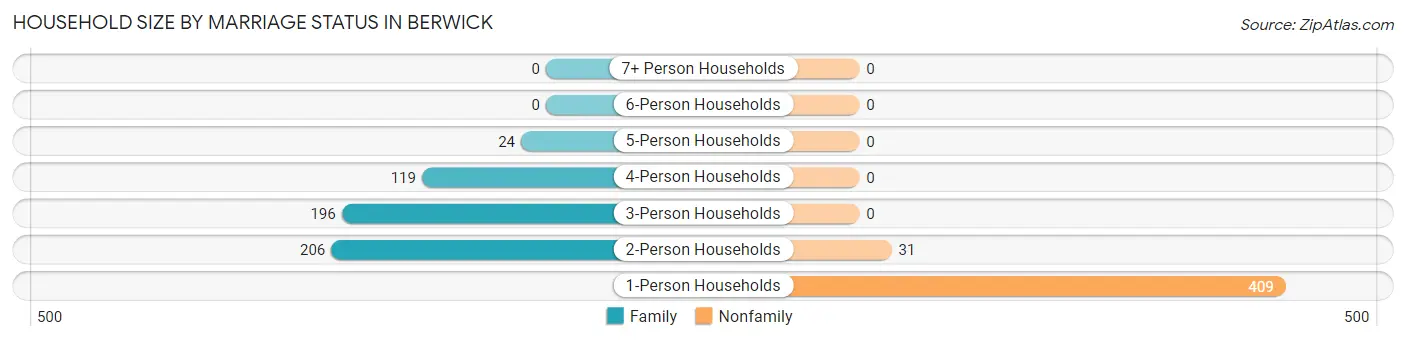
| Household Size | Family Households | Nonfamily Households |
| 1-Person Households | - | 409 (41.5%) |
| 2-Person Households | 206 (20.9%) | 31 (3.2%) |
| 3-Person Households | 196 (19.9%) | 0 (0.0%) |
| 4-Person Households | 119 (12.1%) | 0 (0.0%) |
| 5-Person Households | 24 (2.4%) | 0 (0.0%) |
| 6-Person Households | 0 (0.0%) | 0 (0.0%) |
| 7+ Person Households | 0 (0.0%) | 0 (0.0%) |
| Total | 545 (55.3%) | 440 (44.7%) |
Female Fertility in Berwick
Fertility by Age in Berwick
Average fertility rate in Berwick is 36.0 births per 1,000 women. Women in the age bracket of 20 to 34 years have the highest fertility rate with 232.0 births per 1,000 women. Women in the age bracket of 20 to 34 years acount for 100.0% of all women with births.
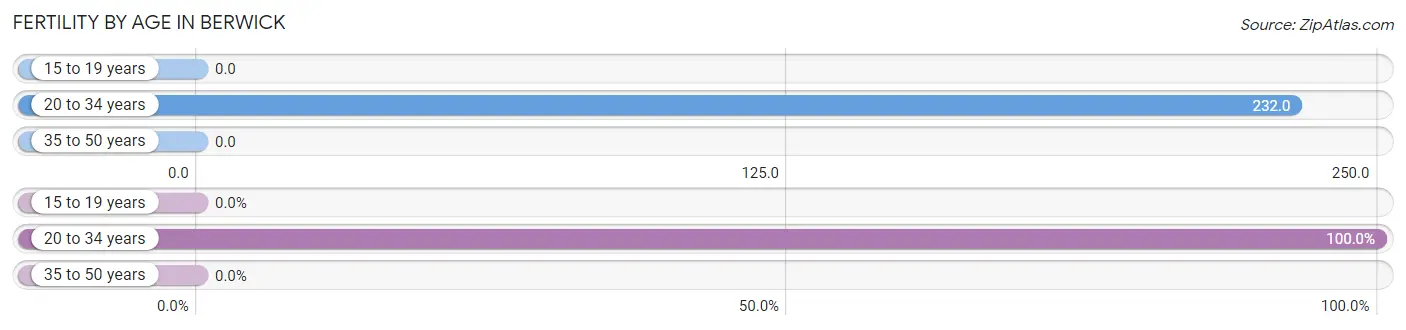
| Age Bracket | Women with Births | Births / 1,000 Women |
| 15 to 19 years | 0 (0.0%) | 0.0 |
| 20 to 34 years | 13 (100.0%) | 232.0 |
| 35 to 50 years | 0 (0.0%) | 0.0 |
| Total | 13 (100.0%) | 36.0 |
Fertility by Age by Marriage Status in Berwick
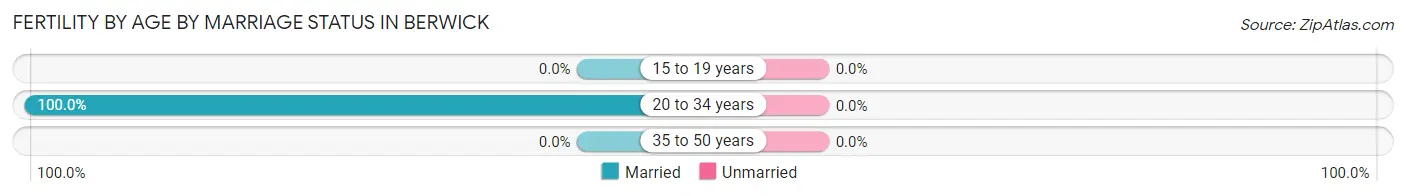
| Age Bracket | Married | Unmarried |
| 15 to 19 years | 0 (0.0%) | 0 (0.0%) |
| 20 to 34 years | 13 (100.0%) | 0 (0.0%) |
| 35 to 50 years | 0 (0.0%) | 0 (0.0%) |
| Total | 13 (100.0%) | 0 (0.0%) |
Fertility by Education in Berwick
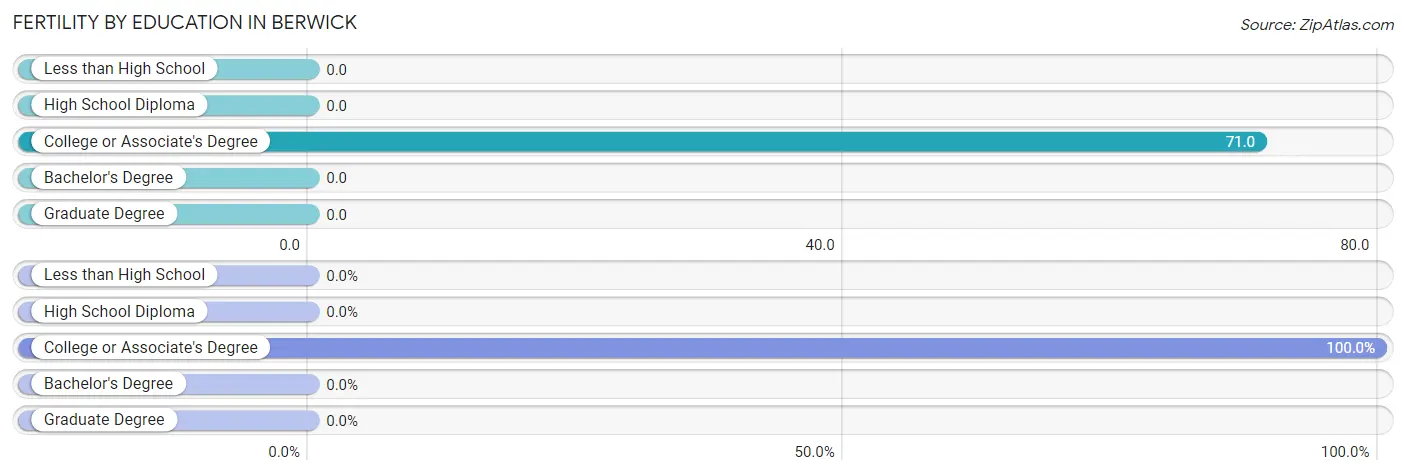
| Educational Attainment | Women with Births | Births / 1,000 Women |
| Less than High School | 0 (0.0%) | 0.0 |
| High School Diploma | 0 (0.0%) | 0.0 |
| College or Associate's Degree | 13 (100.0%) | 71.0 |
| Bachelor's Degree | 0 (0.0%) | 0.0 |
| Graduate Degree | 0 (0.0%) | 0.0 |
| Total | 13 (100.0%) | 36.0 |
Fertility by Education by Marriage Status in Berwick
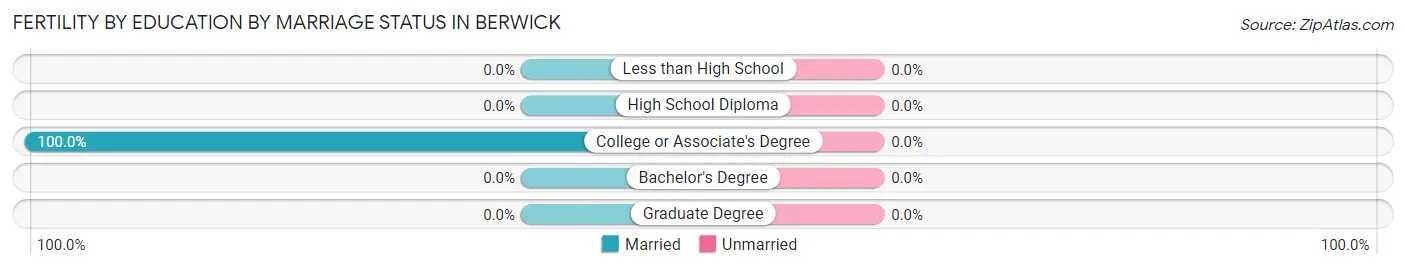
| Educational Attainment | Married | Unmarried |
| Less than High School | 0 (0.0%) | 0 (0.0%) |
| High School Diploma | 0 (0.0%) | 0 (0.0%) |
| College or Associate's Degree | 13 (100.0%) | 0 (0.0%) |
| Bachelor's Degree | 0 (0.0%) | 0 (0.0%) |
| Graduate Degree | 0 (0.0%) | 0 (0.0%) |
| Total | 13 (100.0%) | 0 (0.0%) |
Employment Characteristics in Berwick
Employment by Class of Employer in Berwick
Among the 893 employed individuals in Berwick, private company employees (436 | 48.8%), federal government employees (288 | 32.3%), and self-employed (not incorporated) (72 | 8.1%) make up the most common classes of employment.
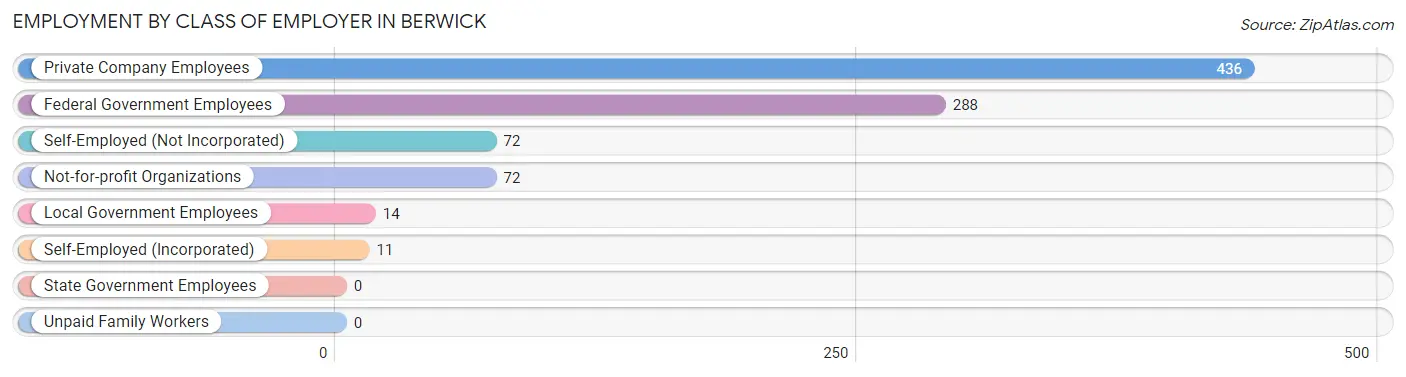
| Employer Class | # Employees | % Employees |
| Private Company Employees | 436 | 48.8% |
| Self-Employed (Incorporated) | 11 | 1.2% |
| Self-Employed (Not Incorporated) | 72 | 8.1% |
| Not-for-profit Organizations | 72 | 8.1% |
| Local Government Employees | 14 | 1.6% |
| State Government Employees | 0 | 0.0% |
| Federal Government Employees | 288 | 32.3% |
| Unpaid Family Workers | 0 | 0.0% |
| Total | 893 | 100.0% |
Employment Status by Age in Berwick
According to the labor force statistics for Berwick, out of the total population over 16 years of age (1,675), 56.1% or 940 individuals are in the labor force, with 5.0% or 47 of them unemployed. The age group with the highest labor force participation rate is 20 to 24 years, with 93.5% or 116 individuals in the labor force. Within the labor force, the 16 to 19 years age range has the highest percentage of unemployed individuals, with 100.0% or 44 of them being unemployed.
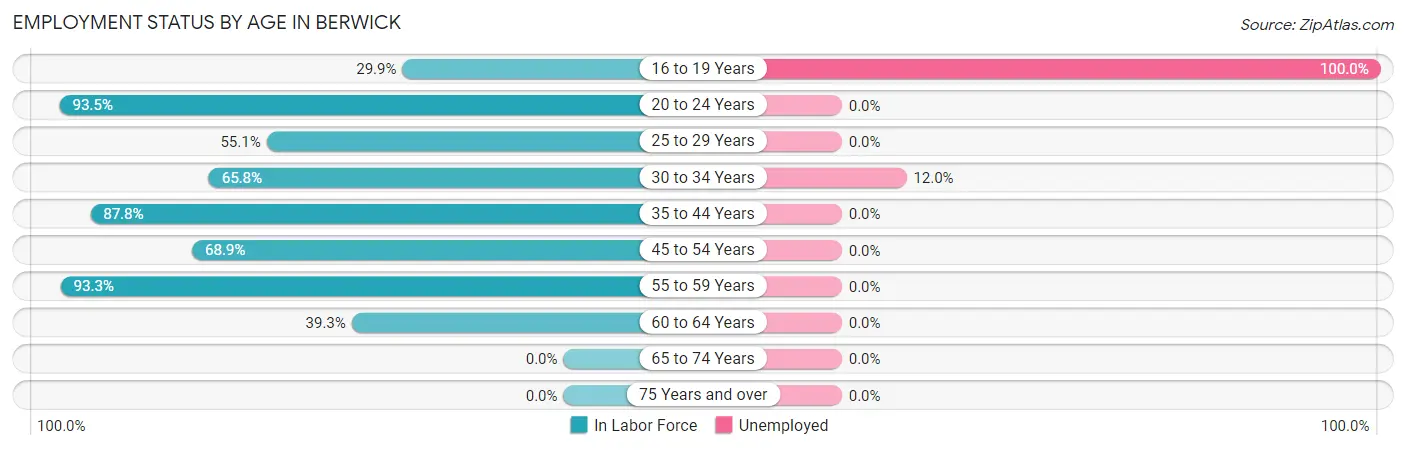
| Age Bracket | In Labor Force | Unemployed |
| 16 to 19 Years | 44 (29.9%) | 44 (100.0%) |
| 20 to 24 Years | 116 (93.5%) | 0 (0.0%) |
| 25 to 29 Years | 27 (55.1%) | 0 (0.0%) |
| 30 to 34 Years | 25 (65.8%) | 3 (12.0%) |
| 35 to 44 Years | 417 (87.8%) | 0 (0.0%) |
| 45 to 54 Years | 131 (68.9%) | 0 (0.0%) |
| 55 to 59 Years | 125 (93.3%) | 0 (0.0%) |
| 60 to 64 Years | 55 (39.3%) | 0 (0.0%) |
| 65 to 74 Years | 0 (0.0%) | 0 (0.0%) |
| 75 Years and over | 0 (0.0%) | 0 (0.0%) |
| Total | 940 (56.1%) | 47 (5.0%) |
Employment Status by Educational Attainment in Berwick
According to labor force statistics for Berwick, 76.0% of individuals (780) out of the total population between 25 and 64 years of age (1,026) are in the labor force, with 0.4% or 3 of them being unemployed. The group with the highest labor force participation rate are those with the educational attainment of bachelor's degree or higher, with 90.2% or 330 individuals in the labor force. Within the labor force, individuals with high school diploma education have the highest percentage of unemployment, with 1.8% or 3 of them being unemployed.
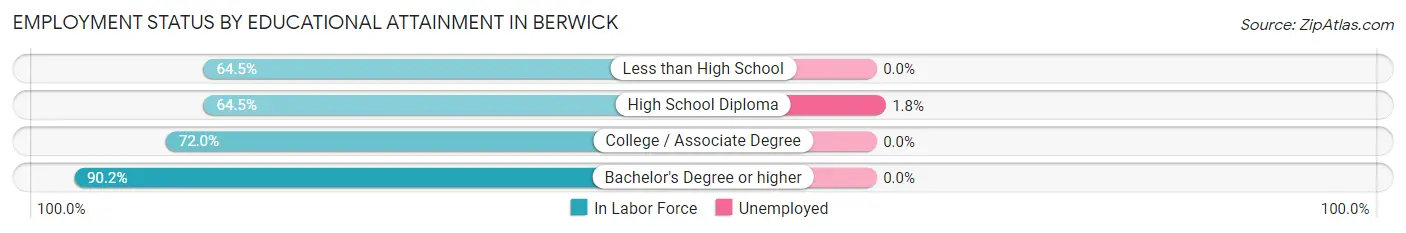
| Educational Attainment | In Labor Force | Unemployed |
| Less than High School | 49 (64.5%) | 0 (0.0%) |
| High School Diploma | 169 (64.5%) | 5 (1.8%) |
| College / Associate Degree | 232 (72.0%) | 0 (0.0%) |
| Bachelor's Degree or higher | 330 (90.2%) | 0 (0.0%) |
| Total | 780 (76.0%) | 4 (0.4%) |
Employment Occupations by Sex in Berwick
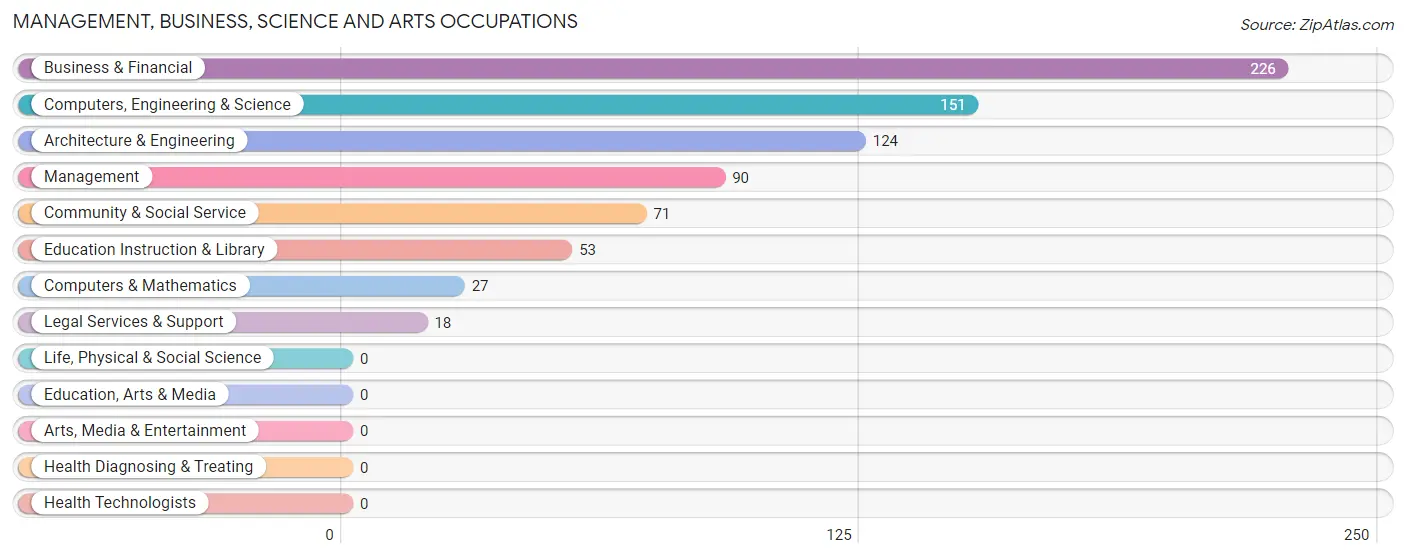
Management, Business, Science and Arts Occupations
The most common Management, Business, Science and Arts occupations in Berwick are Business & Financial (226 | 25.3%), Computers, Engineering & Science (151 | 16.9%), Architecture & Engineering (124 | 13.9%), Management (90 | 10.1%), and Community & Social Service (71 | 8.0%).
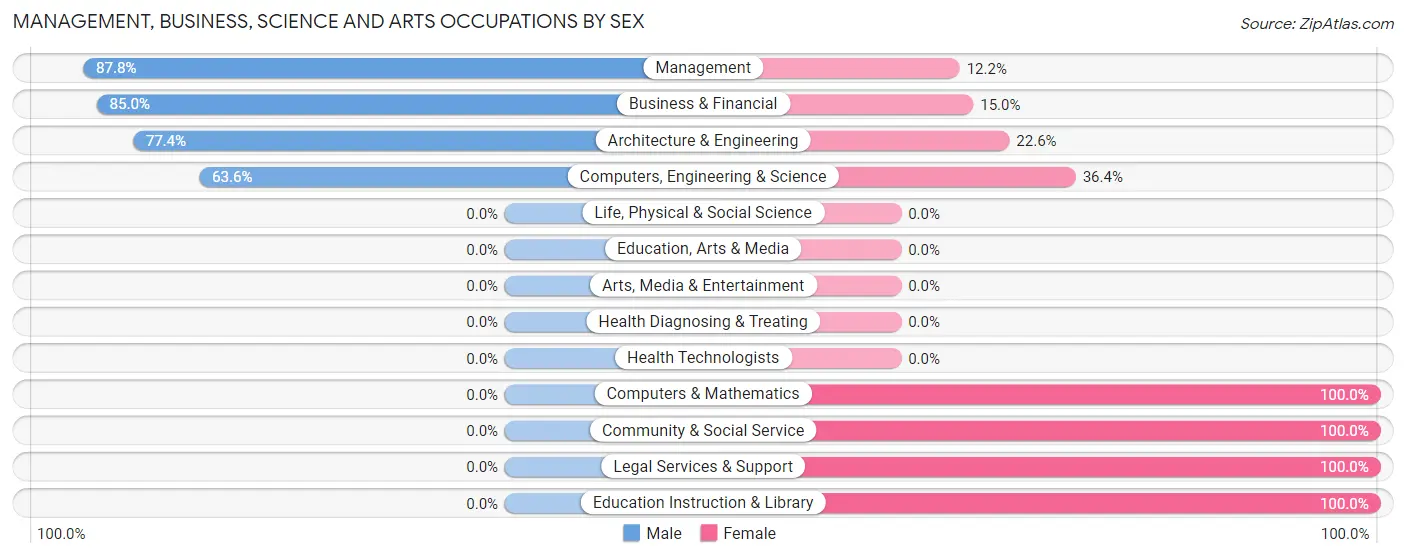
Management, Business, Science and Arts Occupations by Sex
Within the Management, Business, Science and Arts occupations in Berwick, the most male-oriented occupations are Management (87.8%), Business & Financial (85.0%), and Architecture & Engineering (77.4%), while the most female-oriented occupations are Computers & Mathematics (100.0%), Community & Social Service (100.0%), and Legal Services & Support (100.0%).
| Occupation | Male | Female |
| Management | 79 (87.8%) | 11 (12.2%) |
| Business & Financial | 192 (85.0%) | 34 (15.0%) |
| Computers, Engineering & Science | 96 (63.6%) | 55 (36.4%) |
| Computers & Mathematics | 0 (0.0%) | 27 (100.0%) |
| Architecture & Engineering | 96 (77.4%) | 28 (22.6%) |
| Life, Physical & Social Science | 0 (0.0%) | 0 (0.0%) |
| Community & Social Service | 0 (0.0%) | 71 (100.0%) |
| Education, Arts & Media | 0 (0.0%) | 0 (0.0%) |
| Legal Services & Support | 0 (0.0%) | 18 (100.0%) |
| Education Instruction & Library | 0 (0.0%) | 53 (100.0%) |
| Arts, Media & Entertainment | 0 (0.0%) | 0 (0.0%) |
| Health Diagnosing & Treating | 0 (0.0%) | 0 (0.0%) |
| Health Technologists | 0 (0.0%) | 0 (0.0%) |
| Total (Category) | 367 (68.2%) | 171 (31.8%) |
| Total (Overall) | 476 (53.3%) | 417 (46.7%) |
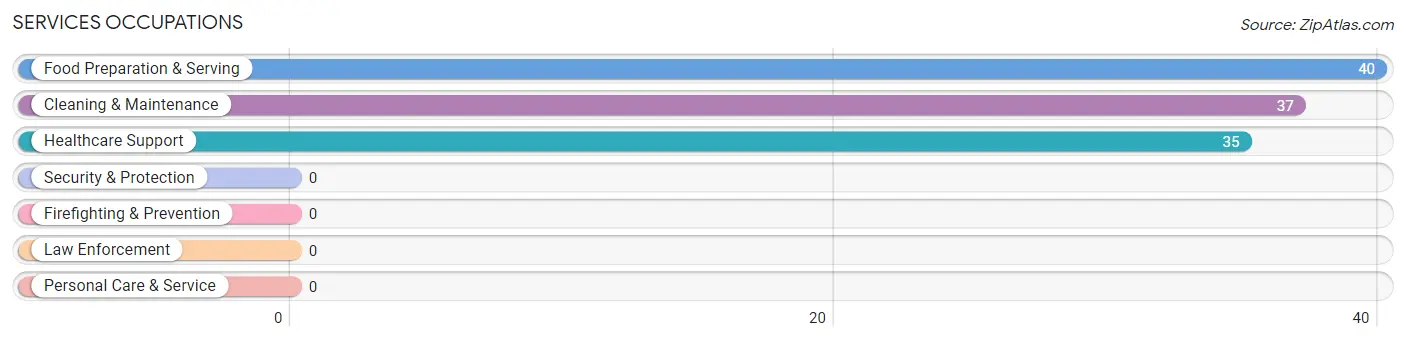
Services Occupations
The most common Services occupations in Berwick are Food Preparation & Serving (40 | 4.5%), Cleaning & Maintenance (37 | 4.1%), and Healthcare Support (35 | 3.9%).
Services Occupations by Sex
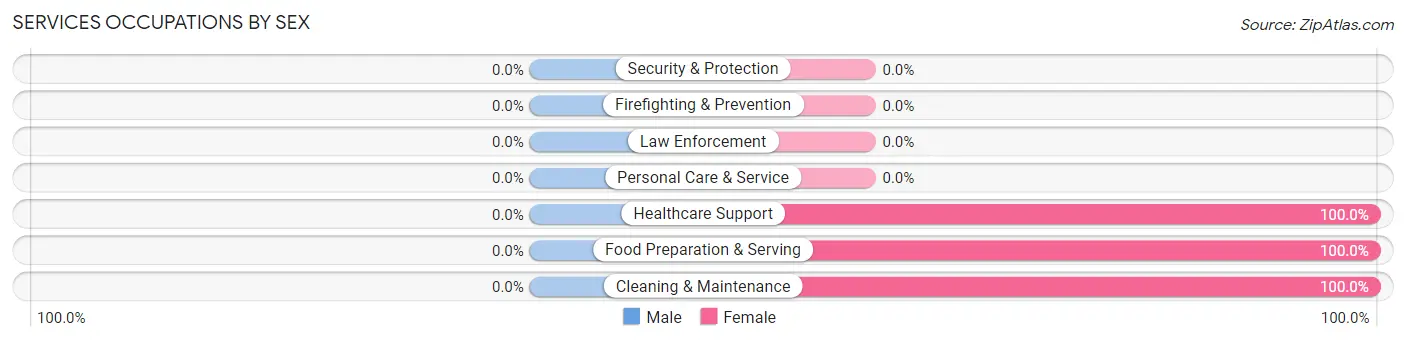
| Occupation | Male | Female |
| Healthcare Support | 0 (0.0%) | 35 (100.0%) |
| Security & Protection | 0 (0.0%) | 0 (0.0%) |
| Firefighting & Prevention | 0 (0.0%) | 0 (0.0%) |
| Law Enforcement | 0 (0.0%) | 0 (0.0%) |
| Food Preparation & Serving | 0 (0.0%) | 40 (100.0%) |
| Cleaning & Maintenance | 0 (0.0%) | 37 (100.0%) |
| Personal Care & Service | 0 (0.0%) | 0 (0.0%) |
| Total (Category) | 0 (0.0%) | 112 (100.0%) |
| Total (Overall) | 476 (53.3%) | 417 (46.7%) |
Sales and Office Occupations
The most common Sales and Office occupations in Berwick are Sales & Related (92 | 10.3%), and Office & Administration (77 | 8.6%).

Sales and Office Occupations by Sex

| Occupation | Male | Female |
| Sales & Related | 0 (0.0%) | 92 (100.0%) |
| Office & Administration | 44 (57.1%) | 33 (42.9%) |
| Total (Category) | 44 (26.0%) | 125 (74.0%) |
| Total (Overall) | 476 (53.3%) | 417 (46.7%) |
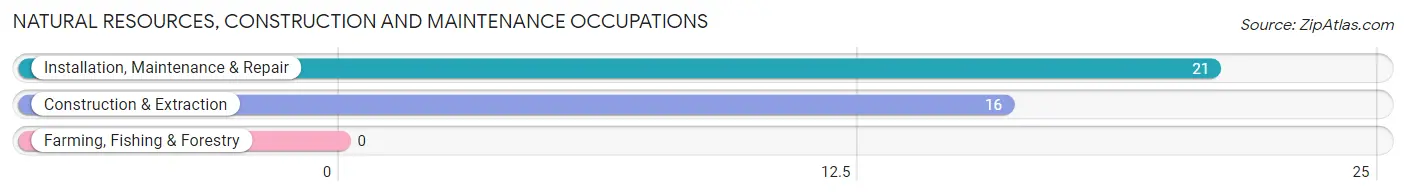
Natural Resources, Construction and Maintenance Occupations
The most common Natural Resources, Construction and Maintenance occupations in Berwick are Installation, Maintenance & Repair (21 | 2.4%), and Construction & Extraction (16 | 1.8%).
Natural Resources, Construction and Maintenance Occupations by Sex
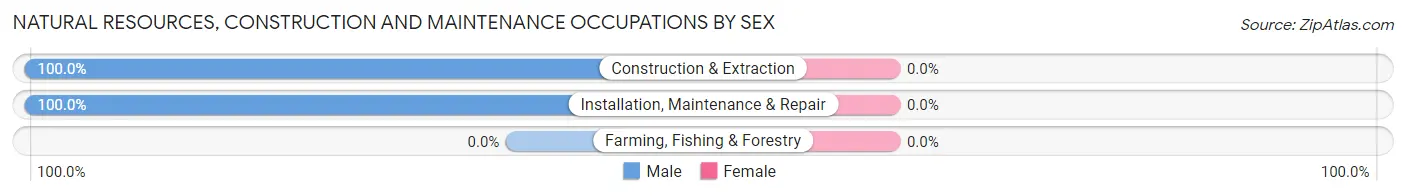
| Occupation | Male | Female |
| Farming, Fishing & Forestry | 0 (0.0%) | 0 (0.0%) |
| Construction & Extraction | 16 (100.0%) | 0 (0.0%) |
| Installation, Maintenance & Repair | 21 (100.0%) | 0 (0.0%) |
| Total (Category) | 37 (100.0%) | 0 (0.0%) |
| Total (Overall) | 476 (53.3%) | 417 (46.7%) |
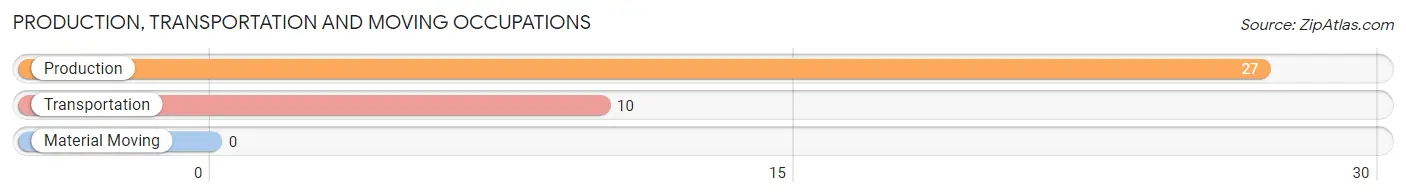
Production, Transportation and Moving Occupations
The most common Production, Transportation and Moving occupations in Berwick are Production (27 | 3.0%), and Transportation (10 | 1.1%).
Production, Transportation and Moving Occupations by Sex
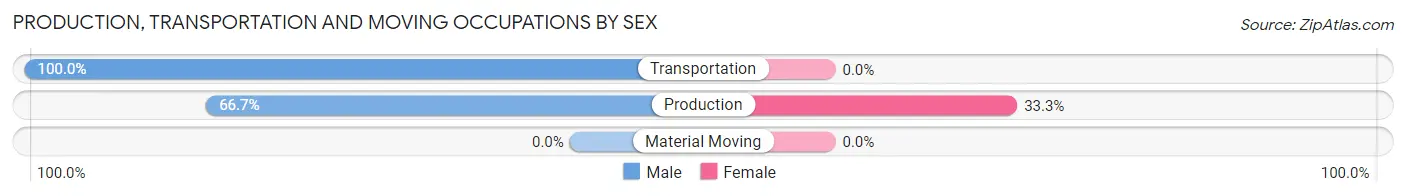
| Occupation | Male | Female |
| Production | 18 (66.7%) | 9 (33.3%) |
| Transportation | 10 (100.0%) | 0 (0.0%) |
| Material Moving | 0 (0.0%) | 0 (0.0%) |
| Total (Category) | 28 (75.7%) | 9 (24.3%) |
| Total (Overall) | 476 (53.3%) | 417 (46.7%) |
Employment Industries by Sex in Berwick
Employment Industries in Berwick
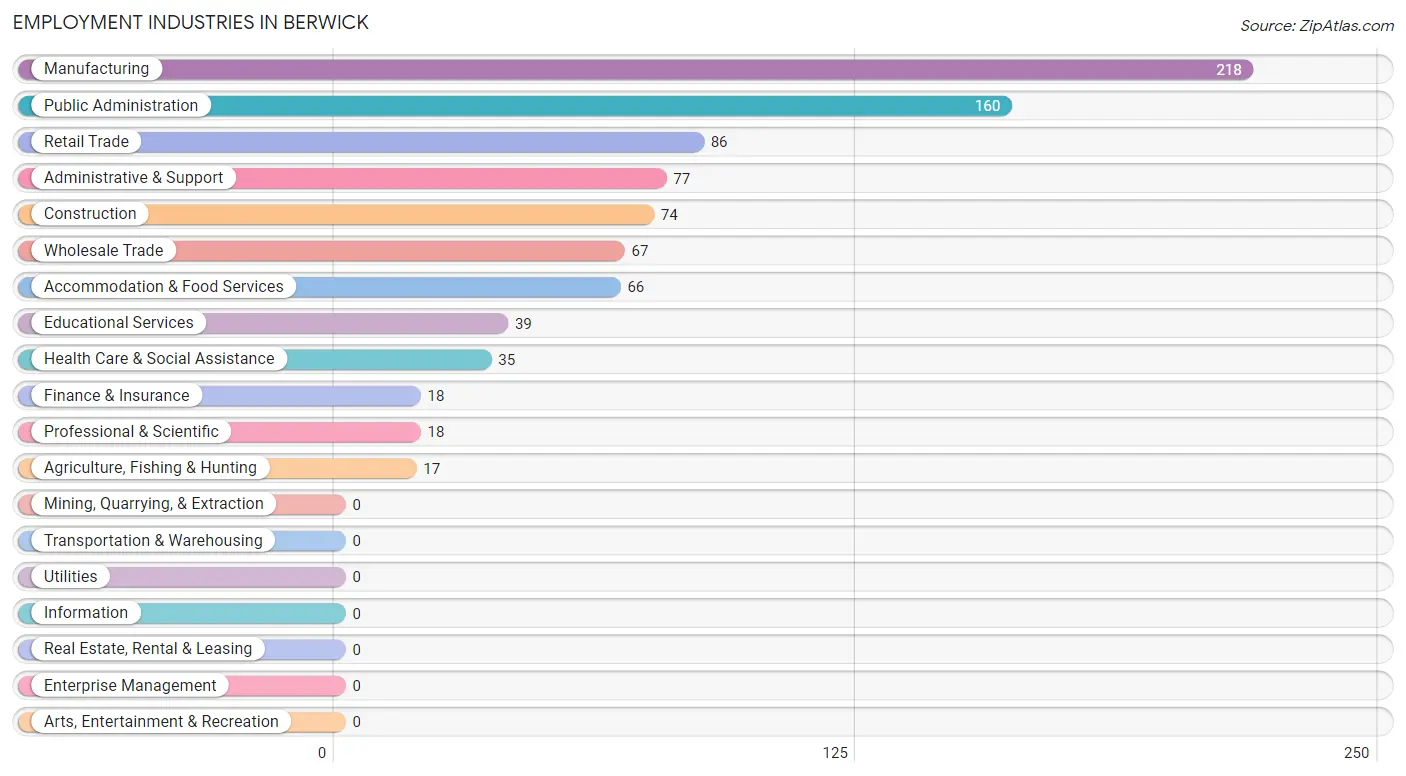
The major employment industries in Berwick include Manufacturing (218 | 24.4%), Public Administration (160 | 17.9%), Retail Trade (86 | 9.6%), Administrative & Support (77 | 8.6%), and Construction (74 | 8.3%).
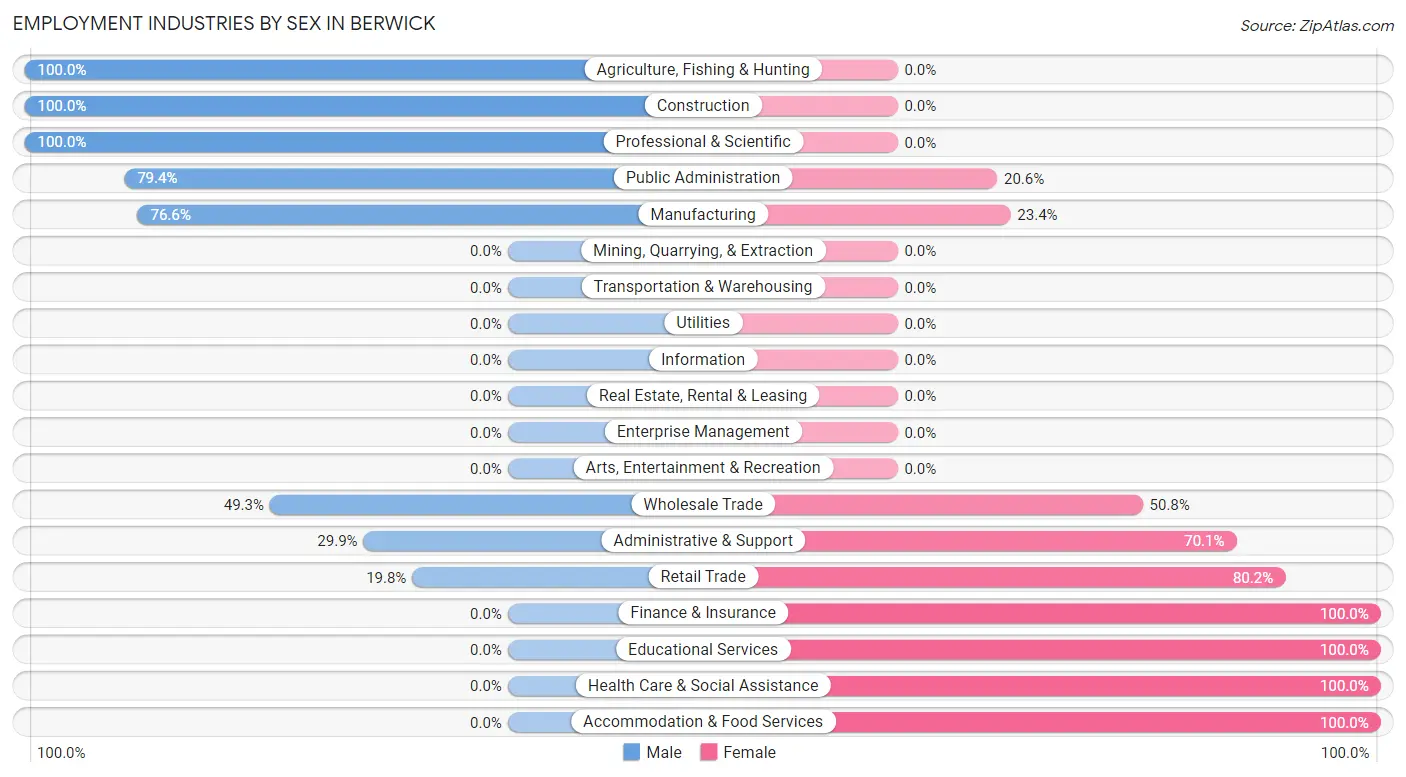
Employment Industries by Sex in Berwick
The Berwick industries that see more men than women are Agriculture, Fishing & Hunting (100.0%), Construction (100.0%), and Professional & Scientific (100.0%), whereas the industries that tend to have a higher number of women are Finance & Insurance (100.0%), Educational Services (100.0%), and Health Care & Social Assistance (100.0%).
| Industry | Male | Female |
| Agriculture, Fishing & Hunting | 17 (100.0%) | 0 (0.0%) |
| Mining, Quarrying, & Extraction | 0 (0.0%) | 0 (0.0%) |
| Construction | 74 (100.0%) | 0 (0.0%) |
| Manufacturing | 167 (76.6%) | 51 (23.4%) |
| Wholesale Trade | 33 (49.2%) | 34 (50.7%) |
| Retail Trade | 17 (19.8%) | 69 (80.2%) |
| Transportation & Warehousing | 0 (0.0%) | 0 (0.0%) |
| Utilities | 0 (0.0%) | 0 (0.0%) |
| Information | 0 (0.0%) | 0 (0.0%) |
| Finance & Insurance | 0 (0.0%) | 18 (100.0%) |
| Real Estate, Rental & Leasing | 0 (0.0%) | 0 (0.0%) |
| Professional & Scientific | 18 (100.0%) | 0 (0.0%) |
| Enterprise Management | 0 (0.0%) | 0 (0.0%) |
| Administrative & Support | 23 (29.9%) | 54 (70.1%) |
| Educational Services | 0 (0.0%) | 39 (100.0%) |
| Health Care & Social Assistance | 0 (0.0%) | 35 (100.0%) |
| Arts, Entertainment & Recreation | 0 (0.0%) | 0 (0.0%) |
| Accommodation & Food Services | 0 (0.0%) | 66 (100.0%) |
| Public Administration | 127 (79.4%) | 33 (20.6%) |
| Total | 476 (53.3%) | 417 (46.7%) |
Education in Berwick
School Enrollment in Berwick
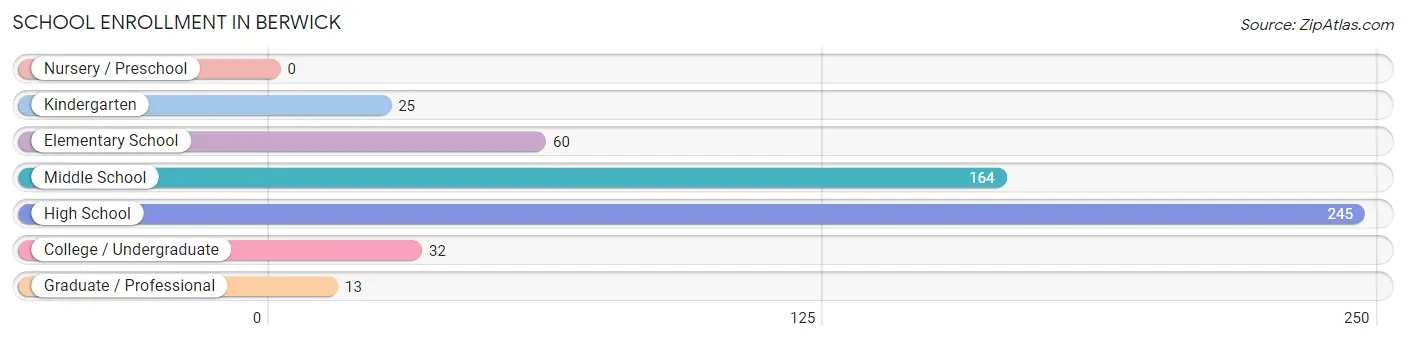
The most common levels of schooling among the 539 students in Berwick are high school (245 | 45.5%), middle school (164 | 30.4%), and elementary school (60 | 11.1%).
| School Level | # Students | % Students |
| Nursery / Preschool | 0 | 0.0% |
| Kindergarten | 25 | 4.6% |
| Elementary School | 60 | 11.1% |
| Middle School | 164 | 30.4% |
| High School | 245 | 45.5% |
| College / Undergraduate | 32 | 5.9% |
| Graduate / Professional | 13 | 2.4% |
| Total | 539 | 100.0% |
School Enrollment by Age by Funding Source in Berwick
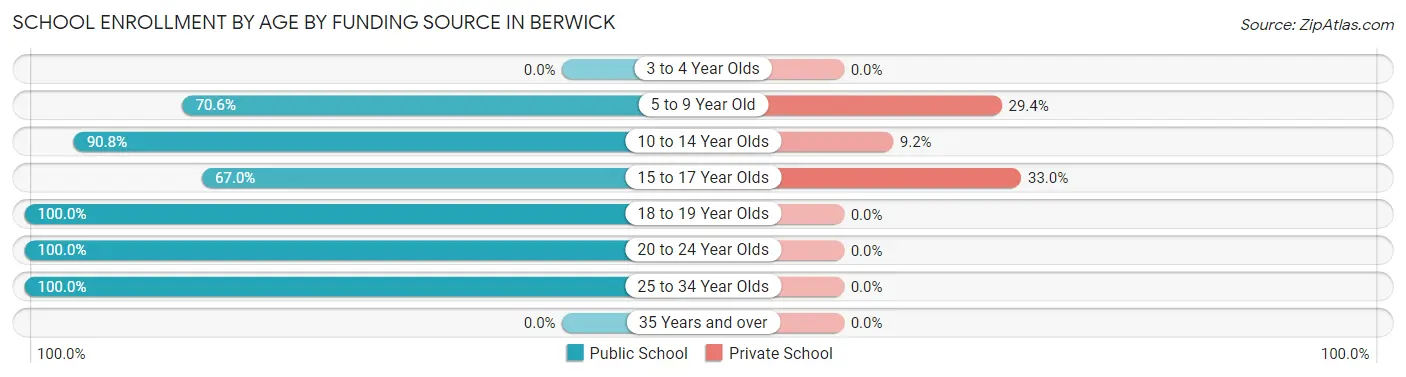
Out of a total of 539 students who are enrolled in schools in Berwick, 86 (16.0%) attend a private institution, while the remaining 453 (84.0%) are enrolled in public schools. The age group of 15 to 17 year olds has the highest likelihood of being enrolled in private schools, with 37 (33.0% in the age bracket) enrolled. Conversely, the age group of 18 to 19 year olds has the lowest likelihood of being enrolled in a private school, with 35 (100.0% in the age bracket) attending a public institution.
| Age Bracket | Public School | Private School |
| 3 to 4 Year Olds | 0 (0.0%) | 0 (0.0%) |
| 5 to 9 Year Old | 60 (70.6%) | 25 (29.4%) |
| 10 to 14 Year Olds | 238 (90.8%) | 24 (9.2%) |
| 15 to 17 Year Olds | 75 (67.0%) | 37 (33.0%) |
| 18 to 19 Year Olds | 35 (100.0%) | 0 (0.0%) |
| 20 to 24 Year Olds | 32 (100.0%) | 0 (0.0%) |
| 25 to 34 Year Olds | 13 (100.0%) | 0 (0.0%) |
| 35 Years and over | 0 (0.0%) | 0 (0.0%) |
| Total | 453 (84.0%) | 86 (16.0%) |
Educational Attainment by Field of Study in Berwick
Social sciences (144 | 24.7%), bio, nature & agricultural (127 | 21.8%), literature & languages (69 | 11.8%), education (53 | 9.1%), and arts & humanities (49 | 8.4%) are the most common fields of study among 583 individuals in Berwick who have obtained a bachelor's degree or higher.
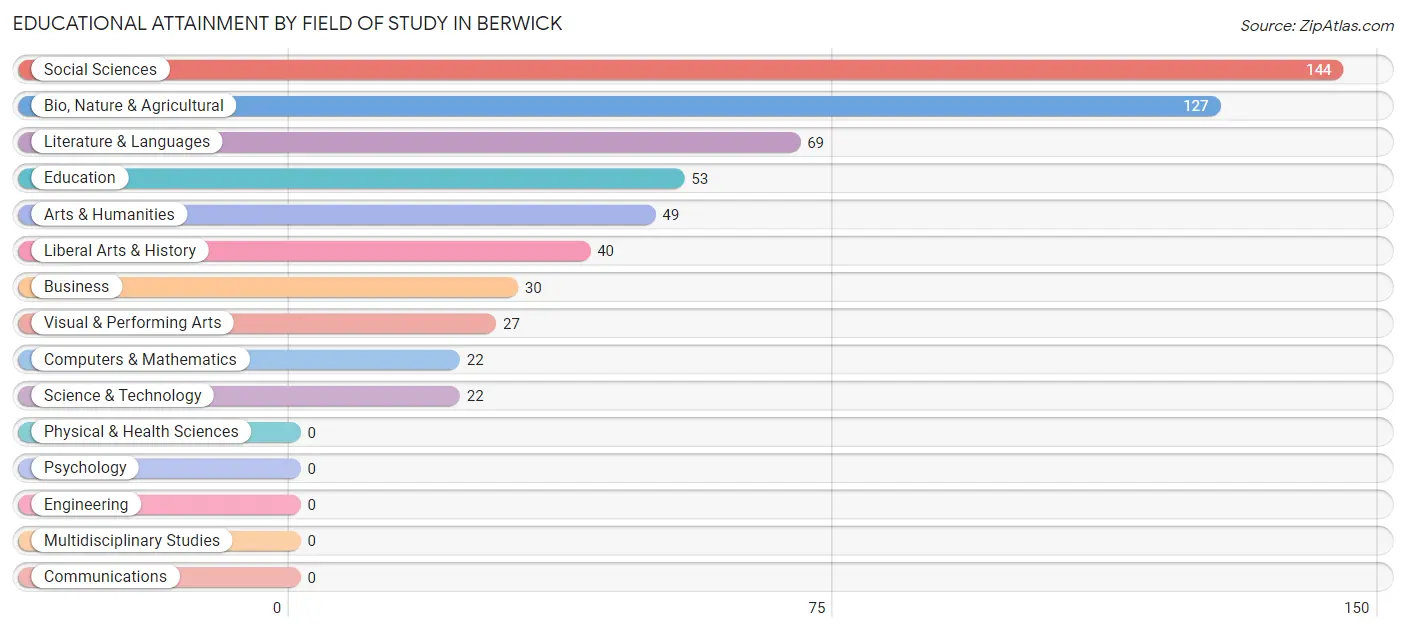
| Field of Study | # Graduates | % Graduates |
| Computers & Mathematics | 22 | 3.8% |
| Bio, Nature & Agricultural | 127 | 21.8% |
| Physical & Health Sciences | 0 | 0.0% |
| Psychology | 0 | 0.0% |
| Social Sciences | 144 | 24.7% |
| Engineering | 0 | 0.0% |
| Multidisciplinary Studies | 0 | 0.0% |
| Science & Technology | 22 | 3.8% |
| Business | 30 | 5.1% |
| Education | 53 | 9.1% |
| Literature & Languages | 69 | 11.8% |
| Liberal Arts & History | 40 | 6.9% |
| Visual & Performing Arts | 27 | 4.6% |
| Communications | 0 | 0.0% |
| Arts & Humanities | 49 | 8.4% |
| Total | 583 | 100.0% |
Transportation & Commute in Berwick
Vehicle Availability by Sex in Berwick
The most prevalent vehicle ownership categories in Berwick are males with 2 vehicles (293, accounting for 61.6%) and females with 2 vehicles (130, making up 70.3%).
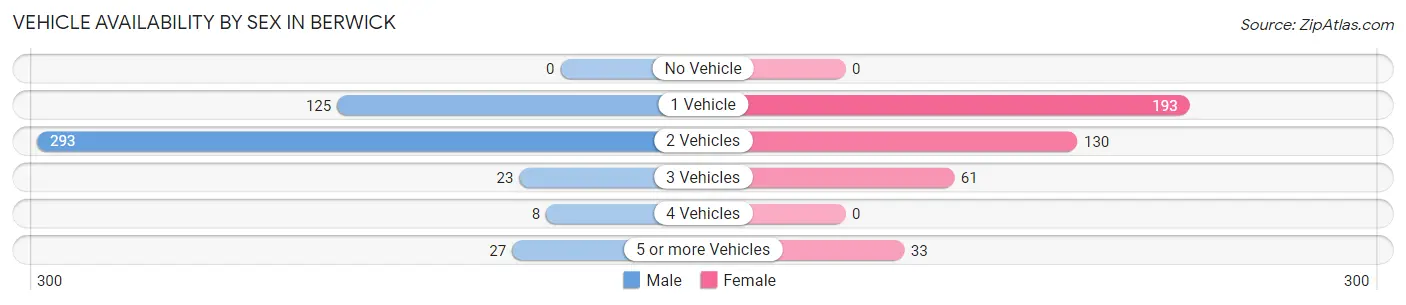
| Vehicles Available | Male | Female |
| No Vehicle | 0 (0.0%) | 0 (0.0%) |
| 1 Vehicle | 125 (26.3%) | 193 (46.3%) |
| 2 Vehicles | 293 (61.6%) | 130 (31.2%) |
| 3 Vehicles | 23 (4.8%) | 61 (14.6%) |
| 4 Vehicles | 8 (1.7%) | 0 (0.0%) |
| 5 or more Vehicles | 27 (5.7%) | 33 (7.9%) |
| Total | 476 (100.0%) | 417 (100.0%) |
Commute Time in Berwick
The most frequently occuring commute durations in Berwick are 30 to 34 minutes (208 commuters, 25.5%), 35 to 39 minutes (153 commuters, 18.8%), and 25 to 29 minutes (113 commuters, 13.9%).
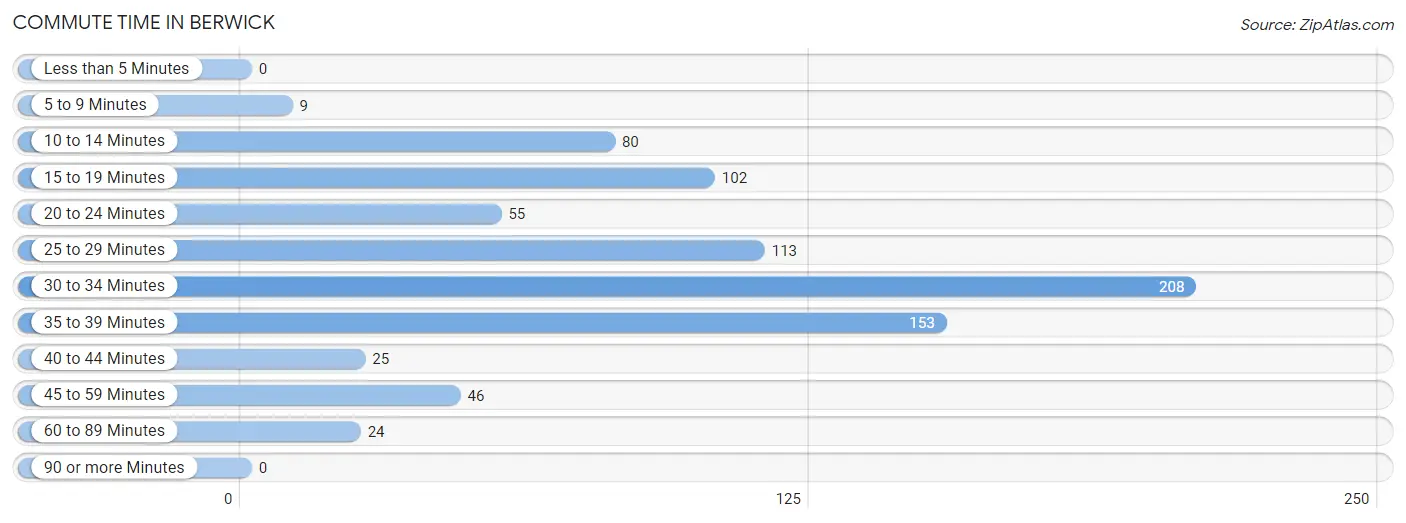
| Commute Time | # Commuters | % Commuters |
| Less than 5 Minutes | 0 | 0.0% |
| 5 to 9 Minutes | 9 | 1.1% |
| 10 to 14 Minutes | 80 | 9.8% |
| 15 to 19 Minutes | 102 | 12.5% |
| 20 to 24 Minutes | 55 | 6.8% |
| 25 to 29 Minutes | 113 | 13.9% |
| 30 to 34 Minutes | 208 | 25.5% |
| 35 to 39 Minutes | 153 | 18.8% |
| 40 to 44 Minutes | 25 | 3.1% |
| 45 to 59 Minutes | 46 | 5.6% |
| 60 to 89 Minutes | 24 | 2.9% |
| 90 or more Minutes | 0 | 0.0% |
Commute Time by Sex in Berwick
The most common commute times in Berwick are 30 to 34 minutes (190 commuters, 39.9%) for males and 15 to 19 minutes (102 commuters, 30.1%) for females.
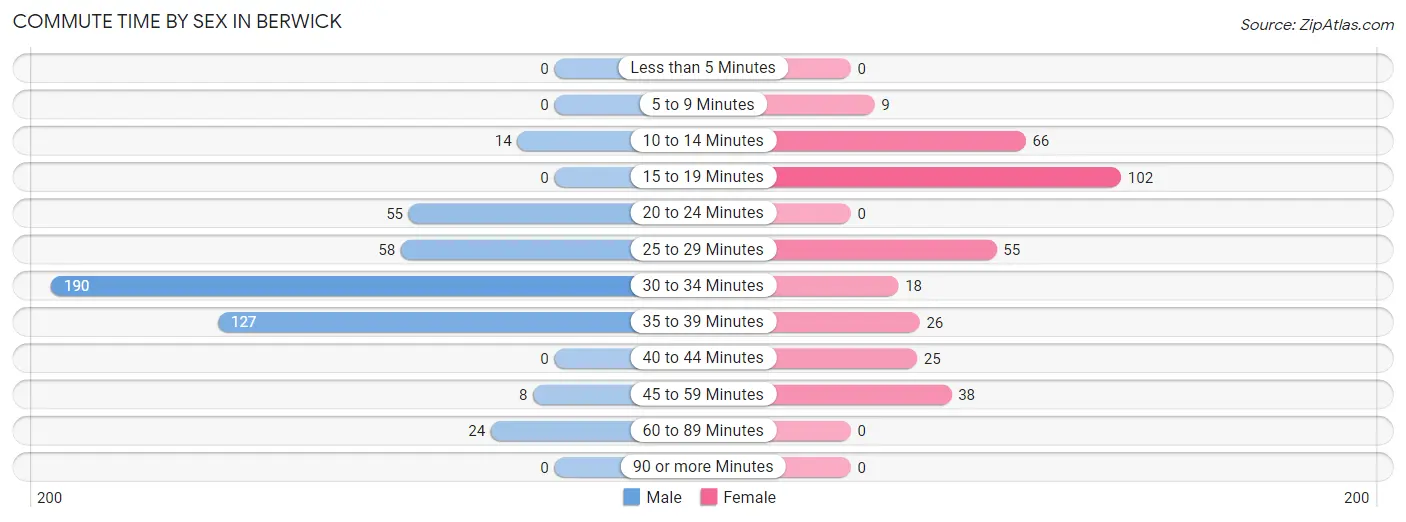
| Commute Time | Male | Female |
| Less than 5 Minutes | 0 (0.0%) | 0 (0.0%) |
| 5 to 9 Minutes | 0 (0.0%) | 9 (2.6%) |
| 10 to 14 Minutes | 14 (2.9%) | 66 (19.5%) |
| 15 to 19 Minutes | 0 (0.0%) | 102 (30.1%) |
| 20 to 24 Minutes | 55 (11.6%) | 0 (0.0%) |
| 25 to 29 Minutes | 58 (12.2%) | 55 (16.2%) |
| 30 to 34 Minutes | 190 (39.9%) | 18 (5.3%) |
| 35 to 39 Minutes | 127 (26.7%) | 26 (7.7%) |
| 40 to 44 Minutes | 0 (0.0%) | 25 (7.4%) |
| 45 to 59 Minutes | 8 (1.7%) | 38 (11.2%) |
| 60 to 89 Minutes | 24 (5.0%) | 0 (0.0%) |
| 90 or more Minutes | 0 (0.0%) | 0 (0.0%) |
Time of Departure to Work by Sex in Berwick
The most frequent times of departure to work in Berwick are 5:00 AM to 5:29 AM (201, 42.2%) for males and 7:30 AM to 7:59 AM (103, 30.4%) for females.
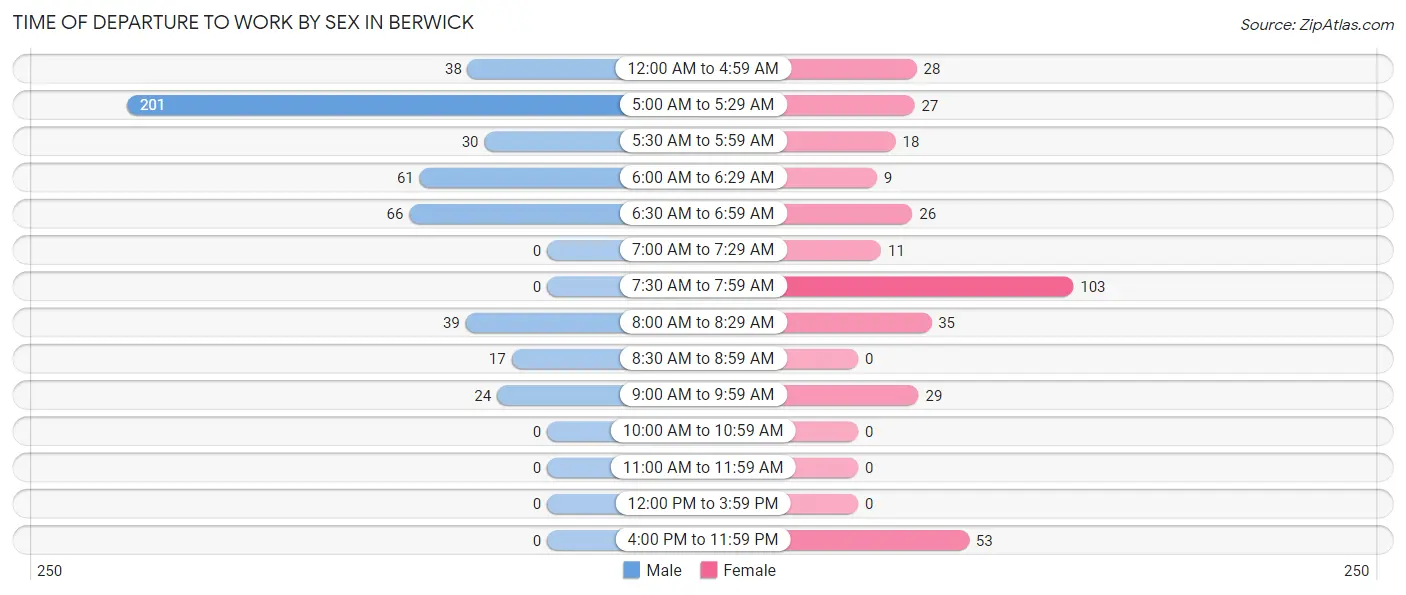
| Time of Departure | Male | Female |
| 12:00 AM to 4:59 AM | 38 (8.0%) | 28 (8.3%) |
| 5:00 AM to 5:29 AM | 201 (42.2%) | 27 (8.0%) |
| 5:30 AM to 5:59 AM | 30 (6.3%) | 18 (5.3%) |
| 6:00 AM to 6:29 AM | 61 (12.8%) | 9 (2.6%) |
| 6:30 AM to 6:59 AM | 66 (13.9%) | 26 (7.7%) |
| 7:00 AM to 7:29 AM | 0 (0.0%) | 11 (3.2%) |
| 7:30 AM to 7:59 AM | 0 (0.0%) | 103 (30.4%) |
| 8:00 AM to 8:29 AM | 39 (8.2%) | 35 (10.3%) |
| 8:30 AM to 8:59 AM | 17 (3.6%) | 0 (0.0%) |
| 9:00 AM to 9:59 AM | 24 (5.0%) | 29 (8.6%) |
| 10:00 AM to 10:59 AM | 0 (0.0%) | 0 (0.0%) |
| 11:00 AM to 11:59 AM | 0 (0.0%) | 0 (0.0%) |
| 12:00 PM to 3:59 PM | 0 (0.0%) | 0 (0.0%) |
| 4:00 PM to 11:59 PM | 0 (0.0%) | 53 (15.6%) |
| Total | 476 (100.0%) | 339 (100.0%) |
Housing Occupancy in Berwick
Occupancy by Ownership in Berwick
Of the total 985 dwellings in Berwick, owner-occupied units account for 593 (60.2%), while renter-occupied units make up 392 (39.8%).
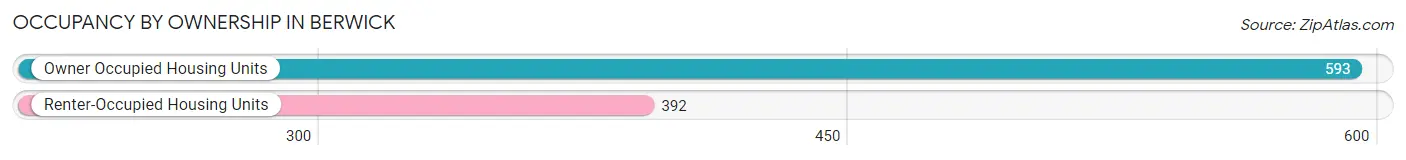
| Occupancy | # Housing Units | % Housing Units |
| Owner Occupied Housing Units | 593 | 60.2% |
| Renter-Occupied Housing Units | 392 | 39.8% |
| Total Occupied Housing Units | 985 | 100.0% |
Occupancy by Household Size in Berwick
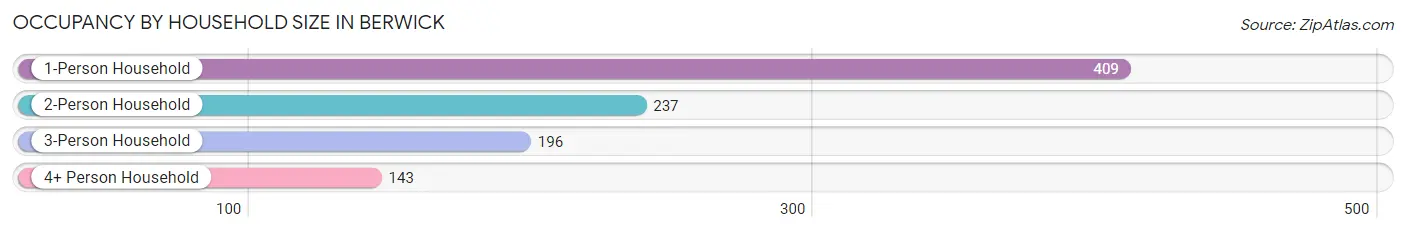
| Household Size | # Housing Units | % Housing Units |
| 1-Person Household | 409 | 41.5% |
| 2-Person Household | 237 | 24.1% |
| 3-Person Household | 196 | 19.9% |
| 4+ Person Household | 143 | 14.5% |
| Total Housing Units | 985 | 100.0% |
Occupancy by Ownership by Household Size in Berwick
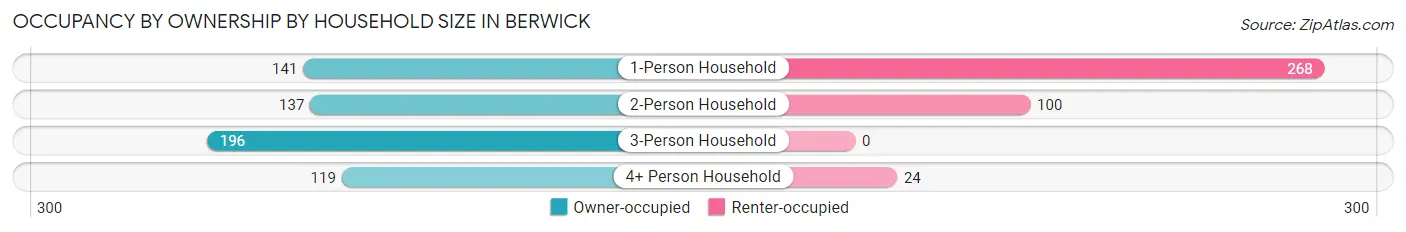
| Household Size | Owner-occupied | Renter-occupied |
| 1-Person Household | 141 (34.5%) | 268 (65.5%) |
| 2-Person Household | 137 (57.8%) | 100 (42.2%) |
| 3-Person Household | 196 (100.0%) | 0 (0.0%) |
| 4+ Person Household | 119 (83.2%) | 24 (16.8%) |
| Total Housing Units | 593 (60.2%) | 392 (39.8%) |
Occupancy by Educational Attainment in Berwick
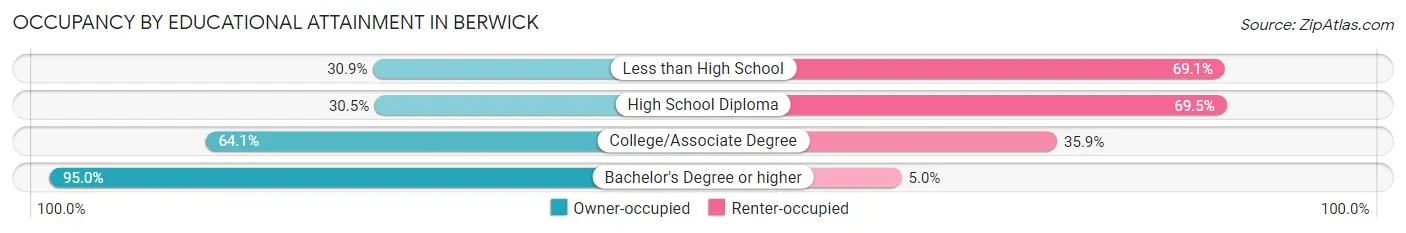
| Household Size | Owner-occupied | Renter-occupied |
| Less than High School | 21 (30.9%) | 47 (69.1%) |
| High School Diploma | 109 (30.5%) | 248 (69.5%) |
| College/Associate Degree | 143 (64.1%) | 80 (35.9%) |
| Bachelor's Degree or higher | 320 (95.0%) | 17 (5.0%) |
Occupancy by Age of Householder in Berwick
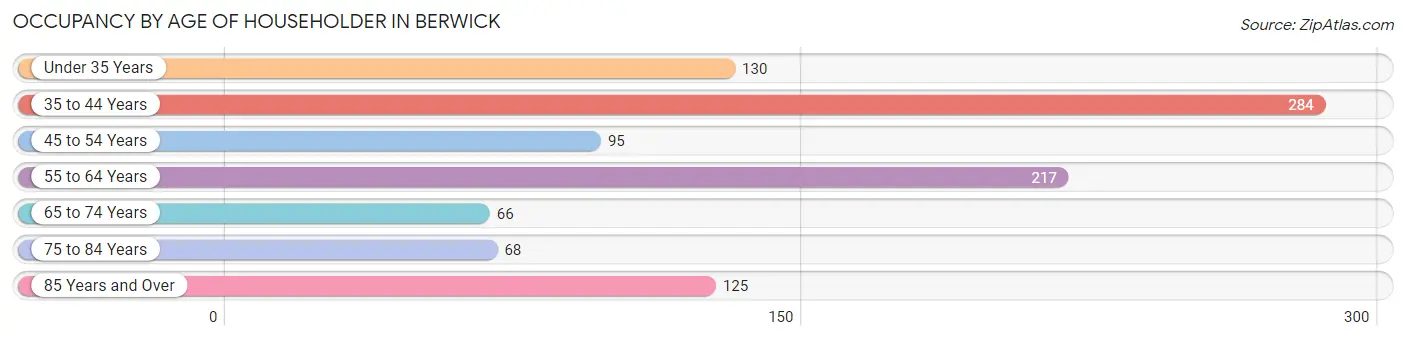
| Age Bracket | # Households | % Households |
| Under 35 Years | 130 | 13.2% |
| 35 to 44 Years | 284 | 28.8% |
| 45 to 54 Years | 95 | 9.6% |
| 55 to 64 Years | 217 | 22.0% |
| 65 to 74 Years | 66 | 6.7% |
| 75 to 84 Years | 68 | 6.9% |
| 85 Years and Over | 125 | 12.7% |
| Total | 985 | 100.0% |
Housing Finances in Berwick
Median Income by Occupancy in Berwick
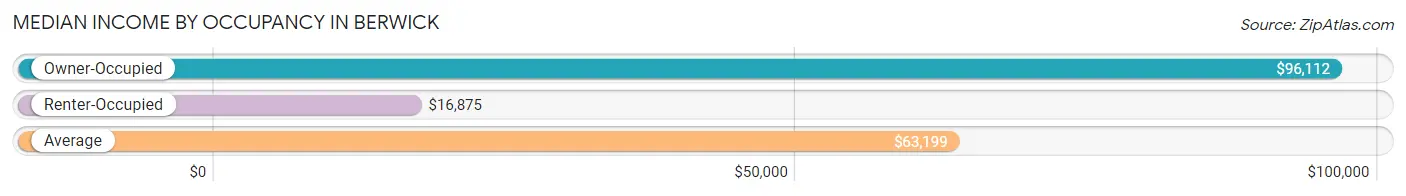
| Occupancy Type | # Households | Median Income |
| Owner-Occupied | 593 (60.2%) | $96,112 |
| Renter-Occupied | 392 (39.8%) | $16,875 |
| Average | 985 (100.0%) | $63,199 |
Occupancy by Householder Income Bracket in Berwick
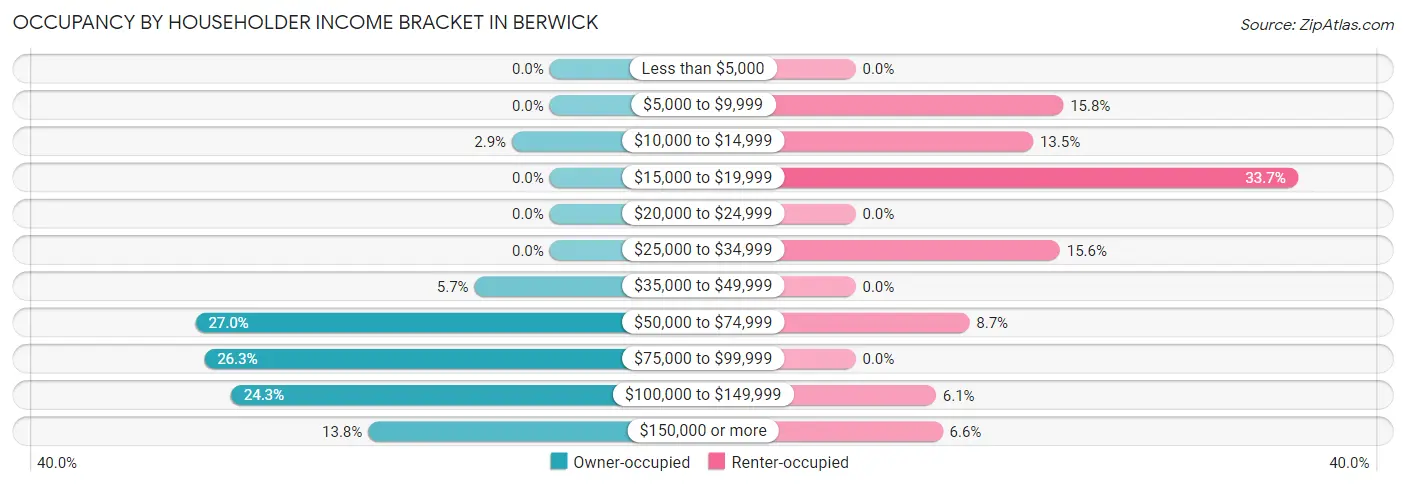
| Income Bracket | Owner-occupied | Renter-occupied |
| Less than $5,000 | 0 (0.0%) | 0 (0.0%) |
| $5,000 to $9,999 | 0 (0.0%) | 62 (15.8%) |
| $10,000 to $14,999 | 17 (2.9%) | 53 (13.5%) |
| $15,000 to $19,999 | 0 (0.0%) | 132 (33.7%) |
| $20,000 to $24,999 | 0 (0.0%) | 0 (0.0%) |
| $25,000 to $34,999 | 0 (0.0%) | 61 (15.6%) |
| $35,000 to $49,999 | 34 (5.7%) | 0 (0.0%) |
| $50,000 to $74,999 | 160 (27.0%) | 34 (8.7%) |
| $75,000 to $99,999 | 156 (26.3%) | 0 (0.0%) |
| $100,000 to $149,999 | 144 (24.3%) | 24 (6.1%) |
| $150,000 or more | 82 (13.8%) | 26 (6.6%) |
| Total | 593 (100.0%) | 392 (100.0%) |
Monthly Housing Cost Tiers in Berwick
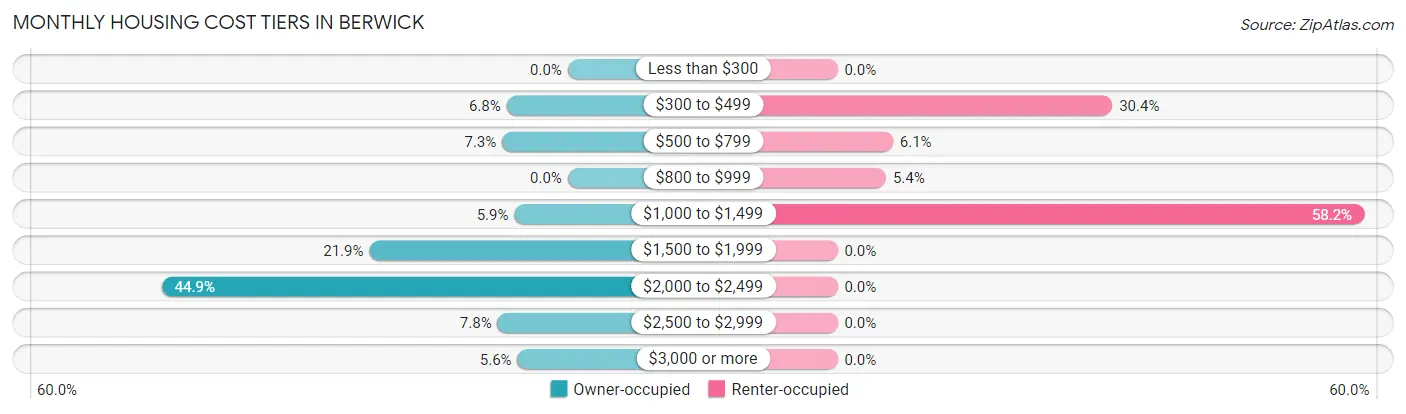
| Monthly Cost | Owner-occupied | Renter-occupied |
| Less than $300 | 0 (0.0%) | 0 (0.0%) |
| $300 to $499 | 40 (6.8%) | 119 (30.4%) |
| $500 to $799 | 43 (7.2%) | 24 (6.1%) |
| $800 to $999 | 0 (0.0%) | 21 (5.4%) |
| $1,000 to $1,499 | 35 (5.9%) | 228 (58.2%) |
| $1,500 to $1,999 | 130 (21.9%) | 0 (0.0%) |
| $2,000 to $2,499 | 266 (44.9%) | 0 (0.0%) |
| $2,500 to $2,999 | 46 (7.8%) | 0 (0.0%) |
| $3,000 or more | 33 (5.6%) | 0 (0.0%) |
| Total | 593 (100.0%) | 392 (100.0%) |
Physical Housing Characteristics in Berwick
Housing Structures in Berwick
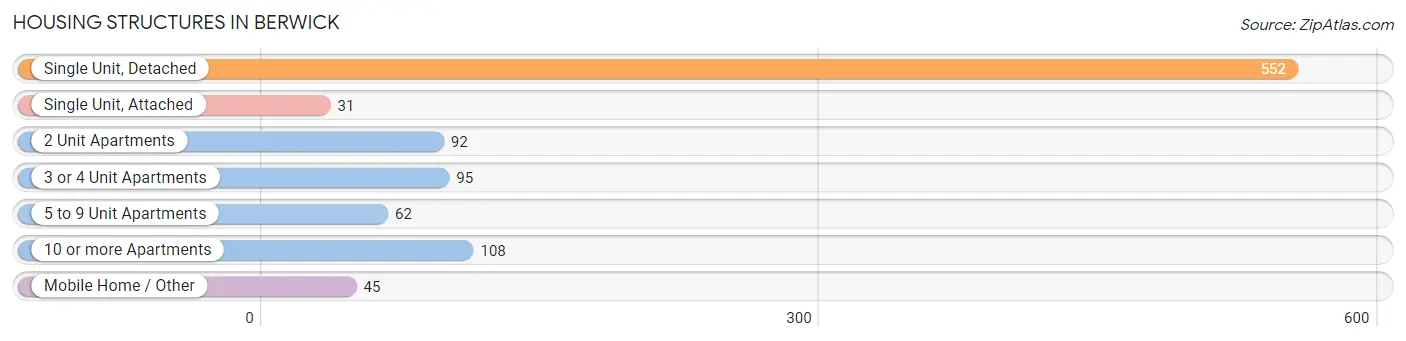
| Structure Type | # Housing Units | % Housing Units |
| Single Unit, Detached | 552 | 56.0% |
| Single Unit, Attached | 31 | 3.2% |
| 2 Unit Apartments | 92 | 9.3% |
| 3 or 4 Unit Apartments | 95 | 9.6% |
| 5 to 9 Unit Apartments | 62 | 6.3% |
| 10 or more Apartments | 108 | 11.0% |
| Mobile Home / Other | 45 | 4.6% |
| Total | 985 | 100.0% |
Housing Structures by Occupancy in Berwick
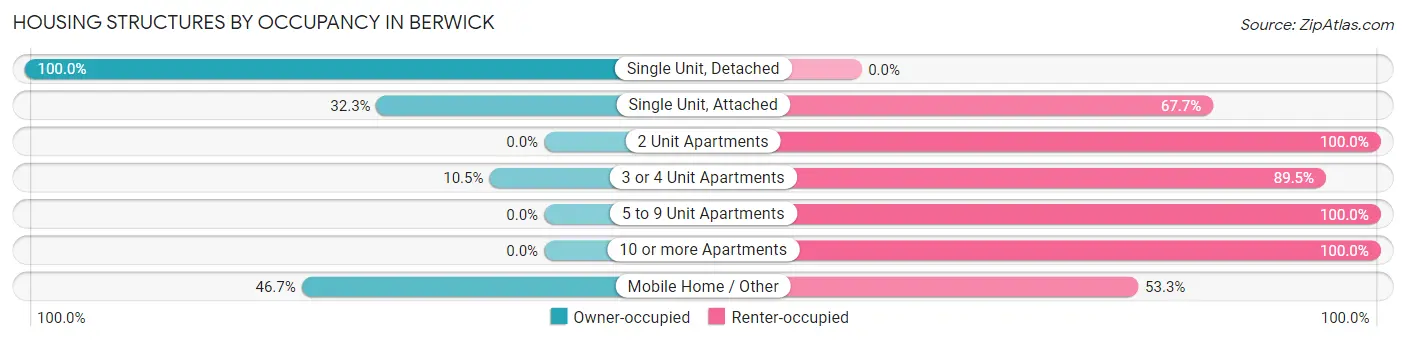
| Structure Type | Owner-occupied | Renter-occupied |
| Single Unit, Detached | 552 (100.0%) | 0 (0.0%) |
| Single Unit, Attached | 10 (32.3%) | 21 (67.7%) |
| 2 Unit Apartments | 0 (0.0%) | 92 (100.0%) |
| 3 or 4 Unit Apartments | 10 (10.5%) | 85 (89.5%) |
| 5 to 9 Unit Apartments | 0 (0.0%) | 62 (100.0%) |
| 10 or more Apartments | 0 (0.0%) | 108 (100.0%) |
| Mobile Home / Other | 21 (46.7%) | 24 (53.3%) |
| Total | 593 (60.2%) | 392 (39.8%) |
Housing Structures by Number of Rooms in Berwick
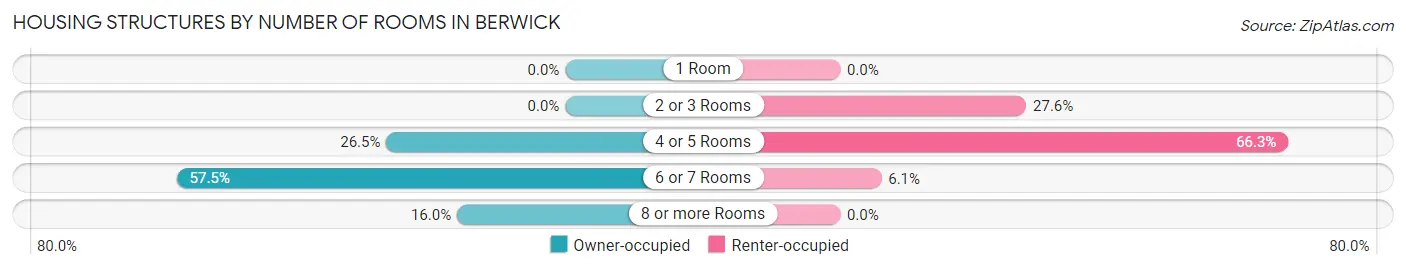
| Number of Rooms | Owner-occupied | Renter-occupied |
| 1 Room | 0 (0.0%) | 0 (0.0%) |
| 2 or 3 Rooms | 0 (0.0%) | 108 (27.6%) |
| 4 or 5 Rooms | 157 (26.5%) | 260 (66.3%) |
| 6 or 7 Rooms | 341 (57.5%) | 24 (6.1%) |
| 8 or more Rooms | 95 (16.0%) | 0 (0.0%) |
| Total | 593 (100.0%) | 392 (100.0%) |
Housing Structure by Heating Type in Berwick
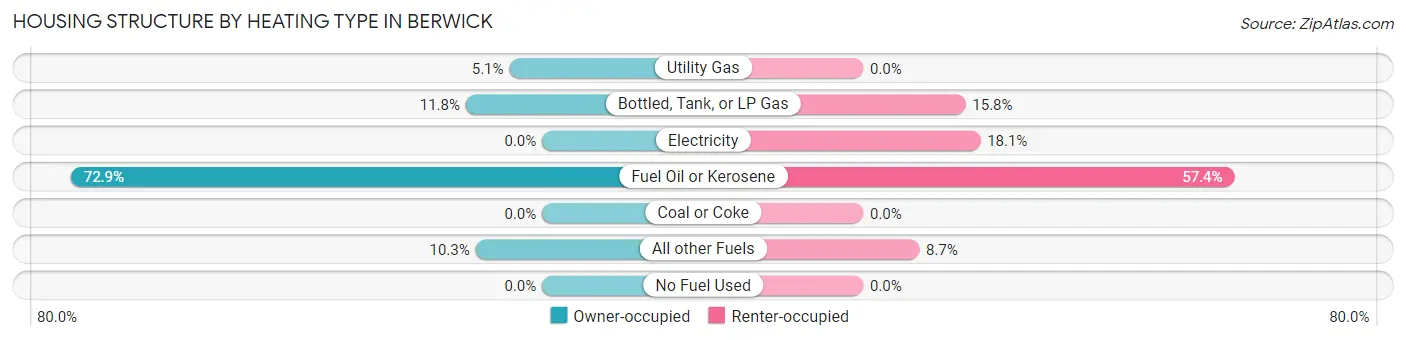
| Heating Type | Owner-occupied | Renter-occupied |
| Utility Gas | 30 (5.1%) | 0 (0.0%) |
| Bottled, Tank, or LP Gas | 70 (11.8%) | 62 (15.8%) |
| Electricity | 0 (0.0%) | 71 (18.1%) |
| Fuel Oil or Kerosene | 432 (72.9%) | 225 (57.4%) |
| Coal or Coke | 0 (0.0%) | 0 (0.0%) |
| All other Fuels | 61 (10.3%) | 34 (8.7%) |
| No Fuel Used | 0 (0.0%) | 0 (0.0%) |
| Total | 593 (100.0%) | 392 (100.0%) |
Household Vehicle Usage in Berwick
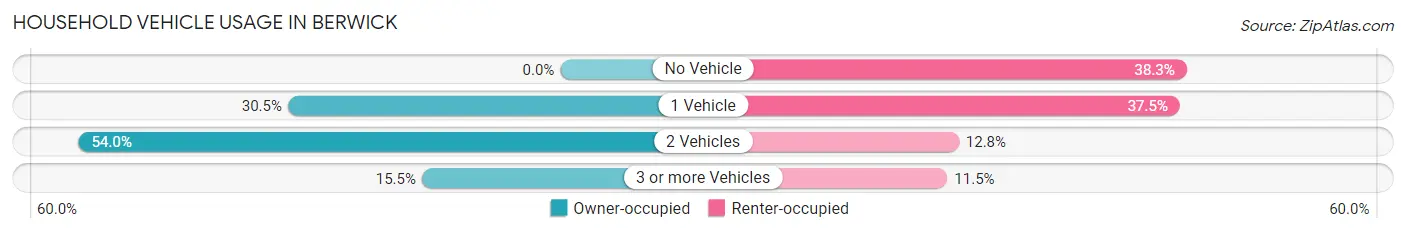
| Vehicles per Household | Owner-occupied | Renter-occupied |
| No Vehicle | 0 (0.0%) | 150 (38.3%) |
| 1 Vehicle | 181 (30.5%) | 147 (37.5%) |
| 2 Vehicles | 320 (54.0%) | 50 (12.8%) |
| 3 or more Vehicles | 92 (15.5%) | 45 (11.5%) |
| Total | 593 (100.0%) | 392 (100.0%) |
Real Estate & Mortgages in Berwick
Real Estate and Mortgage Overview in Berwick
| Characteristic | Without Mortgage | With Mortgage |
| Housing Units | 83 | 510 |
| Median Property Value | $221,400 | $315,400 |
| Median Household Income | - | - |
| Monthly Housing Costs | $607 | $33 |
| Real Estate Taxes | $3,513 | $0 |
Property Value by Mortgage Status in Berwick
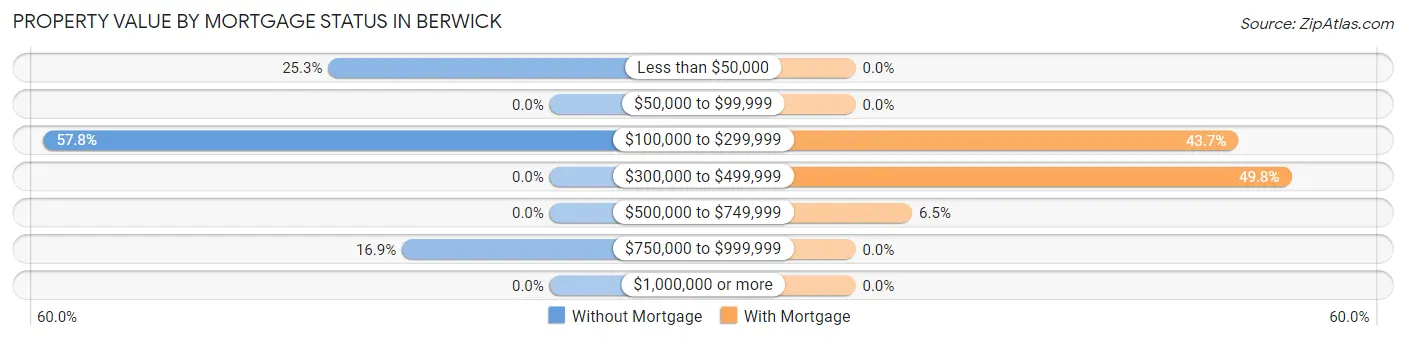
| Property Value | Without Mortgage | With Mortgage |
| Less than $50,000 | 21 (25.3%) | 0 (0.0%) |
| $50,000 to $99,999 | 0 (0.0%) | 0 (0.0%) |
| $100,000 to $299,999 | 48 (57.8%) | 223 (43.7%) |
| $300,000 to $499,999 | 0 (0.0%) | 254 (49.8%) |
| $500,000 to $749,999 | 0 (0.0%) | 33 (6.5%) |
| $750,000 to $999,999 | 14 (16.9%) | 0 (0.0%) |
| $1,000,000 or more | 0 (0.0%) | 0 (0.0%) |
| Total | 83 (100.0%) | 510 (100.0%) |
Household Income by Mortgage Status in Berwick
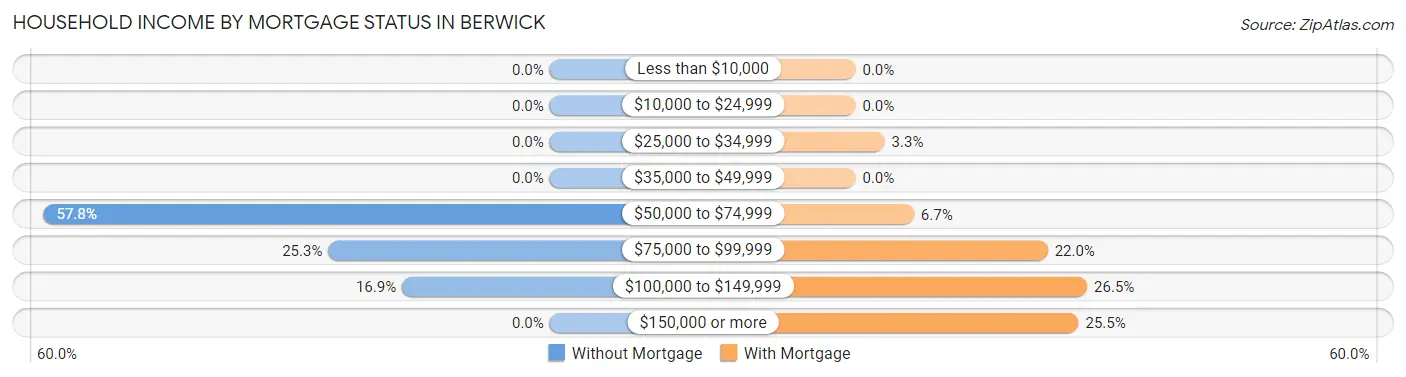
| Household Income | Without Mortgage | With Mortgage |
| Less than $10,000 | 0 (0.0%) | 0 (0.0%) |
| $10,000 to $24,999 | 0 (0.0%) | 0 (0.0%) |
| $25,000 to $34,999 | 0 (0.0%) | 17 (3.3%) |
| $35,000 to $49,999 | 0 (0.0%) | 0 (0.0%) |
| $50,000 to $74,999 | 48 (57.8%) | 34 (6.7%) |
| $75,000 to $99,999 | 21 (25.3%) | 112 (22.0%) |
| $100,000 to $149,999 | 14 (16.9%) | 135 (26.5%) |
| $150,000 or more | 0 (0.0%) | 130 (25.5%) |
| Total | 83 (100.0%) | 510 (100.0%) |
Property Value to Household Income Ratio in Berwick
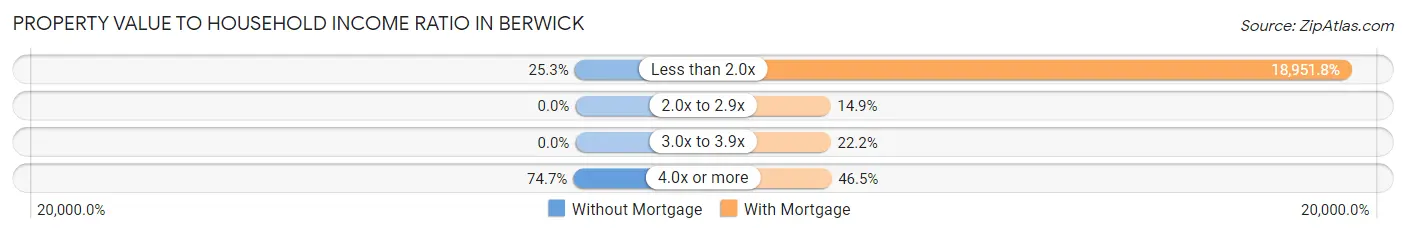
| Value-to-Income Ratio | Without Mortgage | With Mortgage |
| Less than 2.0x | 21 (25.3%) | 96,654 (18,951.8%) |
| 2.0x to 2.9x | 0 (0.0%) | 76 (14.9%) |
| 3.0x to 3.9x | 0 (0.0%) | 113 (22.2%) |
| 4.0x or more | 62 (74.7%) | 237 (46.5%) |
| Total | 83 (100.0%) | 510 (100.0%) |
Real Estate Taxes by Mortgage Status in Berwick
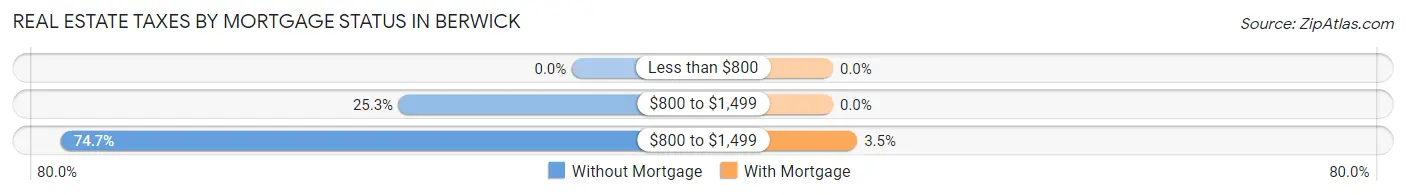
| Property Taxes | Without Mortgage | With Mortgage |
| Less than $800 | 0 (0.0%) | 0 (0.0%) |
| $800 to $1,499 | 21 (25.3%) | 0 (0.0%) |
| $800 to $1,499 | 62 (74.7%) | 18 (3.5%) |
| Total | 83 (100.0%) | 510 (100.0%) |
Health & Disability in Berwick
Health Insurance Coverage by Age in Berwick
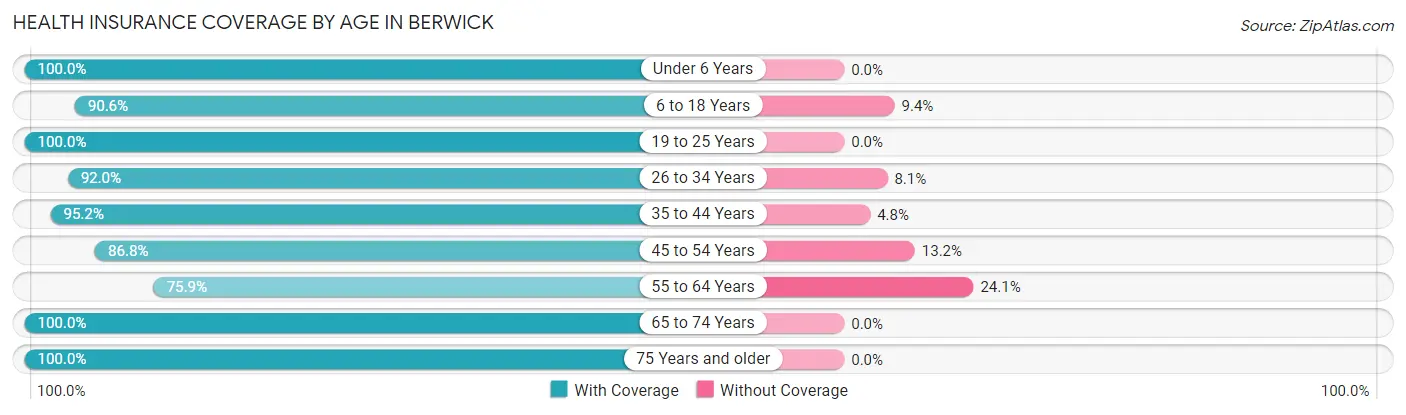
| Age Bracket | With Coverage | Without Coverage |
| Under 6 Years | 53 (100.0%) | 0 (0.0%) |
| 6 to 18 Years | 425 (90.6%) | 44 (9.4%) |
| 19 to 25 Years | 124 (100.0%) | 0 (0.0%) |
| 26 to 34 Years | 80 (91.9%) | 7 (8.1%) |
| 35 to 44 Years | 452 (95.2%) | 23 (4.8%) |
| 45 to 54 Years | 165 (86.8%) | 25 (13.2%) |
| 55 to 64 Years | 208 (75.9%) | 66 (24.1%) |
| 65 to 74 Years | 161 (100.0%) | 0 (0.0%) |
| 75 Years and older | 217 (100.0%) | 0 (0.0%) |
| Total | 1,885 (91.9%) | 165 (8.1%) |
Health Insurance Coverage by Citizenship Status in Berwick
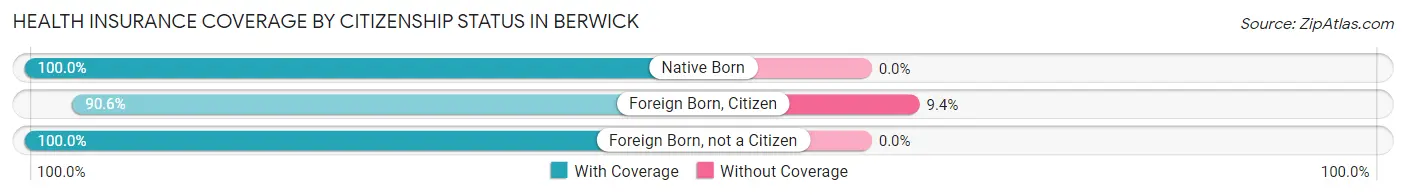
| Citizenship Status | With Coverage | Without Coverage |
| Native Born | 53 (100.0%) | 0 (0.0%) |
| Foreign Born, Citizen | 425 (90.6%) | 44 (9.4%) |
| Foreign Born, not a Citizen | 124 (100.0%) | 0 (0.0%) |
Health Insurance Coverage by Household Income in Berwick
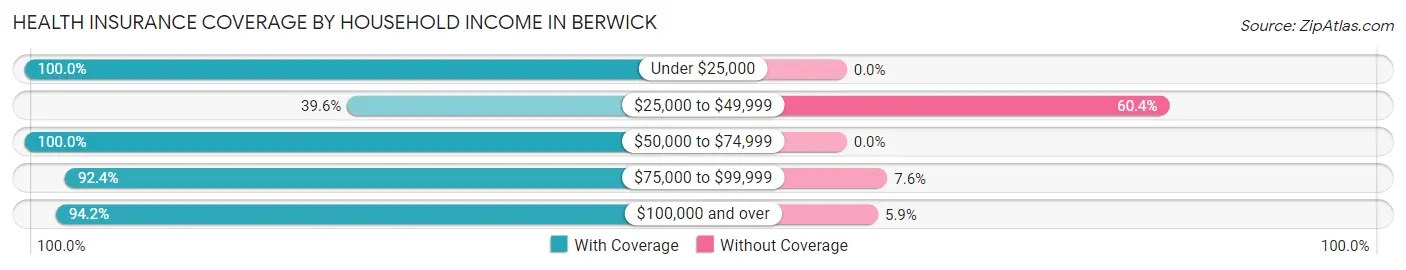
| Household Income | With Coverage | Without Coverage |
| Under $25,000 | 264 (100.0%) | 0 (0.0%) |
| $25,000 to $49,999 | 55 (39.6%) | 84 (60.4%) |
| $50,000 to $74,999 | 379 (100.0%) | 0 (0.0%) |
| $75,000 to $99,999 | 389 (92.4%) | 32 (7.6%) |
| $100,000 and over | 788 (94.2%) | 49 (5.9%) |
Public vs Private Health Insurance Coverage by Age in Berwick
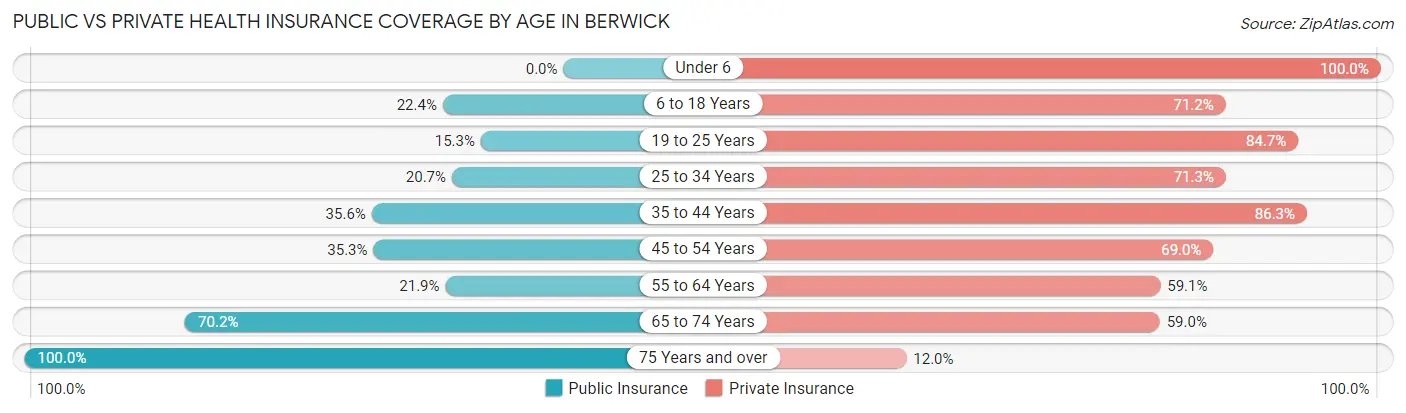
| Age Bracket | Public Insurance | Private Insurance |
| Under 6 | 0 (0.0%) | 53 (100.0%) |
| 6 to 18 Years | 105 (22.4%) | 334 (71.2%) |
| 19 to 25 Years | 19 (15.3%) | 105 (84.7%) |
| 25 to 34 Years | 18 (20.7%) | 62 (71.3%) |
| 35 to 44 Years | 169 (35.6%) | 410 (86.3%) |
| 45 to 54 Years | 67 (35.3%) | 131 (69.0%) |
| 55 to 64 Years | 60 (21.9%) | 162 (59.1%) |
| 65 to 74 Years | 113 (70.2%) | 95 (59.0%) |
| 75 Years and over | 217 (100.0%) | 26 (12.0%) |
| Total | 768 (37.5%) | 1,378 (67.2%) |
Disability Status by Sex by Age in Berwick
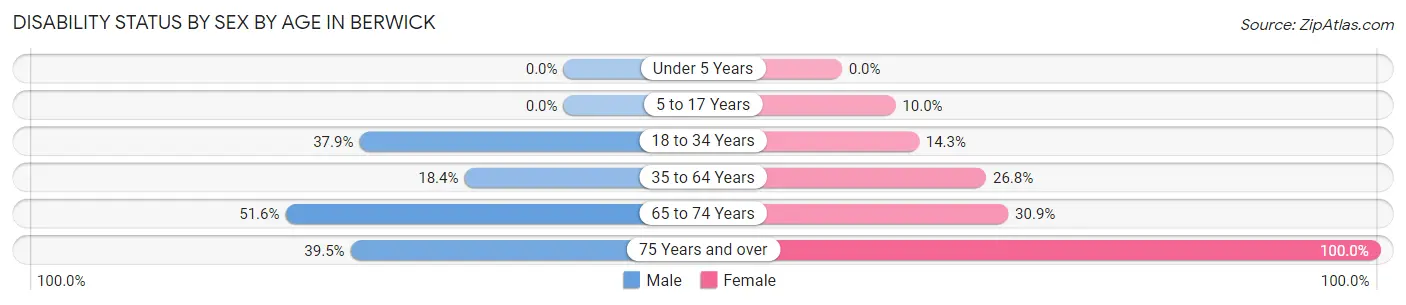
| Age Bracket | Male | Female |
| Under 5 Years | 0 (0.0%) | 0 (0.0%) |
| 5 to 17 Years | 0 (0.0%) | 37 (10.0%) |
| 18 to 34 Years | 72 (37.9%) | 8 (14.3%) |
| 35 to 64 Years | 82 (18.4%) | 132 (26.8%) |
| 65 to 74 Years | 48 (51.6%) | 21 (30.9%) |
| 75 Years and over | 17 (39.5%) | 174 (100.0%) |
Disability Class by Sex by Age in Berwick
Disability Class: Hearing Difficulty
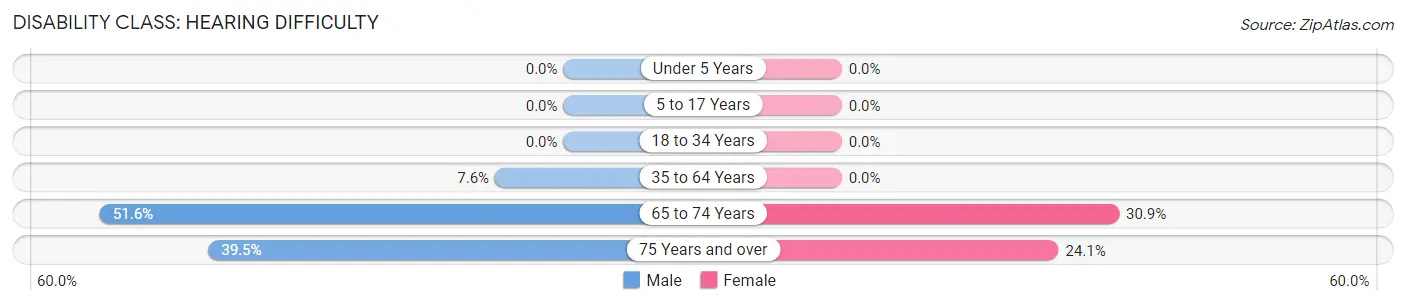
| Age Bracket | Male | Female |
| Under 5 Years | 0 (0.0%) | 0 (0.0%) |
| 5 to 17 Years | 0 (0.0%) | 0 (0.0%) |
| 18 to 34 Years | 0 (0.0%) | 0 (0.0%) |
| 35 to 64 Years | 34 (7.6%) | 0 (0.0%) |
| 65 to 74 Years | 48 (51.6%) | 21 (30.9%) |
| 75 Years and over | 17 (39.5%) | 42 (24.1%) |
Disability Class: Vision Difficulty
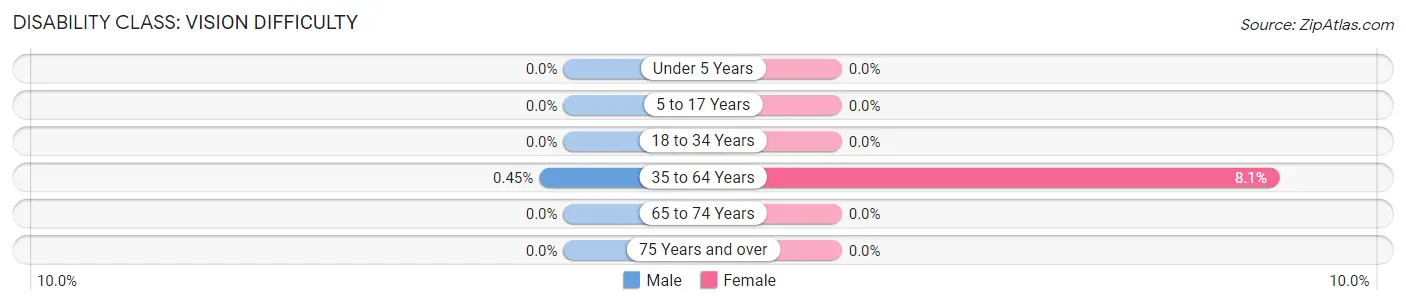
| Age Bracket | Male | Female |
| Under 5 Years | 0 (0.0%) | 0 (0.0%) |
| 5 to 17 Years | 0 (0.0%) | 0 (0.0%) |
| 18 to 34 Years | 0 (0.0%) | 0 (0.0%) |
| 35 to 64 Years | 2 (0.4%) | 40 (8.1%) |
| 65 to 74 Years | 0 (0.0%) | 0 (0.0%) |
| 75 Years and over | 0 (0.0%) | 0 (0.0%) |
Disability Class: Cognitive Difficulty
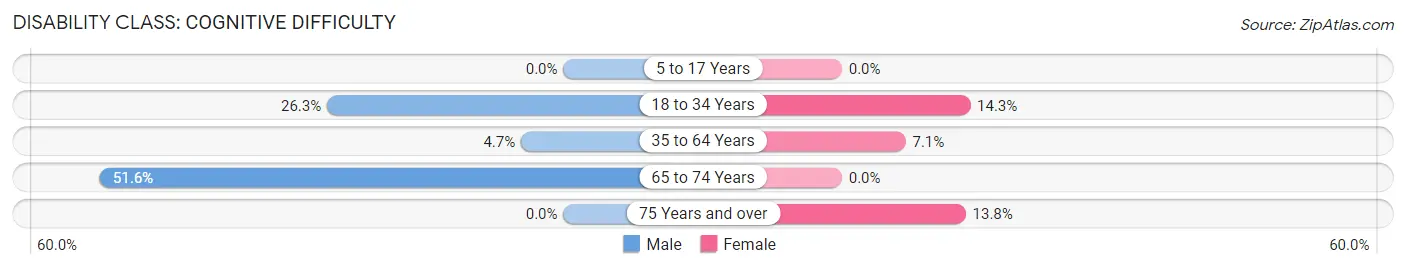
| Age Bracket | Male | Female |
| 5 to 17 Years | 0 (0.0%) | 0 (0.0%) |
| 18 to 34 Years | 50 (26.3%) | 8 (14.3%) |
| 35 to 64 Years | 21 (4.7%) | 35 (7.1%) |
| 65 to 74 Years | 48 (51.6%) | 0 (0.0%) |
| 75 Years and over | 0 (0.0%) | 24 (13.8%) |
Disability Class: Ambulatory Difficulty
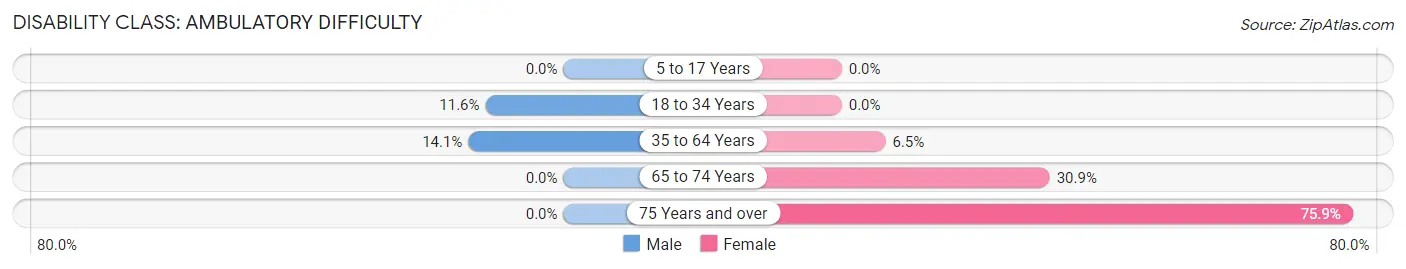
| Age Bracket | Male | Female |
| 5 to 17 Years | 0 (0.0%) | 0 (0.0%) |
| 18 to 34 Years | 22 (11.6%) | 0 (0.0%) |
| 35 to 64 Years | 63 (14.1%) | 32 (6.5%) |
| 65 to 74 Years | 0 (0.0%) | 21 (30.9%) |
| 75 Years and over | 0 (0.0%) | 132 (75.9%) |
Disability Class: Self-Care Difficulty
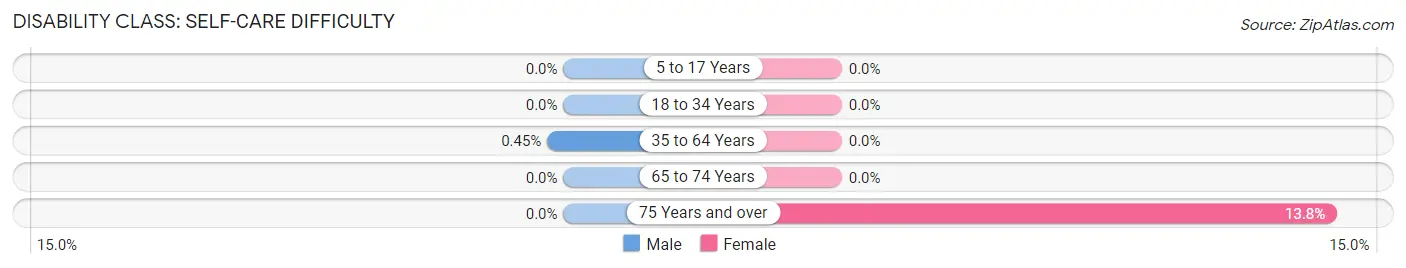
| Age Bracket | Male | Female |
| 5 to 17 Years | 0 (0.0%) | 0 (0.0%) |
| 18 to 34 Years | 0 (0.0%) | 0 (0.0%) |
| 35 to 64 Years | 2 (0.4%) | 0 (0.0%) |
| 65 to 74 Years | 0 (0.0%) | 0 (0.0%) |
| 75 Years and over | 0 (0.0%) | 24 (13.8%) |
Technology Access in Berwick
Computing Device Access in Berwick
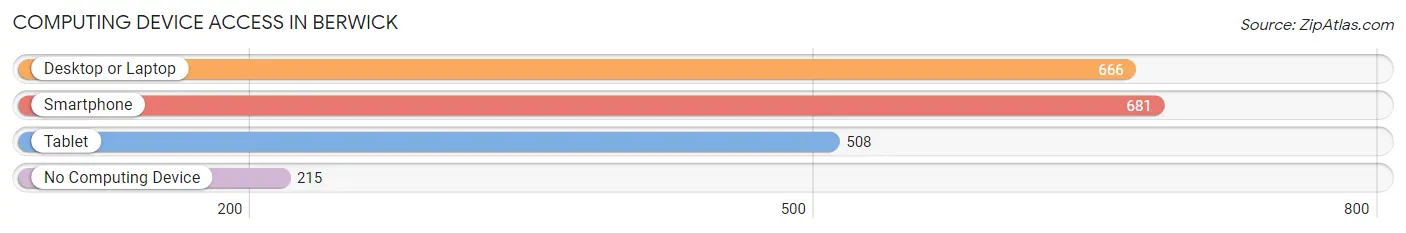
| Device Type | # Households | % Households |
| Desktop or Laptop | 666 | 67.6% |
| Smartphone | 681 | 69.1% |
| Tablet | 508 | 51.6% |
| No Computing Device | 215 | 21.8% |
| Total | 985 | 100.0% |
Internet Access in Berwick
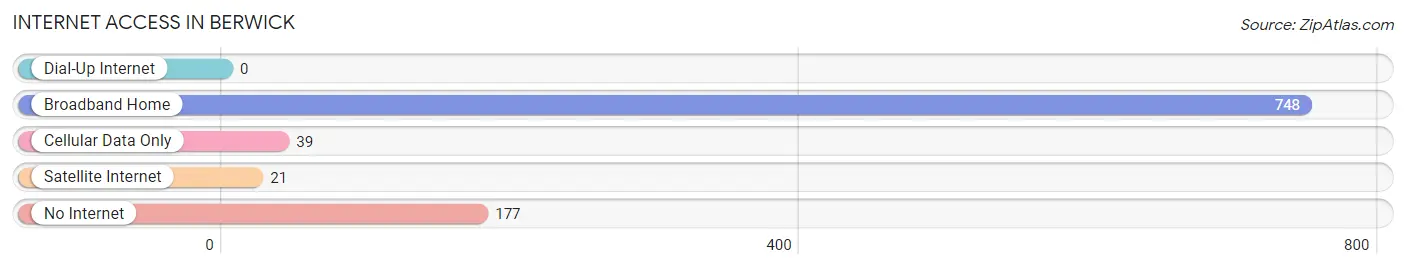
| Internet Type | # Households | % Households |
| Dial-Up Internet | 0 | 0.0% |
| Broadband Home | 748 | 75.9% |
| Cellular Data Only | 39 | 4.0% |
| Satellite Internet | 21 | 2.1% |
| No Internet | 177 | 18.0% |
| Total | 985 | 100.0% |
Berwick Summary
Berwick, Maine is a small town located in York County, in the southern part of the state. It is situated on the Salmon Falls River, which forms the border between Maine and New Hampshire. The town was first settled in 1631 and incorporated in 1713. As of the 2010 census, the population of Berwick was 7,246.
History
Berwick was first settled in 1631 by a group of English settlers from the Massachusetts Bay Colony. The town was originally known as Kittery, but was renamed Berwick in 1713 after the town of Berwick-upon-Tweed in England. The town was an important trading center in the 18th century, and was home to a number of shipbuilding yards. During the Revolutionary War, Berwick was the site of a major battle between the British and American forces.
Geography
Berwick is located in southern Maine, in York County. It is situated on the Salmon Falls River, which forms the border between Maine and New Hampshire. The town is bordered by Lebanon to the north, South Berwick to the east, and Rollinsford, New Hampshire to the south. The town covers an area of approximately 24 square miles, and is located about 40 miles from Portland.
The town is located in a rural area, and is surrounded by forests and rolling hills. The town is home to several small lakes, including Littlefield Lake, Great Works Lake, and Salmon Falls River.
Economy
Berwick’s economy is largely based on agriculture and tourism. The town is home to several farms, which produce a variety of crops, including apples, potatoes, and hay. The town is also home to several small businesses, including restaurants, retail stores, and a variety of service-based businesses.
The town is also a popular tourist destination, and is home to several attractions, including the Salmon Falls River, the Berwick Historical Society, and the Berwick Town Hall. The town is also home to several festivals and events, including the Berwick Fair, the Berwick Harvest Festival, and the Berwick Summer Concert Series.
Demographics
As of the 2010 census, the population of Berwick was 7,246. The population is largely white (94.3%), with small percentages of African American (1.2%), Asian (1.1%), and Native American (0.3%) residents. The median household income in the town is $50,945, and the median age is 41.
Berwick is a small, rural town with a strong sense of community. The town is home to several churches, and is served by the Berwick School District. The town is also home to several parks and recreational facilities, including the Berwick Town Park, the Berwick Recreation Center, and the Berwick Golf Course.
Common Questions
What is Per Capita Income in Berwick?
Per Capita income in Berwick is $35,801.
What is the Median Family Income in Berwick?
Median Family Income in Berwick is $96,841.
What is the Median Household income in Berwick?
Median Household Income in Berwick is $63,199.
What is Income or Wage Gap in Berwick?
Income or Wage Gap in Berwick is 43.6%.
Women in Berwick earn 56.4 cents for every dollar earned by a man.
What is Inequality or Gini Index in Berwick?
Inequality or Gini Index in Berwick is 0.41.
What is the Total Population of Berwick?
Total Population of Berwick is 2,050.
What is the Total Male Population of Berwick?
Total Male Population of Berwick is 859.
What is the Total Female Population of Berwick?
Total Female Population of Berwick is 1,191.
What is the Ratio of Males per 100 Females in Berwick?
There are 72.12 Males per 100 Females in Berwick.
What is the Ratio of Females per 100 Males in Berwick?
There are 138.65 Females per 100 Males in Berwick.
What is the Median Population Age in Berwick?
Median Population Age in Berwick is 44.1 Years.
What is the Average Family Size in Berwick
Average Family Size in Berwick is 2.8 People.
What is the Average Household Size in Berwick
Average Household Size in Berwick is 2.1 People.
How Large is the Labor Force in Berwick?
There are 940 People in the Labor Forcein in Berwick.
What is the Percentage of People in the Labor Force in Berwick?
56.1% of People are in the Labor Force in Berwick.
What is the Unemployment Rate in Berwick?
Unemployment Rate in Berwick is 5.0%.