Richmond, ME Map & Demographics
Richmond Map
Richmond Overview
$28,724
PER CAPITA INCOME
$68,728
AVG FAMILY INCOME
$68,030
AVG HOUSEHOLD INCOME
35.3%
WAGE / INCOME GAP [ % ]
64.7¢/ $1
WAGE / INCOME GAP [ $ ]
0.34
INEQUALITY / GINI INDEX
1,835
TOTAL POPULATION
1,004
MALE POPULATION
831
FEMALE POPULATION
120.82
MALES / 100 FEMALES
82.77
FEMALES / 100 MALES
34.3
MEDIAN AGE
3.0
AVG FAMILY SIZE
2.4
AVG HOUSEHOLD SIZE
956
LABOR FORCE [ PEOPLE ]
68.8%
PERCENT IN LABOR FORCE
5.1%
UNEMPLOYMENT RATE
Richmond Zip Codes
Richmond Area Codes
Income in Richmond
Income Overview in Richmond
Per Capita Income in Richmond is $28,724, while median incomes of families and households are $68,728 and $68,030 respectively.
| Characteristic | Number | Measure |
| Per Capita Income | 1,835 | $28,724 |
| Median Family Income | 451 | $68,728 |
| Mean Family Income | 451 | $71,276 |
| Median Household Income | 746 | $68,030 |
| Mean Household Income | 746 | $70,336 |
| Income Deficit | 451 | $0 |
| Wage / Income Gap (%) | 1,835 | 35.28% |
| Wage / Income Gap ($) | 1,835 | 64.72¢ per $1 |
| Gini / Inequality Index | 1,835 | 0.34 |
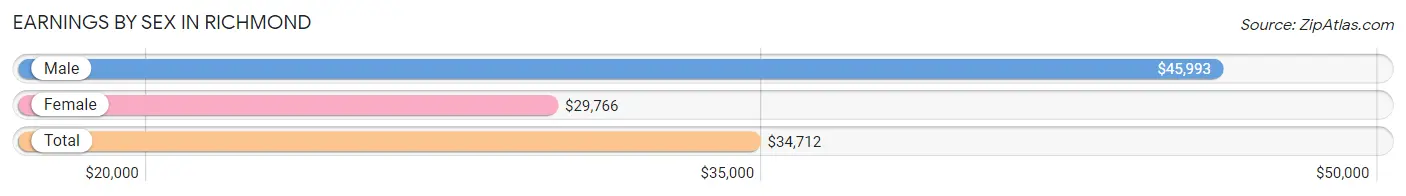
Earnings by Sex in Richmond
Average Earnings in Richmond are $34,712, $45,993 for men and $29,766 for women, a difference of 35.3%.
| Sex | Number | Average Earnings |
| Male | 528 (54.7%) | $45,993 |
| Female | 437 (45.3%) | $29,766 |
| Total | 965 (100.0%) | $34,712 |
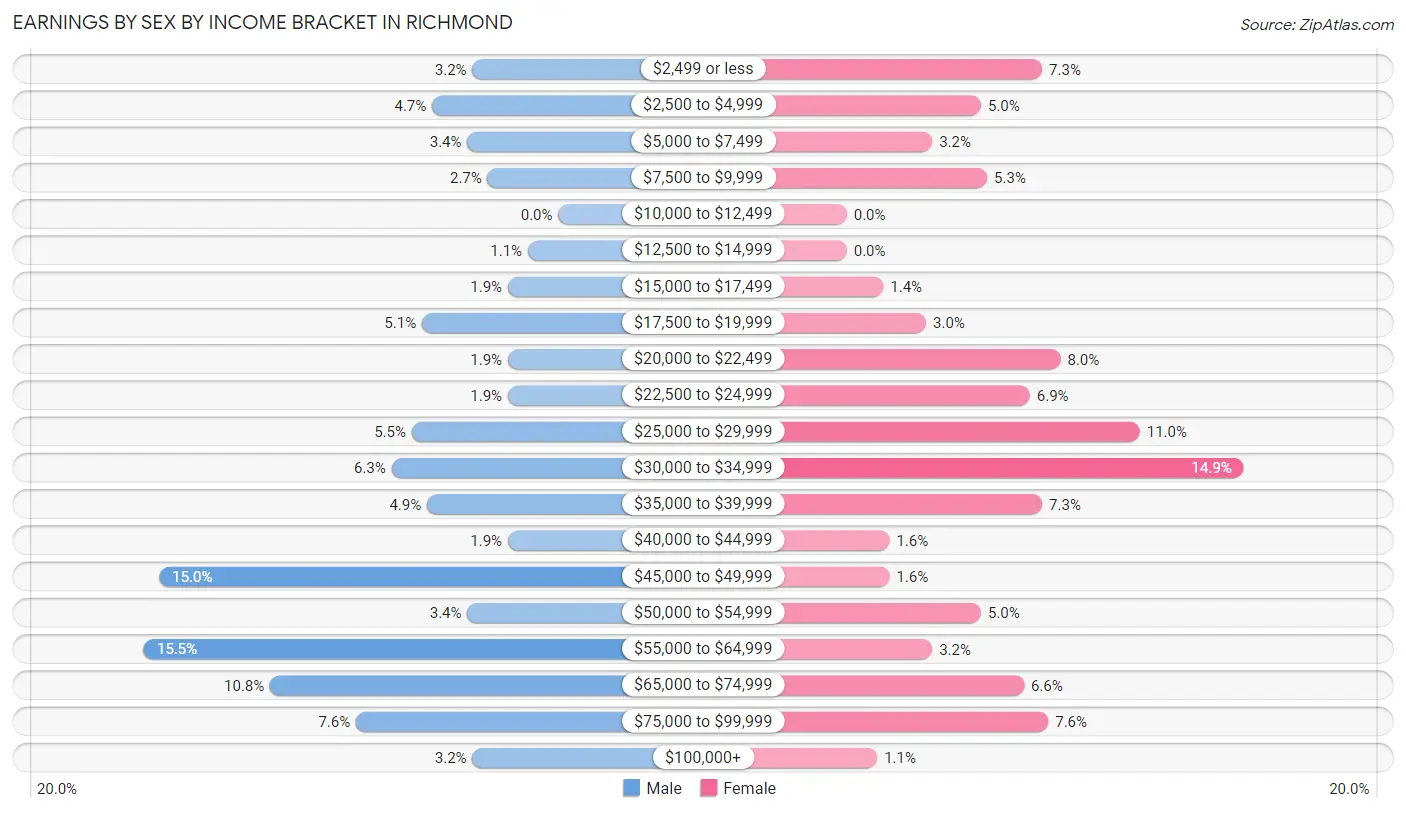
Earnings by Sex by Income Bracket in Richmond
The most common earnings brackets in Richmond are $55,000 to $64,999 for men (82 | 15.5%) and $30,000 to $34,999 for women (65 | 14.9%).
| Income | Male | Female |
| $2,499 or less | 17 (3.2%) | 32 (7.3%) |
| $2,500 to $4,999 | 25 (4.7%) | 22 (5.0%) |
| $5,000 to $7,499 | 18 (3.4%) | 14 (3.2%) |
| $7,500 to $9,999 | 14 (2.6%) | 23 (5.3%) |
| $10,000 to $12,499 | 0 (0.0%) | 0 (0.0%) |
| $12,500 to $14,999 | 6 (1.1%) | 0 (0.0%) |
| $15,000 to $17,499 | 10 (1.9%) | 6 (1.4%) |
| $17,500 to $19,999 | 27 (5.1%) | 13 (3.0%) |
| $20,000 to $22,499 | 10 (1.9%) | 35 (8.0%) |
| $22,500 to $24,999 | 10 (1.9%) | 30 (6.9%) |
| $25,000 to $29,999 | 29 (5.5%) | 48 (11.0%) |
| $30,000 to $34,999 | 33 (6.2%) | 65 (14.9%) |
| $35,000 to $39,999 | 26 (4.9%) | 32 (7.3%) |
| $40,000 to $44,999 | 10 (1.9%) | 7 (1.6%) |
| $45,000 to $49,999 | 79 (15.0%) | 7 (1.6%) |
| $50,000 to $54,999 | 18 (3.4%) | 22 (5.0%) |
| $55,000 to $64,999 | 82 (15.5%) | 14 (3.2%) |
| $65,000 to $74,999 | 57 (10.8%) | 29 (6.6%) |
| $75,000 to $99,999 | 40 (7.6%) | 33 (7.5%) |
| $100,000+ | 17 (3.2%) | 5 (1.1%) |
| Total | 528 (100.0%) | 437 (100.0%) |
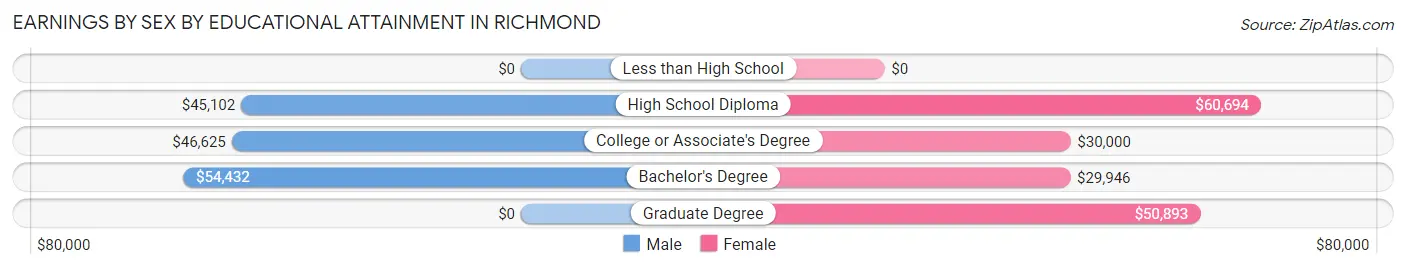
Earnings by Sex by Educational Attainment in Richmond
Average earnings in Richmond are $46,678 for men and $31,766 for women, a difference of 32.0%. Men with an educational attainment of bachelor's degree enjoy the highest average annual earnings of $54,432, while those with high school diploma education earn the least with $45,102. Women with an educational attainment of high school diploma earn the most with the average annual earnings of $60,694, while those with bachelor's degree education have the smallest earnings of $29,946.
| Educational Attainment | Male Income | Female Income |
| Less than High School | - | - |
| High School Diploma | $45,102 | $60,694 |
| College or Associate's Degree | $46,625 | $30,000 |
| Bachelor's Degree | $54,432 | $29,946 |
| Graduate Degree | - | - |
| Total | $46,678 | $31,766 |
Family Income in Richmond
Family Income Brackets in Richmond
According to the Richmond family income data, there are 105 families falling into the $75,000 to $99,999 income range, which is the most common income bracket and makes up 23.3% of all families.
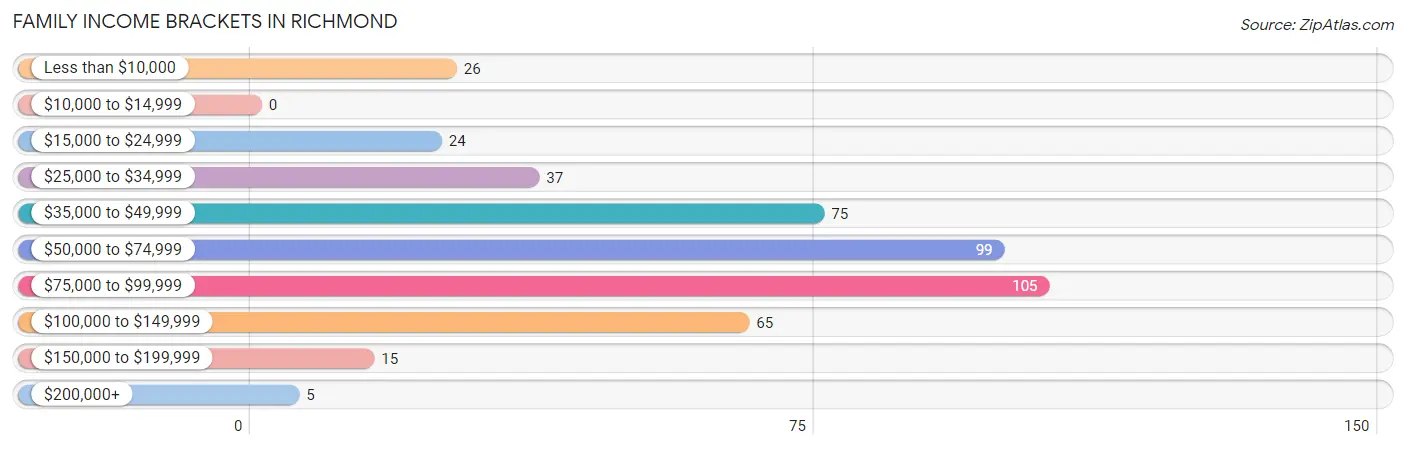
| Income Bracket | # Families | % Families |
| Less than $10,000 | 26 | 5.8% |
| $10,000 to $14,999 | 0 | 0.0% |
| $15,000 to $24,999 | 24 | 5.3% |
| $25,000 to $34,999 | 37 | 8.2% |
| $35,000 to $49,999 | 75 | 16.6% |
| $50,000 to $74,999 | 99 | 22.0% |
| $75,000 to $99,999 | 105 | 23.3% |
| $100,000 to $149,999 | 65 | 14.4% |
| $150,000 to $199,999 | 15 | 3.3% |
| $200,000+ | 5 | 1.1% |
Family Income by Famaliy Size in Richmond
6-person families (47 | 10.4%) account for the highest median family income in Richmond with $80,402 per family, while 2-person families (185 | 41.0%) have the highest median income of $32,644 per family member.
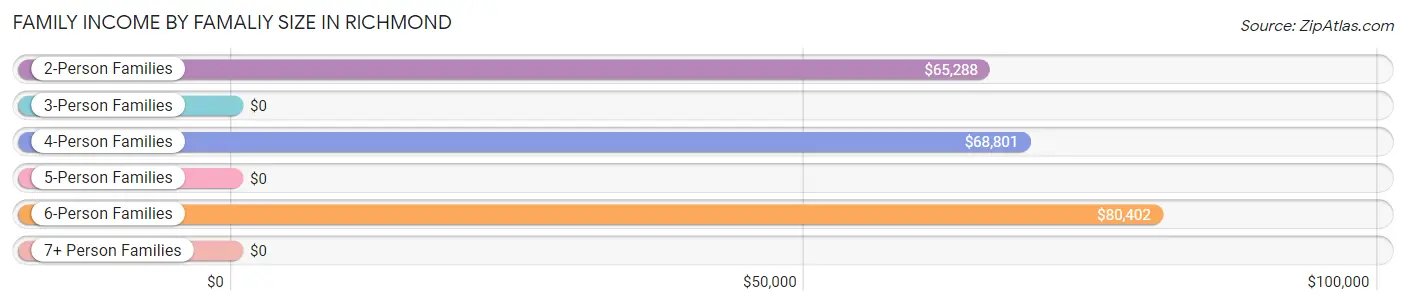
| Income Bracket | # Families | Median Income |
| 2-Person Families | 185 (41.0%) | $65,288 |
| 3-Person Families | 108 (23.9%) | $0 |
| 4-Person Families | 103 (22.8%) | $68,801 |
| 5-Person Families | 0 (0.0%) | $0 |
| 6-Person Families | 47 (10.4%) | $80,402 |
| 7+ Person Families | 8 (1.8%) | $0 |
| Total | 451 (100.0%) | $68,728 |
Family Income by Number of Earners in Richmond
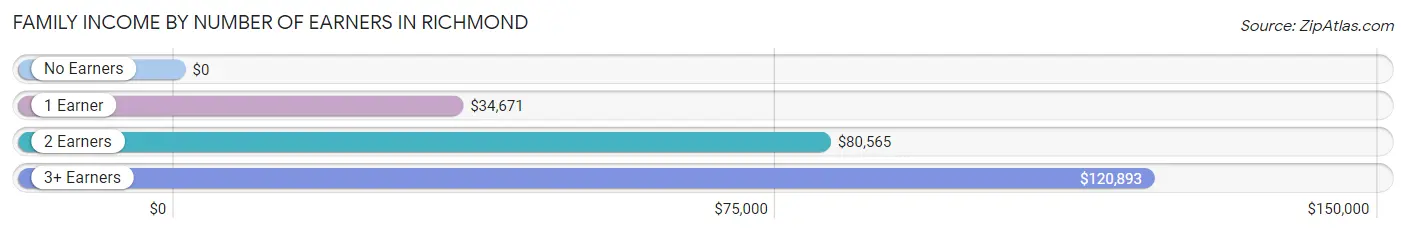
| Number of Earners | # Families | Median Income |
| No Earners | 59 (13.1%) | $0 |
| 1 Earner | 117 (25.9%) | $34,671 |
| 2 Earners | 245 (54.3%) | $80,565 |
| 3+ Earners | 30 (6.7%) | $120,893 |
| Total | 451 (100.0%) | $68,728 |
Household Income in Richmond
Household Income Brackets in Richmond
With 171 households falling in the category, the $75,000 to $99,999 income range is the most frequent in Richmond, accounting for 22.9% of all households. In contrast, only 5 households (0.7%) fall into the $200,000+ income bracket, making it the least populous group.
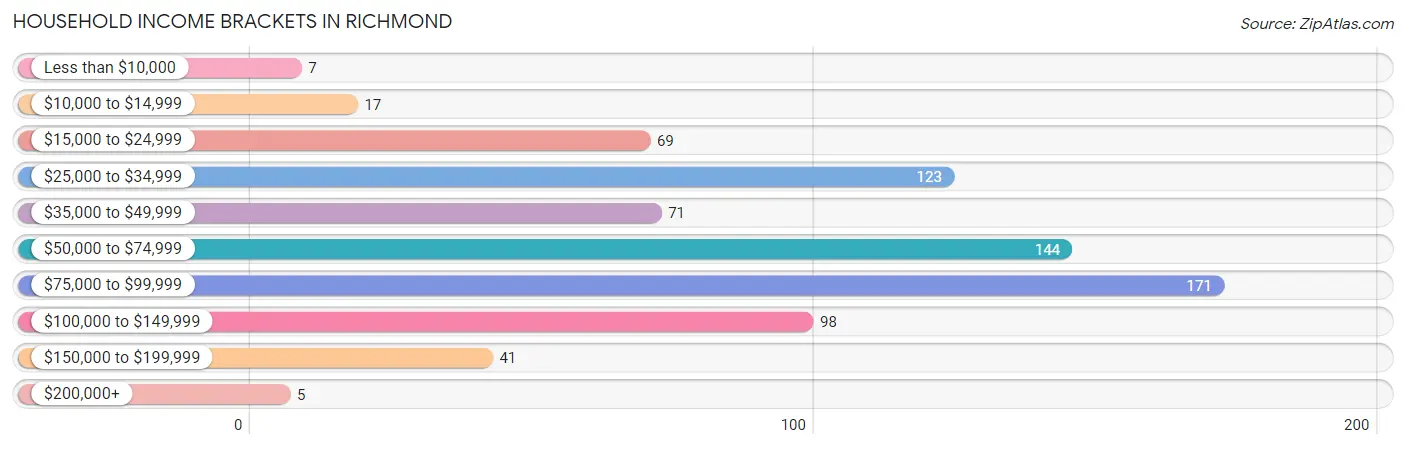
| Income Bracket | # Households | % Households |
| Less than $10,000 | 7 | 0.9% |
| $10,000 to $14,999 | 17 | 2.3% |
| $15,000 to $24,999 | 69 | 9.2% |
| $25,000 to $34,999 | 123 | 16.5% |
| $35,000 to $49,999 | 71 | 9.5% |
| $50,000 to $74,999 | 144 | 19.3% |
| $75,000 to $99,999 | 171 | 22.9% |
| $100,000 to $149,999 | 98 | 13.1% |
| $150,000 to $199,999 | 41 | 5.5% |
| $200,000+ | 5 | 0.7% |
Household Income by Householder Age in Richmond
The median household income in Richmond is $68,030, with the highest median household income of $80,743 found in the 25 to 44 years age bracket for the primary householder. A total of 282 households (37.8%) fall into this category. Meanwhile, the 15 to 24 years age bracket for the primary householder has the lowest median household income of $0, with 48 households (6.4%) in this group.
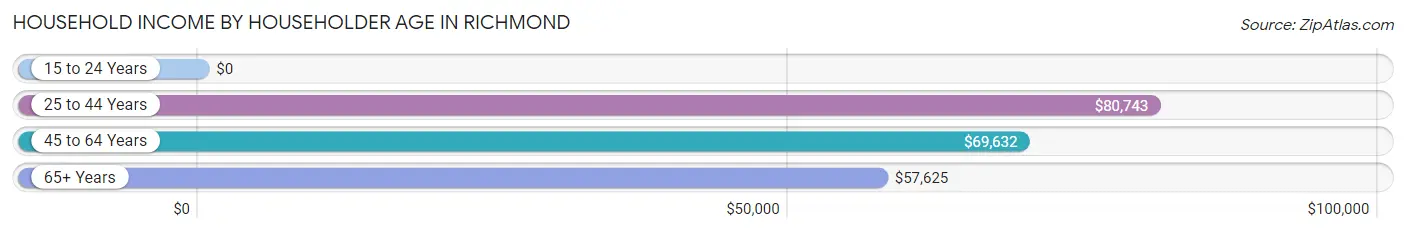
| Income Bracket | # Households | Median Income |
| 15 to 24 Years | 48 (6.4%) | $0 |
| 25 to 44 Years | 282 (37.8%) | $80,743 |
| 45 to 64 Years | 293 (39.3%) | $69,632 |
| 65+ Years | 123 (16.5%) | $57,625 |
| Total | 746 (100.0%) | $68,030 |
Poverty in Richmond
Income Below Poverty by Sex and Age in Richmond
With 8.6% poverty level for males and 8.8% for females among the residents of Richmond, 16 and 17 year old males and 18 to 24 year old females are the most vulnerable to poverty, with 26 males (57.8%) and 26 females (38.2%) in their respective age groups living below the poverty level.
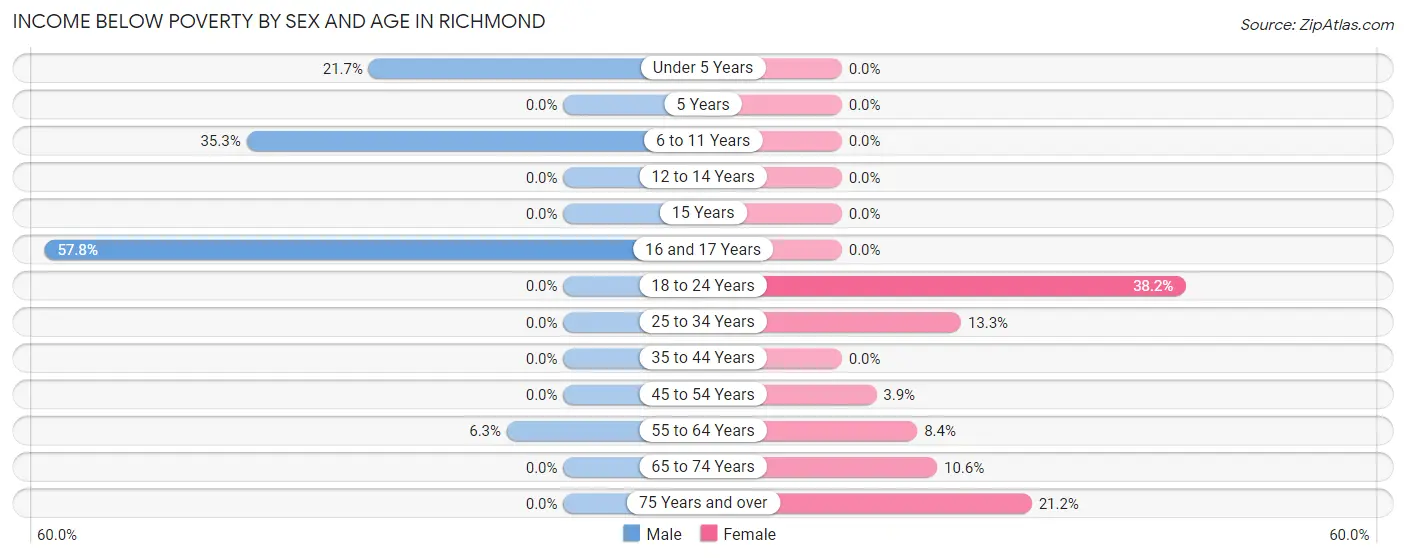
| Age Bracket | Male | Female |
| Under 5 Years | 26 (21.7%) | 0 (0.0%) |
| 5 Years | 0 (0.0%) | 0 (0.0%) |
| 6 to 11 Years | 24 (35.3%) | 0 (0.0%) |
| 12 to 14 Years | 0 (0.0%) | 0 (0.0%) |
| 15 Years | 0 (0.0%) | 0 (0.0%) |
| 16 and 17 Years | 26 (57.8%) | 0 (0.0%) |
| 18 to 24 Years | 0 (0.0%) | 26 (38.2%) |
| 25 to 34 Years | 0 (0.0%) | 15 (13.3%) |
| 35 to 44 Years | 0 (0.0%) | 0 (0.0%) |
| 45 to 54 Years | 0 (0.0%) | 4 (3.8%) |
| 55 to 64 Years | 9 (6.3%) | 10 (8.4%) |
| 65 to 74 Years | 0 (0.0%) | 7 (10.6%) |
| 75 Years and over | 0 (0.0%) | 11 (21.1%) |
| Total | 85 (8.6%) | 73 (8.8%) |
Income Above Poverty by Sex and Age in Richmond
According to the poverty statistics in Richmond, males aged 5 years and females aged under 5 years are the age groups that are most secure financially, with 100.0% of males and 100.0% of females in these age groups living above the poverty line.
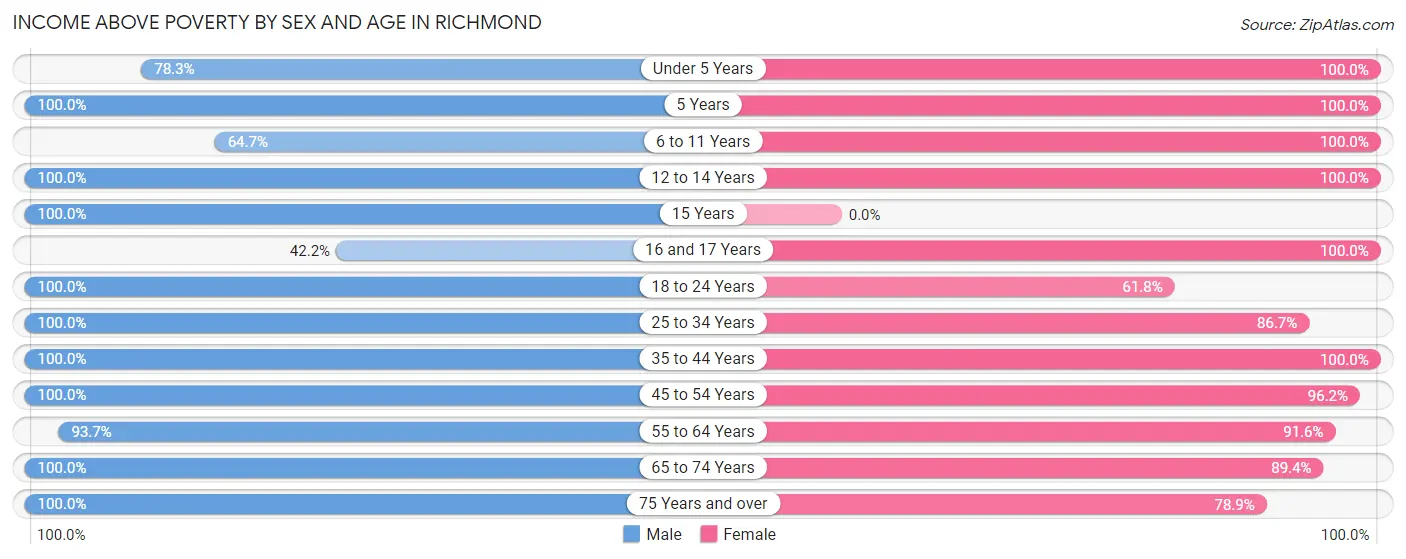
| Age Bracket | Male | Female |
| Under 5 Years | 94 (78.3%) | 45 (100.0%) |
| 5 Years | 6 (100.0%) | 7 (100.0%) |
| 6 to 11 Years | 44 (64.7%) | 81 (100.0%) |
| 12 to 14 Years | 32 (100.0%) | 14 (100.0%) |
| 15 Years | 64 (100.0%) | 0 (0.0%) |
| 16 and 17 Years | 19 (42.2%) | 70 (100.0%) |
| 18 to 24 Years | 88 (100.0%) | 42 (61.8%) |
| 25 to 34 Years | 163 (100.0%) | 98 (86.7%) |
| 35 to 44 Years | 122 (100.0%) | 92 (100.0%) |
| 45 to 54 Years | 59 (100.0%) | 100 (96.2%) |
| 55 to 64 Years | 134 (93.7%) | 109 (91.6%) |
| 65 to 74 Years | 41 (100.0%) | 59 (89.4%) |
| 75 Years and over | 42 (100.0%) | 41 (78.8%) |
| Total | 908 (91.4%) | 758 (91.2%) |
Income Below Poverty Among Married-Couple Families in Richmond
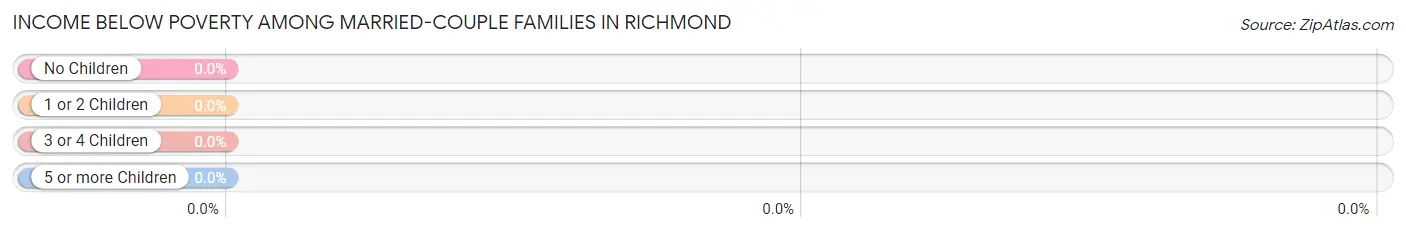
| Children | Above Poverty | Below Poverty |
| No Children | 103 (100.0%) | 0 (0.0%) |
| 1 or 2 Children | 154 (100.0%) | 0 (0.0%) |
| 3 or 4 Children | 47 (100.0%) | 0 (0.0%) |
| 5 or more Children | 8 (100.0%) | 0 (0.0%) |
| Total | 312 (100.0%) | 0 (0.0%) |
Income Below Poverty Among Single-Parent Households in Richmond
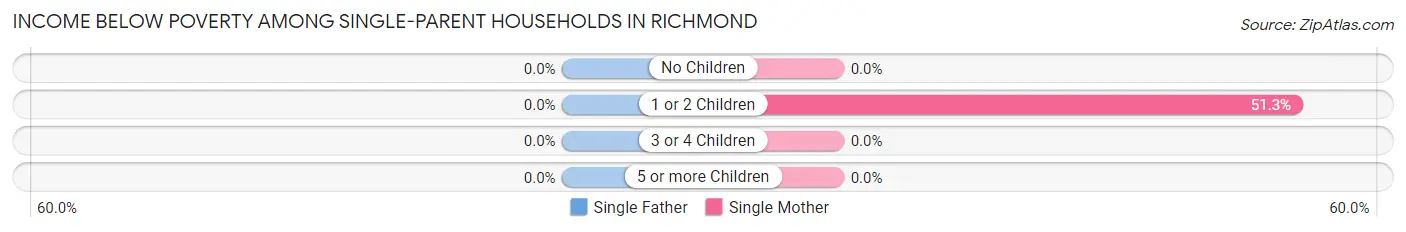
| Children | Single Father | Single Mother |
| No Children | 0 (0.0%) | 0 (0.0%) |
| 1 or 2 Children | 0 (0.0%) | 39 (51.3%) |
| 3 or 4 Children | 0 (0.0%) | 0 (0.0%) |
| 5 or more Children | 0 (0.0%) | 0 (0.0%) |
| Total | 0 (0.0%) | 39 (30.5%) |
Income Below Poverty Among Married-Couple vs Single-Parent Households in Richmond
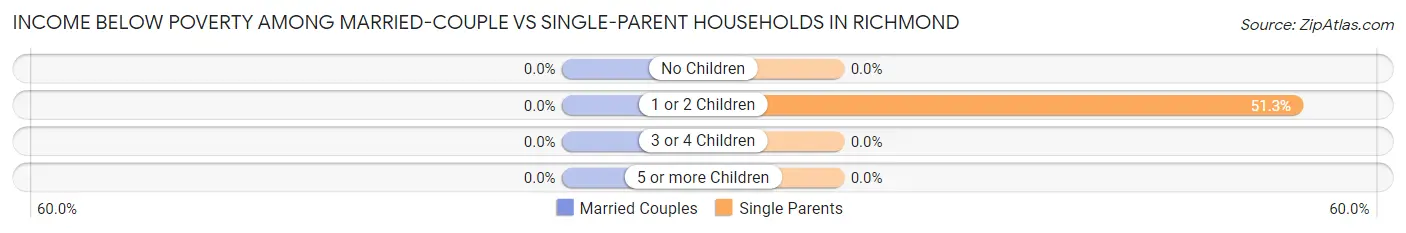
| Children | Married-Couple Families | Single-Parent Households |
| No Children | 0 (0.0%) | 0 (0.0%) |
| 1 or 2 Children | 0 (0.0%) | 39 (51.3%) |
| 3 or 4 Children | 0 (0.0%) | 0 (0.0%) |
| 5 or more Children | 0 (0.0%) | 0 (0.0%) |
| Total | 0 (0.0%) | 39 (28.1%) |
Race in Richmond
The most populous races in Richmond are White / Caucasian (1,766 | 96.2%), Two or more Races (47 | 2.6%), and Native / Alaskan (22 | 1.2%).
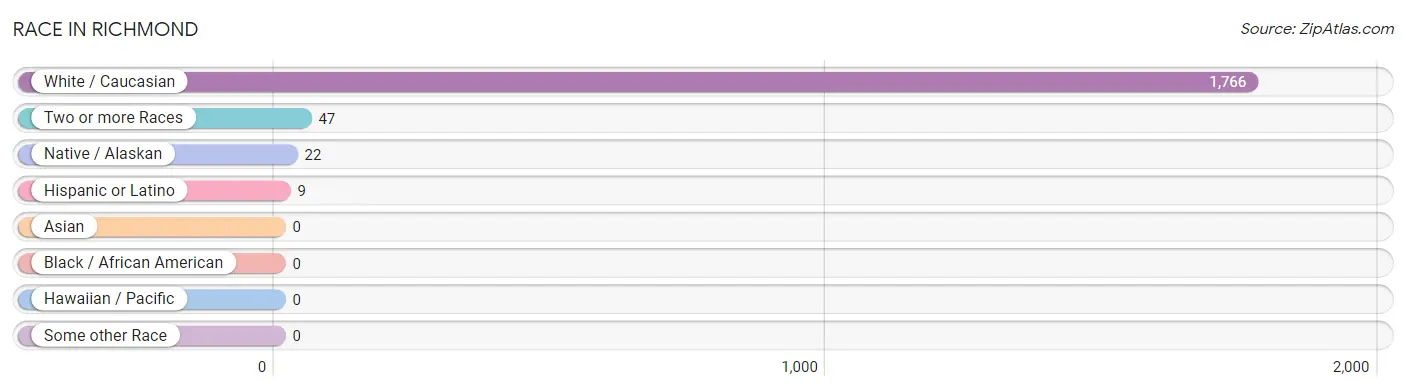
| Race | # Population | % Population |
| Asian | 0 | 0.0% |
| Black / African American | 0 | 0.0% |
| Hawaiian / Pacific | 0 | 0.0% |
| Hispanic or Latino | 9 | 0.5% |
| Native / Alaskan | 22 | 1.2% |
| White / Caucasian | 1,766 | 96.2% |
| Two or more Races | 47 | 2.6% |
| Some other Race | 0 | 0.0% |
| Total | 1,835 | 100.0% |
Ancestry in Richmond
The most populous ancestries reported in Richmond are English (405 | 22.1%), Irish (257 | 14.0%), German (193 | 10.5%), Polish (160 | 8.7%), and French (152 | 8.3%), together accounting for 63.6% of all Richmond residents.
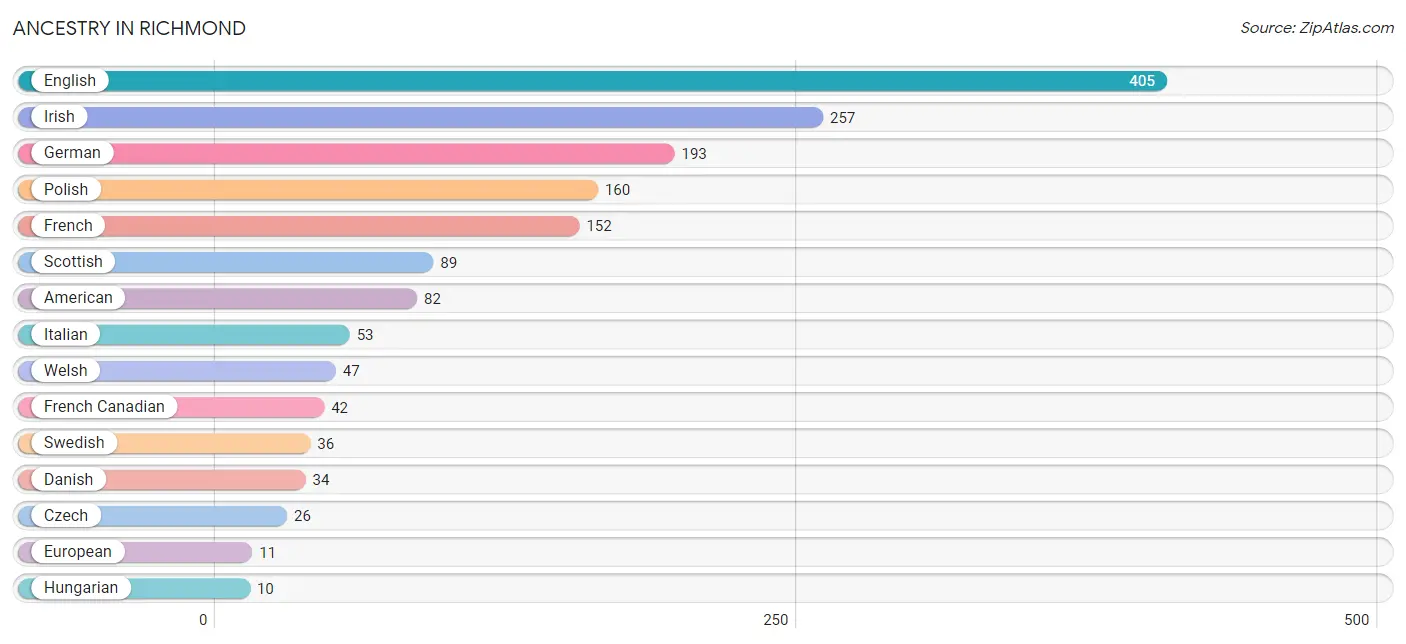
| Ancestry | # Population | % Population |
| American | 82 | 4.5% |
| Austrian | 5 | 0.3% |
| Czech | 26 | 1.4% |
| Czechoslovakian | 5 | 0.3% |
| Danish | 34 | 1.8% |
| English | 405 | 22.1% |
| European | 11 | 0.6% |
| Finnish | 2 | 0.1% |
| French | 152 | 8.3% |
| French Canadian | 42 | 2.3% |
| German | 193 | 10.5% |
| Greek | 7 | 0.4% |
| Hungarian | 10 | 0.5% |
| Irish | 257 | 14.0% |
| Italian | 53 | 2.9% |
| Northern European | 7 | 0.4% |
| Norwegian | 8 | 0.4% |
| Polish | 160 | 8.7% |
| Scotch-Irish | 6 | 0.3% |
| Scottish | 89 | 4.9% |
| Spaniard | 9 | 0.5% |
| Swedish | 36 | 2.0% |
| Swiss | 8 | 0.4% |
| Welsh | 47 | 2.6% | View All 24 Rows |
Immigrants in Richmond
The most numerous immigrant groups reported in Richmond came from Europe (33 | 1.8%), Czechoslovakia (26 | 1.4%), Eastern Europe (26 | 1.4%), France (7 | 0.4%), and Western Europe (7 | 0.4%), together accounting for 5.4% of all Richmond residents.
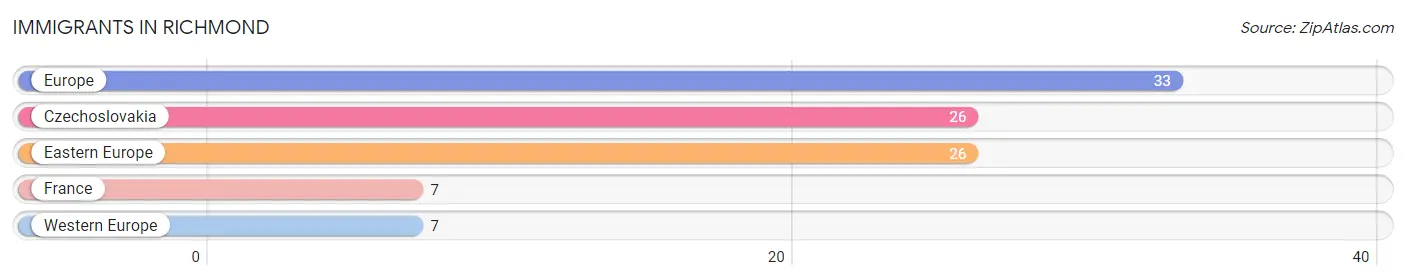
| Immigration Origin | # Population | % Population |
| Czechoslovakia | 26 | 1.4% |
| Eastern Europe | 26 | 1.4% |
| Europe | 33 | 1.8% |
| France | 7 | 0.4% |
| Western Europe | 7 | 0.4% | View All 5 Rows |
Sex and Age in Richmond
Sex and Age in Richmond
The most populous age groups in Richmond are 15 to 19 Years (137 | 13.7%) for men and 15 to 19 Years (90 | 10.8%) for women.
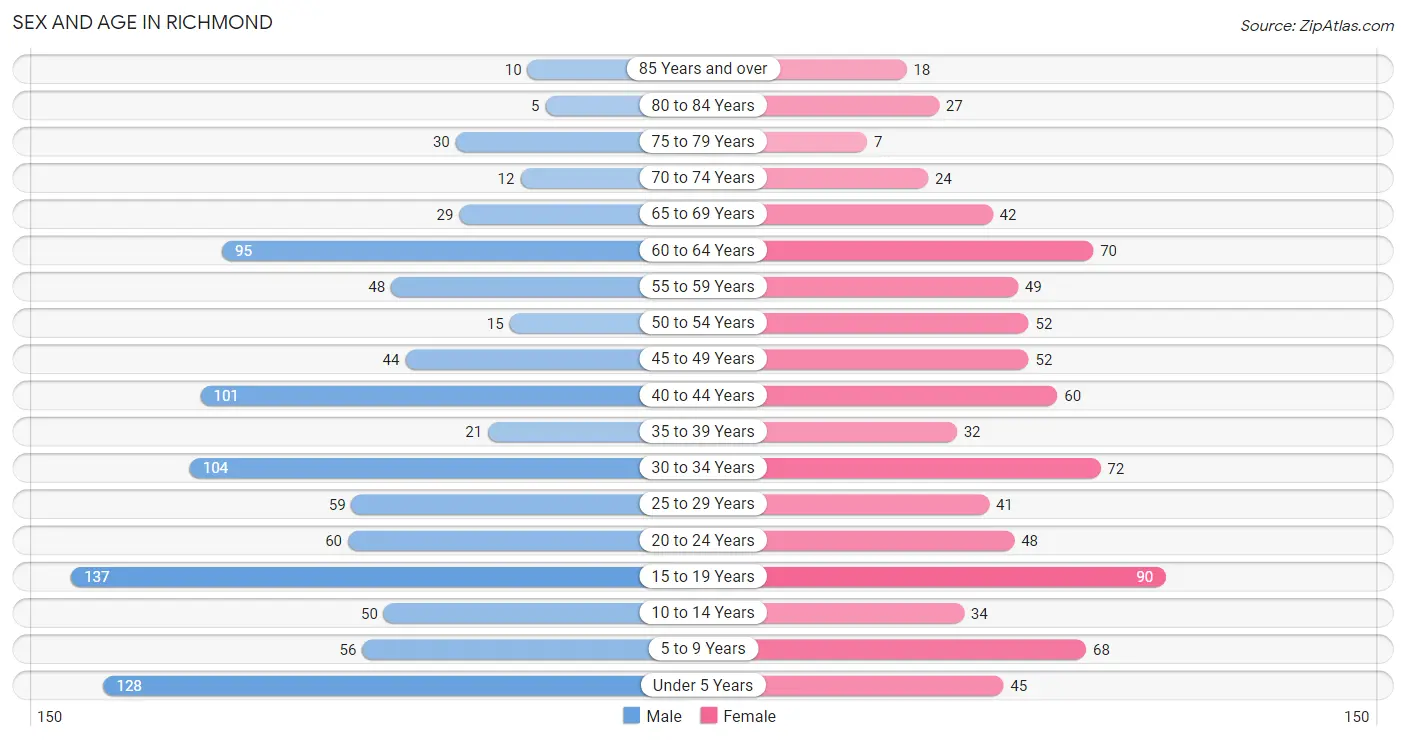
| Age Bracket | Male | Female |
| Under 5 Years | 128 (12.8%) | 45 (5.4%) |
| 5 to 9 Years | 56 (5.6%) | 68 (8.2%) |
| 10 to 14 Years | 50 (5.0%) | 34 (4.1%) |
| 15 to 19 Years | 137 (13.7%) | 90 (10.8%) |
| 20 to 24 Years | 60 (6.0%) | 48 (5.8%) |
| 25 to 29 Years | 59 (5.9%) | 41 (4.9%) |
| 30 to 34 Years | 104 (10.4%) | 72 (8.7%) |
| 35 to 39 Years | 21 (2.1%) | 32 (3.8%) |
| 40 to 44 Years | 101 (10.1%) | 60 (7.2%) |
| 45 to 49 Years | 44 (4.4%) | 52 (6.3%) |
| 50 to 54 Years | 15 (1.5%) | 52 (6.3%) |
| 55 to 59 Years | 48 (4.8%) | 49 (5.9%) |
| 60 to 64 Years | 95 (9.5%) | 70 (8.4%) |
| 65 to 69 Years | 29 (2.9%) | 42 (5.1%) |
| 70 to 74 Years | 12 (1.2%) | 24 (2.9%) |
| 75 to 79 Years | 30 (3.0%) | 7 (0.8%) |
| 80 to 84 Years | 5 (0.5%) | 27 (3.3%) |
| 85 Years and over | 10 (1.0%) | 18 (2.2%) |
| Total | 1,004 (100.0%) | 831 (100.0%) |
Families and Households in Richmond
Median Family Size in Richmond
The median family size in Richmond is 3.02 persons per family, with married-couple families (312 | 69.2%) accounting for the largest median family size of 3.39 persons per family. On the other hand, single male/father families (11 | 2.4%) represent the smallest median family size with 2.18 persons per family.
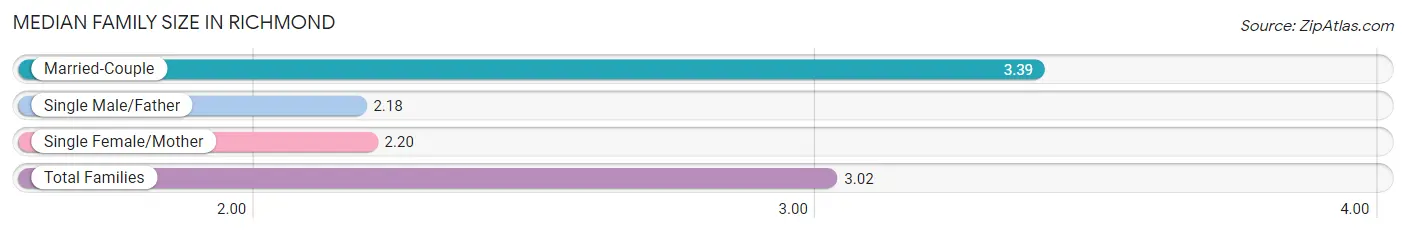
| Family Type | # Families | Family Size |
| Married-Couple | 312 (69.2%) | 3.39 |
| Single Male/Father | 11 (2.4%) | 2.18 |
| Single Female/Mother | 128 (28.4%) | 2.20 |
| Total Families | 451 (100.0%) | 3.02 |
Median Household Size in Richmond
The median household size in Richmond is 2.43 persons per household, with married-couple households (312 | 41.8%) accounting for the largest median household size of 3.5 persons per household. non-family households (295 | 39.5%) represent the smallest median household size with 1.15 persons per household.
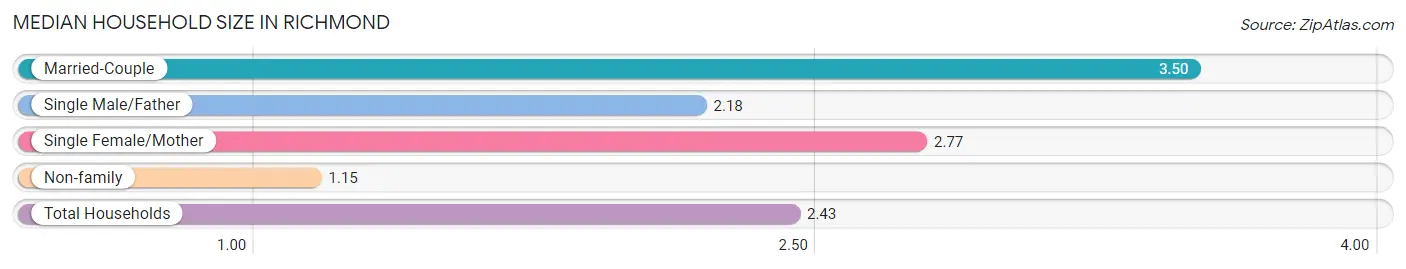
| Household Type | # Households | Household Size |
| Married-Couple | 312 (41.8%) | 3.50 |
| Single Male/Father | 11 (1.5%) | 2.18 |
| Single Female/Mother | 128 (17.2%) | 2.77 |
| Non-family | 295 (39.5%) | 1.15 |
| Total Households | 746 (100.0%) | 2.43 |
Household Size by Marriage Status in Richmond
Out of a total of 746 households in Richmond, 451 (60.5%) are family households, while 295 (39.5%) are nonfamily households. The most numerous type of family households are 2-person households, comprising 159, and the most common type of nonfamily households are 1-person households, comprising 258.
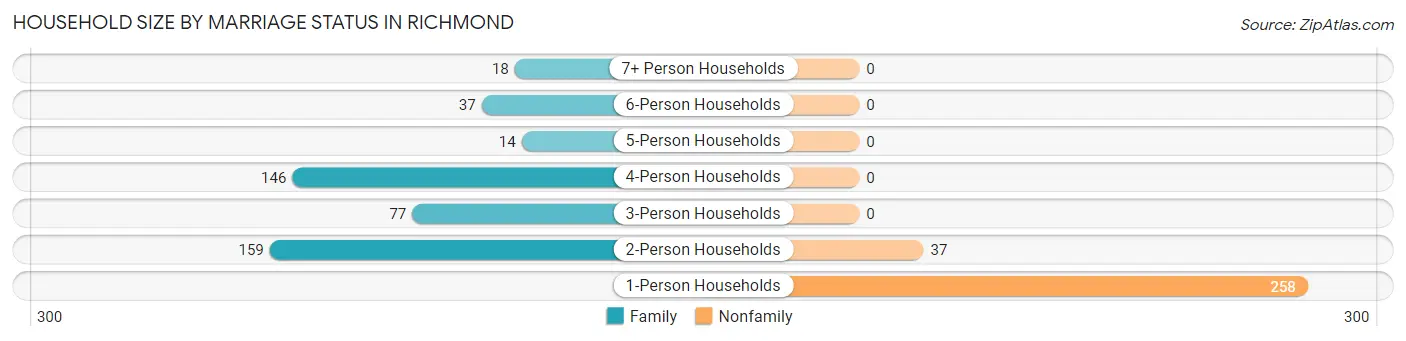
| Household Size | Family Households | Nonfamily Households |
| 1-Person Households | - | 258 (34.6%) |
| 2-Person Households | 159 (21.3%) | 37 (5.0%) |
| 3-Person Households | 77 (10.3%) | 0 (0.0%) |
| 4-Person Households | 146 (19.6%) | 0 (0.0%) |
| 5-Person Households | 14 (1.9%) | 0 (0.0%) |
| 6-Person Households | 37 (5.0%) | 0 (0.0%) |
| 7+ Person Households | 18 (2.4%) | 0 (0.0%) |
| Total | 451 (60.5%) | 295 (39.5%) |
Female Fertility in Richmond
Fertility by Age in Richmond
Average fertility rate in Richmond is 108.0 births per 1,000 women. Women in the age bracket of 20 to 34 years have the highest fertility rate with 267.0 births per 1,000 women. Women in the age bracket of 20 to 34 years acount for 100.0% of all women with births.
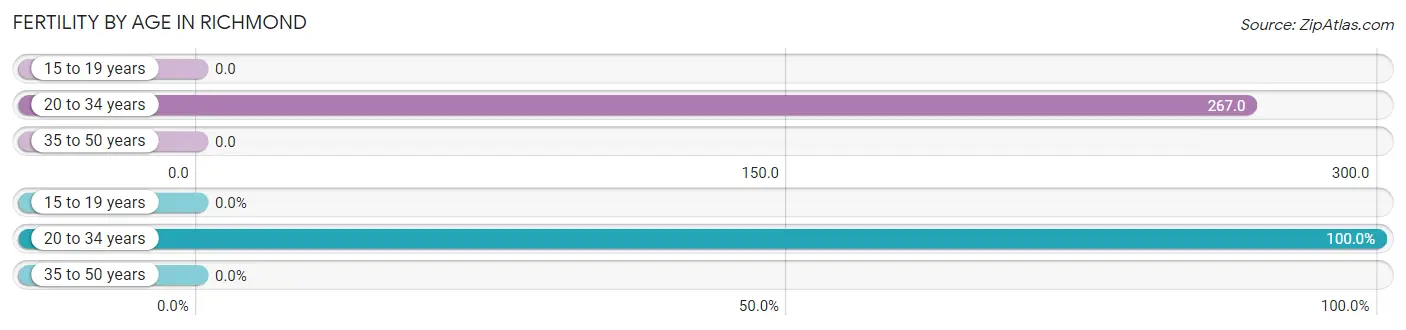
| Age Bracket | Women with Births | Births / 1,000 Women |
| 15 to 19 years | 0 (0.0%) | 0.0 |
| 20 to 34 years | 43 (100.0%) | 267.0 |
| 35 to 50 years | 0 (0.0%) | 0.0 |
| Total | 43 (100.0%) | 108.0 |
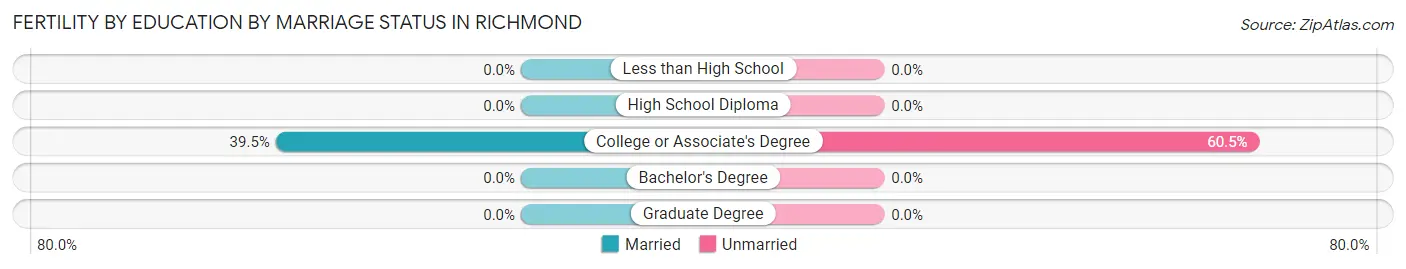
Fertility by Age by Marriage Status in Richmond
39.5% of women with births (43) in Richmond are married. The highest percentage of unmarried women with births falls into 20 to 34 years age bracket with 60.5% of them unmarried at the time of birth, while the lowest percentage of unmarried women with births belong to 20 to 34 years age bracket with 60.5% of them unmarried.
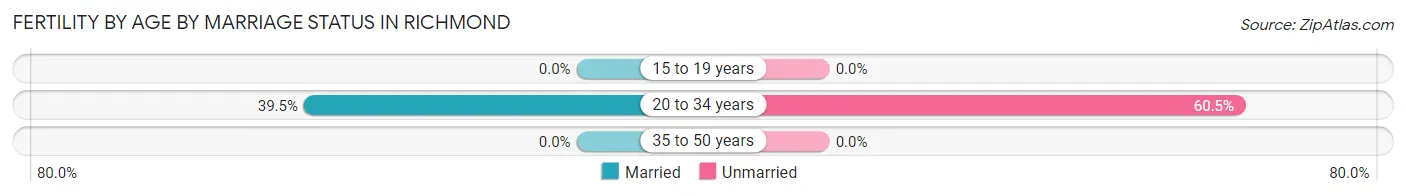
| Age Bracket | Married | Unmarried |
| 15 to 19 years | 0 (0.0%) | 0 (0.0%) |
| 20 to 34 years | 17 (39.5%) | 26 (60.5%) |
| 35 to 50 years | 0 (0.0%) | 0 (0.0%) |
| Total | 17 (39.5%) | 26 (60.5%) |
Fertility by Education in Richmond
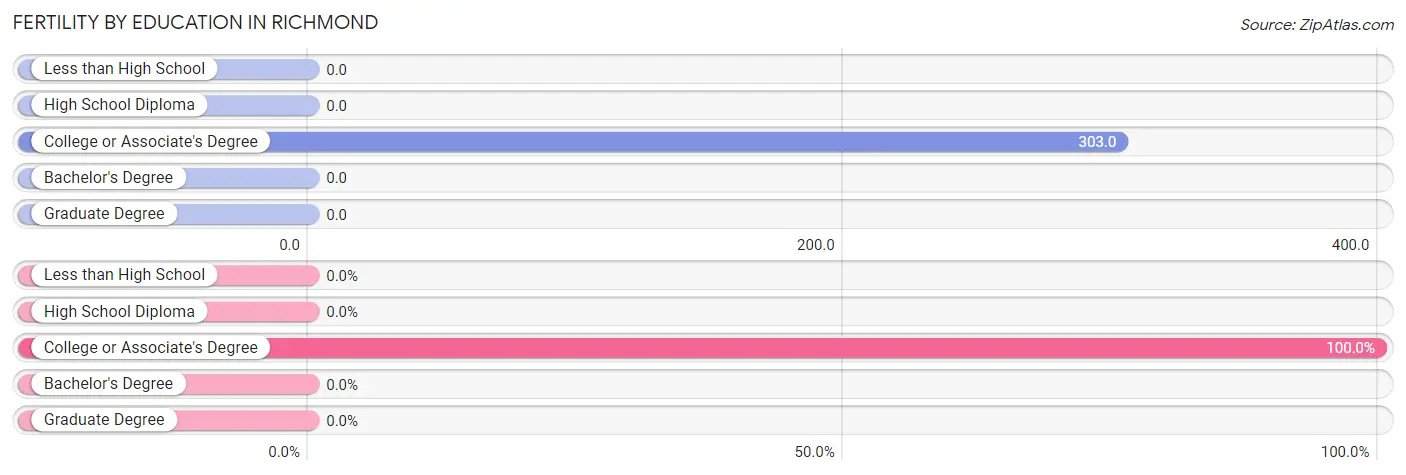
| Educational Attainment | Women with Births | Births / 1,000 Women |
| Less than High School | 0 (0.0%) | 0.0 |
| High School Diploma | 0 (0.0%) | 0.0 |
| College or Associate's Degree | 43 (100.0%) | 303.0 |
| Bachelor's Degree | 0 (0.0%) | 0.0 |
| Graduate Degree | 0 (0.0%) | 0.0 |
| Total | 43 (100.0%) | 108.0 |
Fertility by Education by Marriage Status in Richmond
60.5% of women with births in Richmond are unmarried. Women with the educational attainment of college or associate's degree are most likely to be married with 39.5% of them married at childbirth, while women with the educational attainment of college or associate's degree are least likely to be married with 60.5% of them unmarried at childbirth.
| Educational Attainment | Married | Unmarried |
| Less than High School | 0 (0.0%) | 0 (0.0%) |
| High School Diploma | 0 (0.0%) | 0 (0.0%) |
| College or Associate's Degree | 17 (39.5%) | 26 (60.5%) |
| Bachelor's Degree | 0 (0.0%) | 0 (0.0%) |
| Graduate Degree | 0 (0.0%) | 0 (0.0%) |
| Total | 17 (39.5%) | 26 (60.5%) |
Employment Characteristics in Richmond
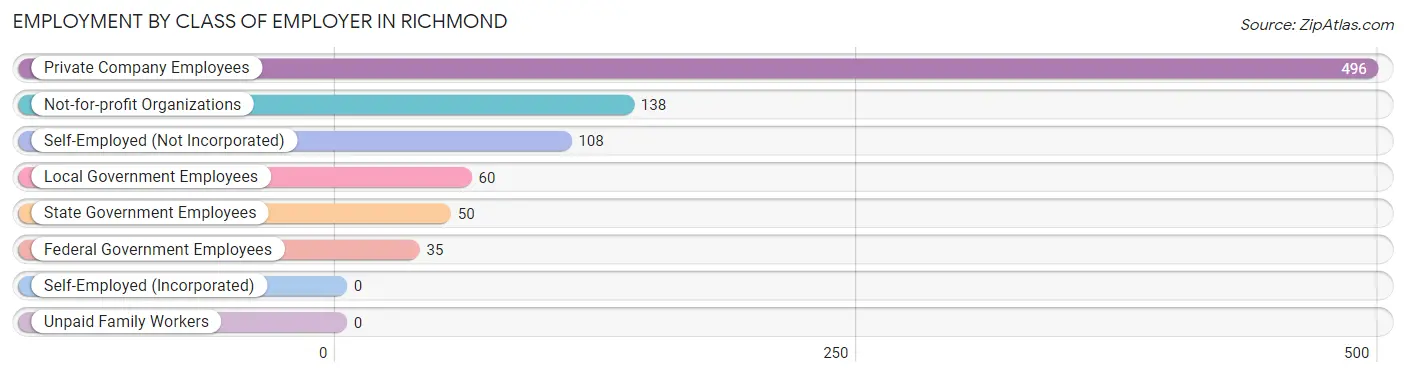
Employment by Class of Employer in Richmond
Among the 887 employed individuals in Richmond, private company employees (496 | 55.9%), not-for-profit organizations (138 | 15.6%), and self-employed (not incorporated) (108 | 12.2%) make up the most common classes of employment.
| Employer Class | # Employees | % Employees |
| Private Company Employees | 496 | 55.9% |
| Self-Employed (Incorporated) | 0 | 0.0% |
| Self-Employed (Not Incorporated) | 108 | 12.2% |
| Not-for-profit Organizations | 138 | 15.6% |
| Local Government Employees | 60 | 6.8% |
| State Government Employees | 50 | 5.6% |
| Federal Government Employees | 35 | 4.0% |
| Unpaid Family Workers | 0 | 0.0% |
| Total | 887 | 100.0% |
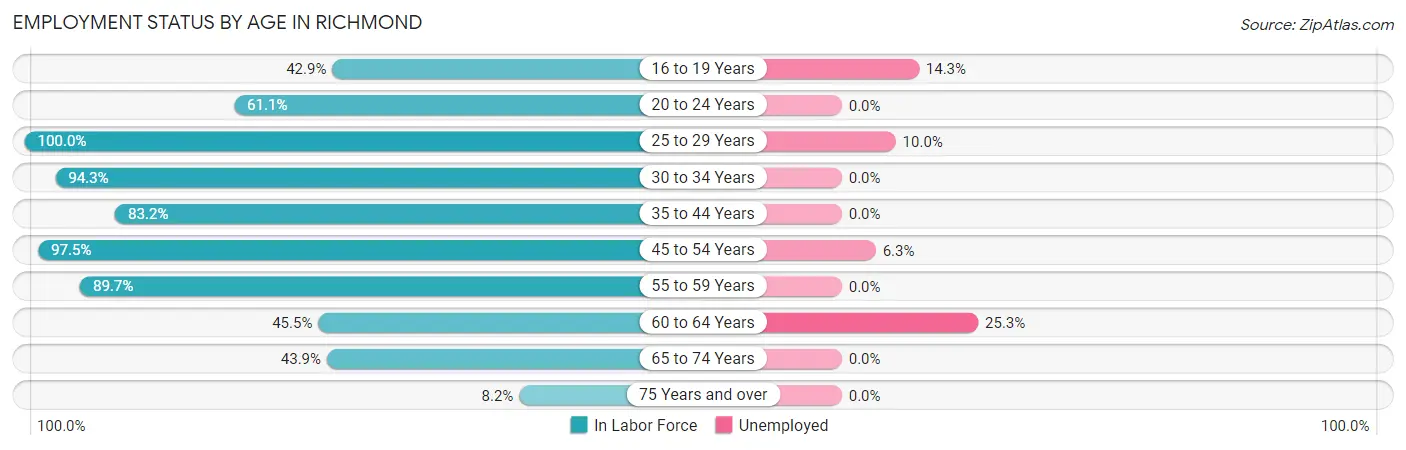
Employment Status by Age in Richmond
According to the labor force statistics for Richmond, out of the total population over 16 years of age (1,390), 68.8% or 956 individuals are in the labor force, with 5.1% or 49 of them unemployed. The age group with the highest labor force participation rate is 25 to 29 years, with 100.0% or 100 individuals in the labor force. Within the labor force, the 60 to 64 years age range has the highest percentage of unemployed individuals, with 25.3% or 19 of them being unemployed.
| Age Bracket | In Labor Force | Unemployed |
| 16 to 19 Years | 70 (42.9%) | 10 (14.3%) |
| 20 to 24 Years | 66 (61.1%) | 0 (0.0%) |
| 25 to 29 Years | 100 (100.0%) | 10 (10.0%) |
| 30 to 34 Years | 166 (94.3%) | 0 (0.0%) |
| 35 to 44 Years | 178 (83.2%) | 0 (0.0%) |
| 45 to 54 Years | 159 (97.5%) | 10 (6.3%) |
| 55 to 59 Years | 87 (89.7%) | 0 (0.0%) |
| 60 to 64 Years | 75 (45.5%) | 19 (25.3%) |
| 65 to 74 Years | 47 (43.9%) | 0 (0.0%) |
| 75 Years and over | 8 (8.2%) | 0 (0.0%) |
| Total | 956 (68.8%) | 49 (5.1%) |
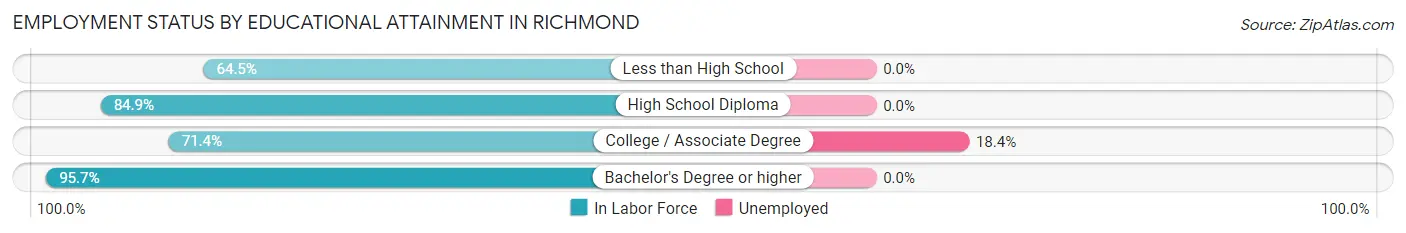
Employment Status by Educational Attainment in Richmond
According to labor force statistics for Richmond, 83.6% of individuals (765) out of the total population between 25 and 64 years of age (915) are in the labor force, with 5.1% or 39 of them being unemployed. The group with the highest labor force participation rate are those with the educational attainment of bachelor's degree or higher, with 95.7% or 308 individuals in the labor force. Within the labor force, individuals with college / associate degree education have the highest percentage of unemployment, with 18.4% or 39 of them being unemployed.
| Educational Attainment | In Labor Force | Unemployed |
| Less than High School | 20 (64.5%) | 0 (0.0%) |
| High School Diploma | 225 (84.9%) | 0 (0.0%) |
| College / Associate Degree | 212 (71.4%) | 55 (18.4%) |
| Bachelor's Degree or higher | 308 (95.7%) | 0 (0.0%) |
| Total | 765 (83.6%) | 47 (5.1%) |
Employment Occupations by Sex in Richmond
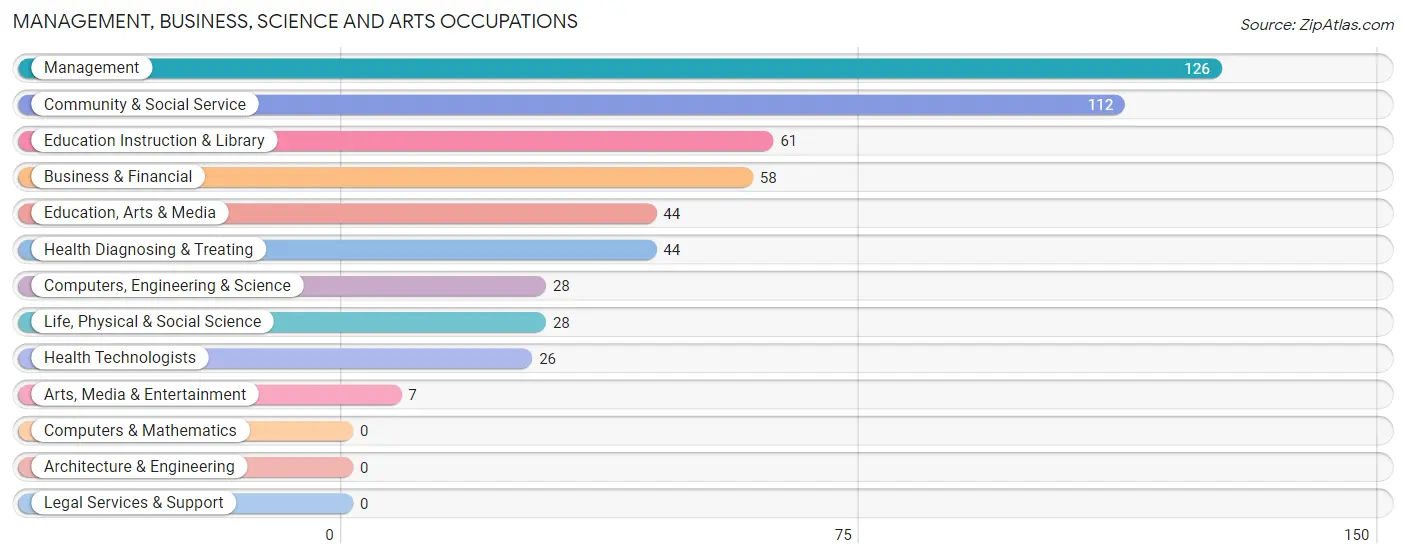
Management, Business, Science and Arts Occupations
The most common Management, Business, Science and Arts occupations in Richmond are Management (126 | 13.9%), Community & Social Service (112 | 12.3%), Education Instruction & Library (61 | 6.7%), Business & Financial (58 | 6.4%), and Education, Arts & Media (44 | 4.9%).
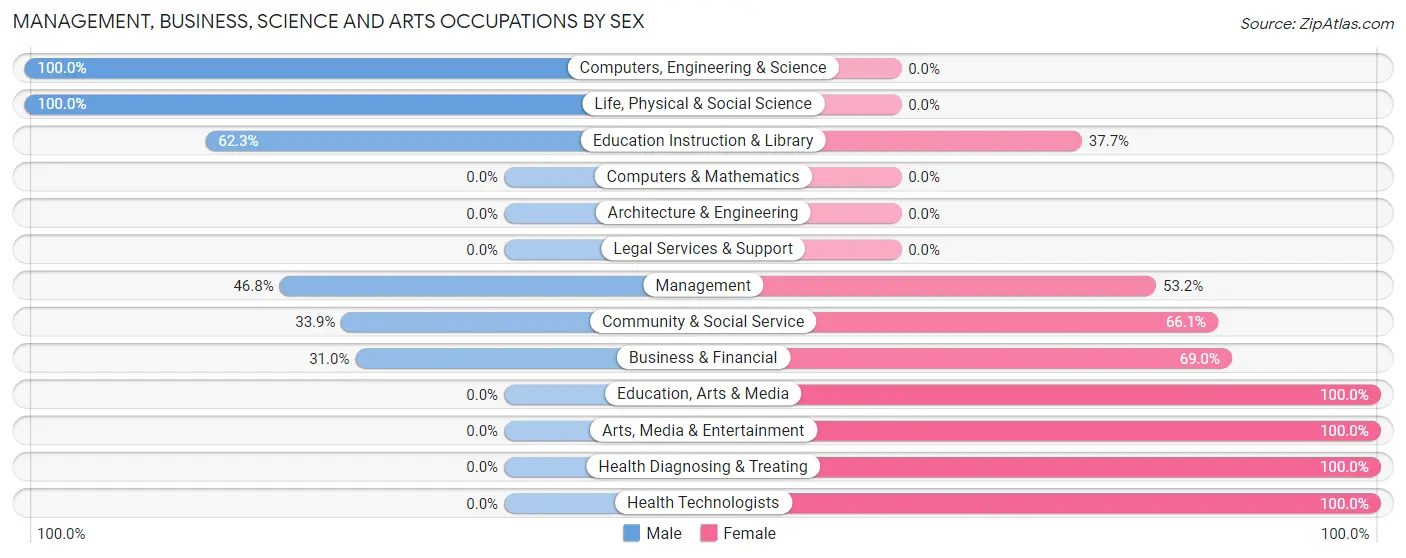
Management, Business, Science and Arts Occupations by Sex
Within the Management, Business, Science and Arts occupations in Richmond, the most male-oriented occupations are Computers, Engineering & Science (100.0%), Life, Physical & Social Science (100.0%), and Education Instruction & Library (62.3%), while the most female-oriented occupations are Education, Arts & Media (100.0%), Arts, Media & Entertainment (100.0%), and Health Diagnosing & Treating (100.0%).
| Occupation | Male | Female |
| Management | 59 (46.8%) | 67 (53.2%) |
| Business & Financial | 18 (31.0%) | 40 (69.0%) |
| Computers, Engineering & Science | 28 (100.0%) | 0 (0.0%) |
| Computers & Mathematics | 0 (0.0%) | 0 (0.0%) |
| Architecture & Engineering | 0 (0.0%) | 0 (0.0%) |
| Life, Physical & Social Science | 28 (100.0%) | 0 (0.0%) |
| Community & Social Service | 38 (33.9%) | 74 (66.1%) |
| Education, Arts & Media | 0 (0.0%) | 44 (100.0%) |
| Legal Services & Support | 0 (0.0%) | 0 (0.0%) |
| Education Instruction & Library | 38 (62.3%) | 23 (37.7%) |
| Arts, Media & Entertainment | 0 (0.0%) | 7 (100.0%) |
| Health Diagnosing & Treating | 0 (0.0%) | 44 (100.0%) |
| Health Technologists | 0 (0.0%) | 26 (100.0%) |
| Total (Category) | 143 (38.9%) | 225 (61.1%) |
| Total (Overall) | 494 (54.5%) | 413 (45.5%) |
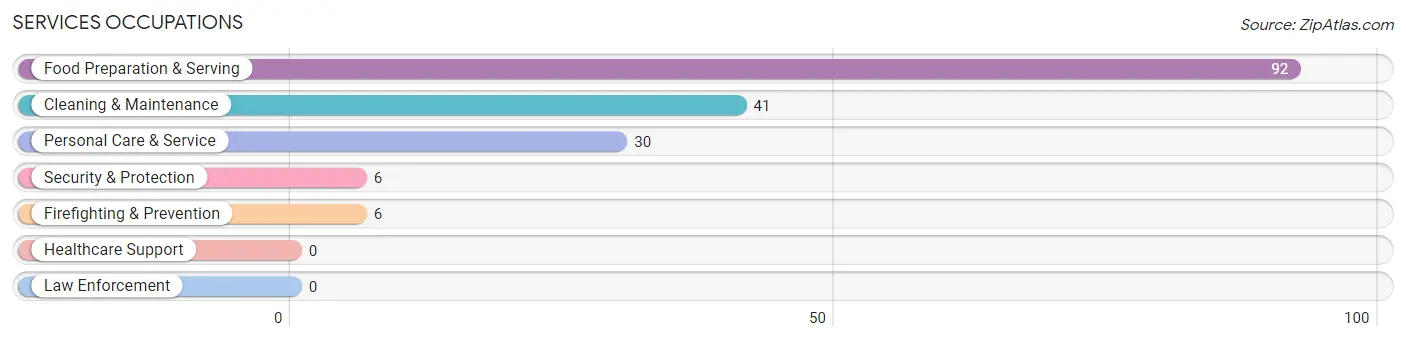
Services Occupations
The most common Services occupations in Richmond are Food Preparation & Serving (92 | 10.1%), Cleaning & Maintenance (41 | 4.5%), Personal Care & Service (30 | 3.3%), Security & Protection (6 | 0.7%), and Firefighting & Prevention (6 | 0.7%).
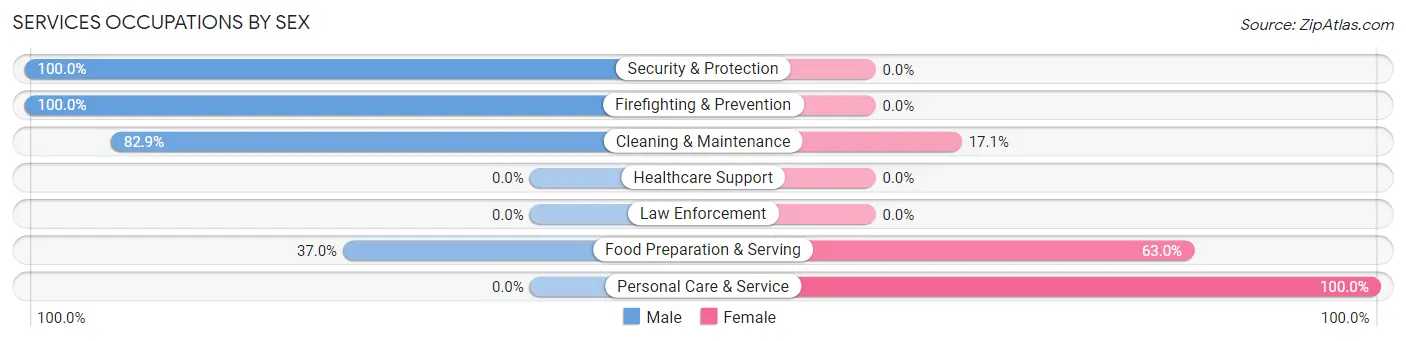
Services Occupations by Sex
Within the Services occupations in Richmond, the most male-oriented occupations are Security & Protection (100.0%), Firefighting & Prevention (100.0%), and Cleaning & Maintenance (82.9%), while the most female-oriented occupations are Personal Care & Service (100.0%), Food Preparation & Serving (63.0%), and Cleaning & Maintenance (17.1%).
| Occupation | Male | Female |
| Healthcare Support | 0 (0.0%) | 0 (0.0%) |
| Security & Protection | 6 (100.0%) | 0 (0.0%) |
| Firefighting & Prevention | 6 (100.0%) | 0 (0.0%) |
| Law Enforcement | 0 (0.0%) | 0 (0.0%) |
| Food Preparation & Serving | 34 (37.0%) | 58 (63.0%) |
| Cleaning & Maintenance | 34 (82.9%) | 7 (17.1%) |
| Personal Care & Service | 0 (0.0%) | 30 (100.0%) |
| Total (Category) | 74 (43.8%) | 95 (56.2%) |
| Total (Overall) | 494 (54.5%) | 413 (45.5%) |
Sales and Office Occupations
The most common Sales and Office occupations in Richmond are Office & Administration (117 | 12.9%), and Sales & Related (63 | 7.0%).
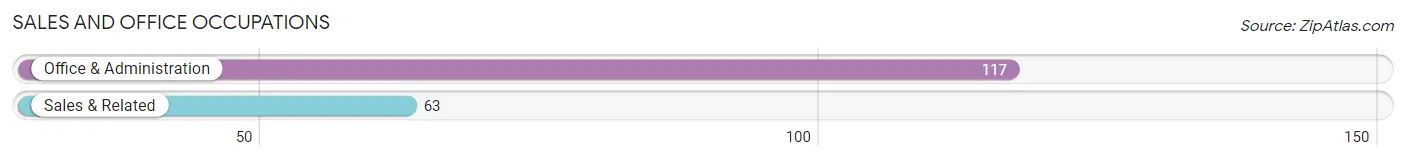
Sales and Office Occupations by Sex
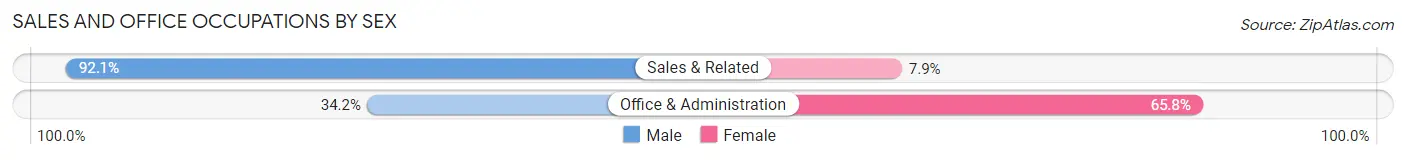
| Occupation | Male | Female |
| Sales & Related | 58 (92.1%) | 5 (7.9%) |
| Office & Administration | 40 (34.2%) | 77 (65.8%) |
| Total (Category) | 98 (54.4%) | 82 (45.6%) |
| Total (Overall) | 494 (54.5%) | 413 (45.5%) |
Natural Resources, Construction and Maintenance Occupations
The most common Natural Resources, Construction and Maintenance occupations in Richmond are Installation, Maintenance & Repair (77 | 8.5%), Construction & Extraction (31 | 3.4%), and Farming, Fishing & Forestry (11 | 1.2%).
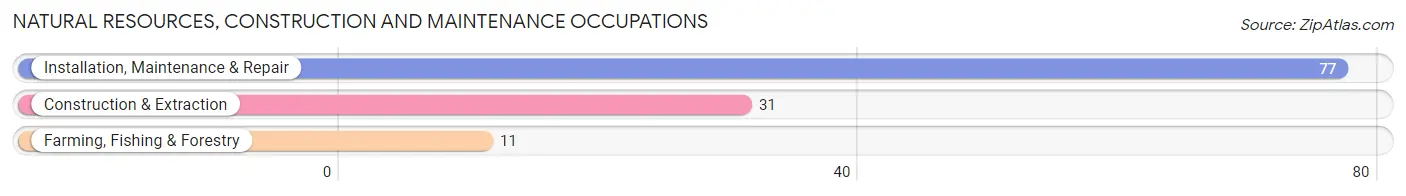
Natural Resources, Construction and Maintenance Occupations by Sex
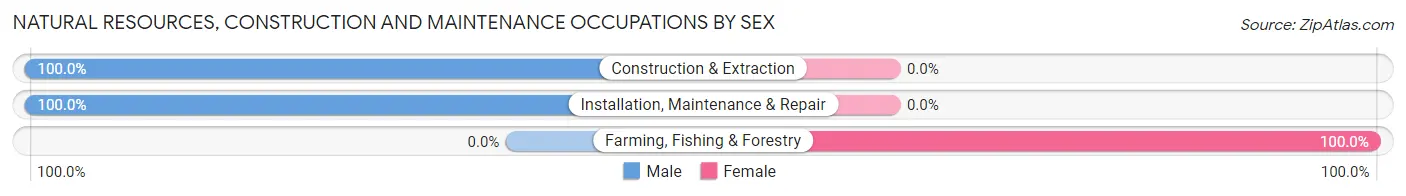
| Occupation | Male | Female |
| Farming, Fishing & Forestry | 0 (0.0%) | 11 (100.0%) |
| Construction & Extraction | 31 (100.0%) | 0 (0.0%) |
| Installation, Maintenance & Repair | 77 (100.0%) | 0 (0.0%) |
| Total (Category) | 108 (90.8%) | 11 (9.2%) |
| Total (Overall) | 494 (54.5%) | 413 (45.5%) |
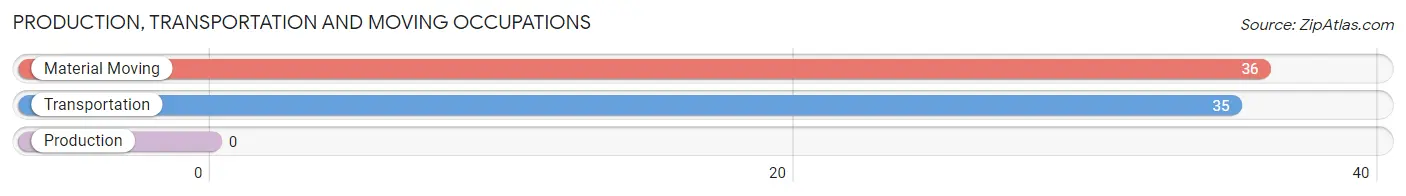
Production, Transportation and Moving Occupations
The most common Production, Transportation and Moving occupations in Richmond are Material Moving (36 | 4.0%), and Transportation (35 | 3.9%).
Production, Transportation and Moving Occupations by Sex
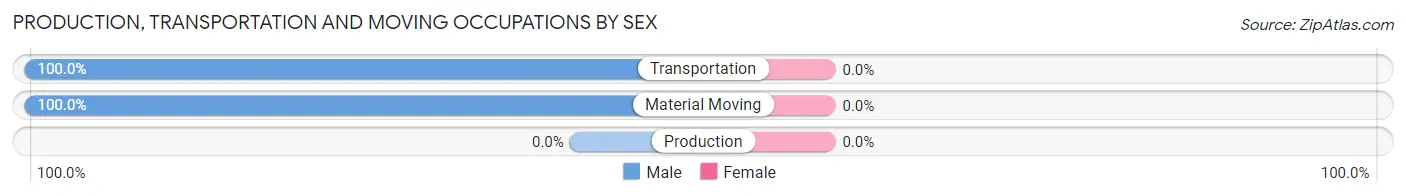
| Occupation | Male | Female |
| Production | 0 (0.0%) | 0 (0.0%) |
| Transportation | 35 (100.0%) | 0 (0.0%) |
| Material Moving | 36 (100.0%) | 0 (0.0%) |
| Total (Category) | 71 (100.0%) | 0 (0.0%) |
| Total (Overall) | 494 (54.5%) | 413 (45.5%) |
Employment Industries by Sex in Richmond
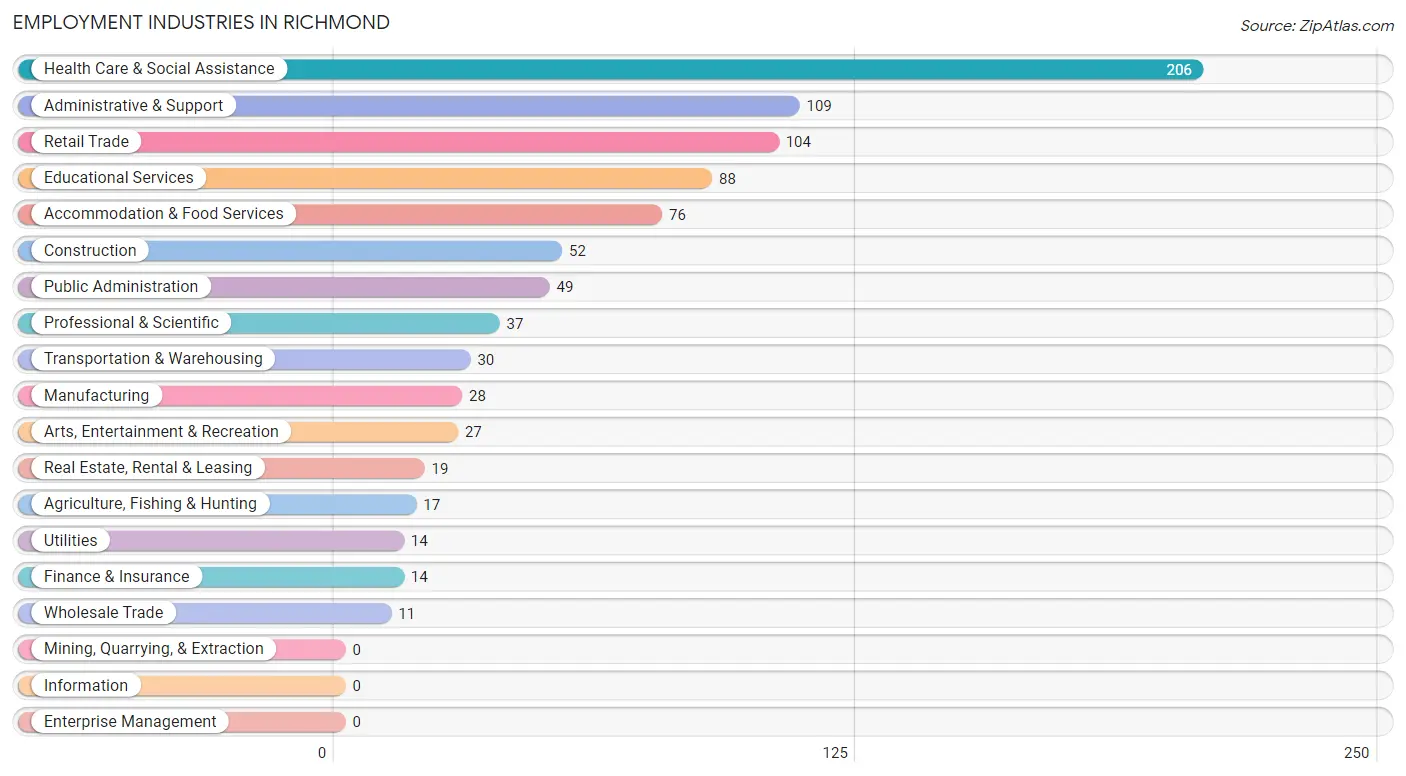
Employment Industries in Richmond
The major employment industries in Richmond include Health Care & Social Assistance (206 | 22.7%), Administrative & Support (109 | 12.0%), Retail Trade (104 | 11.5%), Educational Services (88 | 9.7%), and Accommodation & Food Services (76 | 8.4%).
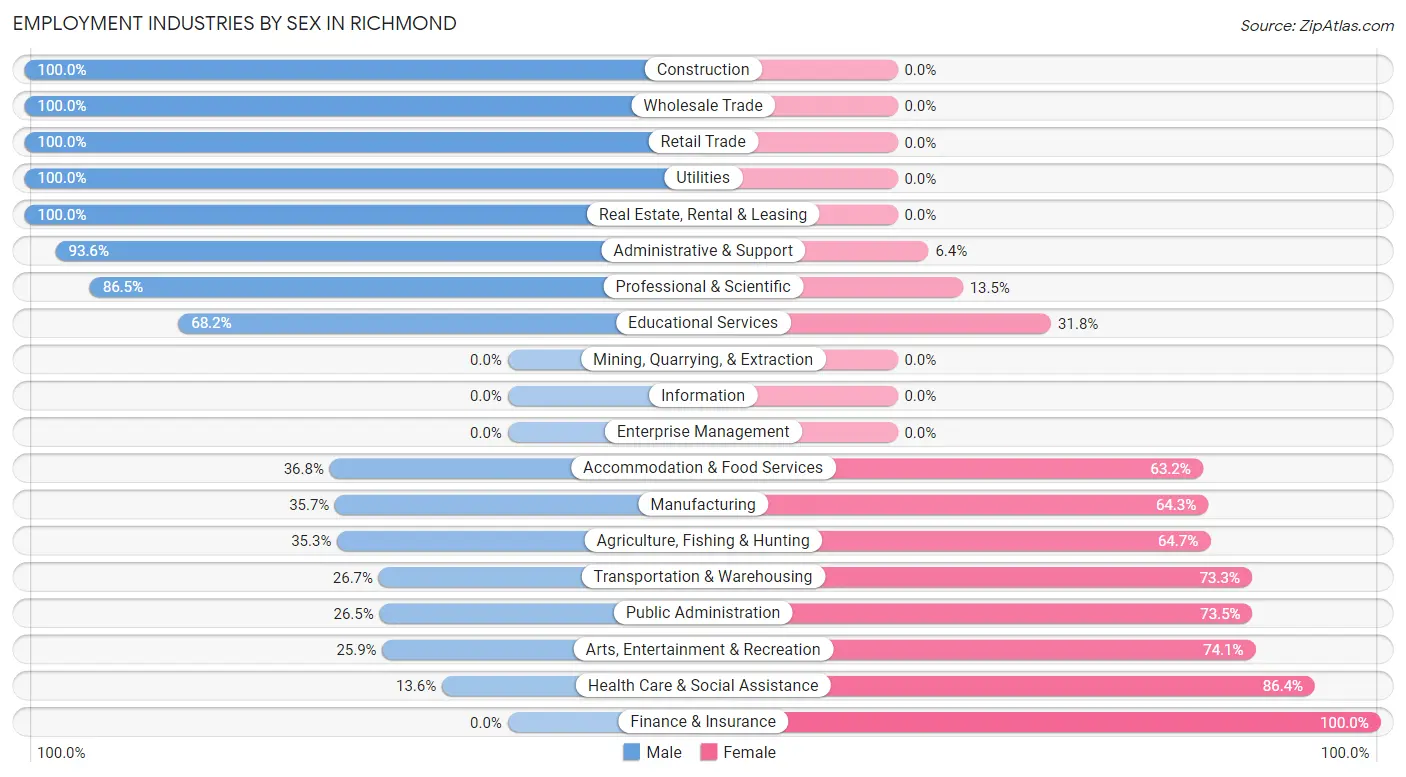
Employment Industries by Sex in Richmond
The Richmond industries that see more men than women are Construction (100.0%), Wholesale Trade (100.0%), and Retail Trade (100.0%), whereas the industries that tend to have a higher number of women are Finance & Insurance (100.0%), Health Care & Social Assistance (86.4%), and Arts, Entertainment & Recreation (74.1%).
| Industry | Male | Female |
| Agriculture, Fishing & Hunting | 6 (35.3%) | 11 (64.7%) |
| Mining, Quarrying, & Extraction | 0 (0.0%) | 0 (0.0%) |
| Construction | 52 (100.0%) | 0 (0.0%) |
| Manufacturing | 10 (35.7%) | 18 (64.3%) |
| Wholesale Trade | 11 (100.0%) | 0 (0.0%) |
| Retail Trade | 104 (100.0%) | 0 (0.0%) |
| Transportation & Warehousing | 8 (26.7%) | 22 (73.3%) |
| Utilities | 14 (100.0%) | 0 (0.0%) |
| Information | 0 (0.0%) | 0 (0.0%) |
| Finance & Insurance | 0 (0.0%) | 14 (100.0%) |
| Real Estate, Rental & Leasing | 19 (100.0%) | 0 (0.0%) |
| Professional & Scientific | 32 (86.5%) | 5 (13.5%) |
| Enterprise Management | 0 (0.0%) | 0 (0.0%) |
| Administrative & Support | 102 (93.6%) | 7 (6.4%) |
| Educational Services | 60 (68.2%) | 28 (31.8%) |
| Health Care & Social Assistance | 28 (13.6%) | 178 (86.4%) |
| Arts, Entertainment & Recreation | 7 (25.9%) | 20 (74.1%) |
| Accommodation & Food Services | 28 (36.8%) | 48 (63.2%) |
| Public Administration | 13 (26.5%) | 36 (73.5%) |
| Total | 494 (54.5%) | 413 (45.5%) |
Education in Richmond
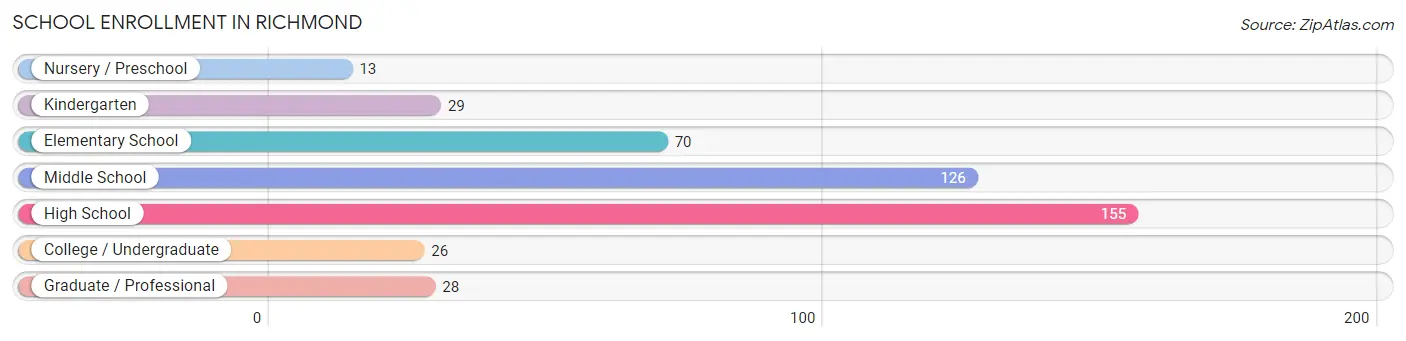
School Enrollment in Richmond
The most common levels of schooling among the 447 students in Richmond are high school (155 | 34.7%), middle school (126 | 28.2%), and elementary school (70 | 15.7%).
| School Level | # Students | % Students |
| Nursery / Preschool | 13 | 2.9% |
| Kindergarten | 29 | 6.5% |
| Elementary School | 70 | 15.7% |
| Middle School | 126 | 28.2% |
| High School | 155 | 34.7% |
| College / Undergraduate | 26 | 5.8% |
| Graduate / Professional | 28 | 6.3% |
| Total | 447 | 100.0% |
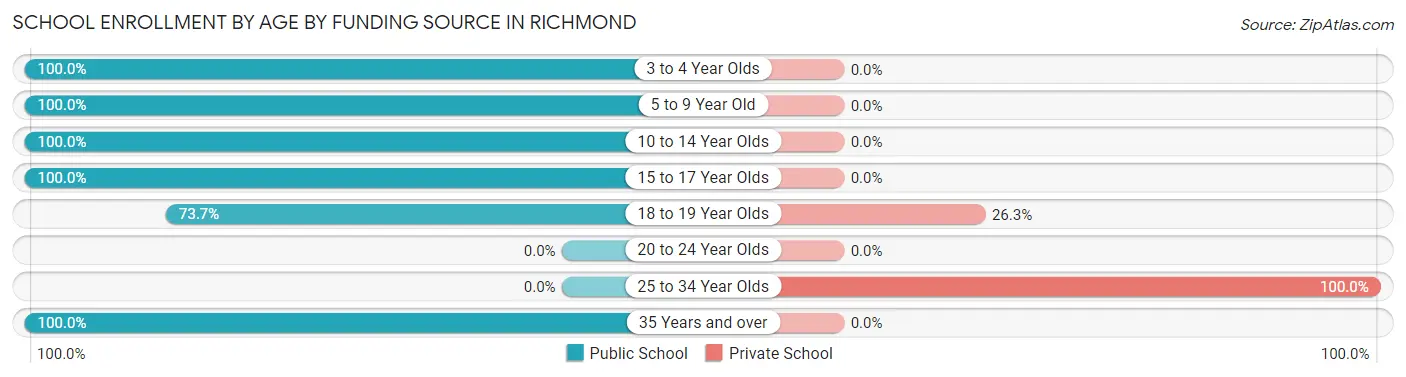
School Enrollment by Age by Funding Source in Richmond
Out of a total of 447 students who are enrolled in schools in Richmond, 38 (8.5%) attend a private institution, while the remaining 409 (91.5%) are enrolled in public schools. The age group of 25 to 34 year olds has the highest likelihood of being enrolled in private schools, with 28 (100.0% in the age bracket) enrolled. Conversely, the age group of 3 to 4 year olds has the lowest likelihood of being enrolled in a private school, with 13 (100.0% in the age bracket) attending a public institution.
| Age Bracket | Public School | Private School |
| 3 to 4 Year Olds | 13 (100.0%) | 0 (0.0%) |
| 5 to 9 Year Old | 99 (100.0%) | 0 (0.0%) |
| 10 to 14 Year Olds | 84 (100.0%) | 0 (0.0%) |
| 15 to 17 Year Olds | 179 (100.0%) | 0 (0.0%) |
| 18 to 19 Year Olds | 28 (73.7%) | 10 (26.3%) |
| 20 to 24 Year Olds | 0 (0.0%) | 0 (0.0%) |
| 25 to 34 Year Olds | 0 (0.0%) | 28 (100.0%) |
| 35 Years and over | 6 (100.0%) | 0 (0.0%) |
| Total | 409 (91.5%) | 38 (8.5%) |
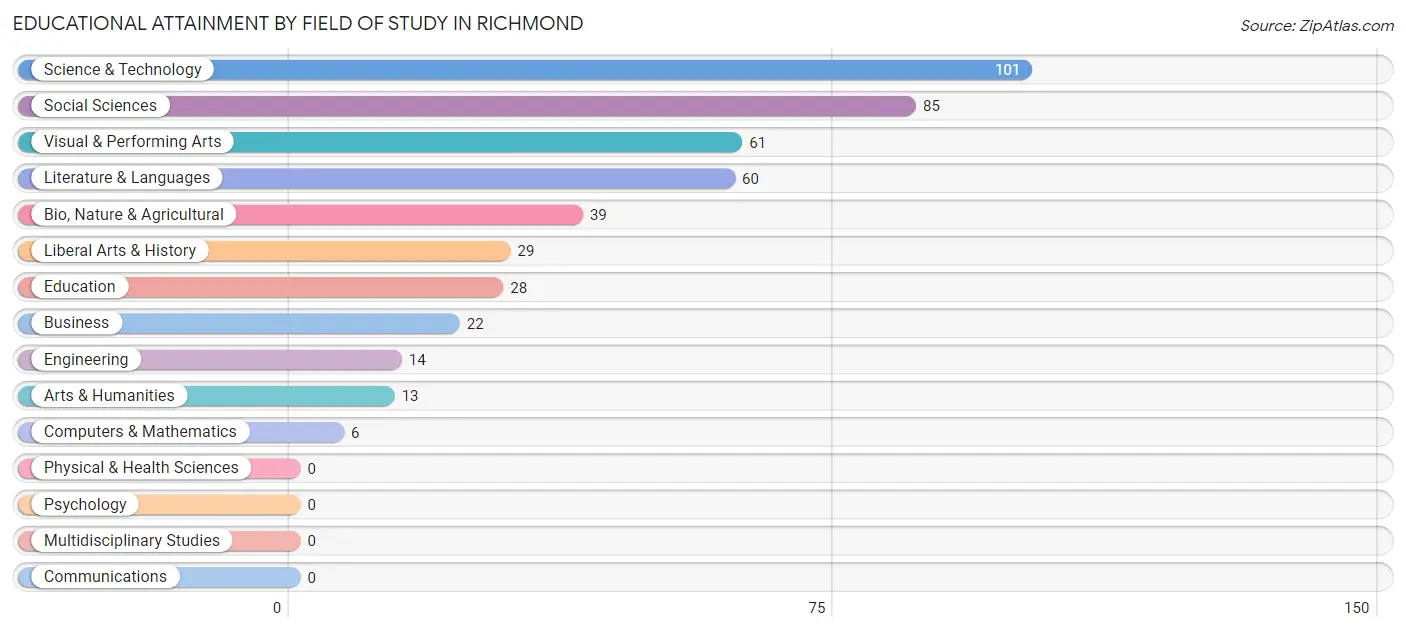
Educational Attainment by Field of Study in Richmond
Science & technology (101 | 22.1%), social sciences (85 | 18.6%), visual & performing arts (61 | 13.3%), literature & languages (60 | 13.1%), and bio, nature & agricultural (39 | 8.5%) are the most common fields of study among 458 individuals in Richmond who have obtained a bachelor's degree or higher.
| Field of Study | # Graduates | % Graduates |
| Computers & Mathematics | 6 | 1.3% |
| Bio, Nature & Agricultural | 39 | 8.5% |
| Physical & Health Sciences | 0 | 0.0% |
| Psychology | 0 | 0.0% |
| Social Sciences | 85 | 18.6% |
| Engineering | 14 | 3.1% |
| Multidisciplinary Studies | 0 | 0.0% |
| Science & Technology | 101 | 22.1% |
| Business | 22 | 4.8% |
| Education | 28 | 6.1% |
| Literature & Languages | 60 | 13.1% |
| Liberal Arts & History | 29 | 6.3% |
| Visual & Performing Arts | 61 | 13.3% |
| Communications | 0 | 0.0% |
| Arts & Humanities | 13 | 2.8% |
| Total | 458 | 100.0% |
Transportation & Commute in Richmond
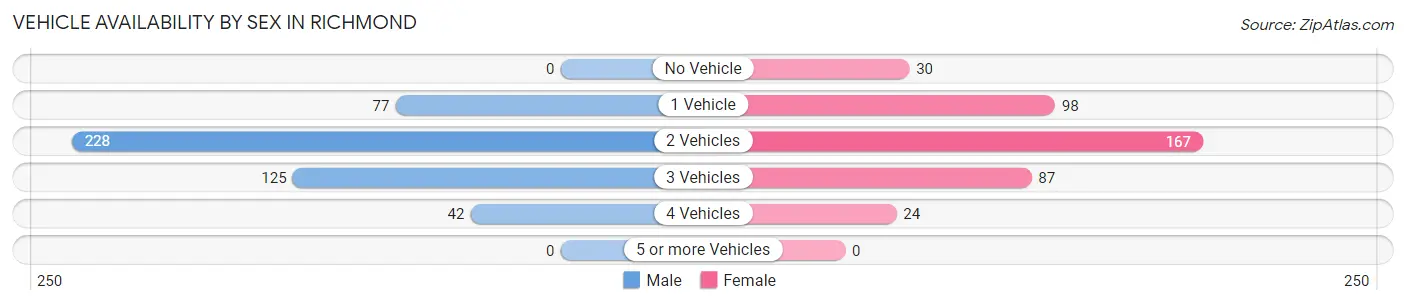
Vehicle Availability by Sex in Richmond
The most prevalent vehicle ownership categories in Richmond are males with 2 vehicles (228, accounting for 48.3%) and females with 2 vehicles (167, making up 56.2%).
| Vehicles Available | Male | Female |
| No Vehicle | 0 (0.0%) | 30 (7.4%) |
| 1 Vehicle | 77 (16.3%) | 98 (24.1%) |
| 2 Vehicles | 228 (48.3%) | 167 (41.1%) |
| 3 Vehicles | 125 (26.5%) | 87 (21.4%) |
| 4 Vehicles | 42 (8.9%) | 24 (5.9%) |
| 5 or more Vehicles | 0 (0.0%) | 0 (0.0%) |
| Total | 472 (100.0%) | 406 (100.0%) |
Commute Time in Richmond
The most frequently occuring commute durations in Richmond are 30 to 34 minutes (225 commuters, 28.0%), 25 to 29 minutes (133 commuters, 16.6%), and 5 to 9 minutes (126 commuters, 15.7%).
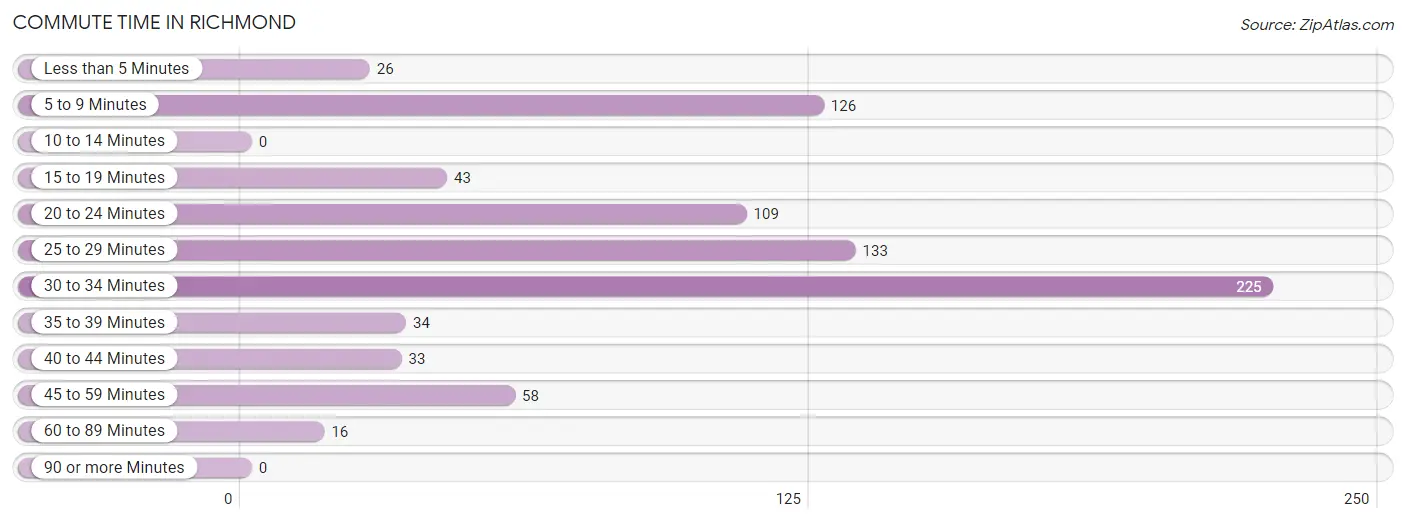
| Commute Time | # Commuters | % Commuters |
| Less than 5 Minutes | 26 | 3.2% |
| 5 to 9 Minutes | 126 | 15.7% |
| 10 to 14 Minutes | 0 | 0.0% |
| 15 to 19 Minutes | 43 | 5.3% |
| 20 to 24 Minutes | 109 | 13.6% |
| 25 to 29 Minutes | 133 | 16.6% |
| 30 to 34 Minutes | 225 | 28.0% |
| 35 to 39 Minutes | 34 | 4.2% |
| 40 to 44 Minutes | 33 | 4.1% |
| 45 to 59 Minutes | 58 | 7.2% |
| 60 to 89 Minutes | 16 | 2.0% |
| 90 or more Minutes | 0 | 0.0% |
Commute Time by Sex in Richmond
The most common commute times in Richmond are 30 to 34 minutes (115 commuters, 28.0%) for males and 30 to 34 minutes (110 commuters, 28.1%) for females.
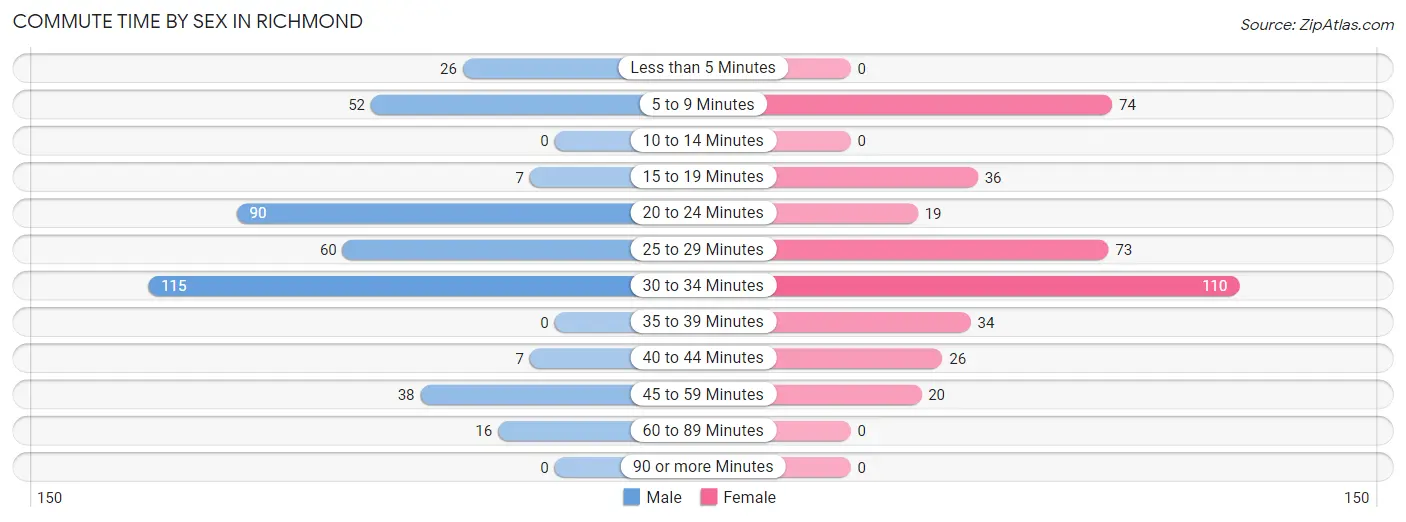
| Commute Time | Male | Female |
| Less than 5 Minutes | 26 (6.3%) | 0 (0.0%) |
| 5 to 9 Minutes | 52 (12.7%) | 74 (18.9%) |
| 10 to 14 Minutes | 0 (0.0%) | 0 (0.0%) |
| 15 to 19 Minutes | 7 (1.7%) | 36 (9.2%) |
| 20 to 24 Minutes | 90 (21.9%) | 19 (4.9%) |
| 25 to 29 Minutes | 60 (14.6%) | 73 (18.6%) |
| 30 to 34 Minutes | 115 (28.0%) | 110 (28.1%) |
| 35 to 39 Minutes | 0 (0.0%) | 34 (8.7%) |
| 40 to 44 Minutes | 7 (1.7%) | 26 (6.6%) |
| 45 to 59 Minutes | 38 (9.2%) | 20 (5.1%) |
| 60 to 89 Minutes | 16 (3.9%) | 0 (0.0%) |
| 90 or more Minutes | 0 (0.0%) | 0 (0.0%) |
Time of Departure to Work by Sex in Richmond
The most frequent times of departure to work in Richmond are 7:00 AM to 7:29 AM (117, 28.5%) for males and 6:30 AM to 6:59 AM (141, 36.0%) for females.
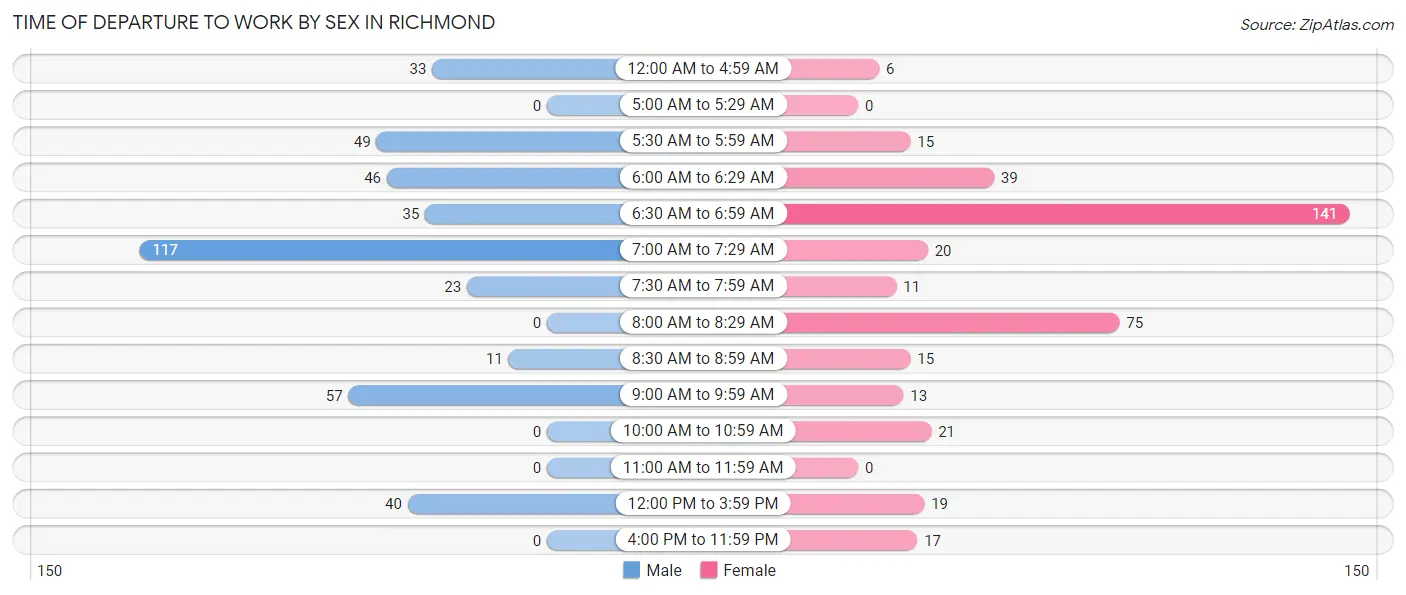
| Time of Departure | Male | Female |
| 12:00 AM to 4:59 AM | 33 (8.0%) | 6 (1.5%) |
| 5:00 AM to 5:29 AM | 0 (0.0%) | 0 (0.0%) |
| 5:30 AM to 5:59 AM | 49 (11.9%) | 15 (3.8%) |
| 6:00 AM to 6:29 AM | 46 (11.2%) | 39 (10.0%) |
| 6:30 AM to 6:59 AM | 35 (8.5%) | 141 (36.0%) |
| 7:00 AM to 7:29 AM | 117 (28.5%) | 20 (5.1%) |
| 7:30 AM to 7:59 AM | 23 (5.6%) | 11 (2.8%) |
| 8:00 AM to 8:29 AM | 0 (0.0%) | 75 (19.1%) |
| 8:30 AM to 8:59 AM | 11 (2.7%) | 15 (3.8%) |
| 9:00 AM to 9:59 AM | 57 (13.9%) | 13 (3.3%) |
| 10:00 AM to 10:59 AM | 0 (0.0%) | 21 (5.4%) |
| 11:00 AM to 11:59 AM | 0 (0.0%) | 0 (0.0%) |
| 12:00 PM to 3:59 PM | 40 (9.7%) | 19 (4.9%) |
| 4:00 PM to 11:59 PM | 0 (0.0%) | 17 (4.3%) |
| Total | 411 (100.0%) | 392 (100.0%) |
Housing Occupancy in Richmond
Occupancy by Ownership in Richmond
Of the total 746 dwellings in Richmond, owner-occupied units account for 410 (55.0%), while renter-occupied units make up 336 (45.0%).
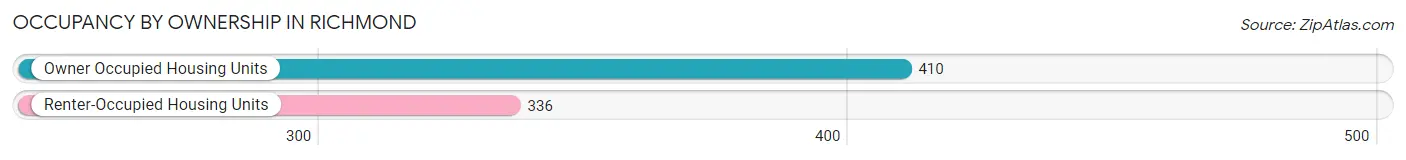
| Occupancy | # Housing Units | % Housing Units |
| Owner Occupied Housing Units | 410 | 55.0% |
| Renter-Occupied Housing Units | 336 | 45.0% |
| Total Occupied Housing Units | 746 | 100.0% |
Occupancy by Household Size in Richmond
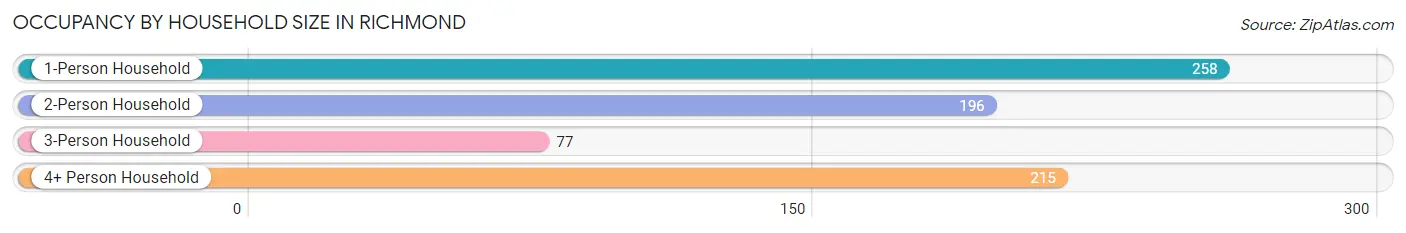
| Household Size | # Housing Units | % Housing Units |
| 1-Person Household | 258 | 34.6% |
| 2-Person Household | 196 | 26.3% |
| 3-Person Household | 77 | 10.3% |
| 4+ Person Household | 215 | 28.8% |
| Total Housing Units | 746 | 100.0% |
Occupancy by Ownership by Household Size in Richmond
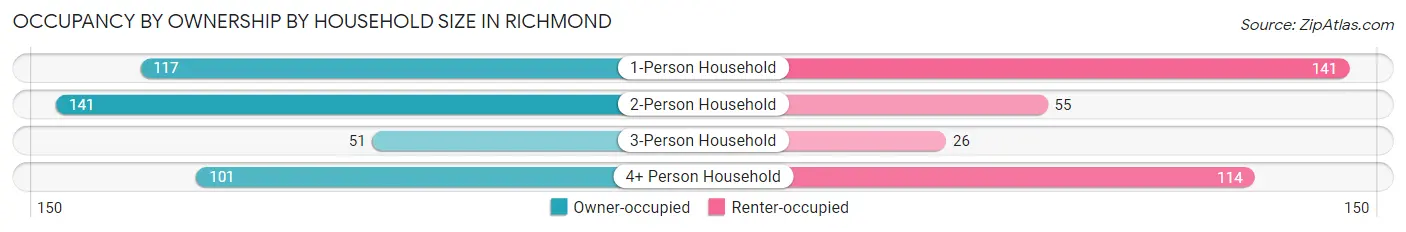
| Household Size | Owner-occupied | Renter-occupied |
| 1-Person Household | 117 (45.4%) | 141 (54.6%) |
| 2-Person Household | 141 (71.9%) | 55 (28.1%) |
| 3-Person Household | 51 (66.2%) | 26 (33.8%) |
| 4+ Person Household | 101 (47.0%) | 114 (53.0%) |
| Total Housing Units | 410 (55.0%) | 336 (45.0%) |
Occupancy by Educational Attainment in Richmond
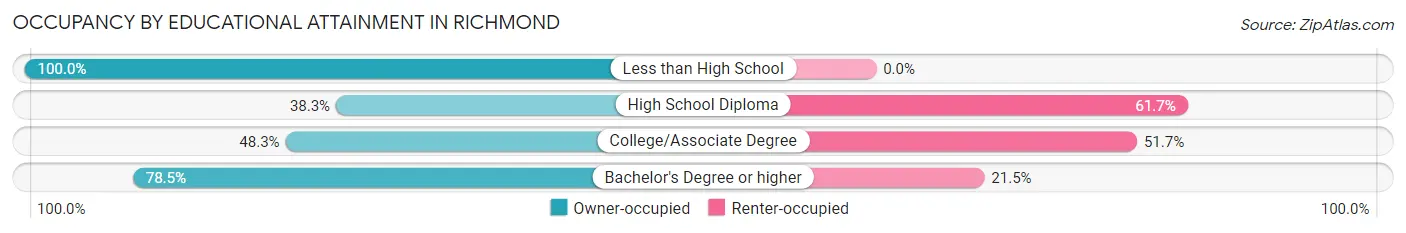
| Household Size | Owner-occupied | Renter-occupied |
| Less than High School | 7 (100.0%) | 0 (0.0%) |
| High School Diploma | 93 (38.3%) | 150 (61.7%) |
| College/Associate Degree | 127 (48.3%) | 136 (51.7%) |
| Bachelor's Degree or higher | 183 (78.5%) | 50 (21.5%) |
Occupancy by Age of Householder in Richmond
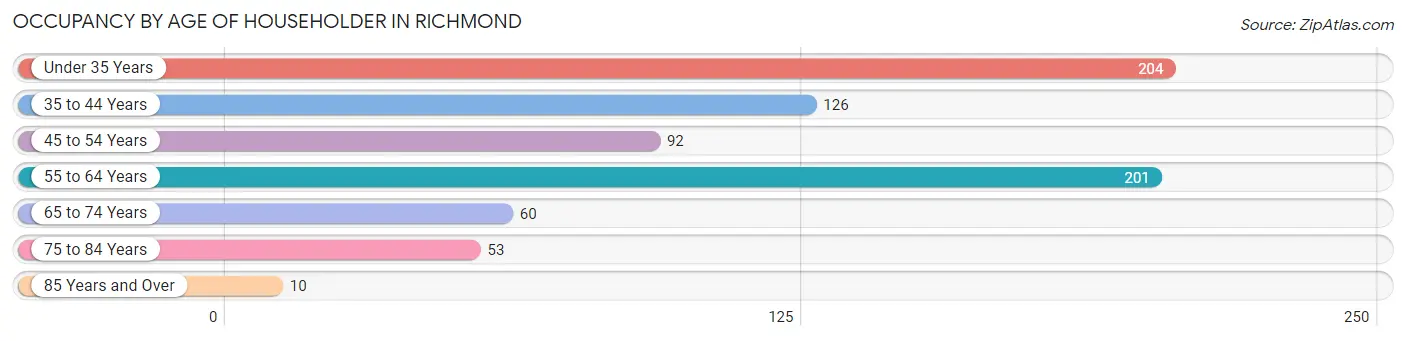
| Age Bracket | # Households | % Households |
| Under 35 Years | 204 | 27.4% |
| 35 to 44 Years | 126 | 16.9% |
| 45 to 54 Years | 92 | 12.3% |
| 55 to 64 Years | 201 | 26.9% |
| 65 to 74 Years | 60 | 8.0% |
| 75 to 84 Years | 53 | 7.1% |
| 85 Years and Over | 10 | 1.3% |
| Total | 746 | 100.0% |
Housing Finances in Richmond
Median Income by Occupancy in Richmond
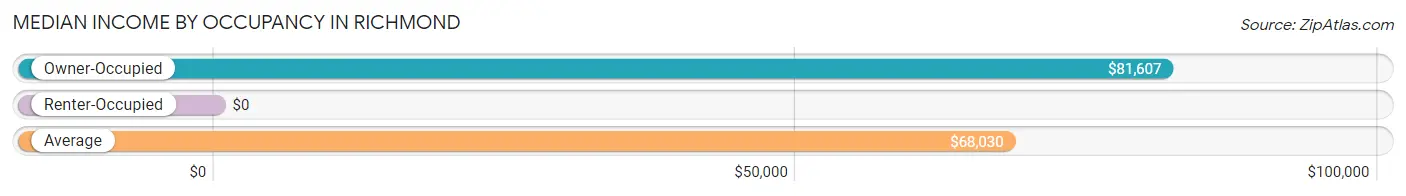
| Occupancy Type | # Households | Median Income |
| Owner-Occupied | 410 (55.0%) | $81,607 |
| Renter-Occupied | 336 (45.0%) | $0 |
| Average | 746 (100.0%) | $68,030 |
Occupancy by Householder Income Bracket in Richmond
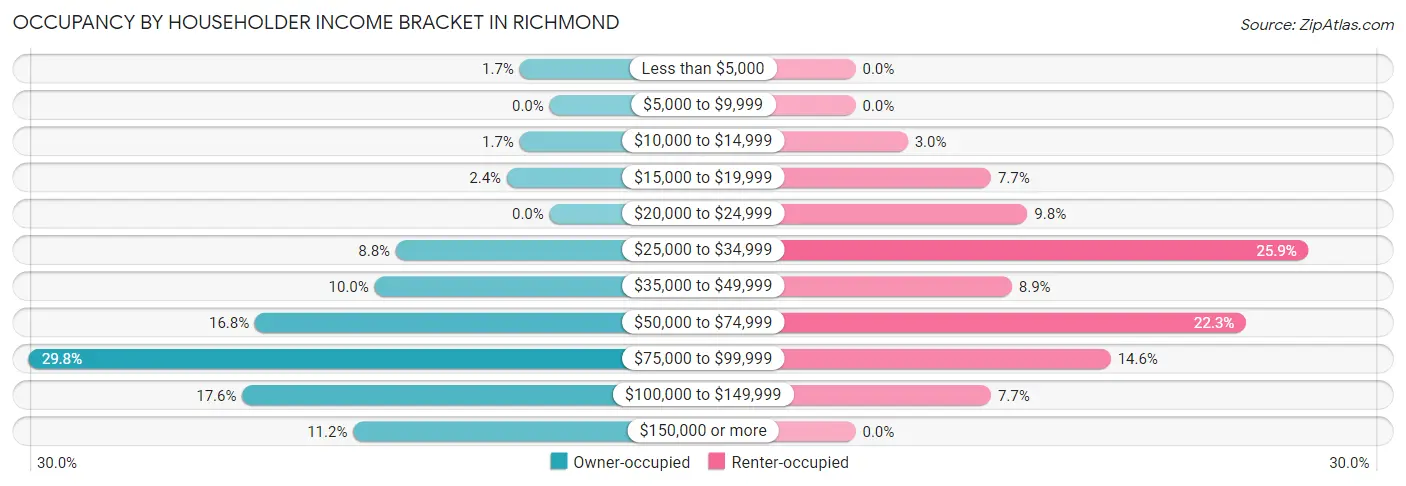
| Income Bracket | Owner-occupied | Renter-occupied |
| Less than $5,000 | 7 (1.7%) | 0 (0.0%) |
| $5,000 to $9,999 | 0 (0.0%) | 0 (0.0%) |
| $10,000 to $14,999 | 7 (1.7%) | 10 (3.0%) |
| $15,000 to $19,999 | 10 (2.4%) | 26 (7.7%) |
| $20,000 to $24,999 | 0 (0.0%) | 33 (9.8%) |
| $25,000 to $34,999 | 36 (8.8%) | 87 (25.9%) |
| $35,000 to $49,999 | 41 (10.0%) | 30 (8.9%) |
| $50,000 to $74,999 | 69 (16.8%) | 75 (22.3%) |
| $75,000 to $99,999 | 122 (29.8%) | 49 (14.6%) |
| $100,000 to $149,999 | 72 (17.6%) | 26 (7.7%) |
| $150,000 or more | 46 (11.2%) | 0 (0.0%) |
| Total | 410 (100.0%) | 336 (100.0%) |
Monthly Housing Cost Tiers in Richmond
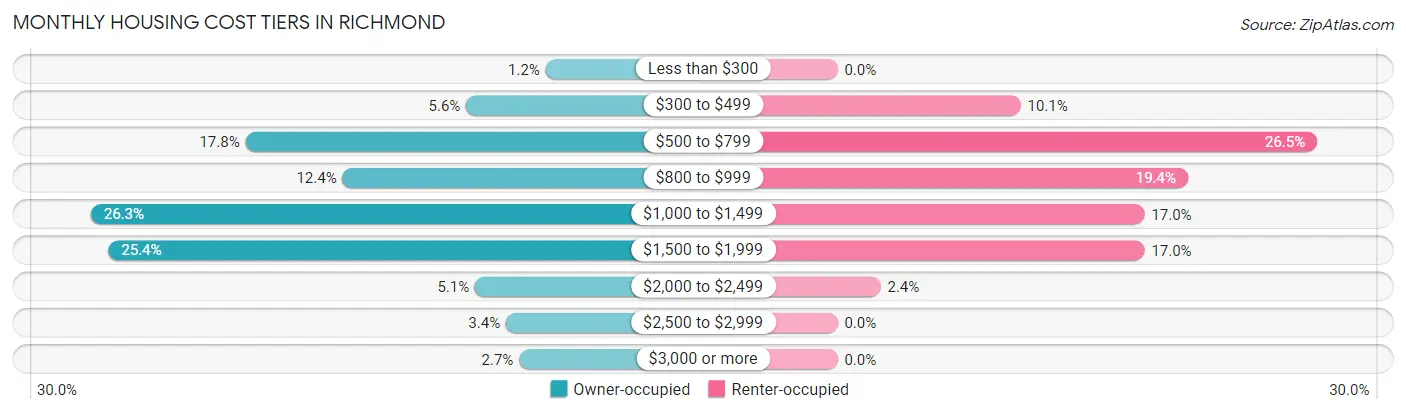
| Monthly Cost | Owner-occupied | Renter-occupied |
| Less than $300 | 5 (1.2%) | 0 (0.0%) |
| $300 to $499 | 23 (5.6%) | 34 (10.1%) |
| $500 to $799 | 73 (17.8%) | 89 (26.5%) |
| $800 to $999 | 51 (12.4%) | 65 (19.4%) |
| $1,000 to $1,499 | 108 (26.3%) | 57 (17.0%) |
| $1,500 to $1,999 | 104 (25.4%) | 57 (17.0%) |
| $2,000 to $2,499 | 21 (5.1%) | 8 (2.4%) |
| $2,500 to $2,999 | 14 (3.4%) | 0 (0.0%) |
| $3,000 or more | 11 (2.7%) | 0 (0.0%) |
| Total | 410 (100.0%) | 336 (100.0%) |
Physical Housing Characteristics in Richmond
Housing Structures in Richmond
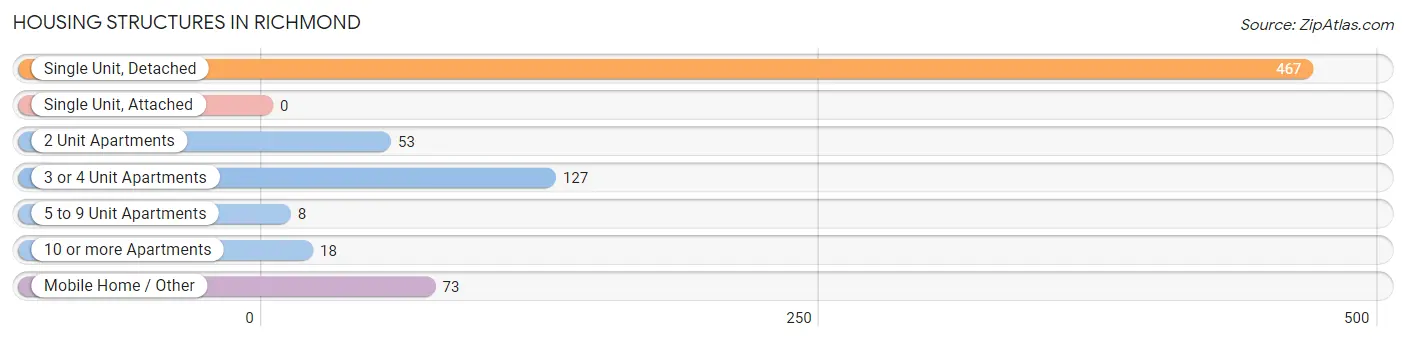
| Structure Type | # Housing Units | % Housing Units |
| Single Unit, Detached | 467 | 62.6% |
| Single Unit, Attached | 0 | 0.0% |
| 2 Unit Apartments | 53 | 7.1% |
| 3 or 4 Unit Apartments | 127 | 17.0% |
| 5 to 9 Unit Apartments | 8 | 1.1% |
| 10 or more Apartments | 18 | 2.4% |
| Mobile Home / Other | 73 | 9.8% |
| Total | 746 | 100.0% |
Housing Structures by Occupancy in Richmond
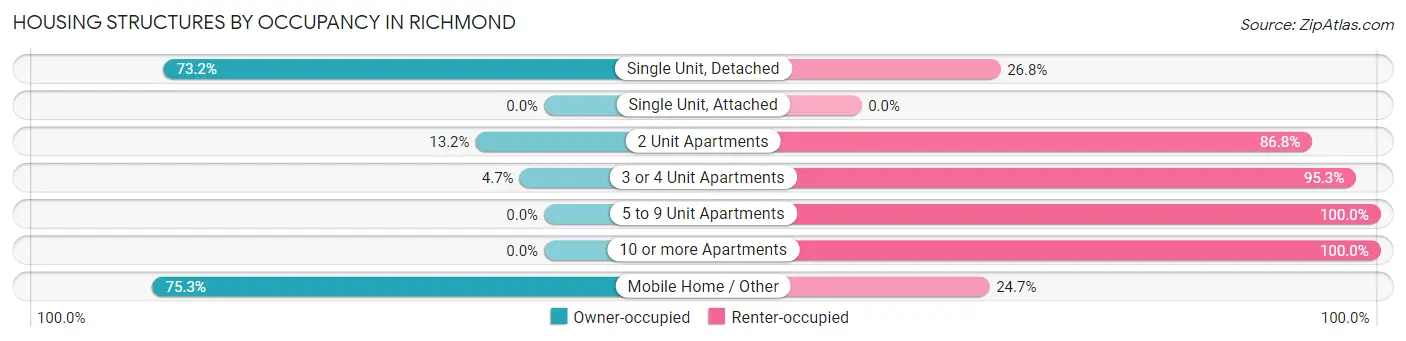
| Structure Type | Owner-occupied | Renter-occupied |
| Single Unit, Detached | 342 (73.2%) | 125 (26.8%) |
| Single Unit, Attached | 0 (0.0%) | 0 (0.0%) |
| 2 Unit Apartments | 7 (13.2%) | 46 (86.8%) |
| 3 or 4 Unit Apartments | 6 (4.7%) | 121 (95.3%) |
| 5 to 9 Unit Apartments | 0 (0.0%) | 8 (100.0%) |
| 10 or more Apartments | 0 (0.0%) | 18 (100.0%) |
| Mobile Home / Other | 55 (75.3%) | 18 (24.7%) |
| Total | 410 (55.0%) | 336 (45.0%) |
Housing Structures by Number of Rooms in Richmond
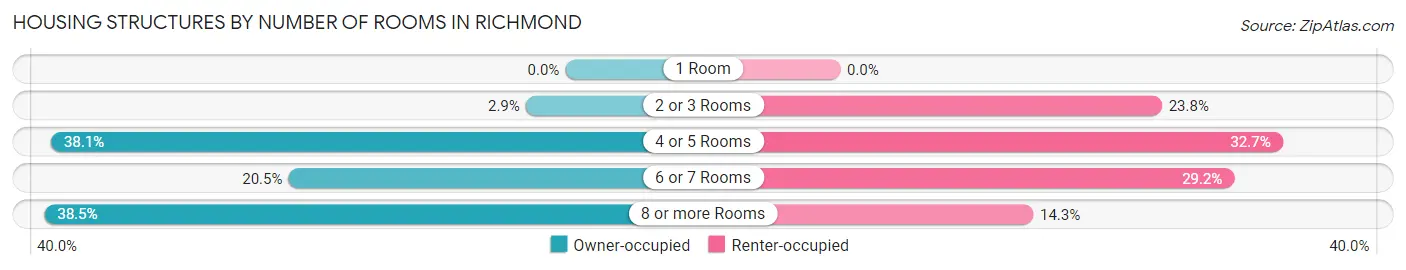
| Number of Rooms | Owner-occupied | Renter-occupied |
| 1 Room | 0 (0.0%) | 0 (0.0%) |
| 2 or 3 Rooms | 12 (2.9%) | 80 (23.8%) |
| 4 or 5 Rooms | 156 (38.1%) | 110 (32.7%) |
| 6 or 7 Rooms | 84 (20.5%) | 98 (29.2%) |
| 8 or more Rooms | 158 (38.5%) | 48 (14.3%) |
| Total | 410 (100.0%) | 336 (100.0%) |
Housing Structure by Heating Type in Richmond
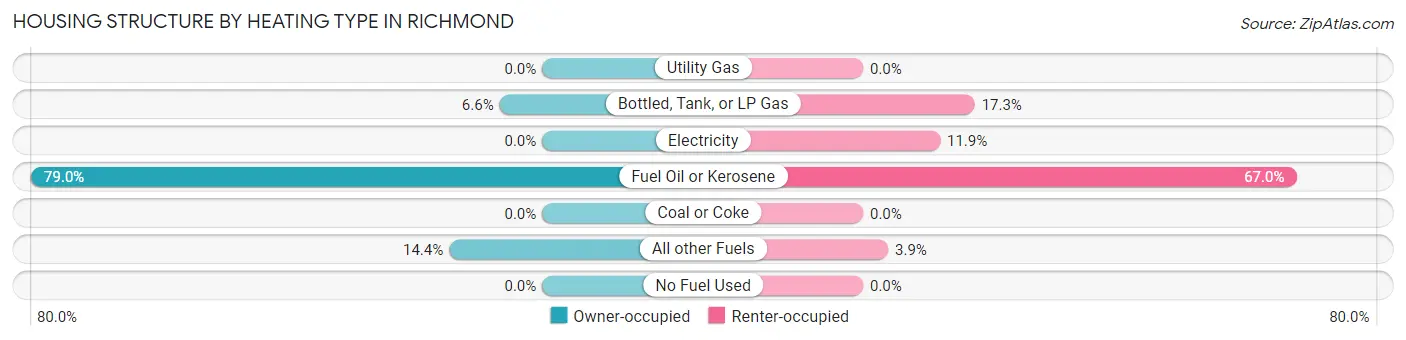
| Heating Type | Owner-occupied | Renter-occupied |
| Utility Gas | 0 (0.0%) | 0 (0.0%) |
| Bottled, Tank, or LP Gas | 27 (6.6%) | 58 (17.3%) |
| Electricity | 0 (0.0%) | 40 (11.9%) |
| Fuel Oil or Kerosene | 324 (79.0%) | 225 (67.0%) |
| Coal or Coke | 0 (0.0%) | 0 (0.0%) |
| All other Fuels | 59 (14.4%) | 13 (3.9%) |
| No Fuel Used | 0 (0.0%) | 0 (0.0%) |
| Total | 410 (100.0%) | 336 (100.0%) |
Household Vehicle Usage in Richmond
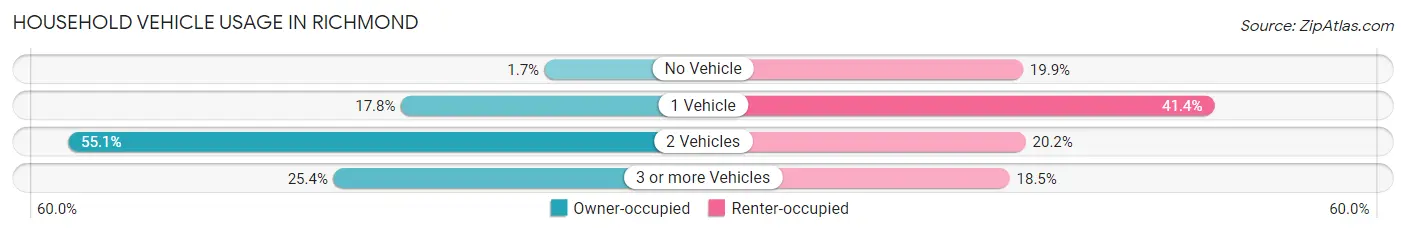
| Vehicles per Household | Owner-occupied | Renter-occupied |
| No Vehicle | 7 (1.7%) | 67 (19.9%) |
| 1 Vehicle | 73 (17.8%) | 139 (41.4%) |
| 2 Vehicles | 226 (55.1%) | 68 (20.2%) |
| 3 or more Vehicles | 104 (25.4%) | 62 (18.4%) |
| Total | 410 (100.0%) | 336 (100.0%) |
Real Estate & Mortgages in Richmond
Real Estate and Mortgage Overview in Richmond
| Characteristic | Without Mortgage | With Mortgage |
| Housing Units | 113 | 297 |
| Median Property Value | $218,100 | $194,300 |
| Median Household Income | $66,193 | $39 |
| Monthly Housing Costs | $571 | $11 |
| Real Estate Taxes | $2,750 | $0 |
Property Value by Mortgage Status in Richmond
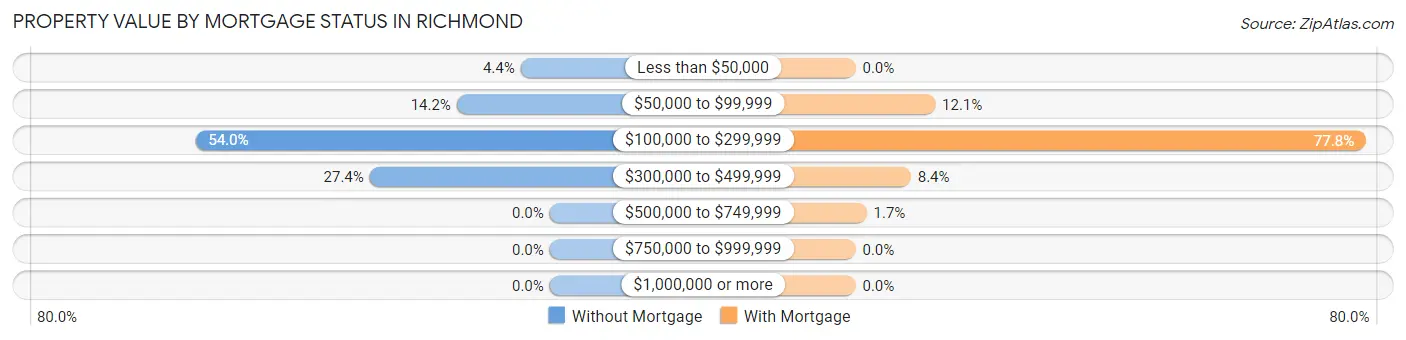
| Property Value | Without Mortgage | With Mortgage |
| Less than $50,000 | 5 (4.4%) | 0 (0.0%) |
| $50,000 to $99,999 | 16 (14.2%) | 36 (12.1%) |
| $100,000 to $299,999 | 61 (54.0%) | 231 (77.8%) |
| $300,000 to $499,999 | 31 (27.4%) | 25 (8.4%) |
| $500,000 to $749,999 | 0 (0.0%) | 5 (1.7%) |
| $750,000 to $999,999 | 0 (0.0%) | 0 (0.0%) |
| $1,000,000 or more | 0 (0.0%) | 0 (0.0%) |
| Total | 113 (100.0%) | 297 (100.0%) |
Household Income by Mortgage Status in Richmond
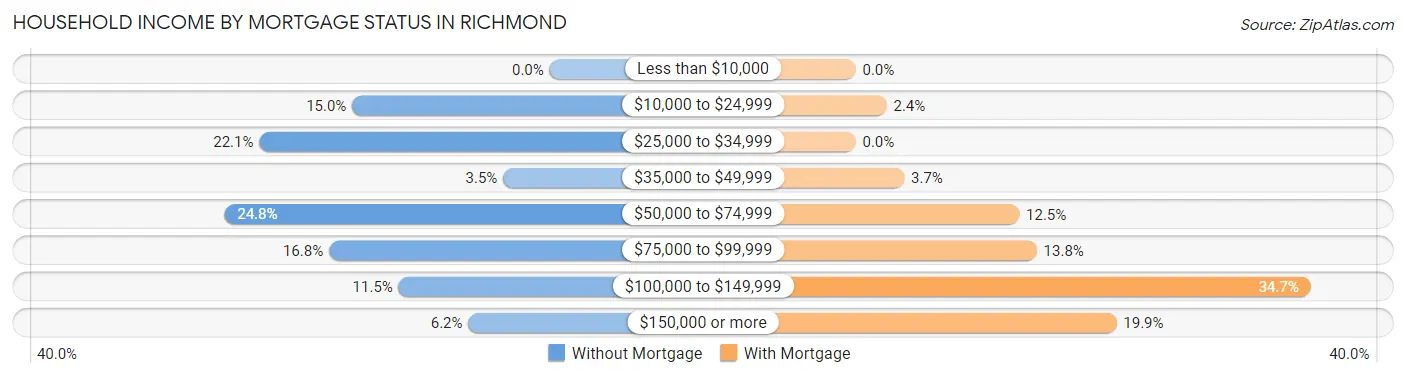
| Household Income | Without Mortgage | With Mortgage |
| Less than $10,000 | 0 (0.0%) | 0 (0.0%) |
| $10,000 to $24,999 | 17 (15.0%) | 7 (2.4%) |
| $25,000 to $34,999 | 25 (22.1%) | 0 (0.0%) |
| $35,000 to $49,999 | 4 (3.5%) | 11 (3.7%) |
| $50,000 to $74,999 | 28 (24.8%) | 37 (12.5%) |
| $75,000 to $99,999 | 19 (16.8%) | 41 (13.8%) |
| $100,000 to $149,999 | 13 (11.5%) | 103 (34.7%) |
| $150,000 or more | 7 (6.2%) | 59 (19.9%) |
| Total | 113 (100.0%) | 297 (100.0%) |
Property Value to Household Income Ratio in Richmond
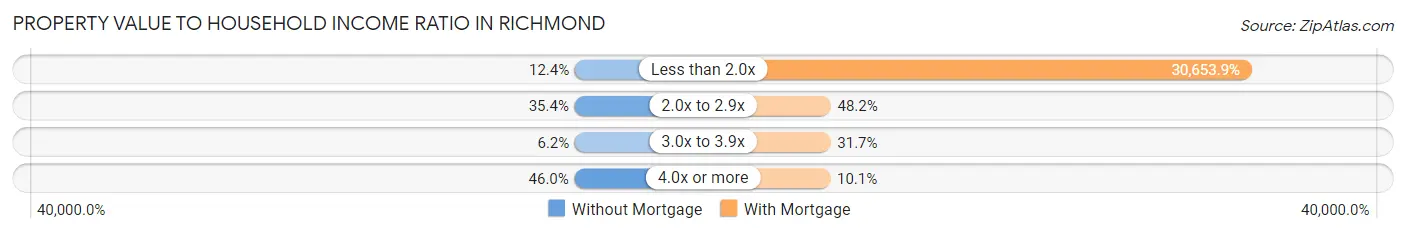
| Value-to-Income Ratio | Without Mortgage | With Mortgage |
| Less than 2.0x | 14 (12.4%) | 91,042 (30,653.9%) |
| 2.0x to 2.9x | 40 (35.4%) | 143 (48.1%) |
| 3.0x to 3.9x | 7 (6.2%) | 94 (31.7%) |
| 4.0x or more | 52 (46.0%) | 30 (10.1%) |
| Total | 113 (100.0%) | 297 (100.0%) |
Real Estate Taxes by Mortgage Status in Richmond
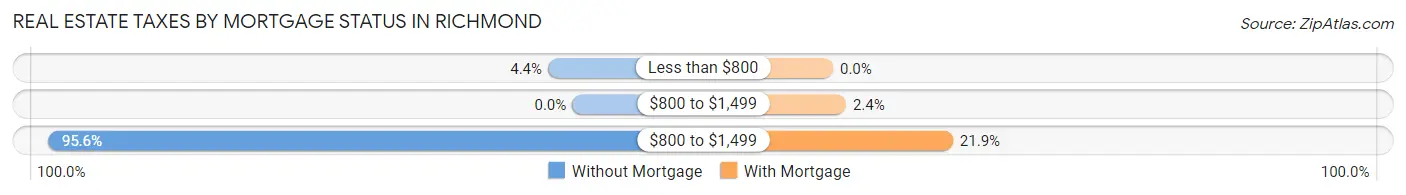
| Property Taxes | Without Mortgage | With Mortgage |
| Less than $800 | 5 (4.4%) | 0 (0.0%) |
| $800 to $1,499 | 0 (0.0%) | 7 (2.4%) |
| $800 to $1,499 | 108 (95.6%) | 65 (21.9%) |
| Total | 113 (100.0%) | 297 (100.0%) |
Health & Disability in Richmond
Health Insurance Coverage by Age in Richmond
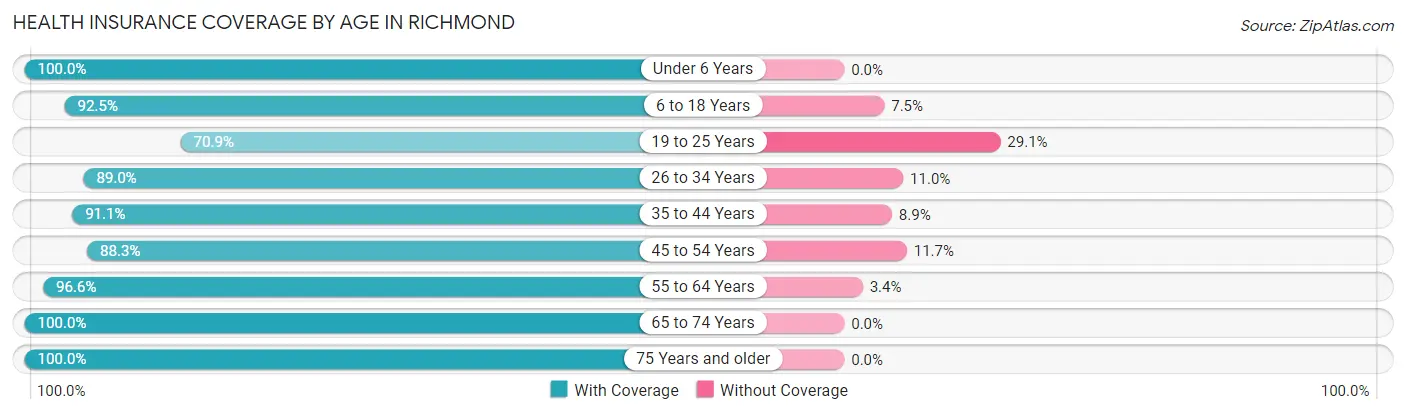
| Age Bracket | With Coverage | Without Coverage |
| Under 6 Years | 186 (100.0%) | 0 (0.0%) |
| 6 to 18 Years | 372 (92.5%) | 30 (7.5%) |
| 19 to 25 Years | 112 (70.9%) | 46 (29.1%) |
| 26 to 34 Years | 219 (89.0%) | 27 (11.0%) |
| 35 to 44 Years | 195 (91.1%) | 19 (8.9%) |
| 45 to 54 Years | 144 (88.3%) | 19 (11.7%) |
| 55 to 64 Years | 253 (96.6%) | 9 (3.4%) |
| 65 to 74 Years | 107 (100.0%) | 0 (0.0%) |
| 75 Years and older | 94 (100.0%) | 0 (0.0%) |
| Total | 1,682 (91.8%) | 150 (8.2%) |
Health Insurance Coverage by Citizenship Status in Richmond
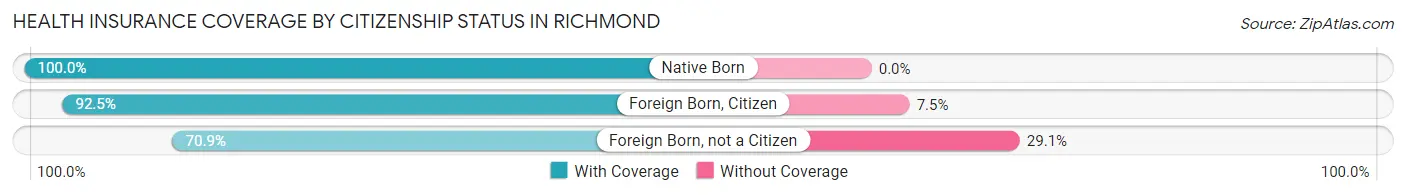
| Citizenship Status | With Coverage | Without Coverage |
| Native Born | 186 (100.0%) | 0 (0.0%) |
| Foreign Born, Citizen | 372 (92.5%) | 30 (7.5%) |
| Foreign Born, not a Citizen | 112 (70.9%) | 46 (29.1%) |
Health Insurance Coverage by Household Income in Richmond
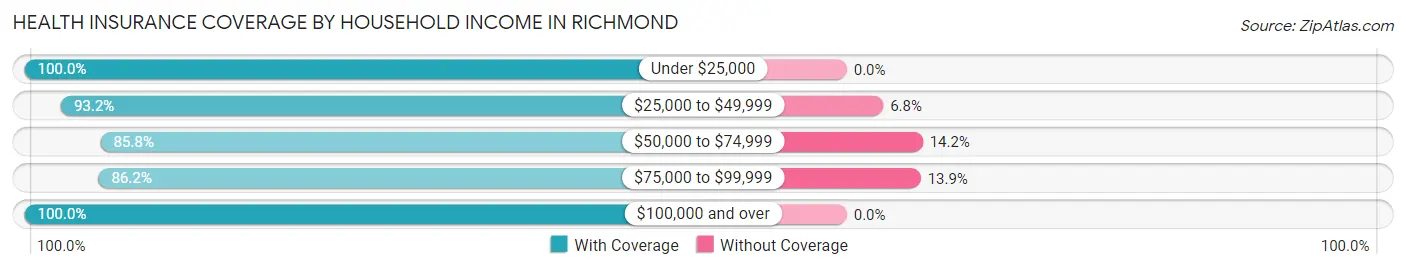
| Household Income | With Coverage | Without Coverage |
| Under $25,000 | 106 (100.0%) | 0 (0.0%) |
| $25,000 to $49,999 | 369 (93.2%) | 27 (6.8%) |
| $50,000 to $74,999 | 362 (85.8%) | 60 (14.2%) |
| $75,000 to $99,999 | 392 (86.2%) | 63 (13.9%) |
| $100,000 and over | 431 (100.0%) | 0 (0.0%) |
Public vs Private Health Insurance Coverage by Age in Richmond
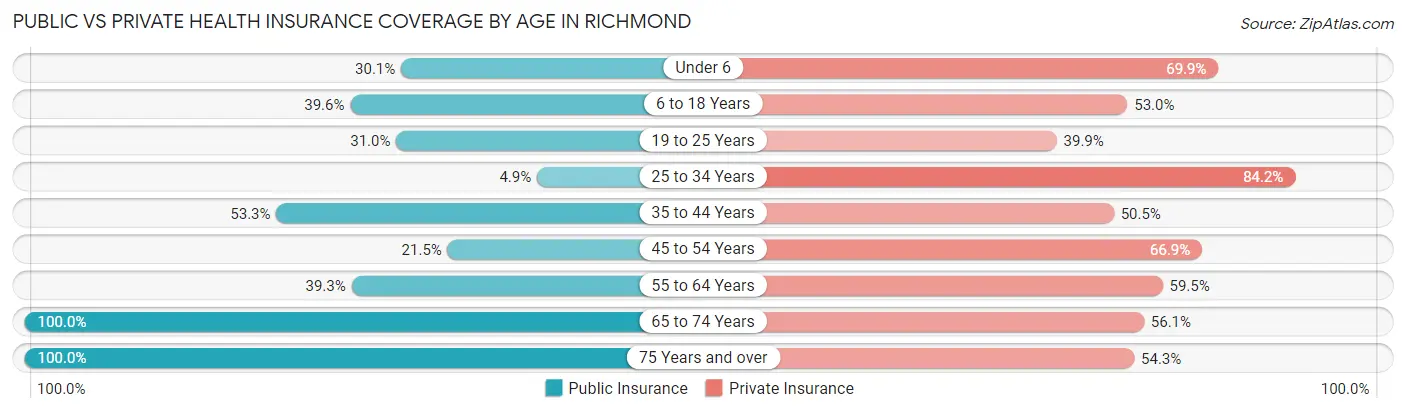
| Age Bracket | Public Insurance | Private Insurance |
| Under 6 | 56 (30.1%) | 130 (69.9%) |
| 6 to 18 Years | 159 (39.6%) | 213 (53.0%) |
| 19 to 25 Years | 49 (31.0%) | 63 (39.9%) |
| 25 to 34 Years | 12 (4.9%) | 207 (84.2%) |
| 35 to 44 Years | 114 (53.3%) | 108 (50.5%) |
| 45 to 54 Years | 35 (21.5%) | 109 (66.9%) |
| 55 to 64 Years | 103 (39.3%) | 156 (59.5%) |
| 65 to 74 Years | 107 (100.0%) | 60 (56.1%) |
| 75 Years and over | 94 (100.0%) | 51 (54.3%) |
| Total | 729 (39.8%) | 1,097 (59.9%) |
Disability Status by Sex by Age in Richmond
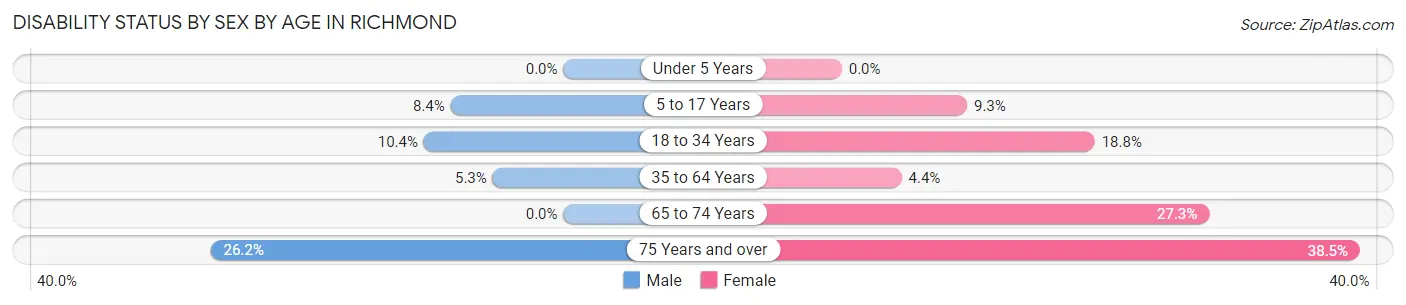
| Age Bracket | Male | Female |
| Under 5 Years | 0 (0.0%) | 0 (0.0%) |
| 5 to 17 Years | 18 (8.4%) | 16 (9.3%) |
| 18 to 34 Years | 26 (10.4%) | 34 (18.8%) |
| 35 to 64 Years | 17 (5.2%) | 14 (4.4%) |
| 65 to 74 Years | 0 (0.0%) | 18 (27.3%) |
| 75 Years and over | 11 (26.2%) | 20 (38.5%) |
Disability Class by Sex by Age in Richmond
Disability Class: Hearing Difficulty
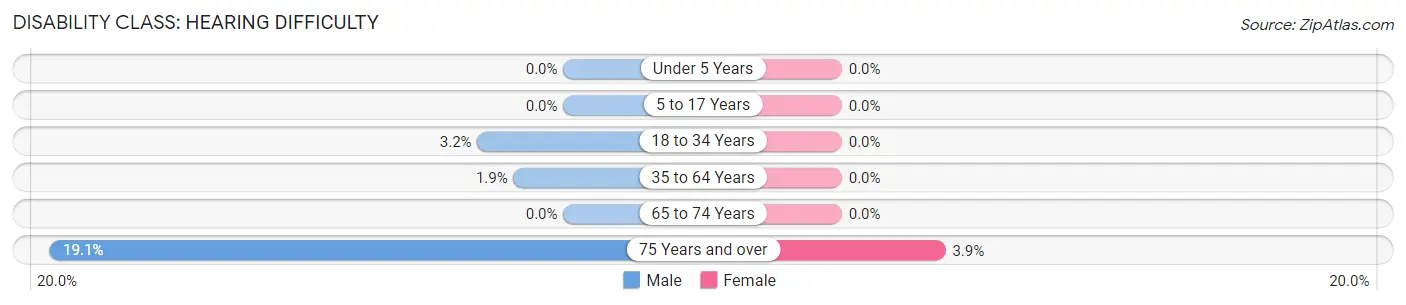
| Age Bracket | Male | Female |
| Under 5 Years | 0 (0.0%) | 0 (0.0%) |
| 5 to 17 Years | 0 (0.0%) | 0 (0.0%) |
| 18 to 34 Years | 8 (3.2%) | 0 (0.0%) |
| 35 to 64 Years | 6 (1.8%) | 0 (0.0%) |
| 65 to 74 Years | 0 (0.0%) | 0 (0.0%) |
| 75 Years and over | 8 (19.1%) | 2 (3.8%) |
Disability Class: Vision Difficulty
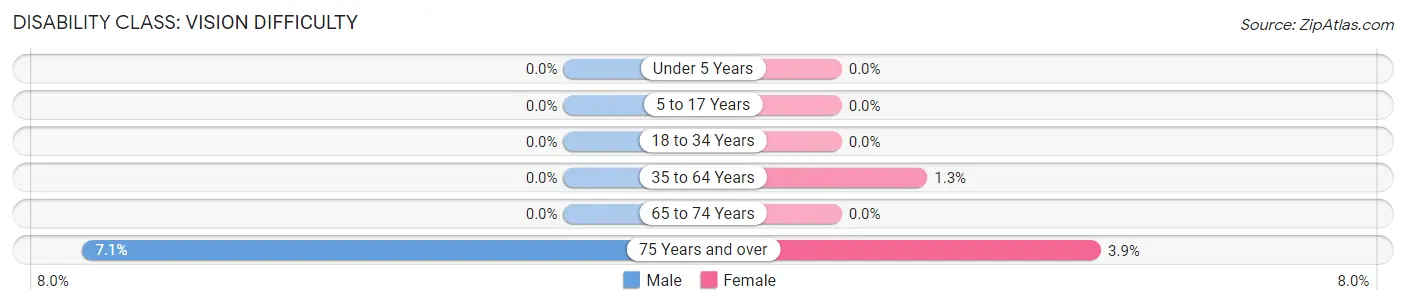
| Age Bracket | Male | Female |
| Under 5 Years | 0 (0.0%) | 0 (0.0%) |
| 5 to 17 Years | 0 (0.0%) | 0 (0.0%) |
| 18 to 34 Years | 0 (0.0%) | 0 (0.0%) |
| 35 to 64 Years | 0 (0.0%) | 4 (1.3%) |
| 65 to 74 Years | 0 (0.0%) | 0 (0.0%) |
| 75 Years and over | 3 (7.1%) | 2 (3.8%) |
Disability Class: Cognitive Difficulty
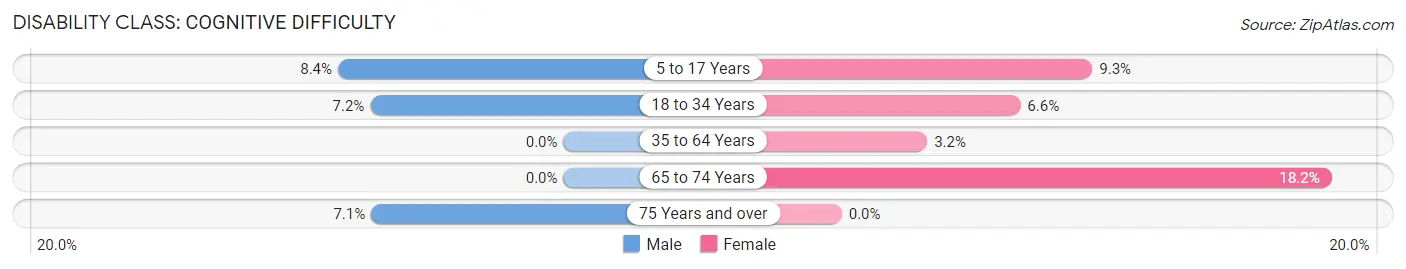
| Age Bracket | Male | Female |
| 5 to 17 Years | 18 (8.4%) | 16 (9.3%) |
| 18 to 34 Years | 18 (7.2%) | 12 (6.6%) |
| 35 to 64 Years | 0 (0.0%) | 10 (3.2%) |
| 65 to 74 Years | 0 (0.0%) | 12 (18.2%) |
| 75 Years and over | 3 (7.1%) | 0 (0.0%) |
Disability Class: Ambulatory Difficulty
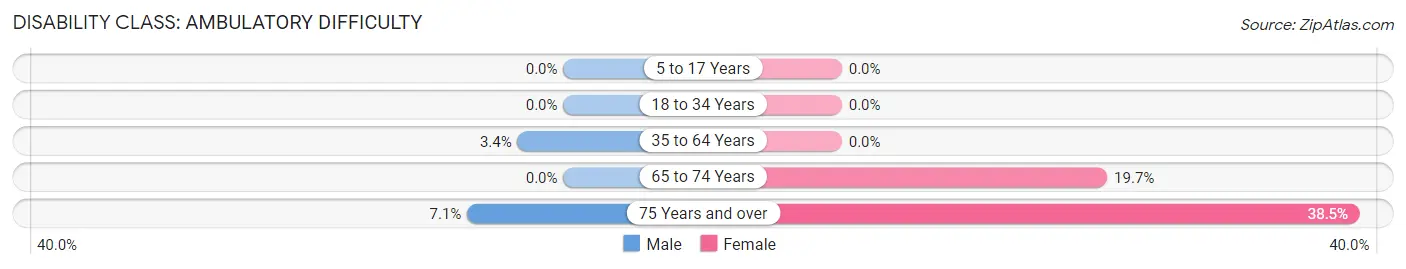
| Age Bracket | Male | Female |
| 5 to 17 Years | 0 (0.0%) | 0 (0.0%) |
| 18 to 34 Years | 0 (0.0%) | 0 (0.0%) |
| 35 to 64 Years | 11 (3.4%) | 0 (0.0%) |
| 65 to 74 Years | 0 (0.0%) | 13 (19.7%) |
| 75 Years and over | 3 (7.1%) | 20 (38.5%) |
Disability Class: Self-Care Difficulty
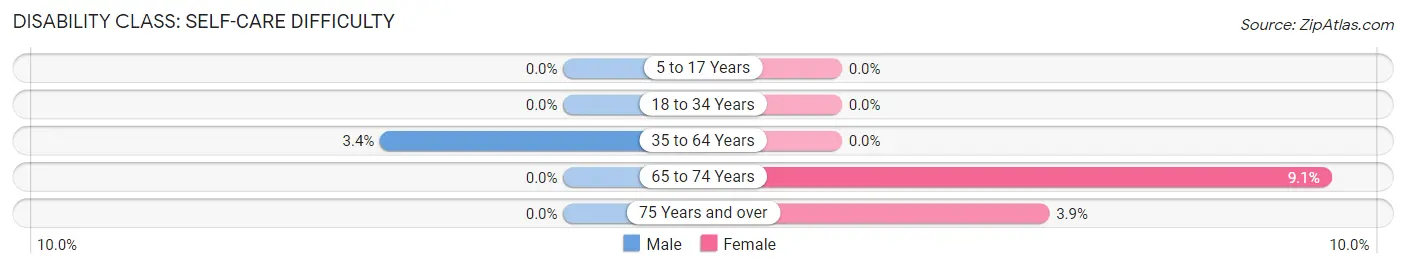
| Age Bracket | Male | Female |
| 5 to 17 Years | 0 (0.0%) | 0 (0.0%) |
| 18 to 34 Years | 0 (0.0%) | 0 (0.0%) |
| 35 to 64 Years | 11 (3.4%) | 0 (0.0%) |
| 65 to 74 Years | 0 (0.0%) | 6 (9.1%) |
| 75 Years and over | 0 (0.0%) | 2 (3.8%) |
Technology Access in Richmond
Computing Device Access in Richmond
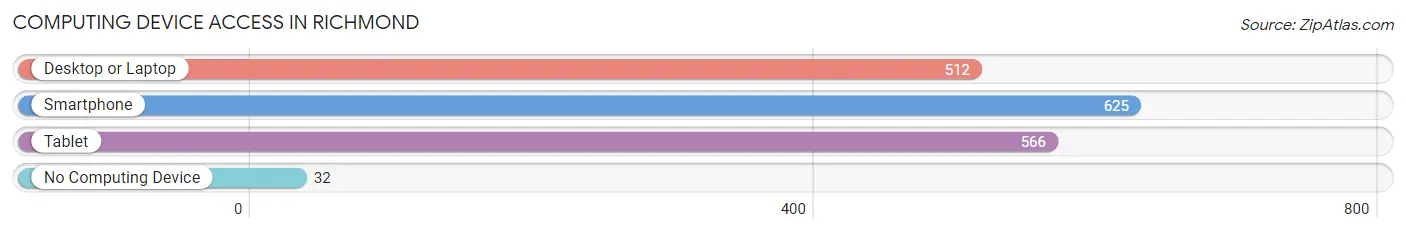
| Device Type | # Households | % Households |
| Desktop or Laptop | 512 | 68.6% |
| Smartphone | 625 | 83.8% |
| Tablet | 566 | 75.9% |
| No Computing Device | 32 | 4.3% |
| Total | 746 | 100.0% |
Internet Access in Richmond
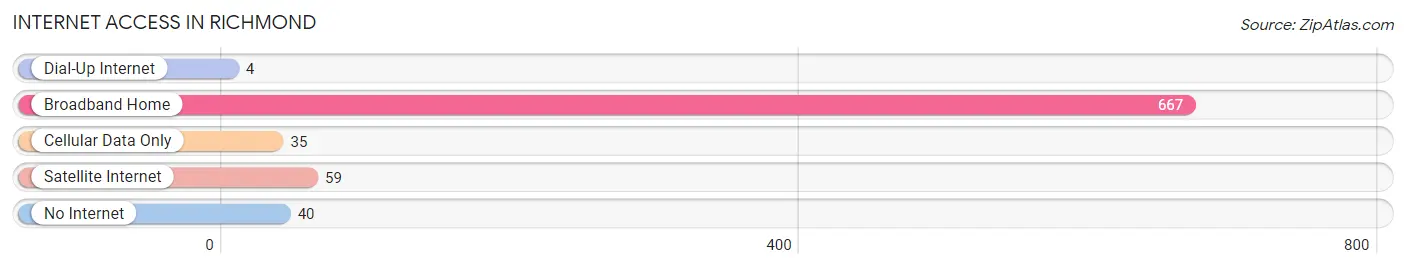
| Internet Type | # Households | % Households |
| Dial-Up Internet | 4 | 0.5% |
| Broadband Home | 667 | 89.4% |
| Cellular Data Only | 35 | 4.7% |
| Satellite Internet | 59 | 7.9% |
| No Internet | 40 | 5.4% |
| Total | 746 | 100.0% |
Richmond Summary
Richmond, Maine is a small town located in Sagadahoc County, in the state of Maine. It is situated on the banks of the Kennebec River, and is part of the Portland-South Portland-Biddeford metropolitan area. The town has a population of 4,085, as of the 2010 census, and is the second-largest town in Sagadahoc County.
History
Richmond was first settled in 1719 by a group of English settlers from the Plymouth Colony. The town was originally known as Bowdoinham Plantation, and was incorporated in 1768 as Richmond. The town was named after Charles Lennox, 3rd Duke of Richmond, who was a British politician and military leader.
The town was an important port in the early 19th century, and was home to several shipbuilding yards. The town was also a major center for the lumber industry, and was home to several sawmills.
Geography
Richmond is located in Sagadahoc County, in the state of Maine. It is situated on the banks of the Kennebec River, and is part of the Portland-South Portland-Biddeford metropolitan area. The town has a total area of 28.2 square miles, of which 27.7 square miles is land and 0.5 square miles is water.
The town is bordered by Bowdoin to the north, Dresden to the east, Bowdoinham to the south, and West Bath to the west. The town is located approximately 20 miles northeast of Portland, and is accessible via Interstate 295 and U.S. Route 201.
Economy
Richmond’s economy is largely based on the service industry, with many residents employed in retail, healthcare, and education. The town is also home to several small businesses, including a lumber mill, a boatyard, and a marina.
The town is also home to several tourist attractions, including the Richmond Historical Society Museum, the Richmond Town Hall, and the Richmond Congregational Church.
Demographics
As of the 2010 census, there were 4,085 people, 1,619 households, and 1,097 families residing in the town. The population density was 146.7 people per square mile. The racial makeup of the town was 97.2% White, 0.5% African American, 0.3% Native American, 0.4% Asian, 0.1% Pacific Islander, 0.3% from other races, and 1.2% from two or more races. Hispanic or Latino of any race were 1.2% of the population.
The median income for a household in the town was $41,944, and the median income for a family was $50,938. The per capita income for the town was $20,945. About 8.3% of families and 11.2% of the population were below the poverty line, including 15.2% of those under age 18 and 8.2% of those age 65 or over.
Common Questions
What is Per Capita Income in Richmond?
Per Capita income in Richmond is $28,724.
What is the Median Family Income in Richmond?
Median Family Income in Richmond is $68,728.
What is the Median Household income in Richmond?
Median Household Income in Richmond is $68,030.
What is Income or Wage Gap in Richmond?
Income or Wage Gap in Richmond is 35.3%.
Women in Richmond earn 64.7 cents for every dollar earned by a man.
What is Inequality or Gini Index in Richmond?
Inequality or Gini Index in Richmond is 0.34.
What is the Total Population of Richmond?
Total Population of Richmond is 1,835.
What is the Total Male Population of Richmond?
Total Male Population of Richmond is 1,004.
What is the Total Female Population of Richmond?
Total Female Population of Richmond is 831.
What is the Ratio of Males per 100 Females in Richmond?
There are 120.82 Males per 100 Females in Richmond.
What is the Ratio of Females per 100 Males in Richmond?
There are 82.77 Females per 100 Males in Richmond.
What is the Median Population Age in Richmond?
Median Population Age in Richmond is 34.3 Years.
What is the Average Family Size in Richmond
Average Family Size in Richmond is 3.0 People.
What is the Average Household Size in Richmond
Average Household Size in Richmond is 2.4 People.
How Large is the Labor Force in Richmond?
There are 956 People in the Labor Forcein in Richmond.
What is the Percentage of People in the Labor Force in Richmond?
68.8% of People are in the Labor Force in Richmond.
What is the Unemployment Rate in Richmond?
Unemployment Rate in Richmond is 5.1%.