Immigrants from Zimbabwe 2 or more Vehicles in Household
COMPARE
Immigrants from Zimbabwe
Select to Compare
2 or more Vehicles in Household
Immigrants from Zimbabwe 2 or more Vehicles in Household
55.6%
2+ VEHICLES AVAILABLE
60.2/ 100
METRIC RATING
163rd/ 347
METRIC RANK
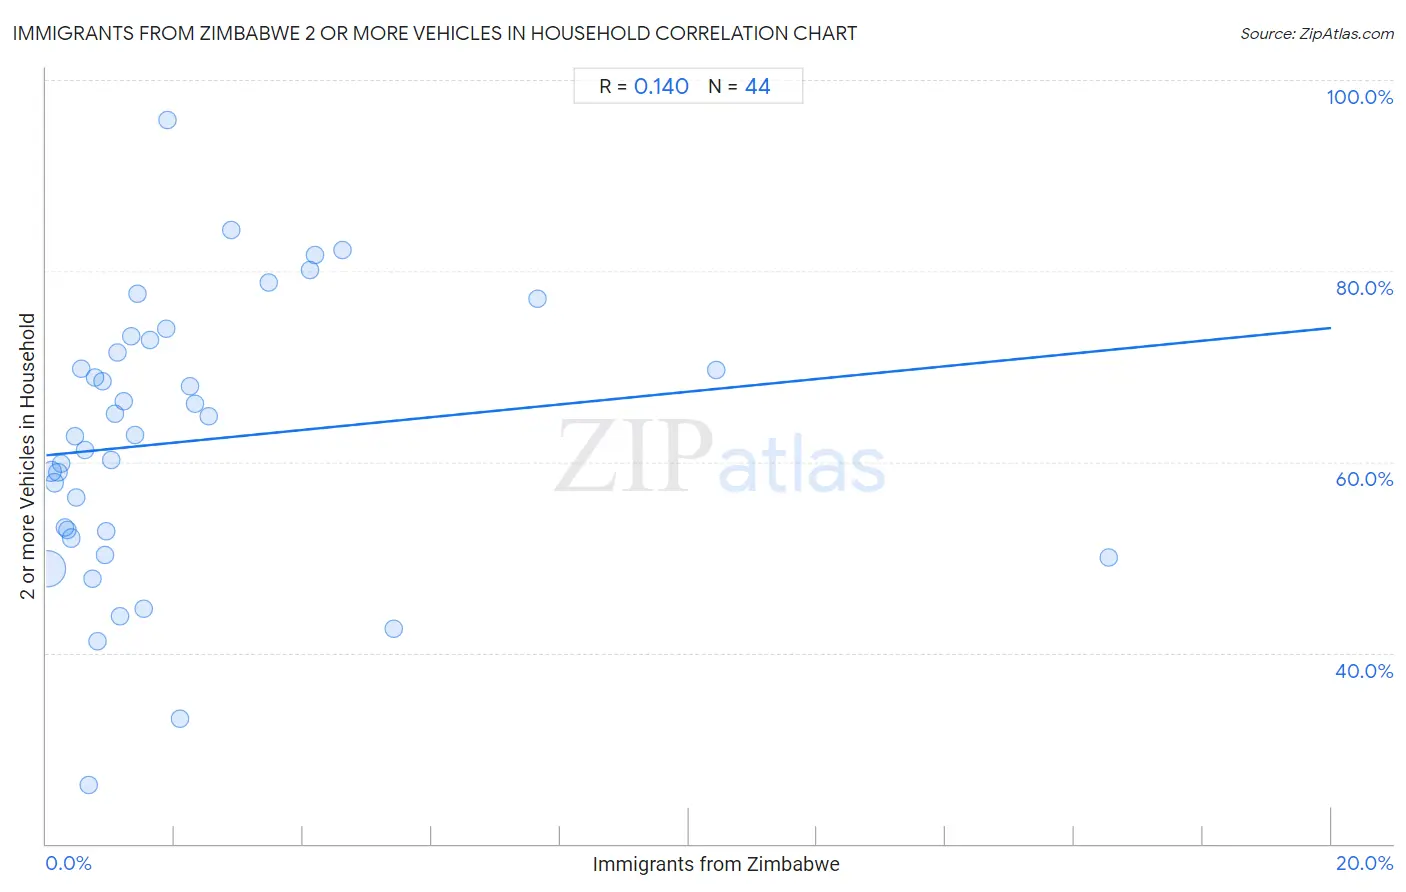
Immigrants from Zimbabwe 2 or more Vehicles in Household Correlation Chart
The statistical analysis conducted on geographies consisting of 117,791,116 people shows a poor positive correlation between the proportion of Immigrants from Zimbabwe and percentage of households with 2 or more vehicles available in the United States with a correlation coefficient (R) of 0.140 and weighted average of 55.6%. On average, for every 1% (one percent) increase in Immigrants from Zimbabwe within a typical geography, there is an increase of 0.67% in percentage of households with 2 or more vehicles available.
It is essential to understand that the correlation between the percentage of Immigrants from Zimbabwe and percentage of households with 2 or more vehicles available does not imply a direct cause-and-effect relationship. It remains uncertain whether the presence of Immigrants from Zimbabwe influences an upward or downward trend in the level of percentage of households with 2 or more vehicles available within an area, or if Immigrants from Zimbabwe simply ended up residing in those areas with higher or lower levels of percentage of households with 2 or more vehicles available due to other factors.
Demographics Similar to Immigrants from Zimbabwe by 2 or more Vehicles in Household
In terms of 2 or more vehicles in household, the demographic groups most similar to Immigrants from Zimbabwe are Dutch West Indian (55.6%, a difference of 0.010%), German Russian (55.6%, a difference of 0.030%), Immigrants from El Salvador (55.6%, a difference of 0.030%), Colville (55.6%, a difference of 0.040%), and Immigrants from Sri Lanka (55.5%, a difference of 0.080%).
| Demographics | Rating | Rank | 2 or more Vehicles in Household |
| Immigrants from Lithuania | 70.4 /100 | #156 | Good 55.8% |
| Immigrants from Kuwait | 70.2 /100 | #157 | Good 55.8% |
| Tlingit-Haida | 68.5 /100 | #158 | Good 55.8% |
| Paiute | 68.0 /100 | #159 | Good 55.8% |
| Crow | 67.0 /100 | #160 | Good 55.7% |
| Colville | 61.1 /100 | #161 | Good 55.6% |
| German Russians | 60.9 /100 | #162 | Good 55.6% |
| Immigrants from Zimbabwe | 60.2 /100 | #163 | Good 55.6% |
| Dutch West Indians | 59.8 /100 | #164 | Average 55.6% |
| Immigrants from El Salvador | 59.4 /100 | #165 | Average 55.6% |
| Immigrants from Sri Lanka | 58.3 /100 | #166 | Average 55.5% |
| Kenyans | 58.1 /100 | #167 | Average 55.5% |
| French American Indians | 56.7 /100 | #168 | Average 55.5% |
| Immigrants from Austria | 56.3 /100 | #169 | Average 55.5% |
| Romanians | 55.8 /100 | #170 | Average 55.5% |
Immigrants from Zimbabwe 2 or more Vehicles in Household Correlation Summary
| Measurement | Immigrants from Zimbabwe Data | 2 or more Vehicles in Household Data |
| Minimum | 0.017% | 26.1% |
| Maximum | 16.5% | 95.8% |
| Range | 16.5% | 69.7% |
| Mean | 2.1% | 62.1% |
| Median | 1.1% | 62.8% |
| Interquartile 25% (IQ1) | 0.58% | 52.4% |
| Interquartile 75% (IQ3) | 2.3% | 72.1% |
| Interquartile Range (IQR) | 1.7% | 19.7% |
| Standard Deviation (Sample) | 3.0% | 14.4% |
| Standard Deviation (Population) | 3.0% | 14.2% |
Correlation Details
| Immigrants from Zimbabwe Percentile | Sample Size | 2 or more Vehicles in Household |
[ 0.0% - 0.5% ] 0.017% | 96,584,996 | 48.8% |
[ 0.0% - 0.5% ] 0.074% | 11,551,653 | 59.0% |
[ 0.0% - 0.5% ] 0.13% | 3,964,784 | 57.8% |
[ 0.0% - 0.5% ] 0.18% | 2,085,630 | 58.9% |
[ 0.0% - 0.5% ] 0.23% | 880,238 | 59.8% |
[ 0.0% - 0.5% ] 0.29% | 670,593 | 53.2% |
[ 0.0% - 0.5% ] 0.33% | 478,711 | 52.9% |
[ 0.0% - 0.5% ] 0.39% | 337,090 | 52.0% |
[ 0.0% - 0.5% ] 0.45% | 355,667 | 62.7% |
[ 0.0% - 0.5% ] 0.48% | 94,478 | 56.3% |
[ 0.5% - 1.0% ] 0.55% | 235,275 | 69.8% |
[ 0.5% - 1.0% ] 0.61% | 83,805 | 61.2% |
[ 0.5% - 1.0% ] 0.66% | 42,362 | 26.1% |
[ 0.5% - 1.0% ] 0.71% | 39,523 | 47.7% |
[ 0.5% - 1.0% ] 0.76% | 76,479 | 68.8% |
[ 0.5% - 1.0% ] 0.79% | 53,714 | 41.2% |
[ 0.5% - 1.0% ] 0.88% | 13,719 | 68.5% |
[ 0.5% - 1.0% ] 0.91% | 57,422 | 50.3% |
[ 0.5% - 1.0% ] 0.94% | 3,935 | 52.7% |
[ 1.0% - 1.5% ] 1.02% | 32,114 | 60.2% |
[ 1.0% - 1.5% ] 1.06% | 4,790 | 65.1% |
[ 1.0% - 1.5% ] 1.11% | 31,316 | 71.4% |
[ 1.0% - 1.5% ] 1.16% | 4,413 | 43.8% |
[ 1.0% - 1.5% ] 1.20% | 916 | 66.4% |
[ 1.0% - 1.5% ] 1.33% | 18,115 | 73.1% |
[ 1.0% - 1.5% ] 1.38% | 4,773 | 62.8% |
[ 1.0% - 1.5% ] 1.43% | 3,572 | 77.7% |
[ 1.5% - 2.0% ] 1.52% | 197 | 44.6% |
[ 1.5% - 2.0% ] 1.62% | 26,607 | 72.8% |
[ 1.5% - 2.0% ] 1.86% | 1,664 | 73.9% |
[ 1.5% - 2.0% ] 1.88% | 1,221 | 95.8% |
[ 2.0% - 2.5% ] 2.08% | 3,801 | 33.1% |
[ 2.0% - 2.5% ] 2.23% | 20,716 | 67.9% |
[ 2.0% - 2.5% ] 2.32% | 18,077 | 66.0% |
[ 2.5% - 3.0% ] 2.54% | 197 | 64.8% |
[ 2.5% - 3.0% ] 2.88% | 208 | 84.3% |
[ 3.0% - 3.5% ] 3.47% | 173 | 78.8% |
[ 4.0% - 4.5% ] 4.10% | 1,513 | 80.1% |
[ 4.0% - 4.5% ] 4.19% | 2,961 | 81.7% |
[ 4.5% - 5.0% ] 4.62% | 1,473 | 82.2% |
[ 5.0% - 5.5% ] 5.42% | 1,366 | 42.6% |
[ 7.5% - 8.0% ] 7.64% | 419 | 77.1% |
[ 10.0% - 10.5% ] 10.42% | 307 | 69.6% |
[ 16.5% - 17.0% ] 16.54% | 133 | 50.0% |