Immigrants from Zimbabwe vs Pennsylvania German Wage/Income Gap
COMPARE
Immigrants from Zimbabwe
Pennsylvania German
Wage/Income Gap
Wage/Income Gap Comparison
Immigrants from Zimbabwe
Pennsylvania Germans
25.3%
WAGE/INCOME GAP
73.7/ 100
METRIC RATING
158th/ 347
METRIC RANK
30.7%
WAGE/INCOME GAP
0.0/ 100
METRIC RATING
342nd/ 347
METRIC RANK
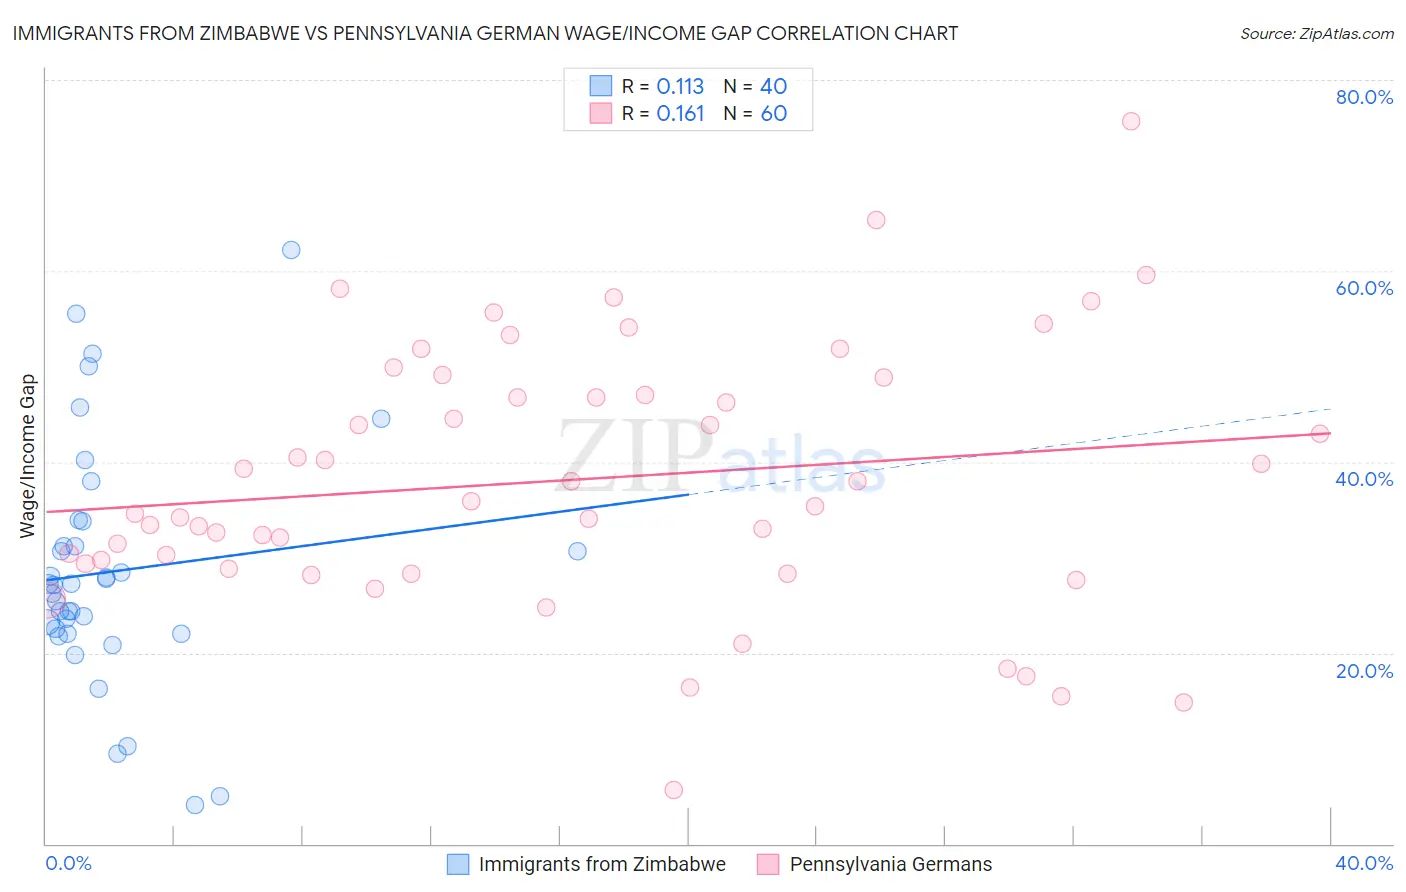
Immigrants from Zimbabwe vs Pennsylvania German Wage/Income Gap Correlation Chart
The statistical analysis conducted on geographies consisting of 117,792,332 people shows a poor positive correlation between the proportion of Immigrants from Zimbabwe and wage/income gap percentage in the United States with a correlation coefficient (R) of 0.113 and weighted average of 25.3%. Similarly, the statistical analysis conducted on geographies consisting of 233,865,703 people shows a poor positive correlation between the proportion of Pennsylvania Germans and wage/income gap percentage in the United States with a correlation coefficient (R) of 0.161 and weighted average of 30.7%, a difference of 21.2%.
Wage/Income Gap Correlation Summary
| Measurement | Immigrants from Zimbabwe | Pennsylvania German |
| Minimum | 4.0% | 5.6% |
| Maximum | 62.1% | 75.6% |
| Range | 58.1% | 70.1% |
| Mean | 28.5% | 38.1% |
| Median | 27.1% | 35.6% |
| Interquartile 25% (IQ1) | 22.3% | 29.1% |
| Interquartile 75% (IQ3) | 32.5% | 48.0% |
| Interquartile Range (IQR) | 10.2% | 18.9% |
| Standard Deviation (Sample) | 12.6% | 13.8% |
| Standard Deviation (Population) | 12.4% | 13.6% |
Similar Demographics by Wage/Income Gap
Demographics Similar to Immigrants from Zimbabwe by Wage/Income Gap
In terms of wage/income gap, the demographic groups most similar to Immigrants from Zimbabwe are Puget Sound Salish (25.3%, a difference of 0.060%), French American Indian (25.4%, a difference of 0.10%), Costa Rican (25.3%, a difference of 0.18%), Immigrants from Mexico (25.3%, a difference of 0.24%), and Albanian (25.4%, a difference of 0.35%).
| Demographics | Rating | Rank | Wage/Income Gap |
| Taiwanese | 81.6 /100 | #151 | Excellent 25.1% |
| Uruguayans | 81.3 /100 | #152 | Excellent 25.2% |
| Blackfeet | 78.1 /100 | #153 | Good 25.2% |
| Immigrants | Northern Africa | 78.1 /100 | #154 | Good 25.2% |
| Immigrants | Vietnam | 77.7 /100 | #155 | Good 25.2% |
| Immigrants | Mexico | 76.4 /100 | #156 | Good 25.3% |
| Costa Ricans | 75.8 /100 | #157 | Good 25.3% |
| Immigrants | Zimbabwe | 73.7 /100 | #158 | Good 25.3% |
| Puget Sound Salish | 73.0 /100 | #159 | Good 25.3% |
| French American Indians | 72.5 /100 | #160 | Good 25.4% |
| Albanians | 69.4 /100 | #161 | Good 25.4% |
| Shoshone | 69.0 /100 | #162 | Good 25.4% |
| Native Hawaiians | 69.0 /100 | #163 | Good 25.4% |
| Koreans | 68.6 /100 | #164 | Good 25.4% |
| Immigrants | Hong Kong | 64.0 /100 | #165 | Good 25.5% |
Demographics Similar to Pennsylvania Germans by Wage/Income Gap
In terms of wage/income gap, the demographic groups most similar to Pennsylvania Germans are Thai (30.5%, a difference of 0.77%), Danish (31.0%, a difference of 0.84%), Assyrian/Chaldean/Syriac (31.0%, a difference of 0.97%), Swiss (30.0%, a difference of 2.5%), and Immigrants from India (31.5%, a difference of 2.7%).
| Demographics | Rating | Rank | Wage/Income Gap |
| Europeans | 0.0 /100 | #333 | Tragic 29.4% |
| Swedes | 0.0 /100 | #334 | Tragic 29.4% |
| Immigrants | Taiwan | 0.0 /100 | #335 | Tragic 29.5% |
| English | 0.0 /100 | #336 | Tragic 29.5% |
| Dutch | 0.0 /100 | #337 | Tragic 29.6% |
| Filipinos | 0.0 /100 | #338 | Tragic 29.7% |
| Iranians | 0.0 /100 | #339 | Tragic 29.7% |
| Swiss | 0.0 /100 | #340 | Tragic 30.0% |
| Thais | 0.0 /100 | #341 | Tragic 30.5% |
| Pennsylvania Germans | 0.0 /100 | #342 | Tragic 30.7% |
| Danes | 0.0 /100 | #343 | Tragic 31.0% |
| Assyrians/Chaldeans/Syriacs | 0.0 /100 | #344 | Tragic 31.0% |
| Immigrants | India | 0.0 /100 | #345 | Tragic 31.5% |
| Cajuns | 0.0 /100 | #346 | Tragic 33.9% |
| Houma | 0.0 /100 | #347 | Tragic 38.7% |