Immigrants from Zimbabwe vs Immigrants from North America Wage/Income Gap
COMPARE
Immigrants from Zimbabwe
Immigrants from North America
Wage/Income Gap
Wage/Income Gap Comparison
Immigrants from Zimbabwe
Immigrants from North America
25.3%
WAGE/INCOME GAP
73.7/ 100
METRIC RATING
158th/ 347
METRIC RANK
28.4%
WAGE/INCOME GAP
0.2/ 100
METRIC RATING
297th/ 347
METRIC RANK
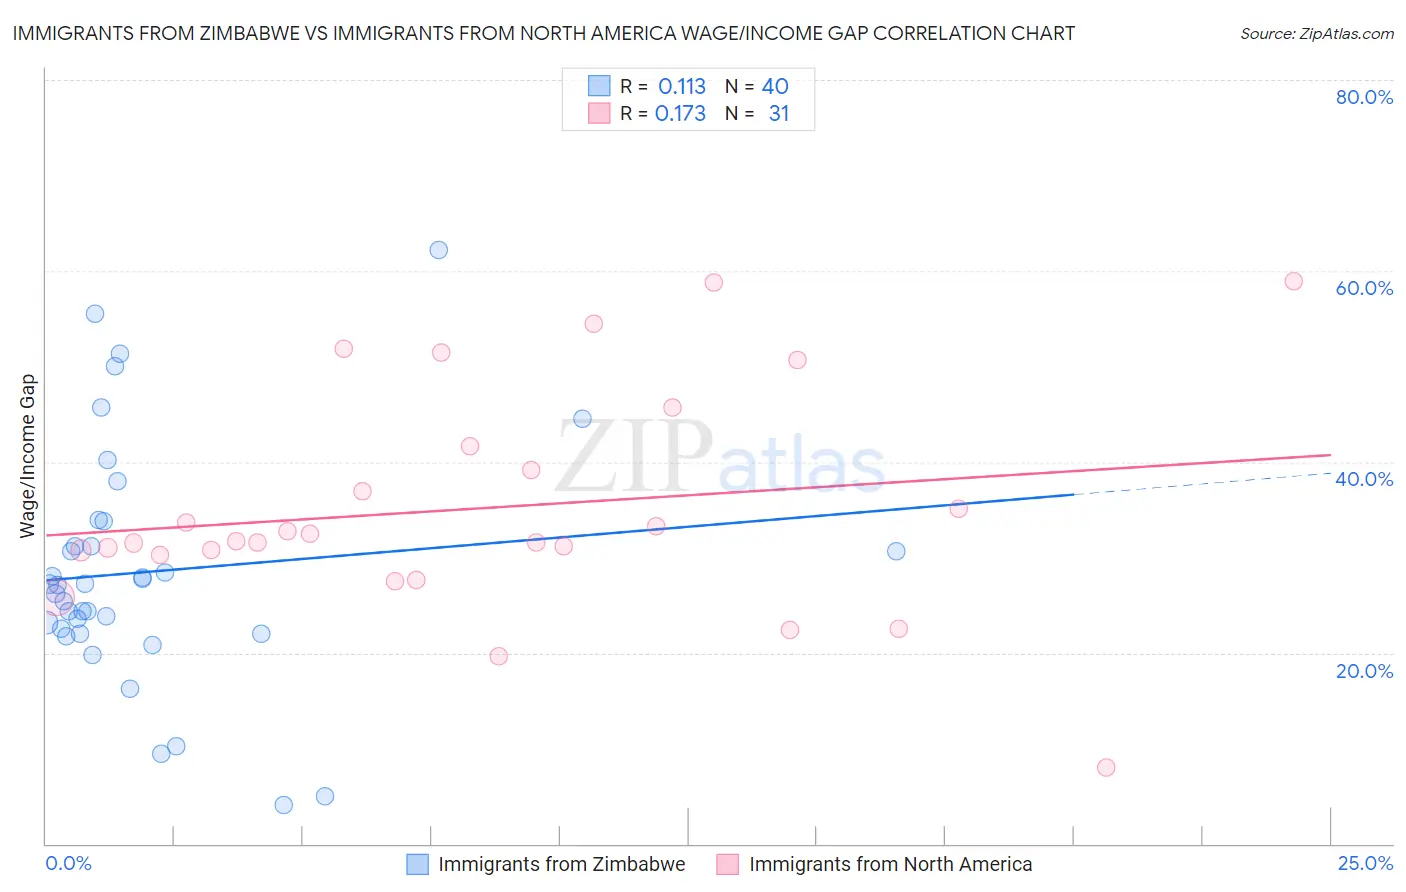
Immigrants from Zimbabwe vs Immigrants from North America Wage/Income Gap Correlation Chart
The statistical analysis conducted on geographies consisting of 117,792,332 people shows a poor positive correlation between the proportion of Immigrants from Zimbabwe and wage/income gap percentage in the United States with a correlation coefficient (R) of 0.113 and weighted average of 25.3%. Similarly, the statistical analysis conducted on geographies consisting of 461,849,295 people shows a poor positive correlation between the proportion of Immigrants from North America and wage/income gap percentage in the United States with a correlation coefficient (R) of 0.173 and weighted average of 28.4%, a difference of 12.1%.
Wage/Income Gap Correlation Summary
| Measurement | Immigrants from Zimbabwe | Immigrants from North America |
| Minimum | 4.0% | 8.0% |
| Maximum | 62.1% | 58.9% |
| Range | 58.1% | 50.9% |
| Mean | 28.5% | 35.2% |
| Median | 27.1% | 31.8% |
| Interquartile 25% (IQ1) | 22.3% | 30.2% |
| Interquartile 75% (IQ3) | 32.5% | 41.7% |
| Interquartile Range (IQR) | 10.2% | 11.5% |
| Standard Deviation (Sample) | 12.6% | 11.7% |
| Standard Deviation (Population) | 12.4% | 11.5% |
Similar Demographics by Wage/Income Gap
Demographics Similar to Immigrants from Zimbabwe by Wage/Income Gap
In terms of wage/income gap, the demographic groups most similar to Immigrants from Zimbabwe are Puget Sound Salish (25.3%, a difference of 0.060%), French American Indian (25.4%, a difference of 0.10%), Costa Rican (25.3%, a difference of 0.18%), Immigrants from Mexico (25.3%, a difference of 0.24%), and Albanian (25.4%, a difference of 0.35%).
| Demographics | Rating | Rank | Wage/Income Gap |
| Taiwanese | 81.6 /100 | #151 | Excellent 25.1% |
| Uruguayans | 81.3 /100 | #152 | Excellent 25.2% |
| Blackfeet | 78.1 /100 | #153 | Good 25.2% |
| Immigrants | Northern Africa | 78.1 /100 | #154 | Good 25.2% |
| Immigrants | Vietnam | 77.7 /100 | #155 | Good 25.2% |
| Immigrants | Mexico | 76.4 /100 | #156 | Good 25.3% |
| Costa Ricans | 75.8 /100 | #157 | Good 25.3% |
| Immigrants | Zimbabwe | 73.7 /100 | #158 | Good 25.3% |
| Puget Sound Salish | 73.0 /100 | #159 | Good 25.3% |
| French American Indians | 72.5 /100 | #160 | Good 25.4% |
| Albanians | 69.4 /100 | #161 | Good 25.4% |
| Shoshone | 69.0 /100 | #162 | Good 25.4% |
| Native Hawaiians | 69.0 /100 | #163 | Good 25.4% |
| Koreans | 68.6 /100 | #164 | Good 25.4% |
| Immigrants | Hong Kong | 64.0 /100 | #165 | Good 25.5% |
Demographics Similar to Immigrants from North America by Wage/Income Gap
In terms of wage/income gap, the demographic groups most similar to Immigrants from North America are Austrian (28.4%, a difference of 0.0%), Immigrants from North Macedonia (28.4%, a difference of 0.050%), Immigrants from Northern Europe (28.5%, a difference of 0.17%), Immigrants from Canada (28.5%, a difference of 0.21%), and Scotch-Irish (28.5%, a difference of 0.24%).
| Demographics | Rating | Rank | Wage/Income Gap |
| Australians | 0.3 /100 | #290 | Tragic 28.2% |
| Czechoslovakians | 0.3 /100 | #291 | Tragic 28.2% |
| Immigrants | Australia | 0.3 /100 | #292 | Tragic 28.2% |
| Immigrants | Israel | 0.3 /100 | #293 | Tragic 28.2% |
| Greeks | 0.3 /100 | #294 | Tragic 28.2% |
| Slovenes | 0.3 /100 | #295 | Tragic 28.3% |
| Northern Europeans | 0.3 /100 | #296 | Tragic 28.3% |
| Immigrants | North America | 0.2 /100 | #297 | Tragic 28.4% |
| Austrians | 0.2 /100 | #298 | Tragic 28.4% |
| Immigrants | North Macedonia | 0.2 /100 | #299 | Tragic 28.4% |
| Immigrants | Northern Europe | 0.2 /100 | #300 | Tragic 28.5% |
| Immigrants | Canada | 0.2 /100 | #301 | Tragic 28.5% |
| Scotch-Irish | 0.2 /100 | #302 | Tragic 28.5% |
| Irish | 0.2 /100 | #303 | Tragic 28.5% |
| Immigrants | Netherlands | 0.2 /100 | #304 | Tragic 28.5% |