Immigrants from Zimbabwe 3 or more Vehicles in Household
COMPARE
Immigrants from Zimbabwe
Select to Compare
3 or more Vehicles in Household
Immigrants from Zimbabwe 3 or more Vehicles in Household
19.1%
3+ VEHICLES AVAILABLE
25.5/ 100
METRIC RATING
190th/ 347
METRIC RANK
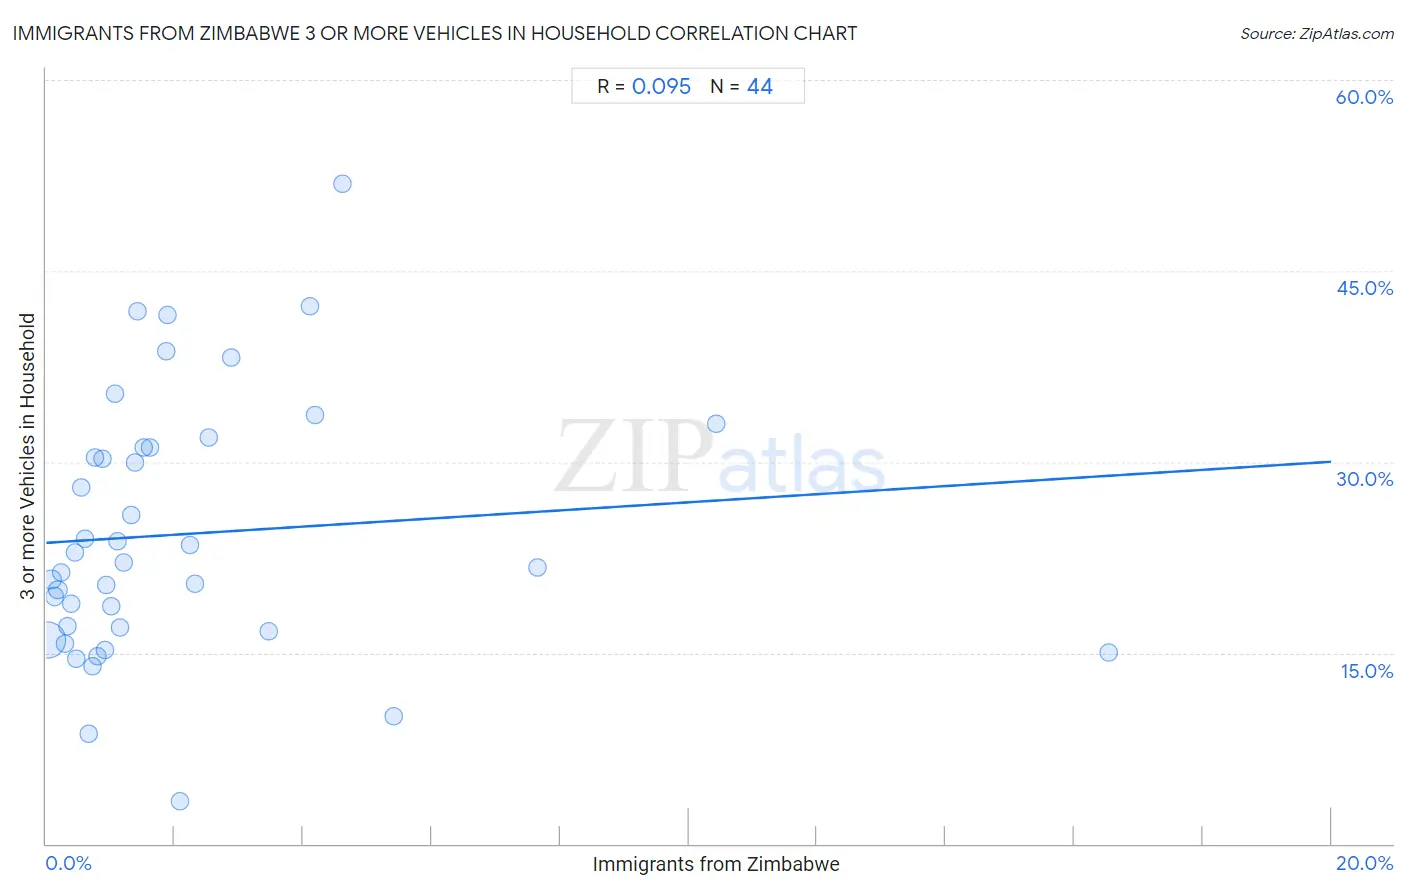
Immigrants from Zimbabwe 3 or more Vehicles in Household Correlation Chart
The statistical analysis conducted on geographies consisting of 117,785,307 people shows a slight positive correlation between the proportion of Immigrants from Zimbabwe and percentage of households with 3 or more vehicles available in the United States with a correlation coefficient (R) of 0.095 and weighted average of 19.1%. On average, for every 1% (one percent) increase in Immigrants from Zimbabwe within a typical geography, there is an increase of 0.32% in percentage of households with 3 or more vehicles available.
It is essential to understand that the correlation between the percentage of Immigrants from Zimbabwe and percentage of households with 3 or more vehicles available does not imply a direct cause-and-effect relationship. It remains uncertain whether the presence of Immigrants from Zimbabwe influences an upward or downward trend in the level of percentage of households with 3 or more vehicles available within an area, or if Immigrants from Zimbabwe simply ended up residing in those areas with higher or lower levels of percentage of households with 3 or more vehicles available due to other factors.
Demographics Similar to Immigrants from Zimbabwe by 3 or more Vehicles in Household
In terms of 3 or more vehicles in household, the demographic groups most similar to Immigrants from Zimbabwe are South American Indian (19.1%, a difference of 0.010%), Indian (Asian) (19.1%, a difference of 0.050%), Immigrants from Kuwait (19.1%, a difference of 0.060%), Kenyan (19.1%, a difference of 0.080%), and Tsimshian (19.1%, a difference of 0.11%).
| Demographics | Rating | Rank | 3 or more Vehicles in Household |
| Cajuns | 36.0 /100 | #183 | Fair 19.3% |
| Latvians | 35.7 /100 | #184 | Fair 19.3% |
| Immigrants from Sri Lanka | 30.7 /100 | #185 | Fair 19.2% |
| Immigrants from Sweden | 29.0 /100 | #186 | Fair 19.2% |
| Immigrants from Hong Kong | 28.3 /100 | #187 | Fair 19.2% |
| Immigrants from Kuwait | 26.1 /100 | #188 | Fair 19.1% |
| Indians (Asian) | 26.0 /100 | #189 | Fair 19.1% |
| Immigrants from Zimbabwe | 25.5 /100 | #190 | Fair 19.1% |
| South American Indians | 25.4 /100 | #191 | Fair 19.1% |
| Kenyans | 24.7 /100 | #192 | Fair 19.1% |
| Tsimshian | 24.4 /100 | #193 | Fair 19.1% |
| Serbians | 24.0 /100 | #194 | Fair 19.1% |
| Immigrants from Moldova | 23.6 /100 | #195 | Fair 19.1% |
| Central American Indians | 22.2 /100 | #196 | Fair 19.0% |
| Immigrants from Japan | 22.0 /100 | #197 | Fair 19.0% |
Immigrants from Zimbabwe 3 or more Vehicles in Household Correlation Summary
| Measurement | Immigrants from Zimbabwe Data | 3 or more Vehicles in Household Data |
| Minimum | 0.017% | 3.3% |
| Maximum | 16.5% | 51.9% |
| Range | 16.5% | 48.5% |
| Mean | 2.1% | 24.3% |
| Median | 1.1% | 21.9% |
| Interquartile 25% (IQ1) | 0.58% | 16.8% |
| Interquartile 75% (IQ3) | 2.3% | 31.1% |
| Interquartile Range (IQR) | 1.7% | 14.3% |
| Standard Deviation (Sample) | 3.0% | 10.2% |
| Standard Deviation (Population) | 3.0% | 10.1% |
Correlation Details
| Immigrants from Zimbabwe Percentile | Sample Size | 3 or more Vehicles in Household |
[ 0.0% - 0.5% ] 0.017% | 96,584,996 | 16.0% |
[ 0.0% - 0.5% ] 0.074% | 11,551,653 | 20.8% |
[ 0.0% - 0.5% ] 0.13% | 3,964,784 | 19.4% |
[ 0.0% - 0.5% ] 0.18% | 2,083,665 | 19.9% |
[ 0.0% - 0.5% ] 0.23% | 880,238 | 21.3% |
[ 0.0% - 0.5% ] 0.29% | 670,593 | 15.7% |
[ 0.0% - 0.5% ] 0.33% | 478,711 | 17.1% |
[ 0.0% - 0.5% ] 0.39% | 335,492 | 18.9% |
[ 0.0% - 0.5% ] 0.45% | 355,667 | 22.9% |
[ 0.0% - 0.5% ] 0.48% | 94,478 | 14.6% |
[ 0.5% - 1.0% ] 0.55% | 233,029 | 28.0% |
[ 0.5% - 1.0% ] 0.61% | 83,805 | 23.9% |
[ 0.5% - 1.0% ] 0.66% | 42,362 | 8.7% |
[ 0.5% - 1.0% ] 0.71% | 39,523 | 13.9% |
[ 0.5% - 1.0% ] 0.76% | 76,479 | 30.3% |
[ 0.5% - 1.0% ] 0.79% | 53,714 | 14.7% |
[ 0.5% - 1.0% ] 0.88% | 13,719 | 30.2% |
[ 0.5% - 1.0% ] 0.91% | 57,422 | 15.2% |
[ 0.5% - 1.0% ] 0.94% | 3,935 | 20.3% |
[ 1.0% - 1.5% ] 1.02% | 32,114 | 18.6% |
[ 1.0% - 1.5% ] 1.06% | 4,790 | 35.3% |
[ 1.0% - 1.5% ] 1.11% | 31,316 | 23.8% |
[ 1.0% - 1.5% ] 1.16% | 4,413 | 16.9% |
[ 1.0% - 1.5% ] 1.20% | 916 | 22.1% |
[ 1.0% - 1.5% ] 1.33% | 18,115 | 25.9% |
[ 1.0% - 1.5% ] 1.38% | 4,773 | 29.9% |
[ 1.0% - 1.5% ] 1.43% | 3,572 | 41.8% |
[ 1.5% - 2.0% ] 1.52% | 197 | 31.1% |
[ 1.5% - 2.0% ] 1.62% | 26,607 | 31.1% |
[ 1.5% - 2.0% ] 1.86% | 1,664 | 38.7% |
[ 1.5% - 2.0% ] 1.88% | 1,221 | 41.5% |
[ 2.0% - 2.5% ] 2.08% | 3,801 | 3.3% |
[ 2.0% - 2.5% ] 2.23% | 20,716 | 23.5% |
[ 2.0% - 2.5% ] 2.32% | 18,077 | 20.5% |
[ 2.5% - 3.0% ] 2.54% | 197 | 31.9% |
[ 2.5% - 3.0% ] 2.88% | 208 | 38.2% |
[ 3.0% - 3.5% ] 3.47% | 173 | 16.7% |
[ 4.0% - 4.5% ] 4.10% | 1,513 | 42.2% |
[ 4.0% - 4.5% ] 4.19% | 2,961 | 33.7% |
[ 4.5% - 5.0% ] 4.62% | 1,473 | 51.9% |
[ 5.0% - 5.5% ] 5.42% | 1,366 | 10.0% |
[ 7.5% - 8.0% ] 7.64% | 419 | 21.7% |
[ 10.0% - 10.5% ] 10.42% | 307 | 33.0% |
[ 16.5% - 17.0% ] 16.54% | 133 | 15.0% |