Immigrants from Zimbabwe vs Pakistani Wage/Income Gap
COMPARE
Immigrants from Zimbabwe
Pakistani
Wage/Income Gap
Wage/Income Gap Comparison
Immigrants from Zimbabwe
Pakistanis
25.3%
WAGE/INCOME GAP
73.7/ 100
METRIC RATING
158th/ 347
METRIC RANK
26.1%
WAGE/INCOME GAP
33.7/ 100
METRIC RATING
185th/ 347
METRIC RANK
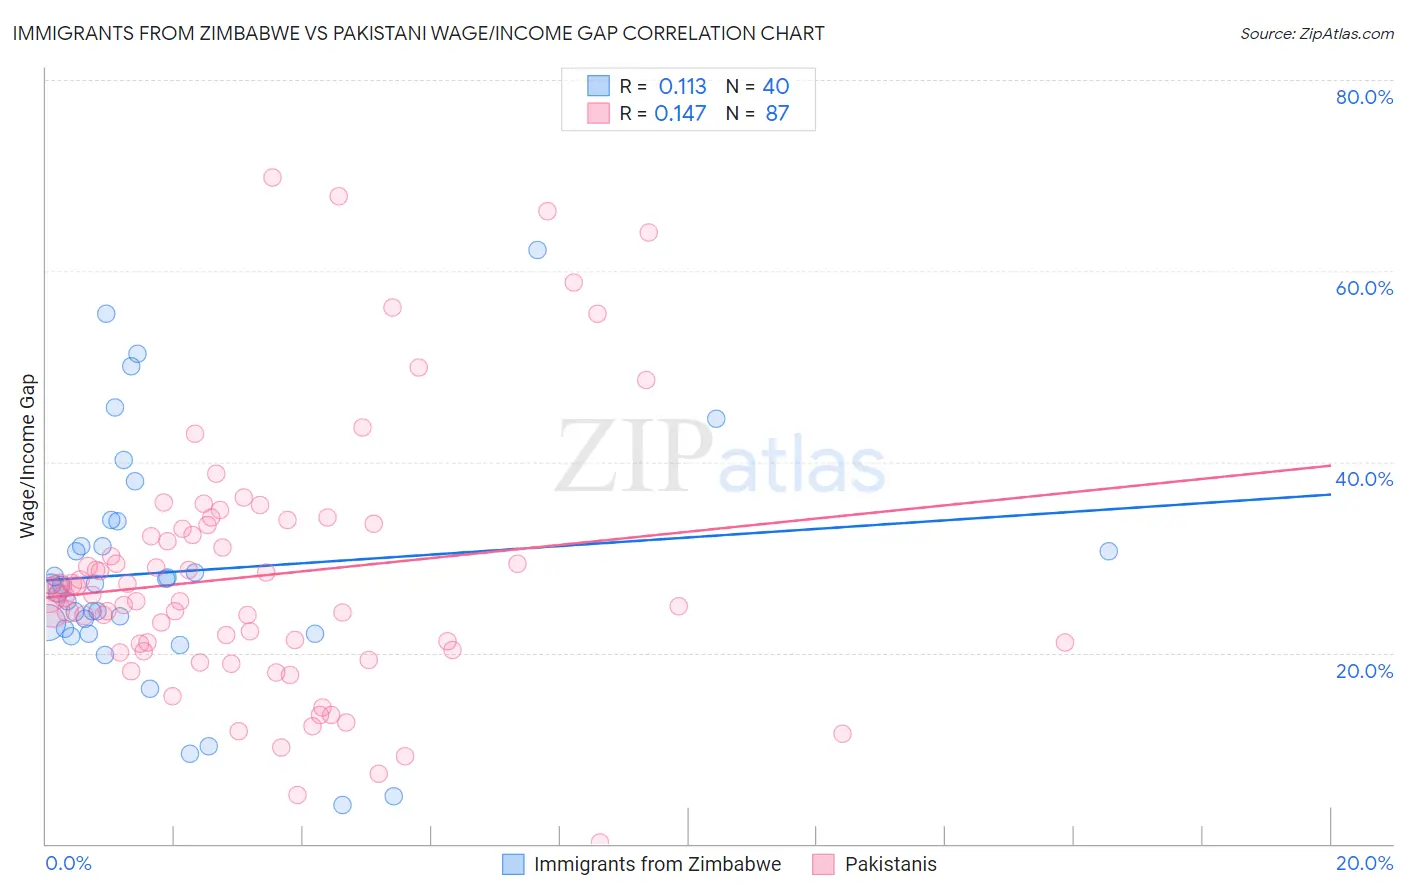
Immigrants from Zimbabwe vs Pakistani Wage/Income Gap Correlation Chart
The statistical analysis conducted on geographies consisting of 117,792,332 people shows a poor positive correlation between the proportion of Immigrants from Zimbabwe and wage/income gap percentage in the United States with a correlation coefficient (R) of 0.113 and weighted average of 25.3%. Similarly, the statistical analysis conducted on geographies consisting of 335,237,953 people shows a poor positive correlation between the proportion of Pakistanis and wage/income gap percentage in the United States with a correlation coefficient (R) of 0.147 and weighted average of 26.1%, a difference of 2.8%.
Wage/Income Gap Correlation Summary
| Measurement | Immigrants from Zimbabwe | Pakistani |
| Minimum | 4.0% | 0.10% |
| Maximum | 62.1% | 69.7% |
| Range | 58.1% | 69.6% |
| Mean | 28.5% | 28.1% |
| Median | 27.1% | 26.1% |
| Interquartile 25% (IQ1) | 22.3% | 20.3% |
| Interquartile 75% (IQ3) | 32.5% | 33.4% |
| Interquartile Range (IQR) | 10.2% | 13.1% |
| Standard Deviation (Sample) | 12.6% | 13.6% |
| Standard Deviation (Population) | 12.4% | 13.6% |
Similar Demographics by Wage/Income Gap
Demographics Similar to Immigrants from Zimbabwe by Wage/Income Gap
In terms of wage/income gap, the demographic groups most similar to Immigrants from Zimbabwe are Puget Sound Salish (25.3%, a difference of 0.060%), French American Indian (25.4%, a difference of 0.10%), Costa Rican (25.3%, a difference of 0.18%), Immigrants from Mexico (25.3%, a difference of 0.24%), and Albanian (25.4%, a difference of 0.35%).
| Demographics | Rating | Rank | Wage/Income Gap |
| Taiwanese | 81.6 /100 | #151 | Excellent 25.1% |
| Uruguayans | 81.3 /100 | #152 | Excellent 25.2% |
| Blackfeet | 78.1 /100 | #153 | Good 25.2% |
| Immigrants | Northern Africa | 78.1 /100 | #154 | Good 25.2% |
| Immigrants | Vietnam | 77.7 /100 | #155 | Good 25.2% |
| Immigrants | Mexico | 76.4 /100 | #156 | Good 25.3% |
| Costa Ricans | 75.8 /100 | #157 | Good 25.3% |
| Immigrants | Zimbabwe | 73.7 /100 | #158 | Good 25.3% |
| Puget Sound Salish | 73.0 /100 | #159 | Good 25.3% |
| French American Indians | 72.5 /100 | #160 | Good 25.4% |
| Albanians | 69.4 /100 | #161 | Good 25.4% |
| Shoshone | 69.0 /100 | #162 | Good 25.4% |
| Native Hawaiians | 69.0 /100 | #163 | Good 25.4% |
| Koreans | 68.6 /100 | #164 | Good 25.4% |
| Immigrants | Hong Kong | 64.0 /100 | #165 | Good 25.5% |
Demographics Similar to Pakistanis by Wage/Income Gap
In terms of wage/income gap, the demographic groups most similar to Pakistanis are Mexican (26.0%, a difference of 0.050%), Immigrants from Indonesia (26.1%, a difference of 0.080%), Immigrants from Kazakhstan (26.0%, a difference of 0.11%), Immigrants from Serbia (26.0%, a difference of 0.12%), and Immigrants from Bolivia (26.0%, a difference of 0.19%).
| Demographics | Rating | Rank | Wage/Income Gap |
| Chinese | 42.0 /100 | #178 | Average 25.9% |
| Samoans | 38.6 /100 | #179 | Fair 26.0% |
| Guamanians/Chamorros | 38.0 /100 | #180 | Fair 26.0% |
| Immigrants | Bolivia | 36.4 /100 | #181 | Fair 26.0% |
| Immigrants | Serbia | 35.4 /100 | #182 | Fair 26.0% |
| Immigrants | Kazakhstan | 35.2 /100 | #183 | Fair 26.0% |
| Mexicans | 34.4 /100 | #184 | Fair 26.0% |
| Pakistanis | 33.7 /100 | #185 | Fair 26.1% |
| Immigrants | Indonesia | 32.5 /100 | #186 | Fair 26.1% |
| Palestinians | 29.9 /100 | #187 | Fair 26.1% |
| Immigrants | Egypt | 29.9 /100 | #188 | Fair 26.1% |
| Immigrants | Moldova | 26.6 /100 | #189 | Fair 26.2% |
| Immigrants | Croatia | 24.8 /100 | #190 | Fair 26.2% |
| Immigrants | Venezuela | 24.7 /100 | #191 | Fair 26.2% |
| Immigrants | Bulgaria | 22.5 /100 | #192 | Fair 26.3% |