Crow vs Immigrants from Poland Wage/Income Gap
COMPARE
Crow
Immigrants from Poland
Wage/Income Gap
Wage/Income Gap Comparison
Crow
Immigrants from Poland
19.1%
WAGE/INCOME GAP
100.0/ 100
METRIC RATING
10th/ 347
METRIC RANK
26.7%
WAGE/INCOME GAP
8.9/ 100
METRIC RATING
219th/ 347
METRIC RANK
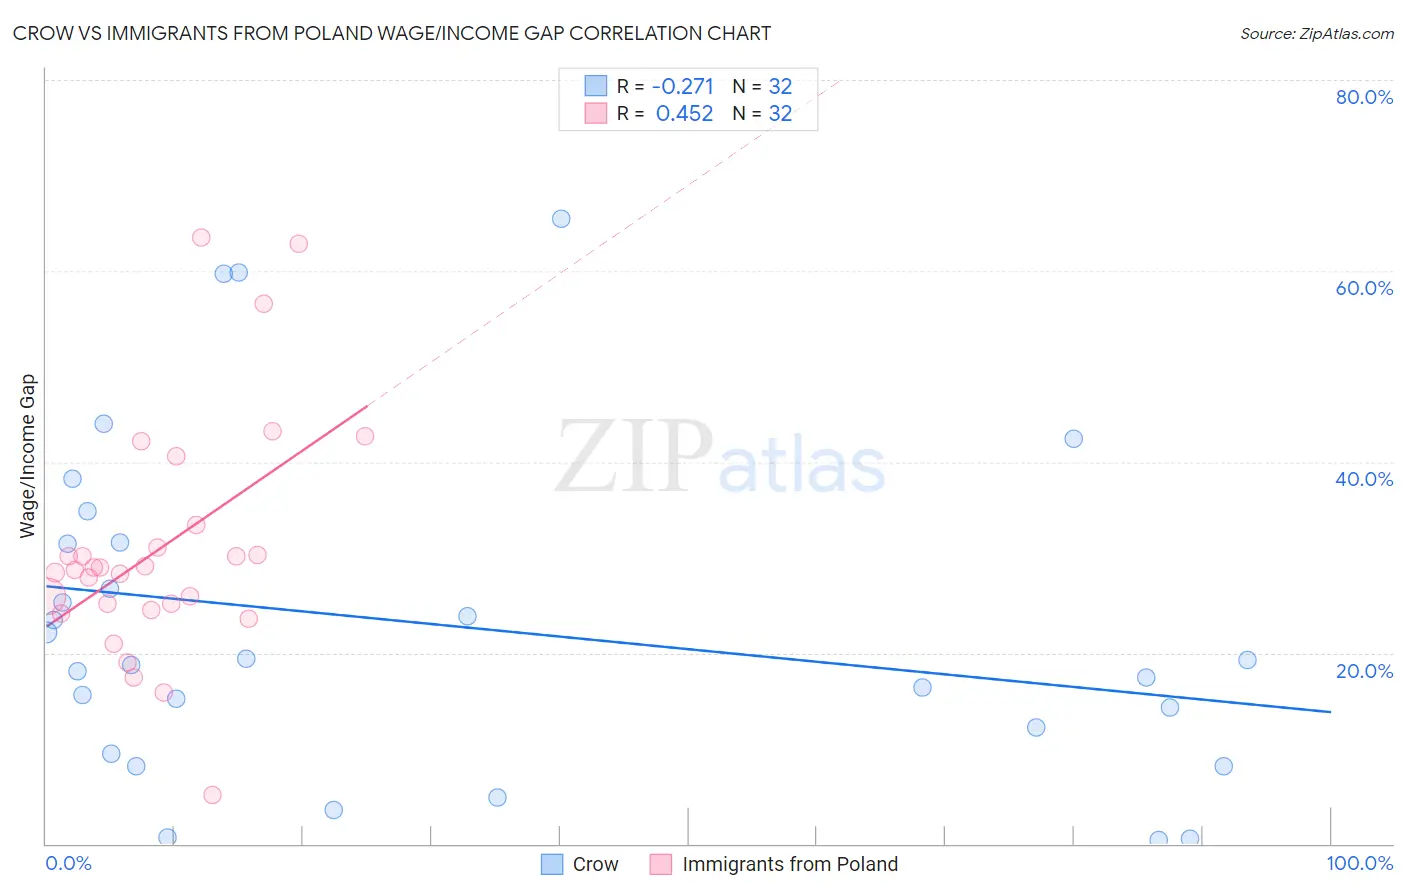
Crow vs Immigrants from Poland Wage/Income Gap Correlation Chart
The statistical analysis conducted on geographies consisting of 59,182,820 people shows a weak negative correlation between the proportion of Crow and wage/income gap percentage in the United States with a correlation coefficient (R) of -0.271 and weighted average of 19.1%. Similarly, the statistical analysis conducted on geographies consisting of 304,701,845 people shows a moderate positive correlation between the proportion of Immigrants from Poland and wage/income gap percentage in the United States with a correlation coefficient (R) of 0.452 and weighted average of 26.7%, a difference of 40.3%.
Wage/Income Gap Correlation Summary
| Measurement | Crow | Immigrants from Poland |
| Minimum | 0.39% | 5.1% |
| Maximum | 65.5% | 63.5% |
| Range | 65.1% | 58.4% |
| Mean | 22.8% | 30.9% |
| Median | 19.0% | 28.8% |
| Interquartile 25% (IQ1) | 10.8% | 24.8% |
| Interquartile 75% (IQ3) | 31.5% | 32.3% |
| Interquartile Range (IQR) | 20.7% | 7.5% |
| Standard Deviation (Sample) | 17.2% | 12.5% |
| Standard Deviation (Population) | 16.9% | 12.3% |
Similar Demographics by Wage/Income Gap
Demographics Similar to Crow by Wage/Income Gap
In terms of wage/income gap, the demographic groups most similar to Crow are Barbadian (19.0%, a difference of 0.53%), Immigrants from Haiti (19.2%, a difference of 0.79%), Immigrants from West Indies (19.2%, a difference of 0.90%), Immigrants from Jamaica (18.8%, a difference of 1.2%), and Trinidadian and Tobagonian (19.3%, a difference of 1.4%).
| Demographics | Rating | Rank | Wage/Income Gap |
| Immigrants | Barbados | 100.0 /100 | #3 | Exceptional 17.8% |
| British West Indians | 100.0 /100 | #4 | Exceptional 18.0% |
| Guyanese | 100.0 /100 | #5 | Exceptional 18.3% |
| Immigrants | Guyana | 100.0 /100 | #6 | Exceptional 18.4% |
| Puerto Ricans | 100.0 /100 | #7 | Exceptional 18.7% |
| Immigrants | Jamaica | 100.0 /100 | #8 | Exceptional 18.8% |
| Barbadians | 100.0 /100 | #9 | Exceptional 19.0% |
| Crow | 100.0 /100 | #10 | Exceptional 19.1% |
| Immigrants | Haiti | 100.0 /100 | #11 | Exceptional 19.2% |
| Immigrants | West Indies | 100.0 /100 | #12 | Exceptional 19.2% |
| Trinidadians and Tobagonians | 100.0 /100 | #13 | Exceptional 19.3% |
| Immigrants | Trinidad and Tobago | 100.0 /100 | #14 | Exceptional 19.3% |
| West Indians | 100.0 /100 | #15 | Exceptional 19.6% |
| Jamaicans | 100.0 /100 | #16 | Exceptional 19.6% |
| Haitians | 100.0 /100 | #17 | Exceptional 19.7% |
Demographics Similar to Immigrants from Poland by Wage/Income Gap
In terms of wage/income gap, the demographic groups most similar to Immigrants from Poland are Immigrants from Latvia (26.7%, a difference of 0.010%), Immigrants from Saudi Arabia (26.7%, a difference of 0.030%), Brazilian (26.7%, a difference of 0.050%), Immigrants from Spain (26.8%, a difference of 0.080%), and Immigrants from Portugal (26.7%, a difference of 0.11%).
| Demographics | Rating | Rank | Wage/Income Gap |
| Iraqis | 11.2 /100 | #212 | Poor 26.6% |
| Immigrants | Iraq | 10.3 /100 | #213 | Poor 26.7% |
| Immigrants | China | 10.3 /100 | #214 | Poor 26.7% |
| Yugoslavians | 9.7 /100 | #215 | Tragic 26.7% |
| Immigrants | Portugal | 9.5 /100 | #216 | Tragic 26.7% |
| Brazilians | 9.2 /100 | #217 | Tragic 26.7% |
| Immigrants | Saudi Arabia | 9.1 /100 | #218 | Tragic 26.7% |
| Immigrants | Poland | 8.9 /100 | #219 | Tragic 26.7% |
| Immigrants | Latvia | 8.9 /100 | #220 | Tragic 26.7% |
| Immigrants | Spain | 8.5 /100 | #221 | Tragic 26.8% |
| Bolivians | 8.3 /100 | #222 | Tragic 26.8% |
| Jordanians | 8.0 /100 | #223 | Tragic 26.8% |
| Immigrants | Argentina | 7.2 /100 | #224 | Tragic 26.8% |
| Immigrants | Ireland | 6.5 /100 | #225 | Tragic 26.9% |
| Asians | 5.9 /100 | #226 | Tragic 26.9% |