Crow vs Costa Rican Wage/Income Gap
COMPARE
Crow
Costa Rican
Wage/Income Gap
Wage/Income Gap Comparison
Crow
Costa Ricans
19.1%
WAGE/INCOME GAP
100.0/ 100
METRIC RATING
10th/ 347
METRIC RANK
25.3%
WAGE/INCOME GAP
75.8/ 100
METRIC RATING
157th/ 347
METRIC RANK
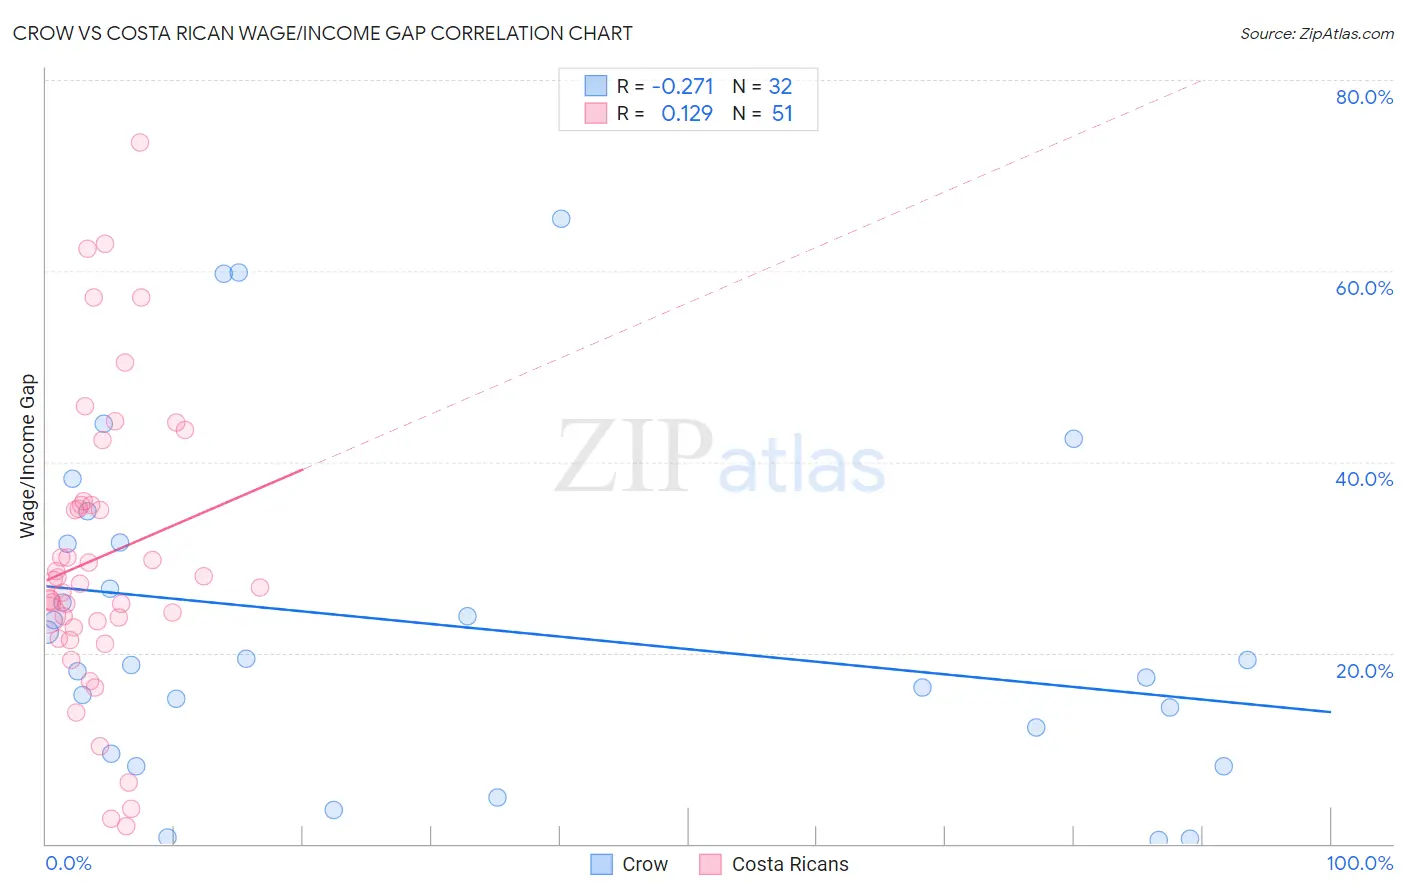
Crow vs Costa Rican Wage/Income Gap Correlation Chart
The statistical analysis conducted on geographies consisting of 59,182,820 people shows a weak negative correlation between the proportion of Crow and wage/income gap percentage in the United States with a correlation coefficient (R) of -0.271 and weighted average of 19.1%. Similarly, the statistical analysis conducted on geographies consisting of 253,543,370 people shows a poor positive correlation between the proportion of Costa Ricans and wage/income gap percentage in the United States with a correlation coefficient (R) of 0.129 and weighted average of 25.3%, a difference of 32.7%.
Wage/Income Gap Correlation Summary
| Measurement | Crow | Costa Rican |
| Minimum | 0.39% | 1.8% |
| Maximum | 65.5% | 73.5% |
| Range | 65.1% | 71.7% |
| Mean | 22.8% | 30.0% |
| Median | 19.0% | 27.2% |
| Interquartile 25% (IQ1) | 10.8% | 22.7% |
| Interquartile 75% (IQ3) | 31.5% | 35.5% |
| Interquartile Range (IQR) | 20.7% | 12.9% |
| Standard Deviation (Sample) | 17.2% | 15.2% |
| Standard Deviation (Population) | 16.9% | 15.1% |
Similar Demographics by Wage/Income Gap
Demographics Similar to Crow by Wage/Income Gap
In terms of wage/income gap, the demographic groups most similar to Crow are Barbadian (19.0%, a difference of 0.53%), Immigrants from Haiti (19.2%, a difference of 0.79%), Immigrants from West Indies (19.2%, a difference of 0.90%), Immigrants from Jamaica (18.8%, a difference of 1.2%), and Trinidadian and Tobagonian (19.3%, a difference of 1.4%).
| Demographics | Rating | Rank | Wage/Income Gap |
| Immigrants | Barbados | 100.0 /100 | #3 | Exceptional 17.8% |
| British West Indians | 100.0 /100 | #4 | Exceptional 18.0% |
| Guyanese | 100.0 /100 | #5 | Exceptional 18.3% |
| Immigrants | Guyana | 100.0 /100 | #6 | Exceptional 18.4% |
| Puerto Ricans | 100.0 /100 | #7 | Exceptional 18.7% |
| Immigrants | Jamaica | 100.0 /100 | #8 | Exceptional 18.8% |
| Barbadians | 100.0 /100 | #9 | Exceptional 19.0% |
| Crow | 100.0 /100 | #10 | Exceptional 19.1% |
| Immigrants | Haiti | 100.0 /100 | #11 | Exceptional 19.2% |
| Immigrants | West Indies | 100.0 /100 | #12 | Exceptional 19.2% |
| Trinidadians and Tobagonians | 100.0 /100 | #13 | Exceptional 19.3% |
| Immigrants | Trinidad and Tobago | 100.0 /100 | #14 | Exceptional 19.3% |
| West Indians | 100.0 /100 | #15 | Exceptional 19.6% |
| Jamaicans | 100.0 /100 | #16 | Exceptional 19.6% |
| Haitians | 100.0 /100 | #17 | Exceptional 19.7% |
Demographics Similar to Costa Ricans by Wage/Income Gap
In terms of wage/income gap, the demographic groups most similar to Costa Ricans are Immigrants from Mexico (25.3%, a difference of 0.060%), Immigrants from Vietnam (25.2%, a difference of 0.18%), Immigrants from Zimbabwe (25.3%, a difference of 0.18%), Blackfeet (25.2%, a difference of 0.22%), and Immigrants from Northern Africa (25.2%, a difference of 0.22%).
| Demographics | Rating | Rank | Wage/Income Gap |
| Immigrants | Immigrants | 82.3 /100 | #150 | Excellent 25.1% |
| Taiwanese | 81.6 /100 | #151 | Excellent 25.1% |
| Uruguayans | 81.3 /100 | #152 | Excellent 25.2% |
| Blackfeet | 78.1 /100 | #153 | Good 25.2% |
| Immigrants | Northern Africa | 78.1 /100 | #154 | Good 25.2% |
| Immigrants | Vietnam | 77.7 /100 | #155 | Good 25.2% |
| Immigrants | Mexico | 76.4 /100 | #156 | Good 25.3% |
| Costa Ricans | 75.8 /100 | #157 | Good 25.3% |
| Immigrants | Zimbabwe | 73.7 /100 | #158 | Good 25.3% |
| Puget Sound Salish | 73.0 /100 | #159 | Good 25.3% |
| French American Indians | 72.5 /100 | #160 | Good 25.4% |
| Albanians | 69.4 /100 | #161 | Good 25.4% |
| Shoshone | 69.0 /100 | #162 | Good 25.4% |
| Native Hawaiians | 69.0 /100 | #163 | Good 25.4% |
| Koreans | 68.6 /100 | #164 | Good 25.4% |