Crow 2 or more Vehicles in Household
COMPARE
Crow
Select to Compare
2 or more Vehicles in Household
Crow 2 or more Vehicles in Household
55.7%
2+ VEHICLES AVAILABLE
67.0/ 100
METRIC RATING
160th/ 347
METRIC RANK
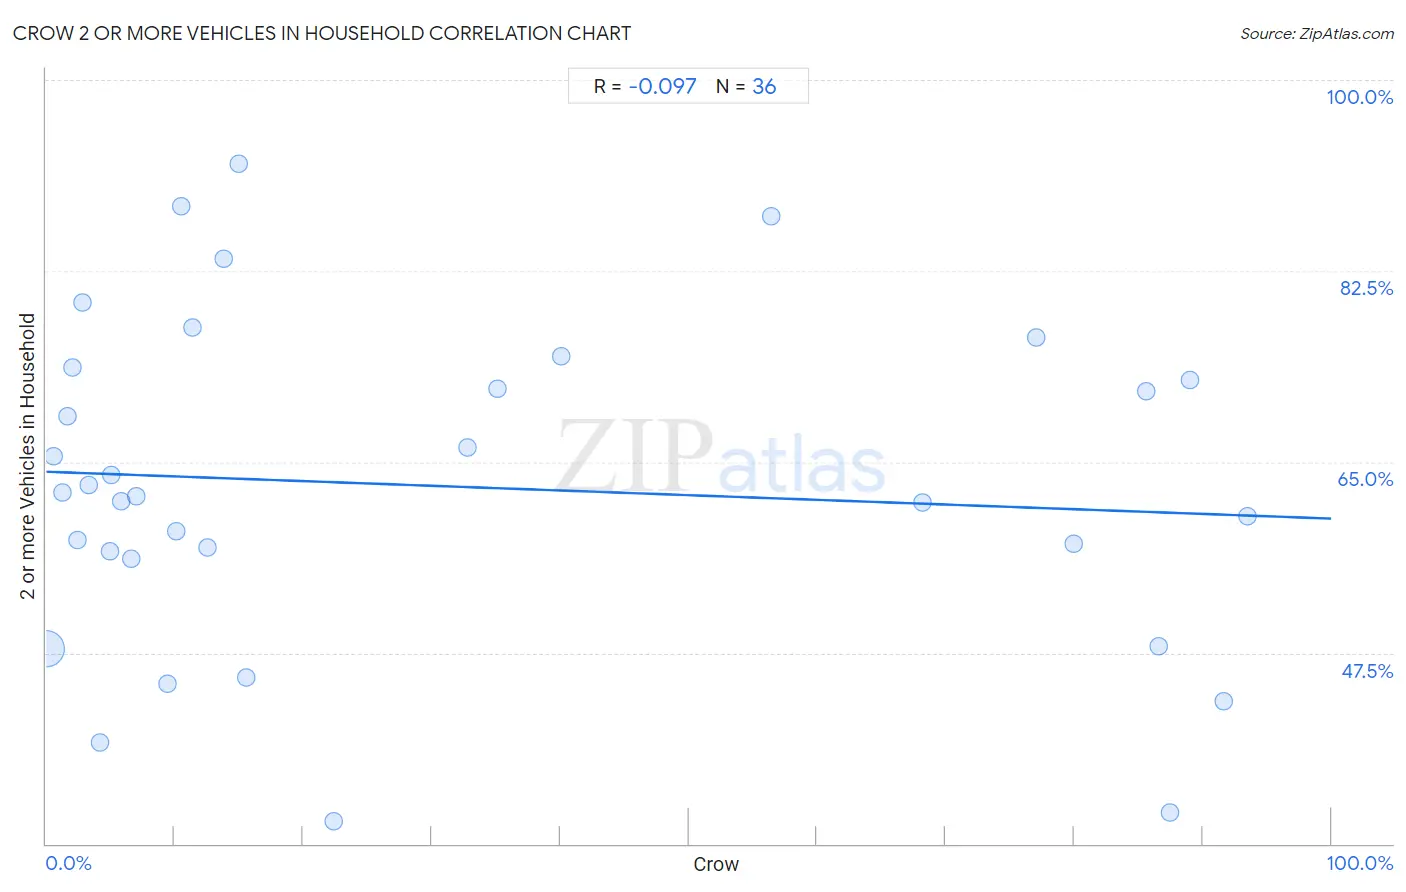
Crow 2 or more Vehicles in Household Correlation Chart
The statistical analysis conducted on geographies consisting of 59,203,156 people shows a slight negative correlation between the proportion of Crow and percentage of households with 2 or more vehicles available in the United States with a correlation coefficient (R) of -0.097 and weighted average of 55.7%. On average, for every 1% (one percent) increase in Crow within a typical geography, there is a decrease of 0.043% in percentage of households with 2 or more vehicles available.
It is essential to understand that the correlation between the percentage of Crow and percentage of households with 2 or more vehicles available does not imply a direct cause-and-effect relationship. It remains uncertain whether the presence of Crow influences an upward or downward trend in the level of percentage of households with 2 or more vehicles available within an area, or if Crow simply ended up residing in those areas with higher or lower levels of percentage of households with 2 or more vehicles available due to other factors.
Demographics Similar to Crow by 2 or more Vehicles in Household
In terms of 2 or more vehicles in household, the demographic groups most similar to Crow are Paiute (55.8%, a difference of 0.050%), Tlingit-Haida (55.8%, a difference of 0.070%), Immigrants from Kuwait (55.8%, a difference of 0.14%), Immigrants from Lithuania (55.8%, a difference of 0.15%), and Ukrainian (55.8%, a difference of 0.17%).
| Demographics | Rating | Rank | 2 or more Vehicles in Household |
| Lumbee | 71.9 /100 | #153 | Good 55.9% |
| Ukrainians | 70.8 /100 | #154 | Good 55.8% |
| Immigrants from Venezuela | 70.7 /100 | #155 | Good 55.8% |
| Immigrants from Lithuania | 70.4 /100 | #156 | Good 55.8% |
| Immigrants from Kuwait | 70.2 /100 | #157 | Good 55.8% |
| Tlingit-Haida | 68.5 /100 | #158 | Good 55.8% |
| Paiute | 68.0 /100 | #159 | Good 55.8% |
| Crow | 67.0 /100 | #160 | Good 55.7% |
| Colville | 61.1 /100 | #161 | Good 55.6% |
| German Russians | 60.9 /100 | #162 | Good 55.6% |
| Immigrants from Zimbabwe | 60.2 /100 | #163 | Good 55.6% |
| Dutch West Indians | 59.8 /100 | #164 | Average 55.6% |
| Immigrants from El Salvador | 59.4 /100 | #165 | Average 55.6% |
| Immigrants from Sri Lanka | 58.3 /100 | #166 | Average 55.5% |
| Kenyans | 58.1 /100 | #167 | Average 55.5% |
Crow 2 or more Vehicles in Household Correlation Summary
| Measurement | Crow Data | 2 or more Vehicles in Household Data |
| Minimum | 0.023% | 32.0% |
| Maximum | 93.4% | 92.3% |
| Range | 93.4% | 60.3% |
| Mean | 30.3% | 62.8% |
| Median | 11.9% | 62.0% |
| Interquartile 25% (IQ1) | 4.6% | 56.5% |
| Interquartile 75% (IQ3) | 62.3% | 73.1% |
| Interquartile Range (IQR) | 57.7% | 16.6% |
| Standard Deviation (Sample) | 34.0% | 15.0% |
| Standard Deviation (Population) | 33.5% | 14.8% |
Correlation Details
| Crow Percentile | Sample Size | 2 or more Vehicles in Household |
[ 0.0% - 0.5% ] 0.023% | 58,539,702 | 47.8% |
[ 0.5% - 1.0% ] 0.59% | 293,509 | 65.6% |
[ 1.0% - 1.5% ] 1.26% | 166,103 | 62.2% |
[ 1.5% - 2.0% ] 1.61% | 93,100 | 69.1% |
[ 2.0% - 2.5% ] 2.07% | 7,192 | 73.7% |
[ 2.0% - 2.5% ] 2.45% | 49,253 | 57.9% |
[ 2.5% - 3.0% ] 2.87% | 2,129 | 79.6% |
[ 3.0% - 3.5% ] 3.26% | 11,598 | 62.8% |
[ 4.0% - 4.5% ] 4.23% | 1,560 | 39.2% |
[ 4.5% - 5.0% ] 4.97% | 5,276 | 56.8% |
[ 5.0% - 5.5% ] 5.10% | 1,019 | 63.8% |
[ 5.5% - 6.0% ] 5.79% | 1,796 | 61.4% |
[ 6.5% - 7.0% ] 6.61% | 4,223 | 56.2% |
[ 7.0% - 7.5% ] 7.01% | 785 | 61.8% |
[ 9.0% - 9.5% ] 9.45% | 2,064 | 44.6% |
[ 10.0% - 10.5% ] 10.08% | 2,817 | 58.6% |
[ 10.5% - 11.0% ] 10.53% | 190 | 88.5% |
[ 11.0% - 11.5% ] 11.36% | 176 | 77.3% |
[ 12.0% - 12.5% ] 12.50% | 48 | 57.1% |
[ 13.5% - 14.0% ] 13.79% | 428 | 83.7% |
[ 15.0% - 15.5% ] 15.00% | 40 | 92.3% |
[ 15.5% - 16.0% ] 15.56% | 1,125 | 45.3% |
[ 22.0% - 22.5% ] 22.35% | 783 | 32.0% |
[ 32.5% - 33.0% ] 32.75% | 3,985 | 66.3% |
[ 35.0% - 35.5% ] 35.12% | 5,199 | 71.6% |
[ 40.0% - 40.5% ] 40.12% | 172 | 74.6% |
[ 56.0% - 56.5% ] 56.41% | 78 | 87.5% |
[ 68.0% - 68.5% ] 68.23% | 576 | 61.2% |
[ 77.0% - 77.5% ] 77.09% | 1,602 | 76.4% |
[ 79.5% - 80.0% ] 79.96% | 459 | 57.4% |
[ 85.5% - 86.0% ] 85.61% | 660 | 71.5% |
[ 86.5% - 87.0% ] 86.61% | 2,180 | 48.1% |
[ 87.0% - 87.5% ] 87.40% | 262 | 32.9% |
[ 89.0% - 89.5% ] 89.03% | 629 | 72.5% |
[ 91.5% - 92.0% ] 91.65% | 1,965 | 43.0% |
[ 93.0% - 93.5% ] 93.45% | 473 | 60.0% |