Comanche vs Apache Wage/Income Gap
COMPARE
Comanche
Apache
Wage/Income Gap
Wage/Income Gap Comparison
Comanche
Apache
25.0%
WAGE/INCOME GAP
85.2/ 100
METRIC RATING
145th/ 347
METRIC RANK
24.5%
WAGE/INCOME GAP
94.8/ 100
METRIC RATING
122nd/ 347
METRIC RANK
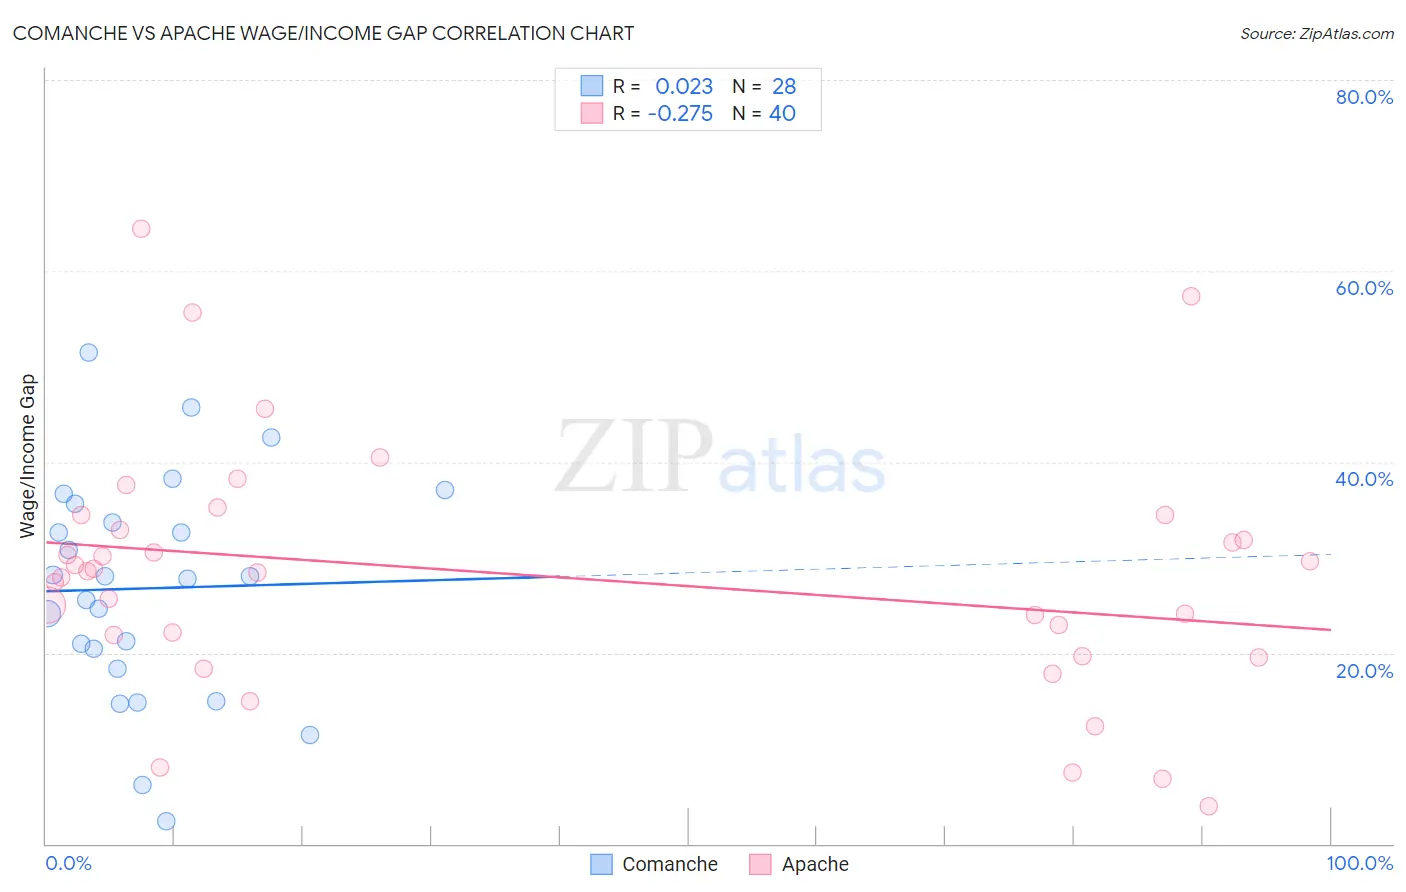
Comanche vs Apache Wage/Income Gap Correlation Chart
The statistical analysis conducted on geographies consisting of 109,744,354 people shows no correlation between the proportion of Comanche and wage/income gap percentage in the United States with a correlation coefficient (R) of 0.023 and weighted average of 25.0%. Similarly, the statistical analysis conducted on geographies consisting of 230,929,884 people shows a weak negative correlation between the proportion of Apache and wage/income gap percentage in the United States with a correlation coefficient (R) of -0.275 and weighted average of 24.5%, a difference of 2.0%.
Wage/Income Gap Correlation Summary
| Measurement | Comanche | Apache |
| Minimum | 2.4% | 3.9% |
| Maximum | 51.5% | 64.5% |
| Range | 49.1% | 60.6% |
| Mean | 26.7% | 28.1% |
| Median | 27.9% | 28.5% |
| Interquartile 25% (IQ1) | 19.4% | 20.8% |
| Interquartile 75% (IQ3) | 34.7% | 33.7% |
| Interquartile Range (IQR) | 15.3% | 12.9% |
| Standard Deviation (Sample) | 11.6% | 13.0% |
| Standard Deviation (Population) | 11.4% | 12.8% |
Similar Demographics by Wage/Income Gap
Demographics Similar to Comanche by Wage/Income Gap
In terms of wage/income gap, the demographic groups most similar to Comanche are South American (25.0%, a difference of 0.0%), Malaysian (25.0%, a difference of 0.030%), Iroquois (25.1%, a difference of 0.16%), Chippewa (25.0%, a difference of 0.24%), and Immigrants from Peru (25.1%, a difference of 0.31%).
| Demographics | Rating | Rank | Wage/Income Gap |
| Immigrants | Bosnia and Herzegovina | 90.1 /100 | #138 | Exceptional 24.8% |
| Hispanics or Latinos | 89.5 /100 | #139 | Excellent 24.9% |
| Immigrants | Nepal | 89.3 /100 | #140 | Excellent 24.9% |
| Hawaiians | 89.3 /100 | #141 | Excellent 24.9% |
| Afghans | 88.1 /100 | #142 | Excellent 24.9% |
| Immigrants | Uganda | 88.0 /100 | #143 | Excellent 24.9% |
| Chippewa | 86.9 /100 | #144 | Excellent 25.0% |
| Comanche | 85.2 /100 | #145 | Excellent 25.0% |
| South Americans | 85.2 /100 | #146 | Excellent 25.0% |
| Malaysians | 84.9 /100 | #147 | Excellent 25.0% |
| Iroquois | 83.9 /100 | #148 | Excellent 25.1% |
| Immigrants | Peru | 82.6 /100 | #149 | Excellent 25.1% |
| Immigrants | Immigrants | 82.3 /100 | #150 | Excellent 25.1% |
| Taiwanese | 81.6 /100 | #151 | Excellent 25.1% |
| Uruguayans | 81.3 /100 | #152 | Excellent 25.2% |
Demographics Similar to Apache by Wage/Income Gap
In terms of wage/income gap, the demographic groups most similar to Apache are Immigrants from Thailand (24.5%, a difference of 0.050%), Native/Alaskan (24.6%, a difference of 0.070%), Immigrants from South America (24.6%, a difference of 0.28%), Spanish American (24.6%, a difference of 0.30%), and Cree (24.5%, a difference of 0.31%).
| Demographics | Rating | Rank | Wage/Income Gap |
| Immigrants | Kenya | 96.4 /100 | #115 | Exceptional 24.4% |
| Alaska Natives | 96.0 /100 | #116 | Exceptional 24.4% |
| Immigrants | Afghanistan | 95.9 /100 | #117 | Exceptional 24.4% |
| Immigrants | Micronesia | 95.8 /100 | #118 | Exceptional 24.4% |
| Kenyans | 95.8 /100 | #119 | Exceptional 24.5% |
| Cree | 95.6 /100 | #120 | Exceptional 24.5% |
| Immigrants | Thailand | 94.9 /100 | #121 | Exceptional 24.5% |
| Apache | 94.8 /100 | #122 | Exceptional 24.5% |
| Natives/Alaskans | 94.6 /100 | #123 | Exceptional 24.6% |
| Immigrants | South America | 93.9 /100 | #124 | Exceptional 24.6% |
| Spanish Americans | 93.8 /100 | #125 | Exceptional 24.6% |
| Immigrants | Uruguay | 93.8 /100 | #126 | Exceptional 24.6% |
| German Russians | 93.7 /100 | #127 | Exceptional 24.6% |
| Immigrants | Central America | 93.5 /100 | #128 | Exceptional 24.6% |
| Yup'ik | 93.3 /100 | #129 | Exceptional 24.7% |