Comanche College, 1 year or more
COMPARE
Comanche
Select to Compare
College, 1 year or more
Comanche College, 1 year or more
54.4%
COLLEGE, 1 YEAR OR MORE
0.2/ 100
METRIC RATING
272nd/ 347
METRIC RANK
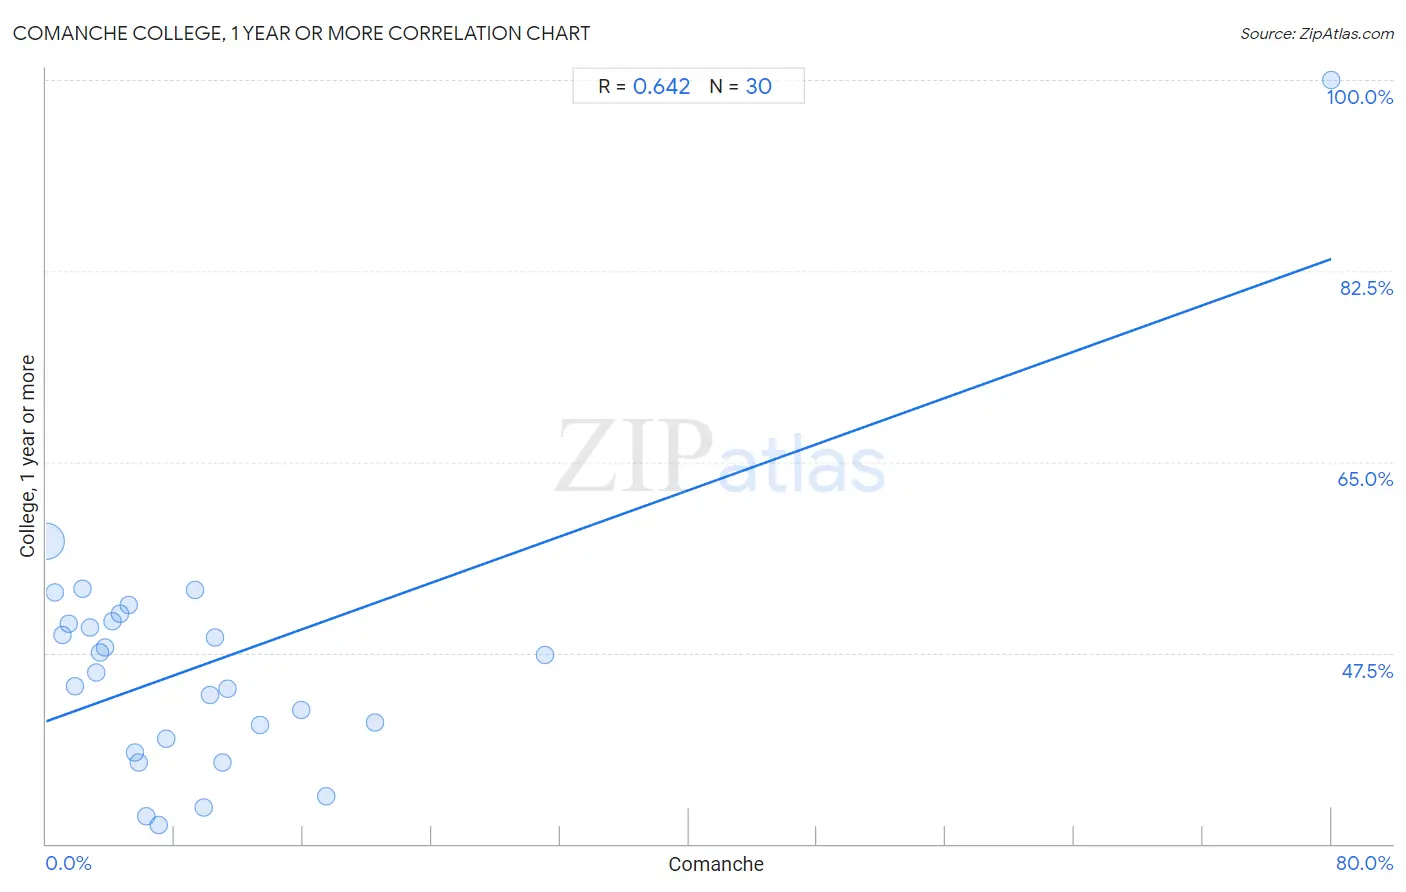
Comanche College, 1 year or more Correlation Chart
The statistical analysis conducted on geographies consisting of 109,786,512 people shows a significant positive correlation between the proportion of Comanche and percentage of population with at least college, 1 year or more education in the United States with a correlation coefficient (R) of 0.642 and weighted average of 54.4%. On average, for every 1% (one percent) increase in Comanche within a typical geography, there is an increase of 0.53% in percentage of population with at least college, 1 year or more education.
It is essential to understand that the correlation between the percentage of Comanche and percentage of population with at least college, 1 year or more education does not imply a direct cause-and-effect relationship. It remains uncertain whether the presence of Comanche influences an upward or downward trend in the level of percentage of population with at least college, 1 year or more education within an area, or if Comanche simply ended up residing in those areas with higher or lower levels of percentage of population with at least college, 1 year or more education due to other factors.
Demographics Similar to Comanche by College, 1 year or more
In terms of college, 1 year or more, the demographic groups most similar to Comanche are Immigrants from Grenada (54.4%, a difference of 0.040%), Bahamian (54.5%, a difference of 0.050%), Crow (54.5%, a difference of 0.070%), Belizean (54.4%, a difference of 0.080%), and Bangladeshi (54.5%, a difference of 0.10%).
| Demographics | Rating | Rank | College, 1 year or more |
| Immigrants from Laos | 0.2 /100 | #265 | Tragic 54.7% |
| Potawatomi | 0.2 /100 | #266 | Tragic 54.6% |
| Blackfeet | 0.2 /100 | #267 | Tragic 54.6% |
| British West Indians | 0.2 /100 | #268 | Tragic 54.5% |
| Bangladeshis | 0.2 /100 | #269 | Tragic 54.5% |
| Crow | 0.2 /100 | #270 | Tragic 54.5% |
| Bahamians | 0.2 /100 | #271 | Tragic 54.5% |
| Comanche | 0.2 /100 | #272 | Tragic 54.4% |
| Immigrants from Grenada | 0.2 /100 | #273 | Tragic 54.4% |
| Belizeans | 0.2 /100 | #274 | Tragic 54.4% |
| Americans | 0.2 /100 | #275 | Tragic 54.4% |
| Shoshone | 0.2 /100 | #276 | Tragic 54.3% |
| Ecuadorians | 0.2 /100 | #277 | Tragic 54.3% |
| Immigrants from Jamaica | 0.1 /100 | #278 | Tragic 54.2% |
| Arapaho | 0.1 /100 | #279 | Tragic 54.1% |
Comanche College, 1 year or more Correlation Summary
| Measurement | Comanche Data | College, 1 year or more Data |
| Minimum | 0.034% | 31.7% |
| Maximum | 80.0% | 100.0% |
| Range | 80.0% | 68.3% |
| Mean | 10.2% | 46.6% |
| Median | 6.0% | 46.5% |
| Interquartile 25% (IQ1) | 3.1% | 39.6% |
| Interquartile 75% (IQ3) | 11.0% | 50.4% |
| Interquartile Range (IQR) | 7.9% | 10.8% |
| Standard Deviation (Sample) | 14.8% | 12.2% |
| Standard Deviation (Population) | 14.6% | 12.0% |
Correlation Details
| Comanche Percentile | Sample Size | College, 1 year or more |
[ 0.0% - 0.5% ] 0.034% | 108,084,093 | 57.7% |
[ 0.5% - 1.0% ] 0.53% | 1,132,107 | 53.0% |
[ 0.5% - 1.0% ] 0.98% | 166,607 | 49.2% |
[ 1.0% - 1.5% ] 1.40% | 65,900 | 50.2% |
[ 1.5% - 2.0% ] 1.80% | 37,119 | 44.5% |
[ 2.0% - 2.5% ] 2.26% | 19,946 | 53.4% |
[ 2.5% - 3.0% ] 2.69% | 159,813 | 49.8% |
[ 3.0% - 3.5% ] 3.12% | 35,480 | 45.7% |
[ 3.0% - 3.5% ] 3.38% | 6,885 | 47.6% |
[ 3.5% - 4.0% ] 3.65% | 25,958 | 48.0% |
[ 4.0% - 4.5% ] 4.11% | 1,654 | 50.4% |
[ 4.5% - 5.0% ] 4.61% | 4,145 | 51.1% |
[ 5.0% - 5.5% ] 5.17% | 4,986 | 51.9% |
[ 5.5% - 6.0% ] 5.50% | 10,507 | 38.4% |
[ 5.5% - 6.0% ] 5.78% | 2,994 | 37.4% |
[ 6.0% - 6.5% ] 6.23% | 6,086 | 32.6% |
[ 6.5% - 7.0% ] 6.98% | 2,520 | 31.7% |
[ 7.0% - 7.5% ] 7.49% | 3,230 | 39.6% |
[ 9.0% - 9.5% ] 9.29% | 312 | 53.2% |
[ 9.5% - 10.0% ] 9.83% | 2,563 | 33.3% |
[ 10.0% - 10.5% ] 10.20% | 49 | 43.6% |
[ 10.5% - 11.0% ] 10.52% | 4,867 | 48.9% |
[ 10.5% - 11.0% ] 10.99% | 1,438 | 37.4% |
[ 11.0% - 11.5% ] 11.26% | 1,377 | 44.2% |
[ 13.0% - 13.5% ] 13.27% | 1,341 | 40.9% |
[ 15.5% - 16.0% ] 15.87% | 2,974 | 42.3% |
[ 17.0% - 17.5% ] 17.46% | 1,065 | 34.4% |
[ 20.0% - 20.5% ] 20.49% | 288 | 41.1% |
[ 31.0% - 31.5% ] 31.03% | 203 | 47.3% |
[ 80.0% - 80.5% ] 80.00% | 5 | 100.0% |