Comanche 2 or more Vehicles in Household
COMPARE
Comanche
Select to Compare
2 or more Vehicles in Household
Comanche 2 or more Vehicles in Household
56.5%
2+ VEHICLES AVAILABLE
88.4/ 100
METRIC RATING
133rd/ 347
METRIC RANK
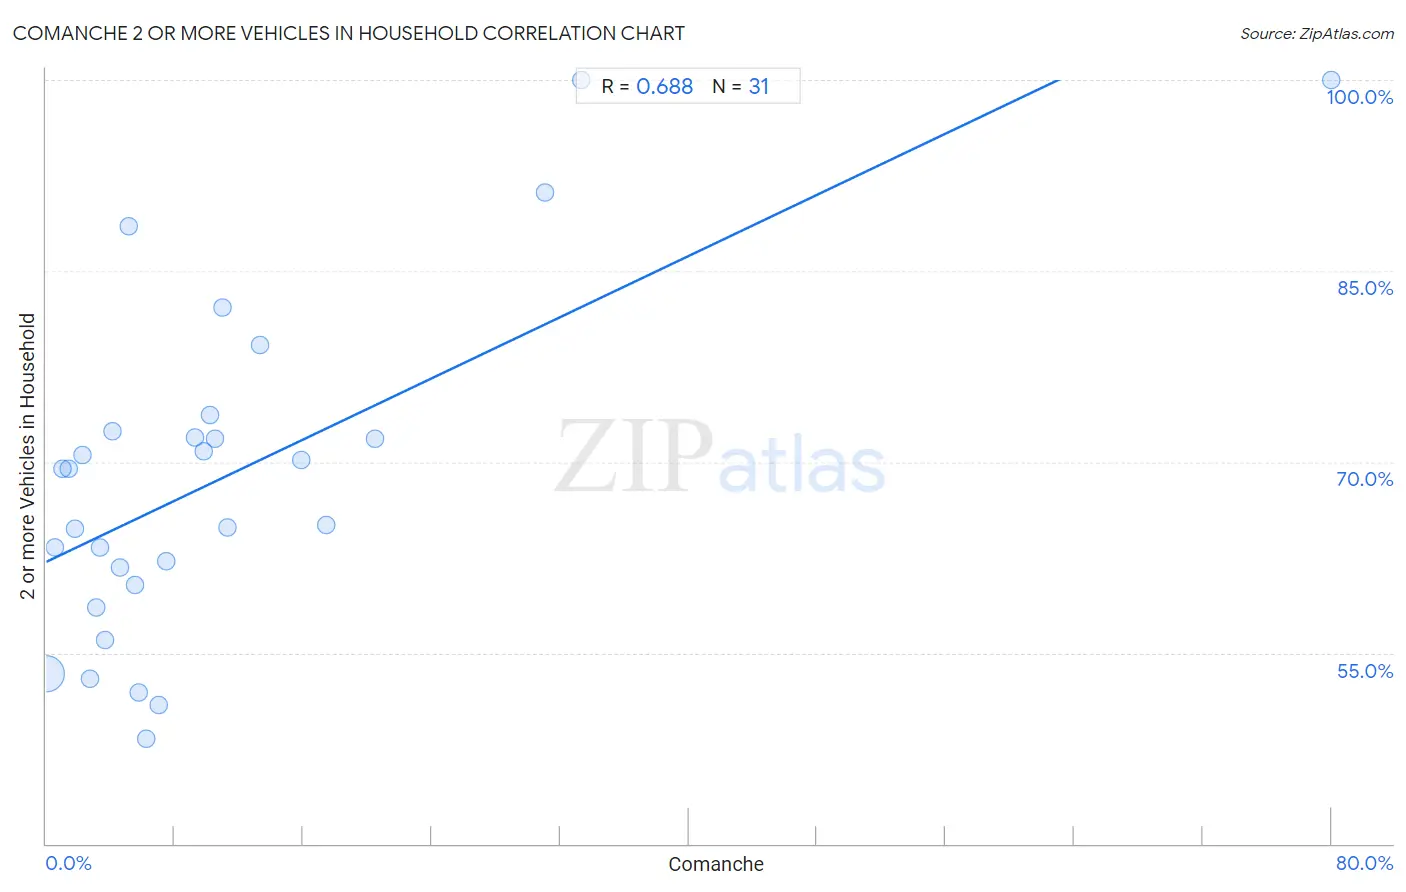
Comanche 2 or more Vehicles in Household Correlation Chart
The statistical analysis conducted on geographies consisting of 109,768,112 people shows a significant positive correlation between the proportion of Comanche and percentage of households with 2 or more vehicles available in the United States with a correlation coefficient (R) of 0.688 and weighted average of 56.5%. On average, for every 1% (one percent) increase in Comanche within a typical geography, there is an increase of 0.60% in percentage of households with 2 or more vehicles available.
It is essential to understand that the correlation between the percentage of Comanche and percentage of households with 2 or more vehicles available does not imply a direct cause-and-effect relationship. It remains uncertain whether the presence of Comanche influences an upward or downward trend in the level of percentage of households with 2 or more vehicles available within an area, or if Comanche simply ended up residing in those areas with higher or lower levels of percentage of households with 2 or more vehicles available due to other factors.
Demographics Similar to Comanche by 2 or more Vehicles in Household
In terms of 2 or more vehicles in household, the demographic groups most similar to Comanche are Hungarian (56.5%, a difference of 0.070%), Bulgarian (56.5%, a difference of 0.14%), Immigrants from the Azores (56.4%, a difference of 0.16%), Blackfeet (56.4%, a difference of 0.16%), and Yugoslavian (56.6%, a difference of 0.17%).
| Demographics | Rating | Rank | 2 or more Vehicles in Household |
| Estonians | 90.9 /100 | #126 | Exceptional 56.6% |
| Immigrants from Thailand | 90.7 /100 | #127 | Exceptional 56.6% |
| Immigrants from South Central Asia | 90.5 /100 | #128 | Exceptional 56.6% |
| Ute | 90.4 /100 | #129 | Exceptional 56.6% |
| Yugoslavians | 90.0 /100 | #130 | Exceptional 56.6% |
| Bulgarians | 89.7 /100 | #131 | Excellent 56.5% |
| Hungarians | 89.1 /100 | #132 | Excellent 56.5% |
| Comanche | 88.4 /100 | #133 | Excellent 56.5% |
| Immigrants from the Azores | 86.6 /100 | #134 | Excellent 56.4% |
| Blackfeet | 86.5 /100 | #135 | Excellent 56.4% |
| Immigrants from Asia | 86.0 /100 | #136 | Excellent 56.3% |
| Cubans | 84.8 /100 | #137 | Excellent 56.3% |
| Salvadorans | 84.7 /100 | #138 | Excellent 56.3% |
| Armenians | 84.3 /100 | #139 | Excellent 56.3% |
| Latvians | 83.6 /100 | #140 | Excellent 56.2% |
Comanche 2 or more Vehicles in Household Correlation Summary
| Measurement | Comanche Data | 2 or more Vehicles in Household Data |
| Minimum | 0.034% | 48.2% |
| Maximum | 80.0% | 100.0% |
| Range | 80.0% | 51.8% |
| Mean | 10.9% | 68.7% |
| Median | 6.2% | 69.4% |
| Interquartile 25% (IQ1) | 3.1% | 60.3% |
| Interquartile 75% (IQ3) | 11.3% | 72.4% |
| Interquartile Range (IQR) | 8.1% | 12.1% |
| Standard Deviation (Sample) | 15.1% | 13.2% |
| Standard Deviation (Population) | 14.9% | 13.0% |
Correlation Details
| Comanche Percentile | Sample Size | 2 or more Vehicles in Household |
[ 0.0% - 0.5% ] 0.034% | 108,068,473 | 53.3% |
[ 0.5% - 1.0% ] 0.53% | 1,132,107 | 63.2% |
[ 0.5% - 1.0% ] 0.98% | 165,510 | 69.4% |
[ 1.0% - 1.5% ] 1.40% | 64,639 | 69.5% |
[ 1.5% - 2.0% ] 1.80% | 37,119 | 64.8% |
[ 2.0% - 2.5% ] 2.26% | 19,946 | 70.5% |
[ 2.5% - 3.0% ] 2.69% | 159,813 | 53.0% |
[ 3.0% - 3.5% ] 3.12% | 35,040 | 58.5% |
[ 3.0% - 3.5% ] 3.38% | 6,885 | 63.2% |
[ 3.5% - 4.0% ] 3.65% | 25,958 | 56.0% |
[ 4.0% - 4.5% ] 4.11% | 1,654 | 72.4% |
[ 4.5% - 5.0% ] 4.61% | 4,145 | 61.7% |
[ 5.0% - 5.5% ] 5.17% | 4,986 | 88.5% |
[ 5.5% - 6.0% ] 5.50% | 10,507 | 60.3% |
[ 5.5% - 6.0% ] 5.78% | 2,994 | 51.9% |
[ 6.0% - 6.5% ] 6.23% | 6,086 | 48.2% |
[ 6.5% - 7.0% ] 6.98% | 2,520 | 50.9% |
[ 7.0% - 7.5% ] 7.49% | 3,230 | 62.2% |
[ 9.0% - 9.5% ] 9.29% | 312 | 71.9% |
[ 9.5% - 10.0% ] 9.83% | 2,563 | 70.9% |
[ 10.0% - 10.5% ] 10.20% | 49 | 73.7% |
[ 10.5% - 11.0% ] 10.52% | 4,867 | 71.9% |
[ 10.5% - 11.0% ] 10.99% | 1,438 | 82.1% |
[ 11.0% - 11.5% ] 11.26% | 1,377 | 64.8% |
[ 13.0% - 13.5% ] 13.27% | 1,341 | 79.2% |
[ 15.5% - 16.0% ] 15.87% | 2,974 | 70.1% |
[ 17.0% - 17.5% ] 17.46% | 1,065 | 65.0% |
[ 20.0% - 20.5% ] 20.49% | 288 | 71.8% |
[ 31.0% - 31.5% ] 31.03% | 203 | 91.2% |
[ 33.0% - 33.5% ] 33.33% | 18 | 100.0% |
[ 80.0% - 80.5% ] 80.00% | 5 | 100.0% |