Comanche Disability Age 5 to 17
COMPARE
Comanche
Select to Compare
Disability Age 5 to 17
Comanche Disability Age 5 to 17
6.4%
DISABILITY | AGE 5 TO 17
0.0/ 100
METRIC RATING
318th/ 347
METRIC RANK
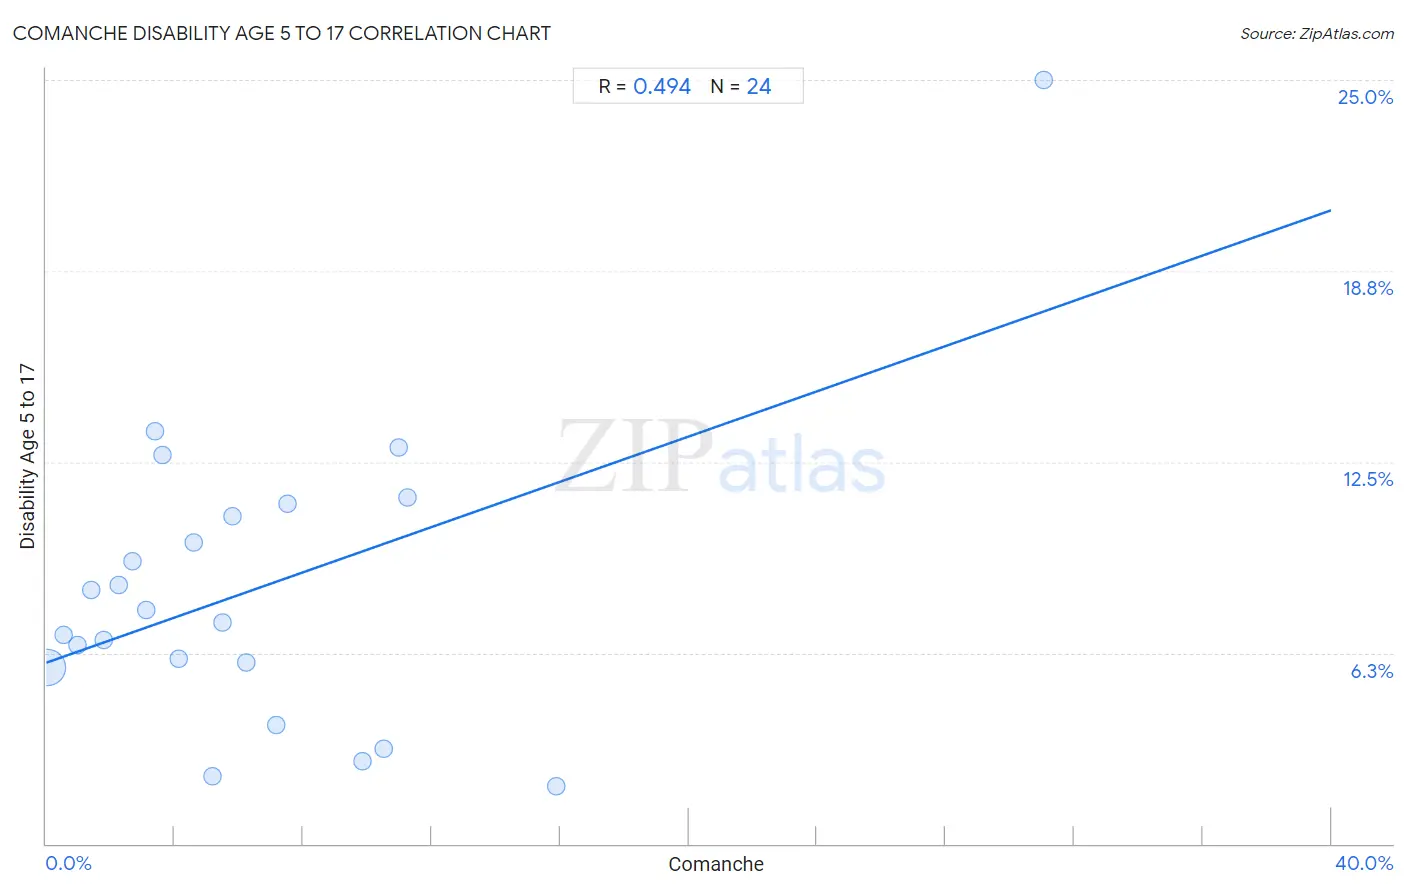
Comanche Disability Age 5 to 17 Correlation Chart
The statistical analysis conducted on geographies consisting of 109,534,984 people shows a moderate positive correlation between the proportion of Comanche and percentage of population with a disability between the ages 5 and 17 in the United States with a correlation coefficient (R) of 0.494 and weighted average of 6.4%. On average, for every 1% (one percent) increase in Comanche within a typical geography, there is an increase of 0.37% in percentage of population with a disability between the ages 5 and 17.
It is essential to understand that the correlation between the percentage of Comanche and percentage of population with a disability between the ages 5 and 17 does not imply a direct cause-and-effect relationship. It remains uncertain whether the presence of Comanche influences an upward or downward trend in the level of percentage of population with a disability between the ages 5 and 17 within an area, or if Comanche simply ended up residing in those areas with higher or lower levels of percentage of population with a disability between the ages 5 and 17 due to other factors.
Demographics Similar to Comanche by Disability Age 5 to 17
In terms of disability age 5 to 17, the demographic groups most similar to Comanche are Kiowa (6.4%, a difference of 0.030%), Immigrants from Dominican Republic (6.4%, a difference of 0.16%), Immigrants from Portugal (6.4%, a difference of 0.34%), French (6.4%, a difference of 0.51%), and Delaware (6.5%, a difference of 0.55%).
| Demographics | Rating | Rank | Disability Age 5 to 17 |
| Immigrants from Dominica | 0.0 /100 | #311 | Tragic 6.3% |
| Bermudans | 0.0 /100 | #312 | Tragic 6.4% |
| Apache | 0.0 /100 | #313 | Tragic 6.4% |
| French | 0.0 /100 | #314 | Tragic 6.4% |
| Immigrants from Portugal | 0.0 /100 | #315 | Tragic 6.4% |
| Immigrants from Dominican Republic | 0.0 /100 | #316 | Tragic 6.4% |
| Kiowa | 0.0 /100 | #317 | Tragic 6.4% |
| Comanche | 0.0 /100 | #318 | Tragic 6.4% |
| Delaware | 0.0 /100 | #319 | Tragic 6.5% |
| Africans | 0.0 /100 | #320 | Tragic 6.5% |
| Tohono O'odham | 0.0 /100 | #321 | Tragic 6.5% |
| Slovaks | 0.0 /100 | #322 | Tragic 6.5% |
| Osage | 0.0 /100 | #323 | Tragic 6.5% |
| Dominicans | 0.0 /100 | #324 | Tragic 6.5% |
| Americans | 0.0 /100 | #325 | Tragic 6.5% |
Comanche Disability Age 5 to 17 Correlation Summary
| Measurement | Comanche Data | Disability Age 5 to 17 Data |
| Minimum | 0.034% | 1.9% |
| Maximum | 31.0% | 25.0% |
| Range | 31.0% | 23.1% |
| Mean | 6.5% | 8.3% |
| Median | 4.9% | 7.4% |
| Interquartile 25% (IQ1) | 2.5% | 5.9% |
| Interquartile 75% (IQ3) | 8.7% | 10.9% |
| Interquartile Range (IQR) | 6.2% | 5.1% |
| Standard Deviation (Sample) | 6.6% | 4.9% |
| Standard Deviation (Population) | 6.4% | 4.8% |
Correlation Details
| Comanche Percentile | Sample Size | Disability Age 5 to 17 |
[ 0.0% - 0.5% ] 0.034% | 107,911,520 | 5.8% |
[ 0.5% - 1.0% ] 0.53% | 1,092,280 | 6.8% |
[ 0.5% - 1.0% ] 0.98% | 159,299 | 6.5% |
[ 1.0% - 1.5% ] 1.40% | 56,264 | 8.3% |
[ 1.5% - 2.0% ] 1.79% | 34,151 | 6.7% |
[ 2.0% - 2.5% ] 2.27% | 16,766 | 8.5% |
[ 2.5% - 3.0% ] 2.69% | 159,135 | 9.3% |
[ 3.0% - 3.5% ] 3.13% | 29,611 | 7.7% |
[ 3.0% - 3.5% ] 3.38% | 6,471 | 13.5% |
[ 3.5% - 4.0% ] 3.64% | 22,953 | 12.7% |
[ 4.0% - 4.5% ] 4.11% | 1,654 | 6.0% |
[ 4.5% - 5.0% ] 4.61% | 4,145 | 9.9% |
[ 5.0% - 5.5% ] 5.19% | 4,219 | 2.2% |
[ 5.5% - 6.0% ] 5.50% | 9,636 | 7.2% |
[ 5.5% - 6.0% ] 5.78% | 2,994 | 10.7% |
[ 6.0% - 6.5% ] 6.23% | 6,086 | 5.9% |
[ 7.0% - 7.5% ] 7.14% | 1,148 | 3.9% |
[ 7.0% - 7.5% ] 7.49% | 3,230 | 11.1% |
[ 9.5% - 10.0% ] 9.83% | 2,563 | 2.7% |
[ 10.5% - 11.0% ] 10.52% | 4,867 | 3.1% |
[ 10.5% - 11.0% ] 10.99% | 1,438 | 13.0% |
[ 11.0% - 11.5% ] 11.26% | 1,377 | 11.3% |
[ 15.5% - 16.0% ] 15.87% | 2,974 | 1.9% |
[ 31.0% - 31.5% ] 31.03% | 203 | 25.0% |