Comanche GED/Equivalency
COMPARE
Comanche
Select to Compare
GED/Equivalency
Comanche GED/Equivalency
83.6%
GED/EQUIVALENCY
0.7/ 100
METRIC RATING
253rd/ 347
METRIC RANK
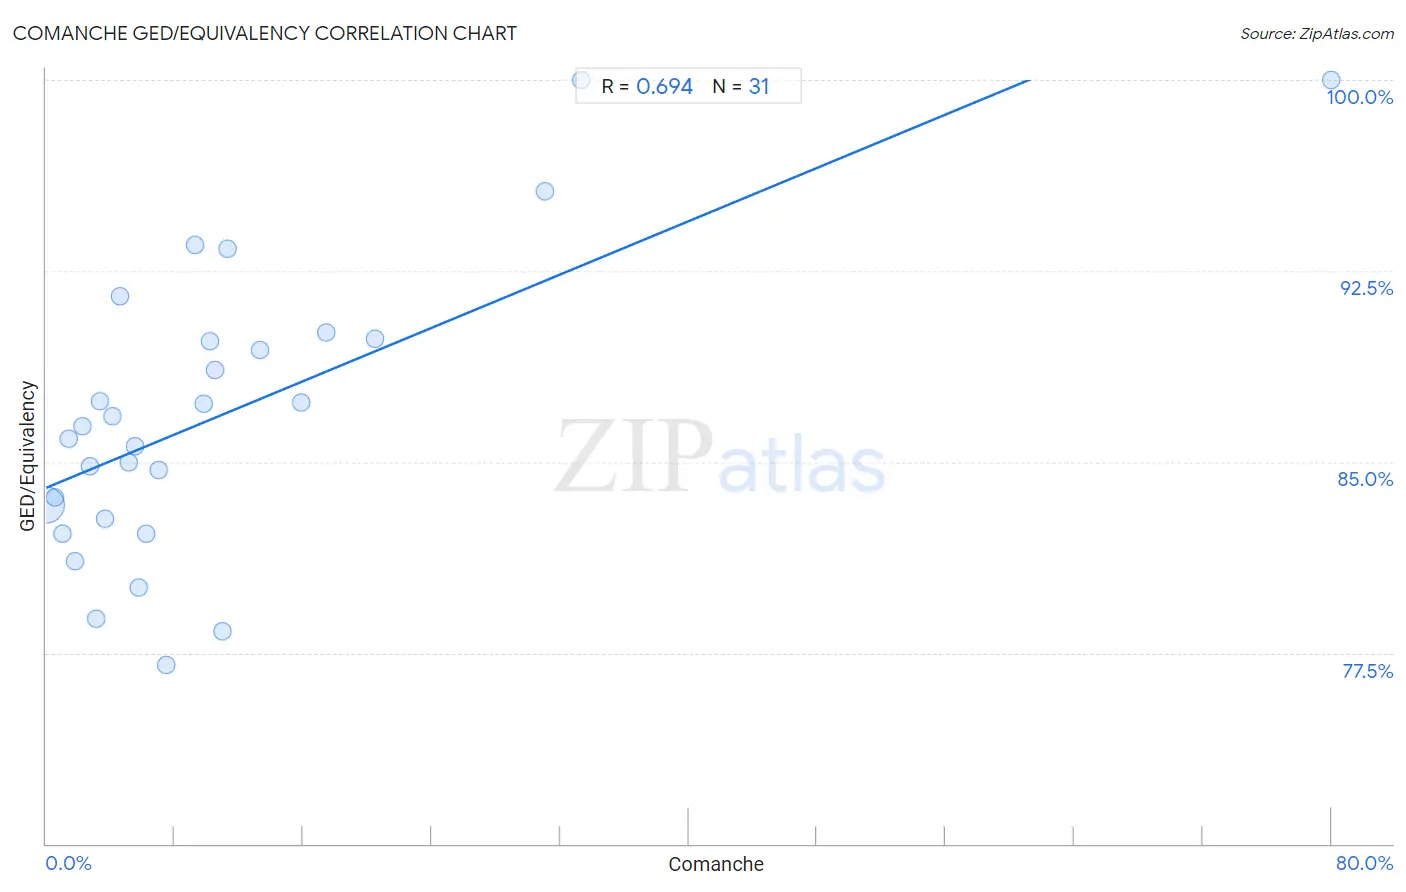
Comanche GED/Equivalency Correlation Chart
The statistical analysis conducted on geographies consisting of 109,786,530 people shows a significant positive correlation between the proportion of Comanche and percentage of population with at least ged/equivalency education in the United States with a correlation coefficient (R) of 0.694 and weighted average of 83.6%. On average, for every 1% (one percent) increase in Comanche within a typical geography, there is an increase of 0.26% in percentage of population with at least ged/equivalency education.
It is essential to understand that the correlation between the percentage of Comanche and percentage of population with at least ged/equivalency education does not imply a direct cause-and-effect relationship. It remains uncertain whether the presence of Comanche influences an upward or downward trend in the level of percentage of population with at least ged/equivalency education within an area, or if Comanche simply ended up residing in those areas with higher or lower levels of percentage of population with at least ged/equivalency education due to other factors.
Demographics Similar to Comanche by GED/Equivalency
In terms of ged/equivalency, the demographic groups most similar to Comanche are Creek (83.6%, a difference of 0.030%), Spanish American (83.6%, a difference of 0.060%), Bahamian (83.6%, a difference of 0.060%), Colville (83.4%, a difference of 0.20%), and African (83.4%, a difference of 0.20%).
| Demographics | Rating | Rank | GED/Equivalency |
| Chickasaw | 1.2 /100 | #246 | Tragic 83.8% |
| Immigrants from Western Africa | 1.1 /100 | #247 | Tragic 83.8% |
| Blackfeet | 1.1 /100 | #248 | Tragic 83.8% |
| Crow | 1.1 /100 | #249 | Tragic 83.8% |
| Shoshone | 1.0 /100 | #250 | Tragic 83.7% |
| Spanish Americans | 0.8 /100 | #251 | Tragic 83.6% |
| Bahamians | 0.8 /100 | #252 | Tragic 83.6% |
| Comanche | 0.7 /100 | #253 | Tragic 83.6% |
| Creek | 0.7 /100 | #254 | Tragic 83.6% |
| Colville | 0.5 /100 | #255 | Tragic 83.4% |
| Africans | 0.5 /100 | #256 | Tragic 83.4% |
| Jamaicans | 0.4 /100 | #257 | Tragic 83.3% |
| Malaysians | 0.4 /100 | #258 | Tragic 83.3% |
| Immigrants from Vietnam | 0.3 /100 | #259 | Tragic 83.2% |
| Choctaw | 0.3 /100 | #260 | Tragic 83.1% |
Comanche GED/Equivalency Correlation Summary
| Measurement | Comanche Data | GED/Equivalency Data |
| Minimum | 0.034% | 77.0% |
| Maximum | 80.0% | 100.0% |
| Range | 80.0% | 23.0% |
| Mean | 10.9% | 86.9% |
| Median | 6.2% | 86.4% |
| Interquartile 25% (IQ1) | 3.1% | 82.8% |
| Interquartile 75% (IQ3) | 11.3% | 89.8% |
| Interquartile Range (IQR) | 8.1% | 7.1% |
| Standard Deviation (Sample) | 15.1% | 5.7% |
| Standard Deviation (Population) | 14.9% | 5.6% |
Correlation Details
| Comanche Percentile | Sample Size | GED/Equivalency |
[ 0.0% - 0.5% ] 0.034% | 108,084,093 | 83.3% |
[ 0.5% - 1.0% ] 0.53% | 1,132,107 | 83.6% |
[ 0.5% - 1.0% ] 0.98% | 166,607 | 82.2% |
[ 1.0% - 1.5% ] 1.40% | 65,900 | 85.9% |
[ 1.5% - 2.0% ] 1.80% | 37,119 | 81.1% |
[ 2.0% - 2.5% ] 2.26% | 19,946 | 86.4% |
[ 2.5% - 3.0% ] 2.69% | 159,813 | 84.9% |
[ 3.0% - 3.5% ] 3.12% | 35,480 | 78.8% |
[ 3.0% - 3.5% ] 3.38% | 6,885 | 87.4% |
[ 3.5% - 4.0% ] 3.65% | 25,958 | 82.8% |
[ 4.0% - 4.5% ] 4.11% | 1,654 | 86.8% |
[ 4.5% - 5.0% ] 4.61% | 4,145 | 91.5% |
[ 5.0% - 5.5% ] 5.17% | 4,986 | 85.0% |
[ 5.5% - 6.0% ] 5.50% | 10,507 | 85.6% |
[ 5.5% - 6.0% ] 5.78% | 2,994 | 80.1% |
[ 6.0% - 6.5% ] 6.23% | 6,086 | 82.2% |
[ 6.5% - 7.0% ] 6.98% | 2,520 | 84.7% |
[ 7.0% - 7.5% ] 7.49% | 3,230 | 77.0% |
[ 9.0% - 9.5% ] 9.29% | 312 | 93.5% |
[ 9.5% - 10.0% ] 9.83% | 2,563 | 87.3% |
[ 10.0% - 10.5% ] 10.20% | 49 | 89.7% |
[ 10.5% - 11.0% ] 10.52% | 4,867 | 88.6% |
[ 10.5% - 11.0% ] 10.99% | 1,438 | 78.4% |
[ 11.0% - 11.5% ] 11.26% | 1,377 | 93.4% |
[ 13.0% - 13.5% ] 13.27% | 1,341 | 89.4% |
[ 15.5% - 16.0% ] 15.87% | 2,974 | 87.3% |
[ 17.0% - 17.5% ] 17.46% | 1,065 | 90.1% |
[ 20.0% - 20.5% ] 20.49% | 288 | 89.8% |
[ 31.0% - 31.5% ] 31.03% | 203 | 95.7% |
[ 33.0% - 33.5% ] 33.33% | 18 | 100.0% |
[ 80.0% - 80.5% ] 80.00% | 5 | 100.0% |