Comanche vs Immigrants from Pakistan Wage/Income Gap

COMPARE

Comanche
Race
Ancestry
AfghanAfricanAlaska NativeAlaskan AthabascanAlbanianAleutAlsatianAmericanApacheArabArapahoArgentineanArmenianAssyrian/Chaldean/SyriacAustralianAustrianBahamianBangladeshiBarbadianBasqueBelgianBelizeanBermudanBhutaneseBlackfeetBolivianBrazilianBritishBritish West IndianBulgarianBurmeseCajunCambodianCanadianCape VerdeanCarpatho RusynCelticCentral AmericanCentral American IndianCherokeeCheyenneChickasawChileanChineseChippewaChoctawColombianColvilleComancheCosta RicanCreeCreekCroatianCrowCubanCypriotCzechCzechoslovakianDanishDelawareDominicanDutchDutch West IndianEastern EuropeanEcuadorianEgyptianEnglishEstonianEthiopianEuropeanFijianFilipinoFinnishFrenchFrench American IndianFrench CanadianGermanGerman RussianGhanaianGreekGuamanian/ChamorroGuatemalanGuyaneseHaitianHmongHonduranHopiHoumaHungarianIcelanderIndian (Asian)IndonesianInupiatIranianIraqiIrishIroquoisIsraeliItalianJamaicanJapaneseJordanianKenyanKiowaKoreanLaotianLatvianLebaneseLiberianLithuanianLumbeeLuxembourgerMacedonianMalaysianMalteseMarshalleseMenomineeMexicanMexican American IndianMongolianMoroccanNative HawaiianNavajoNepaleseNew ZealanderNicaraguanNigerianNorthern EuropeanNorwegianOkinawanOsageOttawaPaiutePakistaniPalestinianPanamanianParaguayanPennsylvania GermanPeruvianPimaPolishPortuguesePotawatomiPuebloPuerto RicanPuget Sound SalishRomanianRussianSalvadoranSamoanScandinavianScotch-IrishScottishSeminoleSenegaleseSerbianShoshoneSierra LeoneanSiouxSlavicSlovakSloveneSomaliSouth AfricanSouth AmericanSouth American IndianSoviet UnionSpaniardSpanishSpanish AmericanSpanish American IndianSri LankanSubsaharan AfricanSudaneseSwedishSwissSyrianTaiwaneseThaiTlingit-HaidaTohono O'OdhamTonganTrinidadian and TobagonianTsimshianTurkishU.S. Virgin IslanderUgandanUkrainianUruguayanUteVenezuelanVietnameseWelshWest IndianYakamaYaquiYugoslavianYumanYup'ikZimbabwean
Immigration
NonimmigrantsImmigrantsAfghanistanAfricaAlbaniaArgentinaArmeniaAsiaAustraliaAustriaBahamasBangladeshBarbadosBelarusBelgiumBelizeBoliviaBosnia and HerzegovinaBrazilBulgariaBurma/MyanmarCabo VerdeCambodiaCameroonCanadaCaribbeanCentral AmericaChileChinaColombiaCongoCosta RicaCroatiaCubaCzechoslovakiaDenmarkDominicaDominican RepublicEastern AfricaEastern AsiaEastern EuropeEcuadorEgyptEl SalvadorEnglandEritreaEthiopiaEuropeFijiFranceGermanyGhanaGreeceGrenadaGuatemalaGuyanaHaitiHondurasHong KongHungaryIndiaIndonesiaIranIraqIrelandIsraelItalyJamaicaJapanJordanKazakhstanKenyaKoreaKuwaitLaosLatin AmericaLatviaLebanonLiberiaLithuaniaMalaysiaMexicoMicronesiaMiddle AfricaMoldovaMoroccoNepalNetherlandsNicaraguaNigeriaNorth AmericaNorth MacedoniaNorthern AfricaNorthern EuropeNorwayOceaniaPanamaPeruPhilippinesPolandPortugalRomaniaRussiaSaudi ArabiaScotlandSenegalSerbiaSierra LeoneSingaporeSomaliaSouth AfricaSouth AmericaSouth Central AsiaSouth Eastern AsiaSouthern EuropeSpainSri LankaSt. Vincent and the GrenadinesSudanSwedenSwitzerlandSyriaTaiwanThailandTrinidad and TobagoTurkeyUgandaUkraineUruguayUzbekistanVenezuelaVietnamWest IndiesWestern AfricaWestern AsiaWestern EuropeYemenZaireZimbabweAzores
Immigrants from Pakistan
Race
Ancestry
AfghanAfricanAlaska NativeAlaskan AthabascanAlbanianAleutAlsatianAmericanApacheArabArapahoArgentineanArmenianAssyrian/Chaldean/SyriacAustralianAustrianBahamianBangladeshiBarbadianBasqueBelgianBelizeanBermudanBhutaneseBlackfeetBolivianBrazilianBritishBritish West IndianBulgarianBurmeseCajunCambodianCanadianCape VerdeanCarpatho RusynCelticCentral AmericanCentral American IndianCherokeeCheyenneChickasawChileanChineseChippewaChoctawColombianColvilleCosta RicanCreeCreekCroatianCrowCubanCypriotCzechCzechoslovakianDanishDelawareDominicanDutchDutch West IndianEastern EuropeanEcuadorianEgyptianEnglishEstonianEthiopianEuropeanFijianFilipinoFinnishFrenchFrench American IndianFrench CanadianGermanGerman RussianGhanaianGreekGuamanian/ChamorroGuatemalanGuyaneseHaitianHmongHonduranHopiHoumaHungarianIcelanderIndian (Asian)IndonesianInupiatIranianIraqiIrishIroquoisIsraeliItalianJamaicanJapaneseJordanianKenyanKiowaKoreanLaotianLatvianLebaneseLiberianLithuanianLumbeeLuxembourgerMacedonianMalaysianMalteseMarshalleseMenomineeMexicanMexican American IndianMongolianMoroccanNative HawaiianNavajoNepaleseNew ZealanderNicaraguanNigerianNorthern EuropeanNorwegianOkinawanOsageOttawaPaiutePakistaniPalestinianPanamanianParaguayanPennsylvania GermanPeruvianPimaPolishPortuguesePotawatomiPuebloPuerto RicanPuget Sound SalishRomanianRussianSalvadoranSamoanScandinavianScotch-IrishScottishSeminoleSenegaleseSerbianShoshoneSierra LeoneanSiouxSlavicSlovakSloveneSomaliSouth AfricanSouth AmericanSouth American IndianSoviet UnionSpaniardSpanishSpanish AmericanSpanish American IndianSri LankanSubsaharan AfricanSudaneseSwedishSwissSyrianTaiwaneseThaiTlingit-HaidaTohono O'OdhamTonganTrinidadian and TobagonianTsimshianTurkishU.S. Virgin IslanderUgandanUkrainianUruguayanUteVenezuelanVietnameseWelshWest IndianYakamaYaquiYugoslavianYumanYup'ikZimbabwean
Immigration
NonimmigrantsImmigrantsAfghanistanAfricaAlbaniaArgentinaArmeniaAsiaAustraliaAustriaBahamasBangladeshBarbadosBelarusBelgiumBelizeBoliviaBosnia and HerzegovinaBrazilBulgariaBurma/MyanmarCabo VerdeCambodiaCameroonCanadaCaribbeanCentral AmericaChileChinaColombiaCongoCosta RicaCroatiaCubaCzechoslovakiaDenmarkDominicaDominican RepublicEastern AfricaEastern AsiaEastern EuropeEcuadorEgyptEl SalvadorEnglandEritreaEthiopiaEuropeFijiFranceGermanyGhanaGreeceGrenadaGuatemalaGuyanaHaitiHondurasHong KongHungaryIndiaIndonesiaIranIraqIrelandIsraelItalyJamaicaJapanJordanKazakhstanKenyaKoreaKuwaitLaosLatin AmericaLatviaLebanonLiberiaLithuaniaMalaysiaMexicoMicronesiaMiddle AfricaMoldovaMoroccoNepalNetherlandsNicaraguaNigeriaNorth AmericaNorth MacedoniaNorthern AfricaNorthern EuropeNorwayOceaniaPakistanPanamaPeruPhilippinesPolandPortugalRomaniaRussiaSaudi ArabiaScotlandSenegalSerbiaSierra LeoneSingaporeSomaliaSouth AfricaSouth AmericaSouth Central AsiaSouth Eastern AsiaSouthern EuropeSpainSri LankaSt. Vincent and the GrenadinesSudanSwedenSwitzerlandSyriaTaiwanThailandTrinidad and TobagoTurkeyUgandaUkraineUruguayUzbekistanVenezuelaVietnamWest IndiesWestern AfricaWestern AsiaWestern EuropeYemenZaireZimbabweAzores
Wage/Income Gap
Income
Poverty
Unemployment
Labor Participation
Family Structure
Vehicle Availability
Education Level
Disability

Wage/Income Gap Comparison

Comanche

Immigrants from Pakistan

Excellent
Tragic
25.0%
WAGE/INCOME GAP
85.2/ 100
METRIC RATING
145th/ 347
METRIC RANK
27.0%
WAGE/INCOME GAP
4.9/ 100
METRIC RATING
234th/ 347
METRIC RANK

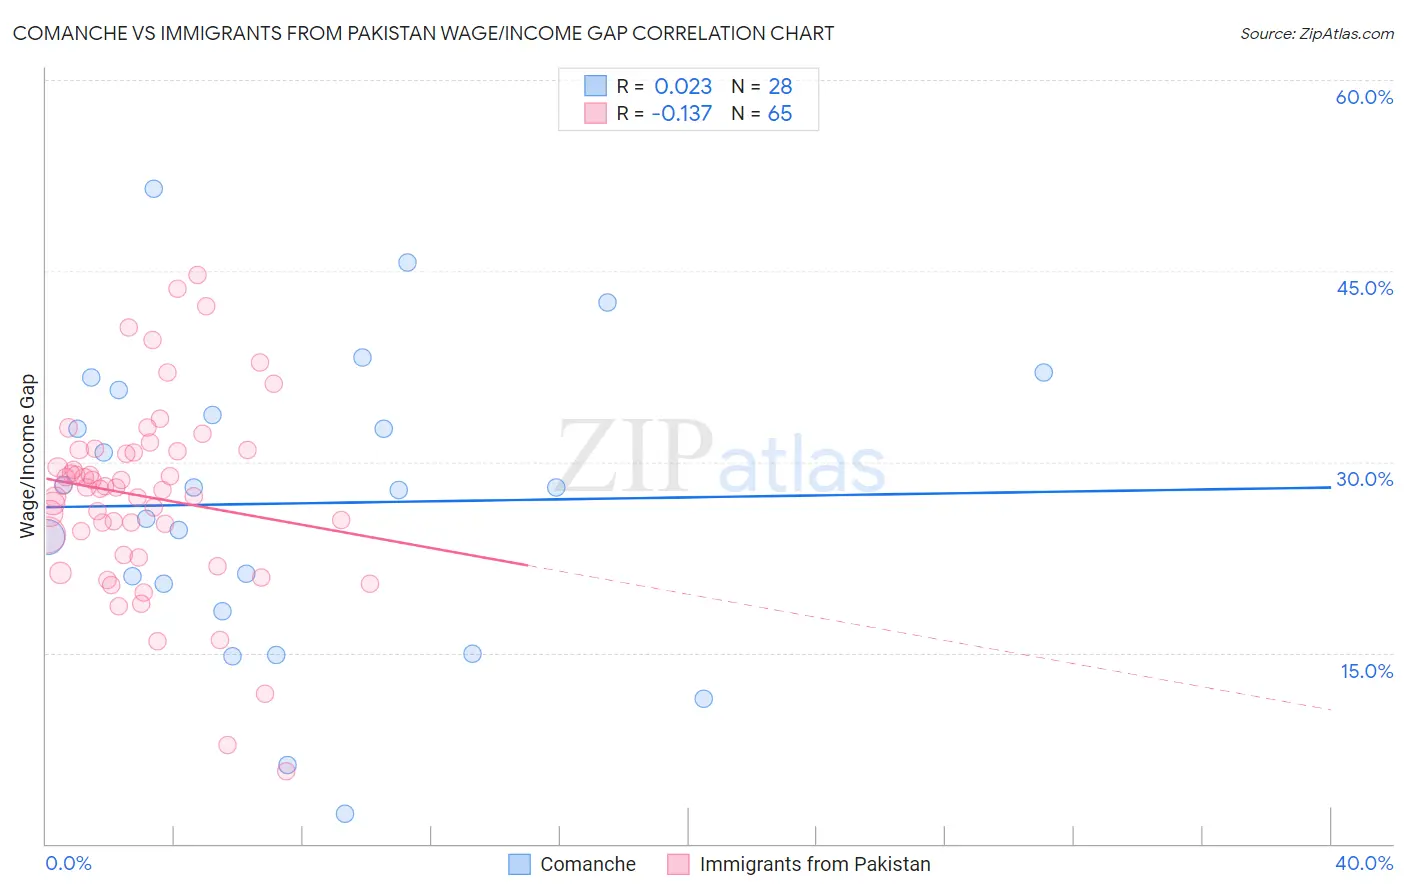
Comanche vs Immigrants from Pakistan Wage/Income Gap Correlation Chart

The statistical analysis conducted on geographies consisting of 109,744,354 people shows no correlation between the proportion of Comanche and wage/income gap percentage in the United States with a correlation coefficient (R) of 0.023 and weighted average of 25.0%. Similarly, the statistical analysis conducted on geographies consisting of 283,872,842 people shows a poor negative correlation between the proportion of Immigrants from Pakistan and wage/income gap percentage in the United States with a correlation coefficient (R) of -0.137 and weighted average of 27.0%, a difference of 7.9%.
Comanche vs Immigrants from Pakistan Wage/Income Gap

Wage/Income Gap Correlation Summary

MeasurementComancheImmigrants from Pakistan
Minimum2.4%5.7%
Maximum51.5%44.7%
Range49.1%39.0%
Mean26.7%27.3%
Median27.9%28.0%
Interquartile 25% (IQ1)19.4%23.5%
Interquartile 75% (IQ3)34.7%30.9%
Interquartile Range (IQR)15.3%7.4%
Standard Deviation (Sample)11.6%7.4%
Standard Deviation (Population)11.4%7.4%

Similar Demographics by Wage/Income Gap

Demographics Similar to Comanche by Wage/Income Gap

In terms of wage/income gap, the demographic groups most similar to Comanche are South American (25.0%, a difference of 0.0%), Malaysian (25.0%, a difference of 0.030%), Iroquois (25.1%, a difference of 0.16%), Chippewa (25.0%, a difference of 0.24%), and Immigrants from Peru (25.1%, a difference of 0.31%).
DemographicsRating | RankWage/Income Gap
Immigrants | Bosnia and Herzegovina
90.1
/100
|
#138
Exceptional
24.8%
Hispanics or Latinos
89.5
/100
|
#139
Excellent
24.9%
Immigrants | Nepal
89.3
/100
|
#140
Excellent
24.9%
Hawaiians
89.3
/100
|
#141
Excellent
24.9%
Afghans
88.1
/100
|
#142
Excellent
24.9%
Immigrants | Uganda
88.0
/100
|
#143
Excellent
24.9%
Chippewa
86.9
/100
|
#144
Excellent
25.0%
Comanche
85.2
/100
|
#145
Excellent
25.0%
South Americans
85.2
/100
|
#146
Excellent
25.0%
Malaysians
84.9
/100
|
#147
Excellent
25.0%
Iroquois
83.9
/100
|
#148
Excellent
25.1%
Immigrants | Peru
82.6
/100
|
#149
Excellent
25.1%
Immigrants | Immigrants
82.3
/100
|
#150
Excellent
25.1%
Taiwanese
81.6
/100
|
#151
Excellent
25.1%
Uruguayans
81.3
/100
|
#152
Excellent
25.2%

Demographics Similar to Immigrants from Pakistan by Wage/Income Gap

In terms of wage/income gap, the demographic groups most similar to Immigrants from Pakistan are Immigrants from Hungary (27.0%, a difference of 0.010%), Immigrants from Romania (27.0%, a difference of 0.030%), Immigrants from Brazil (27.0%, a difference of 0.050%), Argentinean (27.0%, a difference of 0.11%), and Bhutanese (27.0%, a difference of 0.13%).
DemographicsRating | RankWage/Income Gap
Spaniards
5.6
/100
|
#227
Tragic
27.0%
Immigrants | Turkey
5.6
/100
|
#228
Tragic
27.0%
Immigrants | Asia
5.5
/100
|
#229
Tragic
27.0%
Ottawa
5.3
/100
|
#230
Tragic
27.0%
Bhutanese
5.3
/100
|
#231
Tragic
27.0%
Argentineans
5.2
/100
|
#232
Tragic
27.0%
Immigrants | Brazil
5.0
/100
|
#233
Tragic
27.0%
Immigrants | Pakistan
4.9
/100
|
#234
Tragic
27.0%
Immigrants | Hungary
4.8
/100
|
#235
Tragic
27.0%
Immigrants | Romania
4.8
/100
|
#236
Tragic
27.0%
Immigrants | Eastern Asia
4.4
/100
|
#237
Tragic
27.1%
Osage
4.4
/100
|
#238
Tragic
27.1%
Estonians
4.3
/100
|
#239
Tragic
27.1%
Immigrants | Europe
3.8
/100
|
#240
Tragic
27.1%
Creek
3.8
/100
|
#241
Tragic
27.1%