Comanche vs Immigrants from Dominican Republic Wage/Income Gap
COMPARE
Comanche
Immigrants from Dominican Republic
Wage/Income Gap
Wage/Income Gap Comparison
Comanche
Immigrants from Dominican Republic
25.0%
WAGE/INCOME GAP
85.2/ 100
METRIC RATING
145th/ 347
METRIC RANK
20.6%
WAGE/INCOME GAP
100.0/ 100
METRIC RATING
23rd/ 347
METRIC RANK
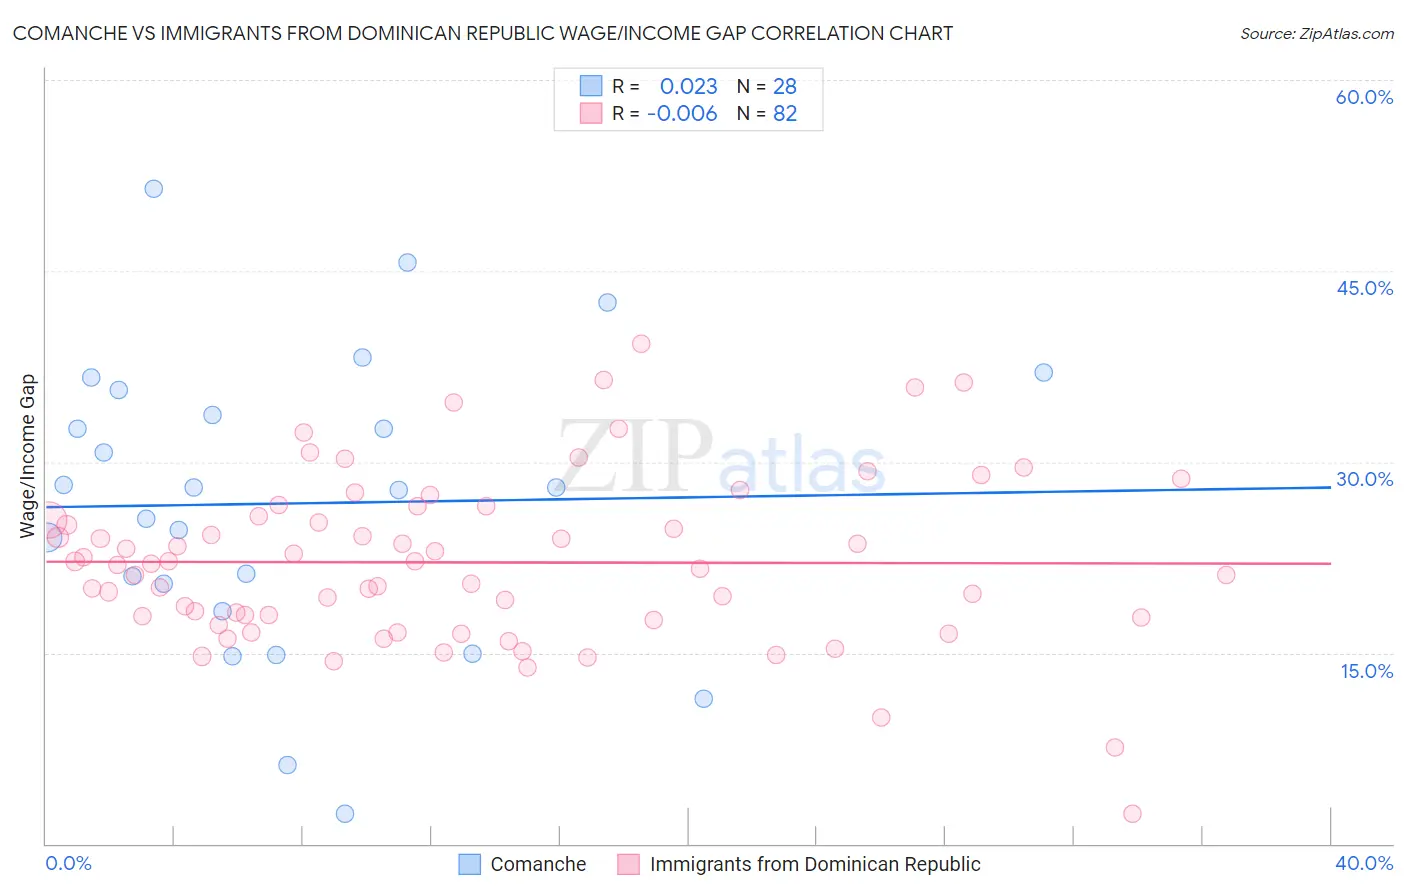
Comanche vs Immigrants from Dominican Republic Wage/Income Gap Correlation Chart
The statistical analysis conducted on geographies consisting of 109,744,354 people shows no correlation between the proportion of Comanche and wage/income gap percentage in the United States with a correlation coefficient (R) of 0.023 and weighted average of 25.0%. Similarly, the statistical analysis conducted on geographies consisting of 274,970,009 people shows no correlation between the proportion of Immigrants from Dominican Republic and wage/income gap percentage in the United States with a correlation coefficient (R) of -0.006 and weighted average of 20.6%, a difference of 21.8%.
Wage/Income Gap Correlation Summary
| Measurement | Comanche | Immigrants from Dominican Republic |
| Minimum | 2.4% | 2.4% |
| Maximum | 51.5% | 39.3% |
| Range | 49.1% | 36.9% |
| Mean | 26.7% | 22.1% |
| Median | 27.9% | 22.0% |
| Interquartile 25% (IQ1) | 19.4% | 17.7% |
| Interquartile 75% (IQ3) | 34.7% | 25.7% |
| Interquartile Range (IQR) | 15.3% | 8.0% |
| Standard Deviation (Sample) | 11.6% | 6.6% |
| Standard Deviation (Population) | 11.4% | 6.6% |
Similar Demographics by Wage/Income Gap
Demographics Similar to Comanche by Wage/Income Gap
In terms of wage/income gap, the demographic groups most similar to Comanche are South American (25.0%, a difference of 0.0%), Malaysian (25.0%, a difference of 0.030%), Iroquois (25.1%, a difference of 0.16%), Chippewa (25.0%, a difference of 0.24%), and Immigrants from Peru (25.1%, a difference of 0.31%).
| Demographics | Rating | Rank | Wage/Income Gap |
| Immigrants | Bosnia and Herzegovina | 90.1 /100 | #138 | Exceptional 24.8% |
| Hispanics or Latinos | 89.5 /100 | #139 | Excellent 24.9% |
| Immigrants | Nepal | 89.3 /100 | #140 | Excellent 24.9% |
| Hawaiians | 89.3 /100 | #141 | Excellent 24.9% |
| Afghans | 88.1 /100 | #142 | Excellent 24.9% |
| Immigrants | Uganda | 88.0 /100 | #143 | Excellent 24.9% |
| Chippewa | 86.9 /100 | #144 | Excellent 25.0% |
| Comanche | 85.2 /100 | #145 | Excellent 25.0% |
| South Americans | 85.2 /100 | #146 | Excellent 25.0% |
| Malaysians | 84.9 /100 | #147 | Excellent 25.0% |
| Iroquois | 83.9 /100 | #148 | Excellent 25.1% |
| Immigrants | Peru | 82.6 /100 | #149 | Excellent 25.1% |
| Immigrants | Immigrants | 82.3 /100 | #150 | Excellent 25.1% |
| Taiwanese | 81.6 /100 | #151 | Excellent 25.1% |
| Uruguayans | 81.3 /100 | #152 | Excellent 25.2% |
Demographics Similar to Immigrants from Dominican Republic by Wage/Income Gap
In terms of wage/income gap, the demographic groups most similar to Immigrants from Dominican Republic are Immigrants from Liberia (20.6%, a difference of 0.020%), Dominican (20.6%, a difference of 0.17%), Senegalese (20.7%, a difference of 0.47%), Pueblo (20.7%, a difference of 0.58%), and Immigrants from Armenia (20.7%, a difference of 0.78%).
| Demographics | Rating | Rank | Wage/Income Gap |
| Jamaicans | 100.0 /100 | #16 | Exceptional 19.6% |
| Haitians | 100.0 /100 | #17 | Exceptional 19.7% |
| Hopi | 100.0 /100 | #18 | Exceptional 20.0% |
| Immigrants | Dominica | 100.0 /100 | #19 | Exceptional 20.0% |
| Bahamians | 100.0 /100 | #20 | Exceptional 20.2% |
| Immigrants | Caribbean | 100.0 /100 | #21 | Exceptional 20.4% |
| Immigrants | Liberia | 100.0 /100 | #22 | Exceptional 20.6% |
| Immigrants | Dominican Republic | 100.0 /100 | #23 | Exceptional 20.6% |
| Dominicans | 100.0 /100 | #24 | Exceptional 20.6% |
| Senegalese | 100.0 /100 | #25 | Exceptional 20.7% |
| Pueblo | 100.0 /100 | #26 | Exceptional 20.7% |
| Immigrants | Armenia | 100.0 /100 | #27 | Exceptional 20.7% |
| Inupiat | 100.0 /100 | #28 | Exceptional 20.8% |
| Immigrants | Senegal | 100.0 /100 | #29 | Exceptional 20.9% |
| Immigrants | Bangladesh | 100.0 /100 | #30 | Exceptional 20.9% |