Zip Codes with the Highest Percentage of Population Employed in Security & Protection in Nampa, ID
RELATED REPORTS & OPTIONS
Security & Protection
Nampa
Compare Zip Codes
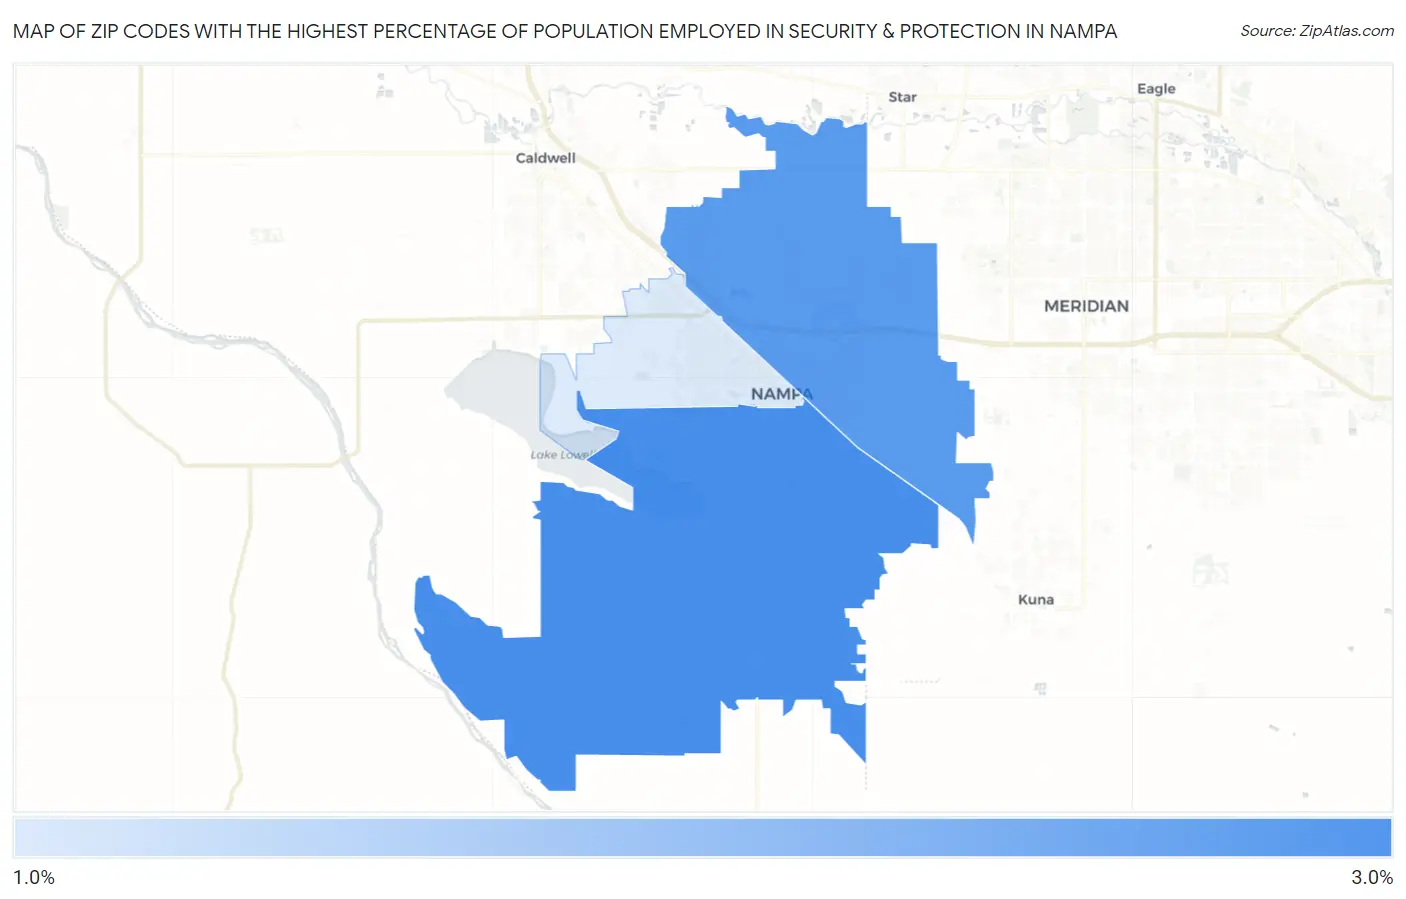
Map of Zip Codes with the Highest Percentage of Population Employed in Security & Protection in Nampa
1.6%
2.8%
Zip Codes with the Highest Percentage of Population Employed in Security & Protection in Nampa, ID
| Zip Code | % Employed | vs State | vs National | |
| 1. | 83686 | 2.8% | 1.7%(+1.09)#47 | 2.1%(+0.661)#8,076 |
| 2. | 83687 | 2.7% | 1.7%(+0.967)#48 | 2.1%(+0.534)#8,616 |
| 3. | 83651 | 1.6% | 1.7%(-0.105)#94 | 2.1%(-0.538)#15,335 |
1
Common Questions
What are the Top Zip Codes with the Highest Percentage of Population Employed in Security & Protection in Nampa, ID?
Top Zip Codes with the Highest Percentage of Population Employed in Security & Protection in Nampa, ID are:
What zip code has the Highest Percentage of Population Employed in Security & Protection in Nampa, ID?
83686 has the Highest Percentage of Population Employed in Security & Protection in Nampa, ID with 2.8%.
What is the Percentage of Population Employed in Security & Protection in Nampa, ID?
Percentage of Population Employed in Security & Protection in Nampa is 2.4%.
What is the Percentage of Population Employed in Security & Protection in Idaho?
Percentage of Population Employed in Security & Protection in Idaho is 1.7%.
What is the Percentage of Population Employed in Security & Protection in the United States?
Percentage of Population Employed in Security & Protection in the United States is 2.1%.