Priest River, ID Map & Demographics
Priest River Map
Priest River Overview
$28,731
PER CAPITA INCOME
$54,457
AVG FAMILY INCOME
$49,868
AVG HOUSEHOLD INCOME
30.2%
WAGE / INCOME GAP [ % ]
69.8¢/ $1
WAGE / INCOME GAP [ $ ]
0.47
INEQUALITY / GINI INDEX
2,170
TOTAL POPULATION
1,184
MALE POPULATION
986
FEMALE POPULATION
120.08
MALES / 100 FEMALES
83.28
FEMALES / 100 MALES
43.0
MEDIAN AGE
3.2
AVG FAMILY SIZE
2.5
AVG HOUSEHOLD SIZE
870
LABOR FORCE [ PEOPLE ]
50.6%
PERCENT IN LABOR FORCE
1.0%
UNEMPLOYMENT RATE
Priest River Zip Codes
Priest River Area Codes
Income in Priest River
Income Overview in Priest River
Per Capita Income in Priest River is $28,731, while median incomes of families and households are $54,457 and $49,868 respectively.
| Characteristic | Number | Measure |
| Per Capita Income | 2,170 | $28,731 |
| Median Family Income | 534 | $54,457 |
| Mean Family Income | 534 | $82,812 |
| Median Household Income | 880 | $49,868 |
| Mean Household Income | 880 | $66,338 |
| Income Deficit | 534 | $0 |
| Wage / Income Gap (%) | 2,170 | 30.17% |
| Wage / Income Gap ($) | 2,170 | 69.83¢ per $1 |
| Gini / Inequality Index | 2,170 | 0.47 |
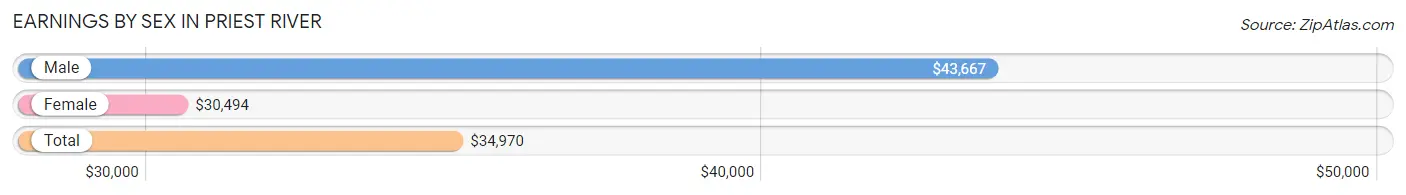
Earnings by Sex in Priest River
Average Earnings in Priest River are $34,970, $43,667 for men and $30,494 for women, a difference of 30.2%.
| Sex | Number | Average Earnings |
| Male | 538 (56.0%) | $43,667 |
| Female | 423 (44.0%) | $30,494 |
| Total | 961 (100.0%) | $34,970 |
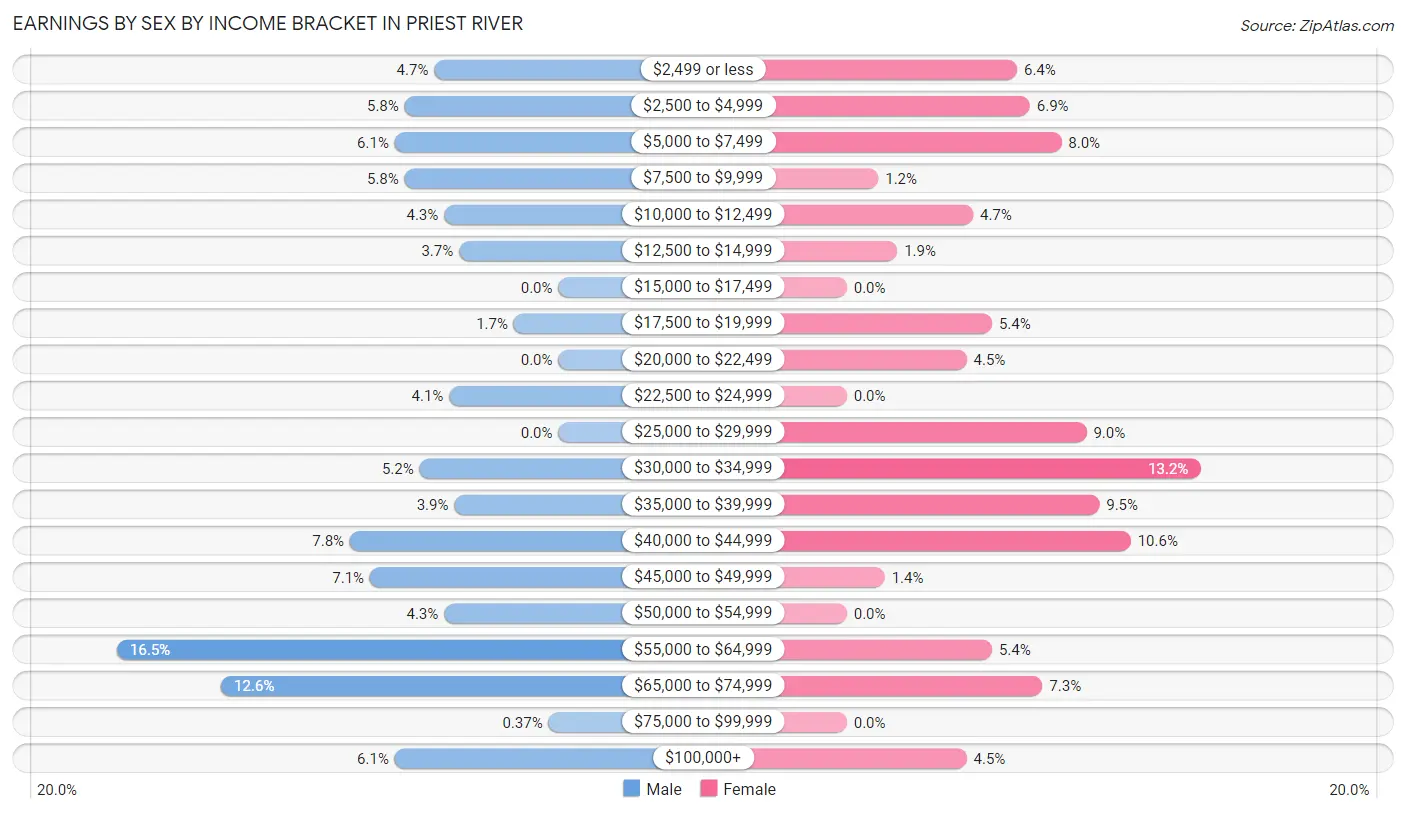
Earnings by Sex by Income Bracket in Priest River
The most common earnings brackets in Priest River are $55,000 to $64,999 for men (89 | 16.5%) and $30,000 to $34,999 for women (56 | 13.2%).
| Income | Male | Female |
| $2,499 or less | 25 (4.6%) | 27 (6.4%) |
| $2,500 to $4,999 | 31 (5.8%) | 29 (6.9%) |
| $5,000 to $7,499 | 33 (6.1%) | 34 (8.0%) |
| $7,500 to $9,999 | 31 (5.8%) | 5 (1.2%) |
| $10,000 to $12,499 | 23 (4.3%) | 20 (4.7%) |
| $12,500 to $14,999 | 20 (3.7%) | 8 (1.9%) |
| $15,000 to $17,499 | 0 (0.0%) | 0 (0.0%) |
| $17,500 to $19,999 | 9 (1.7%) | 23 (5.4%) |
| $20,000 to $22,499 | 0 (0.0%) | 19 (4.5%) |
| $22,500 to $24,999 | 22 (4.1%) | 0 (0.0%) |
| $25,000 to $29,999 | 0 (0.0%) | 38 (9.0%) |
| $30,000 to $34,999 | 28 (5.2%) | 56 (13.2%) |
| $35,000 to $39,999 | 21 (3.9%) | 40 (9.5%) |
| $40,000 to $44,999 | 42 (7.8%) | 45 (10.6%) |
| $45,000 to $49,999 | 38 (7.1%) | 6 (1.4%) |
| $50,000 to $54,999 | 23 (4.3%) | 0 (0.0%) |
| $55,000 to $64,999 | 89 (16.5%) | 23 (5.4%) |
| $65,000 to $74,999 | 68 (12.6%) | 31 (7.3%) |
| $75,000 to $99,999 | 2 (0.4%) | 0 (0.0%) |
| $100,000+ | 33 (6.1%) | 19 (4.5%) |
| Total | 538 (100.0%) | 423 (100.0%) |
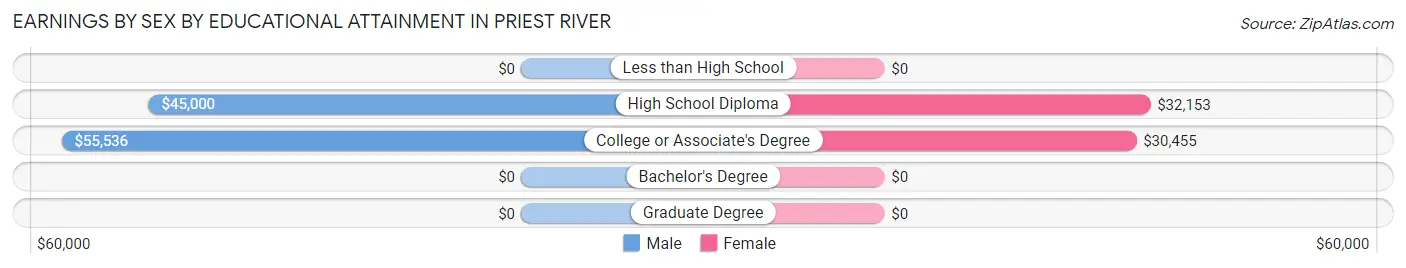
Earnings by Sex by Educational Attainment in Priest River
Average earnings in Priest River are $45,956 for men and $33,846 for women, a difference of 26.4%. Men with an educational attainment of college or associate's degree enjoy the highest average annual earnings of $55,536, while those with high school diploma education earn the least with $45,000. Women with an educational attainment of high school diploma earn the most with the average annual earnings of $32,153, while those with college or associate's degree education have the smallest earnings of $30,455.
| Educational Attainment | Male Income | Female Income |
| Less than High School | - | - |
| High School Diploma | $45,000 | $32,153 |
| College or Associate's Degree | $55,536 | $30,455 |
| Bachelor's Degree | - | - |
| Graduate Degree | - | - |
| Total | $45,956 | $33,846 |
Family Income in Priest River
Family Income Brackets in Priest River
According to the Priest River family income data, there are 133 families falling into the $50,000 to $74,999 income range, which is the most common income bracket and makes up 24.9% of all families.
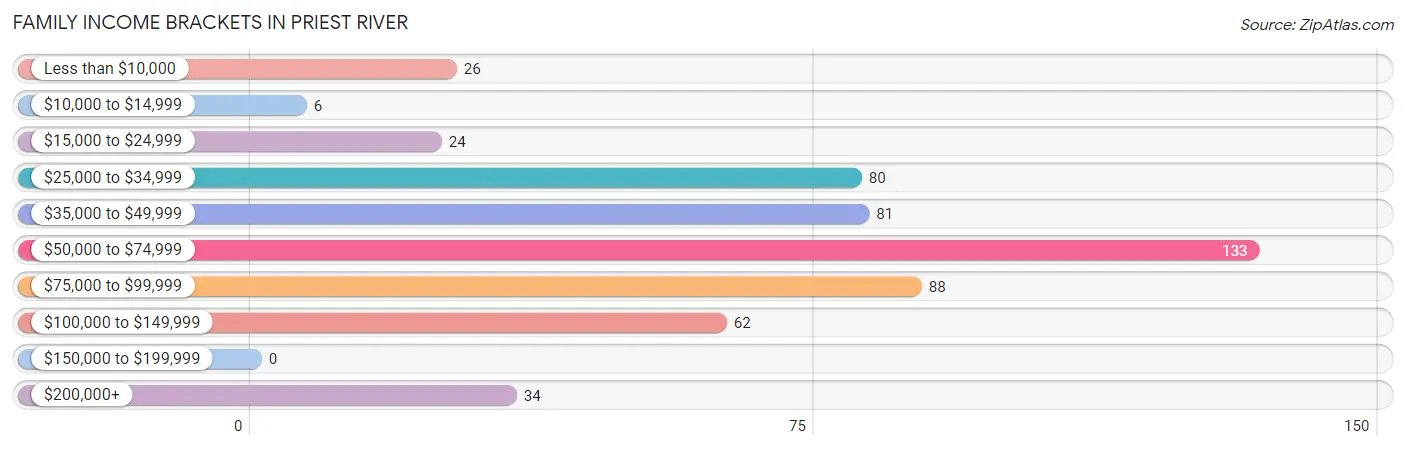
| Income Bracket | # Families | % Families |
| Less than $10,000 | 26 | 4.9% |
| $10,000 to $14,999 | 6 | 1.1% |
| $15,000 to $24,999 | 24 | 4.5% |
| $25,000 to $34,999 | 80 | 15.0% |
| $35,000 to $49,999 | 81 | 15.2% |
| $50,000 to $74,999 | 133 | 24.9% |
| $75,000 to $99,999 | 88 | 16.5% |
| $100,000 to $149,999 | 62 | 11.6% |
| $150,000 to $199,999 | 0 | 0.0% |
| $200,000+ | 34 | 6.4% |
Family Income by Famaliy Size in Priest River
5-person families (32 | 6.0%) account for the highest median family income in Priest River with $67,500 per family, while 2-person families (289 | 54.1%) have the highest median income of $24,575 per family member.
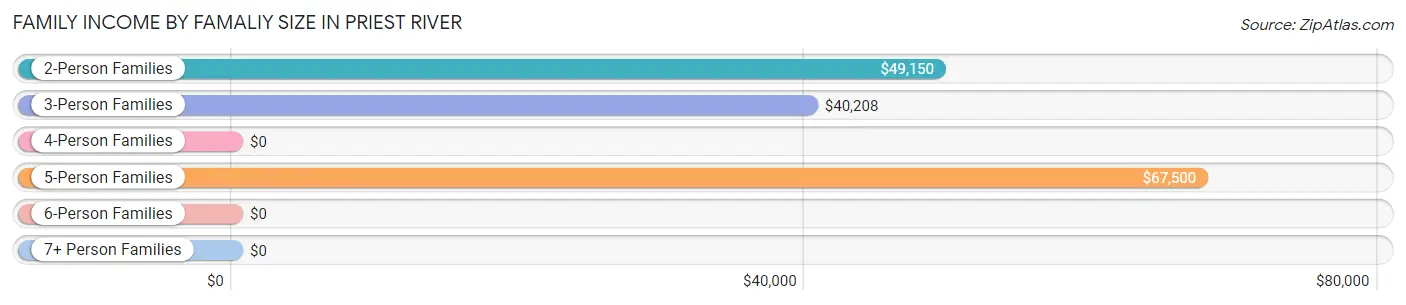
| Income Bracket | # Families | Median Income |
| 2-Person Families | 289 (54.1%) | $49,150 |
| 3-Person Families | 103 (19.3%) | $40,208 |
| 4-Person Families | 55 (10.3%) | $0 |
| 5-Person Families | 32 (6.0%) | $67,500 |
| 6-Person Families | 27 (5.1%) | $0 |
| 7+ Person Families | 28 (5.2%) | $0 |
| Total | 534 (100.0%) | $54,457 |
Family Income by Number of Earners in Priest River
The median family income in Priest River is $54,457, with families comprising 3+ earners (62) having the highest median family income of $92,188, while families with no earners (153) have the lowest median family income of $45,662, accounting for 11.6% and 28.6% of families, respectively.
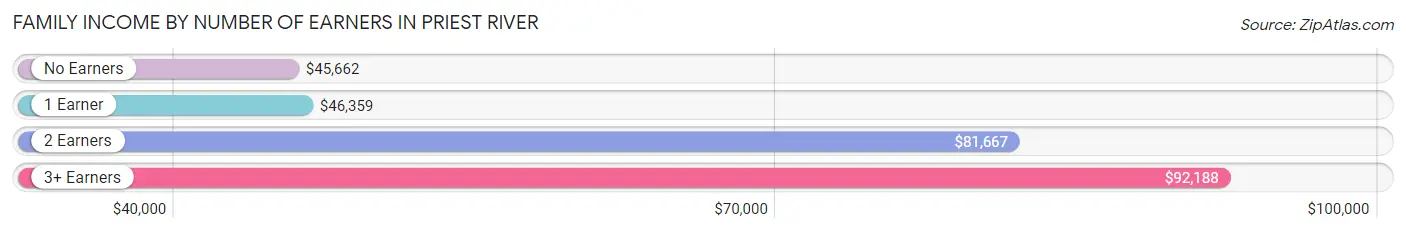
| Number of Earners | # Families | Median Income |
| No Earners | 153 (28.6%) | $45,662 |
| 1 Earner | 123 (23.0%) | $46,359 |
| 2 Earners | 196 (36.7%) | $81,667 |
| 3+ Earners | 62 (11.6%) | $92,188 |
| Total | 534 (100.0%) | $54,457 |
Household Income in Priest River
Household Income Brackets in Priest River
With 223 households falling in the category, the $50,000 to $74,999 income range is the most frequent in Priest River, accounting for 25.3% of all households. In contrast, only 12 households (1.4%) fall into the $150,000 to $199,999 income bracket, making it the least populous group.
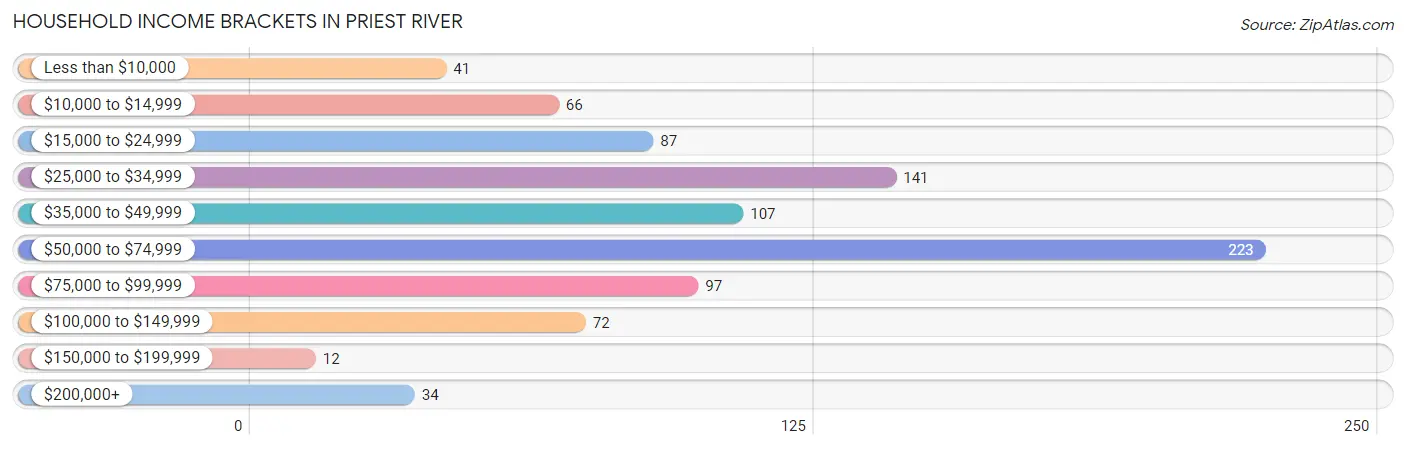
| Income Bracket | # Households | % Households |
| Less than $10,000 | 41 | 4.7% |
| $10,000 to $14,999 | 66 | 7.5% |
| $15,000 to $24,999 | 87 | 9.9% |
| $25,000 to $34,999 | 141 | 16.0% |
| $35,000 to $49,999 | 107 | 12.2% |
| $50,000 to $74,999 | 223 | 25.3% |
| $75,000 to $99,999 | 97 | 11.0% |
| $100,000 to $149,999 | 72 | 8.2% |
| $150,000 to $199,999 | 12 | 1.4% |
| $200,000+ | 34 | 3.9% |
Household Income by Householder Age in Priest River
The median household income in Priest River is $49,868, with the highest median household income of $76,250 found in the 15 to 24 years age bracket for the primary householder. A total of 12 households (1.4%) fall into this category. Meanwhile, the 65+ years age bracket for the primary householder has the lowest median household income of $45,197, with 357 households (40.6%) in this group.
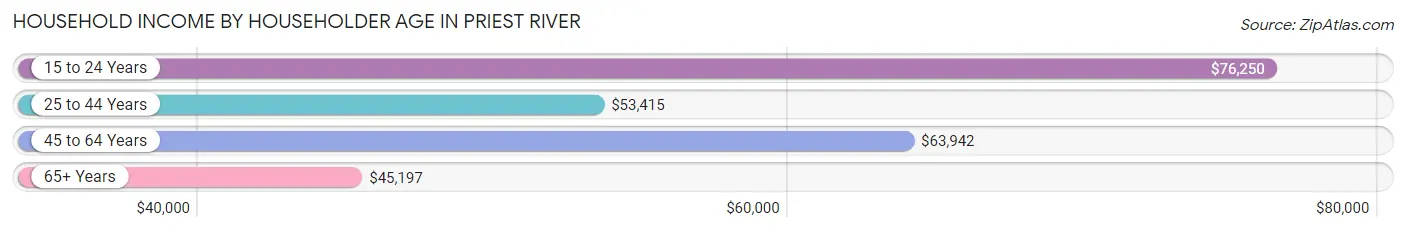
| Income Bracket | # Households | Median Income |
| 15 to 24 Years | 12 (1.4%) | $76,250 |
| 25 to 44 Years | 188 (21.4%) | $53,415 |
| 45 to 64 Years | 323 (36.7%) | $63,942 |
| 65+ Years | 357 (40.6%) | $45,197 |
| Total | 880 (100.0%) | $49,868 |
Poverty in Priest River
Income Below Poverty by Sex and Age in Priest River
With 8.5% poverty level for males and 7.5% for females among the residents of Priest River, 5 year old males and 25 to 34 year old females are the most vulnerable to poverty, with 13 males (100.0%) and 20 females (24.1%) in their respective age groups living below the poverty level.
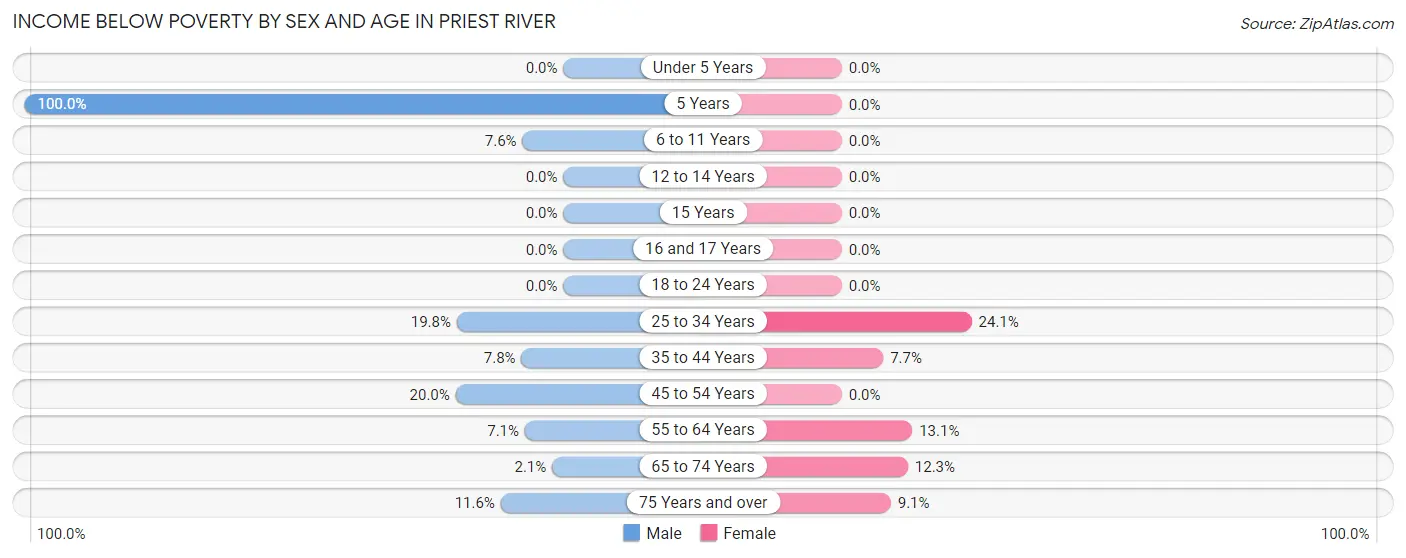
| Age Bracket | Male | Female |
| Under 5 Years | 0 (0.0%) | 0 (0.0%) |
| 5 Years | 13 (100.0%) | 0 (0.0%) |
| 6 to 11 Years | 11 (7.6%) | 0 (0.0%) |
| 12 to 14 Years | 0 (0.0%) | 0 (0.0%) |
| 15 Years | 0 (0.0%) | 0 (0.0%) |
| 16 and 17 Years | 0 (0.0%) | 0 (0.0%) |
| 18 to 24 Years | 0 (0.0%) | 0 (0.0%) |
| 25 to 34 Years | 18 (19.8%) | 20 (24.1%) |
| 35 to 44 Years | 13 (7.8%) | 9 (7.7%) |
| 45 to 54 Years | 23 (20.0%) | 0 (0.0%) |
| 55 to 64 Years | 9 (7.1%) | 17 (13.1%) |
| 65 to 74 Years | 4 (2.1%) | 19 (12.3%) |
| 75 Years and over | 10 (11.6%) | 7 (9.1%) |
| Total | 101 (8.5%) | 72 (7.5%) |
Income Above Poverty by Sex and Age in Priest River
According to the poverty statistics in Priest River, males aged under 5 years and females aged under 5 years are the age groups that are most secure financially, with 100.0% of males and 100.0% of females in these age groups living above the poverty line.
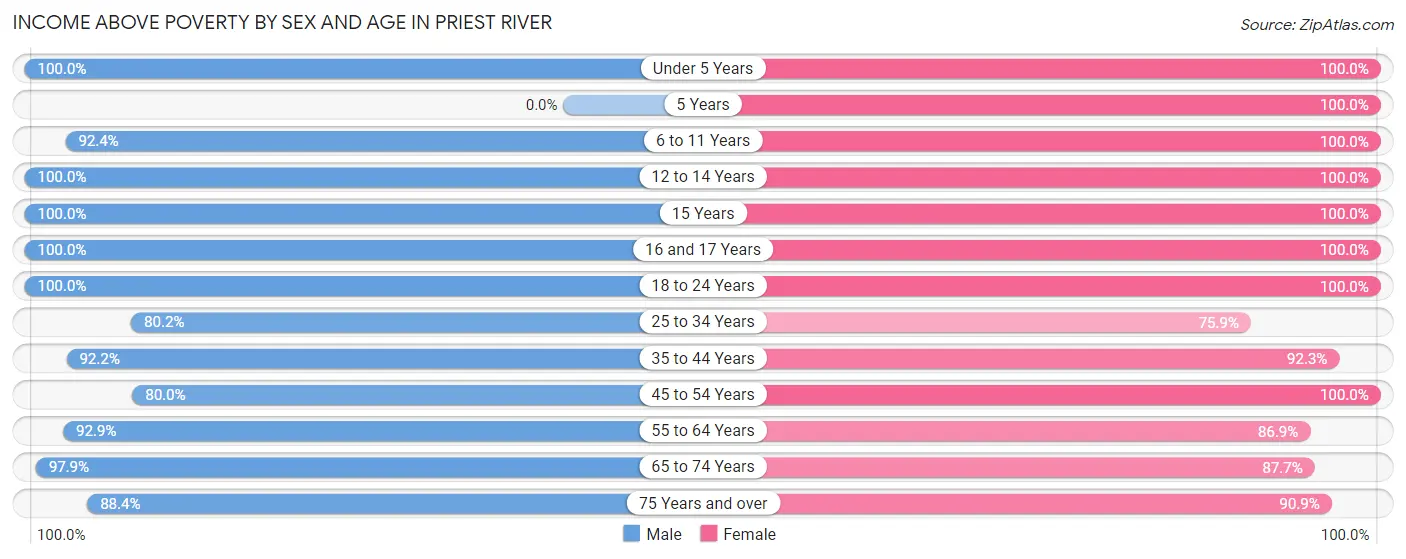
| Age Bracket | Male | Female |
| Under 5 Years | 27 (100.0%) | 54 (100.0%) |
| 5 Years | 0 (0.0%) | 28 (100.0%) |
| 6 to 11 Years | 134 (92.4%) | 56 (100.0%) |
| 12 to 14 Years | 37 (100.0%) | 31 (100.0%) |
| 15 Years | 26 (100.0%) | 7 (100.0%) |
| 16 and 17 Years | 35 (100.0%) | 27 (100.0%) |
| 18 to 24 Years | 125 (100.0%) | 74 (100.0%) |
| 25 to 34 Years | 73 (80.2%) | 63 (75.9%) |
| 35 to 44 Years | 154 (92.2%) | 108 (92.3%) |
| 45 to 54 Years | 92 (80.0%) | 121 (100.0%) |
| 55 to 64 Years | 117 (92.9%) | 113 (86.9%) |
| 65 to 74 Years | 187 (97.9%) | 136 (87.7%) |
| 75 Years and over | 76 (88.4%) | 70 (90.9%) |
| Total | 1,083 (91.5%) | 888 (92.5%) |
Income Below Poverty Among Married-Couple Families in Priest River
The poverty statistics for married-couple families in Priest River show that 9.3% or 35 of the total 376 families live below the poverty line. Families with 1 or 2 children have the highest poverty rate of 17.4%, comprising of 20 families. On the other hand, families with 3 or 4 children have the lowest poverty rate of 0.0%, which includes 0 families.
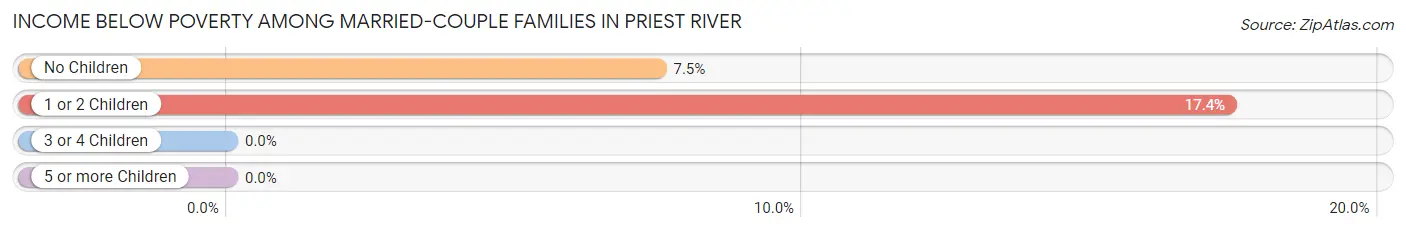
| Children | Above Poverty | Below Poverty |
| No Children | 186 (92.5%) | 15 (7.5%) |
| 1 or 2 Children | 95 (82.6%) | 20 (17.4%) |
| 3 or 4 Children | 60 (100.0%) | 0 (0.0%) |
| 5 or more Children | 0 (0.0%) | 0 (0.0%) |
| Total | 341 (90.7%) | 35 (9.3%) |
Income Below Poverty Among Single-Parent Households in Priest River
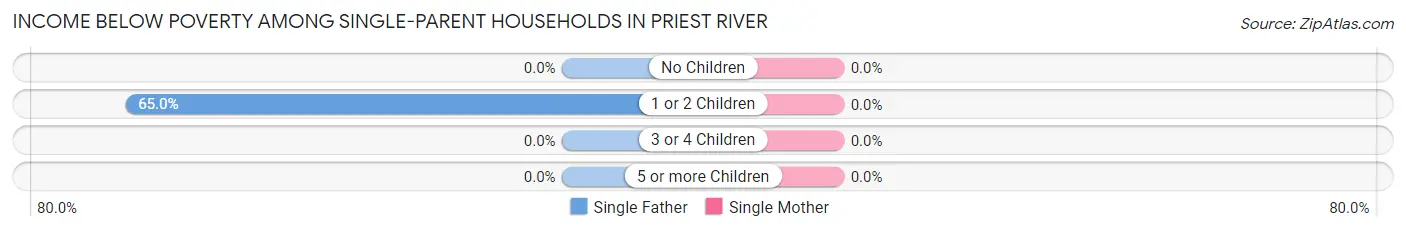
| Children | Single Father | Single Mother |
| No Children | 0 (0.0%) | 0 (0.0%) |
| 1 or 2 Children | 13 (65.0%) | 0 (0.0%) |
| 3 or 4 Children | 0 (0.0%) | 0 (0.0%) |
| 5 or more Children | 0 (0.0%) | 0 (0.0%) |
| Total | 13 (21.0%) | 0 (0.0%) |
Income Below Poverty Among Married-Couple vs Single-Parent Households in Priest River
The poverty data for Priest River shows that 35 of the married-couple family households (9.3%) and 13 of the single-parent households (8.2%) are living below the poverty level. Within the married-couple family households, those with 1 or 2 children have the highest poverty rate, with 20 households (17.4%) falling below the poverty line. Among the single-parent households, those with 1 or 2 children have the highest poverty rate, with 13 household (18.1%) living below poverty.
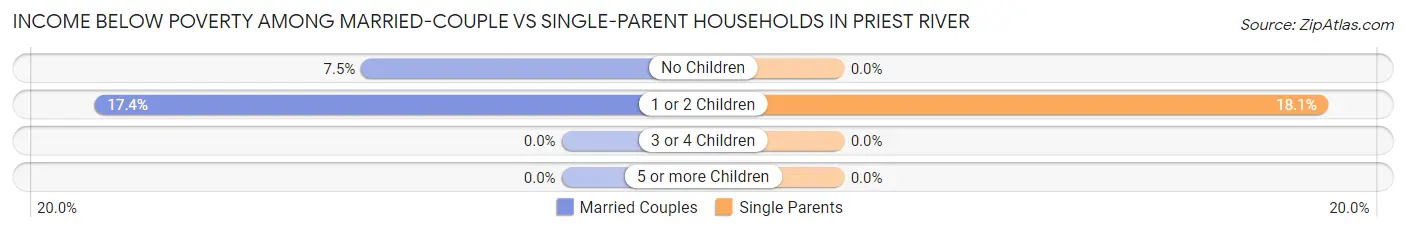
| Children | Married-Couple Families | Single-Parent Households |
| No Children | 15 (7.5%) | 0 (0.0%) |
| 1 or 2 Children | 20 (17.4%) | 13 (18.1%) |
| 3 or 4 Children | 0 (0.0%) | 0 (0.0%) |
| 5 or more Children | 0 (0.0%) | 0 (0.0%) |
| Total | 35 (9.3%) | 13 (8.2%) |
Race in Priest River
The most populous races in Priest River are White / Caucasian (1,926 | 88.8%), Two or more Races (213 | 9.8%), and Hispanic or Latino (57 | 2.6%).
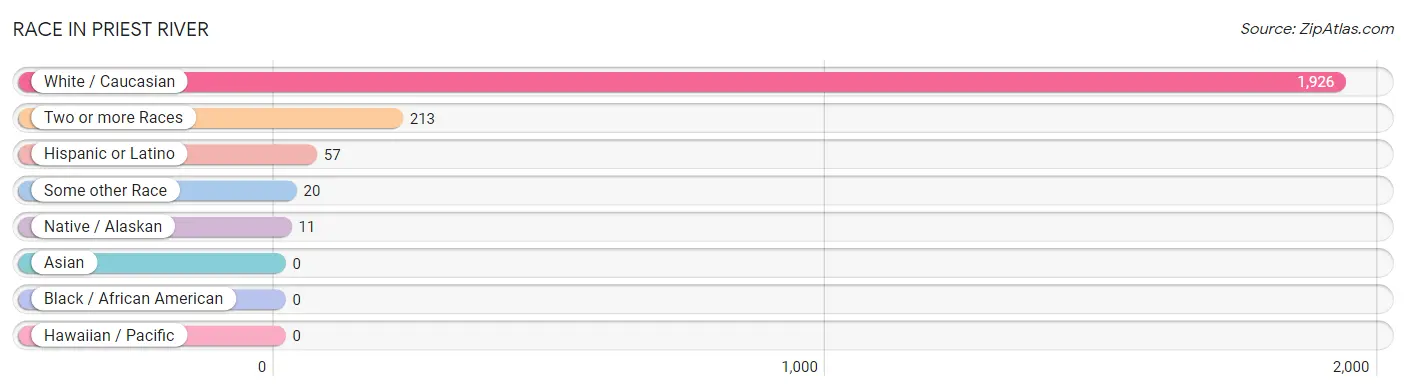
| Race | # Population | % Population |
| Asian | 0 | 0.0% |
| Black / African American | 0 | 0.0% |
| Hawaiian / Pacific | 0 | 0.0% |
| Hispanic or Latino | 57 | 2.6% |
| Native / Alaskan | 11 | 0.5% |
| White / Caucasian | 1,926 | 88.8% |
| Two or more Races | 213 | 9.8% |
| Some other Race | 20 | 0.9% |
| Total | 2,170 | 100.0% |
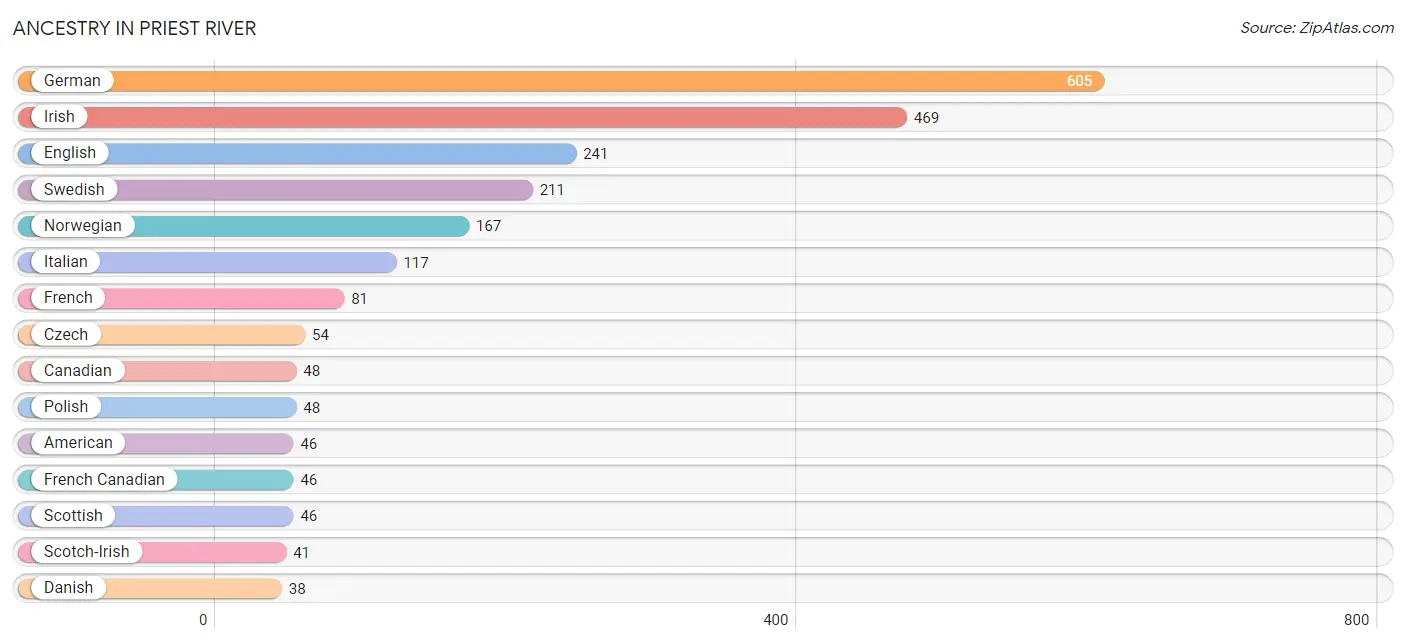
Ancestry in Priest River
The most populous ancestries reported in Priest River are German (605 | 27.9%), Irish (469 | 21.6%), English (241 | 11.1%), Swedish (211 | 9.7%), and Norwegian (167 | 7.7%), together accounting for 78.0% of all Priest River residents.
| Ancestry | # Population | % Population |
| American | 46 | 2.1% |
| Apache | 3 | 0.1% |
| Arab | 2 | 0.1% |
| British | 32 | 1.5% |
| Canadian | 48 | 2.2% |
| Cherokee | 26 | 1.2% |
| Chickasaw | 7 | 0.3% |
| Czech | 54 | 2.5% |
| Danish | 38 | 1.8% |
| Dutch | 31 | 1.4% |
| English | 241 | 11.1% |
| Finnish | 3 | 0.1% |
| French | 81 | 3.7% |
| French American Indian | 8 | 0.4% |
| French Canadian | 46 | 2.1% |
| German | 605 | 27.9% |
| Indian (Asian) | 6 | 0.3% |
| Irish | 469 | 21.6% |
| Italian | 117 | 5.4% |
| Korean | 30 | 1.4% |
| Lebanese | 2 | 0.1% |
| Luxembourger | 8 | 0.4% |
| Mexican | 31 | 1.4% |
| Navajo | 3 | 0.1% |
| Norwegian | 167 | 7.7% |
| Polish | 48 | 2.2% |
| Portuguese | 15 | 0.7% |
| Puget Sound Salish | 11 | 0.5% |
| Romanian | 10 | 0.5% |
| Russian | 31 | 1.4% |
| Scandinavian | 8 | 0.4% |
| Scotch-Irish | 41 | 1.9% |
| Scottish | 46 | 2.1% |
| Spanish | 26 | 1.2% |
| Swedish | 211 | 9.7% |
| Ukrainian | 5 | 0.2% | View All 36 Rows |
Immigrants in Priest River
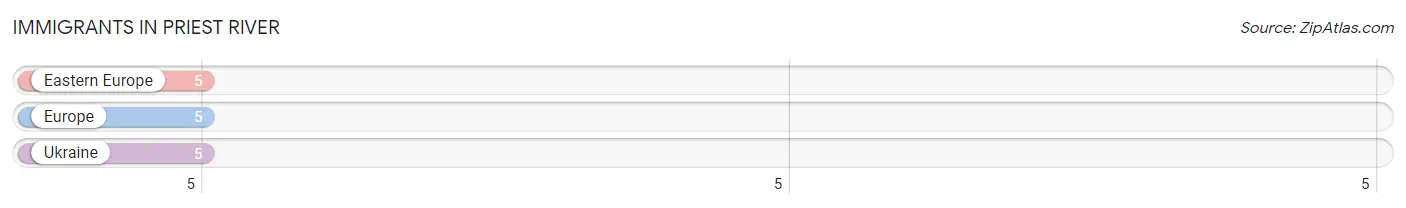
The most numerous immigrant groups reported in Priest River came from Eastern Europe (5 | 0.2%), Europe (5 | 0.2%), and Ukraine (5 | 0.2%), together accounting for 0.7% of all Priest River residents.
| Immigration Origin | # Population | % Population |
| Eastern Europe | 5 | 0.2% |
| Europe | 5 | 0.2% |
| Ukraine | 5 | 0.2% | View All 3 Rows |
Sex and Age in Priest River
Sex and Age in Priest River
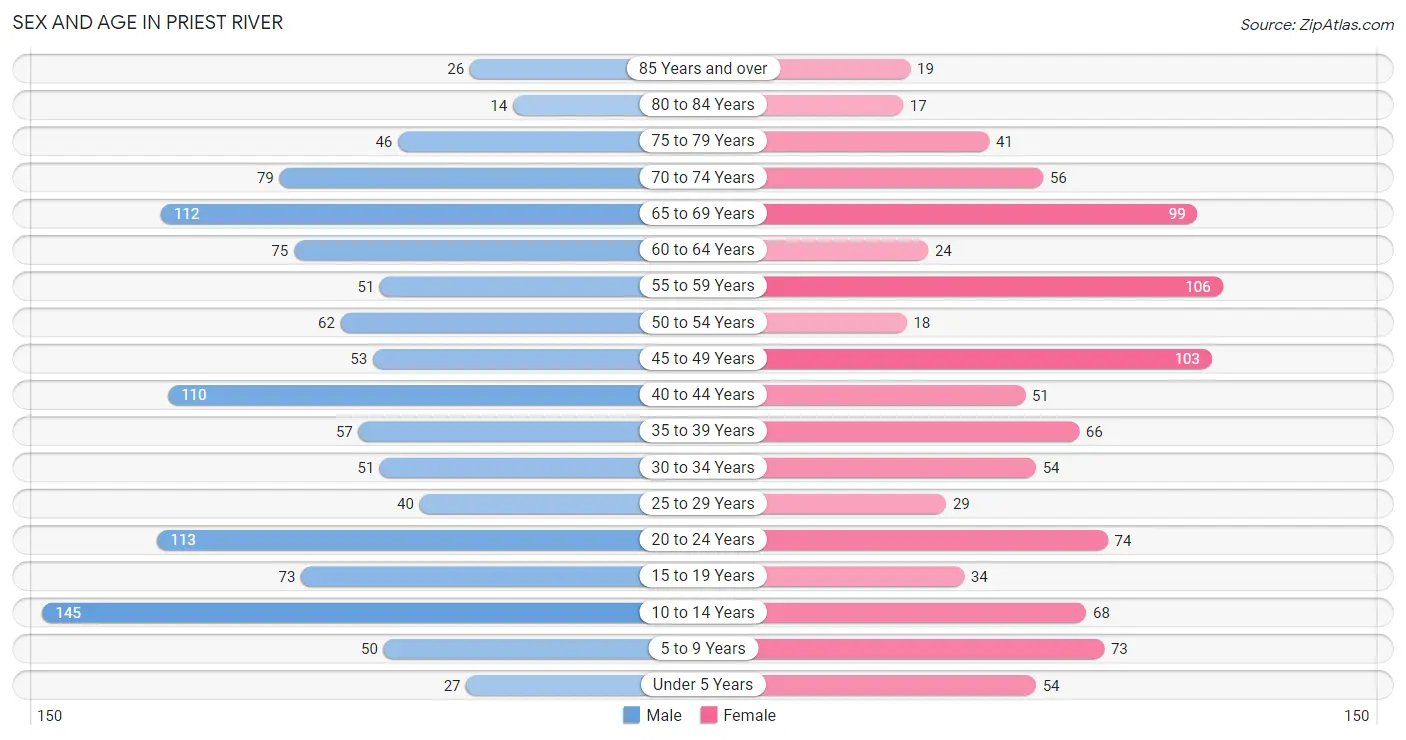
The most populous age groups in Priest River are 10 to 14 Years (145 | 12.2%) for men and 55 to 59 Years (106 | 10.7%) for women.
| Age Bracket | Male | Female |
| Under 5 Years | 27 (2.3%) | 54 (5.5%) |
| 5 to 9 Years | 50 (4.2%) | 73 (7.4%) |
| 10 to 14 Years | 145 (12.2%) | 68 (6.9%) |
| 15 to 19 Years | 73 (6.2%) | 34 (3.5%) |
| 20 to 24 Years | 113 (9.5%) | 74 (7.5%) |
| 25 to 29 Years | 40 (3.4%) | 29 (2.9%) |
| 30 to 34 Years | 51 (4.3%) | 54 (5.5%) |
| 35 to 39 Years | 57 (4.8%) | 66 (6.7%) |
| 40 to 44 Years | 110 (9.3%) | 51 (5.2%) |
| 45 to 49 Years | 53 (4.5%) | 103 (10.4%) |
| 50 to 54 Years | 62 (5.2%) | 18 (1.8%) |
| 55 to 59 Years | 51 (4.3%) | 106 (10.7%) |
| 60 to 64 Years | 75 (6.3%) | 24 (2.4%) |
| 65 to 69 Years | 112 (9.5%) | 99 (10.0%) |
| 70 to 74 Years | 79 (6.7%) | 56 (5.7%) |
| 75 to 79 Years | 46 (3.9%) | 41 (4.2%) |
| 80 to 84 Years | 14 (1.2%) | 17 (1.7%) |
| 85 Years and over | 26 (2.2%) | 19 (1.9%) |
| Total | 1,184 (100.0%) | 986 (100.0%) |
Families and Households in Priest River
Median Family Size in Priest River
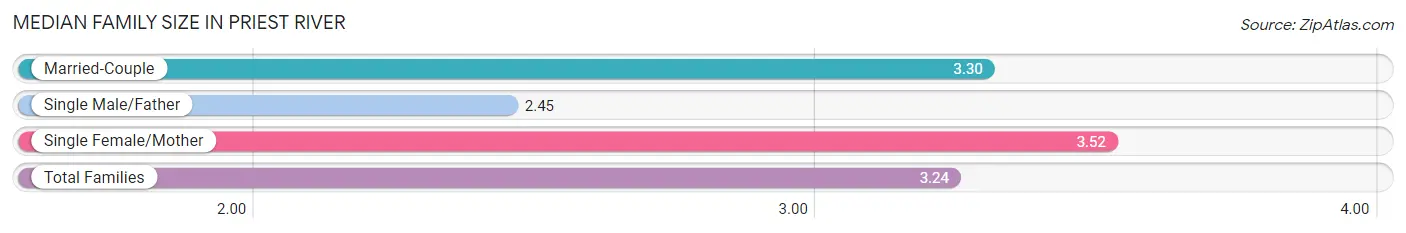
The median family size in Priest River is 3.24 persons per family, with single female/mother families (96 | 18.0%) accounting for the largest median family size of 3.52 persons per family. On the other hand, single male/father families (62 | 11.6%) represent the smallest median family size with 2.45 persons per family.
| Family Type | # Families | Family Size |
| Married-Couple | 376 (70.4%) | 3.30 |
| Single Male/Father | 62 (11.6%) | 2.45 |
| Single Female/Mother | 96 (18.0%) | 3.52 |
| Total Families | 534 (100.0%) | 3.24 |
Median Household Size in Priest River
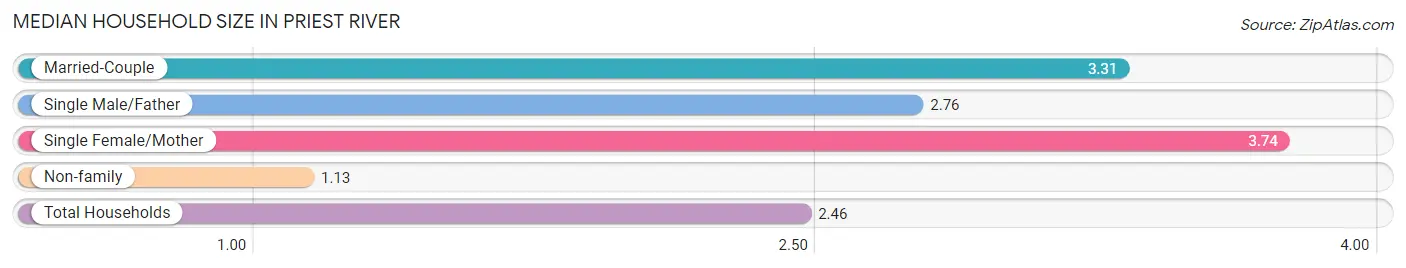
The median household size in Priest River is 2.46 persons per household, with single female/mother households (96 | 10.9%) accounting for the largest median household size of 3.74 persons per household. non-family households (346 | 39.3%) represent the smallest median household size with 1.13 persons per household.
| Household Type | # Households | Household Size |
| Married-Couple | 376 (42.7%) | 3.31 |
| Single Male/Father | 62 (7.0%) | 2.76 |
| Single Female/Mother | 96 (10.9%) | 3.74 |
| Non-family | 346 (39.3%) | 1.13 |
| Total Households | 880 (100.0%) | 2.46 |
Household Size by Marriage Status in Priest River
Out of a total of 880 households in Priest River, 534 (60.7%) are family households, while 346 (39.3%) are nonfamily households. The most numerous type of family households are 2-person households, comprising 274, and the most common type of nonfamily households are 1-person households, comprising 324.
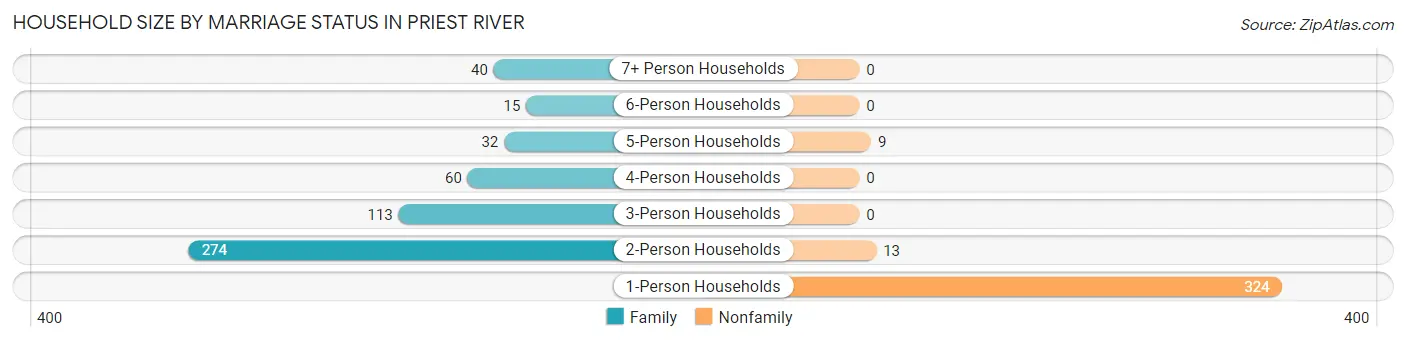
| Household Size | Family Households | Nonfamily Households |
| 1-Person Households | - | 324 (36.8%) |
| 2-Person Households | 274 (31.1%) | 13 (1.5%) |
| 3-Person Households | 113 (12.8%) | 0 (0.0%) |
| 4-Person Households | 60 (6.8%) | 0 (0.0%) |
| 5-Person Households | 32 (3.6%) | 9 (1.0%) |
| 6-Person Households | 15 (1.7%) | 0 (0.0%) |
| 7+ Person Households | 40 (4.5%) | 0 (0.0%) |
| Total | 534 (60.7%) | 346 (39.3%) |
Female Fertility in Priest River
Fertility by Age in Priest River
Average fertility rate in Priest River is 416.0 births per 1,000 women. Women in the age bracket of 20 to 34 years have the highest fertility rate with 637.0 births per 1,000 women. Women in the age bracket of 20 to 34 years acount for 58.5% of all women with births.
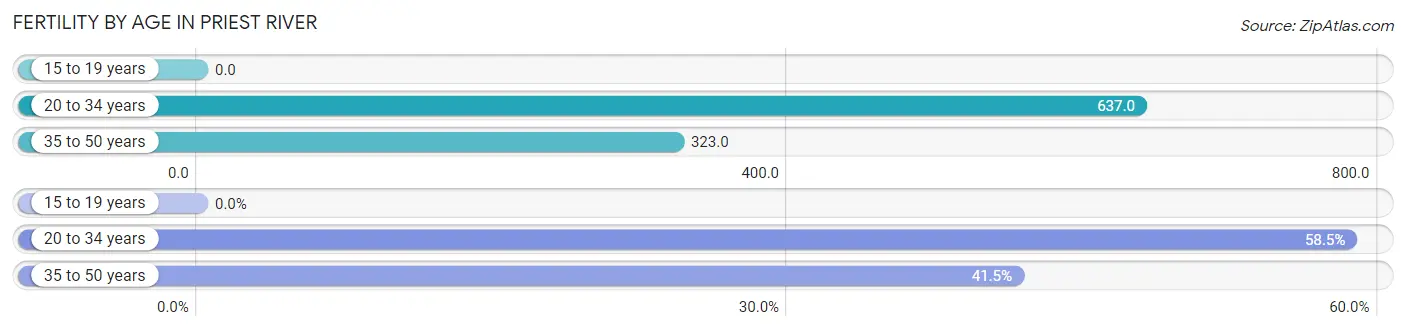
| Age Bracket | Women with Births | Births / 1,000 Women |
| 15 to 19 years | 0 (0.0%) | 0.0 |
| 20 to 34 years | 100 (58.5%) | 637.0 |
| 35 to 50 years | 71 (41.5%) | 323.0 |
| Total | 171 (100.0%) | 416.0 |
Fertility by Age by Marriage Status in Priest River
82.5% of women with births (171) in Priest River are married. The highest percentage of unmarried women with births falls into 35 to 50 years age bracket with 18.3% of them unmarried at the time of birth, while the lowest percentage of unmarried women with births belong to 20 to 34 years age bracket with 17.0% of them unmarried.
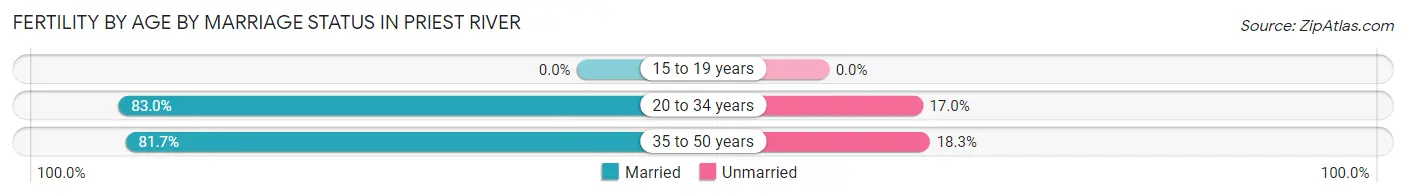
| Age Bracket | Married | Unmarried |
| 15 to 19 years | 0 (0.0%) | 0 (0.0%) |
| 20 to 34 years | 83 (83.0%) | 17 (17.0%) |
| 35 to 50 years | 58 (81.7%) | 13 (18.3%) |
| Total | 141 (82.5%) | 30 (17.5%) |
Fertility by Education in Priest River
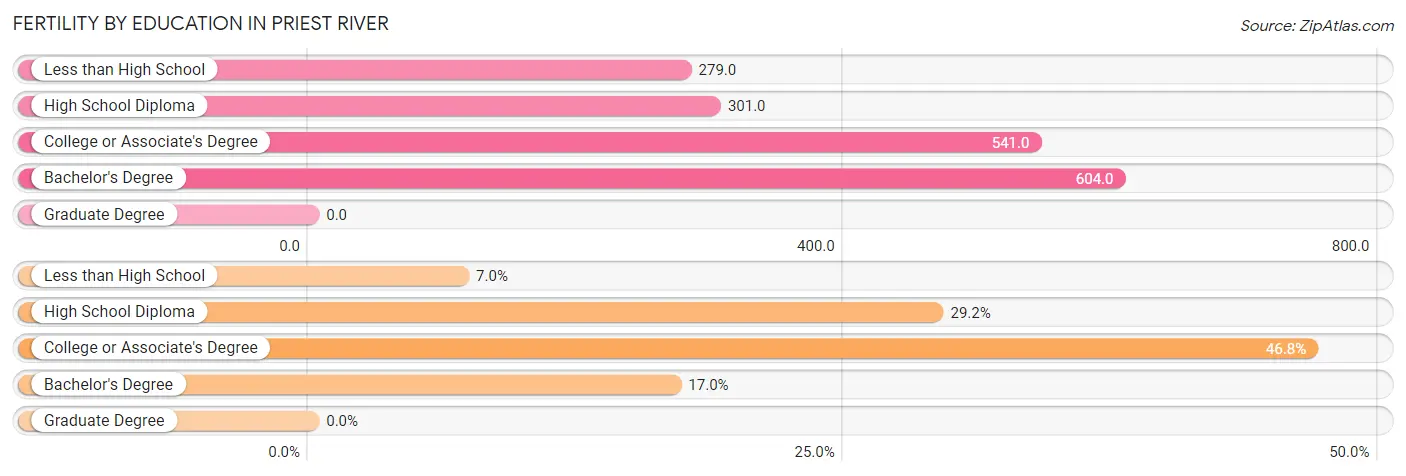
| Educational Attainment | Women with Births | Births / 1,000 Women |
| Less than High School | 12 (7.0%) | 279.0 |
| High School Diploma | 50 (29.2%) | 301.0 |
| College or Associate's Degree | 80 (46.8%) | 541.0 |
| Bachelor's Degree | 29 (17.0%) | 604.0 |
| Graduate Degree | 0 (0.0%) | 0.0 |
| Total | 171 (100.0%) | 416.0 |
Fertility by Education by Marriage Status in Priest River
17.5% of women with births in Priest River are unmarried. Women with the educational attainment of less than high school are most likely to be married with 100.0% of them married at childbirth, while women with the educational attainment of bachelor's degree are least likely to be married with 44.8% of them unmarried at childbirth.
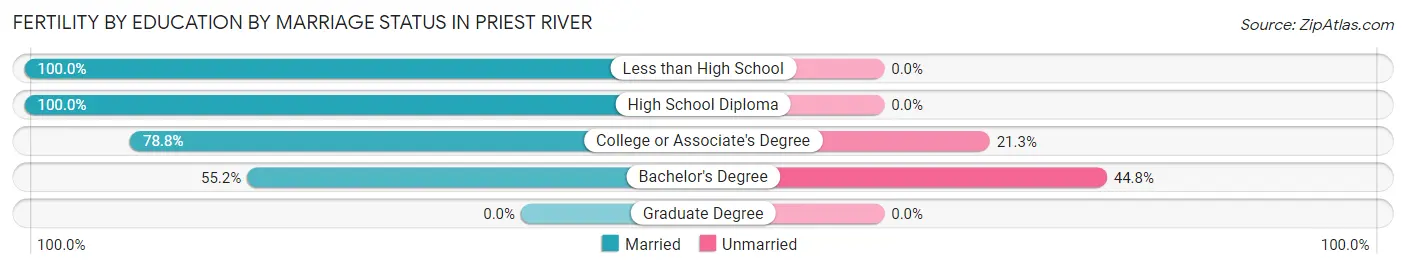
| Educational Attainment | Married | Unmarried |
| Less than High School | 12 (100.0%) | 0 (0.0%) |
| High School Diploma | 50 (100.0%) | 0 (0.0%) |
| College or Associate's Degree | 63 (78.7%) | 17 (21.2%) |
| Bachelor's Degree | 16 (55.2%) | 13 (44.8%) |
| Graduate Degree | 0 (0.0%) | 0 (0.0%) |
| Total | 141 (82.5%) | 30 (17.5%) |
Employment Characteristics in Priest River
Employment by Class of Employer in Priest River
Among the 862 employed individuals in Priest River, private company employees (520 | 60.3%), local government employees (122 | 14.1%), and not-for-profit organizations (80 | 9.3%) make up the most common classes of employment.
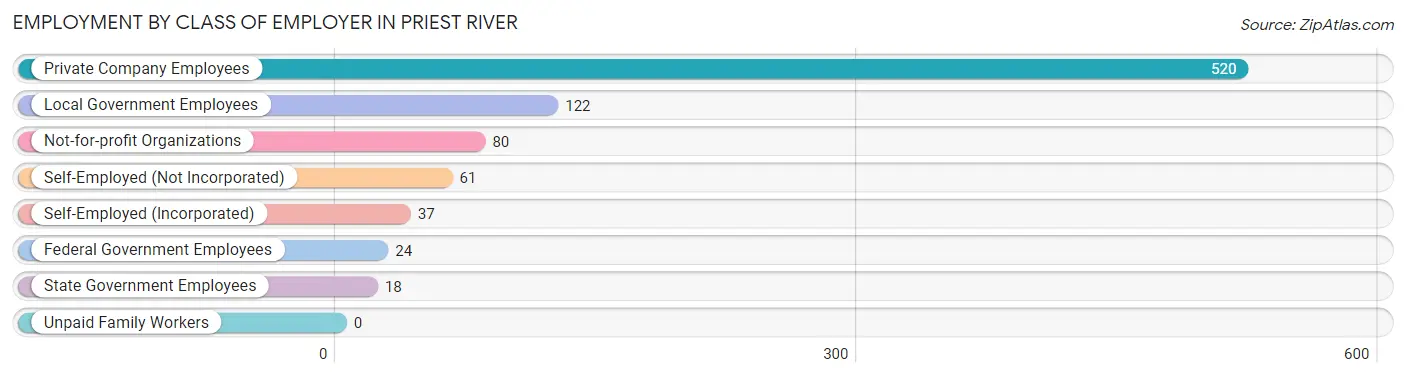
| Employer Class | # Employees | % Employees |
| Private Company Employees | 520 | 60.3% |
| Self-Employed (Incorporated) | 37 | 4.3% |
| Self-Employed (Not Incorporated) | 61 | 7.1% |
| Not-for-profit Organizations | 80 | 9.3% |
| Local Government Employees | 122 | 14.1% |
| State Government Employees | 18 | 2.1% |
| Federal Government Employees | 24 | 2.8% |
| Unpaid Family Workers | 0 | 0.0% |
| Total | 862 | 100.0% |
Employment Status by Age in Priest River
According to the labor force statistics for Priest River, out of the total population over 16 years of age (1,720), 50.6% or 870 individuals are in the labor force, with 1.0% or 9 of them unemployed. The age group with the highest labor force participation rate is 25 to 29 years, with 89.9% or 62 individuals in the labor force. Within the labor force, the 16 to 19 years age range has the highest percentage of unemployed individuals, with 29.0% or 9 of them being unemployed.
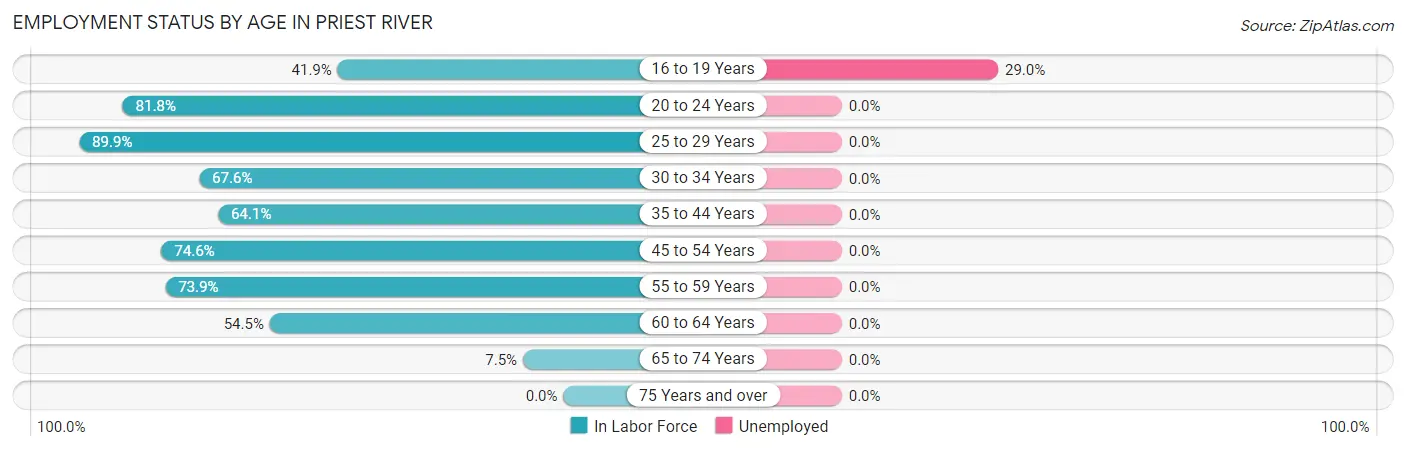
| Age Bracket | In Labor Force | Unemployed |
| 16 to 19 Years | 31 (41.9%) | 9 (29.0%) |
| 20 to 24 Years | 153 (81.8%) | 0 (0.0%) |
| 25 to 29 Years | 62 (89.9%) | 0 (0.0%) |
| 30 to 34 Years | 71 (67.6%) | 0 (0.0%) |
| 35 to 44 Years | 182 (64.1%) | 0 (0.0%) |
| 45 to 54 Years | 176 (74.6%) | 0 (0.0%) |
| 55 to 59 Years | 116 (73.9%) | 0 (0.0%) |
| 60 to 64 Years | 54 (54.5%) | 0 (0.0%) |
| 65 to 74 Years | 26 (7.5%) | 0 (0.0%) |
| 75 Years and over | 0 (0.0%) | 0 (0.0%) |
| Total | 870 (50.6%) | 9 (1.0%) |
Employment Status by Educational Attainment in Priest River
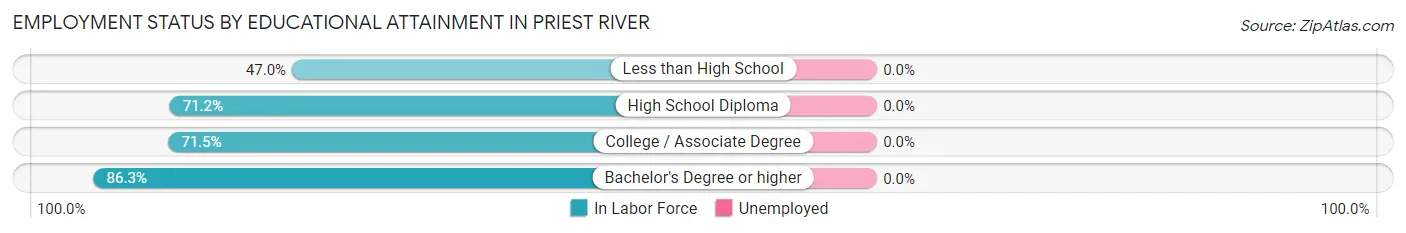
| Educational Attainment | In Labor Force | Unemployed |
| Less than High School | 55 (47.0%) | 0 (0.0%) |
| High School Diploma | 301 (71.2%) | 0 (0.0%) |
| College / Associate Degree | 236 (71.5%) | 0 (0.0%) |
| Bachelor's Degree or higher | 69 (86.3%) | 0 (0.0%) |
| Total | 661 (69.6%) | 0 (0.0%) |
Employment Occupations by Sex in Priest River
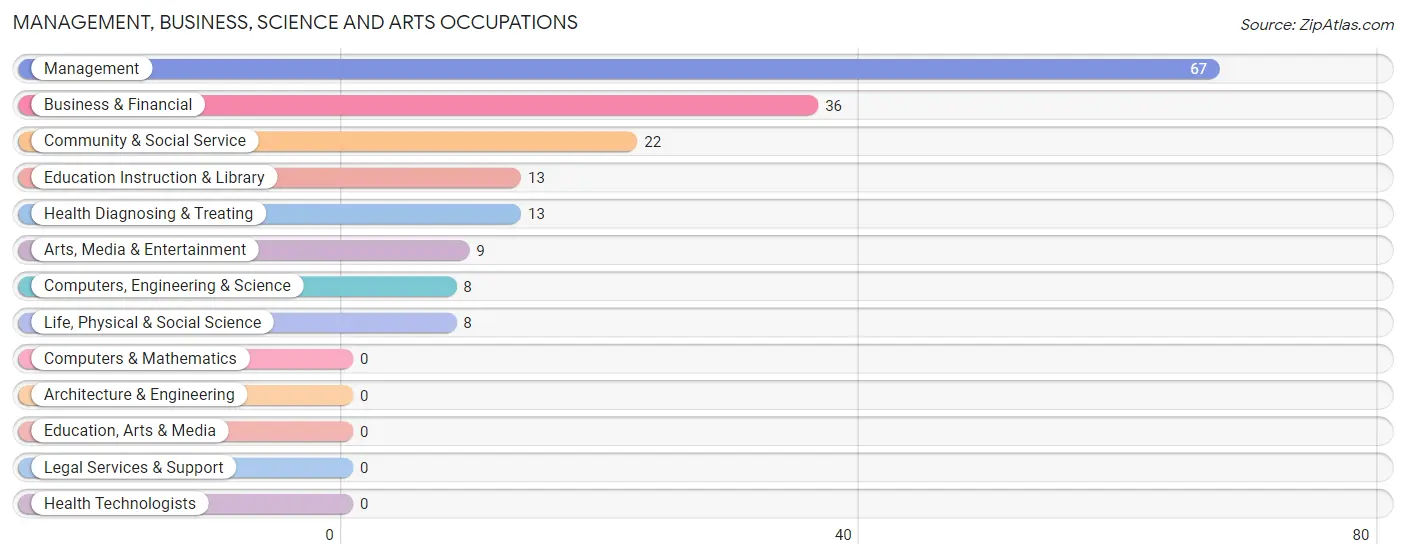
Management, Business, Science and Arts Occupations
The most common Management, Business, Science and Arts occupations in Priest River are Management (67 | 7.8%), Business & Financial (36 | 4.2%), Community & Social Service (22 | 2.5%), Education Instruction & Library (13 | 1.5%), and Health Diagnosing & Treating (13 | 1.5%).
Management, Business, Science and Arts Occupations by Sex
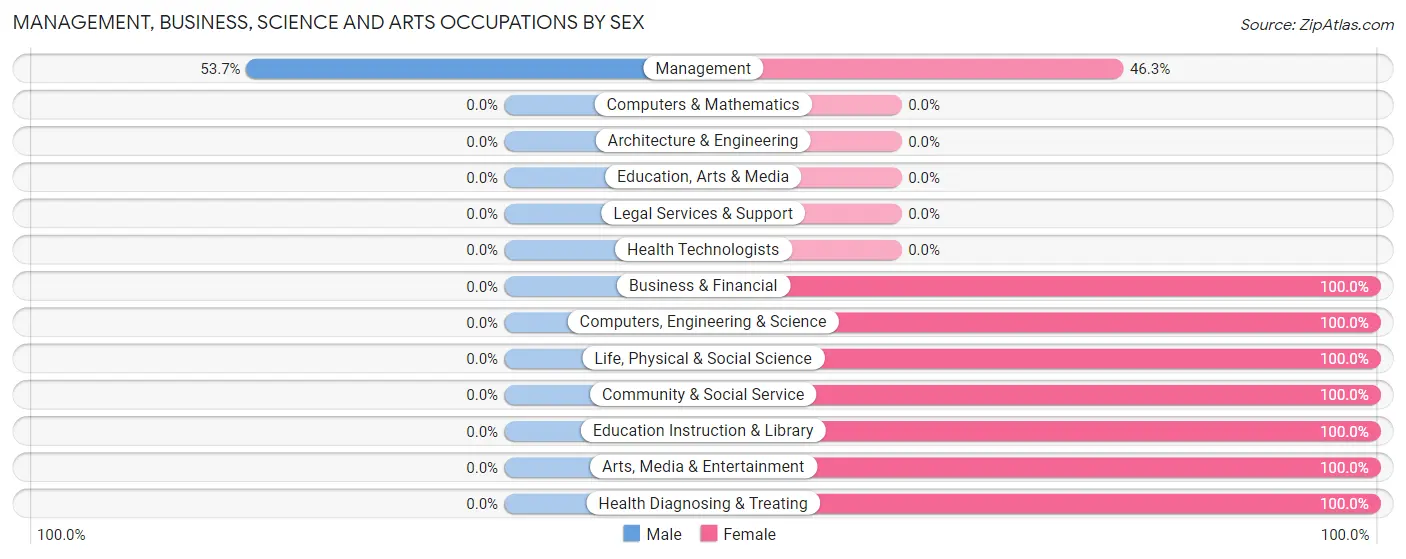
| Occupation | Male | Female |
| Management | 36 (53.7%) | 31 (46.3%) |
| Business & Financial | 0 (0.0%) | 36 (100.0%) |
| Computers, Engineering & Science | 0 (0.0%) | 8 (100.0%) |
| Computers & Mathematics | 0 (0.0%) | 0 (0.0%) |
| Architecture & Engineering | 0 (0.0%) | 0 (0.0%) |
| Life, Physical & Social Science | 0 (0.0%) | 8 (100.0%) |
| Community & Social Service | 0 (0.0%) | 22 (100.0%) |
| Education, Arts & Media | 0 (0.0%) | 0 (0.0%) |
| Legal Services & Support | 0 (0.0%) | 0 (0.0%) |
| Education Instruction & Library | 0 (0.0%) | 13 (100.0%) |
| Arts, Media & Entertainment | 0 (0.0%) | 9 (100.0%) |
| Health Diagnosing & Treating | 0 (0.0%) | 13 (100.0%) |
| Health Technologists | 0 (0.0%) | 0 (0.0%) |
| Total (Category) | 36 (24.7%) | 110 (75.3%) |
| Total (Overall) | 477 (55.3%) | 385 (44.7%) |
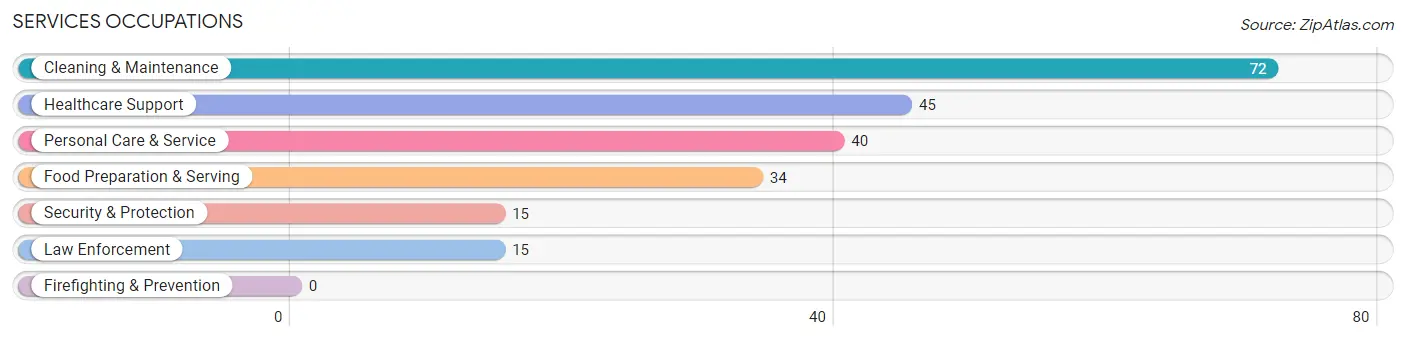
Services Occupations
The most common Services occupations in Priest River are Cleaning & Maintenance (72 | 8.4%), Healthcare Support (45 | 5.2%), Personal Care & Service (40 | 4.6%), Food Preparation & Serving (34 | 3.9%), and Security & Protection (15 | 1.7%).
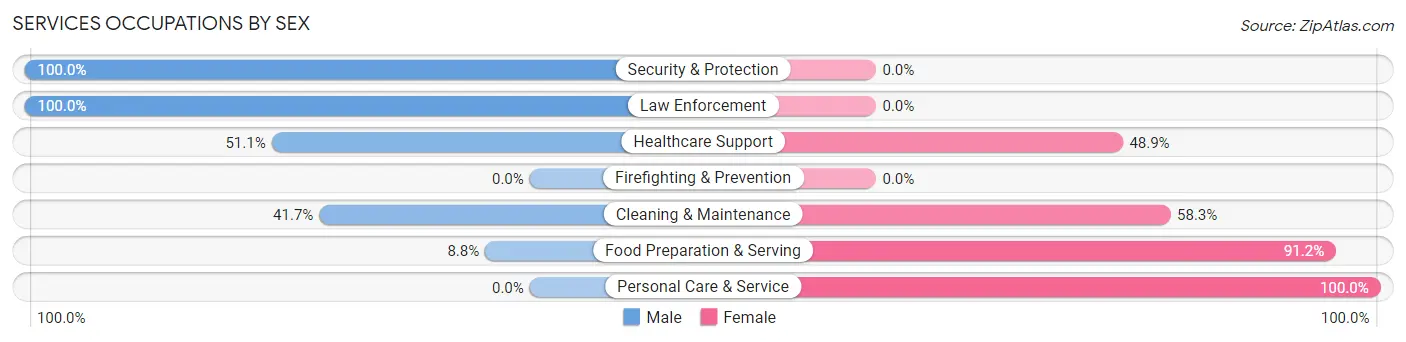
Services Occupations by Sex
Within the Services occupations in Priest River, the most male-oriented occupations are Security & Protection (100.0%), Law Enforcement (100.0%), and Healthcare Support (51.1%), while the most female-oriented occupations are Personal Care & Service (100.0%), Food Preparation & Serving (91.2%), and Cleaning & Maintenance (58.3%).
| Occupation | Male | Female |
| Healthcare Support | 23 (51.1%) | 22 (48.9%) |
| Security & Protection | 15 (100.0%) | 0 (0.0%) |
| Firefighting & Prevention | 0 (0.0%) | 0 (0.0%) |
| Law Enforcement | 15 (100.0%) | 0 (0.0%) |
| Food Preparation & Serving | 3 (8.8%) | 31 (91.2%) |
| Cleaning & Maintenance | 30 (41.7%) | 42 (58.3%) |
| Personal Care & Service | 0 (0.0%) | 40 (100.0%) |
| Total (Category) | 71 (34.5%) | 135 (65.5%) |
| Total (Overall) | 477 (55.3%) | 385 (44.7%) |
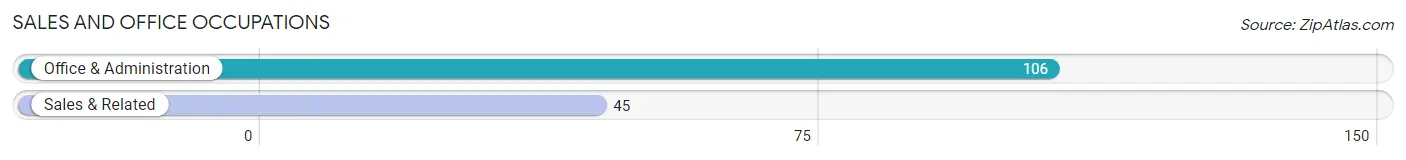
Sales and Office Occupations
The most common Sales and Office occupations in Priest River are Office & Administration (106 | 12.3%), and Sales & Related (45 | 5.2%).
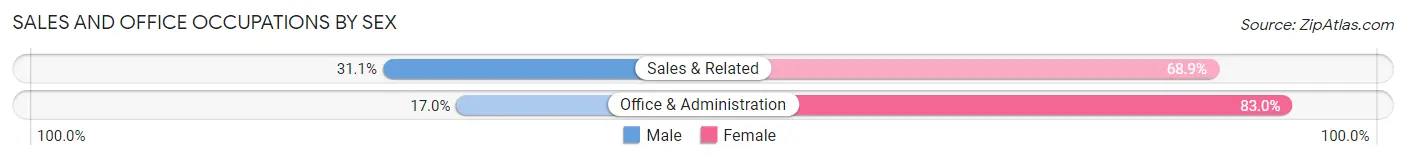
Sales and Office Occupations by Sex
| Occupation | Male | Female |
| Sales & Related | 14 (31.1%) | 31 (68.9%) |
| Office & Administration | 18 (17.0%) | 88 (83.0%) |
| Total (Category) | 32 (21.2%) | 119 (78.8%) |
| Total (Overall) | 477 (55.3%) | 385 (44.7%) |
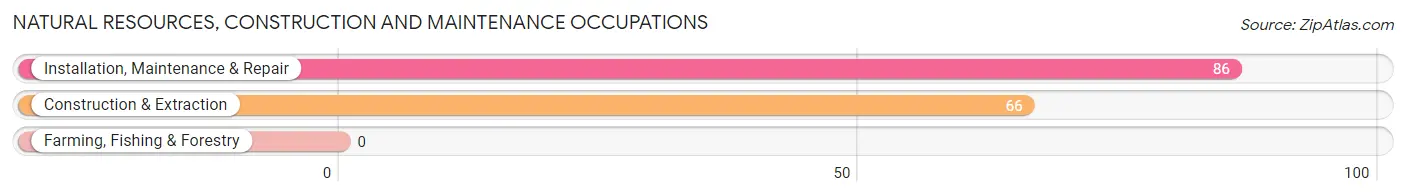
Natural Resources, Construction and Maintenance Occupations
The most common Natural Resources, Construction and Maintenance occupations in Priest River are Installation, Maintenance & Repair (86 | 10.0%), and Construction & Extraction (66 | 7.7%).
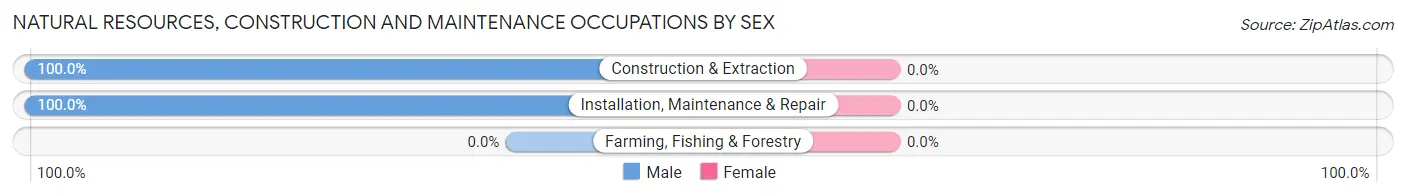
Natural Resources, Construction and Maintenance Occupations by Sex
| Occupation | Male | Female |
| Farming, Fishing & Forestry | 0 (0.0%) | 0 (0.0%) |
| Construction & Extraction | 66 (100.0%) | 0 (0.0%) |
| Installation, Maintenance & Repair | 86 (100.0%) | 0 (0.0%) |
| Total (Category) | 152 (100.0%) | 0 (0.0%) |
| Total (Overall) | 477 (55.3%) | 385 (44.7%) |
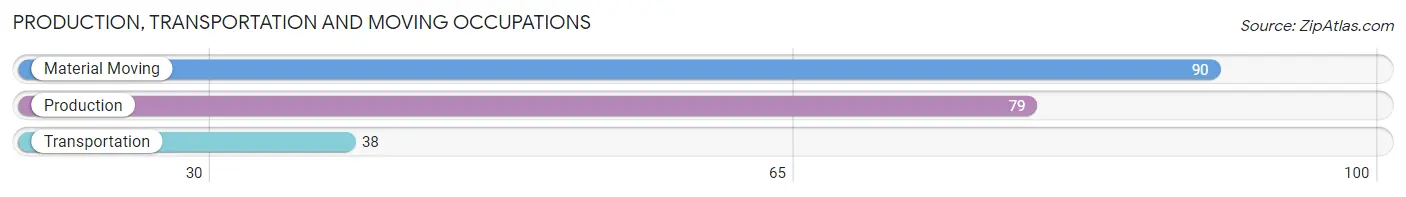
Production, Transportation and Moving Occupations
The most common Production, Transportation and Moving occupations in Priest River are Material Moving (90 | 10.4%), Production (79 | 9.2%), and Transportation (38 | 4.4%).
Production, Transportation and Moving Occupations by Sex
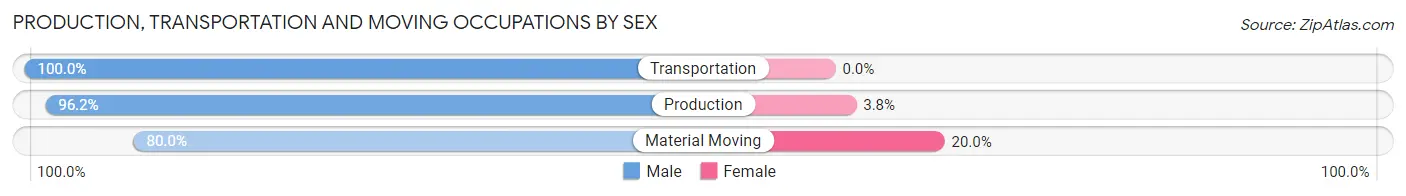
| Occupation | Male | Female |
| Production | 76 (96.2%) | 3 (3.8%) |
| Transportation | 38 (100.0%) | 0 (0.0%) |
| Material Moving | 72 (80.0%) | 18 (20.0%) |
| Total (Category) | 186 (89.9%) | 21 (10.1%) |
| Total (Overall) | 477 (55.3%) | 385 (44.7%) |
Employment Industries by Sex in Priest River
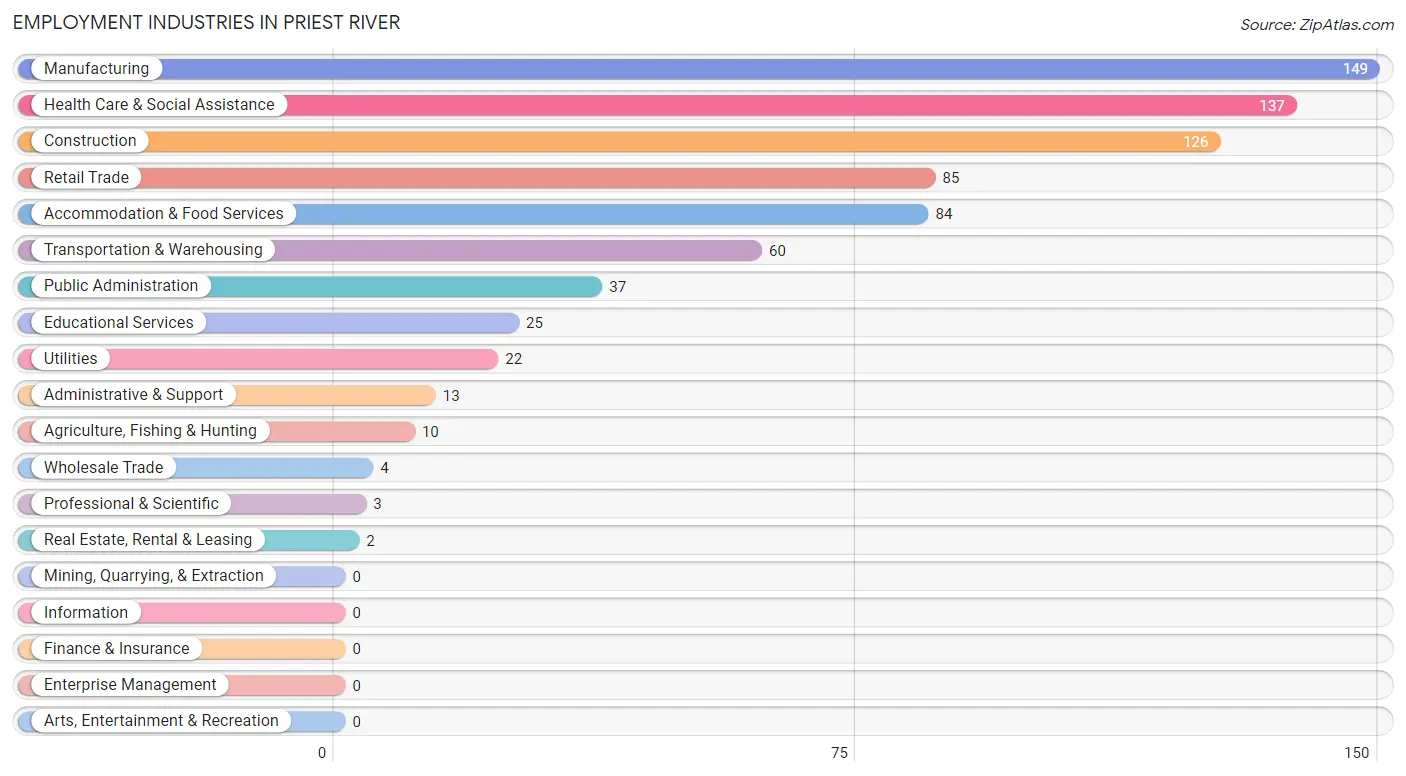
Employment Industries in Priest River
The major employment industries in Priest River include Manufacturing (149 | 17.3%), Health Care & Social Assistance (137 | 15.9%), Construction (126 | 14.6%), Retail Trade (85 | 9.9%), and Accommodation & Food Services (84 | 9.7%).
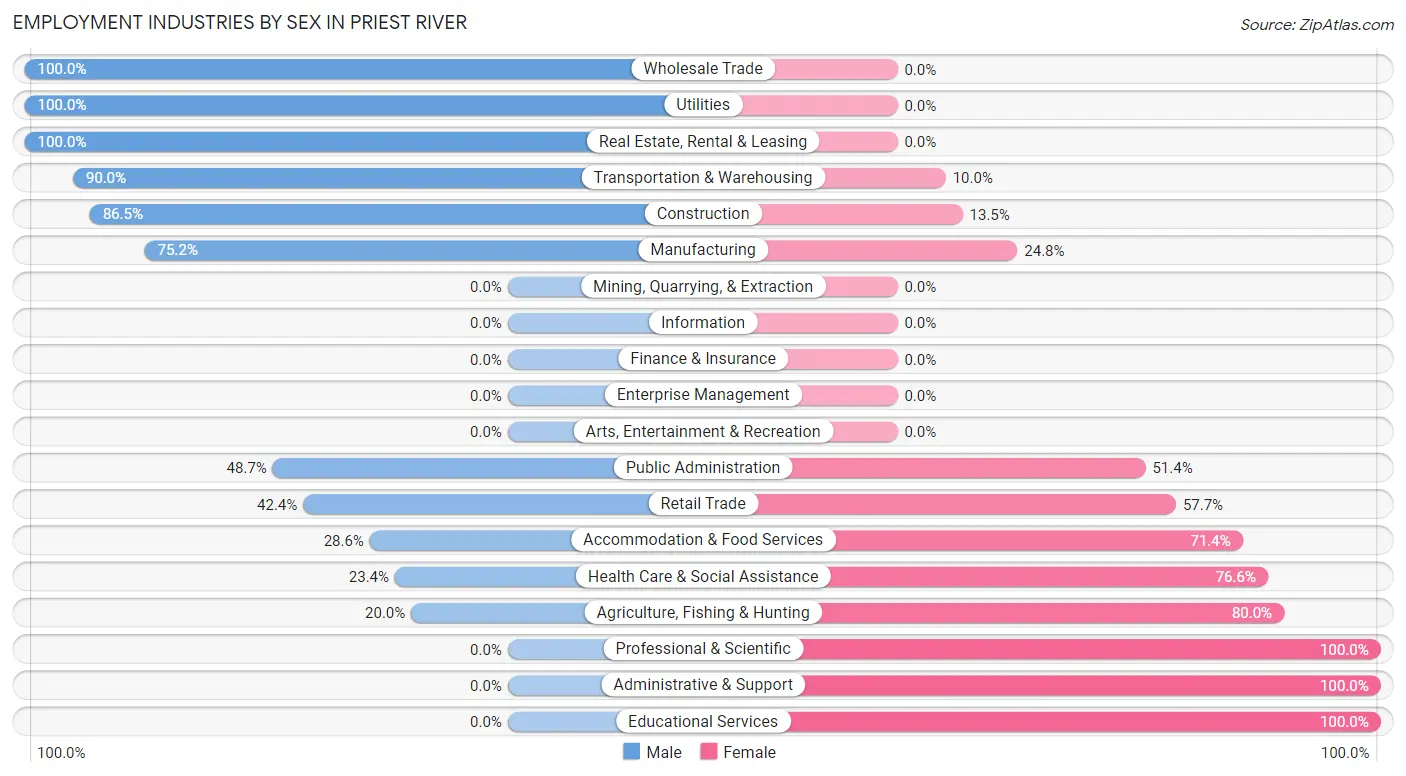
Employment Industries by Sex in Priest River
The Priest River industries that see more men than women are Wholesale Trade (100.0%), Utilities (100.0%), and Real Estate, Rental & Leasing (100.0%), whereas the industries that tend to have a higher number of women are Professional & Scientific (100.0%), Administrative & Support (100.0%), and Educational Services (100.0%).
| Industry | Male | Female |
| Agriculture, Fishing & Hunting | 2 (20.0%) | 8 (80.0%) |
| Mining, Quarrying, & Extraction | 0 (0.0%) | 0 (0.0%) |
| Construction | 109 (86.5%) | 17 (13.5%) |
| Manufacturing | 112 (75.2%) | 37 (24.8%) |
| Wholesale Trade | 4 (100.0%) | 0 (0.0%) |
| Retail Trade | 36 (42.3%) | 49 (57.7%) |
| Transportation & Warehousing | 54 (90.0%) | 6 (10.0%) |
| Utilities | 22 (100.0%) | 0 (0.0%) |
| Information | 0 (0.0%) | 0 (0.0%) |
| Finance & Insurance | 0 (0.0%) | 0 (0.0%) |
| Real Estate, Rental & Leasing | 2 (100.0%) | 0 (0.0%) |
| Professional & Scientific | 0 (0.0%) | 3 (100.0%) |
| Enterprise Management | 0 (0.0%) | 0 (0.0%) |
| Administrative & Support | 0 (0.0%) | 13 (100.0%) |
| Educational Services | 0 (0.0%) | 25 (100.0%) |
| Health Care & Social Assistance | 32 (23.4%) | 105 (76.6%) |
| Arts, Entertainment & Recreation | 0 (0.0%) | 0 (0.0%) |
| Accommodation & Food Services | 24 (28.6%) | 60 (71.4%) |
| Public Administration | 18 (48.6%) | 19 (51.3%) |
| Total | 477 (55.3%) | 385 (44.7%) |
Education in Priest River
School Enrollment in Priest River
The most common levels of schooling among the 430 students in Priest River are middle school (167 | 38.8%), elementary school (115 | 26.7%), and high school (82 | 19.1%).
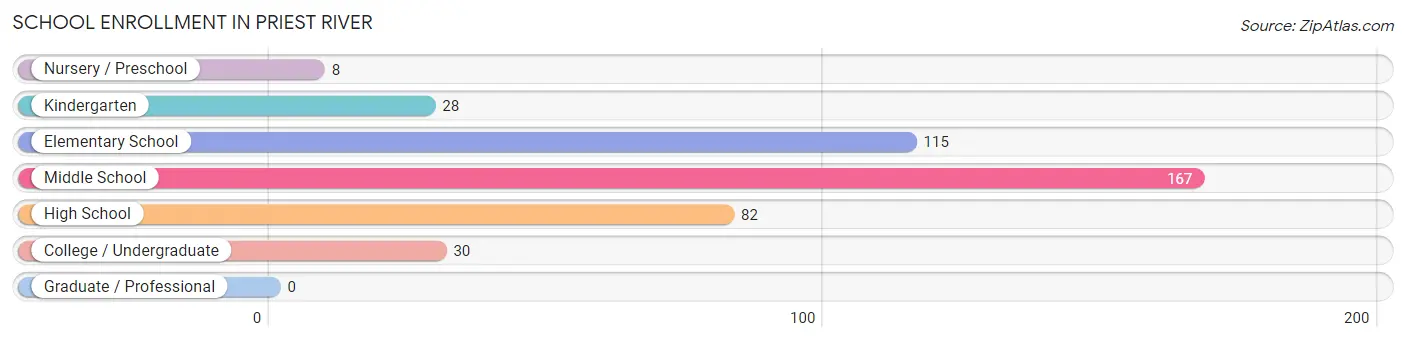
| School Level | # Students | % Students |
| Nursery / Preschool | 8 | 1.9% |
| Kindergarten | 28 | 6.5% |
| Elementary School | 115 | 26.7% |
| Middle School | 167 | 38.8% |
| High School | 82 | 19.1% |
| College / Undergraduate | 30 | 7.0% |
| Graduate / Professional | 0 | 0.0% |
| Total | 430 | 100.0% |
School Enrollment by Age by Funding Source in Priest River
Out of a total of 430 students who are enrolled in schools in Priest River, 51 (11.9%) attend a private institution, while the remaining 379 (88.1%) are enrolled in public schools. The age group of 3 to 4 year olds has the highest likelihood of being enrolled in private schools, with 8 (100.0% in the age bracket) enrolled. Conversely, the age group of 25 to 34 year olds has the lowest likelihood of being enrolled in a private school, with 7 (100.0% in the age bracket) attending a public institution.
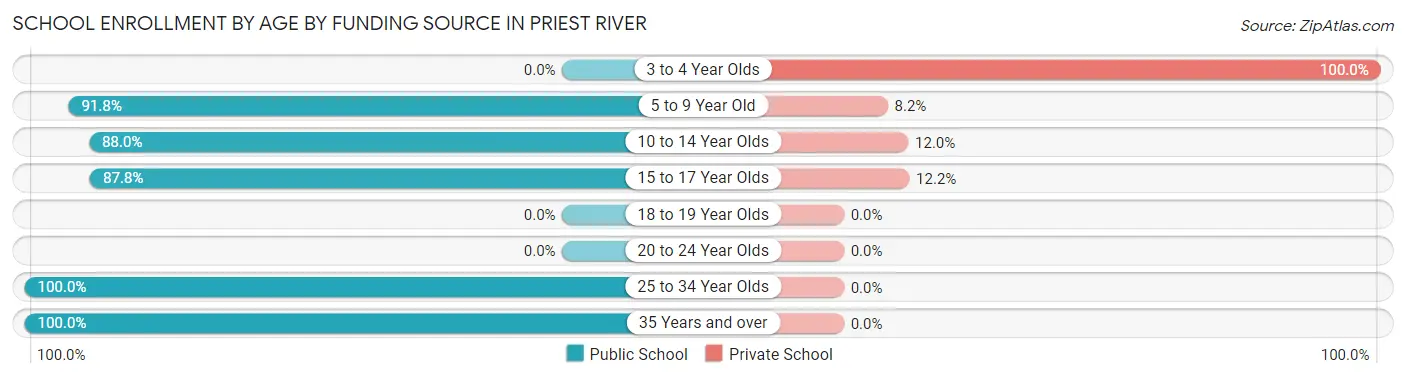
| Age Bracket | Public School | Private School |
| 3 to 4 Year Olds | 0 (0.0%) | 8 (100.0%) |
| 5 to 9 Year Old | 101 (91.8%) | 9 (8.2%) |
| 10 to 14 Year Olds | 176 (88.0%) | 24 (12.0%) |
| 15 to 17 Year Olds | 72 (87.8%) | 10 (12.2%) |
| 18 to 19 Year Olds | 0 (0.0%) | 0 (0.0%) |
| 20 to 24 Year Olds | 0 (0.0%) | 0 (0.0%) |
| 25 to 34 Year Olds | 7 (100.0%) | 0 (0.0%) |
| 35 Years and over | 23 (100.0%) | 0 (0.0%) |
| Total | 379 (88.1%) | 51 (11.9%) |
Educational Attainment by Field of Study in Priest River
Business (46 | 30.5%), education (18 | 11.9%), social sciences (15 | 9.9%), arts & humanities (15 | 9.9%), and psychology (14 | 9.3%) are the most common fields of study among 151 individuals in Priest River who have obtained a bachelor's degree or higher.
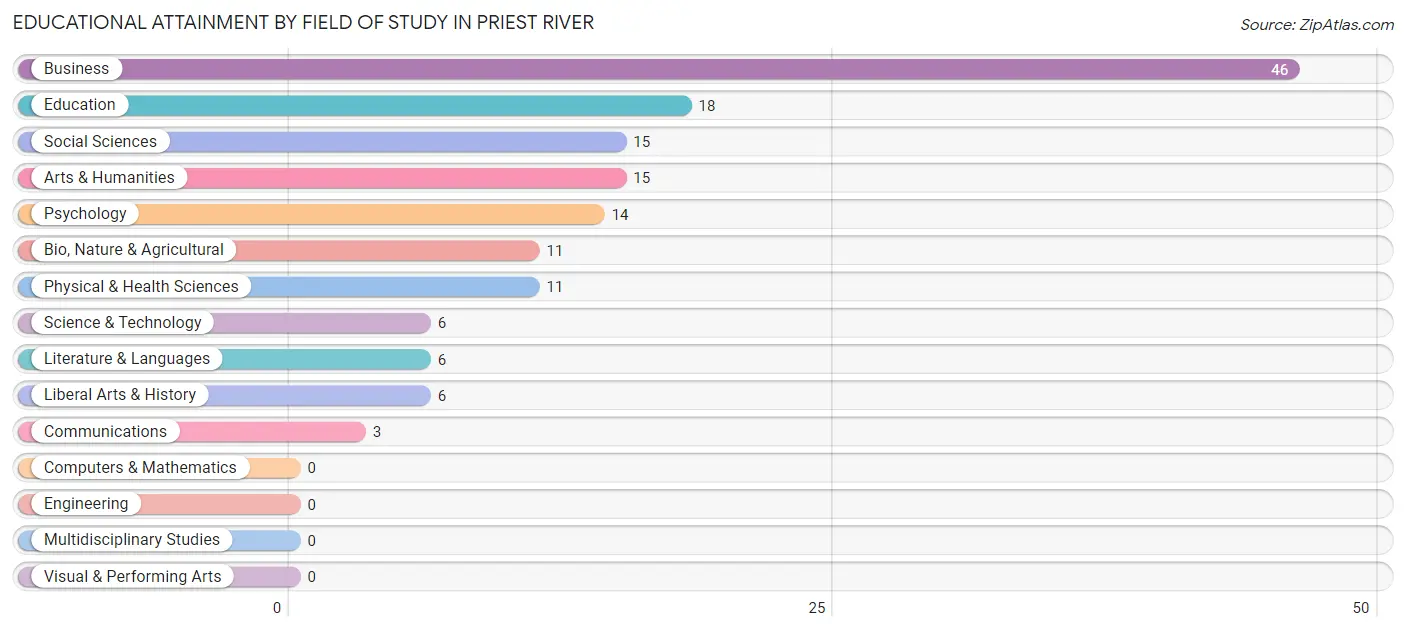
| Field of Study | # Graduates | % Graduates |
| Computers & Mathematics | 0 | 0.0% |
| Bio, Nature & Agricultural | 11 | 7.3% |
| Physical & Health Sciences | 11 | 7.3% |
| Psychology | 14 | 9.3% |
| Social Sciences | 15 | 9.9% |
| Engineering | 0 | 0.0% |
| Multidisciplinary Studies | 0 | 0.0% |
| Science & Technology | 6 | 4.0% |
| Business | 46 | 30.5% |
| Education | 18 | 11.9% |
| Literature & Languages | 6 | 4.0% |
| Liberal Arts & History | 6 | 4.0% |
| Visual & Performing Arts | 0 | 0.0% |
| Communications | 3 | 2.0% |
| Arts & Humanities | 15 | 9.9% |
| Total | 151 | 100.0% |
Transportation & Commute in Priest River
Vehicle Availability by Sex in Priest River
The most prevalent vehicle ownership categories in Priest River are males with 3 vehicles (122, accounting for 25.7%) and females with 3 vehicles (27, making up 31.9%).
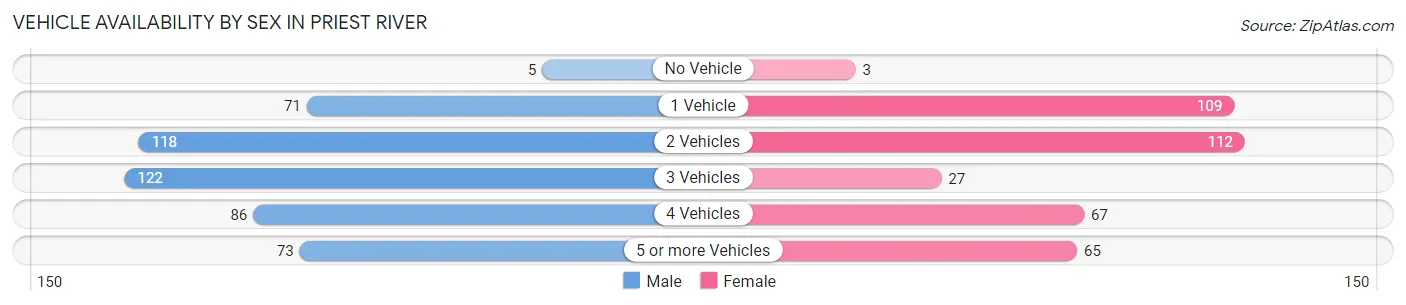
| Vehicles Available | Male | Female |
| No Vehicle | 5 (1.1%) | 3 (0.8%) |
| 1 Vehicle | 71 (14.9%) | 109 (28.5%) |
| 2 Vehicles | 118 (24.8%) | 112 (29.2%) |
| 3 Vehicles | 122 (25.7%) | 27 (7.0%) |
| 4 Vehicles | 86 (18.1%) | 67 (17.5%) |
| 5 or more Vehicles | 73 (15.4%) | 65 (17.0%) |
| Total | 475 (100.0%) | 383 (100.0%) |
Commute Time in Priest River
The most frequently occuring commute durations in Priest River are 30 to 34 minutes (161 commuters, 20.5%), 5 to 9 minutes (133 commuters, 16.9%), and 10 to 14 minutes (121 commuters, 15.4%).
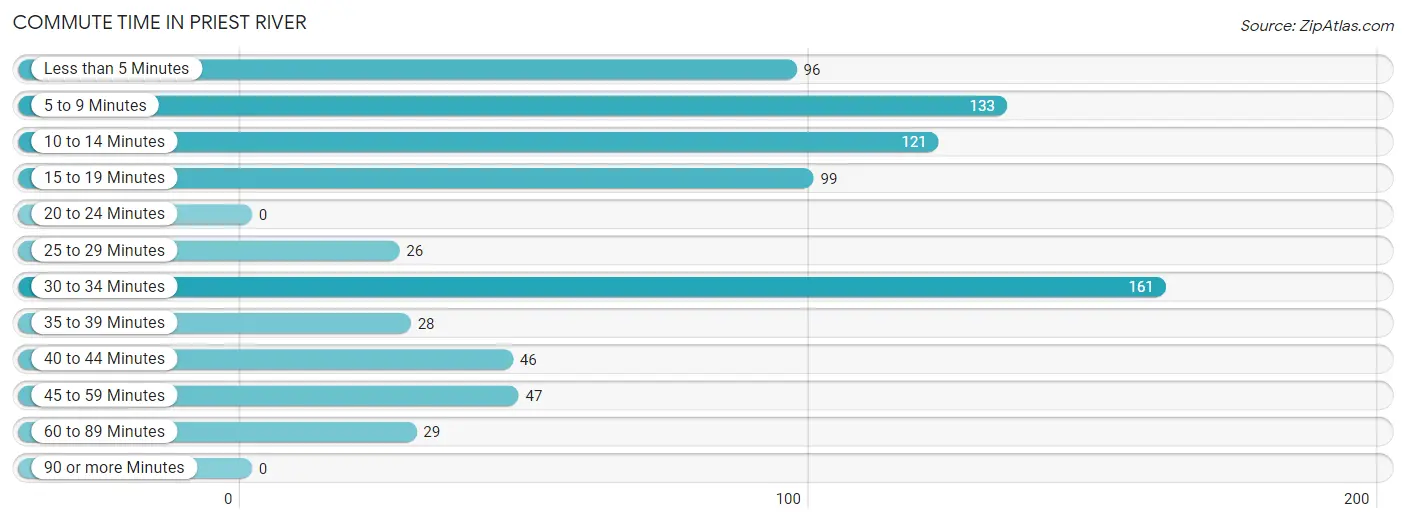
| Commute Time | # Commuters | % Commuters |
| Less than 5 Minutes | 96 | 12.2% |
| 5 to 9 Minutes | 133 | 16.9% |
| 10 to 14 Minutes | 121 | 15.4% |
| 15 to 19 Minutes | 99 | 12.6% |
| 20 to 24 Minutes | 0 | 0.0% |
| 25 to 29 Minutes | 26 | 3.3% |
| 30 to 34 Minutes | 161 | 20.5% |
| 35 to 39 Minutes | 28 | 3.6% |
| 40 to 44 Minutes | 46 | 5.9% |
| 45 to 59 Minutes | 47 | 6.0% |
| 60 to 89 Minutes | 29 | 3.7% |
| 90 or more Minutes | 0 | 0.0% |
Commute Time by Sex in Priest River
The most common commute times in Priest River are less than 5 minutes (72 commuters, 17.0%) for males and 30 to 34 minutes (90 commuters, 24.8%) for females.
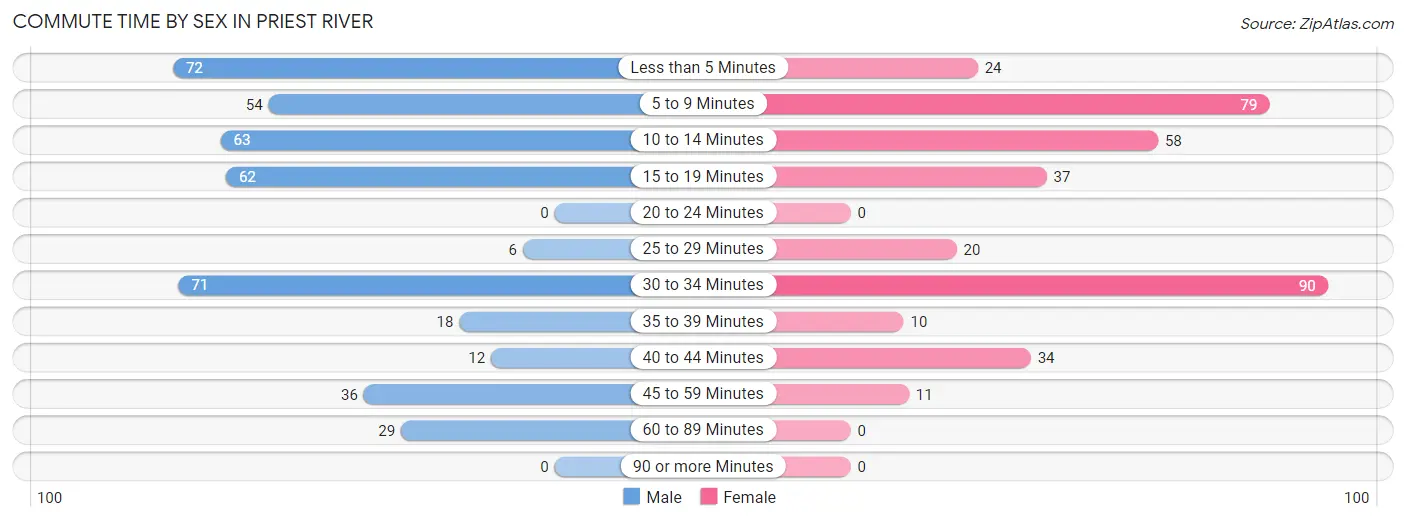
| Commute Time | Male | Female |
| Less than 5 Minutes | 72 (17.0%) | 24 (6.6%) |
| 5 to 9 Minutes | 54 (12.8%) | 79 (21.8%) |
| 10 to 14 Minutes | 63 (14.9%) | 58 (16.0%) |
| 15 to 19 Minutes | 62 (14.7%) | 37 (10.2%) |
| 20 to 24 Minutes | 0 (0.0%) | 0 (0.0%) |
| 25 to 29 Minutes | 6 (1.4%) | 20 (5.5%) |
| 30 to 34 Minutes | 71 (16.8%) | 90 (24.8%) |
| 35 to 39 Minutes | 18 (4.3%) | 10 (2.8%) |
| 40 to 44 Minutes | 12 (2.8%) | 34 (9.4%) |
| 45 to 59 Minutes | 36 (8.5%) | 11 (3.0%) |
| 60 to 89 Minutes | 29 (6.9%) | 0 (0.0%) |
| 90 or more Minutes | 0 (0.0%) | 0 (0.0%) |
Time of Departure to Work by Sex in Priest River
The most frequent times of departure to work in Priest River are 12:00 AM to 4:59 AM (75, 17.7%) for males and 8:30 AM to 8:59 AM (60, 16.5%) for females.
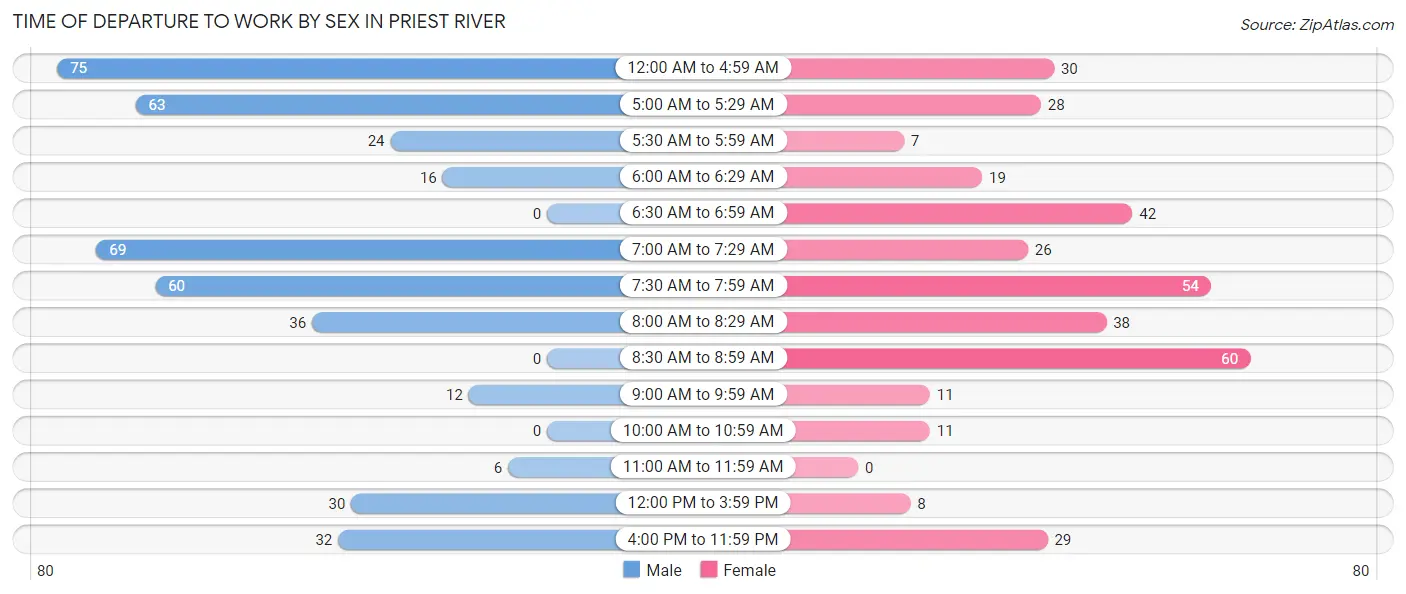
| Time of Departure | Male | Female |
| 12:00 AM to 4:59 AM | 75 (17.7%) | 30 (8.3%) |
| 5:00 AM to 5:29 AM | 63 (14.9%) | 28 (7.7%) |
| 5:30 AM to 5:59 AM | 24 (5.7%) | 7 (1.9%) |
| 6:00 AM to 6:29 AM | 16 (3.8%) | 19 (5.2%) |
| 6:30 AM to 6:59 AM | 0 (0.0%) | 42 (11.6%) |
| 7:00 AM to 7:29 AM | 69 (16.3%) | 26 (7.2%) |
| 7:30 AM to 7:59 AM | 60 (14.2%) | 54 (14.9%) |
| 8:00 AM to 8:29 AM | 36 (8.5%) | 38 (10.5%) |
| 8:30 AM to 8:59 AM | 0 (0.0%) | 60 (16.5%) |
| 9:00 AM to 9:59 AM | 12 (2.8%) | 11 (3.0%) |
| 10:00 AM to 10:59 AM | 0 (0.0%) | 11 (3.0%) |
| 11:00 AM to 11:59 AM | 6 (1.4%) | 0 (0.0%) |
| 12:00 PM to 3:59 PM | 30 (7.1%) | 8 (2.2%) |
| 4:00 PM to 11:59 PM | 32 (7.6%) | 29 (8.0%) |
| Total | 423 (100.0%) | 363 (100.0%) |
Housing Occupancy in Priest River
Occupancy by Ownership in Priest River
Of the total 880 dwellings in Priest River, owner-occupied units account for 665 (75.6%), while renter-occupied units make up 215 (24.4%).
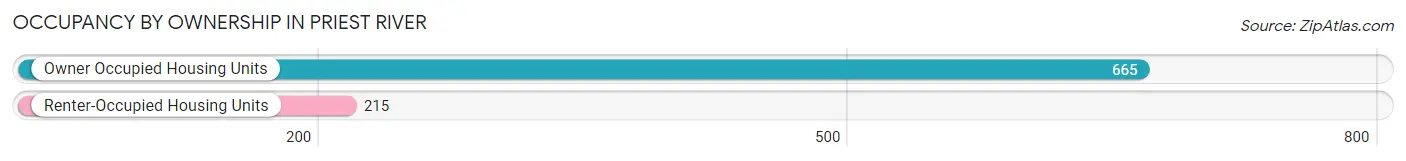
| Occupancy | # Housing Units | % Housing Units |
| Owner Occupied Housing Units | 665 | 75.6% |
| Renter-Occupied Housing Units | 215 | 24.4% |
| Total Occupied Housing Units | 880 | 100.0% |
Occupancy by Household Size in Priest River
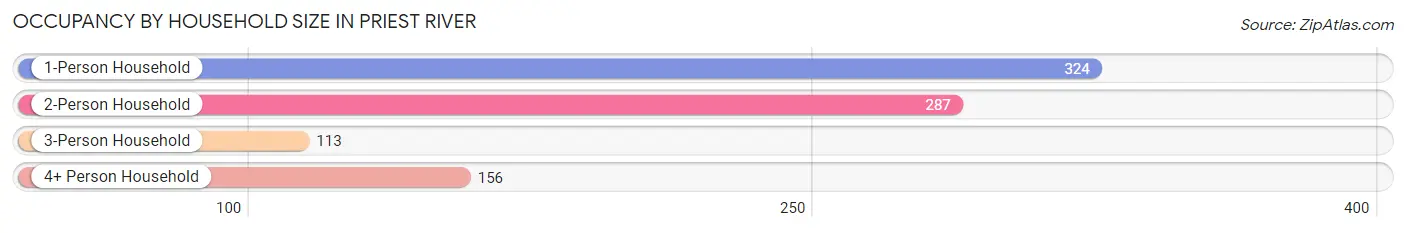
| Household Size | # Housing Units | % Housing Units |
| 1-Person Household | 324 | 36.8% |
| 2-Person Household | 287 | 32.6% |
| 3-Person Household | 113 | 12.8% |
| 4+ Person Household | 156 | 17.7% |
| Total Housing Units | 880 | 100.0% |
Occupancy by Ownership by Household Size in Priest River
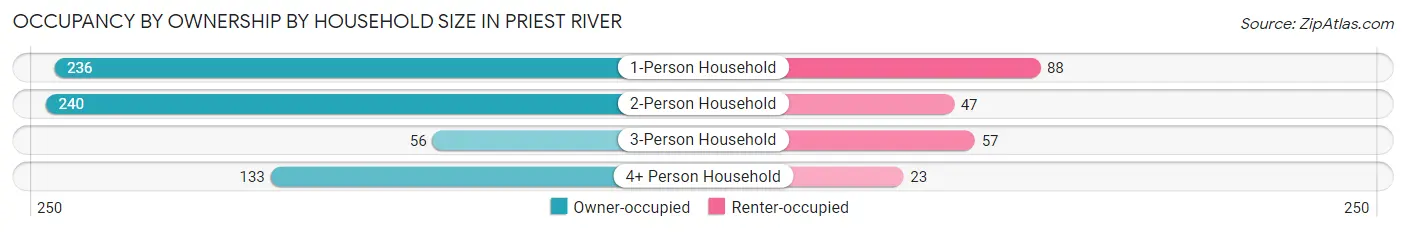
| Household Size | Owner-occupied | Renter-occupied |
| 1-Person Household | 236 (72.8%) | 88 (27.2%) |
| 2-Person Household | 240 (83.6%) | 47 (16.4%) |
| 3-Person Household | 56 (49.6%) | 57 (50.4%) |
| 4+ Person Household | 133 (85.3%) | 23 (14.7%) |
| Total Housing Units | 665 (75.6%) | 215 (24.4%) |
Occupancy by Educational Attainment in Priest River
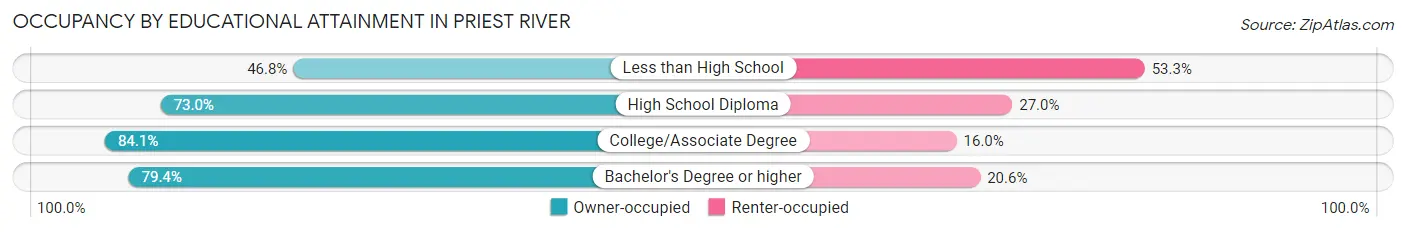
| Household Size | Owner-occupied | Renter-occupied |
| Less than High School | 36 (46.8%) | 41 (53.2%) |
| High School Diploma | 284 (73.0%) | 105 (27.0%) |
| College/Associate Degree | 295 (84.1%) | 56 (16.0%) |
| Bachelor's Degree or higher | 50 (79.4%) | 13 (20.6%) |
Occupancy by Age of Householder in Priest River
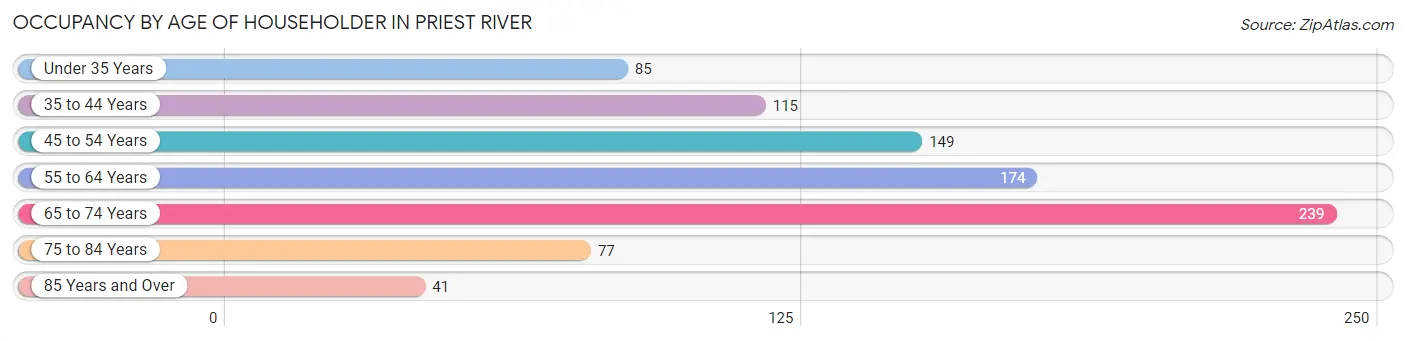
| Age Bracket | # Households | % Households |
| Under 35 Years | 85 | 9.7% |
| 35 to 44 Years | 115 | 13.1% |
| 45 to 54 Years | 149 | 16.9% |
| 55 to 64 Years | 174 | 19.8% |
| 65 to 74 Years | 239 | 27.2% |
| 75 to 84 Years | 77 | 8.7% |
| 85 Years and Over | 41 | 4.7% |
| Total | 880 | 100.0% |
Housing Finances in Priest River
Median Income by Occupancy in Priest River
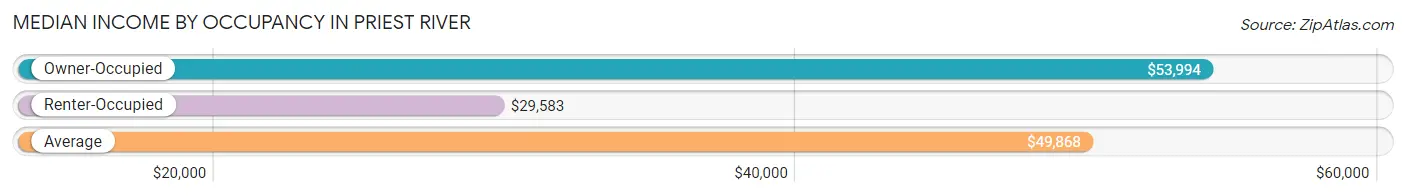
| Occupancy Type | # Households | Median Income |
| Owner-Occupied | 665 (75.6%) | $53,994 |
| Renter-Occupied | 215 (24.4%) | $29,583 |
| Average | 880 (100.0%) | $49,868 |
Occupancy by Householder Income Bracket in Priest River
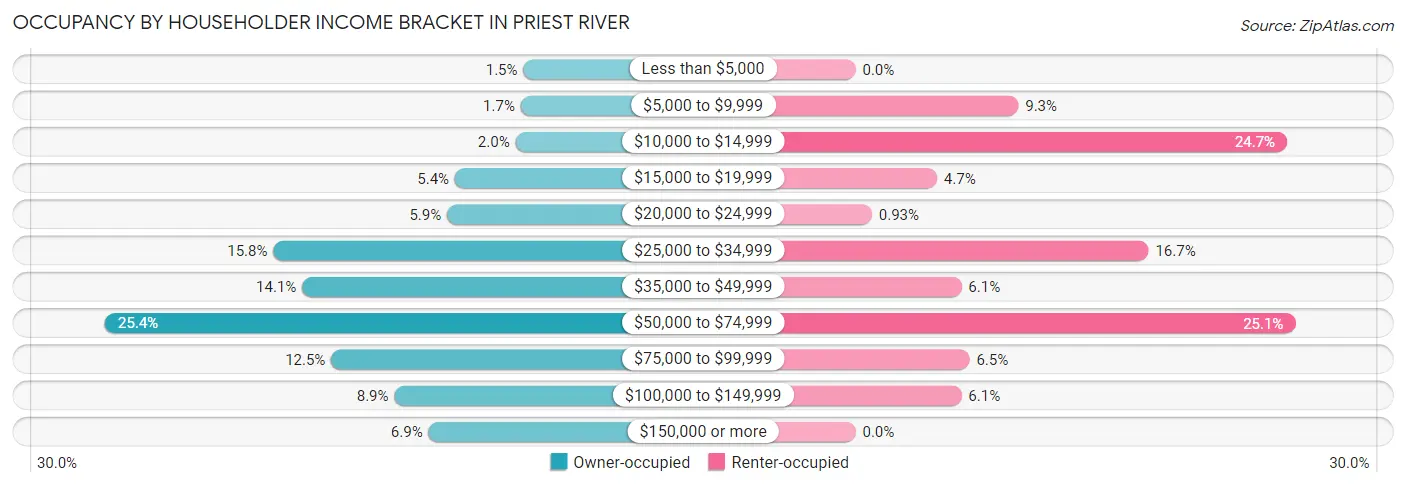
| Income Bracket | Owner-occupied | Renter-occupied |
| Less than $5,000 | 10 (1.5%) | 0 (0.0%) |
| $5,000 to $9,999 | 11 (1.7%) | 20 (9.3%) |
| $10,000 to $14,999 | 13 (1.9%) | 53 (24.6%) |
| $15,000 to $19,999 | 36 (5.4%) | 10 (4.6%) |
| $20,000 to $24,999 | 39 (5.9%) | 2 (0.9%) |
| $25,000 to $34,999 | 105 (15.8%) | 36 (16.7%) |
| $35,000 to $49,999 | 94 (14.1%) | 13 (6.0%) |
| $50,000 to $74,999 | 169 (25.4%) | 54 (25.1%) |
| $75,000 to $99,999 | 83 (12.5%) | 14 (6.5%) |
| $100,000 to $149,999 | 59 (8.9%) | 13 (6.0%) |
| $150,000 or more | 46 (6.9%) | 0 (0.0%) |
| Total | 665 (100.0%) | 215 (100.0%) |
Monthly Housing Cost Tiers in Priest River
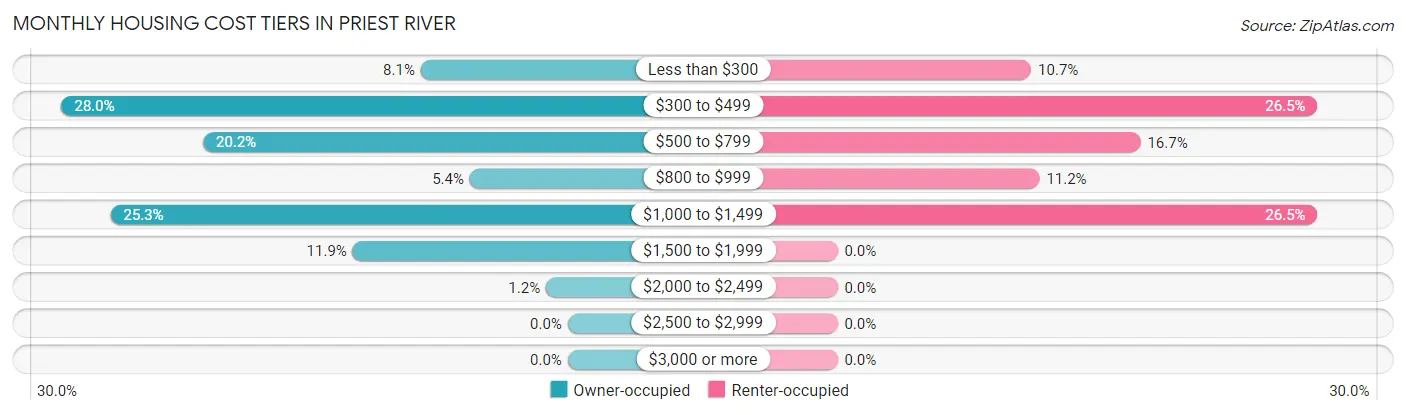
| Monthly Cost | Owner-occupied | Renter-occupied |
| Less than $300 | 54 (8.1%) | 23 (10.7%) |
| $300 to $499 | 186 (28.0%) | 57 (26.5%) |
| $500 to $799 | 134 (20.2%) | 36 (16.7%) |
| $800 to $999 | 36 (5.4%) | 24 (11.2%) |
| $1,000 to $1,499 | 168 (25.3%) | 57 (26.5%) |
| $1,500 to $1,999 | 79 (11.9%) | 0 (0.0%) |
| $2,000 to $2,499 | 8 (1.2%) | 0 (0.0%) |
| $2,500 to $2,999 | 0 (0.0%) | 0 (0.0%) |
| $3,000 or more | 0 (0.0%) | 0 (0.0%) |
| Total | 665 (100.0%) | 215 (100.0%) |
Physical Housing Characteristics in Priest River
Housing Structures in Priest River
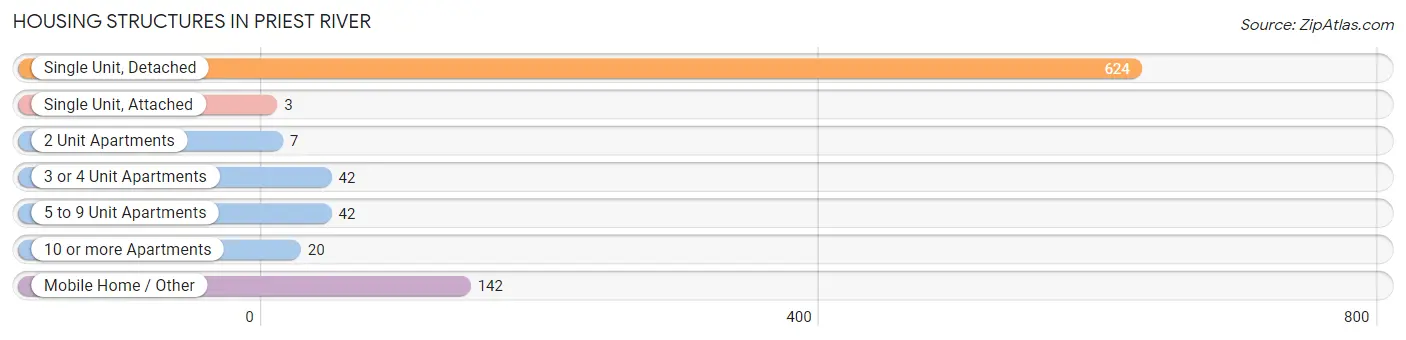
| Structure Type | # Housing Units | % Housing Units |
| Single Unit, Detached | 624 | 70.9% |
| Single Unit, Attached | 3 | 0.3% |
| 2 Unit Apartments | 7 | 0.8% |
| 3 or 4 Unit Apartments | 42 | 4.8% |
| 5 to 9 Unit Apartments | 42 | 4.8% |
| 10 or more Apartments | 20 | 2.3% |
| Mobile Home / Other | 142 | 16.1% |
| Total | 880 | 100.0% |
Housing Structures by Occupancy in Priest River
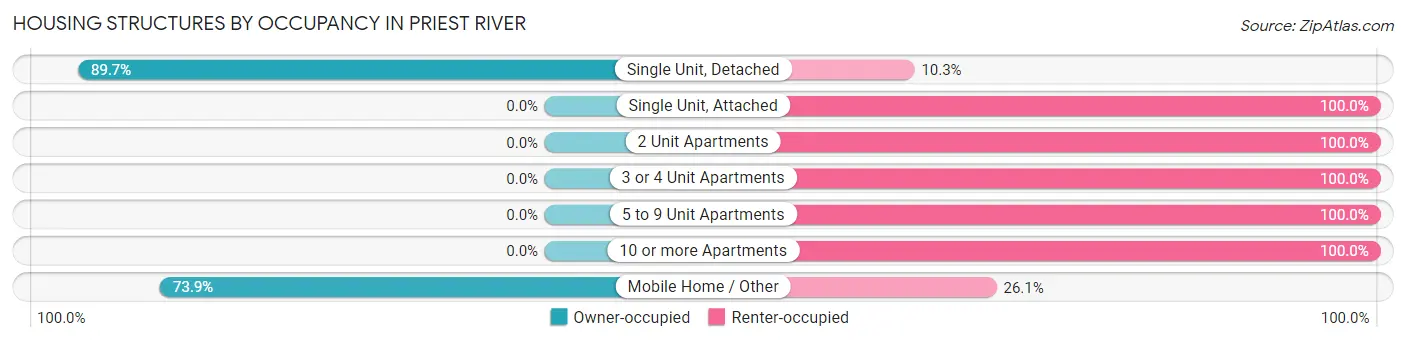
| Structure Type | Owner-occupied | Renter-occupied |
| Single Unit, Detached | 560 (89.7%) | 64 (10.3%) |
| Single Unit, Attached | 0 (0.0%) | 3 (100.0%) |
| 2 Unit Apartments | 0 (0.0%) | 7 (100.0%) |
| 3 or 4 Unit Apartments | 0 (0.0%) | 42 (100.0%) |
| 5 to 9 Unit Apartments | 0 (0.0%) | 42 (100.0%) |
| 10 or more Apartments | 0 (0.0%) | 20 (100.0%) |
| Mobile Home / Other | 105 (73.9%) | 37 (26.1%) |
| Total | 665 (75.6%) | 215 (24.4%) |
Housing Structures by Number of Rooms in Priest River
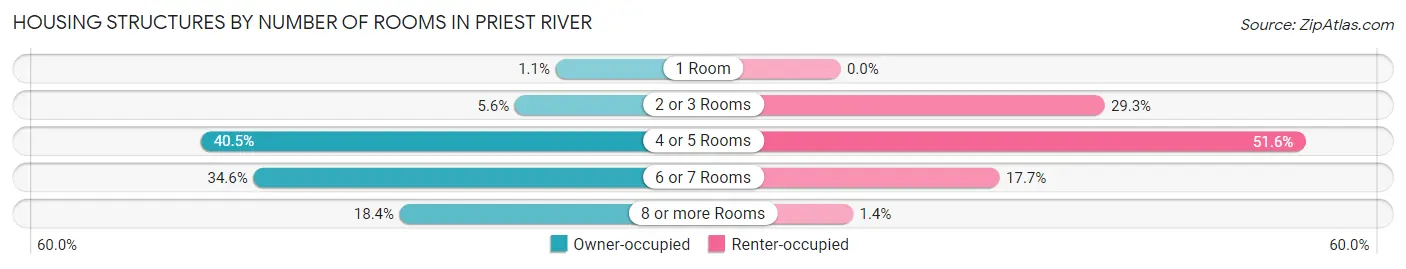
| Number of Rooms | Owner-occupied | Renter-occupied |
| 1 Room | 7 (1.1%) | 0 (0.0%) |
| 2 or 3 Rooms | 37 (5.6%) | 63 (29.3%) |
| 4 or 5 Rooms | 269 (40.5%) | 111 (51.6%) |
| 6 or 7 Rooms | 230 (34.6%) | 38 (17.7%) |
| 8 or more Rooms | 122 (18.3%) | 3 (1.4%) |
| Total | 665 (100.0%) | 215 (100.0%) |
Housing Structure by Heating Type in Priest River
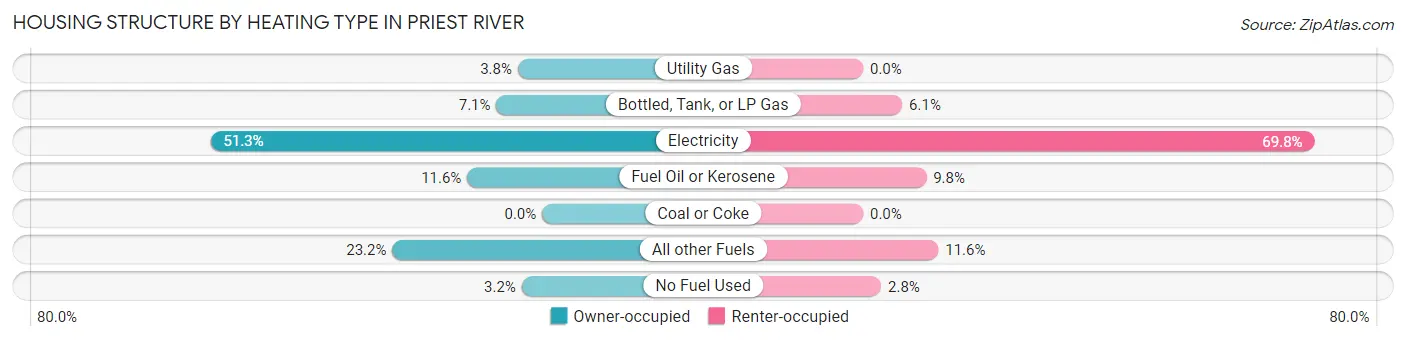
| Heating Type | Owner-occupied | Renter-occupied |
| Utility Gas | 25 (3.8%) | 0 (0.0%) |
| Bottled, Tank, or LP Gas | 47 (7.1%) | 13 (6.0%) |
| Electricity | 341 (51.3%) | 150 (69.8%) |
| Fuel Oil or Kerosene | 77 (11.6%) | 21 (9.8%) |
| Coal or Coke | 0 (0.0%) | 0 (0.0%) |
| All other Fuels | 154 (23.2%) | 25 (11.6%) |
| No Fuel Used | 21 (3.2%) | 6 (2.8%) |
| Total | 665 (100.0%) | 215 (100.0%) |
Household Vehicle Usage in Priest River
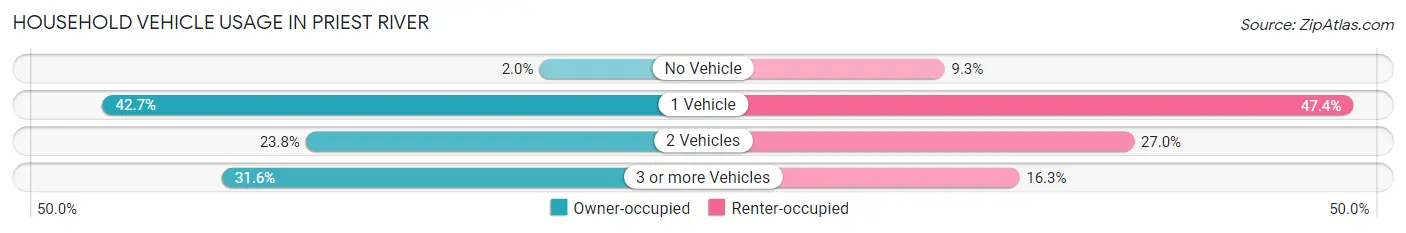
| Vehicles per Household | Owner-occupied | Renter-occupied |
| No Vehicle | 13 (1.9%) | 20 (9.3%) |
| 1 Vehicle | 284 (42.7%) | 102 (47.4%) |
| 2 Vehicles | 158 (23.8%) | 58 (27.0%) |
| 3 or more Vehicles | 210 (31.6%) | 35 (16.3%) |
| Total | 665 (100.0%) | 215 (100.0%) |
Real Estate & Mortgages in Priest River
Real Estate and Mortgage Overview in Priest River
| Characteristic | Without Mortgage | With Mortgage |
| Housing Units | 368 | 297 |
| Median Property Value | $223,500 | $242,700 |
| Median Household Income | $45,862 | $34 |
| Monthly Housing Costs | $449 | $0 |
| Real Estate Taxes | $1,356 | $0 |
Property Value by Mortgage Status in Priest River
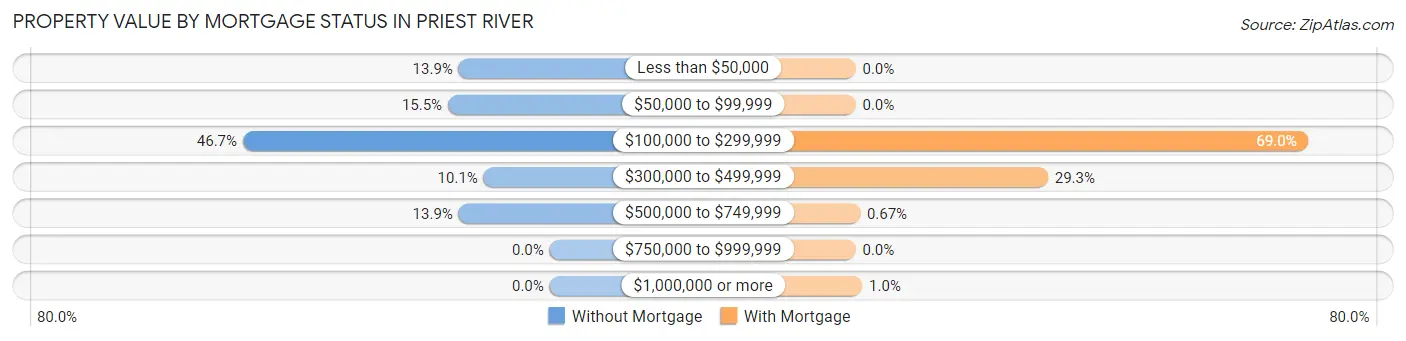
| Property Value | Without Mortgage | With Mortgage |
| Less than $50,000 | 51 (13.9%) | 0 (0.0%) |
| $50,000 to $99,999 | 57 (15.5%) | 0 (0.0%) |
| $100,000 to $299,999 | 172 (46.7%) | 205 (69.0%) |
| $300,000 to $499,999 | 37 (10.1%) | 87 (29.3%) |
| $500,000 to $749,999 | 51 (13.9%) | 2 (0.7%) |
| $750,000 to $999,999 | 0 (0.0%) | 0 (0.0%) |
| $1,000,000 or more | 0 (0.0%) | 3 (1.0%) |
| Total | 368 (100.0%) | 297 (100.0%) |
Household Income by Mortgage Status in Priest River
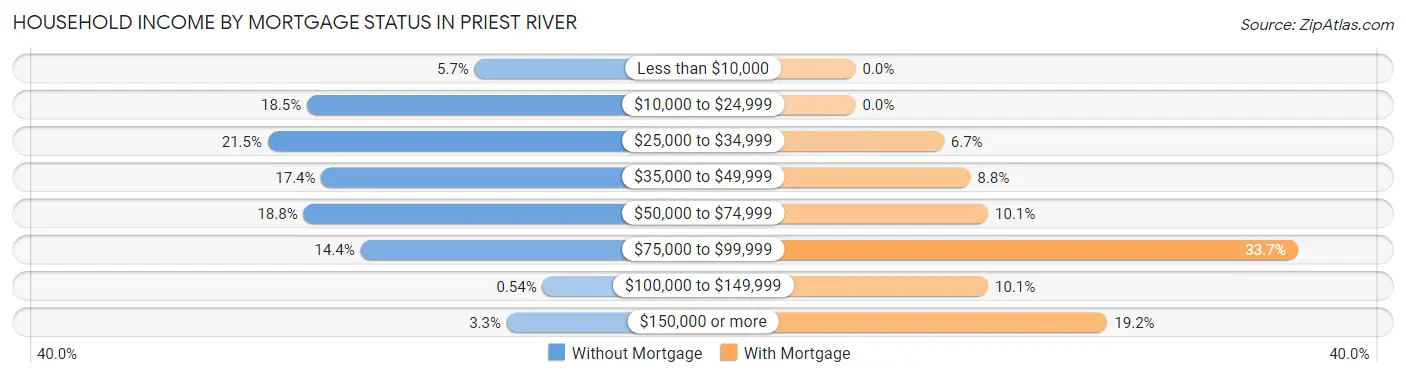
| Household Income | Without Mortgage | With Mortgage |
| Less than $10,000 | 21 (5.7%) | 0 (0.0%) |
| $10,000 to $24,999 | 68 (18.5%) | 0 (0.0%) |
| $25,000 to $34,999 | 79 (21.5%) | 20 (6.7%) |
| $35,000 to $49,999 | 64 (17.4%) | 26 (8.7%) |
| $50,000 to $74,999 | 69 (18.8%) | 30 (10.1%) |
| $75,000 to $99,999 | 53 (14.4%) | 100 (33.7%) |
| $100,000 to $149,999 | 2 (0.5%) | 30 (10.1%) |
| $150,000 or more | 12 (3.3%) | 57 (19.2%) |
| Total | 368 (100.0%) | 297 (100.0%) |
Property Value to Household Income Ratio in Priest River
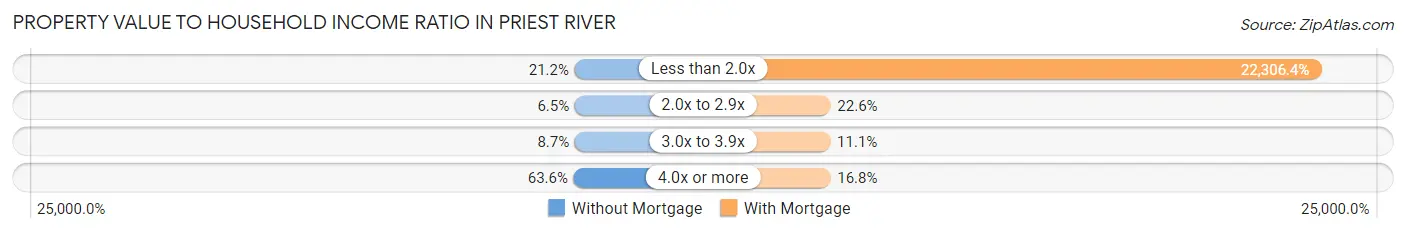
| Value-to-Income Ratio | Without Mortgage | With Mortgage |
| Less than 2.0x | 78 (21.2%) | 66,250 (22,306.4%) |
| 2.0x to 2.9x | 24 (6.5%) | 67 (22.6%) |
| 3.0x to 3.9x | 32 (8.7%) | 33 (11.1%) |
| 4.0x or more | 234 (63.6%) | 50 (16.8%) |
| Total | 368 (100.0%) | 297 (100.0%) |
Real Estate Taxes by Mortgage Status in Priest River
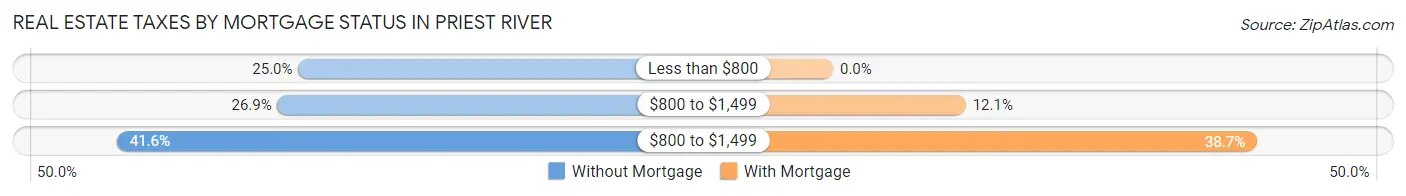
| Property Taxes | Without Mortgage | With Mortgage |
| Less than $800 | 92 (25.0%) | 0 (0.0%) |
| $800 to $1,499 | 99 (26.9%) | 36 (12.1%) |
| $800 to $1,499 | 153 (41.6%) | 115 (38.7%) |
| Total | 368 (100.0%) | 297 (100.0%) |
Health & Disability in Priest River
Health Insurance Coverage by Age in Priest River
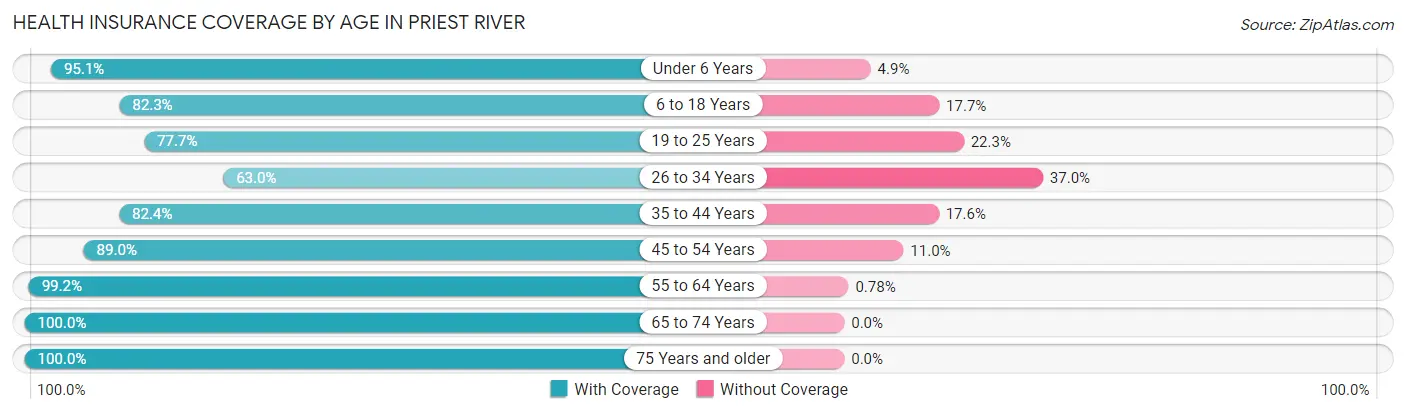
| Age Bracket | With Coverage | Without Coverage |
| Under 6 Years | 116 (95.1%) | 6 (4.9%) |
| 6 to 18 Years | 321 (82.3%) | 69 (17.7%) |
| 19 to 25 Years | 164 (77.7%) | 47 (22.3%) |
| 26 to 34 Years | 102 (63.0%) | 60 (37.0%) |
| 35 to 44 Years | 234 (82.4%) | 50 (17.6%) |
| 45 to 54 Years | 210 (89.0%) | 26 (11.0%) |
| 55 to 64 Years | 254 (99.2%) | 2 (0.8%) |
| 65 to 74 Years | 346 (100.0%) | 0 (0.0%) |
| 75 Years and older | 163 (100.0%) | 0 (0.0%) |
| Total | 1,910 (88.0%) | 260 (12.0%) |
Health Insurance Coverage by Citizenship Status in Priest River
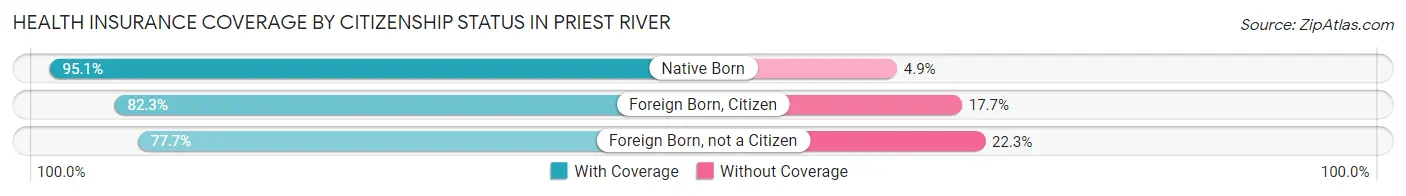
| Citizenship Status | With Coverage | Without Coverage |
| Native Born | 116 (95.1%) | 6 (4.9%) |
| Foreign Born, Citizen | 321 (82.3%) | 69 (17.7%) |
| Foreign Born, not a Citizen | 164 (77.7%) | 47 (22.3%) |
Health Insurance Coverage by Household Income in Priest River
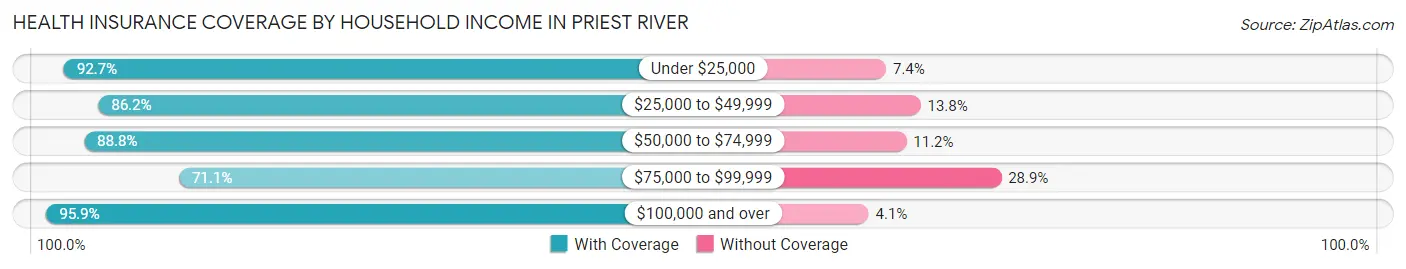
| Household Income | With Coverage | Without Coverage |
| Under $25,000 | 227 (92.6%) | 18 (7.3%) |
| $25,000 to $49,999 | 449 (86.2%) | 72 (13.8%) |
| $50,000 to $74,999 | 637 (88.8%) | 80 (11.2%) |
| $75,000 to $99,999 | 172 (71.1%) | 70 (28.9%) |
| $100,000 and over | 423 (95.9%) | 18 (4.1%) |
Public vs Private Health Insurance Coverage by Age in Priest River
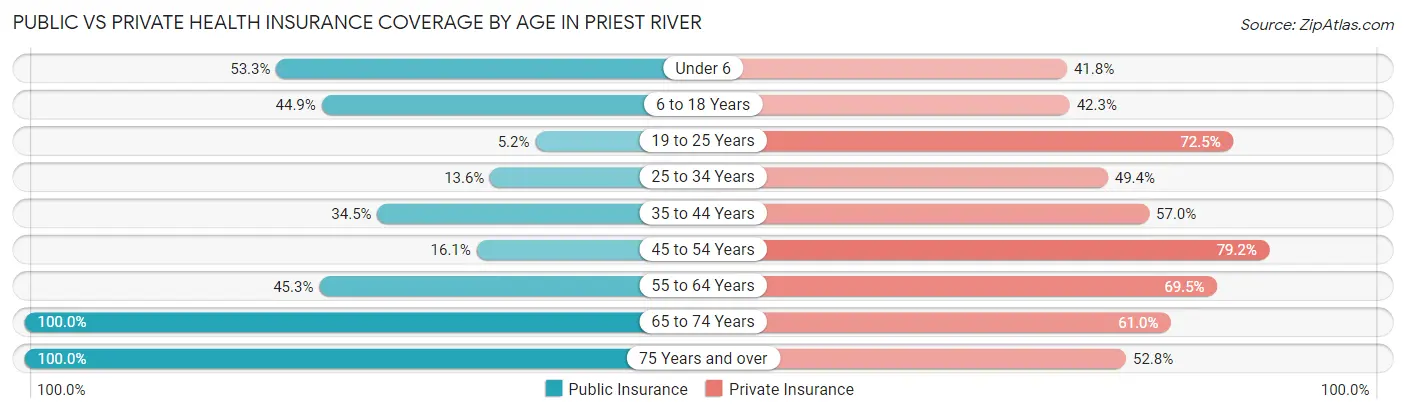
| Age Bracket | Public Insurance | Private Insurance |
| Under 6 | 65 (53.3%) | 51 (41.8%) |
| 6 to 18 Years | 175 (44.9%) | 165 (42.3%) |
| 19 to 25 Years | 11 (5.2%) | 153 (72.5%) |
| 25 to 34 Years | 22 (13.6%) | 80 (49.4%) |
| 35 to 44 Years | 98 (34.5%) | 162 (57.0%) |
| 45 to 54 Years | 38 (16.1%) | 187 (79.2%) |
| 55 to 64 Years | 116 (45.3%) | 178 (69.5%) |
| 65 to 74 Years | 346 (100.0%) | 211 (61.0%) |
| 75 Years and over | 163 (100.0%) | 86 (52.8%) |
| Total | 1,034 (47.6%) | 1,273 (58.7%) |
Disability Status by Sex by Age in Priest River
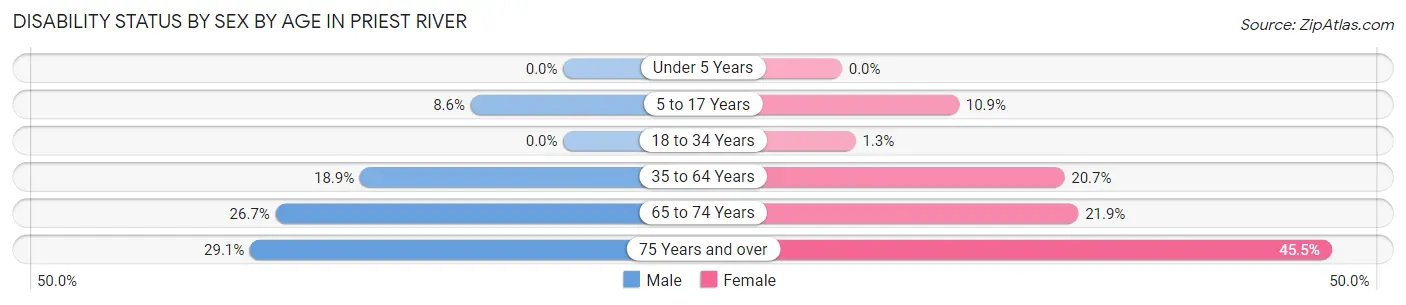
| Age Bracket | Male | Female |
| Under 5 Years | 0 (0.0%) | 0 (0.0%) |
| 5 to 17 Years | 22 (8.6%) | 19 (10.9%) |
| 18 to 34 Years | 0 (0.0%) | 2 (1.3%) |
| 35 to 64 Years | 77 (18.9%) | 76 (20.6%) |
| 65 to 74 Years | 51 (26.7%) | 34 (21.9%) |
| 75 Years and over | 25 (29.1%) | 35 (45.5%) |
Disability Class by Sex by Age in Priest River
Disability Class: Hearing Difficulty
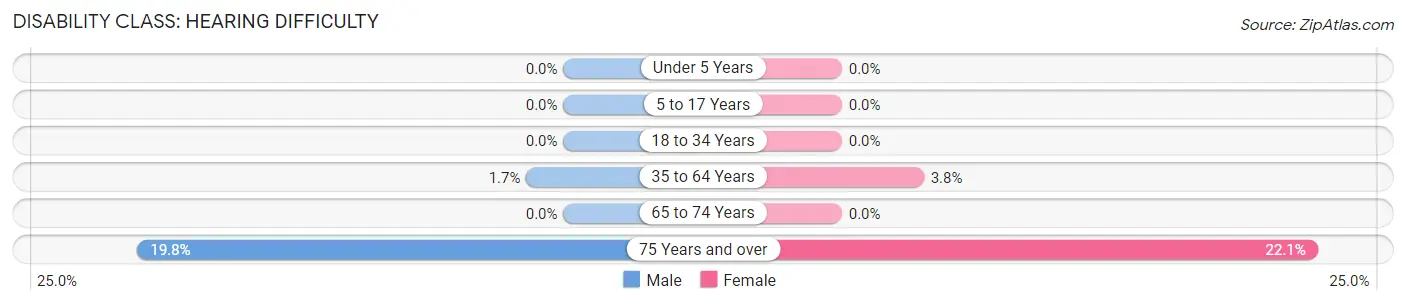
| Age Bracket | Male | Female |
| Under 5 Years | 0 (0.0%) | 0 (0.0%) |
| 5 to 17 Years | 0 (0.0%) | 0 (0.0%) |
| 18 to 34 Years | 0 (0.0%) | 0 (0.0%) |
| 35 to 64 Years | 7 (1.7%) | 14 (3.8%) |
| 65 to 74 Years | 0 (0.0%) | 0 (0.0%) |
| 75 Years and over | 17 (19.8%) | 17 (22.1%) |
Disability Class: Vision Difficulty
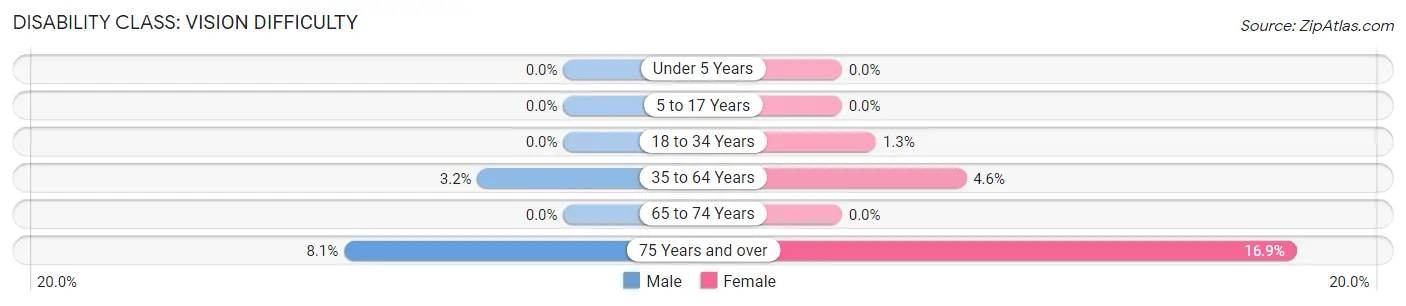
| Age Bracket | Male | Female |
| Under 5 Years | 0 (0.0%) | 0 (0.0%) |
| 5 to 17 Years | 0 (0.0%) | 0 (0.0%) |
| 18 to 34 Years | 0 (0.0%) | 2 (1.3%) |
| 35 to 64 Years | 13 (3.2%) | 17 (4.6%) |
| 65 to 74 Years | 0 (0.0%) | 0 (0.0%) |
| 75 Years and over | 7 (8.1%) | 13 (16.9%) |
Disability Class: Cognitive Difficulty
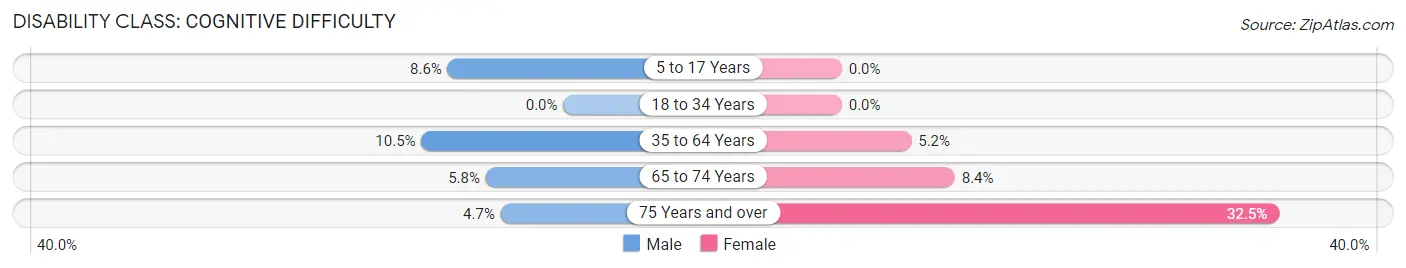
| Age Bracket | Male | Female |
| 5 to 17 Years | 22 (8.6%) | 0 (0.0%) |
| 18 to 34 Years | 0 (0.0%) | 0 (0.0%) |
| 35 to 64 Years | 43 (10.5%) | 19 (5.2%) |
| 65 to 74 Years | 11 (5.8%) | 13 (8.4%) |
| 75 Years and over | 4 (4.6%) | 25 (32.5%) |
Disability Class: Ambulatory Difficulty
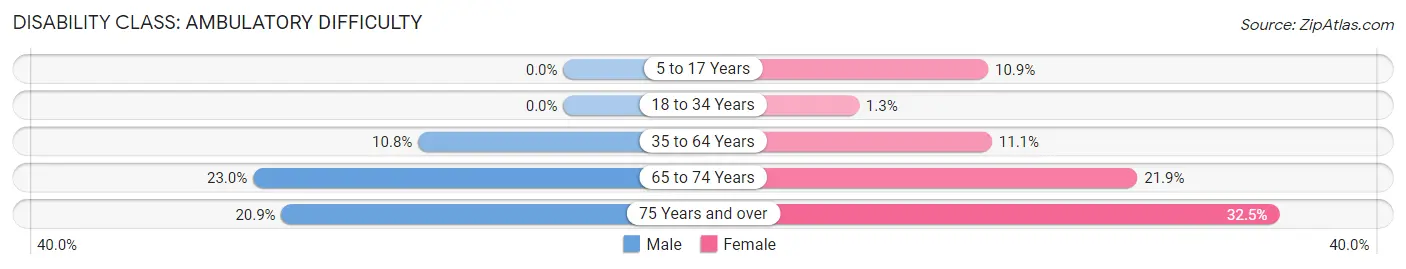
| Age Bracket | Male | Female |
| 5 to 17 Years | 0 (0.0%) | 19 (10.9%) |
| 18 to 34 Years | 0 (0.0%) | 2 (1.3%) |
| 35 to 64 Years | 44 (10.8%) | 41 (11.1%) |
| 65 to 74 Years | 44 (23.0%) | 34 (21.9%) |
| 75 Years and over | 18 (20.9%) | 25 (32.5%) |
Disability Class: Self-Care Difficulty
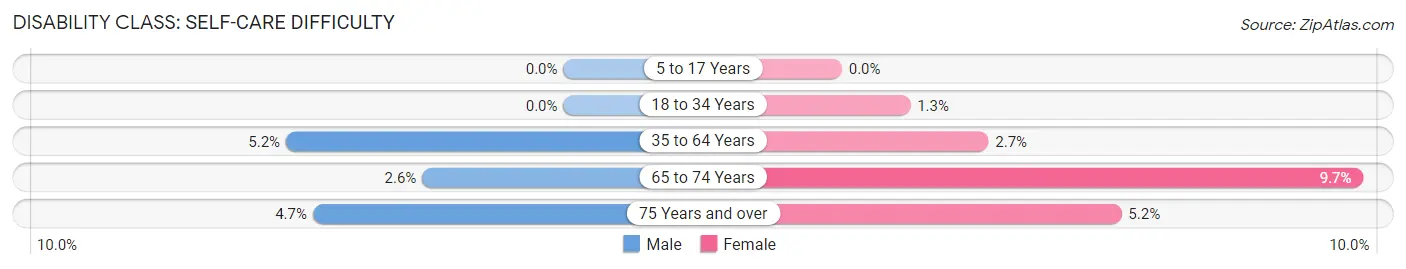
| Age Bracket | Male | Female |
| 5 to 17 Years | 0 (0.0%) | 0 (0.0%) |
| 18 to 34 Years | 0 (0.0%) | 2 (1.3%) |
| 35 to 64 Years | 21 (5.1%) | 10 (2.7%) |
| 65 to 74 Years | 5 (2.6%) | 15 (9.7%) |
| 75 Years and over | 4 (4.6%) | 4 (5.2%) |
Technology Access in Priest River
Computing Device Access in Priest River
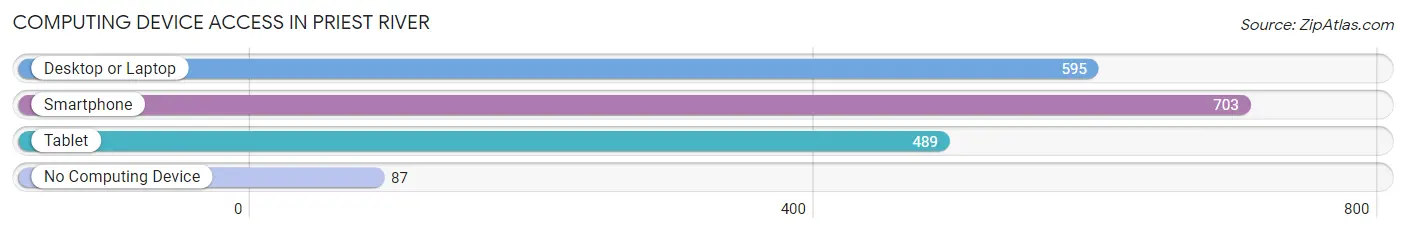
| Device Type | # Households | % Households |
| Desktop or Laptop | 595 | 67.6% |
| Smartphone | 703 | 79.9% |
| Tablet | 489 | 55.6% |
| No Computing Device | 87 | 9.9% |
| Total | 880 | 100.0% |
Internet Access in Priest River
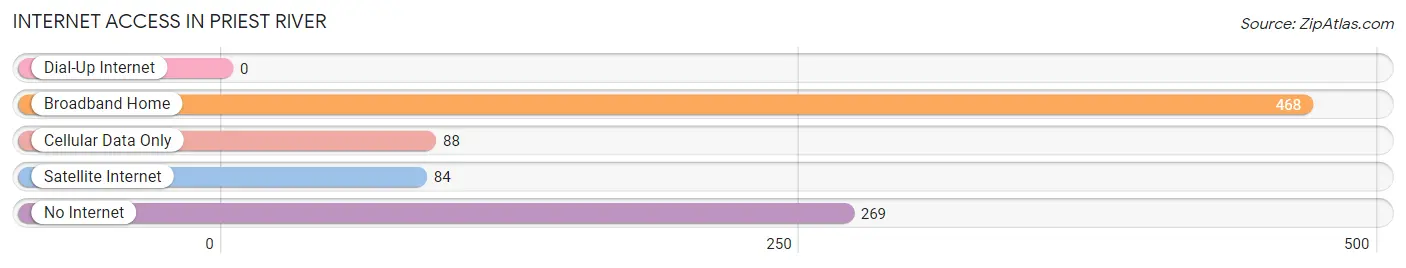
| Internet Type | # Households | % Households |
| Dial-Up Internet | 0 | 0.0% |
| Broadband Home | 468 | 53.2% |
| Cellular Data Only | 88 | 10.0% |
| Satellite Internet | 84 | 9.6% |
| No Internet | 269 | 30.6% |
| Total | 880 | 100.0% |
Priest River Summary
Priest River, Idaho is a small city located in the northern part of the state, in Bonner County. It is situated on the banks of the Priest River, which is a tributary of the Pend Oreille River. The city is located about 25 miles east of the Idaho-Montana border and about 30 miles north of the Idaho-Washington border. The city is part of the Coeur d'Alene metropolitan area and has a population of approximately 1,800 people.
History
The area that is now Priest River was originally inhabited by the Kalispel Tribe of Native Americans. The tribe had a fishing village at the mouth of the Priest River, which was known as "Kamloops". The first non-native settlers arrived in the area in the late 1800s, and the town of Priest River was officially established in 1891. The town was named after the Priest River, which was named after Father Pierre-Jean De Smet, a Jesuit missionary who visited the area in the 1840s.
The town quickly grew and became an important logging and lumbering center. The Priest River Lumber Company was established in 1895 and was the largest employer in the area for many years. The company operated a large sawmill and several logging camps in the area. The town also had a number of other businesses, including a hotel, a general store, a blacksmith shop, and a saloon.
Geography
Priest River is located in the northern part of Idaho, in Bonner County. It is situated on the banks of the Priest River, which is a tributary of the Pend Oreille River. The city is located about 25 miles east of the Idaho-Montana border and about 30 miles north of the Idaho-Washington border. The city is part of the Coeur d'Alene metropolitan area and has a population of approximately 1,800 people.
The city is located in a mountainous region, with the Selkirk Mountains to the east and the Cabinet Mountains to the west. The city is surrounded by forests and is home to several lakes, including Priest Lake, which is the largest lake in the area. The city is also home to several rivers, including the Priest River, which is the main river in the area.
Economy
The economy of Priest River is largely based on the timber industry. The city is home to several lumber mills, including the Priest River Lumber Company, which is the largest employer in the area. The company operates a large sawmill and several logging camps in the area. The city also has a number of other businesses, including a hotel, a general store, a blacksmith shop, and a saloon.
The city is also home to several recreational activities, including fishing, hunting, camping, and hiking. The area is also home to several ski resorts, including Schweitzer Mountain Resort, which is the largest ski resort in the state.
Demographics
As of the 2010 census, the population of Priest River was 1,788. The racial makeup of the city was 94.3% White, 0.3% African American, 0.7% Native American, 0.3% Asian, 0.1% Pacific Islander, 0.7% from other races, and 3.0% from two or more races. Hispanic or Latino of any race were 2.2% of the population.
The median income for a household in the city was $31,250, and the median income for a family was $37,500. The per capita income for the city was $17,845. About 15.3% of families and 18.2% of the population were below the poverty line, including 25.2% of those under age 18 and 8.3% of those age 65 or over.
Common Questions
What is Per Capita Income in Priest River?
Per Capita income in Priest River is $28,731.
What is the Median Family Income in Priest River?
Median Family Income in Priest River is $54,457.
What is the Median Household income in Priest River?
Median Household Income in Priest River is $49,868.
What is Income or Wage Gap in Priest River?
Income or Wage Gap in Priest River is 30.2%.
Women in Priest River earn 69.8 cents for every dollar earned by a man.
What is Inequality or Gini Index in Priest River?
Inequality or Gini Index in Priest River is 0.47.
What is the Total Population of Priest River?
Total Population of Priest River is 2,170.
What is the Total Male Population of Priest River?
Total Male Population of Priest River is 1,184.
What is the Total Female Population of Priest River?
Total Female Population of Priest River is 986.
What is the Ratio of Males per 100 Females in Priest River?
There are 120.08 Males per 100 Females in Priest River.
What is the Ratio of Females per 100 Males in Priest River?
There are 83.28 Females per 100 Males in Priest River.
What is the Median Population Age in Priest River?
Median Population Age in Priest River is 43.0 Years.
What is the Average Family Size in Priest River
Average Family Size in Priest River is 3.2 People.
What is the Average Household Size in Priest River
Average Household Size in Priest River is 2.5 People.
How Large is the Labor Force in Priest River?
There are 870 People in the Labor Forcein in Priest River.
What is the Percentage of People in the Labor Force in Priest River?
50.6% of People are in the Labor Force in Priest River.
What is the Unemployment Rate in Priest River?
Unemployment Rate in Priest River is 1.0%.