Grand View, ID Map & Demographics
Grand View Map
Grand View Overview
$24,263
PER CAPITA INCOME
$59,479
AVG FAMILY INCOME
$39,722
AVG HOUSEHOLD INCOME
12.5%
WAGE / INCOME GAP [ % ]
87.5¢/ $1
WAGE / INCOME GAP [ $ ]
0.40
INEQUALITY / GINI INDEX
485
TOTAL POPULATION
239
MALE POPULATION
246
FEMALE POPULATION
97.15
MALES / 100 FEMALES
102.93
FEMALES / 100 MALES
47.4
MEDIAN AGE
3.1
AVG FAMILY SIZE
2.3
AVG HOUSEHOLD SIZE
223
LABOR FORCE [ PEOPLE ]
57.0%
PERCENT IN LABOR FORCE
8.8%
UNEMPLOYMENT RATE
Grand View Zip Codes
Grand View Area Codes
Income in Grand View
Income Overview in Grand View
Per Capita Income in Grand View is $24,263, while median incomes of families and households are $59,479 and $39,722 respectively.
| Characteristic | Number | Measure |
| Per Capita Income | 485 | $24,263 |
| Median Family Income | 117 | $59,479 |
| Mean Family Income | 117 | $68,560 |
| Median Household Income | 206 | $39,722 |
| Mean Household Income | 206 | $56,698 |
| Income Deficit | 117 | $0 |
| Wage / Income Gap (%) | 485 | 12.53% |
| Wage / Income Gap ($) | 485 | 87.47¢ per $1 |
| Gini / Inequality Index | 485 | 0.40 |
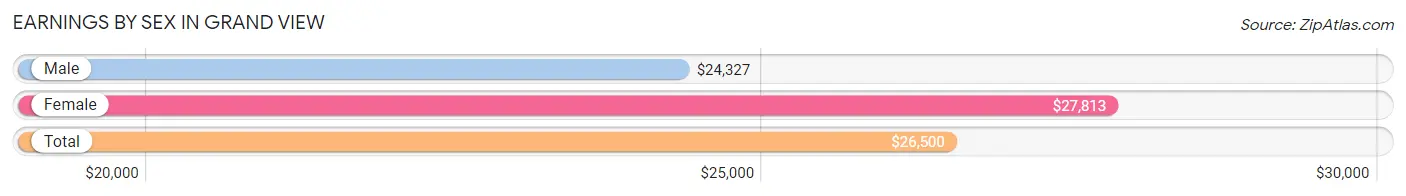
Earnings by Sex in Grand View
Average Earnings in Grand View are $26,500, $24,327 for men and $27,813 for women, a difference of 12.5%.
| Sex | Number | Average Earnings |
| Male | 121 (52.2%) | $24,327 |
| Female | 111 (47.8%) | $27,813 |
| Total | 232 (100.0%) | $26,500 |
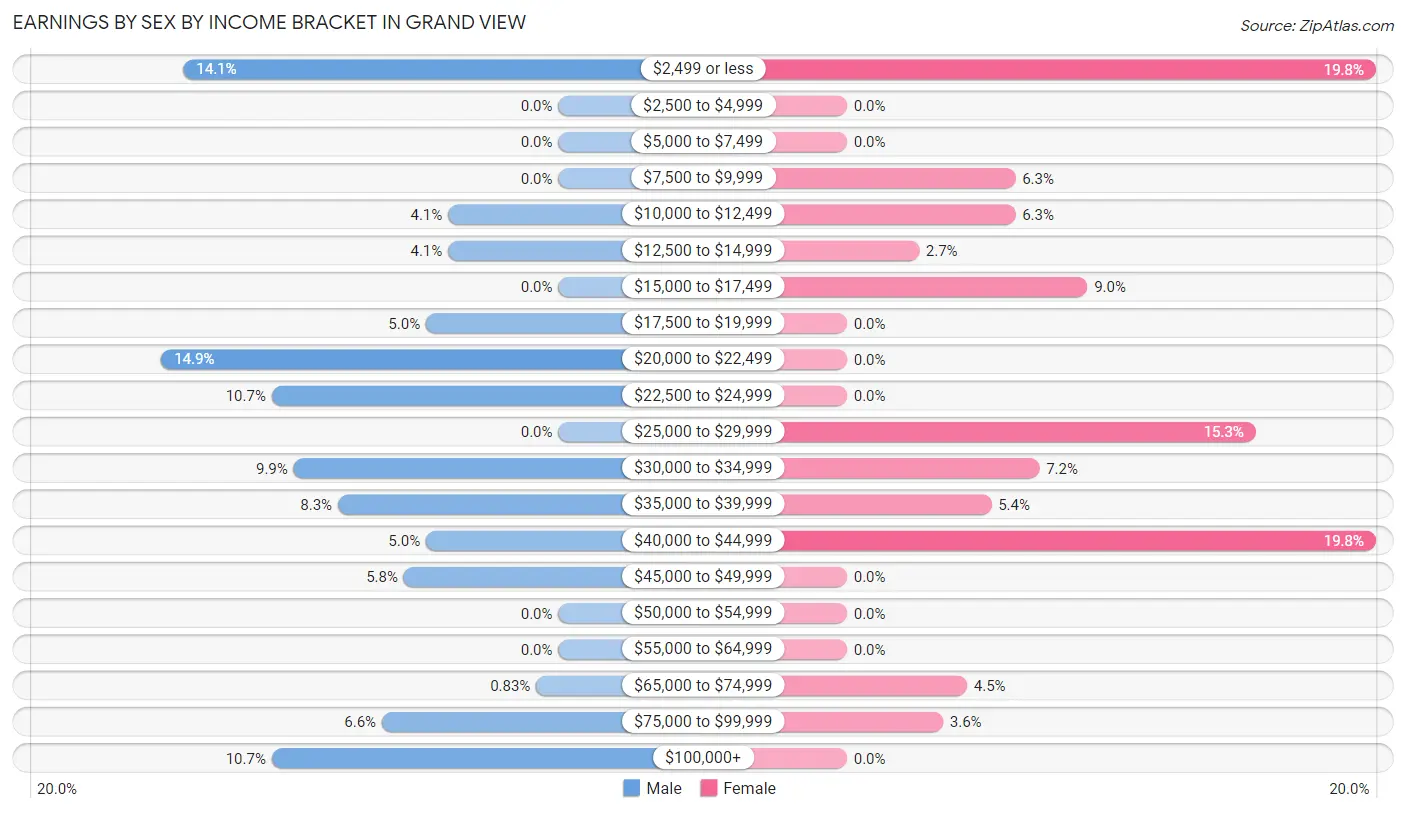
Earnings by Sex by Income Bracket in Grand View
The most common earnings brackets in Grand View are $20,000 to $22,499 for men (18 | 14.9%) and $2,499 or less for women (22 | 19.8%).
| Income | Male | Female |
| $2,499 or less | 17 (14.1%) | 22 (19.8%) |
| $2,500 to $4,999 | 0 (0.0%) | 0 (0.0%) |
| $5,000 to $7,499 | 0 (0.0%) | 0 (0.0%) |
| $7,500 to $9,999 | 0 (0.0%) | 7 (6.3%) |
| $10,000 to $12,499 | 5 (4.1%) | 7 (6.3%) |
| $12,500 to $14,999 | 5 (4.1%) | 3 (2.7%) |
| $15,000 to $17,499 | 0 (0.0%) | 10 (9.0%) |
| $17,500 to $19,999 | 6 (5.0%) | 0 (0.0%) |
| $20,000 to $22,499 | 18 (14.9%) | 0 (0.0%) |
| $22,500 to $24,999 | 13 (10.7%) | 0 (0.0%) |
| $25,000 to $29,999 | 0 (0.0%) | 17 (15.3%) |
| $30,000 to $34,999 | 12 (9.9%) | 8 (7.2%) |
| $35,000 to $39,999 | 10 (8.3%) | 6 (5.4%) |
| $40,000 to $44,999 | 6 (5.0%) | 22 (19.8%) |
| $45,000 to $49,999 | 7 (5.8%) | 0 (0.0%) |
| $50,000 to $54,999 | 0 (0.0%) | 0 (0.0%) |
| $55,000 to $64,999 | 0 (0.0%) | 0 (0.0%) |
| $65,000 to $74,999 | 1 (0.8%) | 5 (4.5%) |
| $75,000 to $99,999 | 8 (6.6%) | 4 (3.6%) |
| $100,000+ | 13 (10.7%) | 0 (0.0%) |
| Total | 121 (100.0%) | 111 (100.0%) |
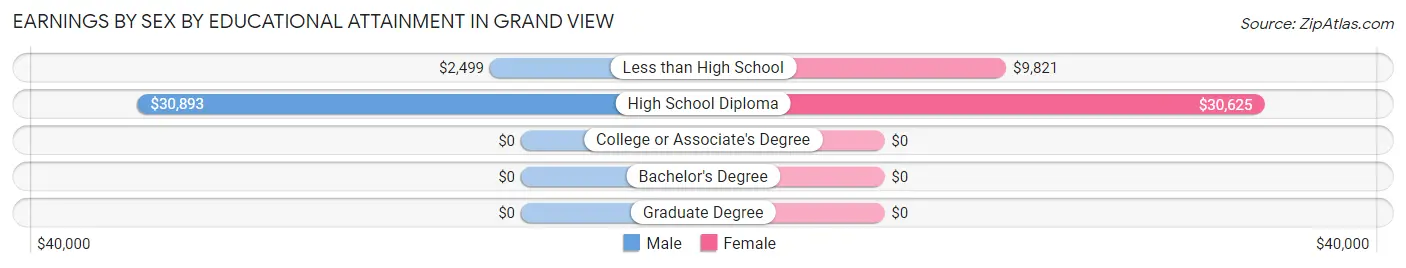
Earnings by Sex by Educational Attainment in Grand View
Average earnings in Grand View are $30,417 for men and $28,333 for women, a difference of 6.9%. Men with an educational attainment of high school diploma enjoy the highest average annual earnings of $30,893, while those with less than high school education earn the least with $2,499. Women with an educational attainment of high school diploma earn the most with the average annual earnings of $30,625, while those with less than high school education have the smallest earnings of $9,821.
| Educational Attainment | Male Income | Female Income |
| Less than High School | $2,499 | $9,821 |
| High School Diploma | $30,893 | $30,625 |
| College or Associate's Degree | - | - |
| Bachelor's Degree | - | - |
| Graduate Degree | - | - |
| Total | $30,417 | $28,333 |
Family Income in Grand View
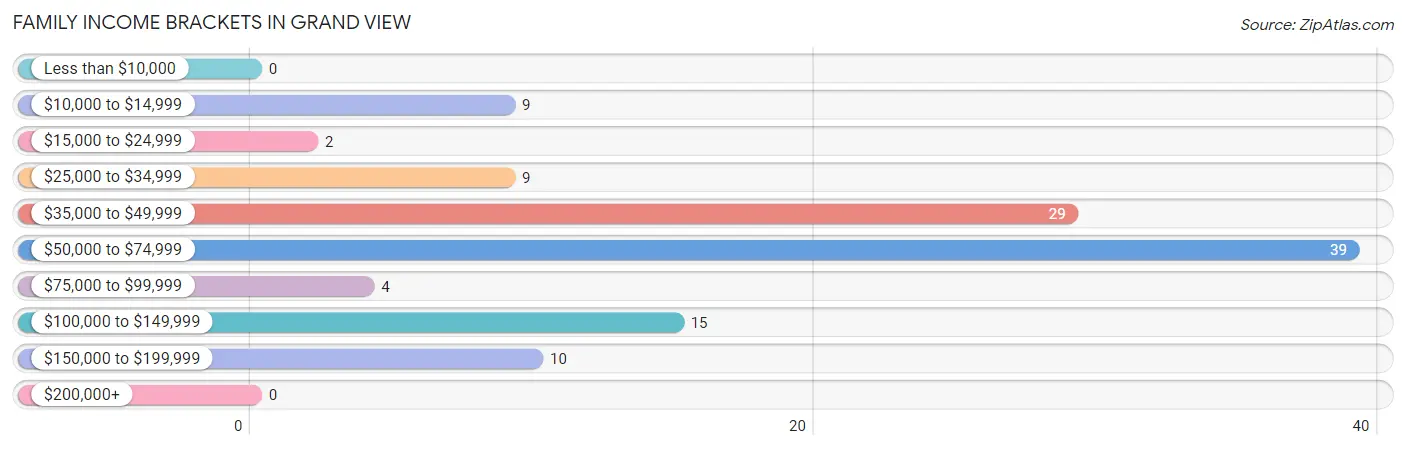
Family Income Brackets in Grand View
According to the Grand View family income data, there are 39 families falling into the $50,000 to $74,999 income range, which is the most common income bracket and makes up 33.3% of all families.
| Income Bracket | # Families | % Families |
| Less than $10,000 | 0 | 0.0% |
| $10,000 to $14,999 | 9 | 7.7% |
| $15,000 to $24,999 | 2 | 1.7% |
| $25,000 to $34,999 | 9 | 7.7% |
| $35,000 to $49,999 | 29 | 24.8% |
| $50,000 to $74,999 | 39 | 33.3% |
| $75,000 to $99,999 | 4 | 3.4% |
| $100,000 to $149,999 | 15 | 12.8% |
| $150,000 to $199,999 | 10 | 8.5% |
| $200,000+ | 0 | 0.0% |
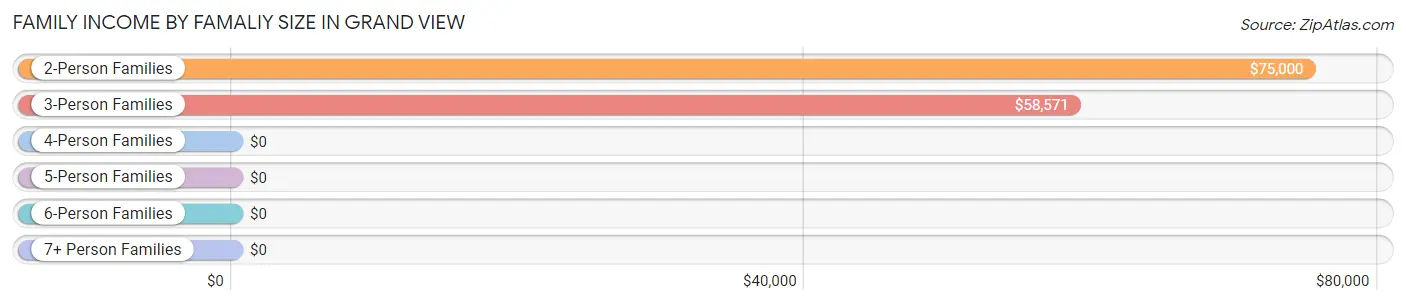
Family Income by Famaliy Size in Grand View
2-person families (46 | 39.3%) account for the highest median family income in Grand View with $75,000 per family, while 2-person families (46 | 39.3%) have the highest median income of $37,500 per family member.
| Income Bracket | # Families | Median Income |
| 2-Person Families | 46 (39.3%) | $75,000 |
| 3-Person Families | 44 (37.6%) | $58,571 |
| 4-Person Families | 11 (9.4%) | $0 |
| 5-Person Families | 11 (9.4%) | $0 |
| 6-Person Families | 5 (4.3%) | $0 |
| 7+ Person Families | 0 (0.0%) | $0 |
| Total | 117 (100.0%) | $59,479 |
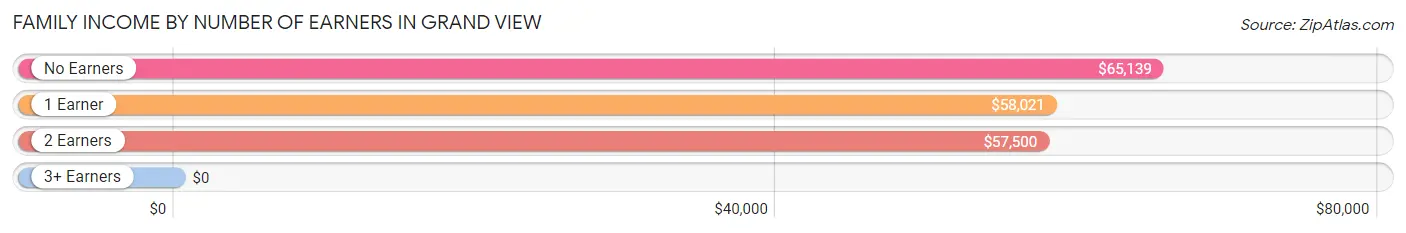
Family Income by Number of Earners in Grand View
| Number of Earners | # Families | Median Income |
| No Earners | 17 (14.5%) | $65,139 |
| 1 Earner | 47 (40.2%) | $58,021 |
| 2 Earners | 48 (41.0%) | $57,500 |
| 3+ Earners | 5 (4.3%) | $0 |
| Total | 117 (100.0%) | $59,479 |
Household Income in Grand View
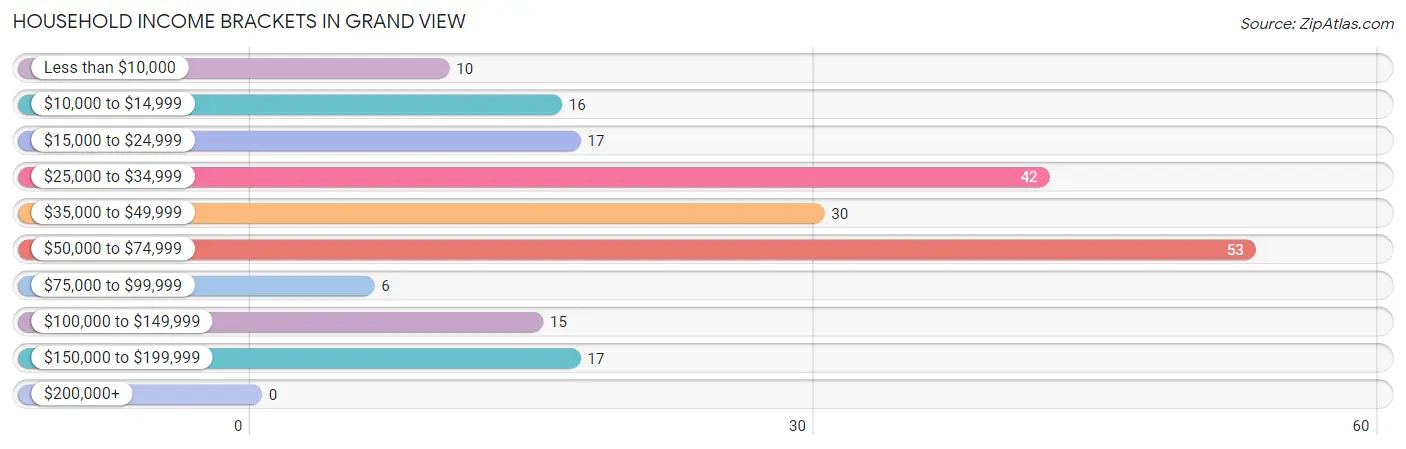
Household Income Brackets in Grand View
With 53 households falling in the category, the $50,000 to $74,999 income range is the most frequent in Grand View, accounting for 25.7% of all households.
| Income Bracket | # Households | % Households |
| Less than $10,000 | 10 | 4.9% |
| $10,000 to $14,999 | 16 | 7.8% |
| $15,000 to $24,999 | 17 | 8.3% |
| $25,000 to $34,999 | 42 | 20.4% |
| $35,000 to $49,999 | 30 | 14.6% |
| $50,000 to $74,999 | 53 | 25.7% |
| $75,000 to $99,999 | 6 | 2.9% |
| $100,000 to $149,999 | 15 | 7.3% |
| $150,000 to $199,999 | 17 | 8.3% |
| $200,000+ | 0 | 0.0% |
Household Income by Householder Age in Grand View
The median household income in Grand View is $39,722, with the highest median household income of $48,958 found in the 45 to 64 years age bracket for the primary householder. A total of 95 households (46.1%) fall into this category. Meanwhile, the 15 to 24 years age bracket for the primary householder has the lowest median household income of $0, with 7 households (3.4%) in this group.
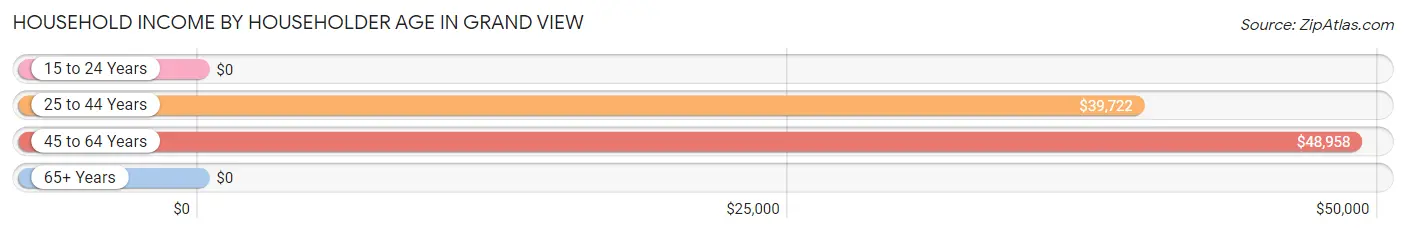
| Income Bracket | # Households | Median Income |
| 15 to 24 Years | 7 (3.4%) | $0 |
| 25 to 44 Years | 40 (19.4%) | $39,722 |
| 45 to 64 Years | 95 (46.1%) | $48,958 |
| 65+ Years | 64 (31.1%) | $0 |
| Total | 206 (100.0%) | $39,722 |
Poverty in Grand View
Income Below Poverty by Sex and Age in Grand View
With 13.6% poverty level for males and 16.7% for females among the residents of Grand View, 55 to 64 year old males and 16 and 17 year old females are the most vulnerable to poverty, with 9 males (31.0%) and 6 females (100.0%) in their respective age groups living below the poverty level.
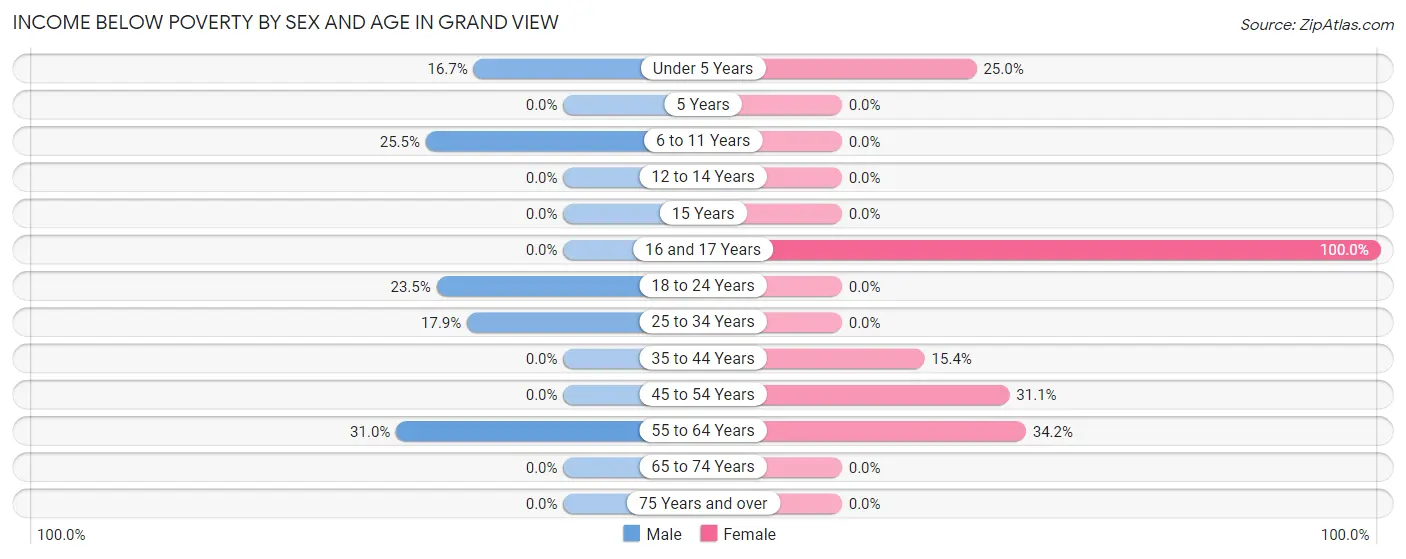
| Age Bracket | Male | Female |
| Under 5 Years | 2 (16.7%) | 3 (25.0%) |
| 5 Years | 0 (0.0%) | 0 (0.0%) |
| 6 to 11 Years | 12 (25.5%) | 0 (0.0%) |
| 12 to 14 Years | 0 (0.0%) | 0 (0.0%) |
| 15 Years | 0 (0.0%) | 0 (0.0%) |
| 16 and 17 Years | 0 (0.0%) | 6 (100.0%) |
| 18 to 24 Years | 4 (23.5%) | 0 (0.0%) |
| 25 to 34 Years | 5 (17.9%) | 0 (0.0%) |
| 35 to 44 Years | 0 (0.0%) | 4 (15.4%) |
| 45 to 54 Years | 0 (0.0%) | 14 (31.1%) |
| 55 to 64 Years | 9 (31.0%) | 14 (34.2%) |
| 65 to 74 Years | 0 (0.0%) | 0 (0.0%) |
| 75 Years and over | 0 (0.0%) | 0 (0.0%) |
| Total | 32 (13.6%) | 41 (16.7%) |
Income Above Poverty by Sex and Age in Grand View
According to the poverty statistics in Grand View, males aged 12 to 14 years and females aged 12 to 14 years are the age groups that are most secure financially, with 100.0% of males and 100.0% of females in these age groups living above the poverty line.
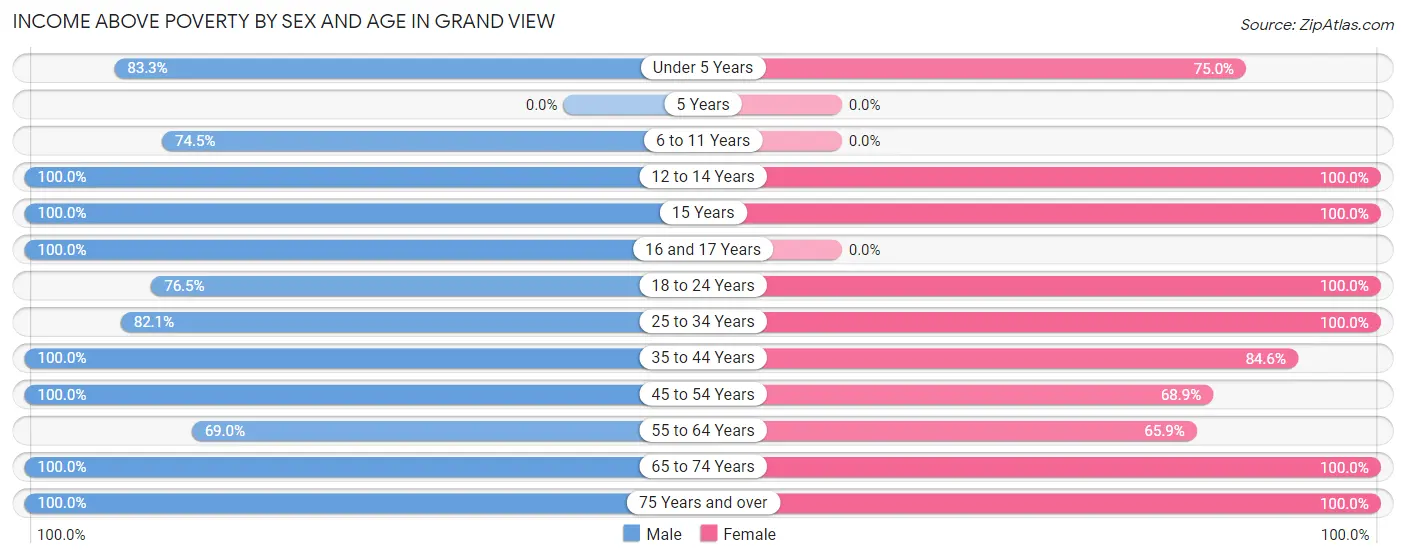
| Age Bracket | Male | Female |
| Under 5 Years | 10 (83.3%) | 9 (75.0%) |
| 5 Years | 0 (0.0%) | 0 (0.0%) |
| 6 to 11 Years | 35 (74.5%) | 0 (0.0%) |
| 12 to 14 Years | 4 (100.0%) | 11 (100.0%) |
| 15 Years | 4 (100.0%) | 4 (100.0%) |
| 16 and 17 Years | 4 (100.0%) | 0 (0.0%) |
| 18 to 24 Years | 13 (76.5%) | 13 (100.0%) |
| 25 to 34 Years | 23 (82.1%) | 21 (100.0%) |
| 35 to 44 Years | 26 (100.0%) | 22 (84.6%) |
| 45 to 54 Years | 21 (100.0%) | 31 (68.9%) |
| 55 to 64 Years | 20 (69.0%) | 27 (65.8%) |
| 65 to 74 Years | 33 (100.0%) | 46 (100.0%) |
| 75 Years and over | 10 (100.0%) | 21 (100.0%) |
| Total | 203 (86.4%) | 205 (83.3%) |
Income Below Poverty Among Married-Couple Families in Grand View
The poverty statistics for married-couple families in Grand View show that 15.0% or 14 of the total 93 families live below the poverty line. Families with 1 or 2 children have the highest poverty rate of 45.0%, comprising of 9 families. On the other hand, families with no children have the lowest poverty rate of 0.0%, which includes 0 families.
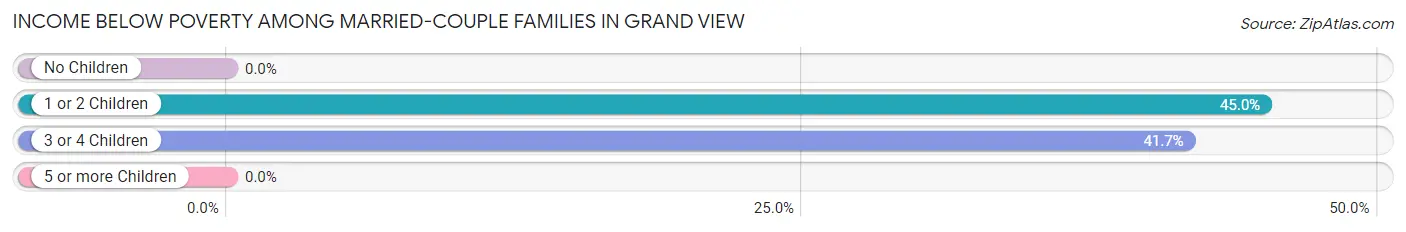
| Children | Above Poverty | Below Poverty |
| No Children | 61 (100.0%) | 0 (0.0%) |
| 1 or 2 Children | 11 (55.0%) | 9 (45.0%) |
| 3 or 4 Children | 7 (58.3%) | 5 (41.7%) |
| 5 or more Children | 0 (0.0%) | 0 (0.0%) |
| Total | 79 (85.0%) | 14 (15.0%) |
Income Below Poverty Among Single-Parent Households in Grand View
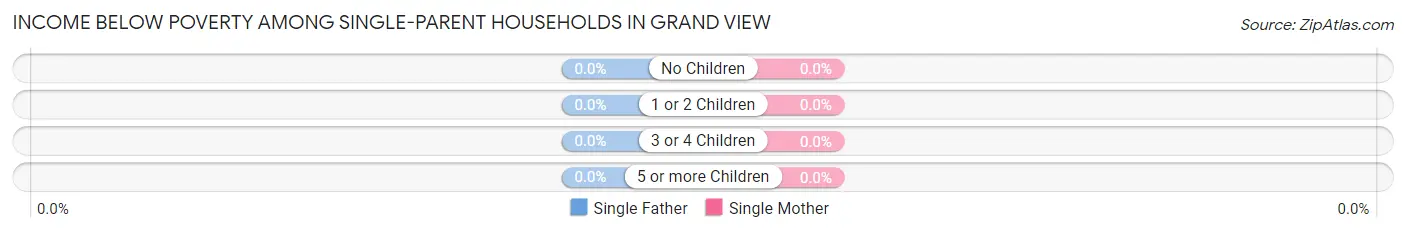
| Children | Single Father | Single Mother |
| No Children | 0 (0.0%) | 0 (0.0%) |
| 1 or 2 Children | 0 (0.0%) | 0 (0.0%) |
| 3 or 4 Children | 0 (0.0%) | 0 (0.0%) |
| 5 or more Children | 0 (0.0%) | 0 (0.0%) |
| Total | 0 (0.0%) | 0 (0.0%) |
Income Below Poverty Among Married-Couple vs Single-Parent Households in Grand View
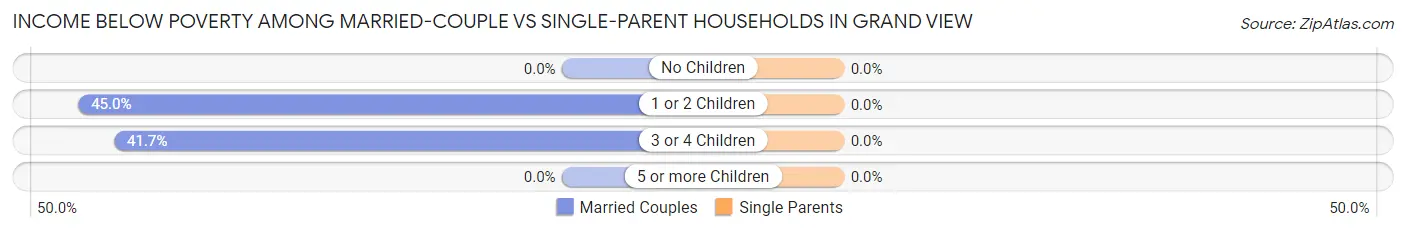
| Children | Married-Couple Families | Single-Parent Households |
| No Children | 0 (0.0%) | 0 (0.0%) |
| 1 or 2 Children | 9 (45.0%) | 0 (0.0%) |
| 3 or 4 Children | 5 (41.7%) | 0 (0.0%) |
| 5 or more Children | 0 (0.0%) | 0 (0.0%) |
| Total | 14 (15.0%) | 0 (0.0%) |
Race in Grand View
The most populous races in Grand View are White / Caucasian (375 | 77.3%), Hispanic or Latino (111 | 22.9%), and Two or more Races (71 | 14.6%).
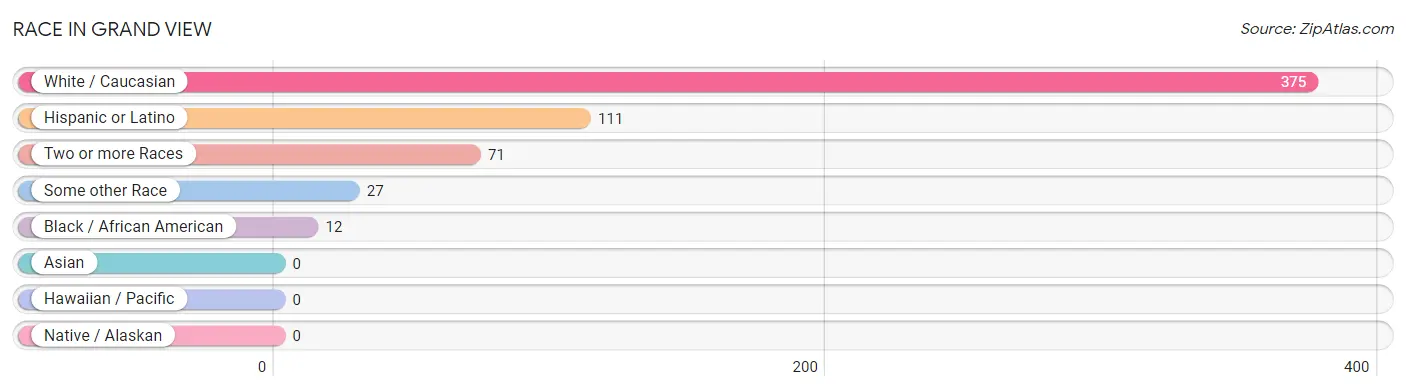
| Race | # Population | % Population |
| Asian | 0 | 0.0% |
| Black / African American | 12 | 2.5% |
| Hawaiian / Pacific | 0 | 0.0% |
| Hispanic or Latino | 111 | 22.9% |
| Native / Alaskan | 0 | 0.0% |
| White / Caucasian | 375 | 77.3% |
| Two or more Races | 71 | 14.6% |
| Some other Race | 27 | 5.6% |
| Total | 485 | 100.0% |
Ancestry in Grand View
The most populous ancestries reported in Grand View are German (118 | 24.3%), Mexican (106 | 21.9%), English (67 | 13.8%), British (43 | 8.9%), and Danish (24 | 5.0%), together accounting for 73.8% of all Grand View residents.
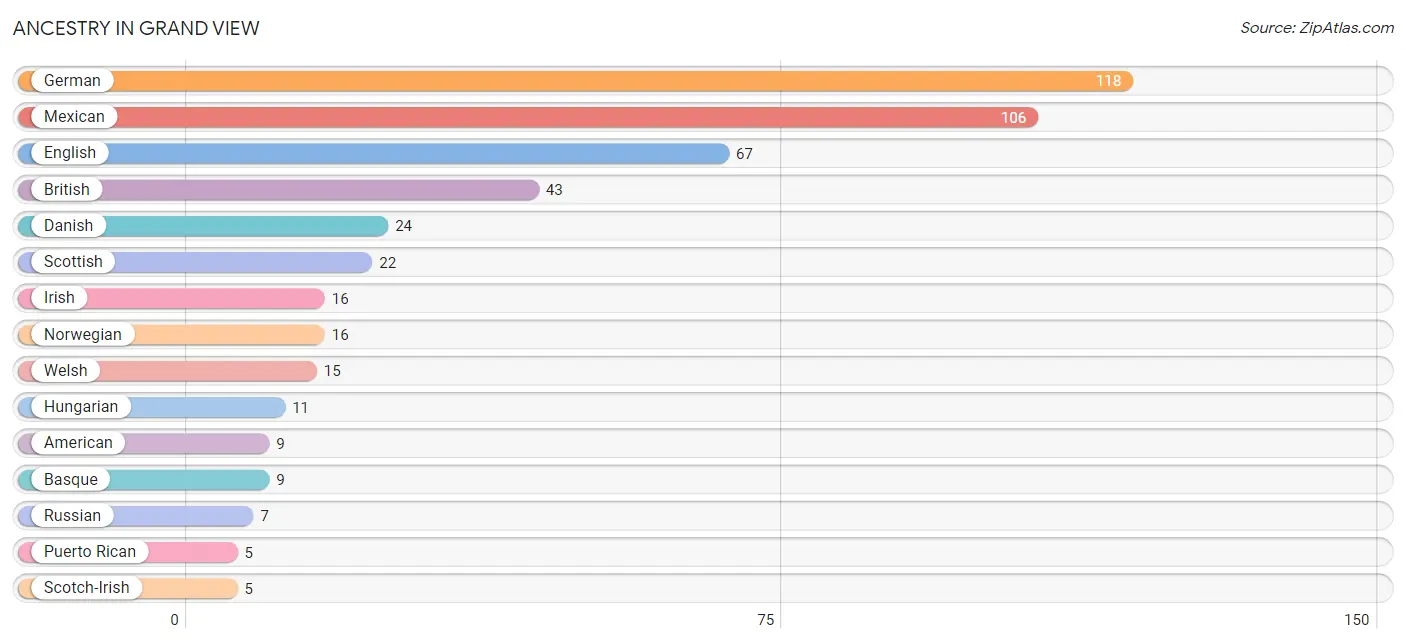
| Ancestry | # Population | % Population |
| American | 9 | 1.9% |
| Basque | 9 | 1.9% |
| British | 43 | 8.9% |
| Danish | 24 | 5.0% |
| Dutch | 1 | 0.2% |
| English | 67 | 13.8% |
| German | 118 | 24.3% |
| Hungarian | 11 | 2.3% |
| Irish | 16 | 3.3% |
| Mexican | 106 | 21.9% |
| Norwegian | 16 | 3.3% |
| Puerto Rican | 5 | 1.0% |
| Russian | 7 | 1.4% |
| Scotch-Irish | 5 | 1.0% |
| Scottish | 22 | 4.5% |
| Swedish | 5 | 1.0% |
| Welsh | 15 | 3.1% | View All 17 Rows |
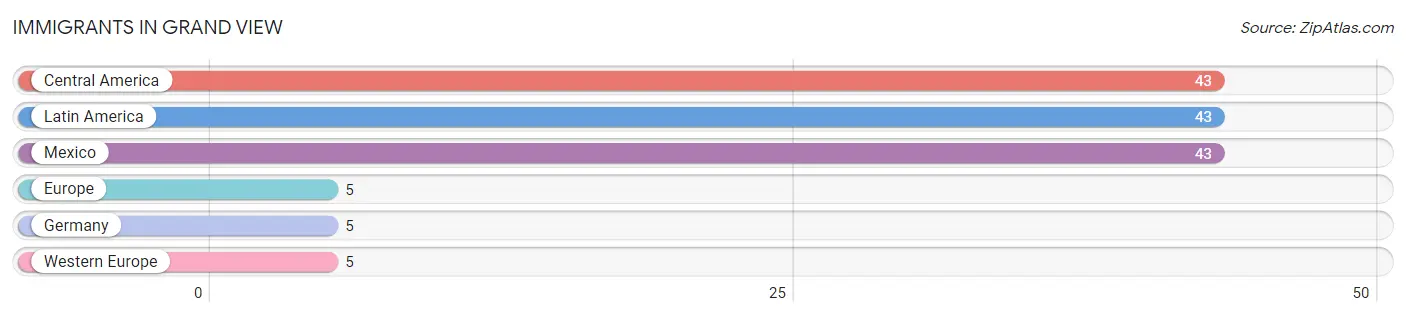
Immigrants in Grand View
The most numerous immigrant groups reported in Grand View came from Central America (43 | 8.9%), Latin America (43 | 8.9%), Mexico (43 | 8.9%), Europe (5 | 1.0%), and Germany (5 | 1.0%), together accounting for 28.7% of all Grand View residents.
| Immigration Origin | # Population | % Population |
| Central America | 43 | 8.9% |
| Europe | 5 | 1.0% |
| Germany | 5 | 1.0% |
| Latin America | 43 | 8.9% |
| Mexico | 43 | 8.9% |
| Western Europe | 5 | 1.0% | View All 6 Rows |
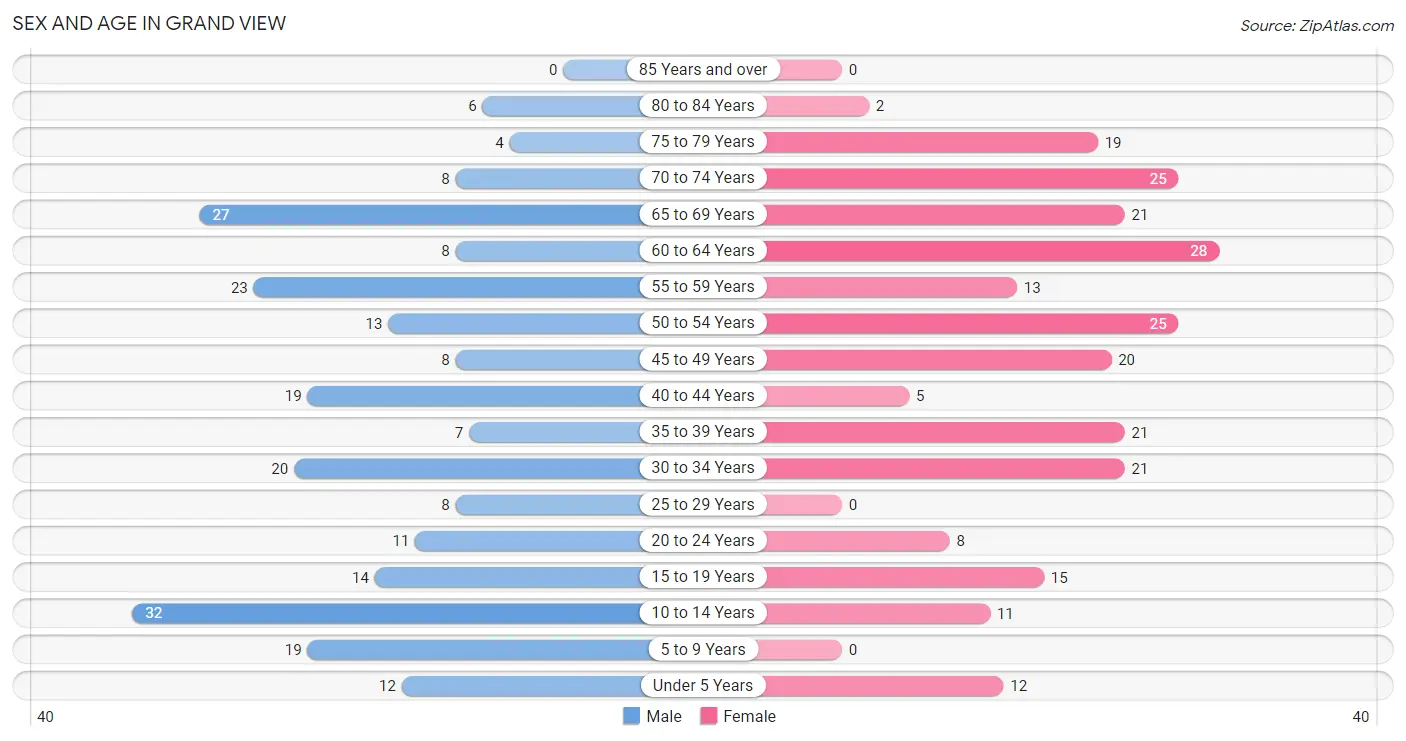
Sex and Age in Grand View
Sex and Age in Grand View
The most populous age groups in Grand View are 10 to 14 Years (32 | 13.4%) for men and 60 to 64 Years (28 | 11.4%) for women.
| Age Bracket | Male | Female |
| Under 5 Years | 12 (5.0%) | 12 (4.9%) |
| 5 to 9 Years | 19 (8.0%) | 0 (0.0%) |
| 10 to 14 Years | 32 (13.4%) | 11 (4.5%) |
| 15 to 19 Years | 14 (5.9%) | 15 (6.1%) |
| 20 to 24 Years | 11 (4.6%) | 8 (3.3%) |
| 25 to 29 Years | 8 (3.4%) | 0 (0.0%) |
| 30 to 34 Years | 20 (8.4%) | 21 (8.5%) |
| 35 to 39 Years | 7 (2.9%) | 21 (8.5%) |
| 40 to 44 Years | 19 (8.0%) | 5 (2.0%) |
| 45 to 49 Years | 8 (3.4%) | 20 (8.1%) |
| 50 to 54 Years | 13 (5.4%) | 25 (10.2%) |
| 55 to 59 Years | 23 (9.6%) | 13 (5.3%) |
| 60 to 64 Years | 8 (3.4%) | 28 (11.4%) |
| 65 to 69 Years | 27 (11.3%) | 21 (8.5%) |
| 70 to 74 Years | 8 (3.4%) | 25 (10.2%) |
| 75 to 79 Years | 4 (1.7%) | 19 (7.7%) |
| 80 to 84 Years | 6 (2.5%) | 2 (0.8%) |
| 85 Years and over | 0 (0.0%) | 0 (0.0%) |
| Total | 239 (100.0%) | 246 (100.0%) |
Families and Households in Grand View
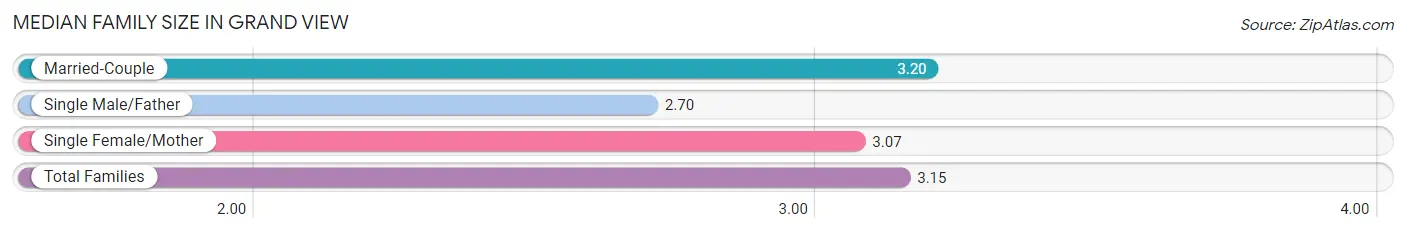
Median Family Size in Grand View
The median family size in Grand View is 3.15 persons per family, with married-couple families (93 | 79.5%) accounting for the largest median family size of 3.2 persons per family. On the other hand, single male/father families (10 | 8.6%) represent the smallest median family size with 2.70 persons per family.
| Family Type | # Families | Family Size |
| Married-Couple | 93 (79.5%) | 3.20 |
| Single Male/Father | 10 (8.6%) | 2.70 |
| Single Female/Mother | 14 (12.0%) | 3.07 |
| Total Families | 117 (100.0%) | 3.15 |
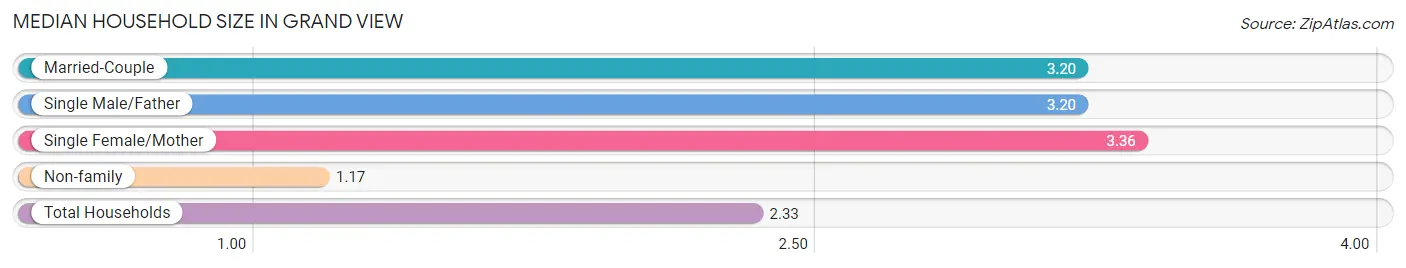
Median Household Size in Grand View
The median household size in Grand View is 2.33 persons per household, with single female/mother households (14 | 6.8%) accounting for the largest median household size of 3.36 persons per household. non-family households (89 | 43.2%) represent the smallest median household size with 1.17 persons per household.
| Household Type | # Households | Household Size |
| Married-Couple | 93 (45.2%) | 3.20 |
| Single Male/Father | 10 (4.9%) | 3.20 |
| Single Female/Mother | 14 (6.8%) | 3.36 |
| Non-family | 89 (43.2%) | 1.17 |
| Total Households | 206 (100.0%) | 2.33 |
Household Size by Marriage Status in Grand View
Out of a total of 206 households in Grand View, 117 (56.8%) are family households, while 89 (43.2%) are nonfamily households. The most numerous type of family households are 2-person households, comprising 46, and the most common type of nonfamily households are 1-person households, comprising 82.
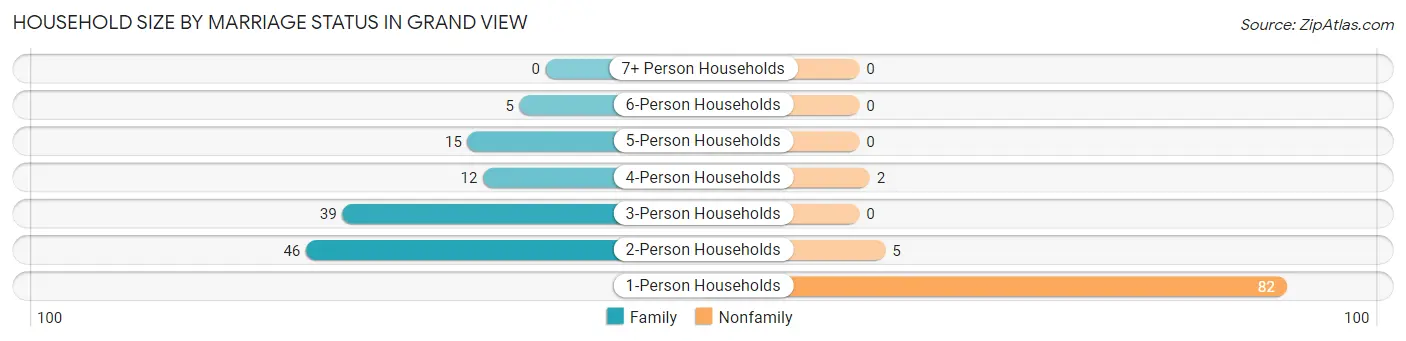
| Household Size | Family Households | Nonfamily Households |
| 1-Person Households | - | 82 (39.8%) |
| 2-Person Households | 46 (22.3%) | 5 (2.4%) |
| 3-Person Households | 39 (18.9%) | 0 (0.0%) |
| 4-Person Households | 12 (5.8%) | 2 (1.0%) |
| 5-Person Households | 15 (7.3%) | 0 (0.0%) |
| 6-Person Households | 5 (2.4%) | 0 (0.0%) |
| 7+ Person Households | 0 (0.0%) | 0 (0.0%) |
| Total | 117 (56.8%) | 89 (43.2%) |
Female Fertility in Grand View
Fertility by Age in Grand View
Average fertility rate in Grand View is 33.0 births per 1,000 women. Women in the age bracket of 20 to 34 years have the highest fertility rate with 103.0 births per 1,000 women. Women in the age bracket of 20 to 34 years acount for 100.0% of all women with births.
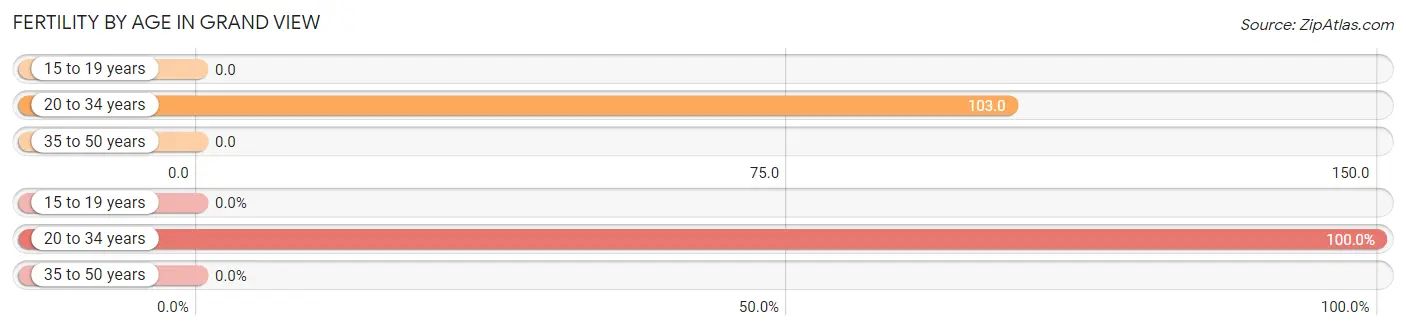
| Age Bracket | Women with Births | Births / 1,000 Women |
| 15 to 19 years | 0 (0.0%) | 0.0 |
| 20 to 34 years | 3 (100.0%) | 103.0 |
| 35 to 50 years | 0 (0.0%) | 0.0 |
| Total | 3 (100.0%) | 33.0 |
Fertility by Age by Marriage Status in Grand View
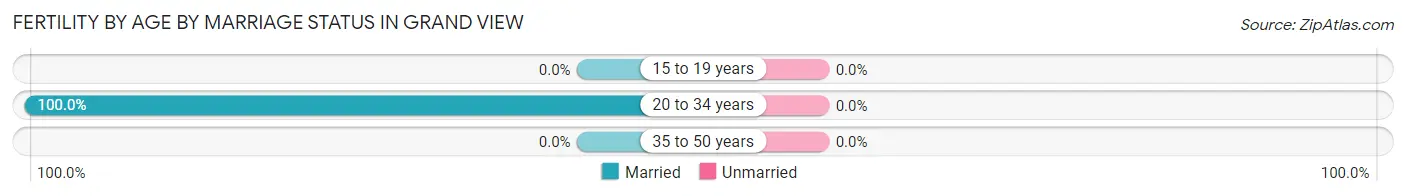
| Age Bracket | Married | Unmarried |
| 15 to 19 years | 0 (0.0%) | 0 (0.0%) |
| 20 to 34 years | 3 (100.0%) | 0 (0.0%) |
| 35 to 50 years | 0 (0.0%) | 0 (0.0%) |
| Total | 3 (100.0%) | 0 (0.0%) |
Fertility by Education in Grand View
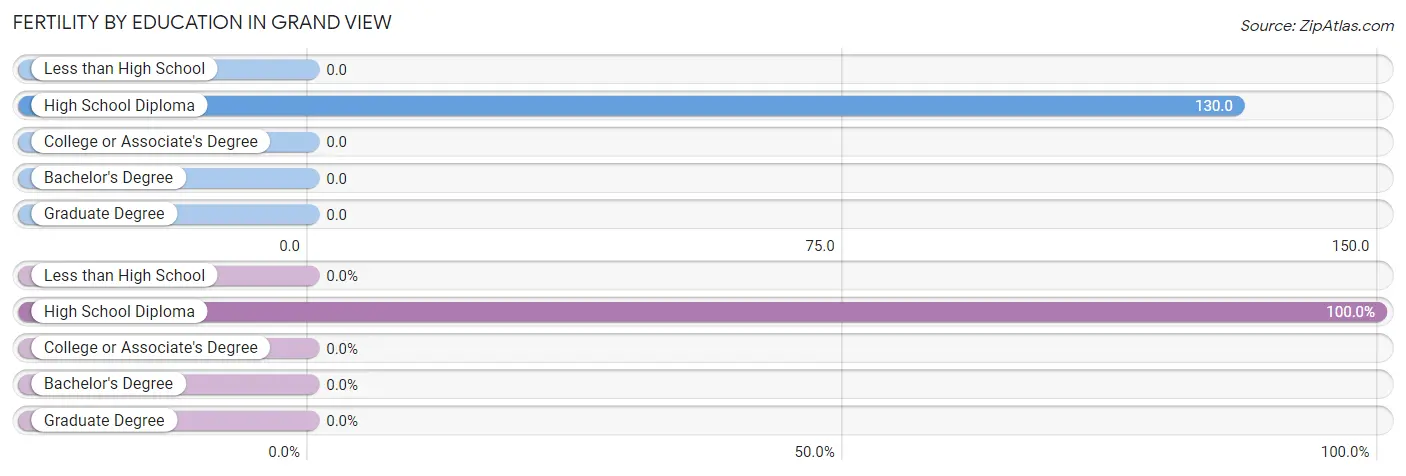
| Educational Attainment | Women with Births | Births / 1,000 Women |
| Less than High School | 0 (0.0%) | 0.0 |
| High School Diploma | 3 (100.0%) | 130.0 |
| College or Associate's Degree | 0 (0.0%) | 0.0 |
| Bachelor's Degree | 0 (0.0%) | 0.0 |
| Graduate Degree | 0 (0.0%) | 0.0 |
| Total | 3 (100.0%) | 33.0 |
Fertility by Education by Marriage Status in Grand View
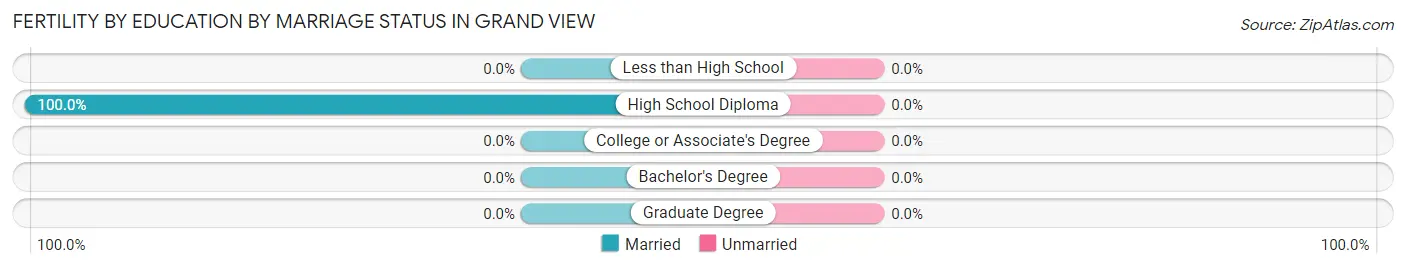
| Educational Attainment | Married | Unmarried |
| Less than High School | 0 (0.0%) | 0 (0.0%) |
| High School Diploma | 3 (100.0%) | 0 (0.0%) |
| College or Associate's Degree | 0 (0.0%) | 0 (0.0%) |
| Bachelor's Degree | 0 (0.0%) | 0 (0.0%) |
| Graduate Degree | 0 (0.0%) | 0 (0.0%) |
| Total | 3 (100.0%) | 0 (0.0%) |
Employment Characteristics in Grand View
Employment by Class of Employer in Grand View
Among the 204 employed individuals in Grand View, private company employees (135 | 66.2%), local government employees (29 | 14.2%), and unpaid family workers (16 | 7.8%) make up the most common classes of employment.
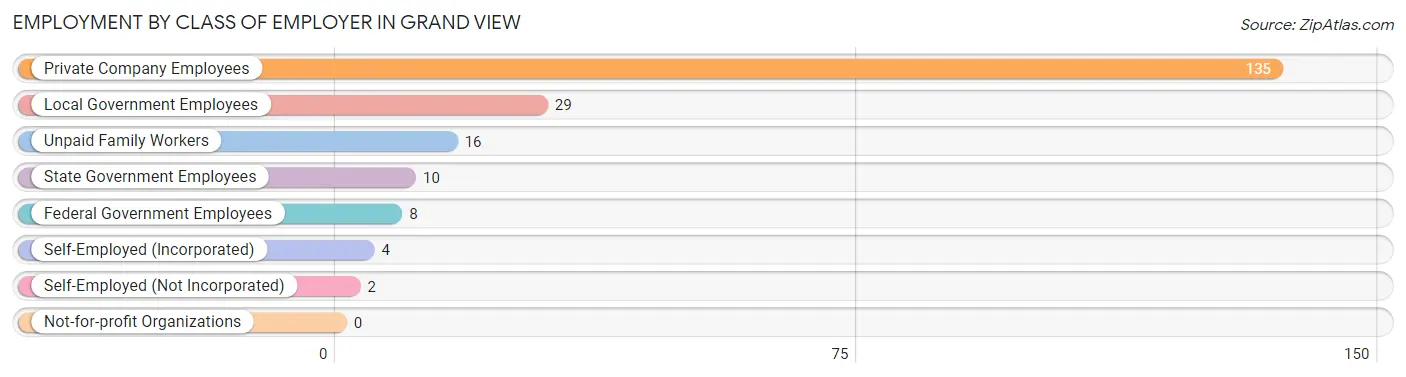
| Employer Class | # Employees | % Employees |
| Private Company Employees | 135 | 66.2% |
| Self-Employed (Incorporated) | 4 | 2.0% |
| Self-Employed (Not Incorporated) | 2 | 1.0% |
| Not-for-profit Organizations | 0 | 0.0% |
| Local Government Employees | 29 | 14.2% |
| State Government Employees | 10 | 4.9% |
| Federal Government Employees | 8 | 3.9% |
| Unpaid Family Workers | 16 | 7.8% |
| Total | 204 | 100.0% |
Employment Status by Age in Grand View
According to the labor force statistics for Grand View, out of the total population over 16 years of age (391), 57.0% or 223 individuals are in the labor force, with 8.8% or 20 of them unemployed. The age group with the highest labor force participation rate is 25 to 29 years, with 100.0% or 8 individuals in the labor force. Within the labor force, the 55 to 59 years age range has the highest percentage of unemployed individuals, with 18.8% or 6 of them being unemployed.
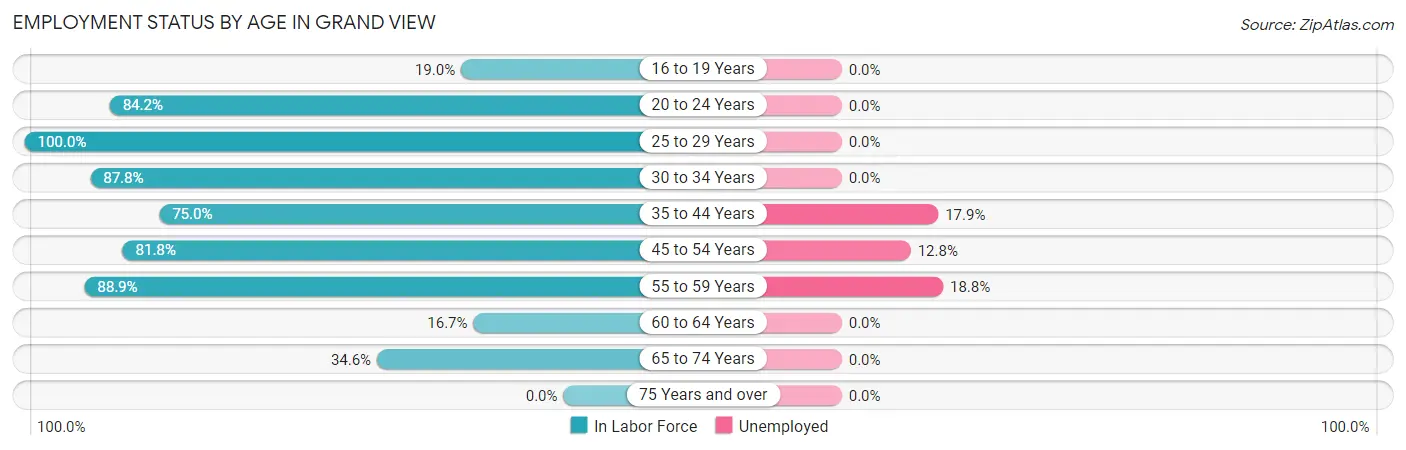
| Age Bracket | In Labor Force | Unemployed |
| 16 to 19 Years | 4 (19.0%) | 0 (0.0%) |
| 20 to 24 Years | 16 (84.2%) | 0 (0.0%) |
| 25 to 29 Years | 8 (100.0%) | 0 (0.0%) |
| 30 to 34 Years | 36 (87.8%) | 0 (0.0%) |
| 35 to 44 Years | 39 (75.0%) | 7 (17.9%) |
| 45 to 54 Years | 54 (81.8%) | 7 (12.8%) |
| 55 to 59 Years | 32 (88.9%) | 6 (18.8%) |
| 60 to 64 Years | 6 (16.7%) | 0 (0.0%) |
| 65 to 74 Years | 28 (34.6%) | 0 (0.0%) |
| 75 Years and over | 0 (0.0%) | 0 (0.0%) |
| Total | 223 (57.0%) | 20 (8.8%) |
Employment Status by Educational Attainment in Grand View
According to labor force statistics for Grand View, 73.2% of individuals (175) out of the total population between 25 and 64 years of age (239) are in the labor force, with 11.3% or 20 of them being unemployed. The group with the highest labor force participation rate are those with the educational attainment of bachelor's degree or higher, with 100.0% or 14 individuals in the labor force. Within the labor force, individuals with high school diploma education have the highest percentage of unemployment, with 20.6% or 13 of them being unemployed.
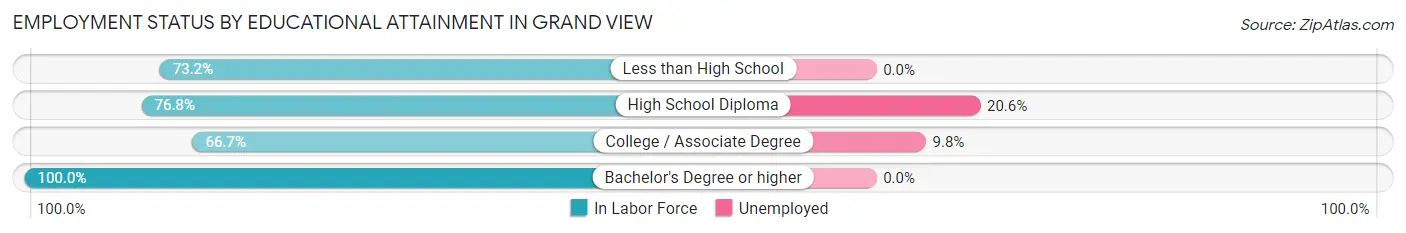
| Educational Attainment | In Labor Force | Unemployed |
| Less than High School | 30 (73.2%) | 0 (0.0%) |
| High School Diploma | 63 (76.8%) | 17 (20.6%) |
| College / Associate Degree | 68 (66.7%) | 10 (9.8%) |
| Bachelor's Degree or higher | 14 (100.0%) | 0 (0.0%) |
| Total | 175 (73.2%) | 27 (11.3%) |
Employment Occupations by Sex in Grand View
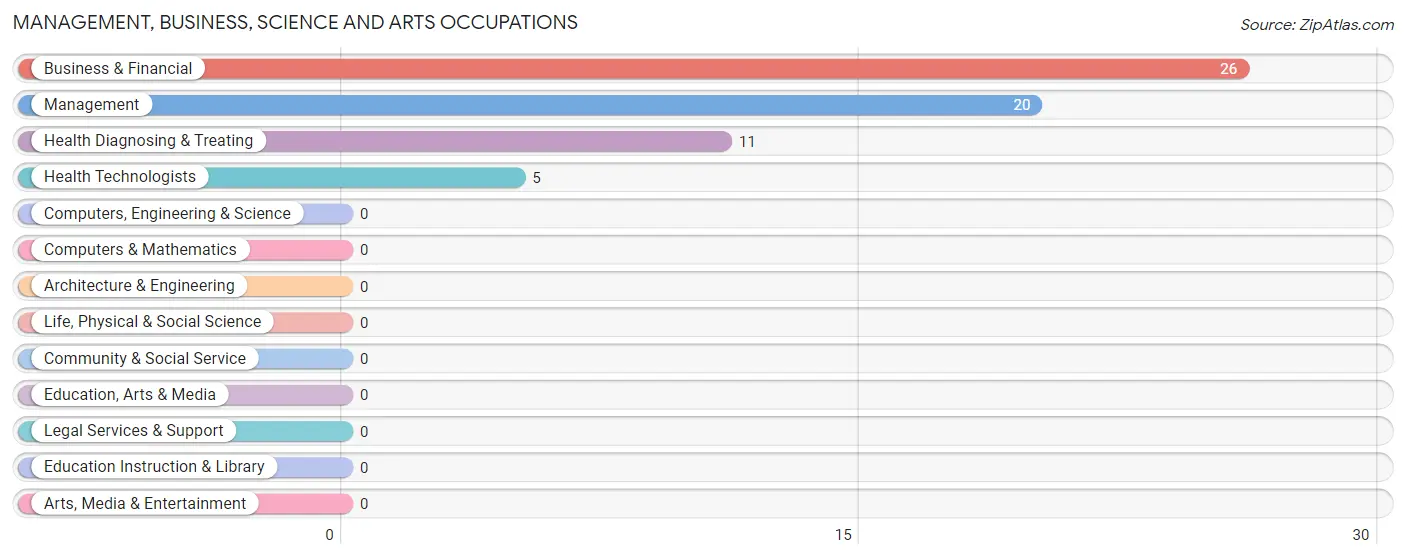
Management, Business, Science and Arts Occupations
The most common Management, Business, Science and Arts occupations in Grand View are Business & Financial (26 | 13.2%), Management (20 | 10.2%), Health Diagnosing & Treating (11 | 5.6%), and Health Technologists (5 | 2.5%).
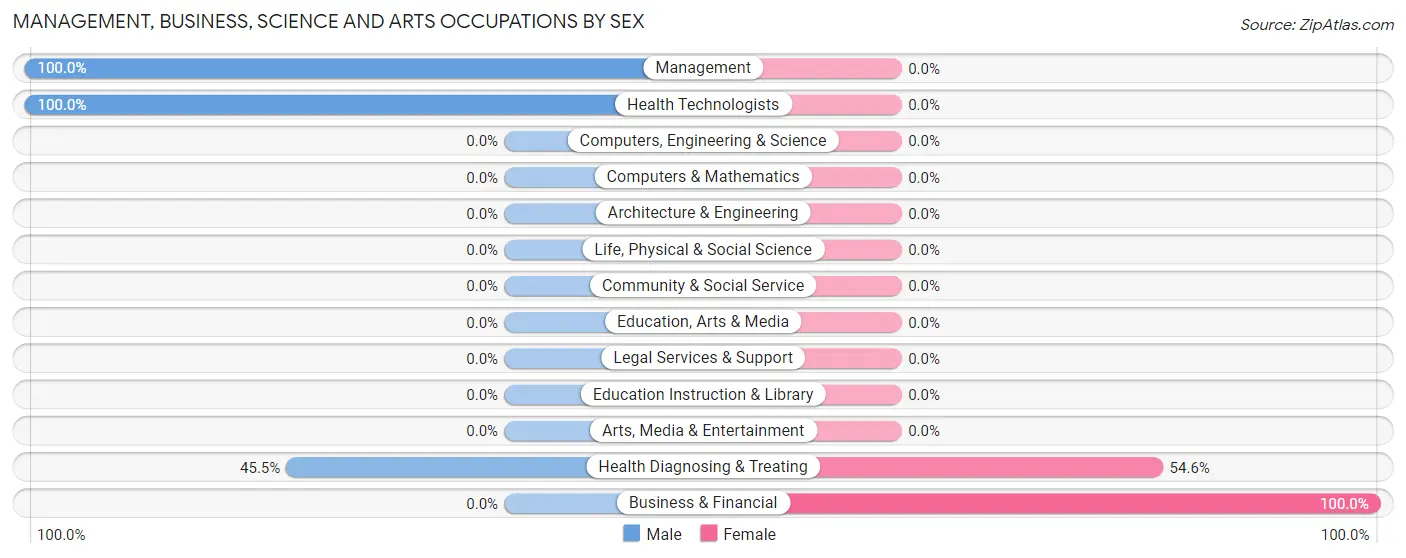
Management, Business, Science and Arts Occupations by Sex
Within the Management, Business, Science and Arts occupations in Grand View, the most male-oriented occupations are Management (100.0%), Health Technologists (100.0%), and Health Diagnosing & Treating (45.5%), while the most female-oriented occupations are Business & Financial (100.0%), and Health Diagnosing & Treating (54.5%).
| Occupation | Male | Female |
| Management | 20 (100.0%) | 0 (0.0%) |
| Business & Financial | 0 (0.0%) | 26 (100.0%) |
| Computers, Engineering & Science | 0 (0.0%) | 0 (0.0%) |
| Computers & Mathematics | 0 (0.0%) | 0 (0.0%) |
| Architecture & Engineering | 0 (0.0%) | 0 (0.0%) |
| Life, Physical & Social Science | 0 (0.0%) | 0 (0.0%) |
| Community & Social Service | 0 (0.0%) | 0 (0.0%) |
| Education, Arts & Media | 0 (0.0%) | 0 (0.0%) |
| Legal Services & Support | 0 (0.0%) | 0 (0.0%) |
| Education Instruction & Library | 0 (0.0%) | 0 (0.0%) |
| Arts, Media & Entertainment | 0 (0.0%) | 0 (0.0%) |
| Health Diagnosing & Treating | 5 (45.5%) | 6 (54.5%) |
| Health Technologists | 5 (100.0%) | 0 (0.0%) |
| Total (Category) | 25 (43.9%) | 32 (56.1%) |
| Total (Overall) | 96 (48.7%) | 101 (51.3%) |
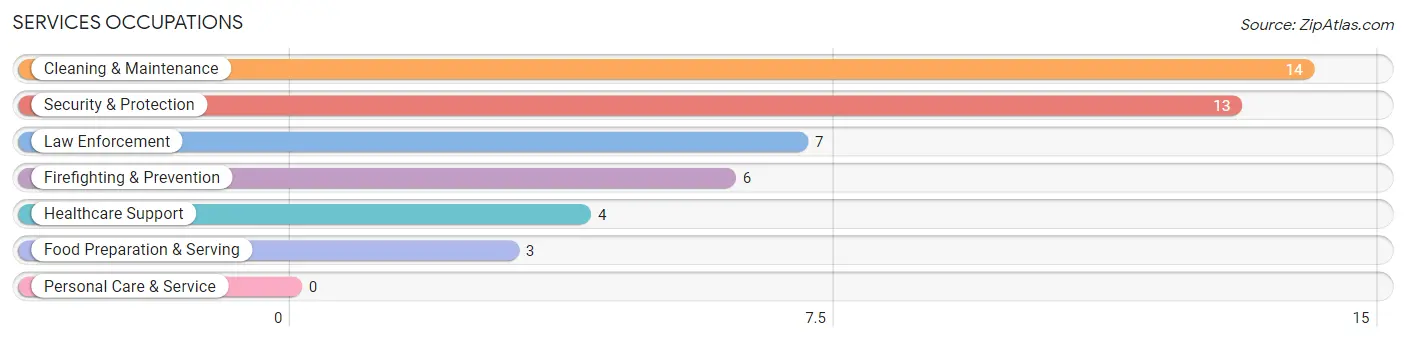
Services Occupations
The most common Services occupations in Grand View are Cleaning & Maintenance (14 | 7.1%), Security & Protection (13 | 6.6%), Law Enforcement (7 | 3.5%), Firefighting & Prevention (6 | 3.0%), and Healthcare Support (4 | 2.0%).
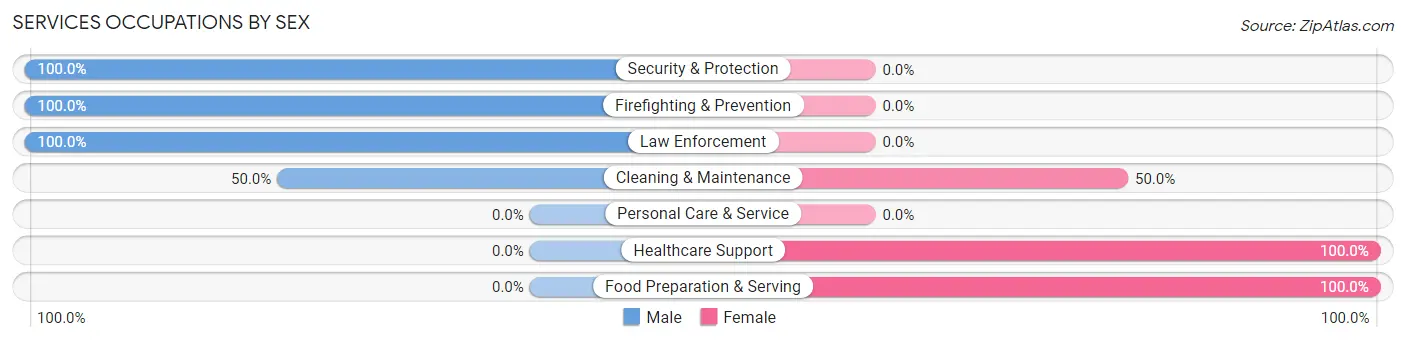
Services Occupations by Sex
Within the Services occupations in Grand View, the most male-oriented occupations are Security & Protection (100.0%), Firefighting & Prevention (100.0%), and Law Enforcement (100.0%), while the most female-oriented occupations are Healthcare Support (100.0%), Food Preparation & Serving (100.0%), and Cleaning & Maintenance (50.0%).
| Occupation | Male | Female |
| Healthcare Support | 0 (0.0%) | 4 (100.0%) |
| Security & Protection | 13 (100.0%) | 0 (0.0%) |
| Firefighting & Prevention | 6 (100.0%) | 0 (0.0%) |
| Law Enforcement | 7 (100.0%) | 0 (0.0%) |
| Food Preparation & Serving | 0 (0.0%) | 3 (100.0%) |
| Cleaning & Maintenance | 7 (50.0%) | 7 (50.0%) |
| Personal Care & Service | 0 (0.0%) | 0 (0.0%) |
| Total (Category) | 20 (58.8%) | 14 (41.2%) |
| Total (Overall) | 96 (48.7%) | 101 (51.3%) |
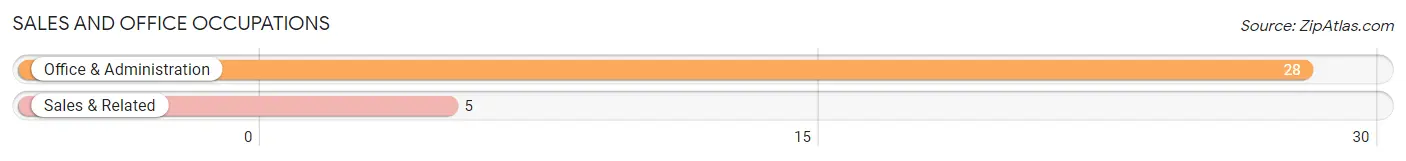
Sales and Office Occupations
The most common Sales and Office occupations in Grand View are Office & Administration (28 | 14.2%), and Sales & Related (5 | 2.5%).
Sales and Office Occupations by Sex
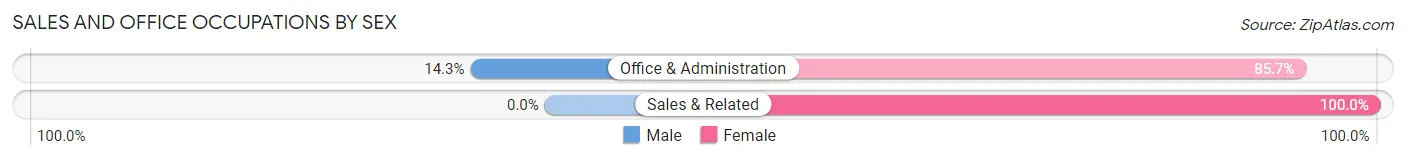
| Occupation | Male | Female |
| Sales & Related | 0 (0.0%) | 5 (100.0%) |
| Office & Administration | 4 (14.3%) | 24 (85.7%) |
| Total (Category) | 4 (12.1%) | 29 (87.9%) |
| Total (Overall) | 96 (48.7%) | 101 (51.3%) |
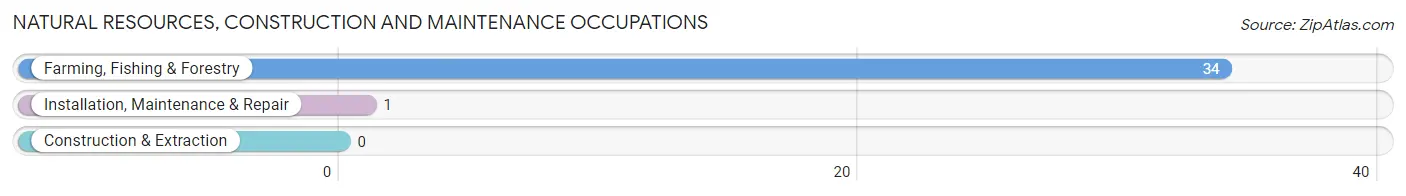
Natural Resources, Construction and Maintenance Occupations
The most common Natural Resources, Construction and Maintenance occupations in Grand View are Farming, Fishing & Forestry (34 | 17.3%), and Installation, Maintenance & Repair (1 | 0.5%).
Natural Resources, Construction and Maintenance Occupations by Sex
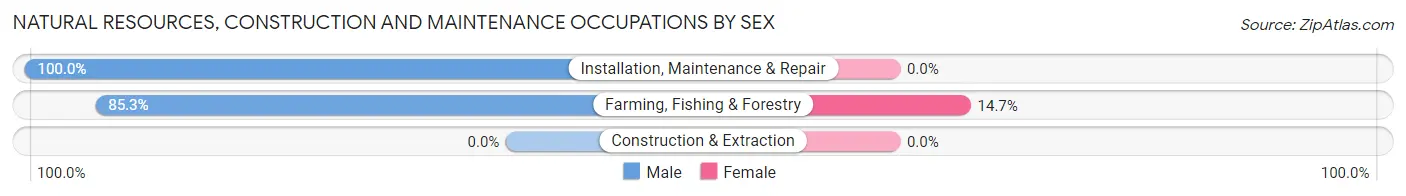
| Occupation | Male | Female |
| Farming, Fishing & Forestry | 29 (85.3%) | 5 (14.7%) |
| Construction & Extraction | 0 (0.0%) | 0 (0.0%) |
| Installation, Maintenance & Repair | 1 (100.0%) | 0 (0.0%) |
| Total (Category) | 30 (85.7%) | 5 (14.3%) |
| Total (Overall) | 96 (48.7%) | 101 (51.3%) |
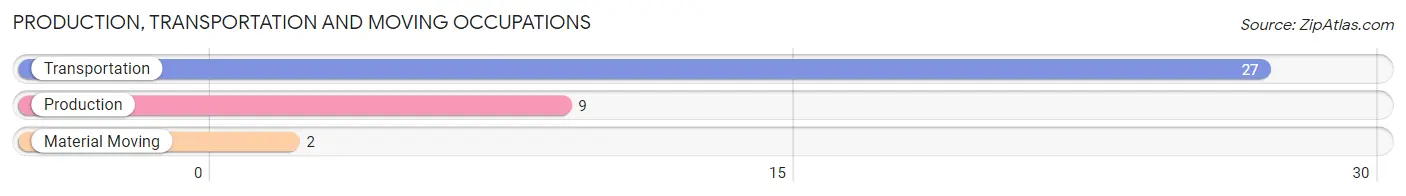
Production, Transportation and Moving Occupations
The most common Production, Transportation and Moving occupations in Grand View are Transportation (27 | 13.7%), Production (9 | 4.6%), and Material Moving (2 | 1.0%).
Production, Transportation and Moving Occupations by Sex
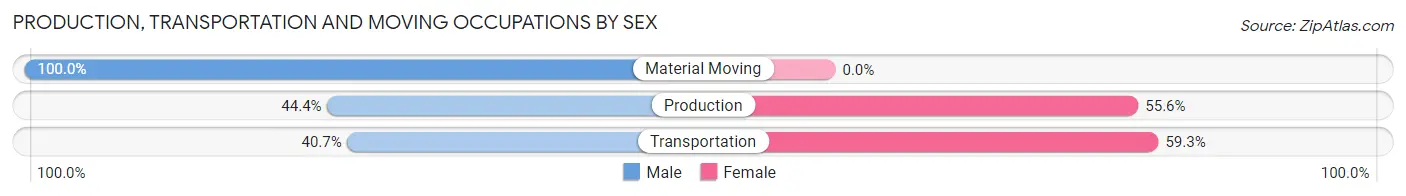
| Occupation | Male | Female |
| Production | 4 (44.4%) | 5 (55.6%) |
| Transportation | 11 (40.7%) | 16 (59.3%) |
| Material Moving | 2 (100.0%) | 0 (0.0%) |
| Total (Category) | 17 (44.7%) | 21 (55.3%) |
| Total (Overall) | 96 (48.7%) | 101 (51.3%) |
Employment Industries by Sex in Grand View
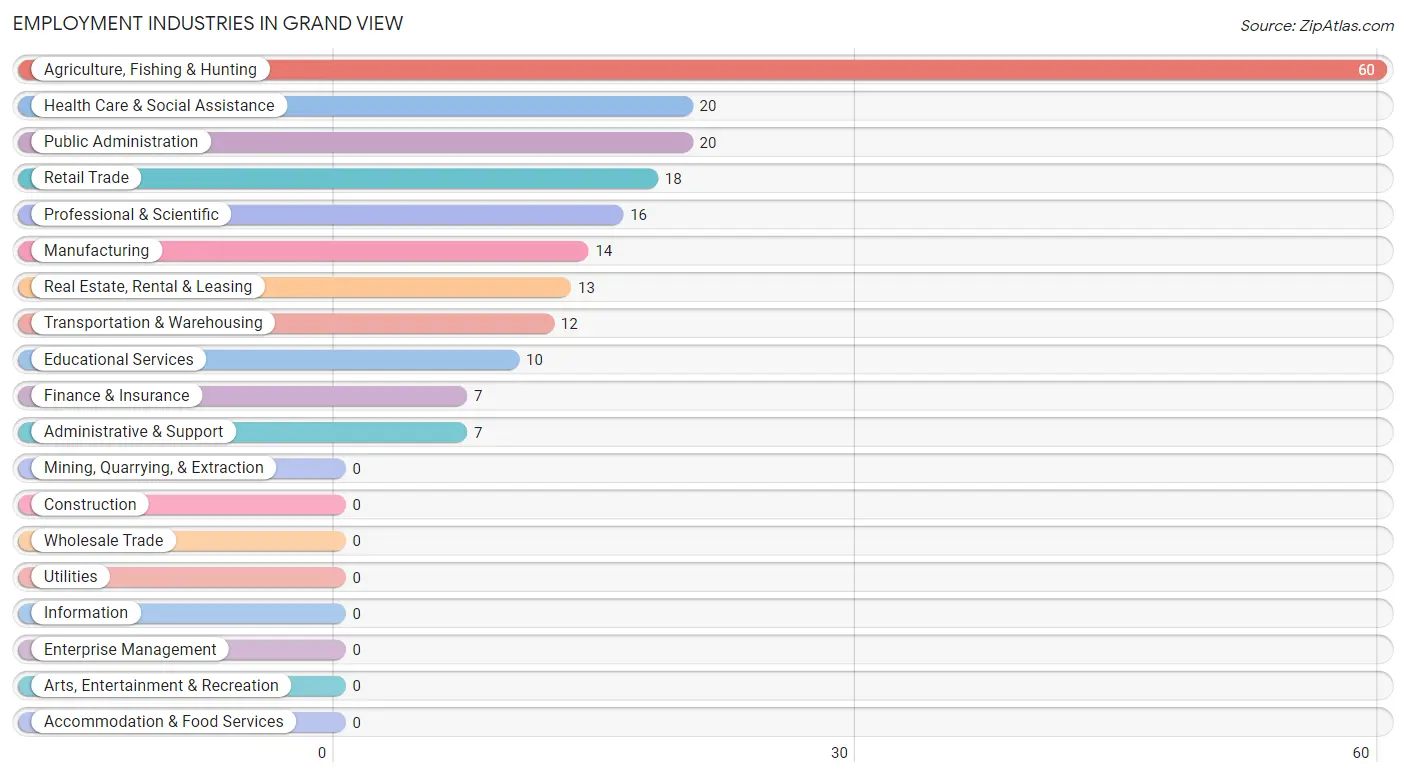
Employment Industries in Grand View
The major employment industries in Grand View include Agriculture, Fishing & Hunting (60 | 30.5%), Health Care & Social Assistance (20 | 10.2%), Public Administration (20 | 10.2%), Retail Trade (18 | 9.1%), and Professional & Scientific (16 | 8.1%).
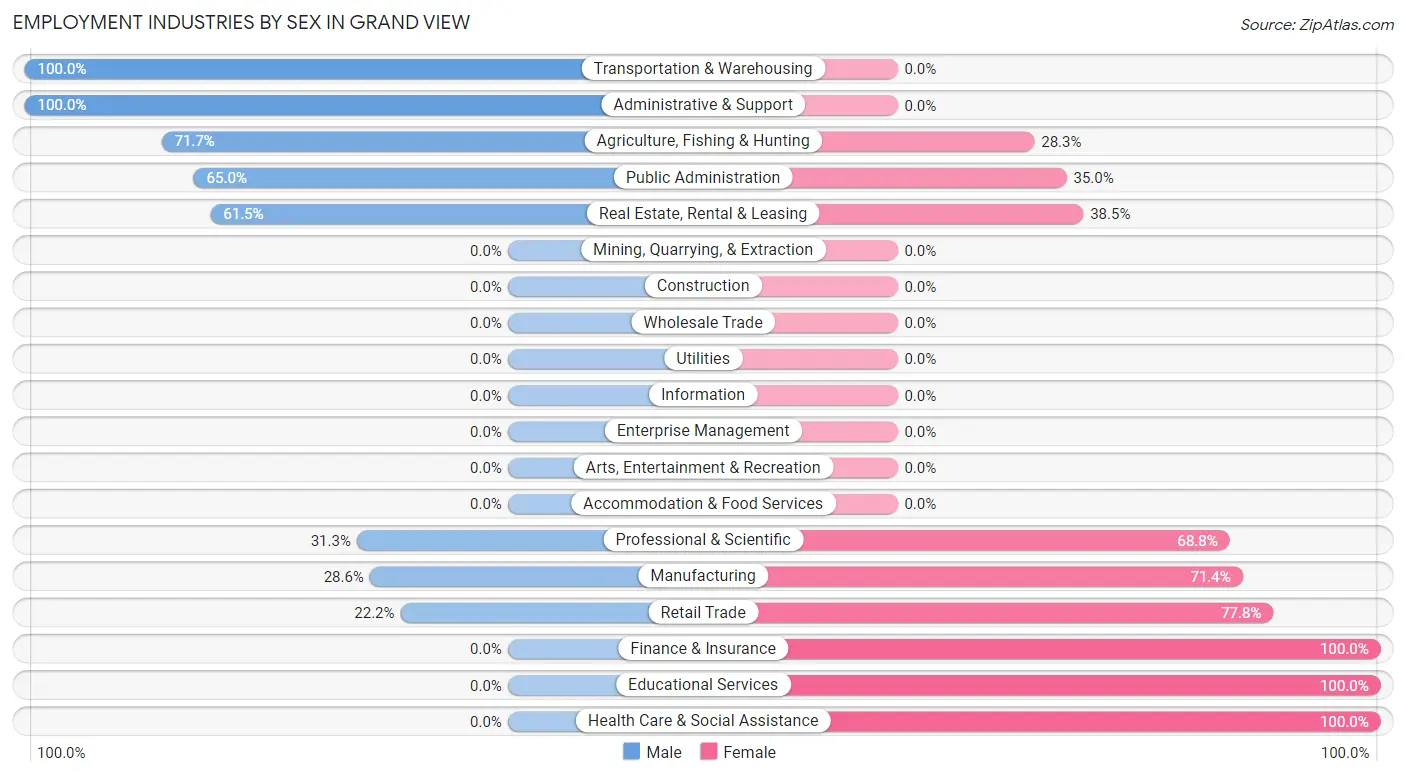
Employment Industries by Sex in Grand View
The Grand View industries that see more men than women are Transportation & Warehousing (100.0%), Administrative & Support (100.0%), and Agriculture, Fishing & Hunting (71.7%), whereas the industries that tend to have a higher number of women are Finance & Insurance (100.0%), Educational Services (100.0%), and Health Care & Social Assistance (100.0%).
| Industry | Male | Female |
| Agriculture, Fishing & Hunting | 43 (71.7%) | 17 (28.3%) |
| Mining, Quarrying, & Extraction | 0 (0.0%) | 0 (0.0%) |
| Construction | 0 (0.0%) | 0 (0.0%) |
| Manufacturing | 4 (28.6%) | 10 (71.4%) |
| Wholesale Trade | 0 (0.0%) | 0 (0.0%) |
| Retail Trade | 4 (22.2%) | 14 (77.8%) |
| Transportation & Warehousing | 12 (100.0%) | 0 (0.0%) |
| Utilities | 0 (0.0%) | 0 (0.0%) |
| Information | 0 (0.0%) | 0 (0.0%) |
| Finance & Insurance | 0 (0.0%) | 7 (100.0%) |
| Real Estate, Rental & Leasing | 8 (61.5%) | 5 (38.5%) |
| Professional & Scientific | 5 (31.2%) | 11 (68.8%) |
| Enterprise Management | 0 (0.0%) | 0 (0.0%) |
| Administrative & Support | 7 (100.0%) | 0 (0.0%) |
| Educational Services | 0 (0.0%) | 10 (100.0%) |
| Health Care & Social Assistance | 0 (0.0%) | 20 (100.0%) |
| Arts, Entertainment & Recreation | 0 (0.0%) | 0 (0.0%) |
| Accommodation & Food Services | 0 (0.0%) | 0 (0.0%) |
| Public Administration | 13 (65.0%) | 7 (35.0%) |
| Total | 96 (48.7%) | 101 (51.3%) |
Education in Grand View
School Enrollment in Grand View
The most common levels of schooling among the 96 students in Grand View are middle school (49 | 51.0%), high school (19 | 19.8%), and college / undergraduate (11 | 11.5%).
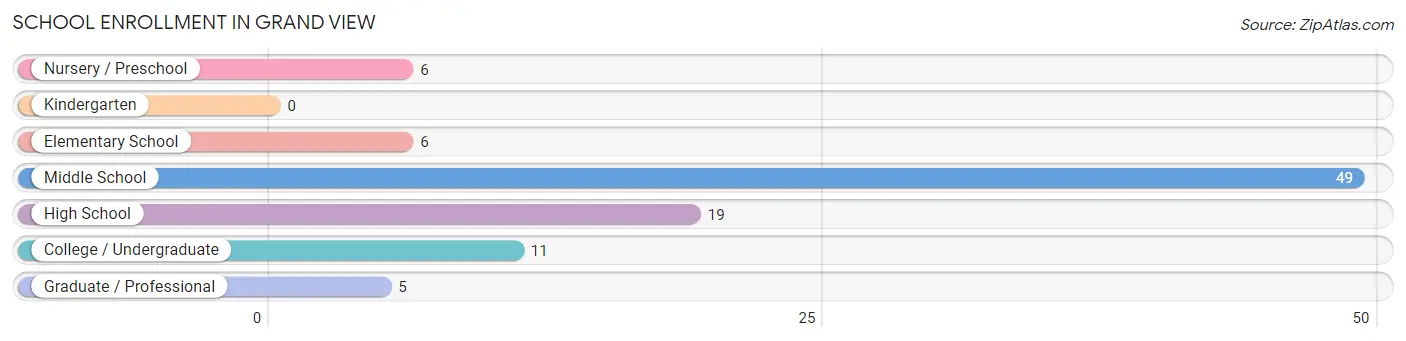
| School Level | # Students | % Students |
| Nursery / Preschool | 6 | 6.2% |
| Kindergarten | 0 | 0.0% |
| Elementary School | 6 | 6.2% |
| Middle School | 49 | 51.0% |
| High School | 19 | 19.8% |
| College / Undergraduate | 11 | 11.5% |
| Graduate / Professional | 5 | 5.2% |
| Total | 96 | 100.0% |
School Enrollment by Age by Funding Source in Grand View
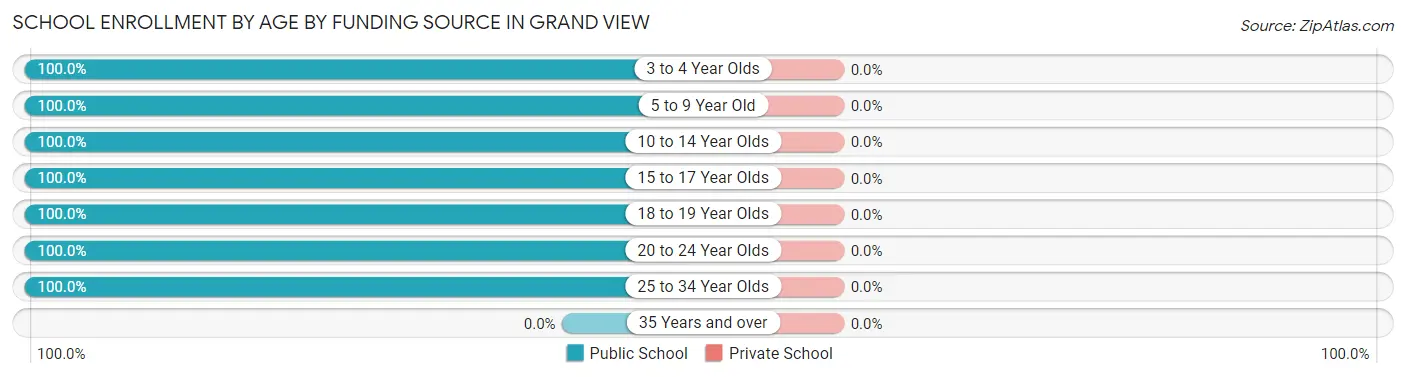
| Age Bracket | Public School | Private School |
| 3 to 4 Year Olds | 6 (100.0%) | 0 (0.0%) |
| 5 to 9 Year Old | 12 (100.0%) | 0 (0.0%) |
| 10 to 14 Year Olds | 43 (100.0%) | 0 (0.0%) |
| 15 to 17 Year Olds | 14 (100.0%) | 0 (0.0%) |
| 18 to 19 Year Olds | 5 (100.0%) | 0 (0.0%) |
| 20 to 24 Year Olds | 4 (100.0%) | 0 (0.0%) |
| 25 to 34 Year Olds | 12 (100.0%) | 0 (0.0%) |
| 35 Years and over | 0 (0.0%) | 0 (0.0%) |
| Total | 96 (100.0%) | 0 (0.0%) |
Educational Attainment by Field of Study in Grand View
Business (12 | 42.9%), social sciences (6 | 21.4%), psychology (5 | 17.9%), and literature & languages (5 | 17.9%) are the most common fields of study among 28 individuals in Grand View who have obtained a bachelor's degree or higher.
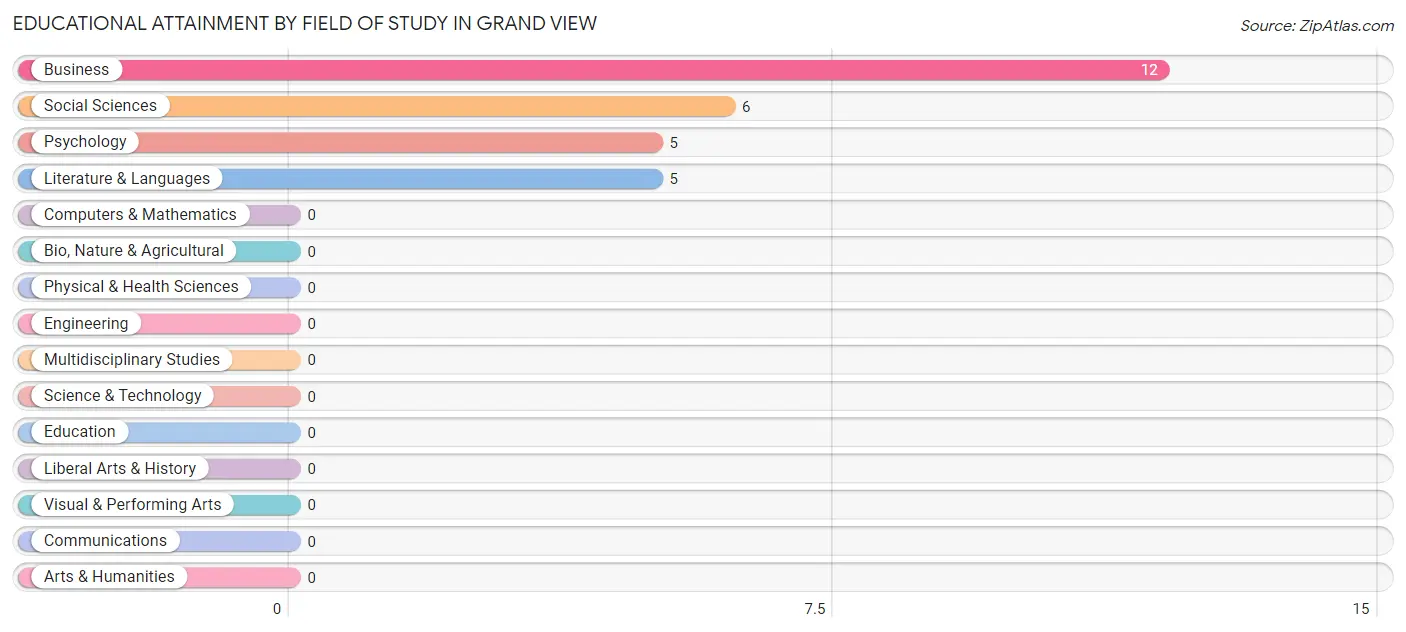
| Field of Study | # Graduates | % Graduates |
| Computers & Mathematics | 0 | 0.0% |
| Bio, Nature & Agricultural | 0 | 0.0% |
| Physical & Health Sciences | 0 | 0.0% |
| Psychology | 5 | 17.9% |
| Social Sciences | 6 | 21.4% |
| Engineering | 0 | 0.0% |
| Multidisciplinary Studies | 0 | 0.0% |
| Science & Technology | 0 | 0.0% |
| Business | 12 | 42.9% |
| Education | 0 | 0.0% |
| Literature & Languages | 5 | 17.9% |
| Liberal Arts & History | 0 | 0.0% |
| Visual & Performing Arts | 0 | 0.0% |
| Communications | 0 | 0.0% |
| Arts & Humanities | 0 | 0.0% |
| Total | 28 | 100.0% |
Transportation & Commute in Grand View
Vehicle Availability by Sex in Grand View
The most prevalent vehicle ownership categories in Grand View are males with 3 vehicles (43, accounting for 41.7%) and females with 3 vehicles (37, making up 42.6%).
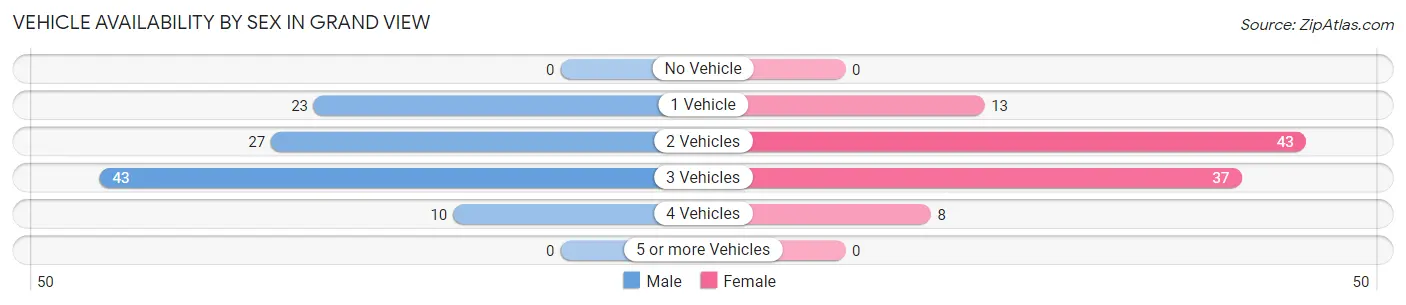
| Vehicles Available | Male | Female |
| No Vehicle | 0 (0.0%) | 0 (0.0%) |
| 1 Vehicle | 23 (22.3%) | 13 (12.9%) |
| 2 Vehicles | 27 (26.2%) | 43 (42.6%) |
| 3 Vehicles | 43 (41.7%) | 37 (36.6%) |
| 4 Vehicles | 10 (9.7%) | 8 (7.9%) |
| 5 or more Vehicles | 0 (0.0%) | 0 (0.0%) |
| Total | 103 (100.0%) | 101 (100.0%) |
Commute Time in Grand View
The most frequently occuring commute durations in Grand View are 5 to 9 minutes (57 commuters, 28.8%), 45 to 59 minutes (44 commuters, 22.2%), and less than 5 minutes (24 commuters, 12.1%).
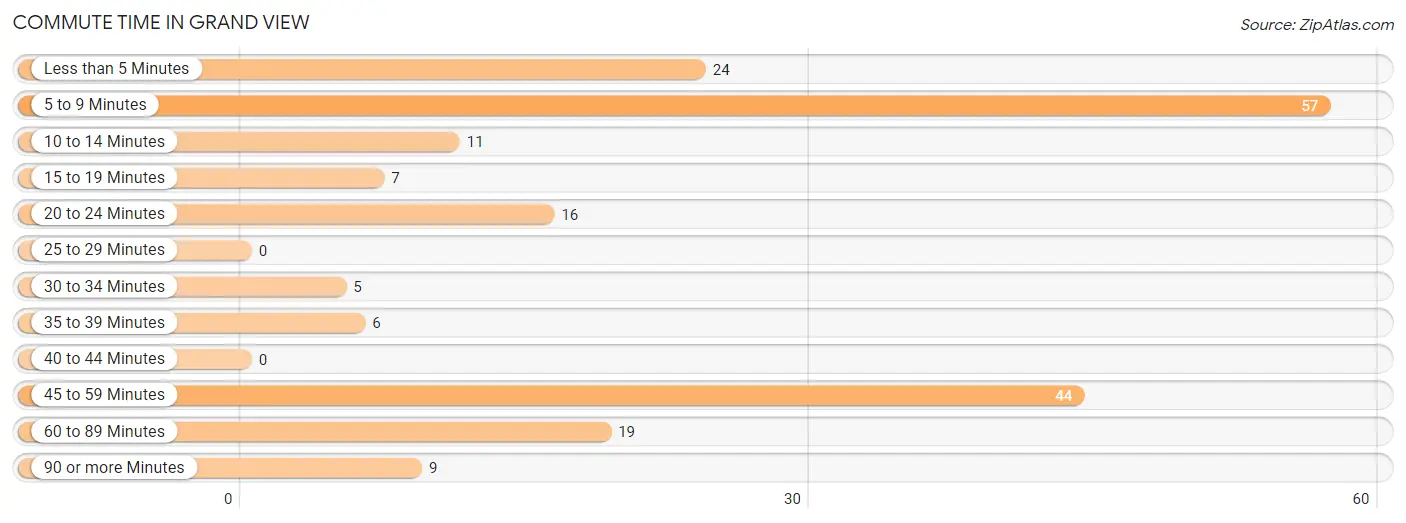
| Commute Time | # Commuters | % Commuters |
| Less than 5 Minutes | 24 | 12.1% |
| 5 to 9 Minutes | 57 | 28.8% |
| 10 to 14 Minutes | 11 | 5.6% |
| 15 to 19 Minutes | 7 | 3.5% |
| 20 to 24 Minutes | 16 | 8.1% |
| 25 to 29 Minutes | 0 | 0.0% |
| 30 to 34 Minutes | 5 | 2.5% |
| 35 to 39 Minutes | 6 | 3.0% |
| 40 to 44 Minutes | 0 | 0.0% |
| 45 to 59 Minutes | 44 | 22.2% |
| 60 to 89 Minutes | 19 | 9.6% |
| 90 or more Minutes | 9 | 4.5% |
Commute Time by Sex in Grand View
The most common commute times in Grand View are 5 to 9 minutes (29 commuters, 29.9%) for males and 45 to 59 minutes (31 commuters, 30.7%) for females.
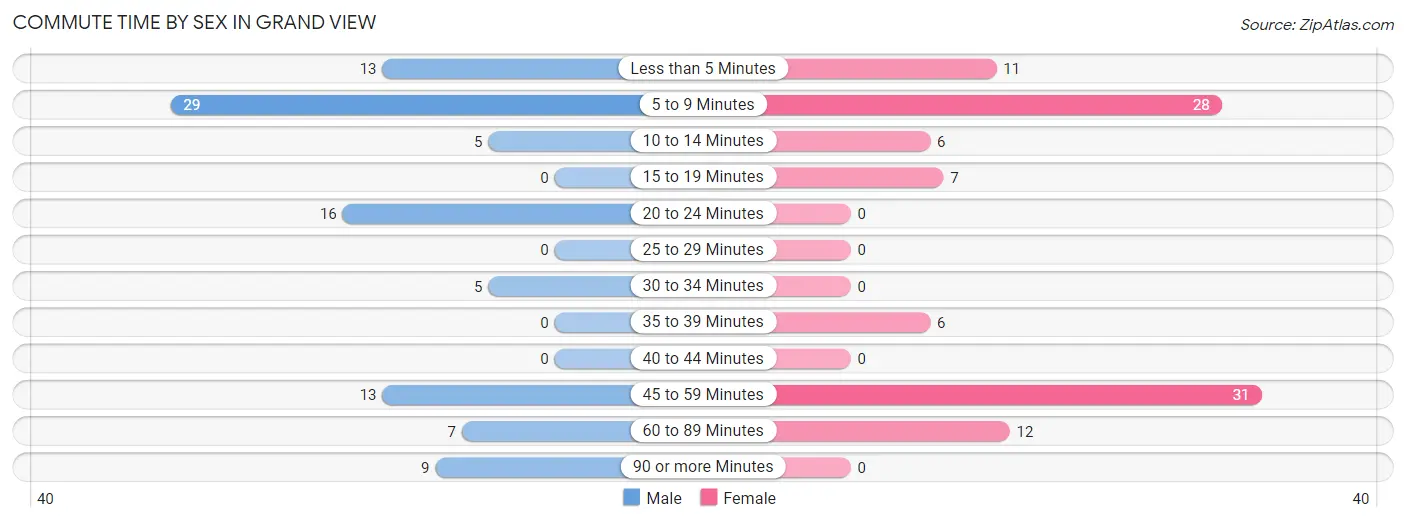
| Commute Time | Male | Female |
| Less than 5 Minutes | 13 (13.4%) | 11 (10.9%) |
| 5 to 9 Minutes | 29 (29.9%) | 28 (27.7%) |
| 10 to 14 Minutes | 5 (5.1%) | 6 (5.9%) |
| 15 to 19 Minutes | 0 (0.0%) | 7 (6.9%) |
| 20 to 24 Minutes | 16 (16.5%) | 0 (0.0%) |
| 25 to 29 Minutes | 0 (0.0%) | 0 (0.0%) |
| 30 to 34 Minutes | 5 (5.1%) | 0 (0.0%) |
| 35 to 39 Minutes | 0 (0.0%) | 6 (5.9%) |
| 40 to 44 Minutes | 0 (0.0%) | 0 (0.0%) |
| 45 to 59 Minutes | 13 (13.4%) | 31 (30.7%) |
| 60 to 89 Minutes | 7 (7.2%) | 12 (11.9%) |
| 90 or more Minutes | 9 (9.3%) | 0 (0.0%) |
Time of Departure to Work by Sex in Grand View
The most frequent times of departure to work in Grand View are 7:00 AM to 7:29 AM (26, 26.8%) for males and 8:00 AM to 8:29 AM (17, 16.8%) for females.
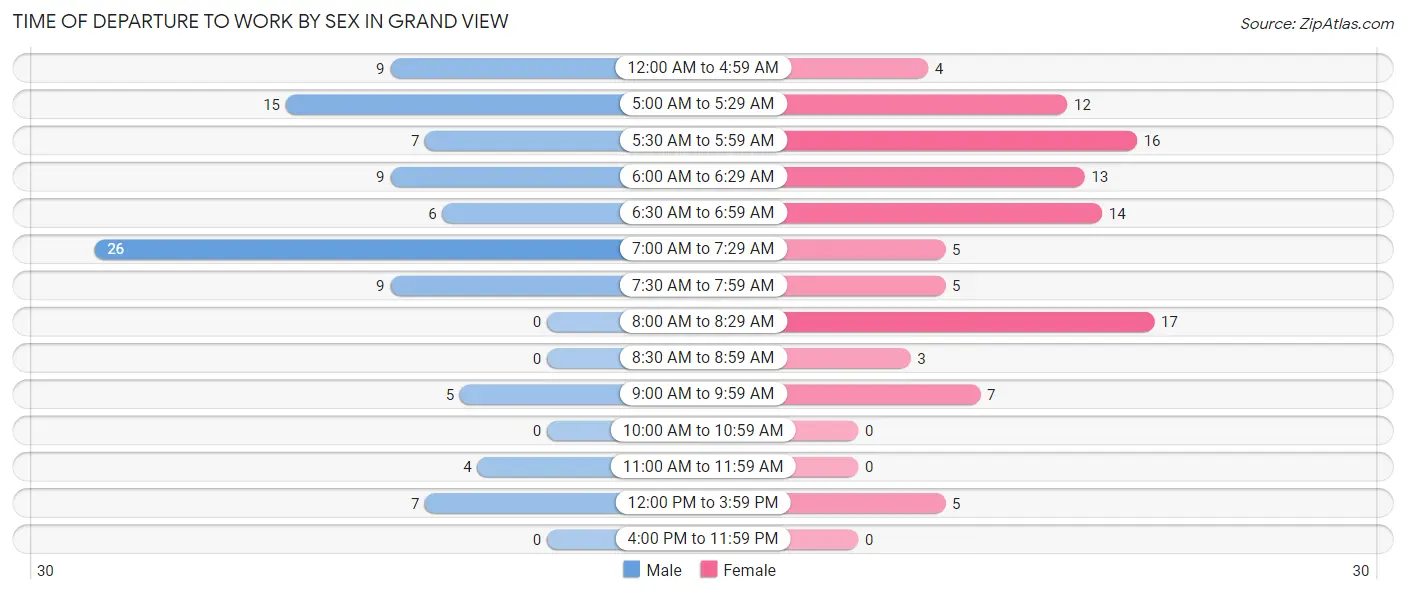
| Time of Departure | Male | Female |
| 12:00 AM to 4:59 AM | 9 (9.3%) | 4 (4.0%) |
| 5:00 AM to 5:29 AM | 15 (15.5%) | 12 (11.9%) |
| 5:30 AM to 5:59 AM | 7 (7.2%) | 16 (15.8%) |
| 6:00 AM to 6:29 AM | 9 (9.3%) | 13 (12.9%) |
| 6:30 AM to 6:59 AM | 6 (6.2%) | 14 (13.9%) |
| 7:00 AM to 7:29 AM | 26 (26.8%) | 5 (5.0%) |
| 7:30 AM to 7:59 AM | 9 (9.3%) | 5 (5.0%) |
| 8:00 AM to 8:29 AM | 0 (0.0%) | 17 (16.8%) |
| 8:30 AM to 8:59 AM | 0 (0.0%) | 3 (3.0%) |
| 9:00 AM to 9:59 AM | 5 (5.1%) | 7 (6.9%) |
| 10:00 AM to 10:59 AM | 0 (0.0%) | 0 (0.0%) |
| 11:00 AM to 11:59 AM | 4 (4.1%) | 0 (0.0%) |
| 12:00 PM to 3:59 PM | 7 (7.2%) | 5 (5.0%) |
| 4:00 PM to 11:59 PM | 0 (0.0%) | 0 (0.0%) |
| Total | 97 (100.0%) | 101 (100.0%) |
Housing Occupancy in Grand View
Occupancy by Ownership in Grand View
Of the total 206 dwellings in Grand View, owner-occupied units account for 110 (53.4%), while renter-occupied units make up 96 (46.6%).
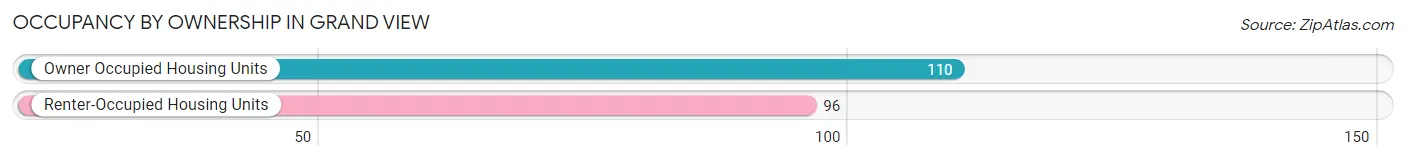
| Occupancy | # Housing Units | % Housing Units |
| Owner Occupied Housing Units | 110 | 53.4% |
| Renter-Occupied Housing Units | 96 | 46.6% |
| Total Occupied Housing Units | 206 | 100.0% |
Occupancy by Household Size in Grand View
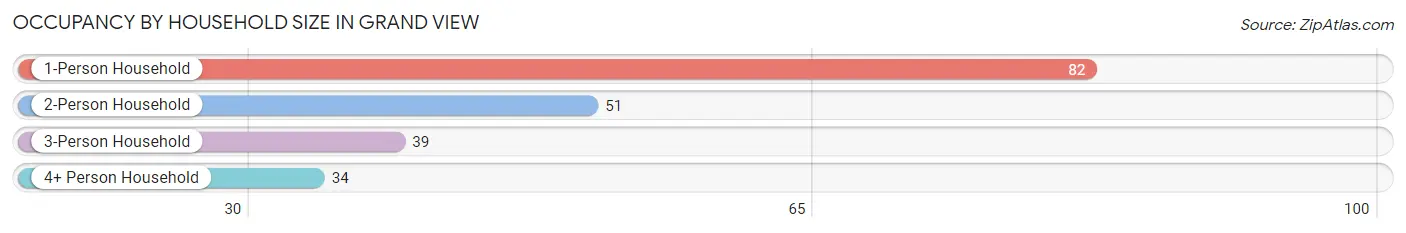
| Household Size | # Housing Units | % Housing Units |
| 1-Person Household | 82 | 39.8% |
| 2-Person Household | 51 | 24.8% |
| 3-Person Household | 39 | 18.9% |
| 4+ Person Household | 34 | 16.5% |
| Total Housing Units | 206 | 100.0% |
Occupancy by Ownership by Household Size in Grand View
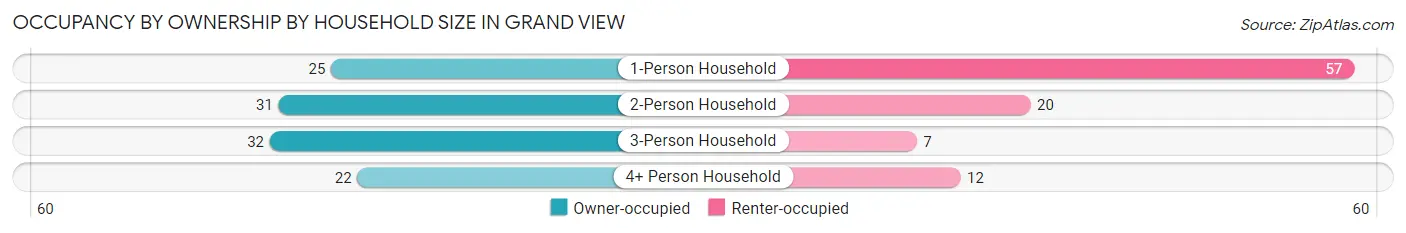
| Household Size | Owner-occupied | Renter-occupied |
| 1-Person Household | 25 (30.5%) | 57 (69.5%) |
| 2-Person Household | 31 (60.8%) | 20 (39.2%) |
| 3-Person Household | 32 (82.1%) | 7 (17.9%) |
| 4+ Person Household | 22 (64.7%) | 12 (35.3%) |
| Total Housing Units | 110 (53.4%) | 96 (46.6%) |
Occupancy by Educational Attainment in Grand View
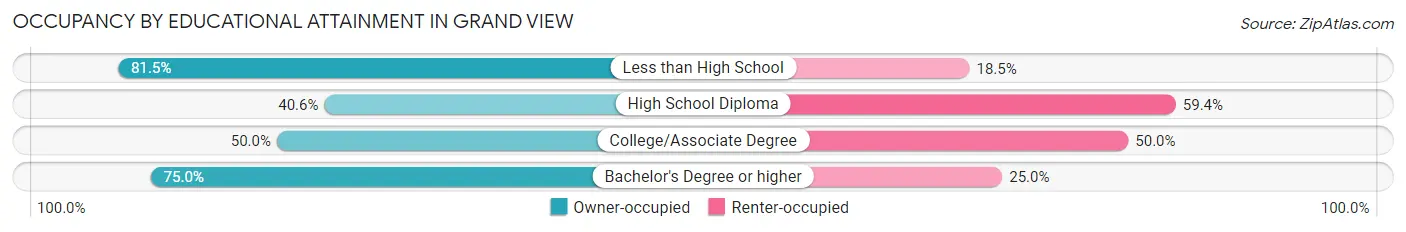
| Household Size | Owner-occupied | Renter-occupied |
| Less than High School | 22 (81.5%) | 5 (18.5%) |
| High School Diploma | 28 (40.6%) | 41 (59.4%) |
| College/Associate Degree | 45 (50.0%) | 45 (50.0%) |
| Bachelor's Degree or higher | 15 (75.0%) | 5 (25.0%) |
Occupancy by Age of Householder in Grand View
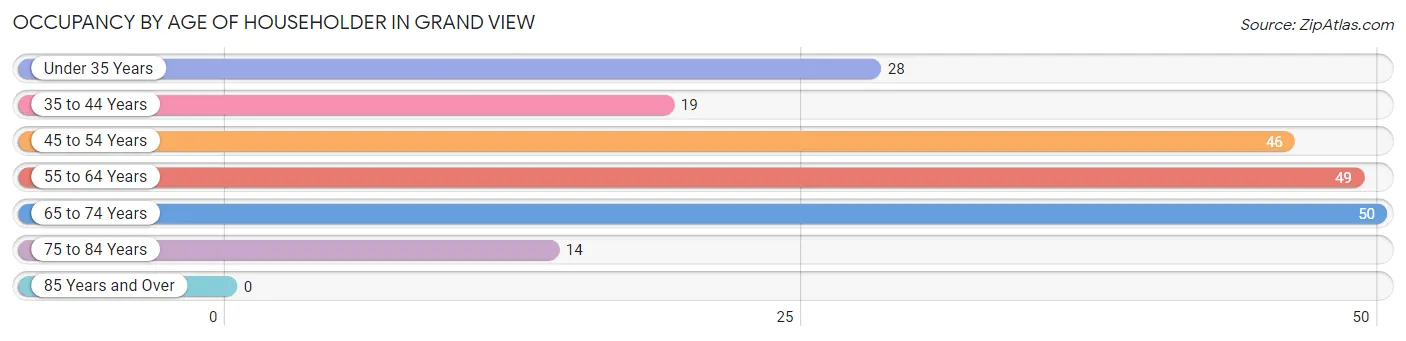
| Age Bracket | # Households | % Households |
| Under 35 Years | 28 | 13.6% |
| 35 to 44 Years | 19 | 9.2% |
| 45 to 54 Years | 46 | 22.3% |
| 55 to 64 Years | 49 | 23.8% |
| 65 to 74 Years | 50 | 24.3% |
| 75 to 84 Years | 14 | 6.8% |
| 85 Years and Over | 0 | 0.0% |
| Total | 206 | 100.0% |
Housing Finances in Grand View
Median Income by Occupancy in Grand View
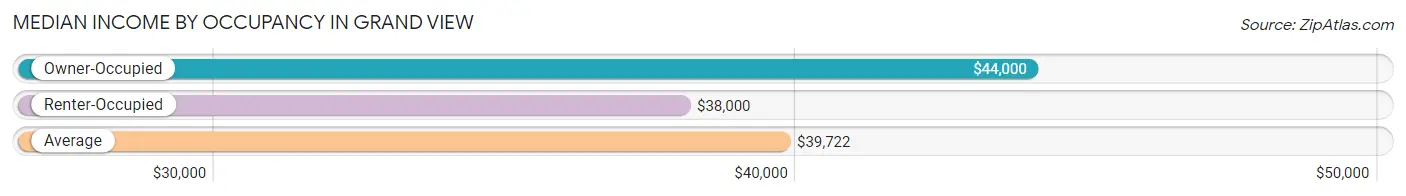
| Occupancy Type | # Households | Median Income |
| Owner-Occupied | 110 (53.4%) | $44,000 |
| Renter-Occupied | 96 (46.6%) | $38,000 |
| Average | 206 (100.0%) | $39,722 |
Occupancy by Householder Income Bracket in Grand View
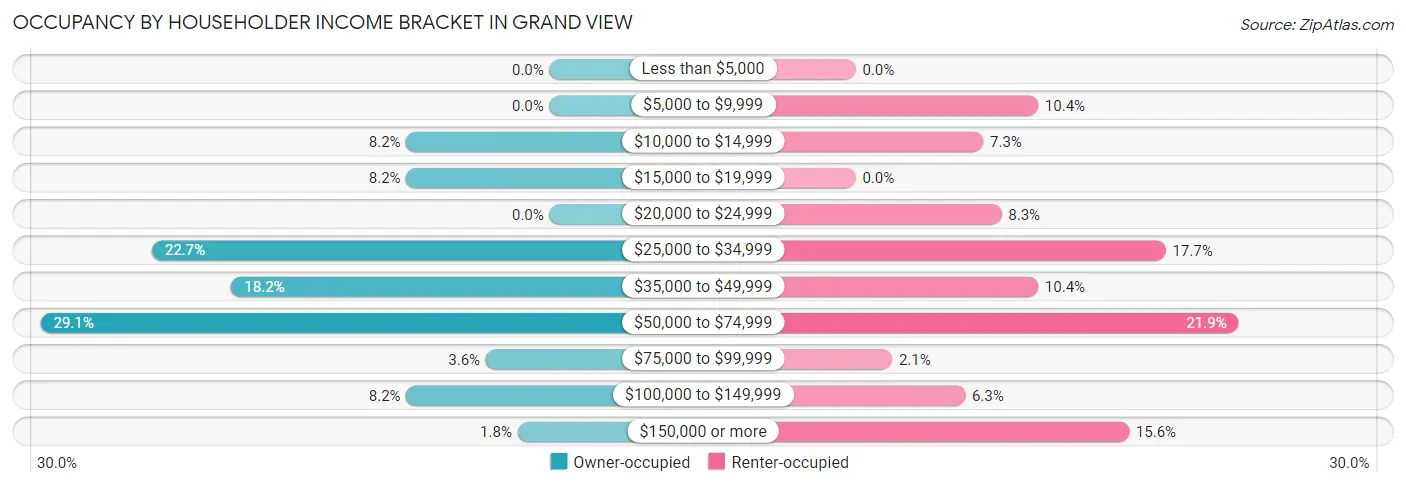
| Income Bracket | Owner-occupied | Renter-occupied |
| Less than $5,000 | 0 (0.0%) | 0 (0.0%) |
| $5,000 to $9,999 | 0 (0.0%) | 10 (10.4%) |
| $10,000 to $14,999 | 9 (8.2%) | 7 (7.3%) |
| $15,000 to $19,999 | 9 (8.2%) | 0 (0.0%) |
| $20,000 to $24,999 | 0 (0.0%) | 8 (8.3%) |
| $25,000 to $34,999 | 25 (22.7%) | 17 (17.7%) |
| $35,000 to $49,999 | 20 (18.2%) | 10 (10.4%) |
| $50,000 to $74,999 | 32 (29.1%) | 21 (21.9%) |
| $75,000 to $99,999 | 4 (3.6%) | 2 (2.1%) |
| $100,000 to $149,999 | 9 (8.2%) | 6 (6.2%) |
| $150,000 or more | 2 (1.8%) | 15 (15.6%) |
| Total | 110 (100.0%) | 96 (100.0%) |
Monthly Housing Cost Tiers in Grand View
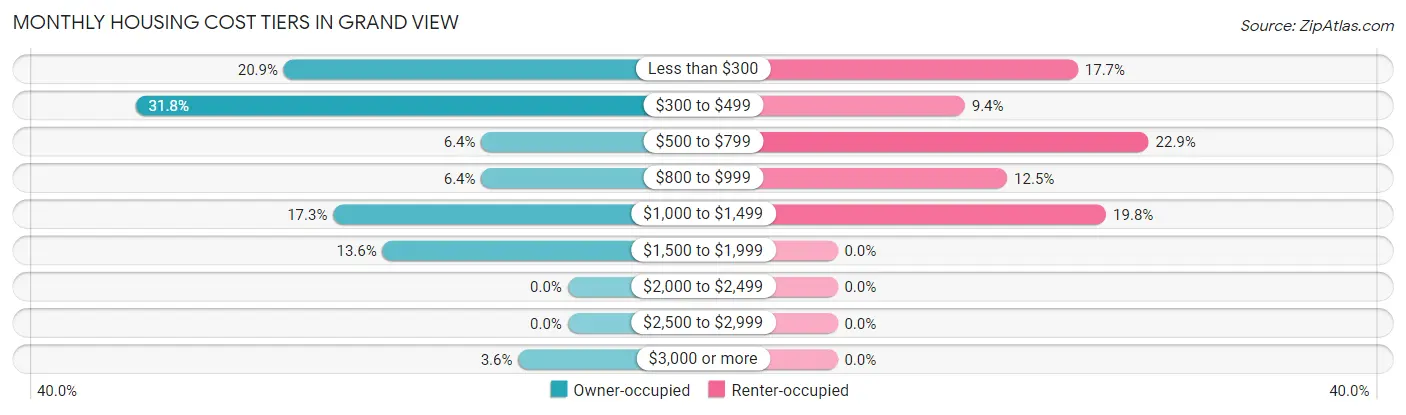
| Monthly Cost | Owner-occupied | Renter-occupied |
| Less than $300 | 23 (20.9%) | 17 (17.7%) |
| $300 to $499 | 35 (31.8%) | 9 (9.4%) |
| $500 to $799 | 7 (6.4%) | 22 (22.9%) |
| $800 to $999 | 7 (6.4%) | 12 (12.5%) |
| $1,000 to $1,499 | 19 (17.3%) | 19 (19.8%) |
| $1,500 to $1,999 | 15 (13.6%) | 0 (0.0%) |
| $2,000 to $2,499 | 0 (0.0%) | 0 (0.0%) |
| $2,500 to $2,999 | 0 (0.0%) | 0 (0.0%) |
| $3,000 or more | 4 (3.6%) | 0 (0.0%) |
| Total | 110 (100.0%) | 96 (100.0%) |
Physical Housing Characteristics in Grand View
Housing Structures in Grand View
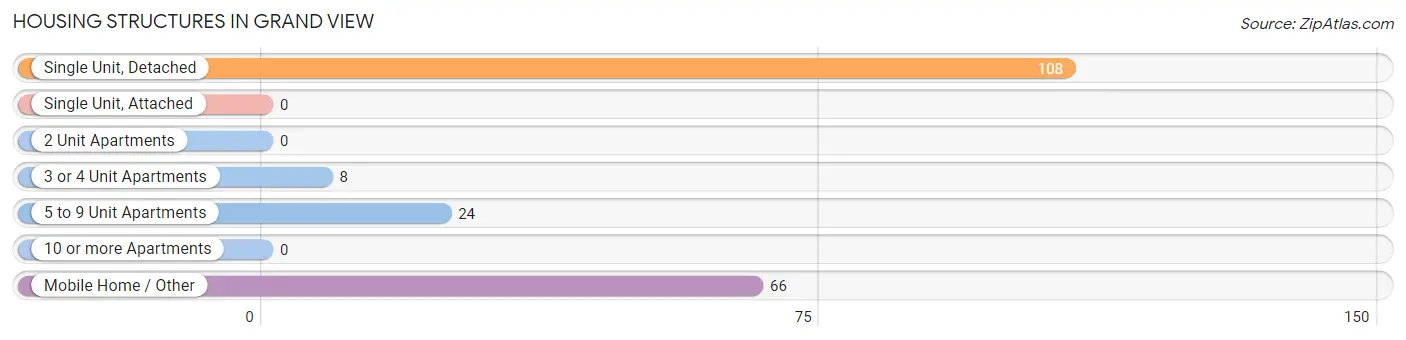
| Structure Type | # Housing Units | % Housing Units |
| Single Unit, Detached | 108 | 52.4% |
| Single Unit, Attached | 0 | 0.0% |
| 2 Unit Apartments | 0 | 0.0% |
| 3 or 4 Unit Apartments | 8 | 3.9% |
| 5 to 9 Unit Apartments | 24 | 11.7% |
| 10 or more Apartments | 0 | 0.0% |
| Mobile Home / Other | 66 | 32.0% |
| Total | 206 | 100.0% |
Housing Structures by Occupancy in Grand View
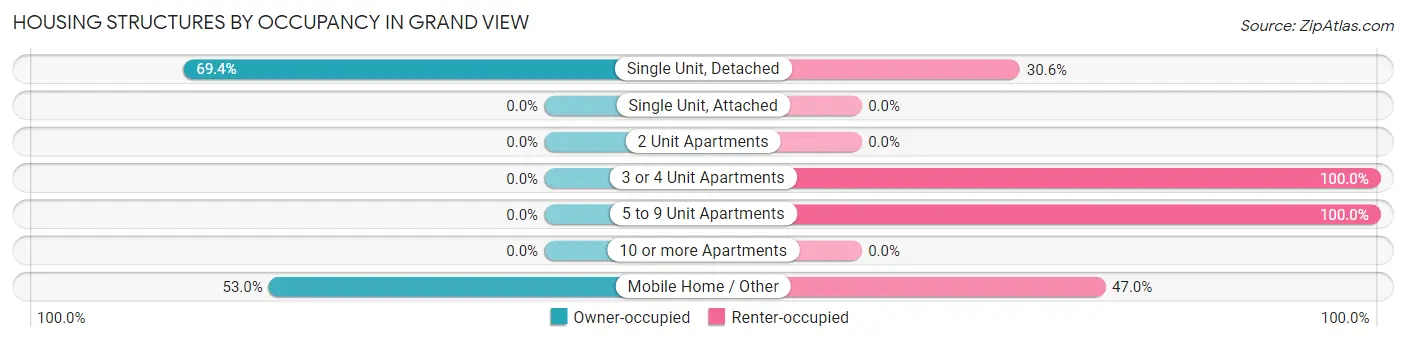
| Structure Type | Owner-occupied | Renter-occupied |
| Single Unit, Detached | 75 (69.4%) | 33 (30.6%) |
| Single Unit, Attached | 0 (0.0%) | 0 (0.0%) |
| 2 Unit Apartments | 0 (0.0%) | 0 (0.0%) |
| 3 or 4 Unit Apartments | 0 (0.0%) | 8 (100.0%) |
| 5 to 9 Unit Apartments | 0 (0.0%) | 24 (100.0%) |
| 10 or more Apartments | 0 (0.0%) | 0 (0.0%) |
| Mobile Home / Other | 35 (53.0%) | 31 (47.0%) |
| Total | 110 (53.4%) | 96 (46.6%) |
Housing Structures by Number of Rooms in Grand View
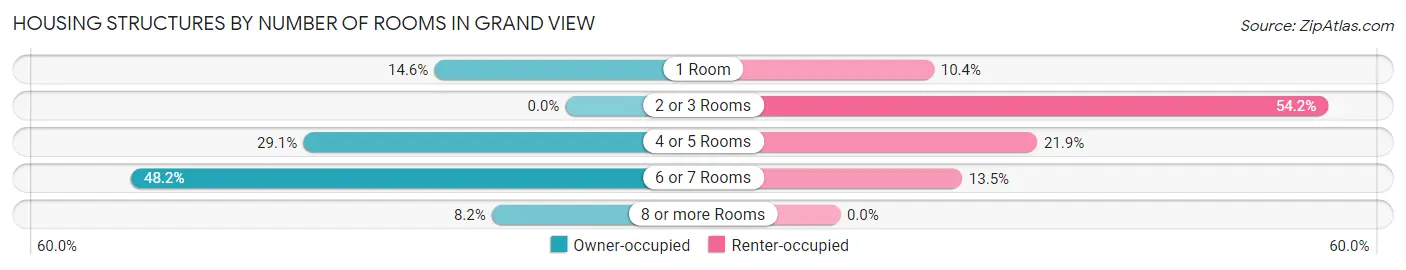
| Number of Rooms | Owner-occupied | Renter-occupied |
| 1 Room | 16 (14.5%) | 10 (10.4%) |
| 2 or 3 Rooms | 0 (0.0%) | 52 (54.2%) |
| 4 or 5 Rooms | 32 (29.1%) | 21 (21.9%) |
| 6 or 7 Rooms | 53 (48.2%) | 13 (13.5%) |
| 8 or more Rooms | 9 (8.2%) | 0 (0.0%) |
| Total | 110 (100.0%) | 96 (100.0%) |
Housing Structure by Heating Type in Grand View
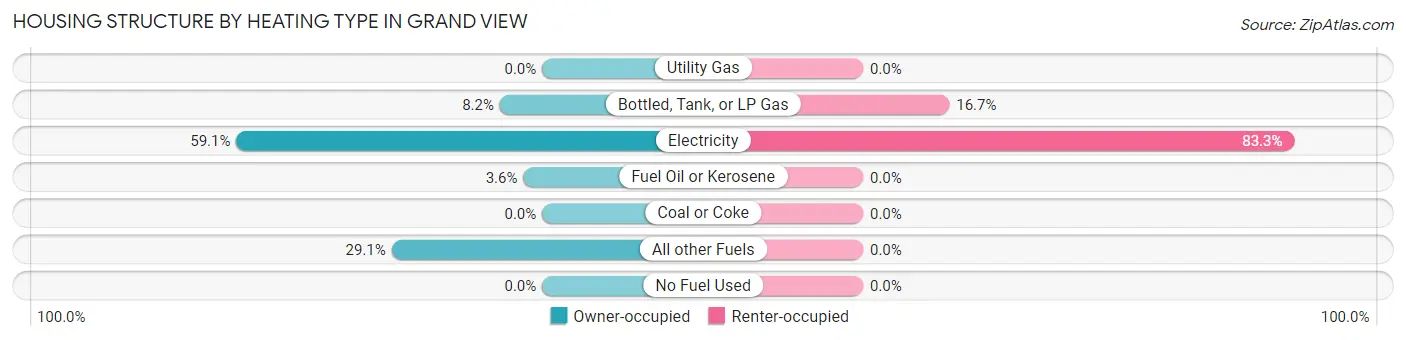
| Heating Type | Owner-occupied | Renter-occupied |
| Utility Gas | 0 (0.0%) | 0 (0.0%) |
| Bottled, Tank, or LP Gas | 9 (8.2%) | 16 (16.7%) |
| Electricity | 65 (59.1%) | 80 (83.3%) |
| Fuel Oil or Kerosene | 4 (3.6%) | 0 (0.0%) |
| Coal or Coke | 0 (0.0%) | 0 (0.0%) |
| All other Fuels | 32 (29.1%) | 0 (0.0%) |
| No Fuel Used | 0 (0.0%) | 0 (0.0%) |
| Total | 110 (100.0%) | 96 (100.0%) |
Household Vehicle Usage in Grand View
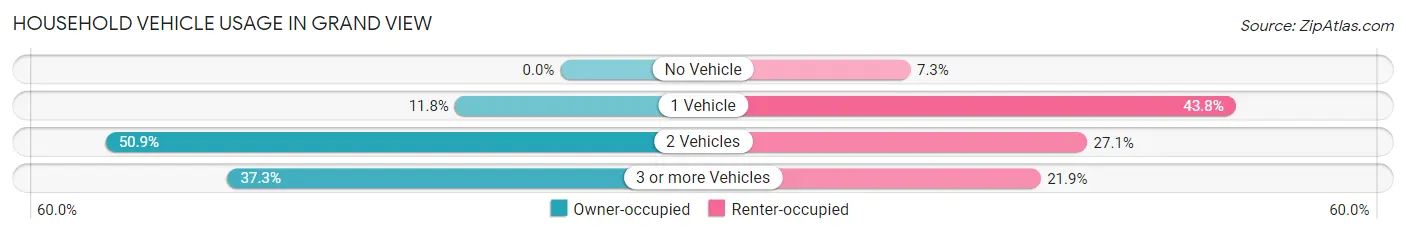
| Vehicles per Household | Owner-occupied | Renter-occupied |
| No Vehicle | 0 (0.0%) | 7 (7.3%) |
| 1 Vehicle | 13 (11.8%) | 42 (43.8%) |
| 2 Vehicles | 56 (50.9%) | 26 (27.1%) |
| 3 or more Vehicles | 41 (37.3%) | 21 (21.9%) |
| Total | 110 (100.0%) | 96 (100.0%) |
Real Estate & Mortgages in Grand View
Real Estate and Mortgage Overview in Grand View
| Characteristic | Without Mortgage | With Mortgage |
| Housing Units | 58 | 52 |
| Median Property Value | - | - |
| Median Household Income | $34,063 | $2 |
| Monthly Housing Costs | $369 | $4 |
| Real Estate Taxes | $882 | $0 |
Property Value by Mortgage Status in Grand View
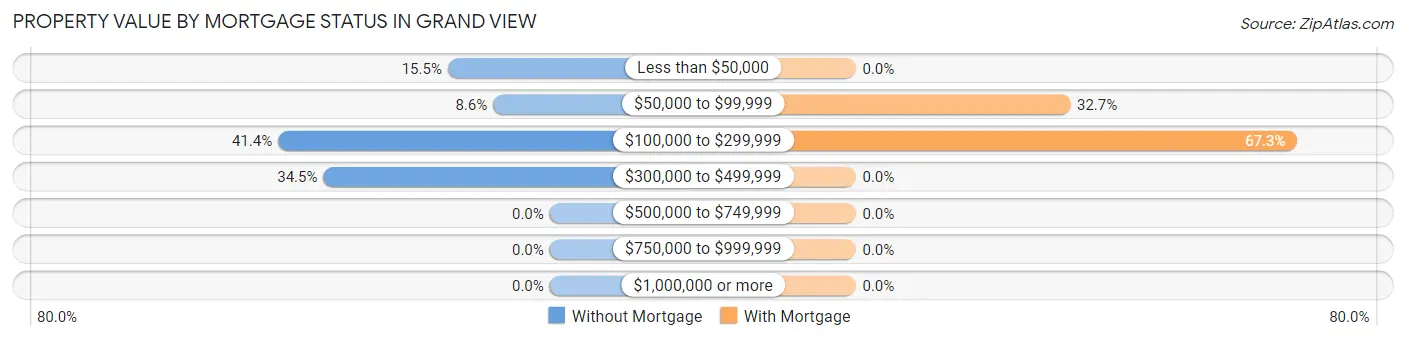
| Property Value | Without Mortgage | With Mortgage |
| Less than $50,000 | 9 (15.5%) | 0 (0.0%) |
| $50,000 to $99,999 | 5 (8.6%) | 17 (32.7%) |
| $100,000 to $299,999 | 24 (41.4%) | 35 (67.3%) |
| $300,000 to $499,999 | 20 (34.5%) | 0 (0.0%) |
| $500,000 to $749,999 | 0 (0.0%) | 0 (0.0%) |
| $750,000 to $999,999 | 0 (0.0%) | 0 (0.0%) |
| $1,000,000 or more | 0 (0.0%) | 0 (0.0%) |
| Total | 58 (100.0%) | 52 (100.0%) |
Household Income by Mortgage Status in Grand View
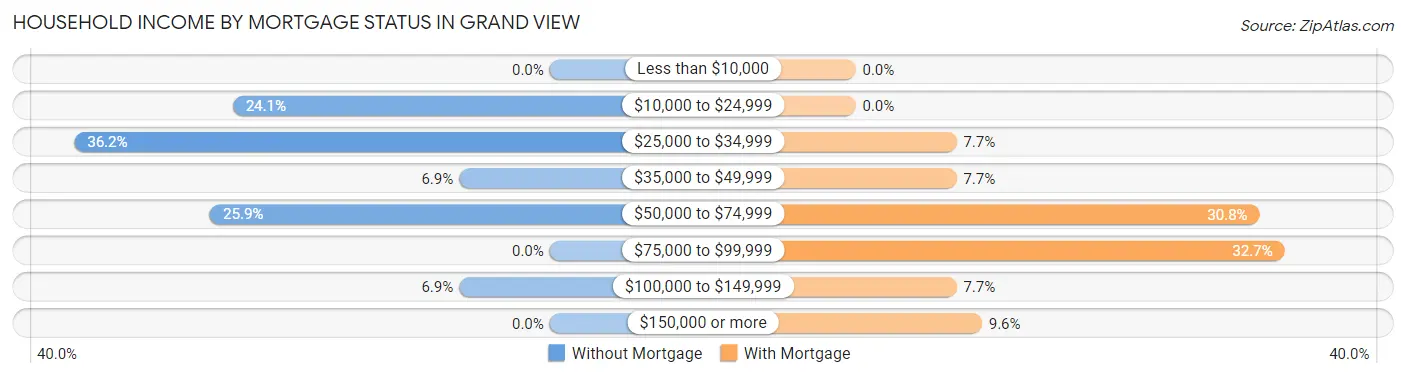
| Household Income | Without Mortgage | With Mortgage |
| Less than $10,000 | 0 (0.0%) | 0 (0.0%) |
| $10,000 to $24,999 | 14 (24.1%) | 0 (0.0%) |
| $25,000 to $34,999 | 21 (36.2%) | 4 (7.7%) |
| $35,000 to $49,999 | 4 (6.9%) | 4 (7.7%) |
| $50,000 to $74,999 | 15 (25.9%) | 16 (30.8%) |
| $75,000 to $99,999 | 0 (0.0%) | 17 (32.7%) |
| $100,000 to $149,999 | 4 (6.9%) | 4 (7.7%) |
| $150,000 or more | 0 (0.0%) | 5 (9.6%) |
| Total | 58 (100.0%) | 52 (100.0%) |
Property Value to Household Income Ratio in Grand View
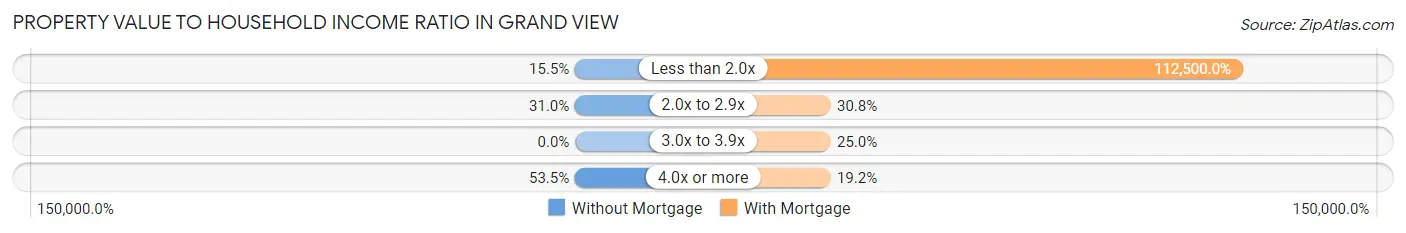
| Value-to-Income Ratio | Without Mortgage | With Mortgage |
| Less than 2.0x | 9 (15.5%) | 58,500 (112,500.0%) |
| 2.0x to 2.9x | 18 (31.0%) | 16 (30.8%) |
| 3.0x to 3.9x | 0 (0.0%) | 13 (25.0%) |
| 4.0x or more | 31 (53.4%) | 10 (19.2%) |
| Total | 58 (100.0%) | 52 (100.0%) |
Real Estate Taxes by Mortgage Status in Grand View
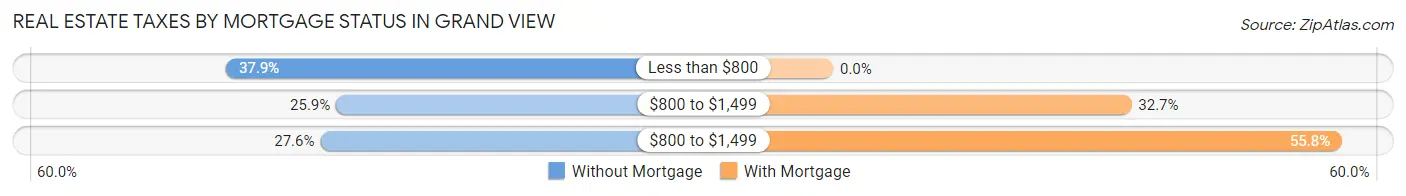
| Property Taxes | Without Mortgage | With Mortgage |
| Less than $800 | 22 (37.9%) | 0 (0.0%) |
| $800 to $1,499 | 15 (25.9%) | 17 (32.7%) |
| $800 to $1,499 | 16 (27.6%) | 29 (55.8%) |
| Total | 58 (100.0%) | 52 (100.0%) |
Health & Disability in Grand View
Health Insurance Coverage by Age in Grand View
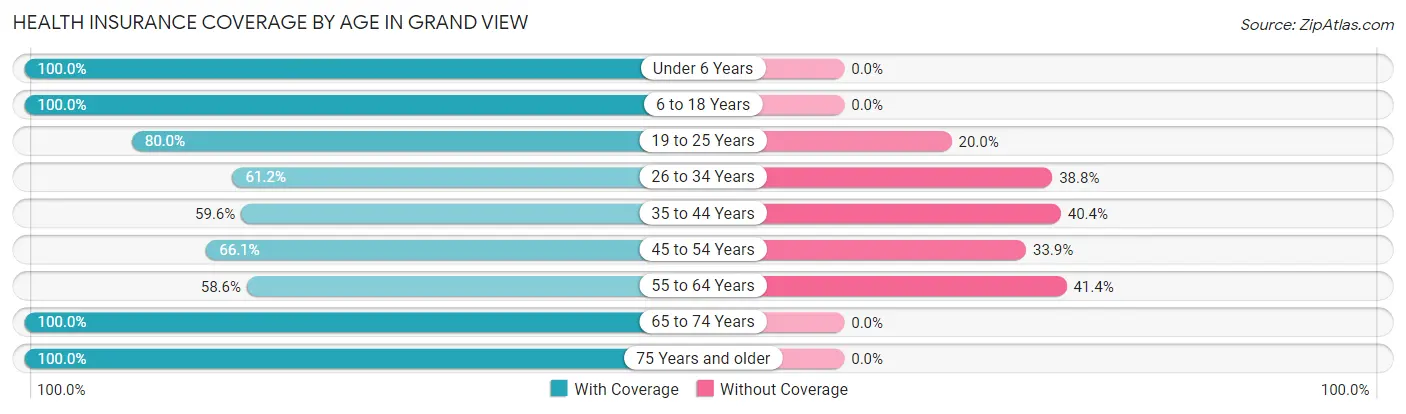
| Age Bracket | With Coverage | Without Coverage |
| Under 6 Years | 24 (100.0%) | 0 (0.0%) |
| 6 to 18 Years | 85 (100.0%) | 0 (0.0%) |
| 19 to 25 Years | 20 (80.0%) | 5 (20.0%) |
| 26 to 34 Years | 30 (61.2%) | 19 (38.8%) |
| 35 to 44 Years | 31 (59.6%) | 21 (40.4%) |
| 45 to 54 Years | 39 (66.1%) | 20 (33.9%) |
| 55 to 64 Years | 41 (58.6%) | 29 (41.4%) |
| 65 to 74 Years | 79 (100.0%) | 0 (0.0%) |
| 75 Years and older | 31 (100.0%) | 0 (0.0%) |
| Total | 380 (80.2%) | 94 (19.8%) |
Health Insurance Coverage by Citizenship Status in Grand View
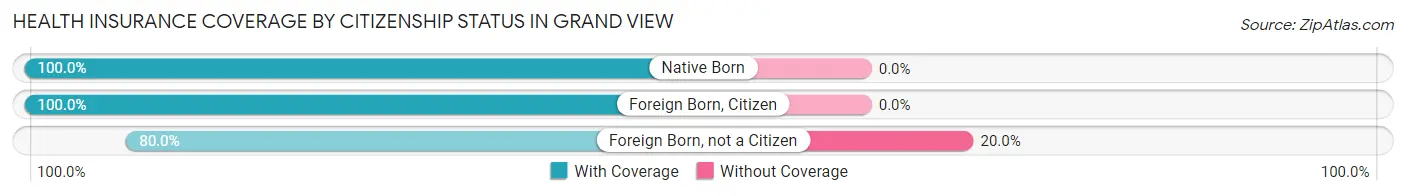
| Citizenship Status | With Coverage | Without Coverage |
| Native Born | 24 (100.0%) | 0 (0.0%) |
| Foreign Born, Citizen | 85 (100.0%) | 0 (0.0%) |
| Foreign Born, not a Citizen | 20 (80.0%) | 5 (20.0%) |
Health Insurance Coverage by Household Income in Grand View
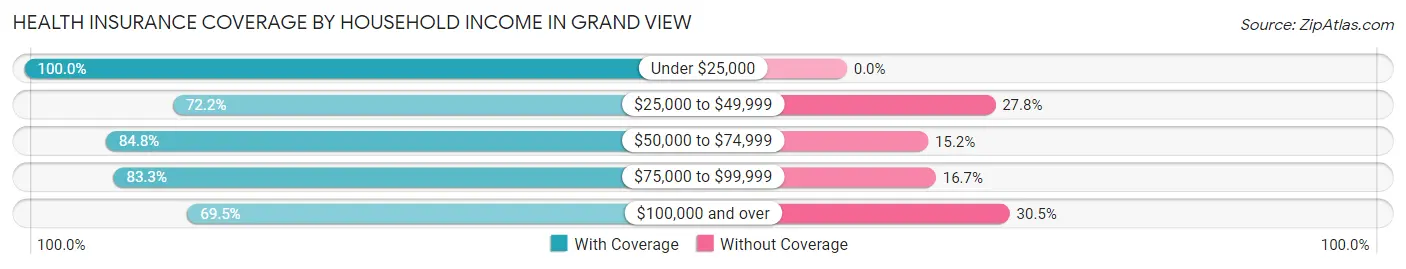
| Household Income | With Coverage | Without Coverage |
| Under $25,000 | 58 (100.0%) | 0 (0.0%) |
| $25,000 to $49,999 | 122 (72.2%) | 47 (27.8%) |
| $50,000 to $74,999 | 139 (84.8%) | 25 (15.2%) |
| $75,000 to $99,999 | 20 (83.3%) | 4 (16.7%) |
| $100,000 and over | 41 (69.5%) | 18 (30.5%) |
Public vs Private Health Insurance Coverage by Age in Grand View
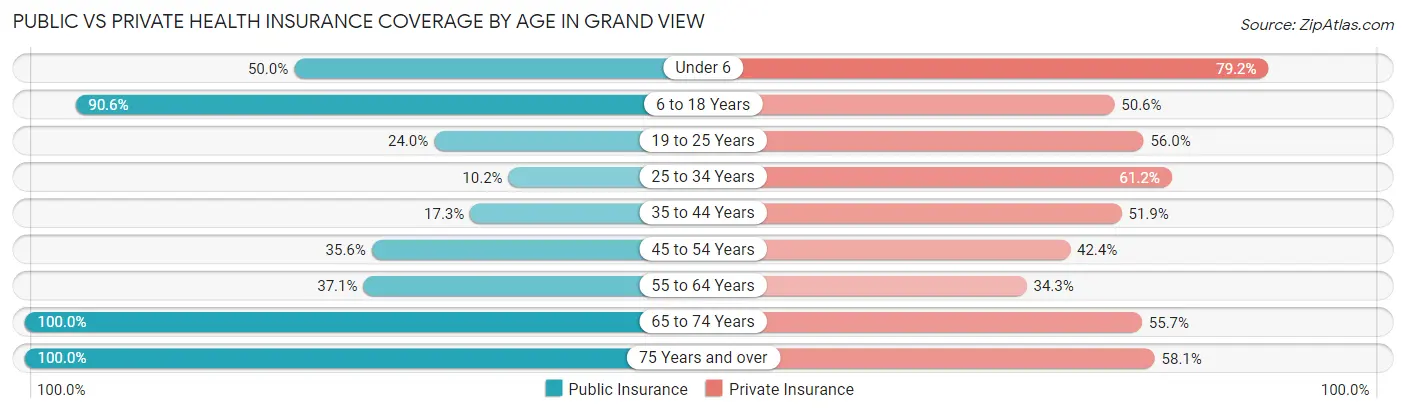
| Age Bracket | Public Insurance | Private Insurance |
| Under 6 | 12 (50.0%) | 19 (79.2%) |
| 6 to 18 Years | 77 (90.6%) | 43 (50.6%) |
| 19 to 25 Years | 6 (24.0%) | 14 (56.0%) |
| 25 to 34 Years | 5 (10.2%) | 30 (61.2%) |
| 35 to 44 Years | 9 (17.3%) | 27 (51.9%) |
| 45 to 54 Years | 21 (35.6%) | 25 (42.4%) |
| 55 to 64 Years | 26 (37.1%) | 24 (34.3%) |
| 65 to 74 Years | 79 (100.0%) | 44 (55.7%) |
| 75 Years and over | 31 (100.0%) | 18 (58.1%) |
| Total | 266 (56.1%) | 244 (51.5%) |
Disability Status by Sex by Age in Grand View
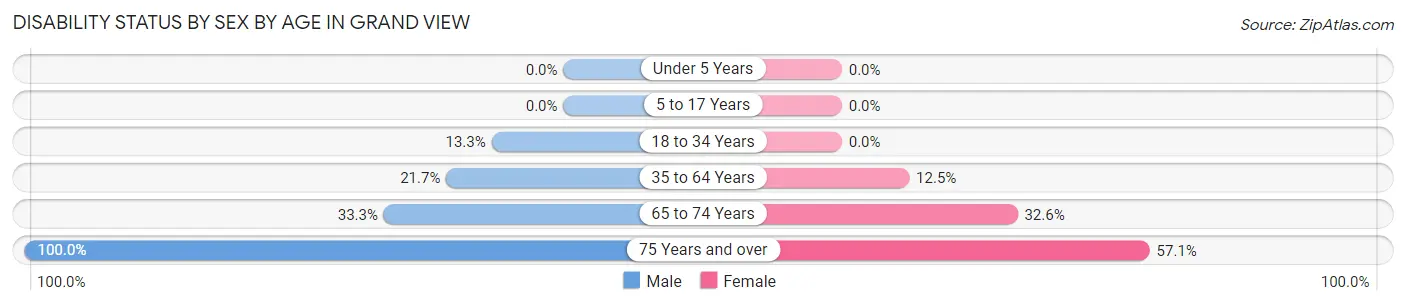
| Age Bracket | Male | Female |
| Under 5 Years | 0 (0.0%) | 0 (0.0%) |
| 5 to 17 Years | 0 (0.0%) | 0 (0.0%) |
| 18 to 34 Years | 6 (13.3%) | 0 (0.0%) |
| 35 to 64 Years | 15 (21.7%) | 14 (12.5%) |
| 65 to 74 Years | 11 (33.3%) | 15 (32.6%) |
| 75 Years and over | 10 (100.0%) | 12 (57.1%) |
Disability Class by Sex by Age in Grand View
Disability Class: Hearing Difficulty
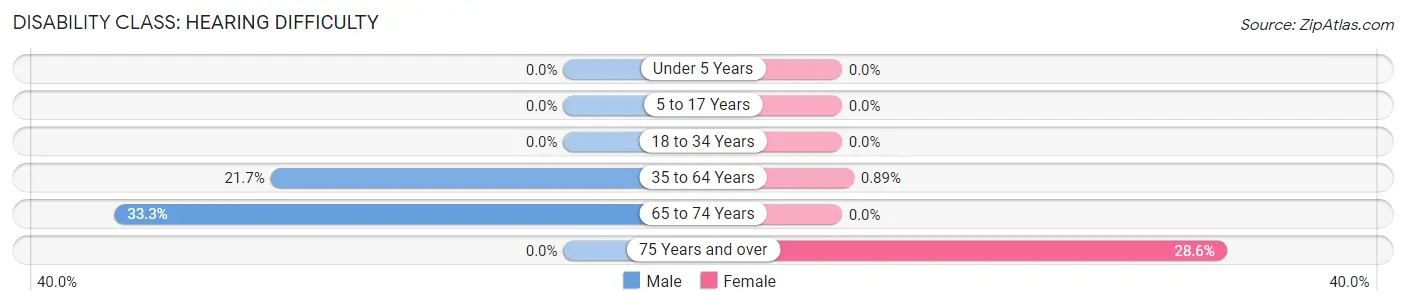
| Age Bracket | Male | Female |
| Under 5 Years | 0 (0.0%) | 0 (0.0%) |
| 5 to 17 Years | 0 (0.0%) | 0 (0.0%) |
| 18 to 34 Years | 0 (0.0%) | 0 (0.0%) |
| 35 to 64 Years | 15 (21.7%) | 1 (0.9%) |
| 65 to 74 Years | 11 (33.3%) | 0 (0.0%) |
| 75 Years and over | 0 (0.0%) | 6 (28.6%) |
Disability Class: Vision Difficulty
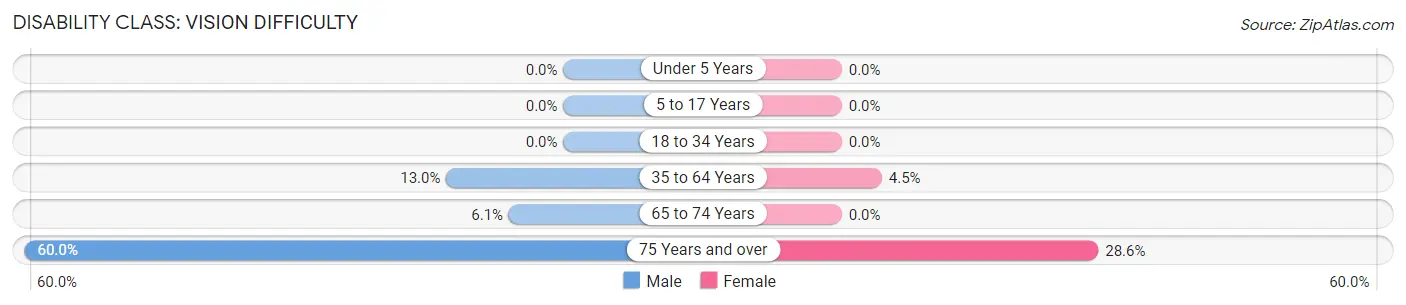
| Age Bracket | Male | Female |
| Under 5 Years | 0 (0.0%) | 0 (0.0%) |
| 5 to 17 Years | 0 (0.0%) | 0 (0.0%) |
| 18 to 34 Years | 0 (0.0%) | 0 (0.0%) |
| 35 to 64 Years | 9 (13.0%) | 5 (4.5%) |
| 65 to 74 Years | 2 (6.1%) | 0 (0.0%) |
| 75 Years and over | 6 (60.0%) | 6 (28.6%) |
Disability Class: Cognitive Difficulty
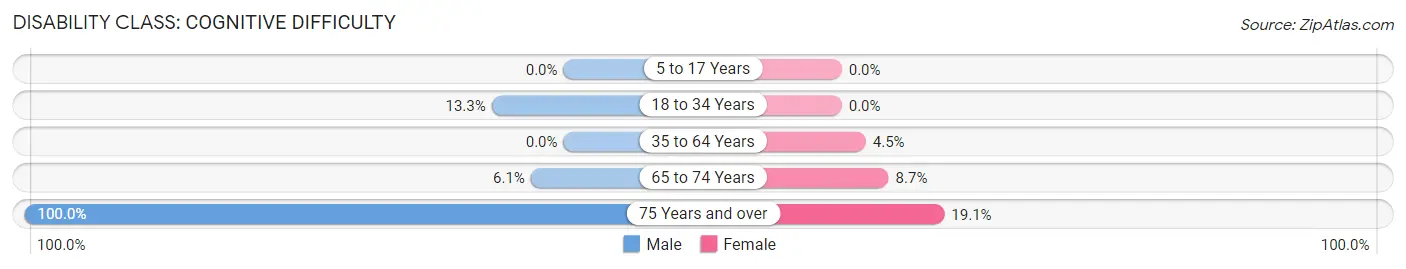
| Age Bracket | Male | Female |
| 5 to 17 Years | 0 (0.0%) | 0 (0.0%) |
| 18 to 34 Years | 6 (13.3%) | 0 (0.0%) |
| 35 to 64 Years | 0 (0.0%) | 5 (4.5%) |
| 65 to 74 Years | 2 (6.1%) | 4 (8.7%) |
| 75 Years and over | 10 (100.0%) | 4 (19.1%) |
Disability Class: Ambulatory Difficulty
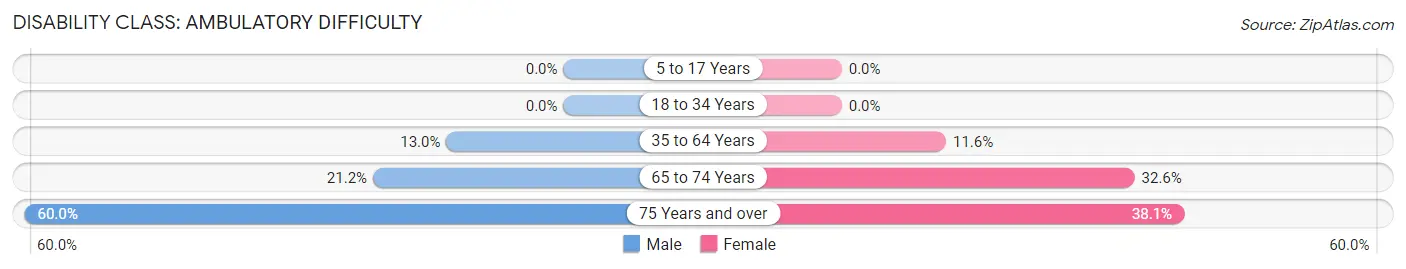
| Age Bracket | Male | Female |
| 5 to 17 Years | 0 (0.0%) | 0 (0.0%) |
| 18 to 34 Years | 0 (0.0%) | 0 (0.0%) |
| 35 to 64 Years | 9 (13.0%) | 13 (11.6%) |
| 65 to 74 Years | 7 (21.2%) | 15 (32.6%) |
| 75 Years and over | 6 (60.0%) | 8 (38.1%) |
Disability Class: Self-Care Difficulty
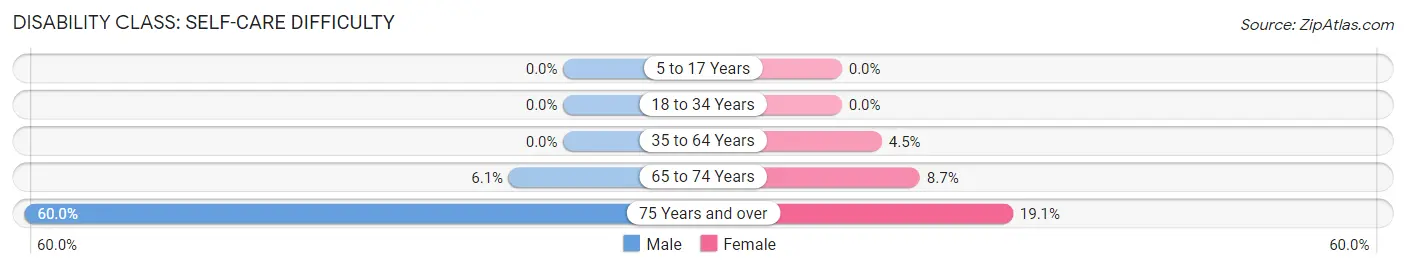
| Age Bracket | Male | Female |
| 5 to 17 Years | 0 (0.0%) | 0 (0.0%) |
| 18 to 34 Years | 0 (0.0%) | 0 (0.0%) |
| 35 to 64 Years | 0 (0.0%) | 5 (4.5%) |
| 65 to 74 Years | 2 (6.1%) | 4 (8.7%) |
| 75 Years and over | 6 (60.0%) | 4 (19.1%) |
Technology Access in Grand View
Computing Device Access in Grand View
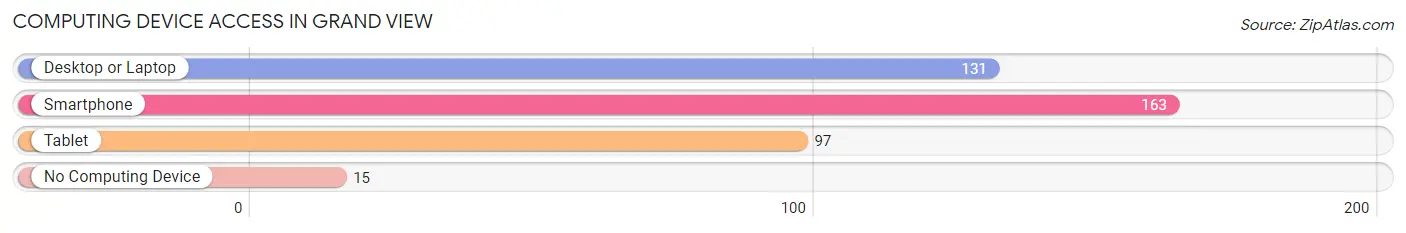
| Device Type | # Households | % Households |
| Desktop or Laptop | 131 | 63.6% |
| Smartphone | 163 | 79.1% |
| Tablet | 97 | 47.1% |
| No Computing Device | 15 | 7.3% |
| Total | 206 | 100.0% |
Internet Access in Grand View
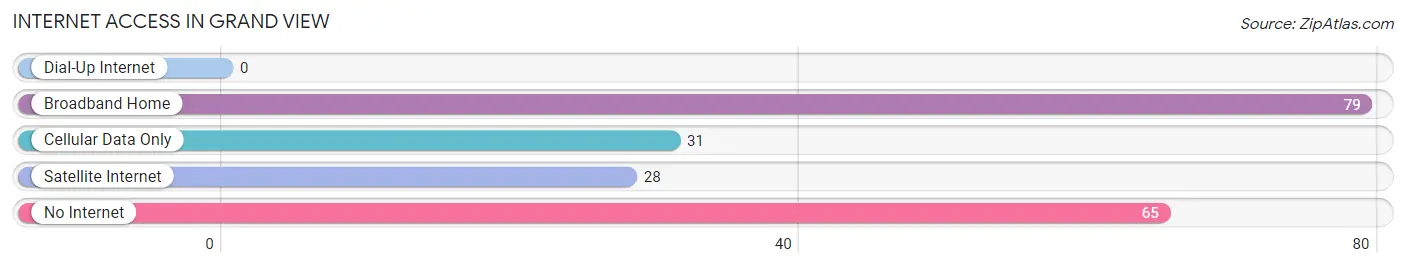
| Internet Type | # Households | % Households |
| Dial-Up Internet | 0 | 0.0% |
| Broadband Home | 79 | 38.4% |
| Cellular Data Only | 31 | 15.0% |
| Satellite Internet | 28 | 13.6% |
| No Internet | 65 | 31.6% |
| Total | 206 | 100.0% |
Grand View Summary
Geography
Grand View is a small city located in Owyhee County, Idaho. It is situated in the southwestern corner of the state, near the Nevada border. The city is located in the Snake River Plain, a large area of flat land that stretches across the state. The city is surrounded by rolling hills and mountains, including the Owyhee Mountains to the east and the Bruneau Mountains to the west. The city is located at an elevation of 4,400 feet above sea level.
The climate in Grand View is semi-arid, with hot summers and cold winters. The average high temperature in the summer is around 90 degrees Fahrenheit, while the average low temperature in the winter is around 20 degrees Fahrenheit. The city receives an average of 8 inches of precipitation per year, with most of it falling in the winter months.
History
Grand View was founded in 1883 by a group of settlers from the nearby town of Silver City. The settlers were looking for a place to settle and farm, and they chose the area around Grand View because of its fertile soil and abundant water. The town was originally called Grand View Ranch, but the name was changed to Grand View in 1887.
The town grew slowly over the years, and by the early 1900s it had become a thriving agricultural community. The town was home to several businesses, including a general store, a hotel, a bank, and a post office.
In the 1950s, the town began to decline as many of its residents moved away in search of better economic opportunities. The population of Grand View dropped from over 500 in 1950 to just over 200 in 2000.
Economy
The economy of Grand View is largely based on agriculture. The city is home to several farms, which produce a variety of crops, including potatoes, alfalfa, and wheat. The city is also home to several small businesses, including a grocery store, a hardware store, and a restaurant.
The city is also home to a small manufacturing sector, which produces a variety of products, including furniture, clothing, and electronics. The city is also home to a small tourism industry, which attracts visitors from around the state and beyond.
Demographics
As of the 2010 census, the population of Grand View was 1,845. The racial makeup of the city was 95.3% White, 0.7% Native American, 0.3% Asian, 0.2% African American, and 3.5% from other races. The median household income in the city was $35,000, and the median age was 38.
Grand View is a small, rural community with a strong sense of community. The city is home to several churches, a library, and a community center. The city is also home to a variety of recreational activities, including fishing, hunting, and camping.
Common Questions
What is Per Capita Income in Grand View?
Per Capita income in Grand View is $24,263.
What is the Median Family Income in Grand View?
Median Family Income in Grand View is $59,479.
What is the Median Household income in Grand View?
Median Household Income in Grand View is $39,722.
What is Income or Wage Gap in Grand View?
Income or Wage Gap in Grand View is 12.5%.
Women in Grand View earn 87.5 cents for every dollar earned by a man.
What is Inequality or Gini Index in Grand View?
Inequality or Gini Index in Grand View is 0.40.
What is the Total Population of Grand View?
Total Population of Grand View is 485.
What is the Total Male Population of Grand View?
Total Male Population of Grand View is 239.
What is the Total Female Population of Grand View?
Total Female Population of Grand View is 246.
What is the Ratio of Males per 100 Females in Grand View?
There are 97.15 Males per 100 Females in Grand View.
What is the Ratio of Females per 100 Males in Grand View?
There are 102.93 Females per 100 Males in Grand View.
What is the Median Population Age in Grand View?
Median Population Age in Grand View is 47.4 Years.
What is the Average Family Size in Grand View
Average Family Size in Grand View is 3.1 People.
What is the Average Household Size in Grand View
Average Household Size in Grand View is 2.3 People.
How Large is the Labor Force in Grand View?
There are 223 People in the Labor Forcein in Grand View.
What is the Percentage of People in the Labor Force in Grand View?
57.0% of People are in the Labor Force in Grand View.
What is the Unemployment Rate in Grand View?
Unemployment Rate in Grand View is 8.8%.