Parkline, ID Map & Demographics
Parkline Map
Parkline Overview
$97,024
PER CAPITA INCOME
$250,001
AVG FAMILY INCOME
0.42
INEQUALITY / GINI INDEX
45
TOTAL POPULATION
27
MALE POPULATION
18
FEMALE POPULATION
150.00
MALES / 100 FEMALES
66.67
FEMALES / 100 MALES
58.5
MEDIAN AGE
2.2
AVG FAMILY SIZE
1.4
AVG HOUSEHOLD SIZE
27
LABOR FORCE [ PEOPLE ]
61.4%
PERCENT IN LABOR FORCE
Income in Parkline
Income Overview in Parkline
| Characteristic | Number | Measure |
| Per Capita Income | 45 | $97,024 |
| Median Family Income | 12 | $250,001 |
| Mean Family Income | 12 | $256,450 |
| Median Household Income | 31 | $0 |
| Mean Household Income | 31 | $135,858 |
| Income Deficit | 12 | $0 |
| Wage / Income Gap (%) | 45 | 0.00% |
| Wage / Income Gap ($) | 45 | 100.00¢ per $1 |
| Gini / Inequality Index | 45 | 0.42 |
Earnings by Sex in Parkline
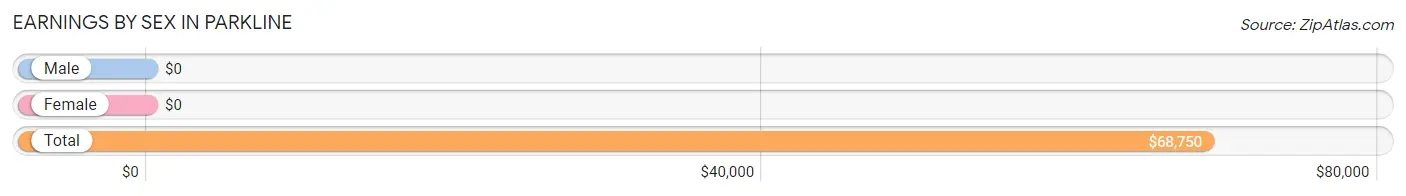
| Sex | Number | Average Earnings |
| Male | 22 (81.5%) | $0 |
| Female | 5 (18.5%) | $0 |
| Total | 27 (100.0%) | $68,750 |
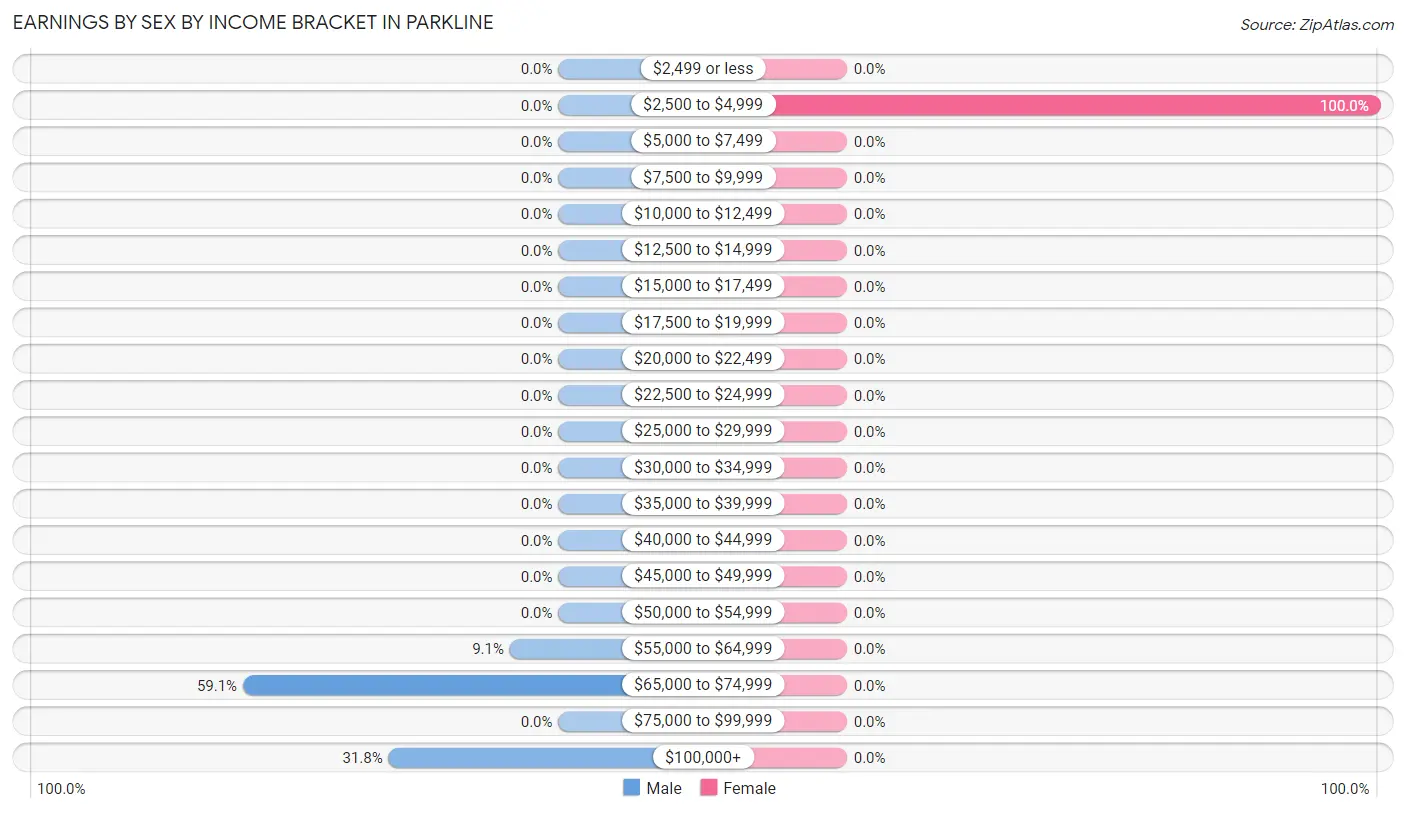
Earnings by Sex by Income Bracket in Parkline
The most common earnings brackets in Parkline are $65,000 to $74,999 for men (13 | 59.1%) and $2,500 to $4,999 for women (5 | 100.0%).
| Income | Male | Female |
| $2,499 or less | 0 (0.0%) | 0 (0.0%) |
| $2,500 to $4,999 | 0 (0.0%) | 5 (100.0%) |
| $5,000 to $7,499 | 0 (0.0%) | 0 (0.0%) |
| $7,500 to $9,999 | 0 (0.0%) | 0 (0.0%) |
| $10,000 to $12,499 | 0 (0.0%) | 0 (0.0%) |
| $12,500 to $14,999 | 0 (0.0%) | 0 (0.0%) |
| $15,000 to $17,499 | 0 (0.0%) | 0 (0.0%) |
| $17,500 to $19,999 | 0 (0.0%) | 0 (0.0%) |
| $20,000 to $22,499 | 0 (0.0%) | 0 (0.0%) |
| $22,500 to $24,999 | 0 (0.0%) | 0 (0.0%) |
| $25,000 to $29,999 | 0 (0.0%) | 0 (0.0%) |
| $30,000 to $34,999 | 0 (0.0%) | 0 (0.0%) |
| $35,000 to $39,999 | 0 (0.0%) | 0 (0.0%) |
| $40,000 to $44,999 | 0 (0.0%) | 0 (0.0%) |
| $45,000 to $49,999 | 0 (0.0%) | 0 (0.0%) |
| $50,000 to $54,999 | 0 (0.0%) | 0 (0.0%) |
| $55,000 to $64,999 | 2 (9.1%) | 0 (0.0%) |
| $65,000 to $74,999 | 13 (59.1%) | 0 (0.0%) |
| $75,000 to $99,999 | 0 (0.0%) | 0 (0.0%) |
| $100,000+ | 7 (31.8%) | 0 (0.0%) |
| Total | 22 (100.0%) | 5 (100.0%) |
Earnings by Sex by Educational Attainment in Parkline
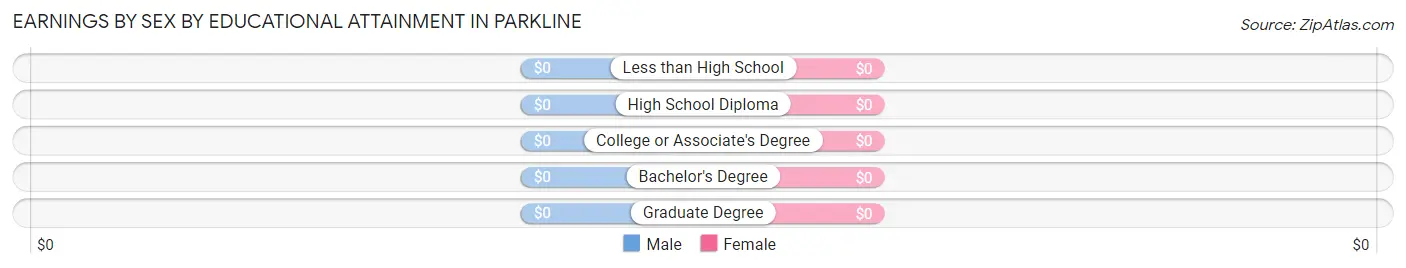
| Educational Attainment | Male Income | Female Income |
| Less than High School | - | - |
| High School Diploma | - | - |
| College or Associate's Degree | - | - |
| Bachelor's Degree | - | - |
| Graduate Degree | - | - |
| Total | - | - |
Family Income in Parkline
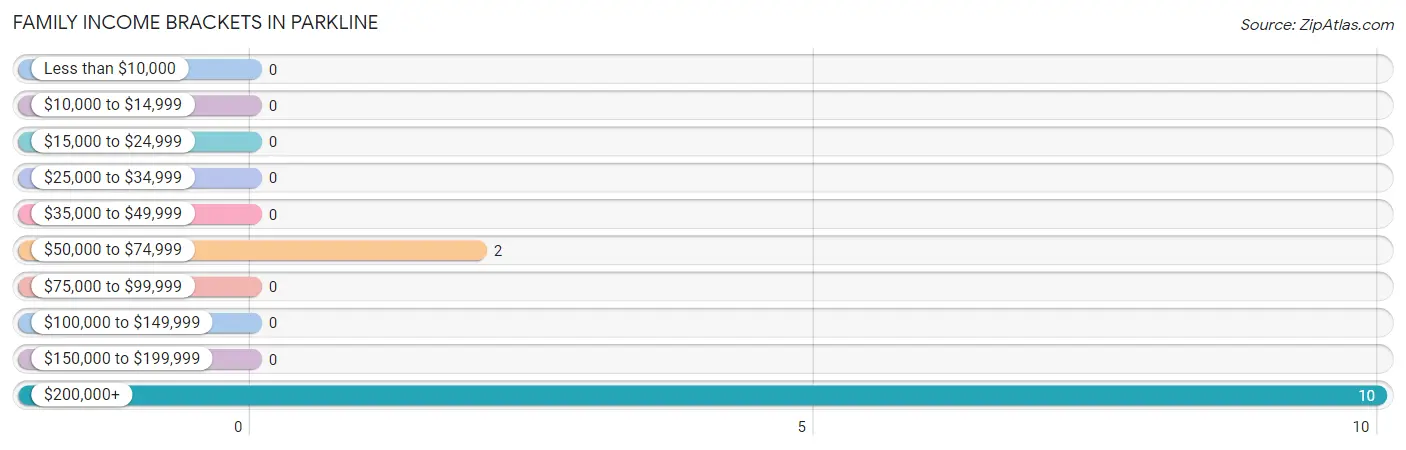
Family Income Brackets in Parkline
According to the Parkline family income data, there are 10 families falling into the $200,000+ income range, which is the most common income bracket and makes up 83.3% of all families.
| Income Bracket | # Families | % Families |
| Less than $10,000 | 0 | 0.0% |
| $10,000 to $14,999 | 0 | 0.0% |
| $15,000 to $24,999 | 0 | 0.0% |
| $25,000 to $34,999 | 0 | 0.0% |
| $35,000 to $49,999 | 0 | 0.0% |
| $50,000 to $74,999 | 2 | 16.7% |
| $75,000 to $99,999 | 0 | 0.0% |
| $100,000 to $149,999 | 0 | 0.0% |
| $150,000 to $199,999 | 0 | 0.0% |
| $200,000+ | 10 | 83.3% |
Family Income by Famaliy Size in Parkline
| Income Bracket | # Families | Median Income |
| 2-Person Families | 10 (83.3%) | $0 |
| 3-Person Families | 2 (16.7%) | $0 |
| 4-Person Families | 0 (0.0%) | $0 |
| 5-Person Families | 0 (0.0%) | $0 |
| 6-Person Families | 0 (0.0%) | $0 |
| 7+ Person Families | 0 (0.0%) | $0 |
| Total | 12 (100.0%) | $250,001 |
Family Income by Number of Earners in Parkline
| Number of Earners | # Families | Median Income |
| No Earners | 3 (25.0%) | $0 |
| 1 Earner | 2 (16.7%) | $0 |
| 2 Earners | 7 (58.3%) | $0 |
| 3+ Earners | 0 (0.0%) | $0 |
| Total | 12 (100.0%) | $250,001 |
Household Income in Parkline
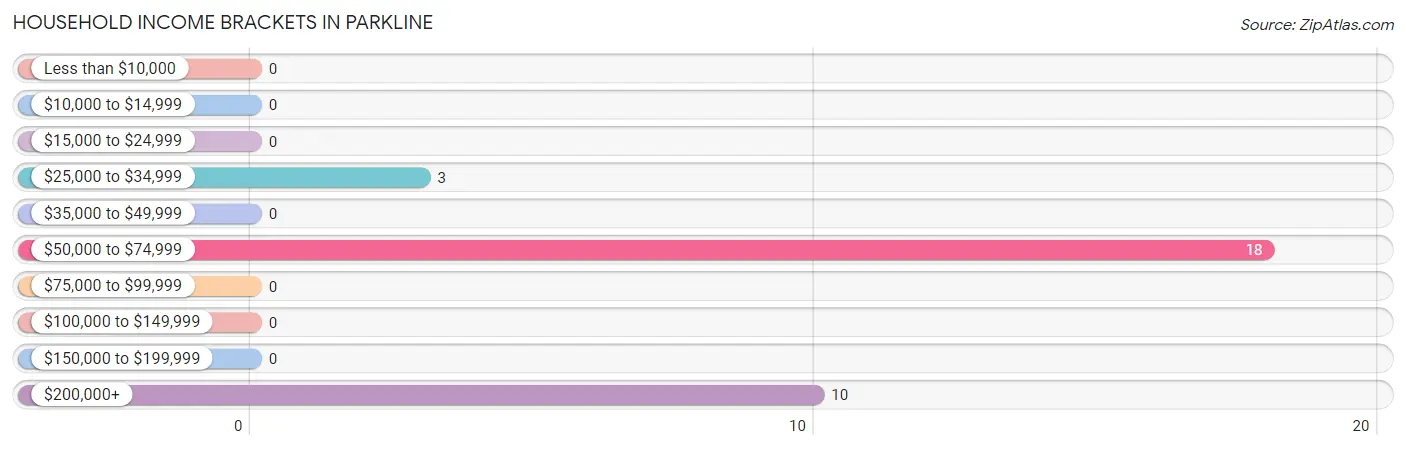
Household Income Brackets in Parkline
With 18 households falling in the category, the $50,000 to $74,999 income range is the most frequent in Parkline, accounting for 58.1% of all households.
| Income Bracket | # Households | % Households |
| Less than $10,000 | 0 | 0.0% |
| $10,000 to $14,999 | 0 | 0.0% |
| $15,000 to $24,999 | 0 | 0.0% |
| $25,000 to $34,999 | 3 | 9.7% |
| $35,000 to $49,999 | 0 | 0.0% |
| $50,000 to $74,999 | 18 | 58.1% |
| $75,000 to $99,999 | 0 | 0.0% |
| $100,000 to $149,999 | 0 | 0.0% |
| $150,000 to $199,999 | 0 | 0.0% |
| $200,000+ | 10 | 32.3% |
Household Income by Householder Age in Parkline
| Income Bracket | # Households | Median Income |
| 15 to 24 Years | 0 (0.0%) | $0 |
| 25 to 44 Years | 2 (6.5%) | $0 |
| 45 to 64 Years | 20 (64.5%) | $0 |
| 65+ Years | 9 (29.0%) | $0 |
| Total | 31 (100.0%) | $0 |
Poverty in Parkline
Income Below Poverty by Sex and Age in Parkline
| Age Bracket | Male | Female |
| Under 5 Years | 0 (0.0%) | 0 (0.0%) |
| 5 Years | 0 (0.0%) | 0 (0.0%) |
| 6 to 11 Years | 0 (0.0%) | 0 (0.0%) |
| 12 to 14 Years | 0 (0.0%) | 0 (0.0%) |
| 15 Years | 0 (0.0%) | 0 (0.0%) |
| 16 and 17 Years | 0 (0.0%) | 0 (0.0%) |
| 18 to 24 Years | 0 (0.0%) | 0 (0.0%) |
| 25 to 34 Years | 0 (0.0%) | 0 (0.0%) |
| 35 to 44 Years | 0 (0.0%) | 0 (0.0%) |
| 45 to 54 Years | 0 (0.0%) | 0 (0.0%) |
| 55 to 64 Years | 0 (0.0%) | 0 (0.0%) |
| 65 to 74 Years | 0 (0.0%) | 0 (0.0%) |
| 75 Years and over | 0 (0.0%) | 0 (0.0%) |
| Total | 0 (0.0%) | 0 (0.0%) |
Income Above Poverty by Sex and Age in Parkline
According to the poverty statistics in Parkline, males aged under 5 years and females aged 25 to 34 years are the age groups that are most secure financially, with 100.0% of males and 100.0% of females in these age groups living above the poverty line.
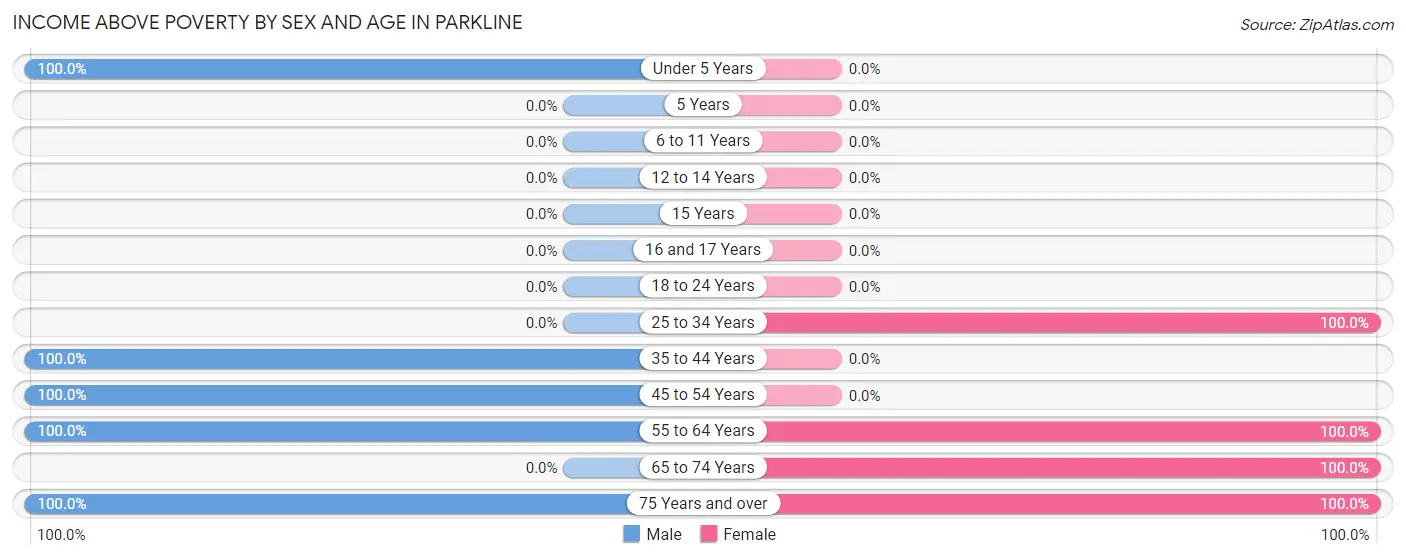
| Age Bracket | Male | Female |
| Under 5 Years | 1 (100.0%) | 0 (0.0%) |
| 5 Years | 0 (0.0%) | 0 (0.0%) |
| 6 to 11 Years | 0 (0.0%) | 0 (0.0%) |
| 12 to 14 Years | 0 (0.0%) | 0 (0.0%) |
| 15 Years | 0 (0.0%) | 0 (0.0%) |
| 16 and 17 Years | 0 (0.0%) | 0 (0.0%) |
| 18 to 24 Years | 0 (0.0%) | 0 (0.0%) |
| 25 to 34 Years | 0 (0.0%) | 4 (100.0%) |
| 35 to 44 Years | 2 (100.0%) | 0 (0.0%) |
| 45 to 54 Years | 13 (100.0%) | 0 (0.0%) |
| 55 to 64 Years | 7 (100.0%) | 5 (100.0%) |
| 65 to 74 Years | 0 (0.0%) | 3 (100.0%) |
| 75 Years and over | 4 (100.0%) | 6 (100.0%) |
| Total | 27 (100.0%) | 18 (100.0%) |
Income Below Poverty Among Married-Couple Families in Parkline
| Children | Above Poverty | Below Poverty |
| No Children | 10 (100.0%) | 0 (0.0%) |
| 1 or 2 Children | 2 (100.0%) | 0 (0.0%) |
| 3 or 4 Children | 0 (0.0%) | 0 (0.0%) |
| 5 or more Children | 0 (0.0%) | 0 (0.0%) |
| Total | 12 (100.0%) | 0 (0.0%) |
Income Below Poverty Among Single-Parent Households in Parkline
| Children | Single Father | Single Mother |
| No Children | 0 (0.0%) | 0 (0.0%) |
| 1 or 2 Children | 0 (0.0%) | 0 (0.0%) |
| 3 or 4 Children | 0 (0.0%) | 0 (0.0%) |
| 5 or more Children | 0 (0.0%) | 0 (0.0%) |
| Total | 0 (0.0%) | 0 (0.0%) |
Income Below Poverty Among Married-Couple vs Single-Parent Households in Parkline
| Children | Married-Couple Families | Single-Parent Households |
| No Children | 0 (0.0%) | 0 (0.0%) |
| 1 or 2 Children | 0 (0.0%) | 0 (0.0%) |
| 3 or 4 Children | 0 (0.0%) | 0 (0.0%) |
| 5 or more Children | 0 (0.0%) | 0 (0.0%) |
| Total | 0 (0.0%) | 0 (0.0%) |
Race in Parkline
The most populous races in Parkline are White / Caucasian (32 | 71.1%), and Some other Race (13 | 28.9%).
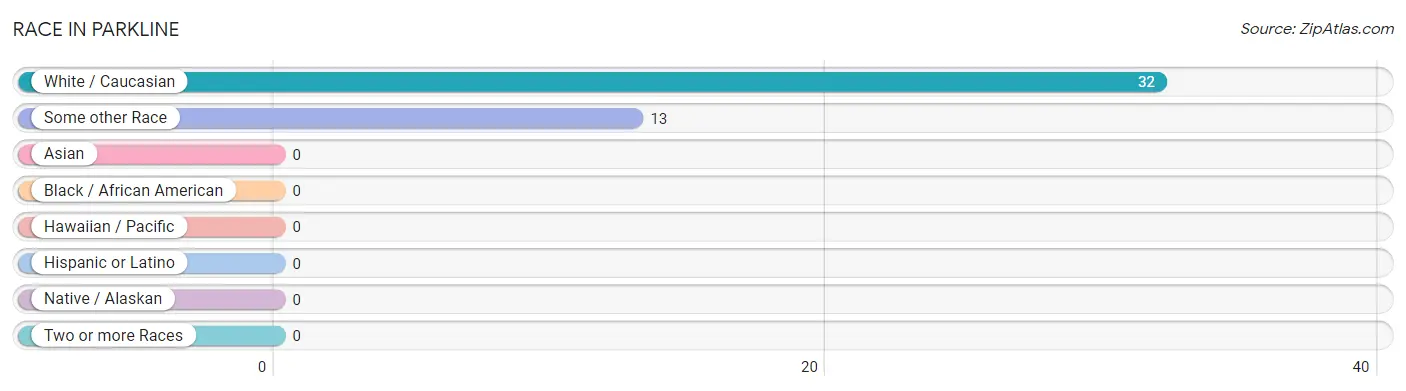
| Race | # Population | % Population |
| Asian | 0 | 0.0% |
| Black / African American | 0 | 0.0% |
| Hawaiian / Pacific | 0 | 0.0% |
| Hispanic or Latino | 0 | 0.0% |
| Native / Alaskan | 0 | 0.0% |
| White / Caucasian | 32 | 71.1% |
| Two or more Races | 0 | 0.0% |
| Some other Race | 13 | 28.9% |
| Total | 45 | 100.0% |
Ancestry in Parkline
The most populous ancestries reported in Parkline are English (8 | 17.8%), Irish (6 | 13.3%), Swedish (6 | 13.3%), Danish (4 | 8.9%), and American (3 | 6.7%), together accounting for 60.0% of all Parkline residents.
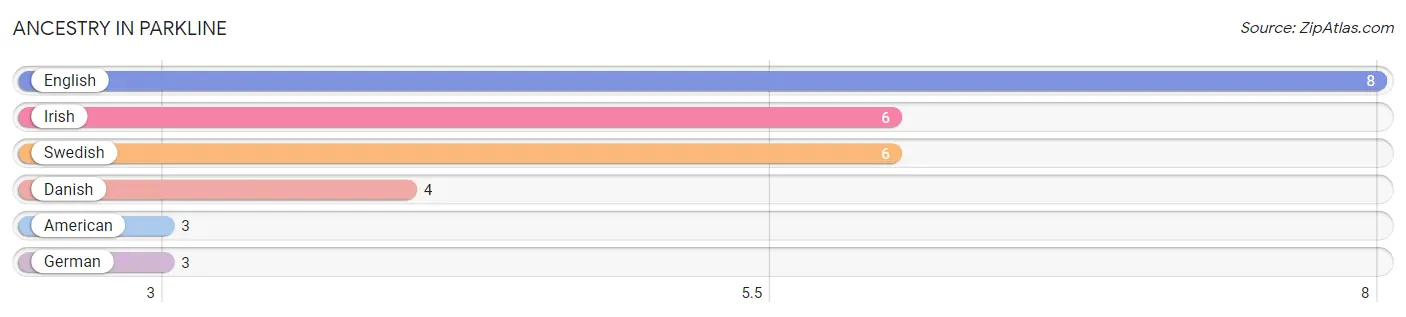
| Ancestry | # Population | % Population |
| American | 3 | 6.7% |
| Danish | 4 | 8.9% |
| English | 8 | 17.8% |
| German | 3 | 6.7% |
| Irish | 6 | 13.3% |
| Swedish | 6 | 13.3% | View All 6 Rows |
Immigrants in Parkline
The most numerous immigrant groups reported in Parkline came from , and Canada (4 | 8.9%), together accounting for 8.9% of all Parkline residents.

| Immigration Origin | # Population | % Population |
| Canada | 4 | 8.9% | View All 1 Rows |
Sex and Age in Parkline
Sex and Age in Parkline
The most populous age groups in Parkline are 50 to 54 Years (13 | 48.1%) for men and 55 to 59 Years (5 | 27.8%) for women.
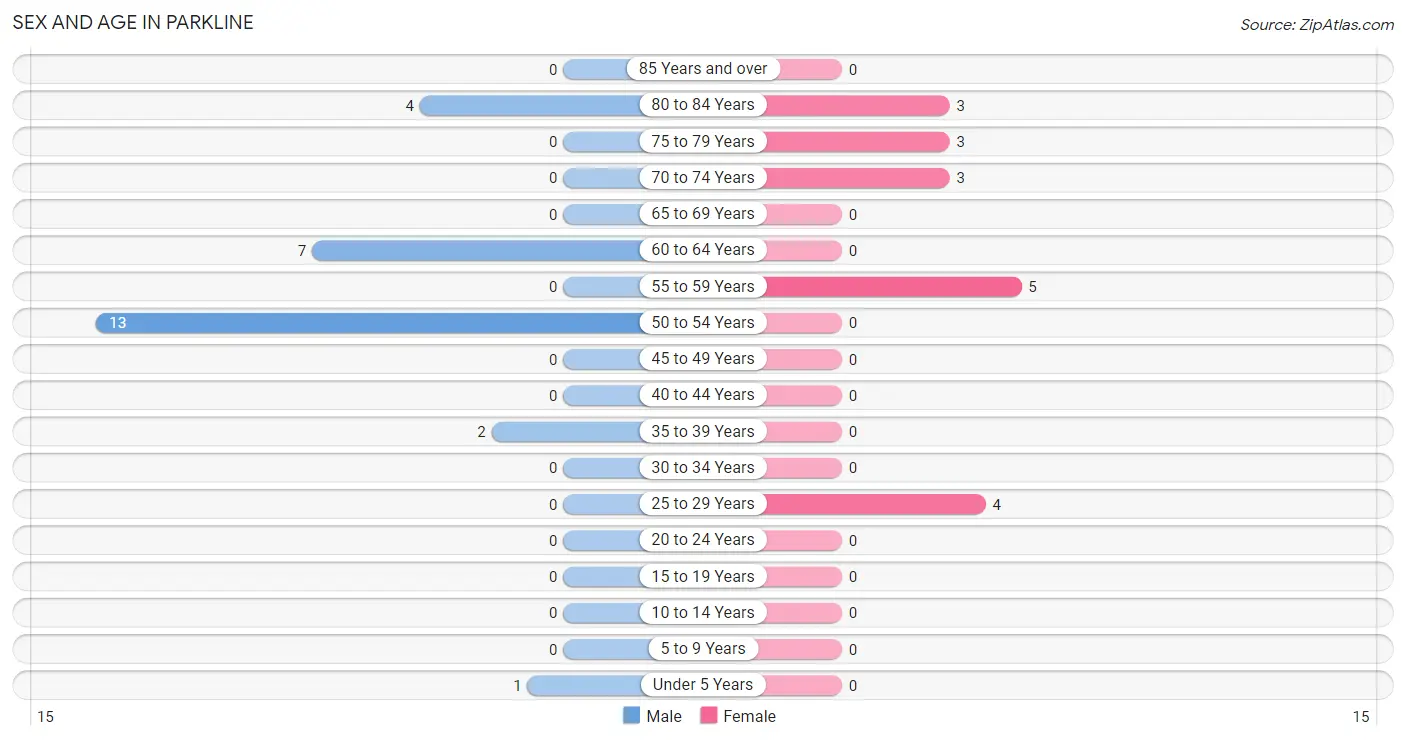
| Age Bracket | Male | Female |
| Under 5 Years | 1 (3.7%) | 0 (0.0%) |
| 5 to 9 Years | 0 (0.0%) | 0 (0.0%) |
| 10 to 14 Years | 0 (0.0%) | 0 (0.0%) |
| 15 to 19 Years | 0 (0.0%) | 0 (0.0%) |
| 20 to 24 Years | 0 (0.0%) | 0 (0.0%) |
| 25 to 29 Years | 0 (0.0%) | 4 (22.2%) |
| 30 to 34 Years | 0 (0.0%) | 0 (0.0%) |
| 35 to 39 Years | 2 (7.4%) | 0 (0.0%) |
| 40 to 44 Years | 0 (0.0%) | 0 (0.0%) |
| 45 to 49 Years | 0 (0.0%) | 0 (0.0%) |
| 50 to 54 Years | 13 (48.1%) | 0 (0.0%) |
| 55 to 59 Years | 0 (0.0%) | 5 (27.8%) |
| 60 to 64 Years | 7 (25.9%) | 0 (0.0%) |
| 65 to 69 Years | 0 (0.0%) | 0 (0.0%) |
| 70 to 74 Years | 0 (0.0%) | 3 (16.7%) |
| 75 to 79 Years | 0 (0.0%) | 3 (16.7%) |
| 80 to 84 Years | 4 (14.8%) | 3 (16.7%) |
| 85 Years and over | 0 (0.0%) | 0 (0.0%) |
| Total | 27 (100.0%) | 18 (100.0%) |
Families and Households in Parkline
Median Family Size in Parkline
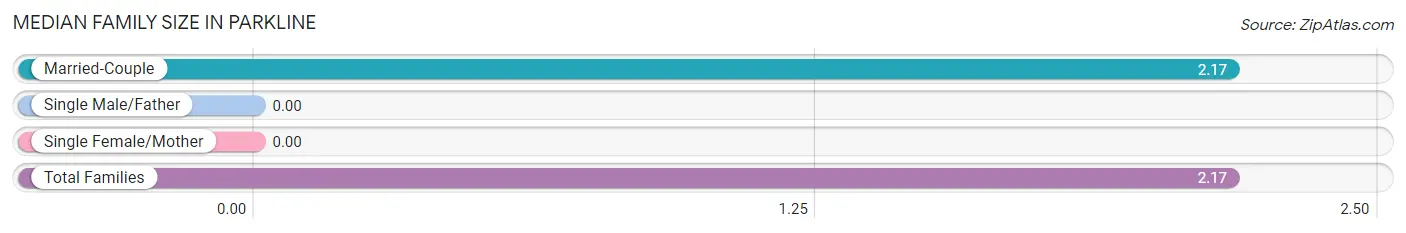
| Family Type | # Families | Family Size |
| Married-Couple | 12 (100.0%) | 2.17 |
| Single Male/Father | 0 (0.0%) | - |
| Single Female/Mother | 0 (0.0%) | - |
| Total Families | 12 (100.0%) | 2.17 |
Median Household Size in Parkline
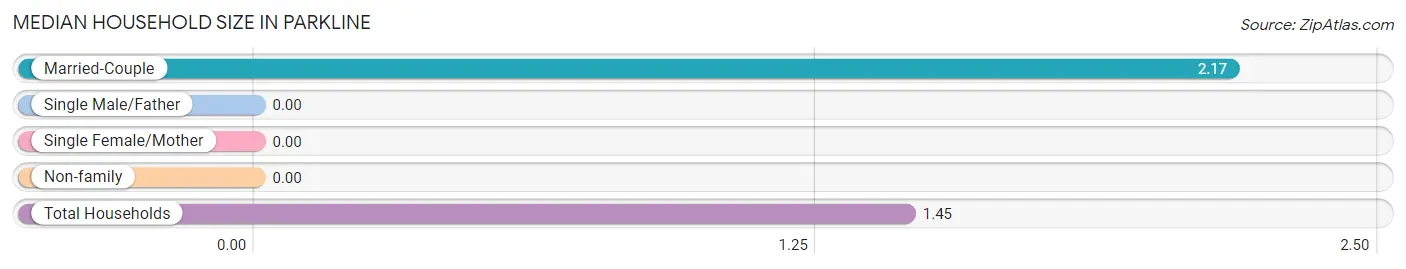
| Household Type | # Households | Household Size |
| Married-Couple | 12 (38.7%) | 2.17 |
| Single Male/Father | 0 (0.0%) | - |
| Single Female/Mother | 0 (0.0%) | - |
| Non-family | 19 (61.3%) | - |
| Total Households | 31 (100.0%) | 1.45 |
Household Size by Marriage Status in Parkline
Out of a total of 31 households in Parkline, 12 (38.7%) are family households, while 19 (61.3%) are nonfamily households. The most numerous type of family households are 2-person households, comprising 10, and the most common type of nonfamily households are 1-person households, comprising 19.
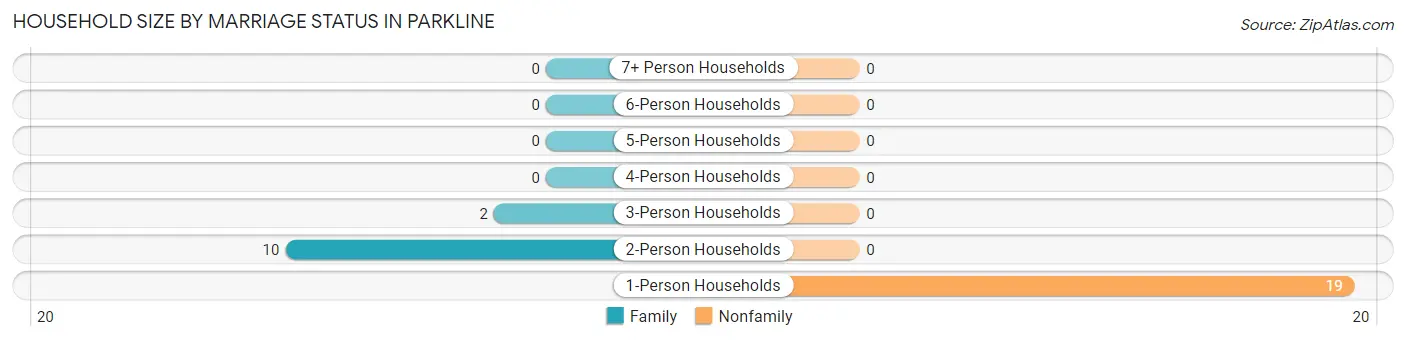
| Household Size | Family Households | Nonfamily Households |
| 1-Person Households | - | 19 (61.3%) |
| 2-Person Households | 10 (32.3%) | 0 (0.0%) |
| 3-Person Households | 2 (6.5%) | 0 (0.0%) |
| 4-Person Households | 0 (0.0%) | 0 (0.0%) |
| 5-Person Households | 0 (0.0%) | 0 (0.0%) |
| 6-Person Households | 0 (0.0%) | 0 (0.0%) |
| 7+ Person Households | 0 (0.0%) | 0 (0.0%) |
| Total | 12 (38.7%) | 19 (61.3%) |
Female Fertility in Parkline
Fertility by Age in Parkline
| Age Bracket | Women with Births | Births / 1,000 Women |
| 15 to 19 years | 0 (0.0%) | 0.0 |
| 20 to 34 years | 0 (0.0%) | 0.0 |
| 35 to 50 years | 0 (0.0%) | 0.0 |
| Total | 0 (0.0%) | 0.0 |
Fertility by Age by Marriage Status in Parkline
| Age Bracket | Married | Unmarried |
| 15 to 19 years | 0 (0.0%) | 0 (0.0%) |
| 20 to 34 years | 0 (0.0%) | 0 (0.0%) |
| 35 to 50 years | 0 (0.0%) | 0 (0.0%) |
| Total | 0 (0.0%) | 0 (0.0%) |
Fertility by Education in Parkline
| Educational Attainment | Women with Births | Births / 1,000 Women |
| Less than High School | 0 (0.0%) | 0.0 |
| High School Diploma | 0 (0.0%) | 0.0 |
| College or Associate's Degree | 0 (0.0%) | 0.0 |
| Bachelor's Degree | 0 (0.0%) | 0.0 |
| Graduate Degree | 0 (0.0%) | 0.0 |
| Total | 0 (0.0%) | 0.0 |
Fertility by Education by Marriage Status in Parkline
| Educational Attainment | Married | Unmarried |
| Less than High School | 0 (0.0%) | 0 (0.0%) |
| High School Diploma | 0 (0.0%) | 0 (0.0%) |
| College or Associate's Degree | 0 (0.0%) | 0 (0.0%) |
| Bachelor's Degree | 0 (0.0%) | 0 (0.0%) |
| Graduate Degree | 0 (0.0%) | 0 (0.0%) |
| Total | 0 (0.0%) | 0 (0.0%) |
Employment Characteristics in Parkline
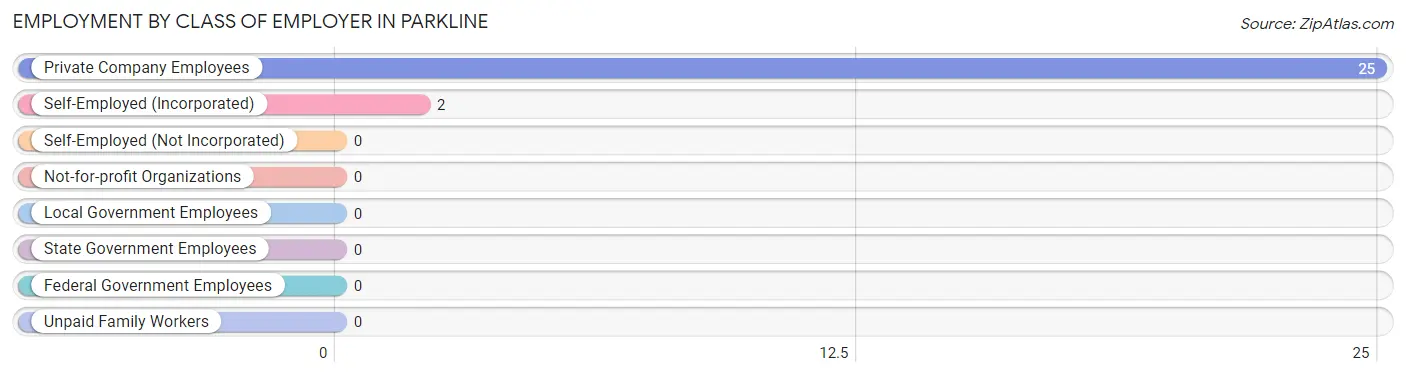
Employment by Class of Employer in Parkline
Among the 27 employed individuals in Parkline, private company employees (25 | 92.6%), and self-employed (incorporated) (2 | 7.4%) make up the most common classes of employment.
| Employer Class | # Employees | % Employees |
| Private Company Employees | 25 | 92.6% |
| Self-Employed (Incorporated) | 2 | 7.4% |
| Self-Employed (Not Incorporated) | 0 | 0.0% |
| Not-for-profit Organizations | 0 | 0.0% |
| Local Government Employees | 0 | 0.0% |
| State Government Employees | 0 | 0.0% |
| Federal Government Employees | 0 | 0.0% |
| Unpaid Family Workers | 0 | 0.0% |
| Total | 27 | 100.0% |
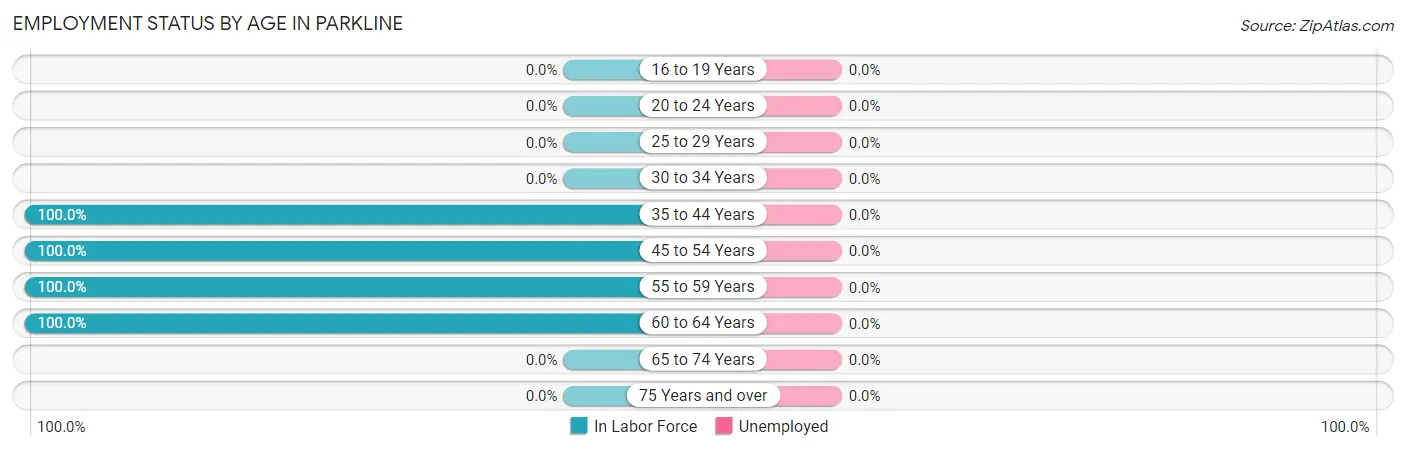
Employment Status by Age in Parkline
| Age Bracket | In Labor Force | Unemployed |
| 16 to 19 Years | 0 (0.0%) | 0 (0.0%) |
| 20 to 24 Years | 0 (0.0%) | 0 (0.0%) |
| 25 to 29 Years | 0 (0.0%) | 0 (0.0%) |
| 30 to 34 Years | 0 (0.0%) | 0 (0.0%) |
| 35 to 44 Years | 2 (100.0%) | 0 (0.0%) |
| 45 to 54 Years | 13 (100.0%) | 0 (0.0%) |
| 55 to 59 Years | 5 (100.0%) | 0 (0.0%) |
| 60 to 64 Years | 7 (100.0%) | 0 (0.0%) |
| 65 to 74 Years | 0 (0.0%) | 0 (0.0%) |
| 75 Years and over | 0 (0.0%) | 0 (0.0%) |
| Total | 27 (61.4%) | 0 (0.0%) |
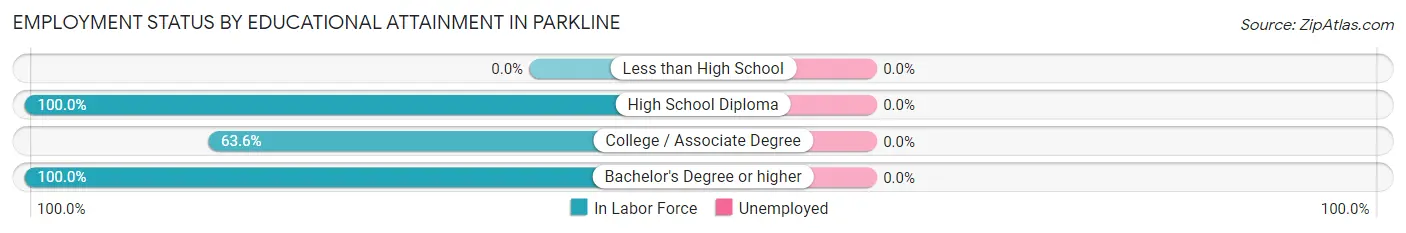
Employment Status by Educational Attainment in Parkline
| Educational Attainment | In Labor Force | Unemployed |
| Less than High School | 0 (0.0%) | 0 (0.0%) |
| High School Diploma | 13 (100.0%) | 0 (0.0%) |
| College / Associate Degree | 7 (63.6%) | 0 (0.0%) |
| Bachelor's Degree or higher | 7 (100.0%) | 0 (0.0%) |
| Total | 27 (87.1%) | 0 (0.0%) |
Employment Occupations by Sex in Parkline
Management, Business, Science and Arts Occupations
The most common Management, Business, Science and Arts occupations in Parkline are , and Management (9 | 33.3%).
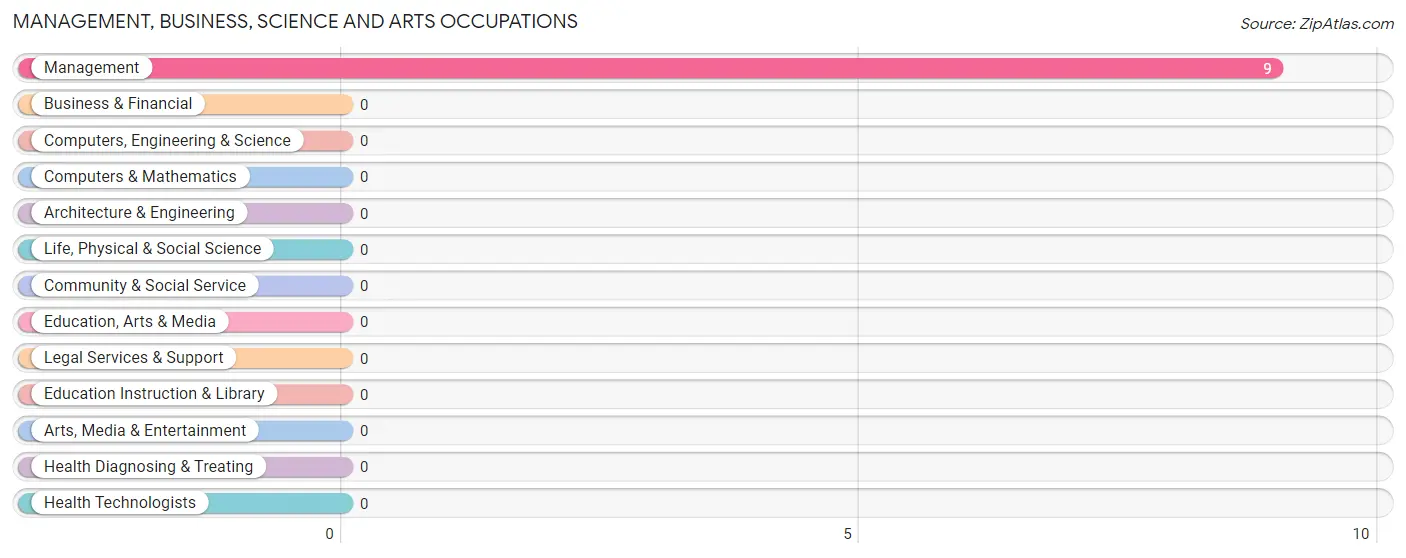
Management, Business, Science and Arts Occupations by Sex
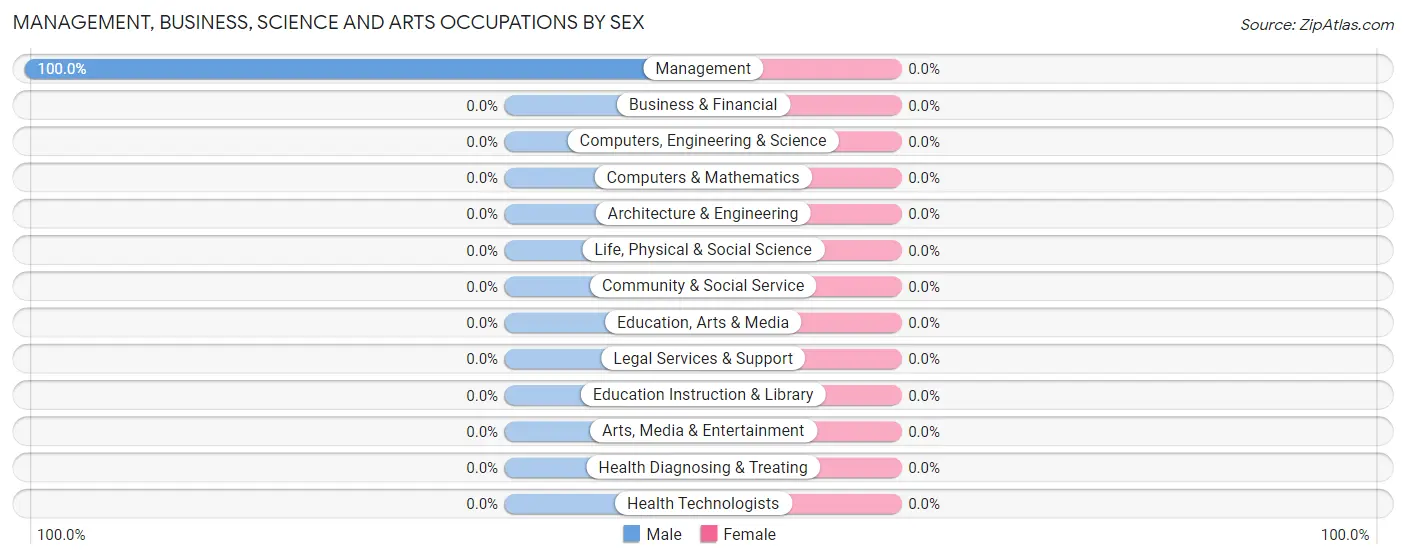
| Occupation | Male | Female |
| Management | 9 (100.0%) | 0 (0.0%) |
| Business & Financial | 0 (0.0%) | 0 (0.0%) |
| Computers, Engineering & Science | 0 (0.0%) | 0 (0.0%) |
| Computers & Mathematics | 0 (0.0%) | 0 (0.0%) |
| Architecture & Engineering | 0 (0.0%) | 0 (0.0%) |
| Life, Physical & Social Science | 0 (0.0%) | 0 (0.0%) |
| Community & Social Service | 0 (0.0%) | 0 (0.0%) |
| Education, Arts & Media | 0 (0.0%) | 0 (0.0%) |
| Legal Services & Support | 0 (0.0%) | 0 (0.0%) |
| Education Instruction & Library | 0 (0.0%) | 0 (0.0%) |
| Arts, Media & Entertainment | 0 (0.0%) | 0 (0.0%) |
| Health Diagnosing & Treating | 0 (0.0%) | 0 (0.0%) |
| Health Technologists | 0 (0.0%) | 0 (0.0%) |
| Total (Category) | 9 (100.0%) | 0 (0.0%) |
| Total (Overall) | 22 (81.5%) | 5 (18.5%) |
Services Occupations
The most common Services occupations in Parkline are Security & Protection (5 | 18.5%), and Firefighting & Prevention (5 | 18.5%).
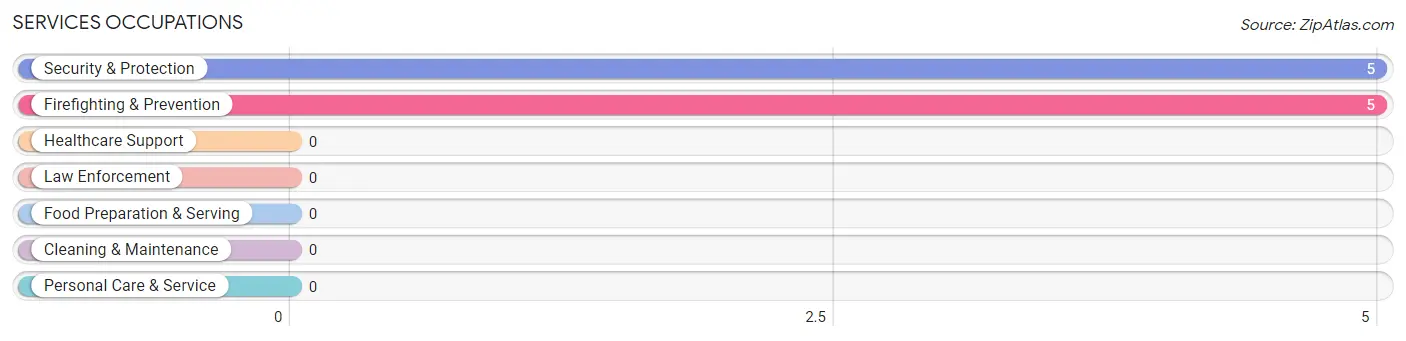
Services Occupations by Sex
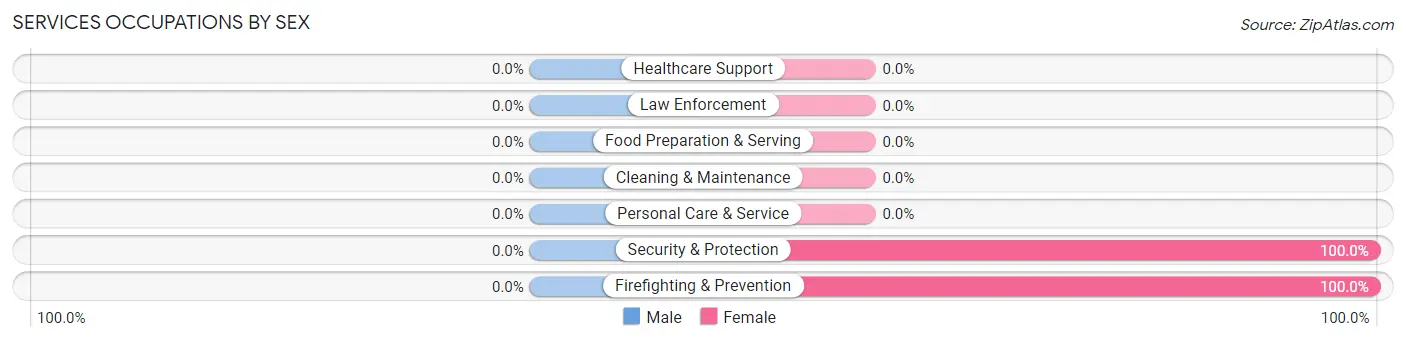
| Occupation | Male | Female |
| Healthcare Support | 0 (0.0%) | 0 (0.0%) |
| Security & Protection | 0 (0.0%) | 5 (100.0%) |
| Firefighting & Prevention | 0 (0.0%) | 5 (100.0%) |
| Law Enforcement | 0 (0.0%) | 0 (0.0%) |
| Food Preparation & Serving | 0 (0.0%) | 0 (0.0%) |
| Cleaning & Maintenance | 0 (0.0%) | 0 (0.0%) |
| Personal Care & Service | 0 (0.0%) | 0 (0.0%) |
| Total (Category) | 0 (0.0%) | 5 (100.0%) |
| Total (Overall) | 22 (81.5%) | 5 (18.5%) |
Sales and Office Occupations
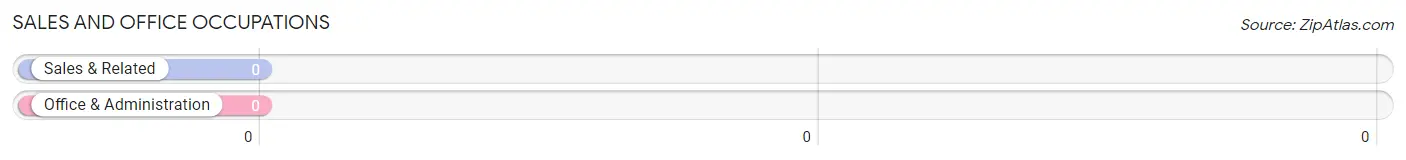
Sales and Office Occupations by Sex
| Occupation | Male | Female |
| Sales & Related | 0 (0.0%) | 0 (0.0%) |
| Office & Administration | 0 (0.0%) | 0 (0.0%) |
| Total (Category) | 0 (0.0%) | 0 (0.0%) |
| Total (Overall) | 22 (81.5%) | 5 (18.5%) |
Natural Resources, Construction and Maintenance Occupations
Natural Resources, Construction and Maintenance Occupations by Sex
| Occupation | Male | Female |
| Farming, Fishing & Forestry | 0 (0.0%) | 0 (0.0%) |
| Construction & Extraction | 0 (0.0%) | 0 (0.0%) |
| Installation, Maintenance & Repair | 0 (0.0%) | 0 (0.0%) |
| Total (Category) | 0 (0.0%) | 0 (0.0%) |
| Total (Overall) | 22 (81.5%) | 5 (18.5%) |
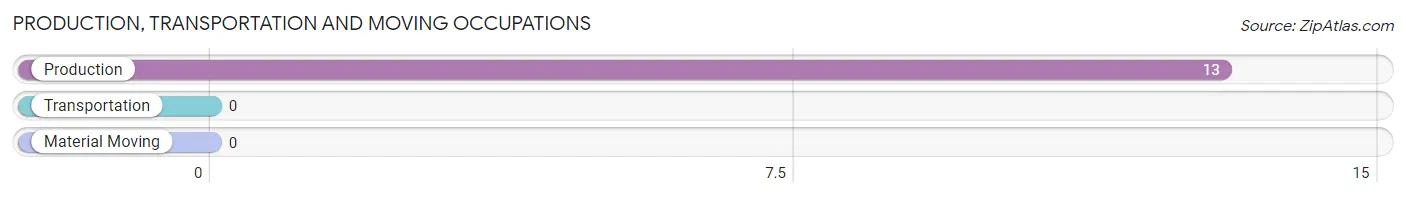
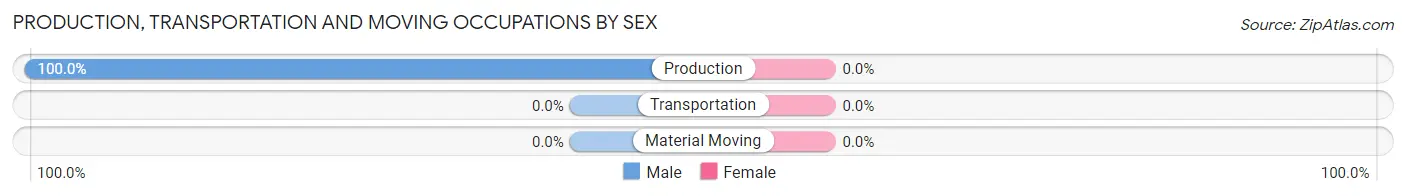
Production, Transportation and Moving Occupations
The most common Production, Transportation and Moving occupations in Parkline are , and Production (13 | 48.1%).
Production, Transportation and Moving Occupations by Sex
| Occupation | Male | Female |
| Production | 13 (100.0%) | 0 (0.0%) |
| Transportation | 0 (0.0%) | 0 (0.0%) |
| Material Moving | 0 (0.0%) | 0 (0.0%) |
| Total (Category) | 13 (100.0%) | 0 (0.0%) |
| Total (Overall) | 22 (81.5%) | 5 (18.5%) |
Employment Industries by Sex in Parkline
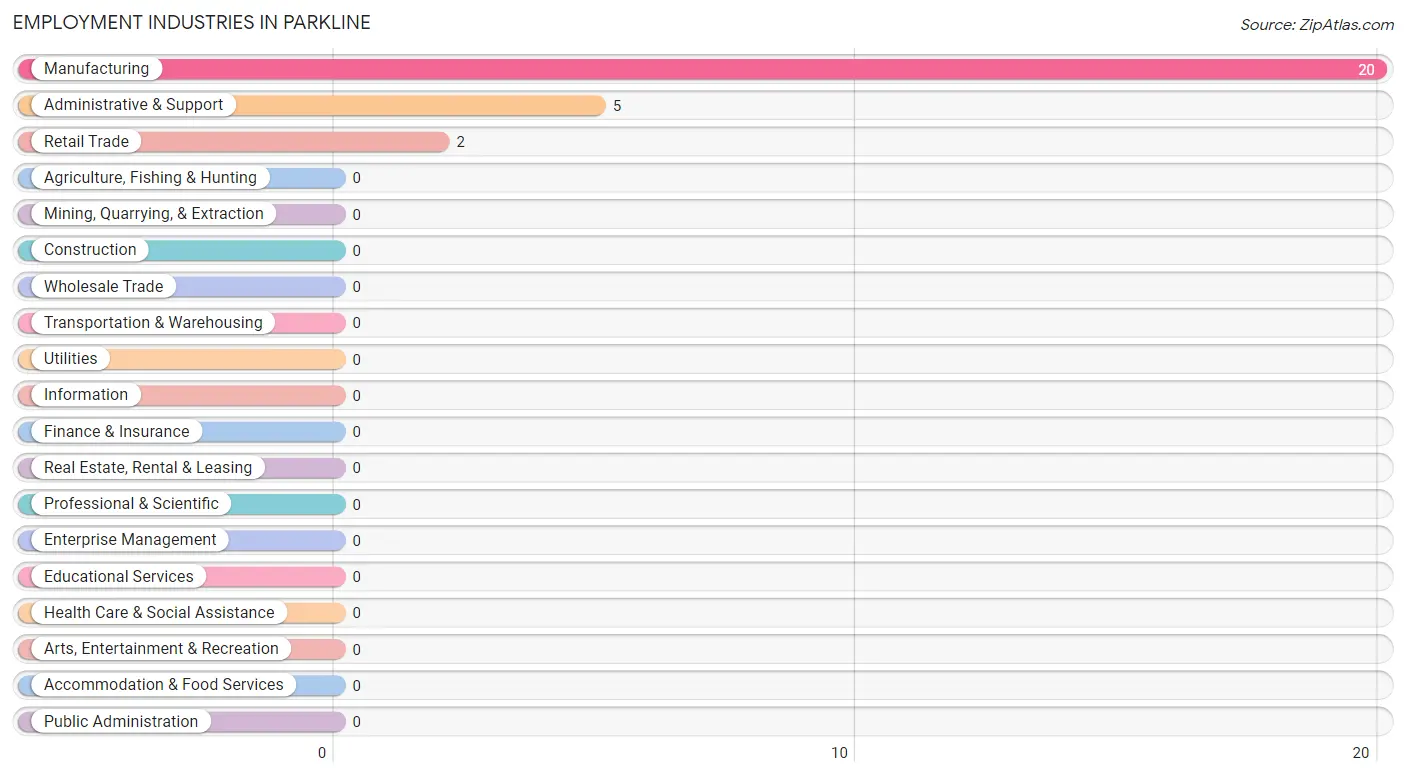
Employment Industries in Parkline
The major employment industries in Parkline include Manufacturing (20 | 74.1%), Administrative & Support (5 | 18.5%), and Retail Trade (2 | 7.4%).
Employment Industries by Sex in Parkline
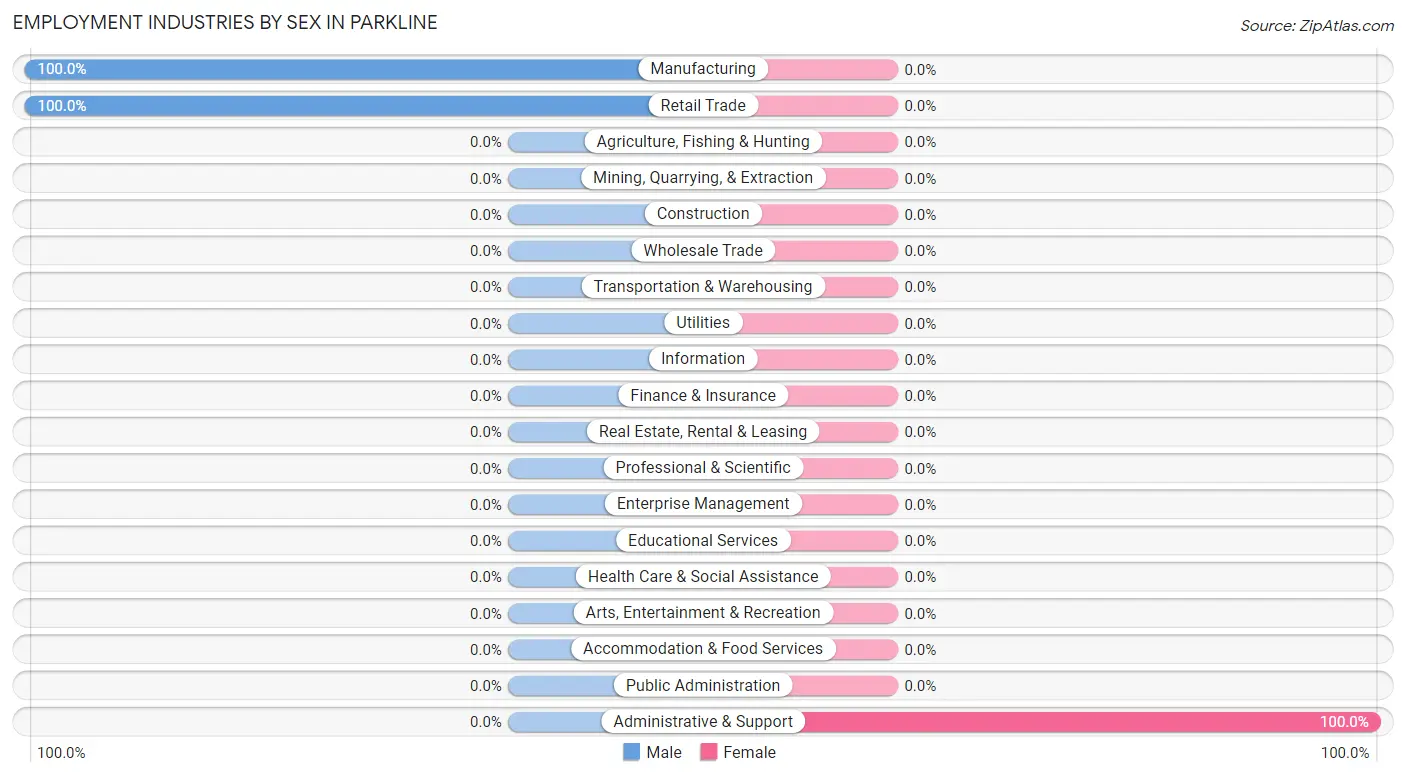
| Industry | Male | Female |
| Agriculture, Fishing & Hunting | 0 (0.0%) | 0 (0.0%) |
| Mining, Quarrying, & Extraction | 0 (0.0%) | 0 (0.0%) |
| Construction | 0 (0.0%) | 0 (0.0%) |
| Manufacturing | 20 (100.0%) | 0 (0.0%) |
| Wholesale Trade | 0 (0.0%) | 0 (0.0%) |
| Retail Trade | 2 (100.0%) | 0 (0.0%) |
| Transportation & Warehousing | 0 (0.0%) | 0 (0.0%) |
| Utilities | 0 (0.0%) | 0 (0.0%) |
| Information | 0 (0.0%) | 0 (0.0%) |
| Finance & Insurance | 0 (0.0%) | 0 (0.0%) |
| Real Estate, Rental & Leasing | 0 (0.0%) | 0 (0.0%) |
| Professional & Scientific | 0 (0.0%) | 0 (0.0%) |
| Enterprise Management | 0 (0.0%) | 0 (0.0%) |
| Administrative & Support | 0 (0.0%) | 5 (100.0%) |
| Educational Services | 0 (0.0%) | 0 (0.0%) |
| Health Care & Social Assistance | 0 (0.0%) | 0 (0.0%) |
| Arts, Entertainment & Recreation | 0 (0.0%) | 0 (0.0%) |
| Accommodation & Food Services | 0 (0.0%) | 0 (0.0%) |
| Public Administration | 0 (0.0%) | 0 (0.0%) |
| Total | 22 (81.5%) | 5 (18.5%) |
Education in Parkline
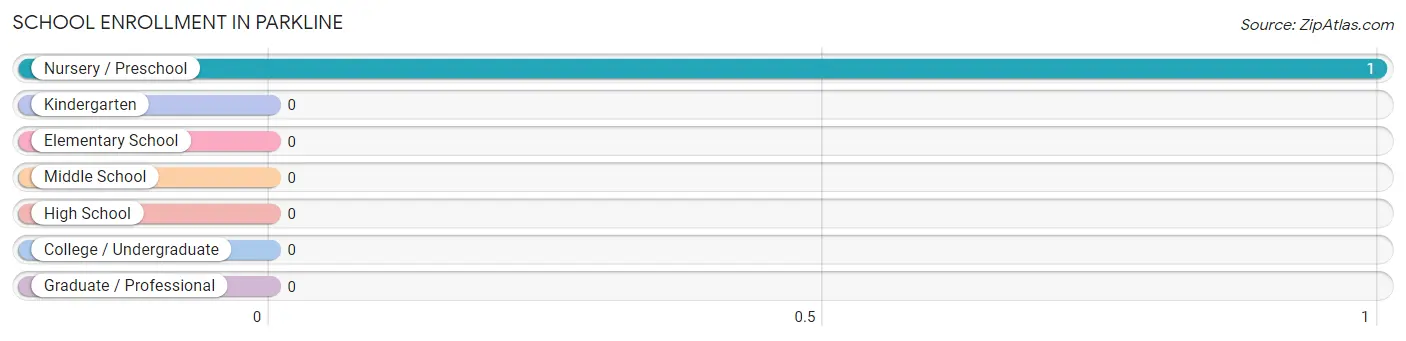
School Enrollment in Parkline
| School Level | # Students | % Students |
| Nursery / Preschool | 1 | 100.0% |
| Kindergarten | 0 | 0.0% |
| Elementary School | 0 | 0.0% |
| Middle School | 0 | 0.0% |
| High School | 0 | 0.0% |
| College / Undergraduate | 0 | 0.0% |
| Graduate / Professional | 0 | 0.0% |
| Total | 1 | 100.0% |
School Enrollment by Age by Funding Source in Parkline
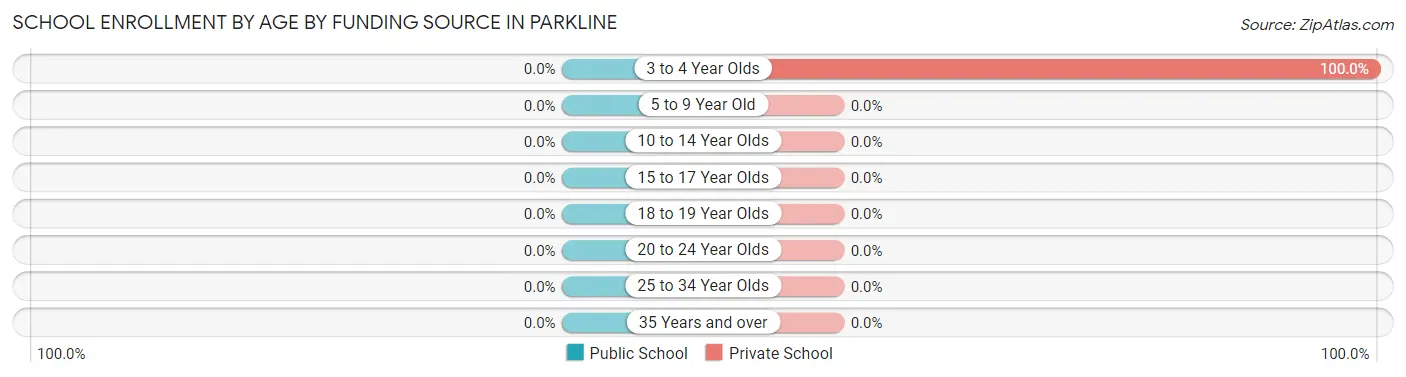
| Age Bracket | Public School | Private School |
| 3 to 4 Year Olds | 0 (0.0%) | 1 (100.0%) |
| 5 to 9 Year Old | 0 (0.0%) | 0 (0.0%) |
| 10 to 14 Year Olds | 0 (0.0%) | 0 (0.0%) |
| 15 to 17 Year Olds | 0 (0.0%) | 0 (0.0%) |
| 18 to 19 Year Olds | 0 (0.0%) | 0 (0.0%) |
| 20 to 24 Year Olds | 0 (0.0%) | 0 (0.0%) |
| 25 to 34 Year Olds | 0 (0.0%) | 0 (0.0%) |
| 35 Years and over | 0 (0.0%) | 0 (0.0%) |
| Total | 0 (0.0%) | 1 (100.0%) |
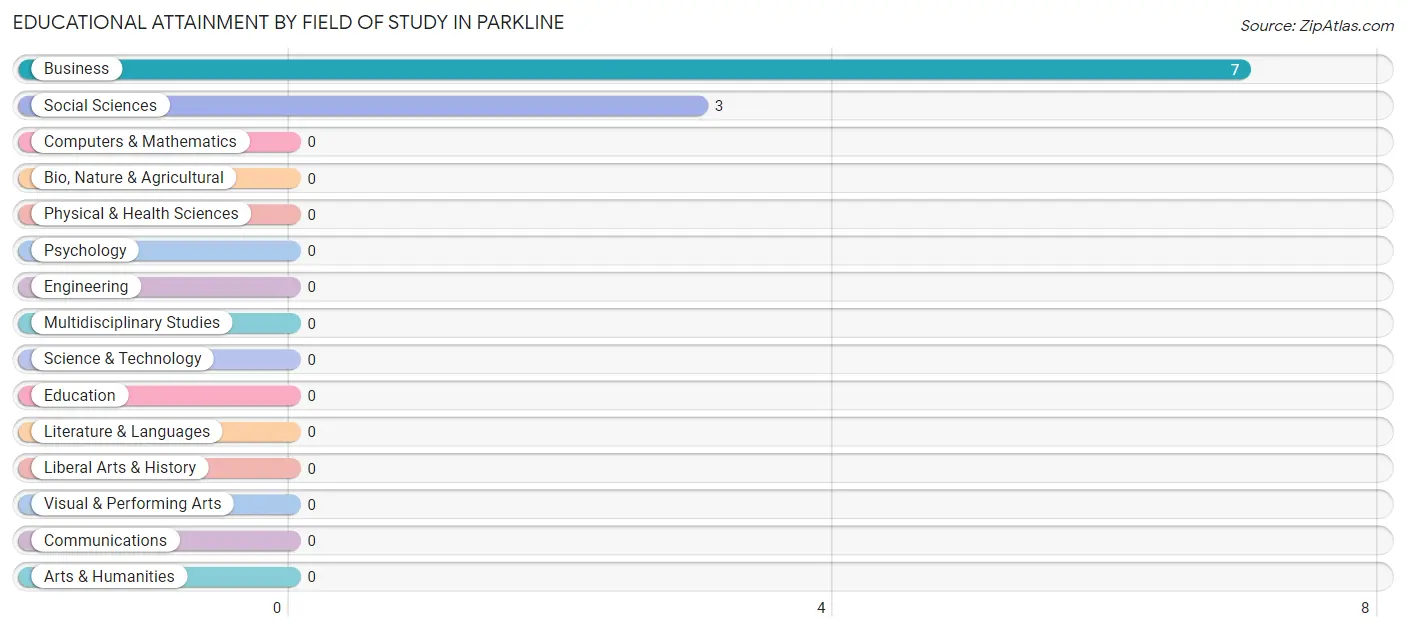
Educational Attainment by Field of Study in Parkline
Business (7 | 70.0%), and social sciences (3 | 30.0%) are the most common fields of study among 10 individuals in Parkline who have obtained a bachelor's degree or higher.
| Field of Study | # Graduates | % Graduates |
| Computers & Mathematics | 0 | 0.0% |
| Bio, Nature & Agricultural | 0 | 0.0% |
| Physical & Health Sciences | 0 | 0.0% |
| Psychology | 0 | 0.0% |
| Social Sciences | 3 | 30.0% |
| Engineering | 0 | 0.0% |
| Multidisciplinary Studies | 0 | 0.0% |
| Science & Technology | 0 | 0.0% |
| Business | 7 | 70.0% |
| Education | 0 | 0.0% |
| Literature & Languages | 0 | 0.0% |
| Liberal Arts & History | 0 | 0.0% |
| Visual & Performing Arts | 0 | 0.0% |
| Communications | 0 | 0.0% |
| Arts & Humanities | 0 | 0.0% |
| Total | 10 | 100.0% |
Transportation & Commute in Parkline
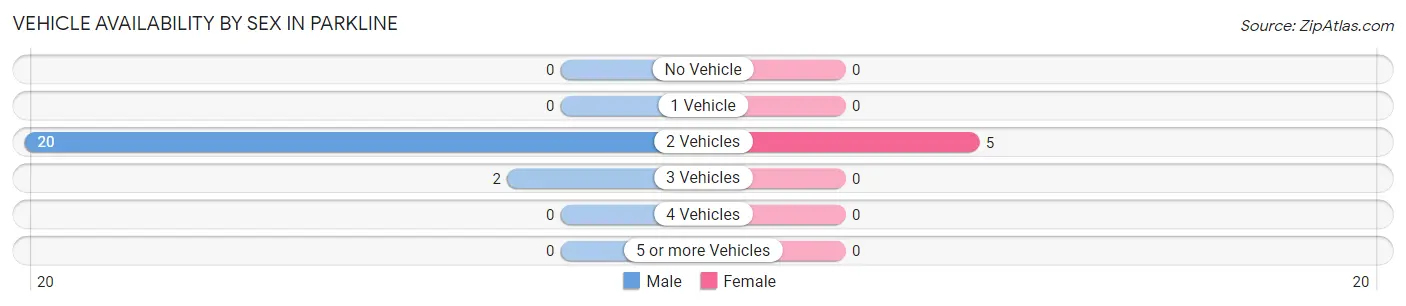
Vehicle Availability by Sex in Parkline
The most prevalent vehicle ownership categories in Parkline are males with 2 vehicles (20, accounting for 90.9%) and females with 2 vehicles (5, making up 400.0%).
| Vehicles Available | Male | Female |
| No Vehicle | 0 (0.0%) | 0 (0.0%) |
| 1 Vehicle | 0 (0.0%) | 0 (0.0%) |
| 2 Vehicles | 20 (90.9%) | 5 (100.0%) |
| 3 Vehicles | 2 (9.1%) | 0 (0.0%) |
| 4 Vehicles | 0 (0.0%) | 0 (0.0%) |
| 5 or more Vehicles | 0 (0.0%) | 0 (0.0%) |
| Total | 22 (100.0%) | 5 (100.0%) |
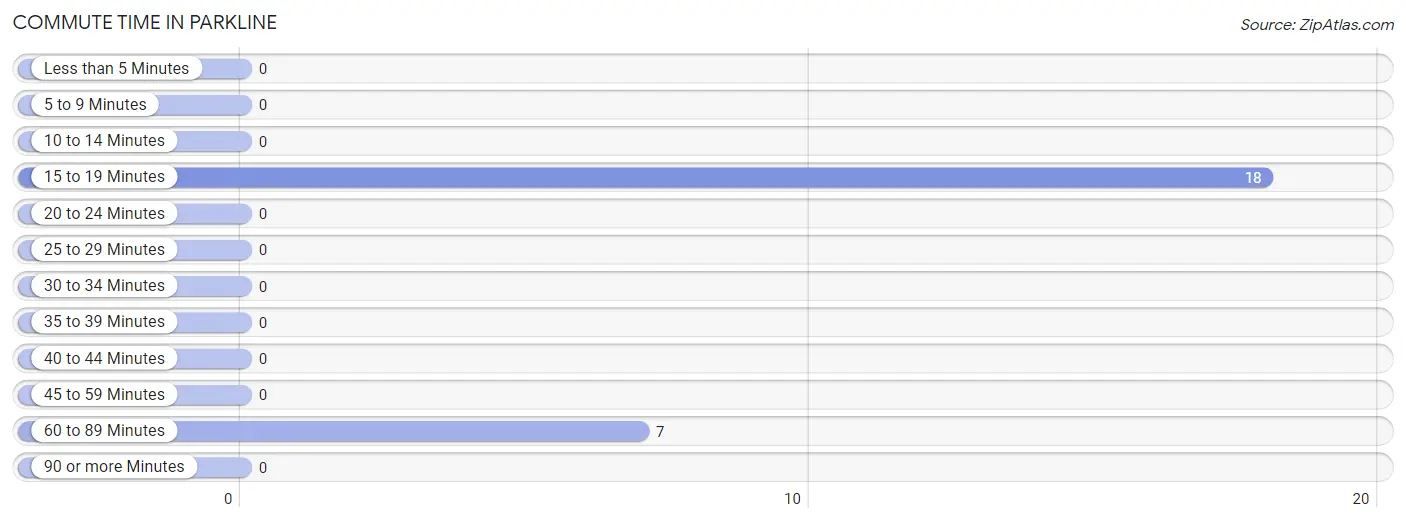
Commute Time in Parkline
The most frequently occuring commute durations in Parkline are 15 to 19 minutes (18 commuters, 72.0%), 60 to 89 minutes (7 commuters, 28.0%), and less than 5 minutes (0 commuters, 0.0%).
| Commute Time | # Commuters | % Commuters |
| Less than 5 Minutes | 0 | 0.0% |
| 5 to 9 Minutes | 0 | 0.0% |
| 10 to 14 Minutes | 0 | 0.0% |
| 15 to 19 Minutes | 18 | 72.0% |
| 20 to 24 Minutes | 0 | 0.0% |
| 25 to 29 Minutes | 0 | 0.0% |
| 30 to 34 Minutes | 0 | 0.0% |
| 35 to 39 Minutes | 0 | 0.0% |
| 40 to 44 Minutes | 0 | 0.0% |
| 45 to 59 Minutes | 0 | 0.0% |
| 60 to 89 Minutes | 7 | 28.0% |
| 90 or more Minutes | 0 | 0.0% |
Commute Time by Sex in Parkline
The most common commute times in Parkline are 15 to 19 minutes (13 commuters, 65.0%) for males and 15 to 19 minutes (5 commuters, 100.0%) for females.
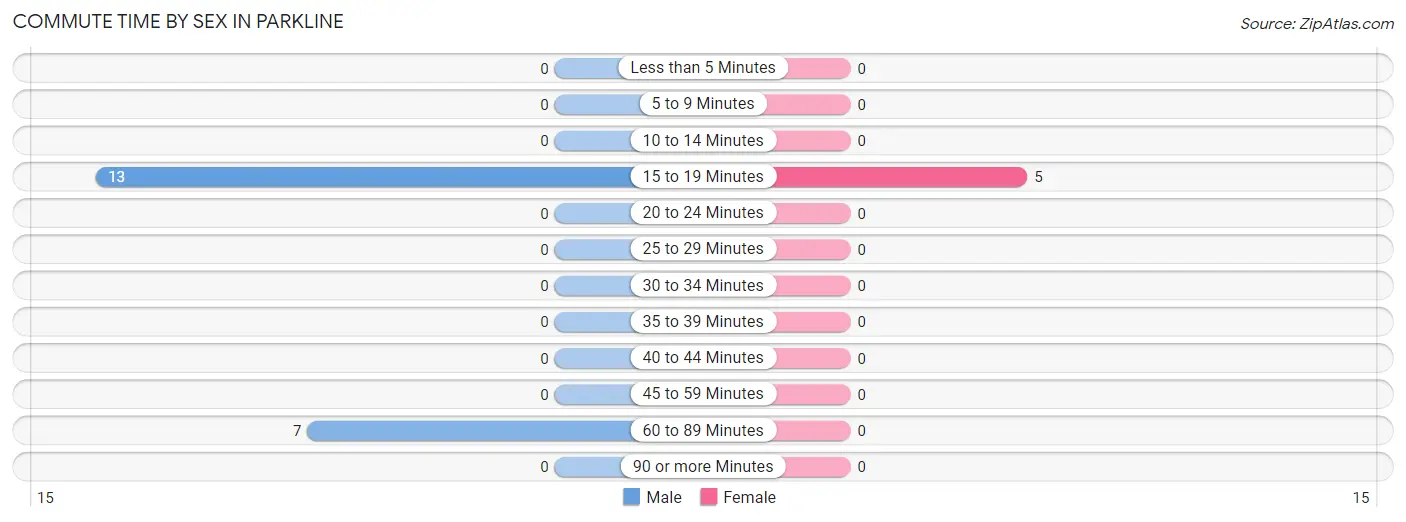
| Commute Time | Male | Female |
| Less than 5 Minutes | 0 (0.0%) | 0 (0.0%) |
| 5 to 9 Minutes | 0 (0.0%) | 0 (0.0%) |
| 10 to 14 Minutes | 0 (0.0%) | 0 (0.0%) |
| 15 to 19 Minutes | 13 (65.0%) | 5 (100.0%) |
| 20 to 24 Minutes | 0 (0.0%) | 0 (0.0%) |
| 25 to 29 Minutes | 0 (0.0%) | 0 (0.0%) |
| 30 to 34 Minutes | 0 (0.0%) | 0 (0.0%) |
| 35 to 39 Minutes | 0 (0.0%) | 0 (0.0%) |
| 40 to 44 Minutes | 0 (0.0%) | 0 (0.0%) |
| 45 to 59 Minutes | 0 (0.0%) | 0 (0.0%) |
| 60 to 89 Minutes | 7 (35.0%) | 0 (0.0%) |
| 90 or more Minutes | 0 (0.0%) | 0 (0.0%) |
Time of Departure to Work by Sex in Parkline
The most frequent times of departure to work in Parkline are 4:00 PM to 11:59 PM (13, 65.0%) for males and 7:30 AM to 7:59 AM (5, 100.0%) for females.
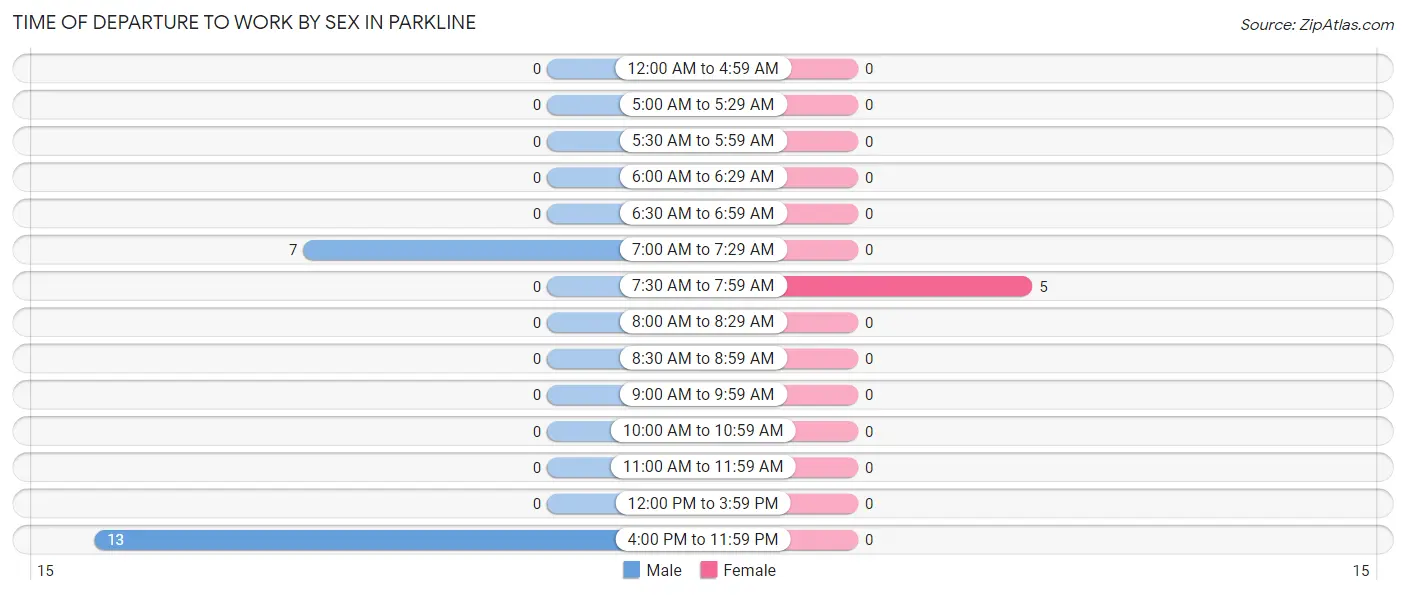
| Time of Departure | Male | Female |
| 12:00 AM to 4:59 AM | 0 (0.0%) | 0 (0.0%) |
| 5:00 AM to 5:29 AM | 0 (0.0%) | 0 (0.0%) |
| 5:30 AM to 5:59 AM | 0 (0.0%) | 0 (0.0%) |
| 6:00 AM to 6:29 AM | 0 (0.0%) | 0 (0.0%) |
| 6:30 AM to 6:59 AM | 0 (0.0%) | 0 (0.0%) |
| 7:00 AM to 7:29 AM | 7 (35.0%) | 0 (0.0%) |
| 7:30 AM to 7:59 AM | 0 (0.0%) | 5 (100.0%) |
| 8:00 AM to 8:29 AM | 0 (0.0%) | 0 (0.0%) |
| 8:30 AM to 8:59 AM | 0 (0.0%) | 0 (0.0%) |
| 9:00 AM to 9:59 AM | 0 (0.0%) | 0 (0.0%) |
| 10:00 AM to 10:59 AM | 0 (0.0%) | 0 (0.0%) |
| 11:00 AM to 11:59 AM | 0 (0.0%) | 0 (0.0%) |
| 12:00 PM to 3:59 PM | 0 (0.0%) | 0 (0.0%) |
| 4:00 PM to 11:59 PM | 13 (65.0%) | 0 (0.0%) |
| Total | 20 (100.0%) | 5 (100.0%) |
Housing Occupancy in Parkline
Occupancy by Ownership in Parkline
Of the total 31 dwellings in Parkline, owner-occupied units account for 24 (77.4%), while renter-occupied units make up 7 (22.6%).
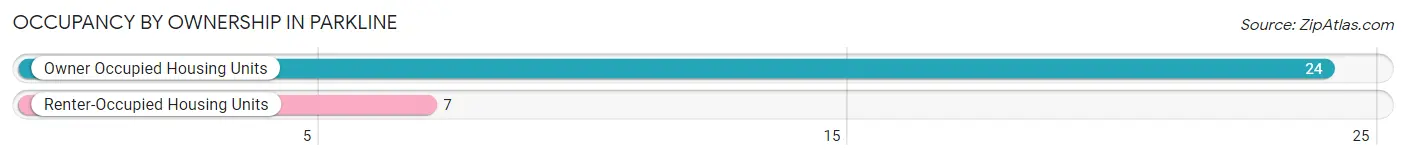
| Occupancy | # Housing Units | % Housing Units |
| Owner Occupied Housing Units | 24 | 77.4% |
| Renter-Occupied Housing Units | 7 | 22.6% |
| Total Occupied Housing Units | 31 | 100.0% |
Occupancy by Household Size in Parkline
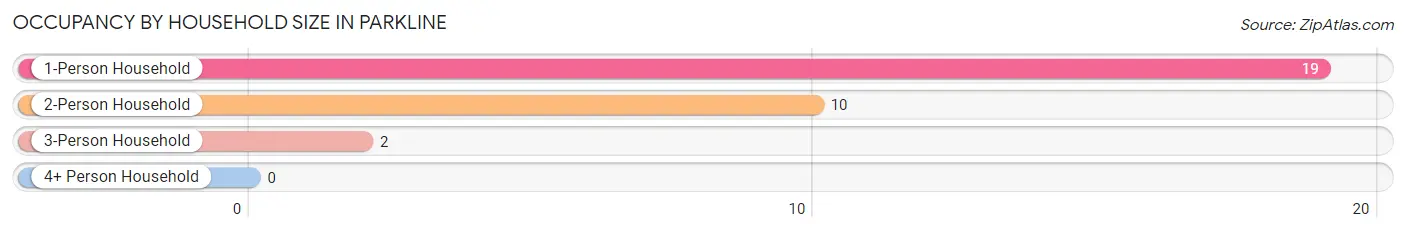
| Household Size | # Housing Units | % Housing Units |
| 1-Person Household | 19 | 61.3% |
| 2-Person Household | 10 | 32.3% |
| 3-Person Household | 2 | 6.5% |
| 4+ Person Household | 0 | 0.0% |
| Total Housing Units | 31 | 100.0% |
Occupancy by Ownership by Household Size in Parkline
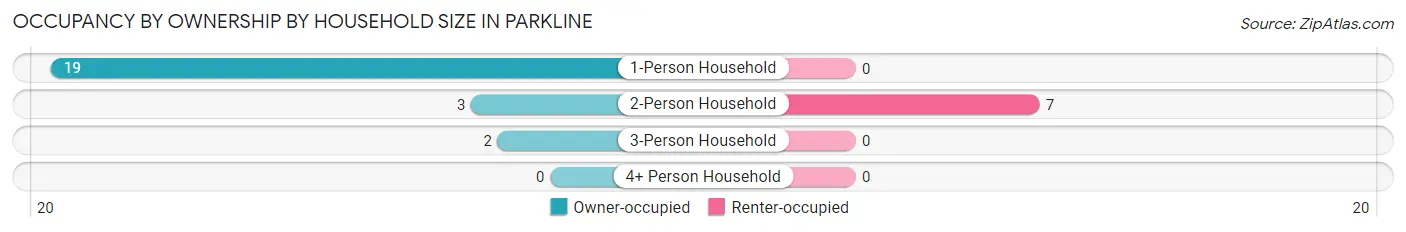
| Household Size | Owner-occupied | Renter-occupied |
| 1-Person Household | 19 (100.0%) | 0 (0.0%) |
| 2-Person Household | 3 (30.0%) | 7 (70.0%) |
| 3-Person Household | 2 (100.0%) | 0 (0.0%) |
| 4+ Person Household | 0 (0.0%) | 0 (0.0%) |
| Total Housing Units | 24 (77.4%) | 7 (22.6%) |
Occupancy by Educational Attainment in Parkline
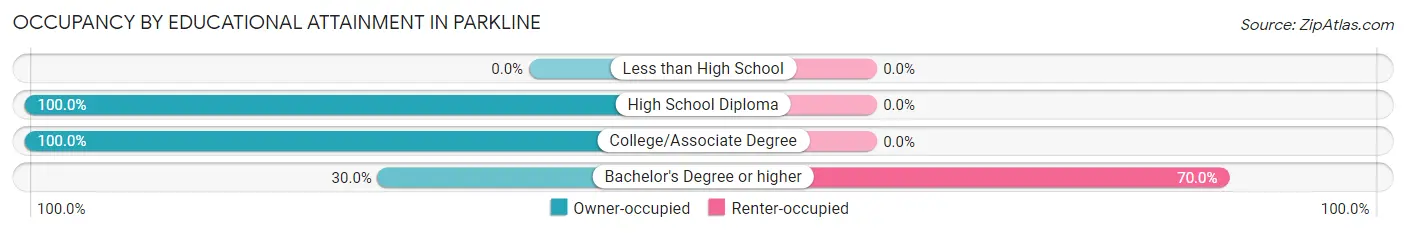
| Household Size | Owner-occupied | Renter-occupied |
| Less than High School | 0 (0.0%) | 0 (0.0%) |
| High School Diploma | 13 (100.0%) | 0 (0.0%) |
| College/Associate Degree | 8 (100.0%) | 0 (0.0%) |
| Bachelor's Degree or higher | 3 (30.0%) | 7 (70.0%) |
Occupancy by Age of Householder in Parkline
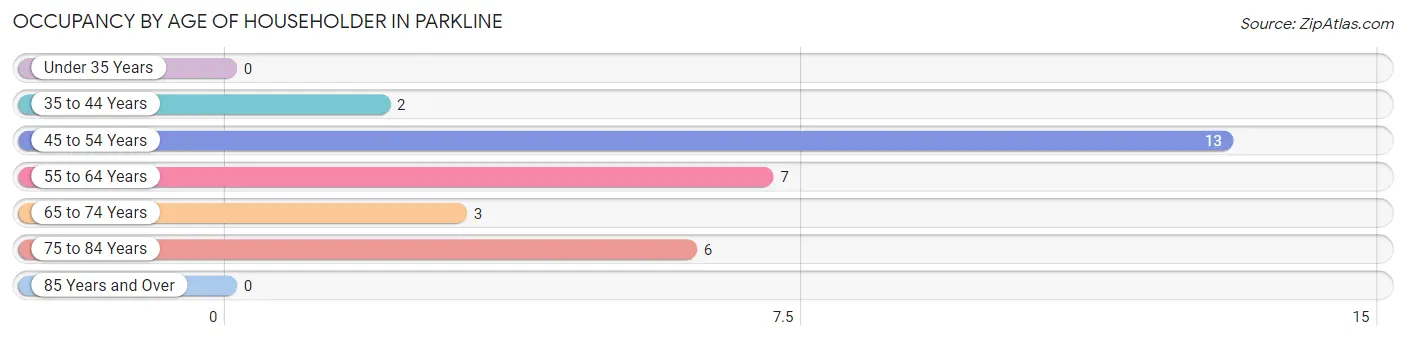
| Age Bracket | # Households | % Households |
| Under 35 Years | 0 | 0.0% |
| 35 to 44 Years | 2 | 6.5% |
| 45 to 54 Years | 13 | 41.9% |
| 55 to 64 Years | 7 | 22.6% |
| 65 to 74 Years | 3 | 9.7% |
| 75 to 84 Years | 6 | 19.4% |
| 85 Years and Over | 0 | 0.0% |
| Total | 31 | 100.0% |
Housing Finances in Parkline
Median Income by Occupancy in Parkline
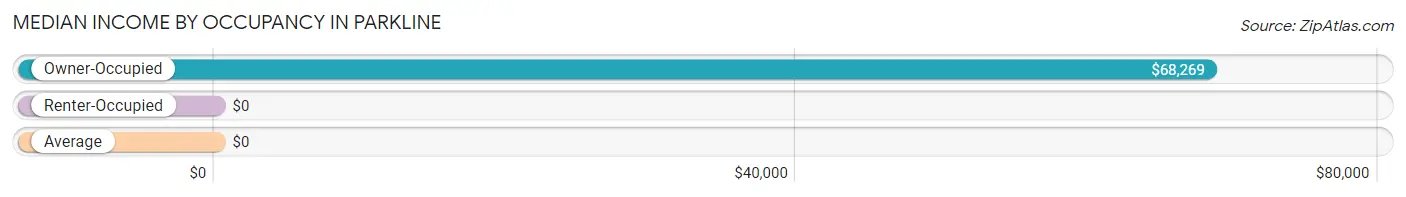
| Occupancy Type | # Households | Median Income |
| Owner-Occupied | 24 (77.4%) | $68,269 |
| Renter-Occupied | 7 (22.6%) | $0 |
| Average | 31 (100.0%) | $0 |
Occupancy by Householder Income Bracket in Parkline
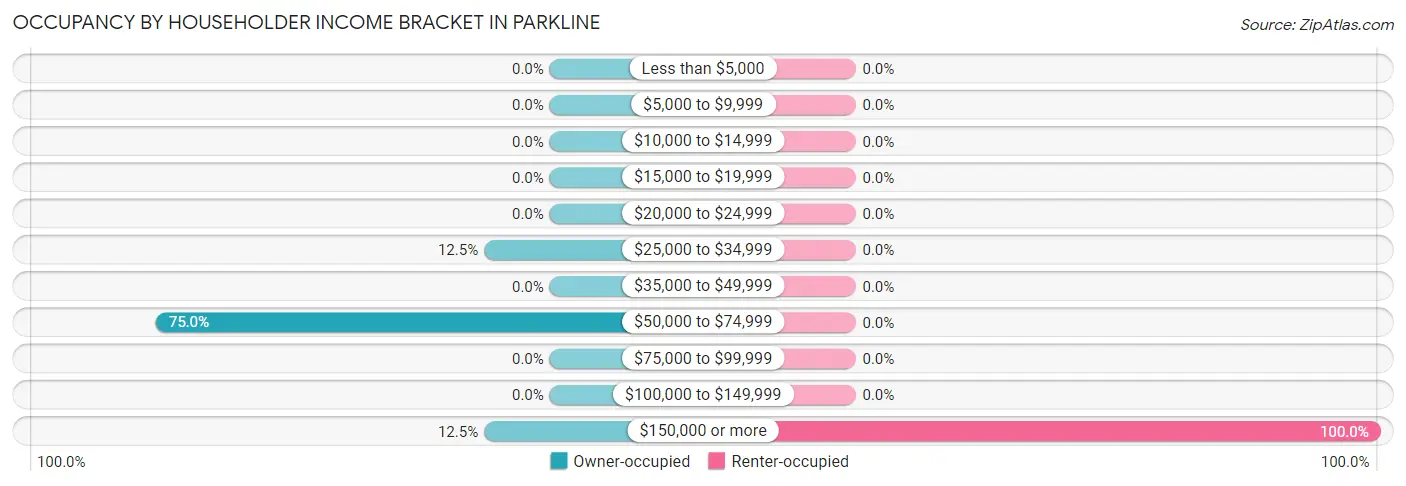
| Income Bracket | Owner-occupied | Renter-occupied |
| Less than $5,000 | 0 (0.0%) | 0 (0.0%) |
| $5,000 to $9,999 | 0 (0.0%) | 0 (0.0%) |
| $10,000 to $14,999 | 0 (0.0%) | 0 (0.0%) |
| $15,000 to $19,999 | 0 (0.0%) | 0 (0.0%) |
| $20,000 to $24,999 | 0 (0.0%) | 0 (0.0%) |
| $25,000 to $34,999 | 3 (12.5%) | 0 (0.0%) |
| $35,000 to $49,999 | 0 (0.0%) | 0 (0.0%) |
| $50,000 to $74,999 | 18 (75.0%) | 0 (0.0%) |
| $75,000 to $99,999 | 0 (0.0%) | 0 (0.0%) |
| $100,000 to $149,999 | 0 (0.0%) | 0 (0.0%) |
| $150,000 or more | 3 (12.5%) | 7 (100.0%) |
| Total | 24 (100.0%) | 7 (100.0%) |
Monthly Housing Cost Tiers in Parkline
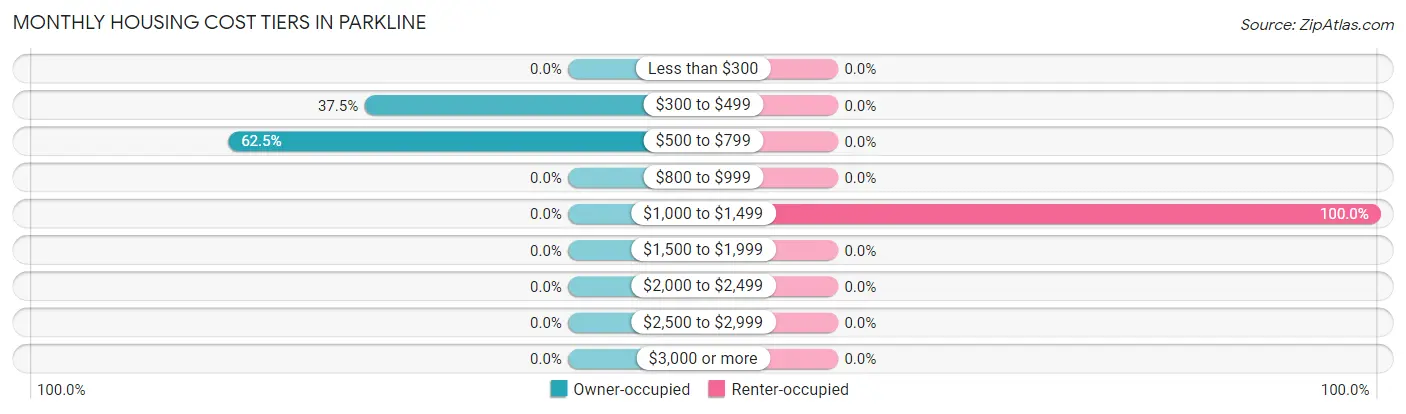
| Monthly Cost | Owner-occupied | Renter-occupied |
| Less than $300 | 0 (0.0%) | 0 (0.0%) |
| $300 to $499 | 9 (37.5%) | 0 (0.0%) |
| $500 to $799 | 15 (62.5%) | 0 (0.0%) |
| $800 to $999 | 0 (0.0%) | 0 (0.0%) |
| $1,000 to $1,499 | 0 (0.0%) | 7 (100.0%) |
| $1,500 to $1,999 | 0 (0.0%) | 0 (0.0%) |
| $2,000 to $2,499 | 0 (0.0%) | 0 (0.0%) |
| $2,500 to $2,999 | 0 (0.0%) | 0 (0.0%) |
| $3,000 or more | 0 (0.0%) | 0 (0.0%) |
| Total | 24 (100.0%) | 7 (100.0%) |
Physical Housing Characteristics in Parkline
Housing Structures in Parkline
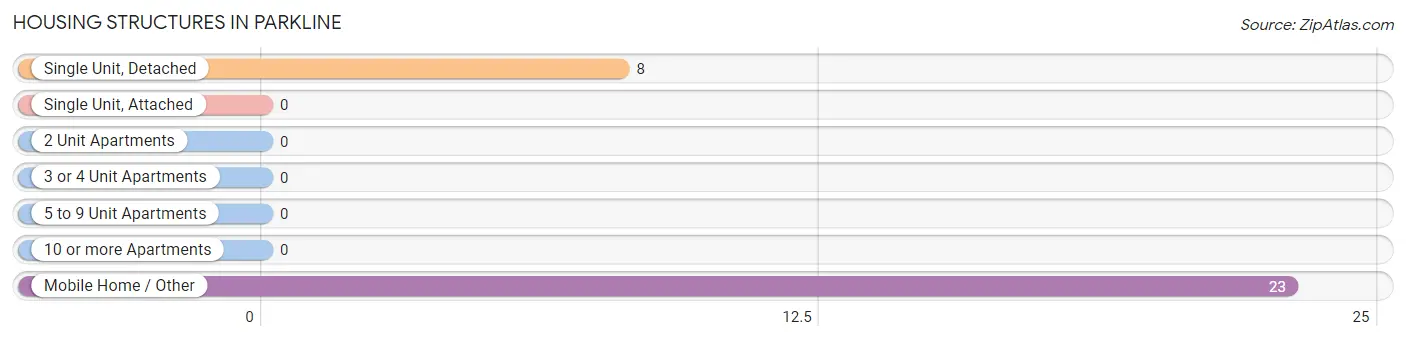
| Structure Type | # Housing Units | % Housing Units |
| Single Unit, Detached | 8 | 25.8% |
| Single Unit, Attached | 0 | 0.0% |
| 2 Unit Apartments | 0 | 0.0% |
| 3 or 4 Unit Apartments | 0 | 0.0% |
| 5 to 9 Unit Apartments | 0 | 0.0% |
| 10 or more Apartments | 0 | 0.0% |
| Mobile Home / Other | 23 | 74.2% |
| Total | 31 | 100.0% |
Housing Structures by Occupancy in Parkline
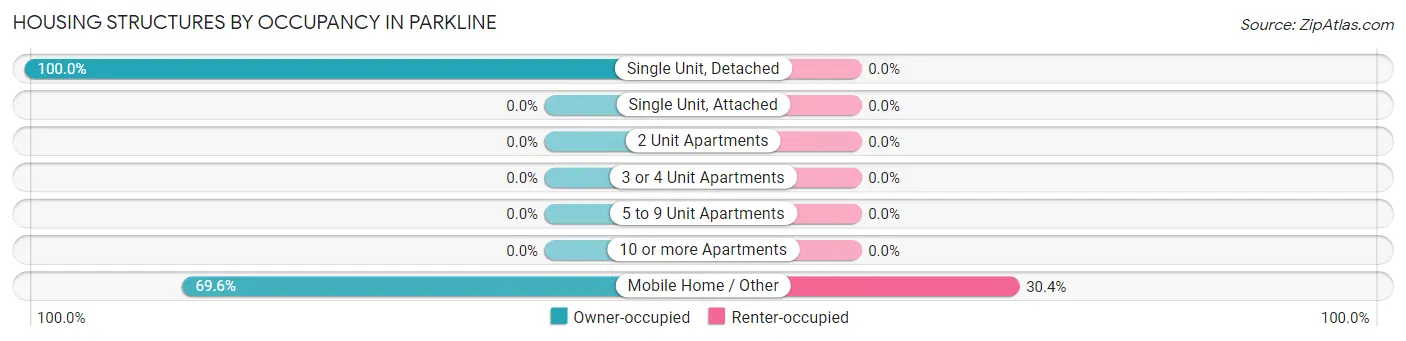
| Structure Type | Owner-occupied | Renter-occupied |
| Single Unit, Detached | 8 (100.0%) | 0 (0.0%) |
| Single Unit, Attached | 0 (0.0%) | 0 (0.0%) |
| 2 Unit Apartments | 0 (0.0%) | 0 (0.0%) |
| 3 or 4 Unit Apartments | 0 (0.0%) | 0 (0.0%) |
| 5 to 9 Unit Apartments | 0 (0.0%) | 0 (0.0%) |
| 10 or more Apartments | 0 (0.0%) | 0 (0.0%) |
| Mobile Home / Other | 16 (69.6%) | 7 (30.4%) |
| Total | 24 (77.4%) | 7 (22.6%) |
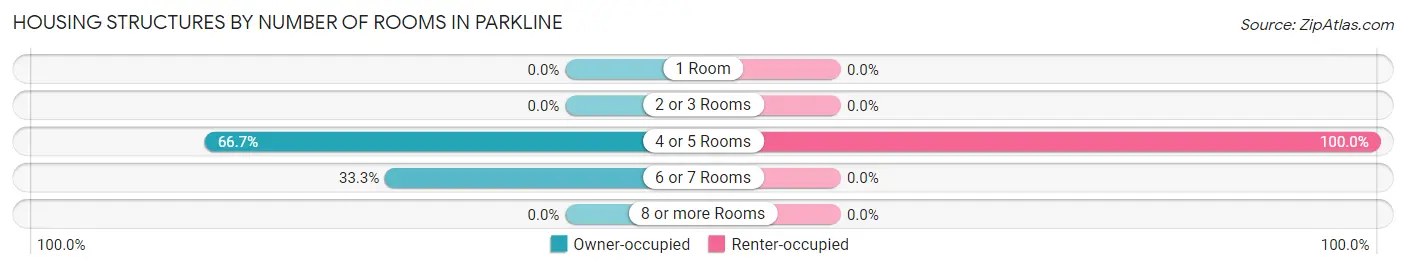
Housing Structures by Number of Rooms in Parkline
| Number of Rooms | Owner-occupied | Renter-occupied |
| 1 Room | 0 (0.0%) | 0 (0.0%) |
| 2 or 3 Rooms | 0 (0.0%) | 0 (0.0%) |
| 4 or 5 Rooms | 16 (66.7%) | 7 (100.0%) |
| 6 or 7 Rooms | 8 (33.3%) | 0 (0.0%) |
| 8 or more Rooms | 0 (0.0%) | 0 (0.0%) |
| Total | 24 (100.0%) | 7 (100.0%) |
Housing Structure by Heating Type in Parkline
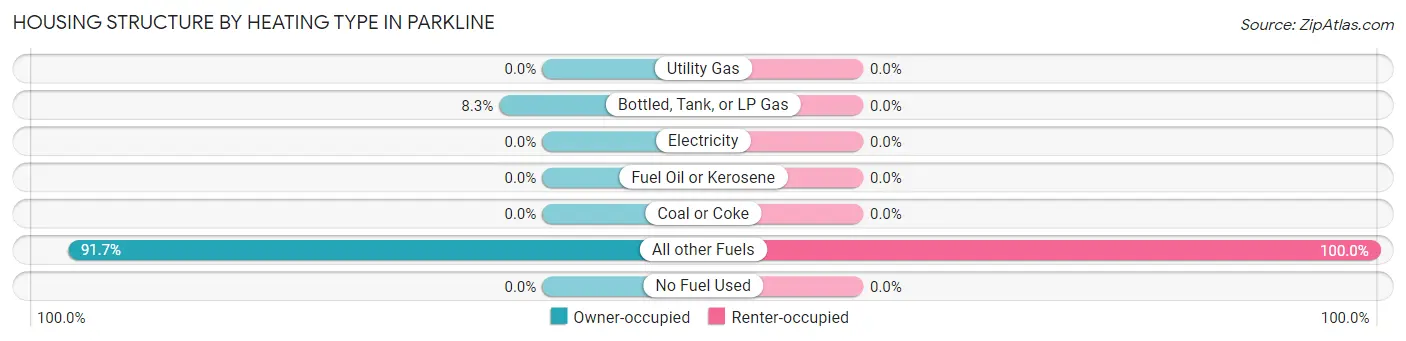
| Heating Type | Owner-occupied | Renter-occupied |
| Utility Gas | 0 (0.0%) | 0 (0.0%) |
| Bottled, Tank, or LP Gas | 2 (8.3%) | 0 (0.0%) |
| Electricity | 0 (0.0%) | 0 (0.0%) |
| Fuel Oil or Kerosene | 0 (0.0%) | 0 (0.0%) |
| Coal or Coke | 0 (0.0%) | 0 (0.0%) |
| All other Fuels | 22 (91.7%) | 7 (100.0%) |
| No Fuel Used | 0 (0.0%) | 0 (0.0%) |
| Total | 24 (100.0%) | 7 (100.0%) |
Household Vehicle Usage in Parkline
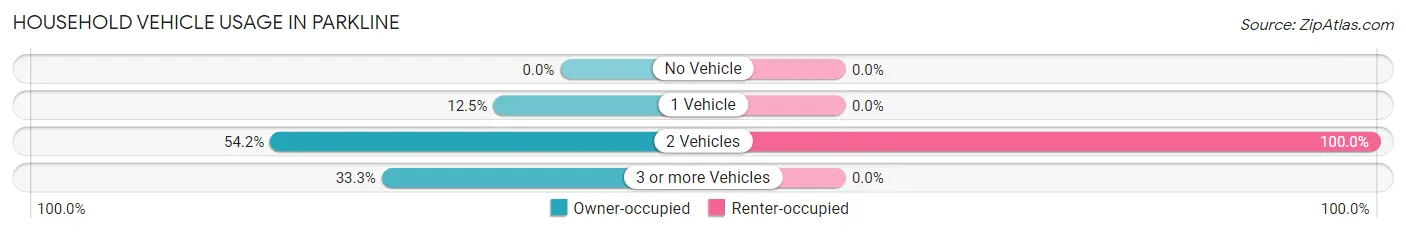
| Vehicles per Household | Owner-occupied | Renter-occupied |
| No Vehicle | 0 (0.0%) | 0 (0.0%) |
| 1 Vehicle | 3 (12.5%) | 0 (0.0%) |
| 2 Vehicles | 13 (54.2%) | 7 (100.0%) |
| 3 or more Vehicles | 8 (33.3%) | 0 (0.0%) |
| Total | 24 (100.0%) | 7 (100.0%) |
Real Estate & Mortgages in Parkline
Real Estate and Mortgage Overview in Parkline
| Characteristic | Without Mortgage | With Mortgage |
| Housing Units | 11 | 13 |
| Median Property Value | - | - |
| Median Household Income | - | - |
| Monthly Housing Costs | $396 | $0 |
| Real Estate Taxes | - | - |
Property Value by Mortgage Status in Parkline
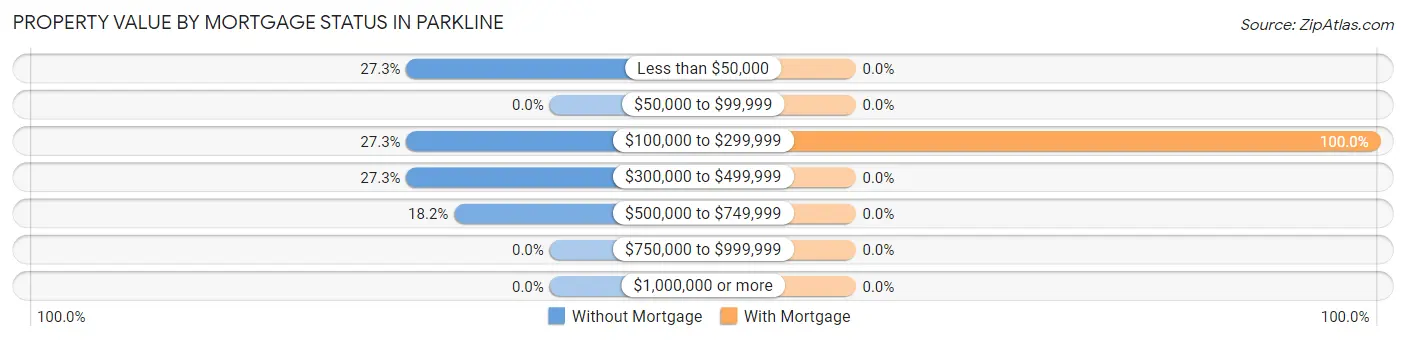
| Property Value | Without Mortgage | With Mortgage |
| Less than $50,000 | 3 (27.3%) | 0 (0.0%) |
| $50,000 to $99,999 | 0 (0.0%) | 0 (0.0%) |
| $100,000 to $299,999 | 3 (27.3%) | 13 (100.0%) |
| $300,000 to $499,999 | 3 (27.3%) | 0 (0.0%) |
| $500,000 to $749,999 | 2 (18.2%) | 0 (0.0%) |
| $750,000 to $999,999 | 0 (0.0%) | 0 (0.0%) |
| $1,000,000 or more | 0 (0.0%) | 0 (0.0%) |
| Total | 11 (100.0%) | 13 (100.0%) |
Household Income by Mortgage Status in Parkline
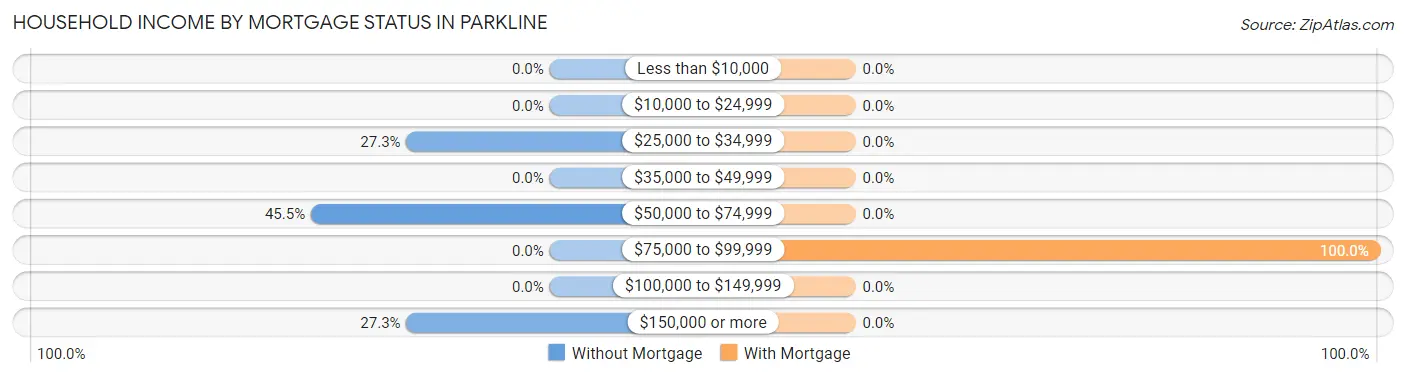
| Household Income | Without Mortgage | With Mortgage |
| Less than $10,000 | 0 (0.0%) | 0 (0.0%) |
| $10,000 to $24,999 | 0 (0.0%) | 0 (0.0%) |
| $25,000 to $34,999 | 3 (27.3%) | 0 (0.0%) |
| $35,000 to $49,999 | 0 (0.0%) | 0 (0.0%) |
| $50,000 to $74,999 | 5 (45.5%) | 0 (0.0%) |
| $75,000 to $99,999 | 0 (0.0%) | 13 (100.0%) |
| $100,000 to $149,999 | 0 (0.0%) | 0 (0.0%) |
| $150,000 or more | 3 (27.3%) | 0 (0.0%) |
| Total | 11 (100.0%) | 13 (100.0%) |
Property Value to Household Income Ratio in Parkline
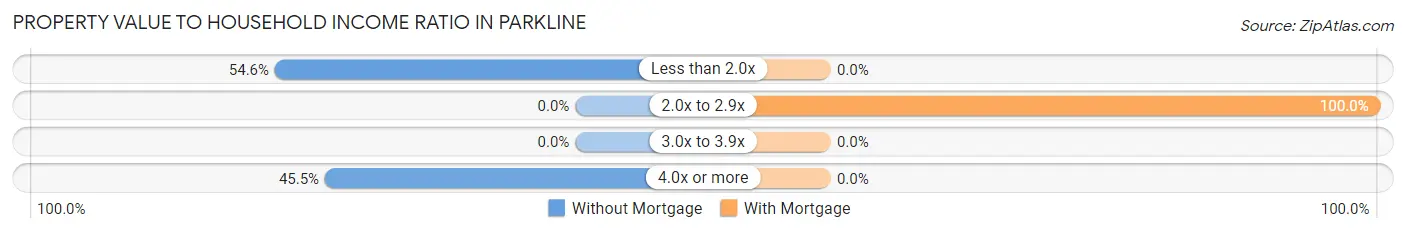
| Value-to-Income Ratio | Without Mortgage | With Mortgage |
| Less than 2.0x | 6 (54.5%) | 0 (0.0%) |
| 2.0x to 2.9x | 0 (0.0%) | 13 (100.0%) |
| 3.0x to 3.9x | 0 (0.0%) | 0 (0.0%) |
| 4.0x or more | 5 (45.5%) | 0 (0.0%) |
| Total | 11 (100.0%) | 13 (100.0%) |
Real Estate Taxes by Mortgage Status in Parkline
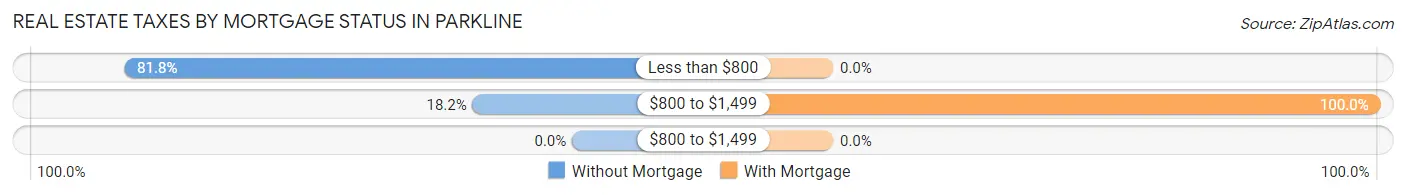
| Property Taxes | Without Mortgage | With Mortgage |
| Less than $800 | 9 (81.8%) | 0 (0.0%) |
| $800 to $1,499 | 2 (18.2%) | 13 (100.0%) |
| $800 to $1,499 | 0 (0.0%) | 0 (0.0%) |
| Total | 11 (100.0%) | 13 (100.0%) |
Health & Disability in Parkline
Health Insurance Coverage by Age in Parkline
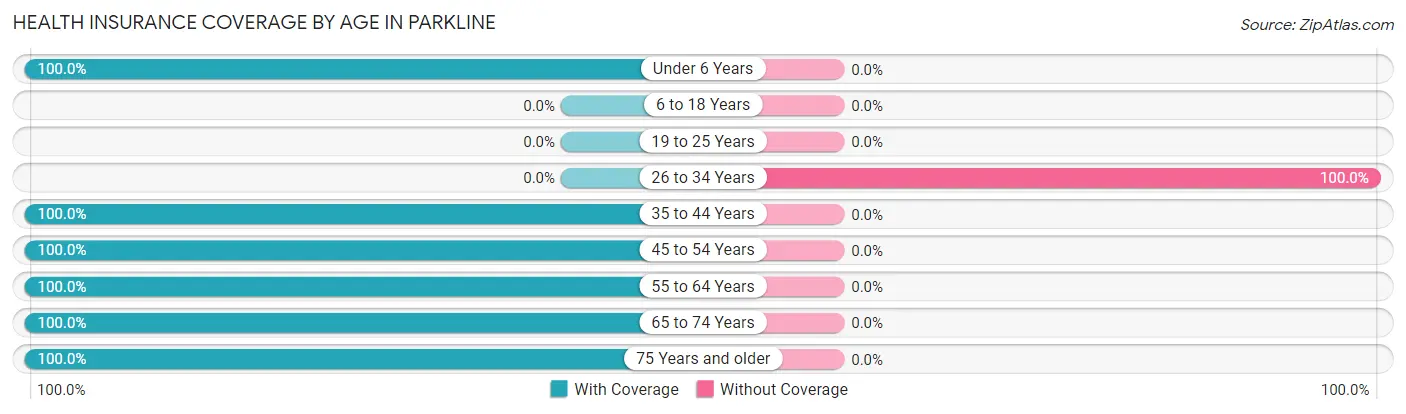
| Age Bracket | With Coverage | Without Coverage |
| Under 6 Years | 1 (100.0%) | 0 (0.0%) |
| 6 to 18 Years | 0 (0.0%) | 0 (0.0%) |
| 19 to 25 Years | 0 (0.0%) | 0 (0.0%) |
| 26 to 34 Years | 0 (0.0%) | 4 (100.0%) |
| 35 to 44 Years | 2 (100.0%) | 0 (0.0%) |
| 45 to 54 Years | 13 (100.0%) | 0 (0.0%) |
| 55 to 64 Years | 12 (100.0%) | 0 (0.0%) |
| 65 to 74 Years | 3 (100.0%) | 0 (0.0%) |
| 75 Years and older | 10 (100.0%) | 0 (0.0%) |
| Total | 41 (91.1%) | 4 (8.9%) |
Health Insurance Coverage by Citizenship Status in Parkline
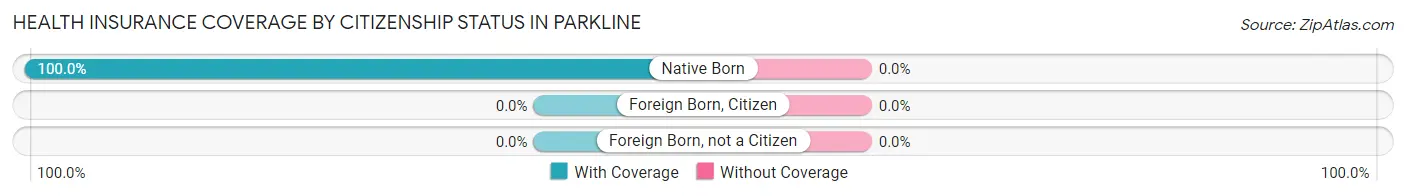
| Citizenship Status | With Coverage | Without Coverage |
| Native Born | 1 (100.0%) | 0 (0.0%) |
| Foreign Born, Citizen | 0 (0.0%) | 0 (0.0%) |
| Foreign Born, not a Citizen | 0 (0.0%) | 0 (0.0%) |
Health Insurance Coverage by Household Income in Parkline
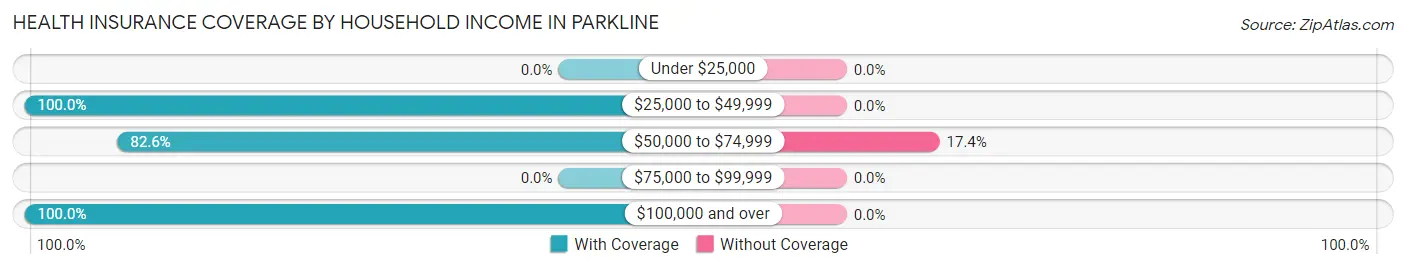
| Household Income | With Coverage | Without Coverage |
| Under $25,000 | 0 (0.0%) | 0 (0.0%) |
| $25,000 to $49,999 | 3 (100.0%) | 0 (0.0%) |
| $50,000 to $74,999 | 19 (82.6%) | 4 (17.4%) |
| $75,000 to $99,999 | 0 (0.0%) | 0 (0.0%) |
| $100,000 and over | 19 (100.0%) | 0 (0.0%) |
Public vs Private Health Insurance Coverage by Age in Parkline
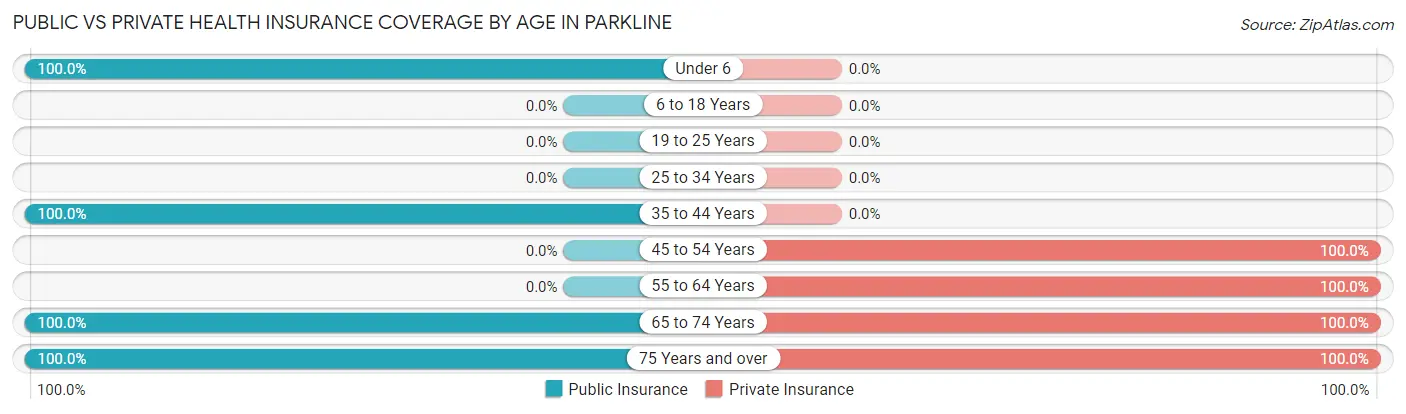
| Age Bracket | Public Insurance | Private Insurance |
| Under 6 | 1 (100.0%) | 0 (0.0%) |
| 6 to 18 Years | 0 (0.0%) | 0 (0.0%) |
| 19 to 25 Years | 0 (0.0%) | 0 (0.0%) |
| 25 to 34 Years | 0 (0.0%) | 0 (0.0%) |
| 35 to 44 Years | 2 (100.0%) | 0 (0.0%) |
| 45 to 54 Years | 0 (0.0%) | 13 (100.0%) |
| 55 to 64 Years | 0 (0.0%) | 12 (100.0%) |
| 65 to 74 Years | 3 (100.0%) | 3 (100.0%) |
| 75 Years and over | 10 (100.0%) | 10 (100.0%) |
| Total | 16 (35.6%) | 38 (84.4%) |
Disability Status by Sex by Age in Parkline
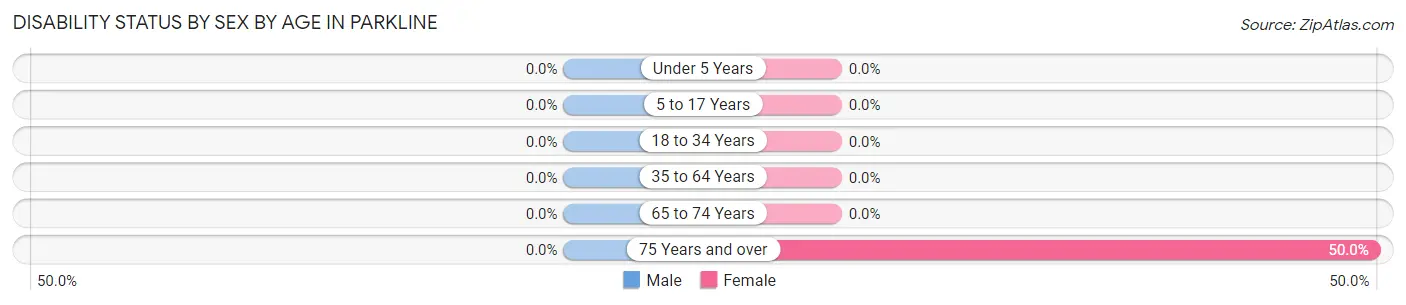
| Age Bracket | Male | Female |
| Under 5 Years | 0 (0.0%) | 0 (0.0%) |
| 5 to 17 Years | 0 (0.0%) | 0 (0.0%) |
| 18 to 34 Years | 0 (0.0%) | 0 (0.0%) |
| 35 to 64 Years | 0 (0.0%) | 0 (0.0%) |
| 65 to 74 Years | 0 (0.0%) | 0 (0.0%) |
| 75 Years and over | 0 (0.0%) | 3 (50.0%) |
Disability Class by Sex by Age in Parkline
Disability Class: Hearing Difficulty
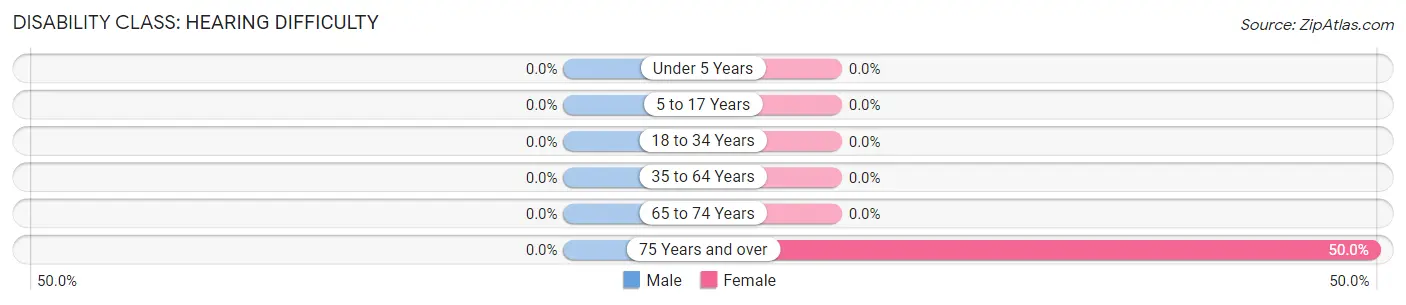
| Age Bracket | Male | Female |
| Under 5 Years | 0 (0.0%) | 0 (0.0%) |
| 5 to 17 Years | 0 (0.0%) | 0 (0.0%) |
| 18 to 34 Years | 0 (0.0%) | 0 (0.0%) |
| 35 to 64 Years | 0 (0.0%) | 0 (0.0%) |
| 65 to 74 Years | 0 (0.0%) | 0 (0.0%) |
| 75 Years and over | 0 (0.0%) | 3 (50.0%) |
Disability Class: Vision Difficulty
| Age Bracket | Male | Female |
| Under 5 Years | 0 (0.0%) | 0 (0.0%) |
| 5 to 17 Years | 0 (0.0%) | 0 (0.0%) |
| 18 to 34 Years | 0 (0.0%) | 0 (0.0%) |
| 35 to 64 Years | 0 (0.0%) | 0 (0.0%) |
| 65 to 74 Years | 0 (0.0%) | 0 (0.0%) |
| 75 Years and over | 0 (0.0%) | 0 (0.0%) |
Disability Class: Cognitive Difficulty

| Age Bracket | Male | Female |
| 5 to 17 Years | 0 (0.0%) | 0 (0.0%) |
| 18 to 34 Years | 0 (0.0%) | 0 (0.0%) |
| 35 to 64 Years | 0 (0.0%) | 0 (0.0%) |
| 65 to 74 Years | 0 (0.0%) | 0 (0.0%) |
| 75 Years and over | 0 (0.0%) | 0 (0.0%) |
Disability Class: Ambulatory Difficulty

| Age Bracket | Male | Female |
| 5 to 17 Years | 0 (0.0%) | 0 (0.0%) |
| 18 to 34 Years | 0 (0.0%) | 0 (0.0%) |
| 35 to 64 Years | 0 (0.0%) | 0 (0.0%) |
| 65 to 74 Years | 0 (0.0%) | 0 (0.0%) |
| 75 Years and over | 0 (0.0%) | 0 (0.0%) |
Disability Class: Self-Care Difficulty
| Age Bracket | Male | Female |
| 5 to 17 Years | 0 (0.0%) | 0 (0.0%) |
| 18 to 34 Years | 0 (0.0%) | 0 (0.0%) |
| 35 to 64 Years | 0 (0.0%) | 0 (0.0%) |
| 65 to 74 Years | 0 (0.0%) | 0 (0.0%) |
| 75 Years and over | 0 (0.0%) | 0 (0.0%) |
Technology Access in Parkline
Computing Device Access in Parkline
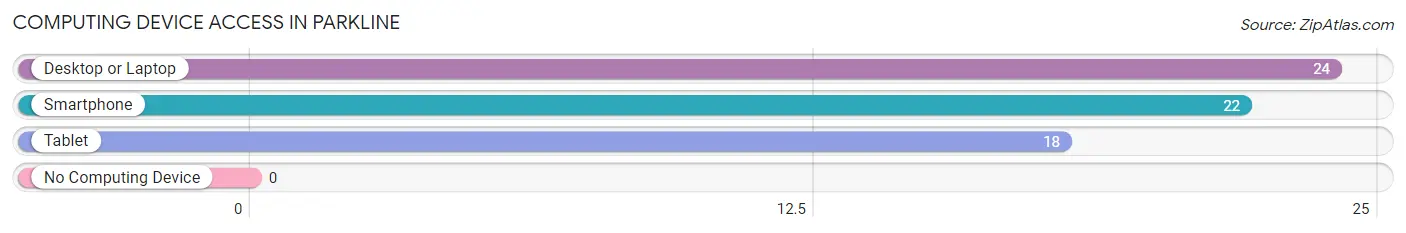
| Device Type | # Households | % Households |
| Desktop or Laptop | 24 | 77.4% |
| Smartphone | 22 | 71.0% |
| Tablet | 18 | 58.1% |
| No Computing Device | 0 | 0.0% |
| Total | 31 | 100.0% |
Internet Access in Parkline
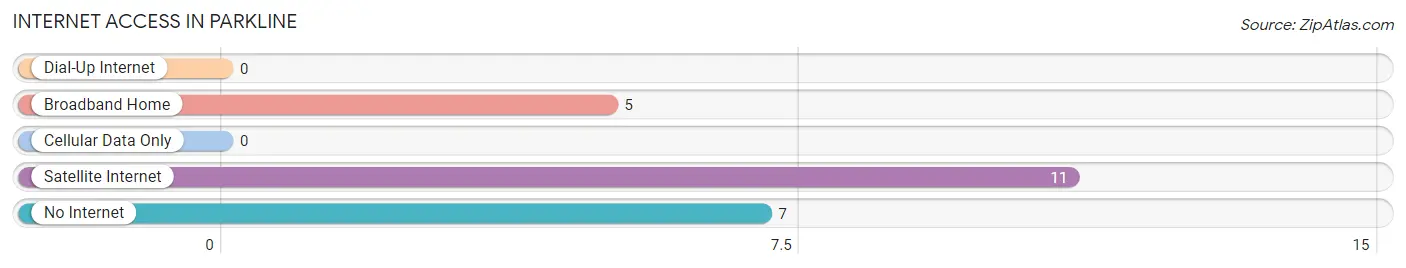
| Internet Type | # Households | % Households |
| Dial-Up Internet | 0 | 0.0% |
| Broadband Home | 5 | 16.1% |
| Cellular Data Only | 0 | 0.0% |
| Satellite Internet | 11 | 35.5% |
| No Internet | 7 | 22.6% |
| Total | 31 | 100.0% |
Parkline Summary
Line ID is a province in Thailand located in the northern region of the country. It is bordered by the provinces of Chiang Mai to the north, Lampang to the east, Phrae to the south, and Nan to the west. The provincial capital is Chiang Rai, which is located in the northernmost part of the province.
History
Line ID has a long and rich history, dating back to the 13th century when it was part of the Lanna Kingdom. The kingdom was founded by King Mangrai, who unified the various city-states in the region and established the capital at Chiang Rai. The kingdom flourished until the 16th century when it was conquered by the Burmese. The Burmese rule lasted until 1786 when the kingdom was annexed by Siam (modern-day Thailand).
In the 19th century, Line ID was part of the northern region of Siam, which was known as the Monthon Phayap. The region was divided into four provinces, including Chiang Rai, Lampang, Phrae, and Nan. In 1933, the region was reorganized into the five provinces of Chiang Mai, Chiang Rai, Lampang, Phrae, and Nan.
Geography
Line ID is located in the northern region of Thailand and is bordered by the provinces of Chiang Mai to the north, Lampang to the east, Phrae to the south, and Nan to the west. The province covers an area of approximately 11,678 square kilometers and is divided into 12 districts. The terrain of the province is mostly mountainous, with the highest peak being Doi Tung at 2,285 meters. The province is also home to several rivers, including the Mae Kok, Mae Sai, and Mae Nam Kok.
Economy
The economy of Line ID is largely based on agriculture, with the main crops being rice, maize, and cassava. The province is also known for its production of tea, coffee, and other agricultural products. Tourism is also an important part of the economy, with the province being home to several national parks and other attractions.
Demographics
As of 2020, the population of Line ID was estimated to be 1,717,845. The majority of the population is of Thai ethnicity, with the remainder being of Chinese, Lao, and other ethnicities. The majority of the population is Buddhist, with a small minority of Christians and Muslims. The official language of the province is Thai, although English is also widely spoken.
Common Questions
What is Per Capita Income in Parkline?
Per Capita income in Parkline is $97,024.
What is the Median Family Income in Parkline?
Median Family Income in Parkline is $250,001.
What is Inequality or Gini Index in Parkline?
Inequality or Gini Index in Parkline is 0.42.
What is the Total Population of Parkline?
Total Population of Parkline is 45.
What is the Total Male Population of Parkline?
Total Male Population of Parkline is 27.
What is the Total Female Population of Parkline?
Total Female Population of Parkline is 18.
What is the Ratio of Males per 100 Females in Parkline?
There are 150.00 Males per 100 Females in Parkline.
What is the Ratio of Females per 100 Males in Parkline?
There are 66.67 Females per 100 Males in Parkline.
What is the Median Population Age in Parkline?
Median Population Age in Parkline is 58.5 Years.
What is the Average Family Size in Parkline
Average Family Size in Parkline is 2.2 People.
What is the Average Household Size in Parkline
Average Household Size in Parkline is 1.4 People.
How Large is the Labor Force in Parkline?
There are 27 People in the Labor Forcein in Parkline.
What is the Percentage of People in the Labor Force in Parkline?
61.4% of People are in the Labor Force in Parkline.