Hauser, ID Map & Demographics
Hauser Map
Hauser Overview
$32,976
PER CAPITA INCOME
$55,417
AVG FAMILY INCOME
$54,875
AVG HOUSEHOLD INCOME
37.6%
WAGE / INCOME GAP [ % ]
62.4¢/ $1
WAGE / INCOME GAP [ $ ]
$12,658
FAMILY INCOME DEFICIT
0.40
INEQUALITY / GINI INDEX
935
TOTAL POPULATION
523
MALE POPULATION
412
FEMALE POPULATION
126.94
MALES / 100 FEMALES
78.78
FEMALES / 100 MALES
51.0
MEDIAN AGE
2.6
AVG FAMILY SIZE
2.3
AVG HOUSEHOLD SIZE
542
LABOR FORCE [ PEOPLE ]
65.9%
PERCENT IN LABOR FORCE
3.7%
UNEMPLOYMENT RATE
Hauser Area Codes
Income in Hauser
Income Overview in Hauser
Per Capita Income in Hauser is $32,976, while median incomes of families and households are $55,417 and $54,875 respectively.
| Characteristic | Number | Measure |
| Per Capita Income | 935 | $32,976 |
| Median Family Income | 281 | $55,417 |
| Mean Family Income | 281 | $78,291 |
| Median Household Income | 407 | $54,875 |
| Mean Household Income | 407 | $71,731 |
| Income Deficit | 281 | $12,658 |
| Wage / Income Gap (%) | 935 | 37.61% |
| Wage / Income Gap ($) | 935 | 62.39¢ per $1 |
| Gini / Inequality Index | 935 | 0.40 |
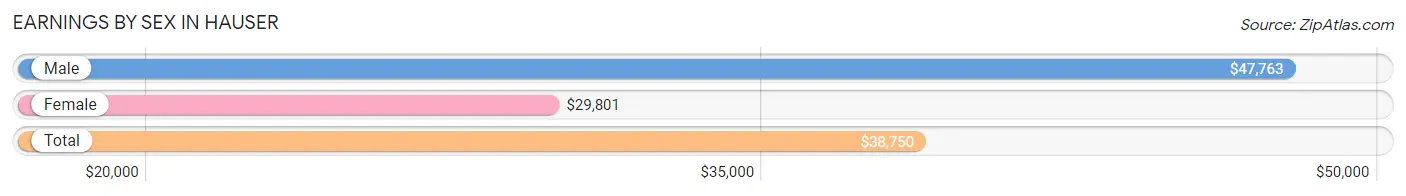
Earnings by Sex in Hauser
Average Earnings in Hauser are $38,750, $47,763 for men and $29,801 for women, a difference of 37.6%.
| Sex | Number | Average Earnings |
| Male | 290 (52.4%) | $47,763 |
| Female | 263 (47.6%) | $29,801 |
| Total | 553 (100.0%) | $38,750 |
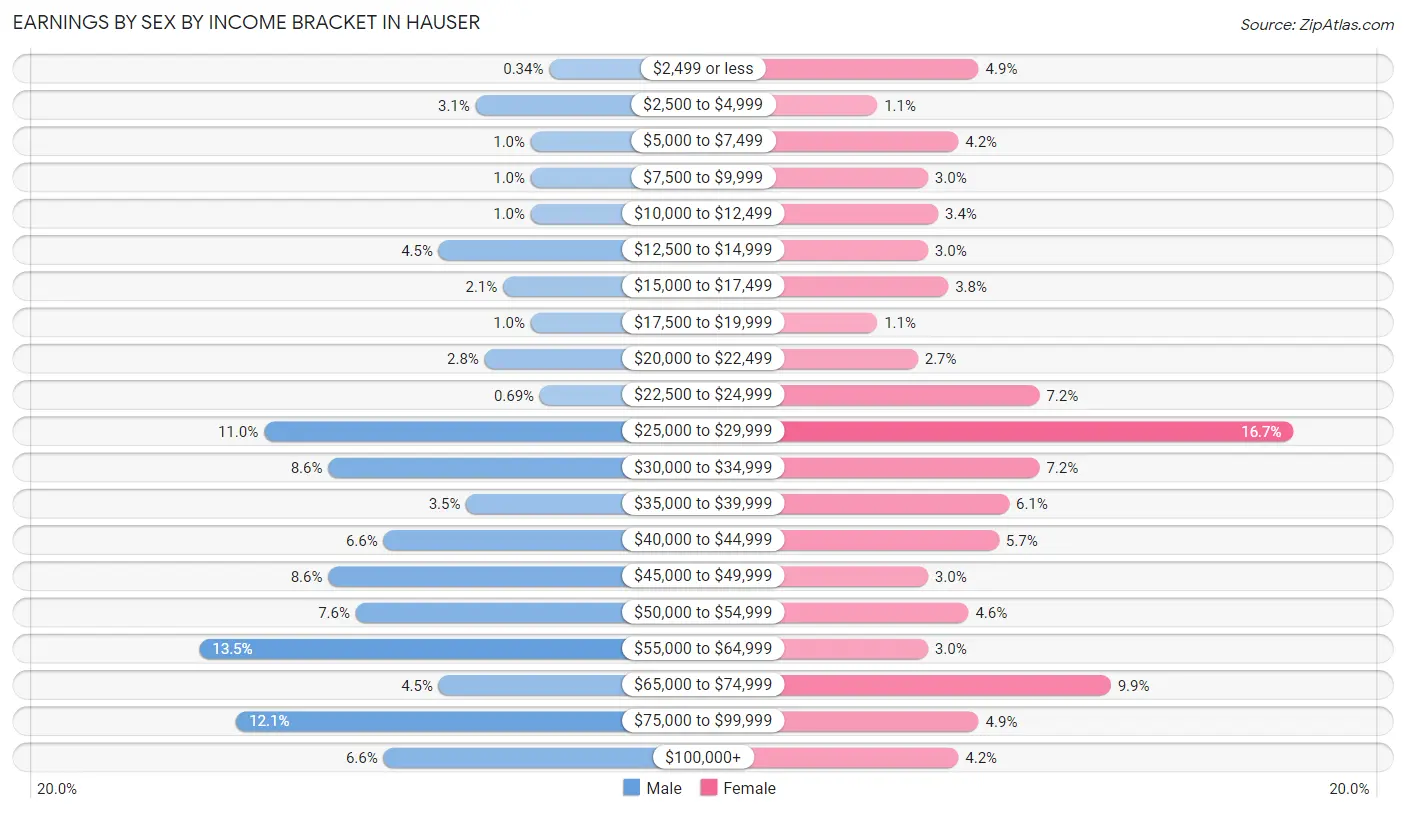
Earnings by Sex by Income Bracket in Hauser
The most common earnings brackets in Hauser are $55,000 to $64,999 for men (39 | 13.5%) and $25,000 to $29,999 for women (44 | 16.7%).
| Income | Male | Female |
| $2,499 or less | 1 (0.3%) | 13 (4.9%) |
| $2,500 to $4,999 | 9 (3.1%) | 3 (1.1%) |
| $5,000 to $7,499 | 3 (1.0%) | 11 (4.2%) |
| $7,500 to $9,999 | 3 (1.0%) | 8 (3.0%) |
| $10,000 to $12,499 | 3 (1.0%) | 9 (3.4%) |
| $12,500 to $14,999 | 13 (4.5%) | 8 (3.0%) |
| $15,000 to $17,499 | 6 (2.1%) | 10 (3.8%) |
| $17,500 to $19,999 | 3 (1.0%) | 3 (1.1%) |
| $20,000 to $22,499 | 8 (2.8%) | 7 (2.7%) |
| $22,500 to $24,999 | 2 (0.7%) | 19 (7.2%) |
| $25,000 to $29,999 | 32 (11.0%) | 44 (16.7%) |
| $30,000 to $34,999 | 25 (8.6%) | 19 (7.2%) |
| $35,000 to $39,999 | 10 (3.5%) | 16 (6.1%) |
| $40,000 to $44,999 | 19 (6.6%) | 15 (5.7%) |
| $45,000 to $49,999 | 25 (8.6%) | 8 (3.0%) |
| $50,000 to $54,999 | 22 (7.6%) | 12 (4.6%) |
| $55,000 to $64,999 | 39 (13.5%) | 8 (3.0%) |
| $65,000 to $74,999 | 13 (4.5%) | 26 (9.9%) |
| $75,000 to $99,999 | 35 (12.1%) | 13 (4.9%) |
| $100,000+ | 19 (6.6%) | 11 (4.2%) |
| Total | 290 (100.0%) | 263 (100.0%) |
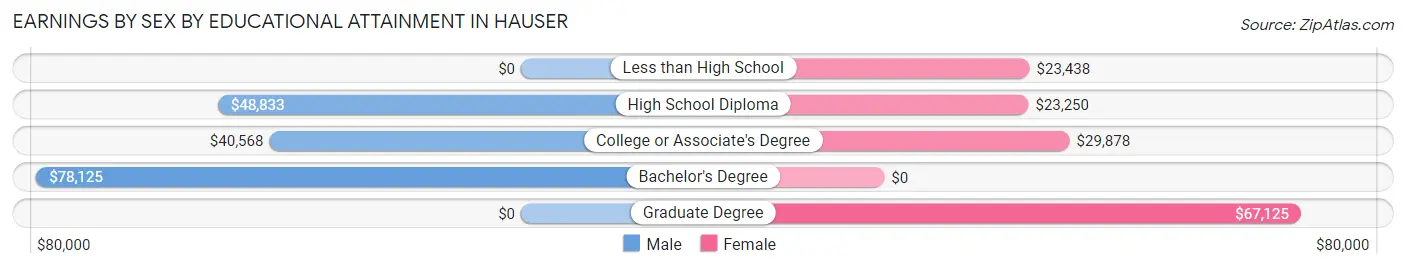
Earnings by Sex by Educational Attainment in Hauser
Average earnings in Hauser are $48,553 for men and $31,029 for women, a difference of 36.1%. Men with an educational attainment of bachelor's degree enjoy the highest average annual earnings of $78,125, while those with college or associate's degree education earn the least with $40,568. Women with an educational attainment of graduate degree earn the most with the average annual earnings of $67,125, while those with high school diploma education have the smallest earnings of $23,250.
| Educational Attainment | Male Income | Female Income |
| Less than High School | - | - |
| High School Diploma | $48,833 | $23,250 |
| College or Associate's Degree | $40,568 | $29,878 |
| Bachelor's Degree | $78,125 | $0 |
| Graduate Degree | - | - |
| Total | $48,553 | $31,029 |
Family Income in Hauser
Family Income Brackets in Hauser
According to the Hauser family income data, there are 77 families falling into the $35,000 to $49,999 income range, which is the most common income bracket and makes up 27.4% of all families. Conversely, the $10,000 to $14,999 income bracket is the least frequent group with only 4 families (1.4%) belonging to this category.
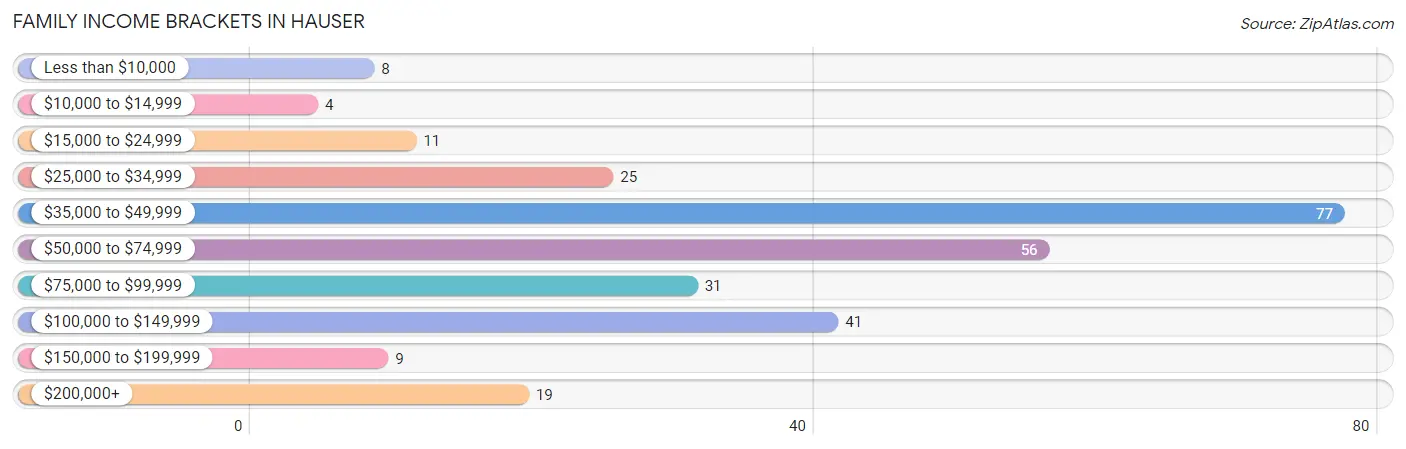
| Income Bracket | # Families | % Families |
| Less than $10,000 | 8 | 2.8% |
| $10,000 to $14,999 | 4 | 1.4% |
| $15,000 to $24,999 | 11 | 3.9% |
| $25,000 to $34,999 | 25 | 8.9% |
| $35,000 to $49,999 | 77 | 27.4% |
| $50,000 to $74,999 | 56 | 19.9% |
| $75,000 to $99,999 | 31 | 11.0% |
| $100,000 to $149,999 | 41 | 14.6% |
| $150,000 to $199,999 | 9 | 3.2% |
| $200,000+ | 19 | 6.8% |
Family Income by Famaliy Size in Hauser
5-person families (4 | 1.4%) account for the highest median family income in Hauser with $143,750 per family, while 5-person families (4 | 1.4%) have the highest median income of $28,750 per family member.
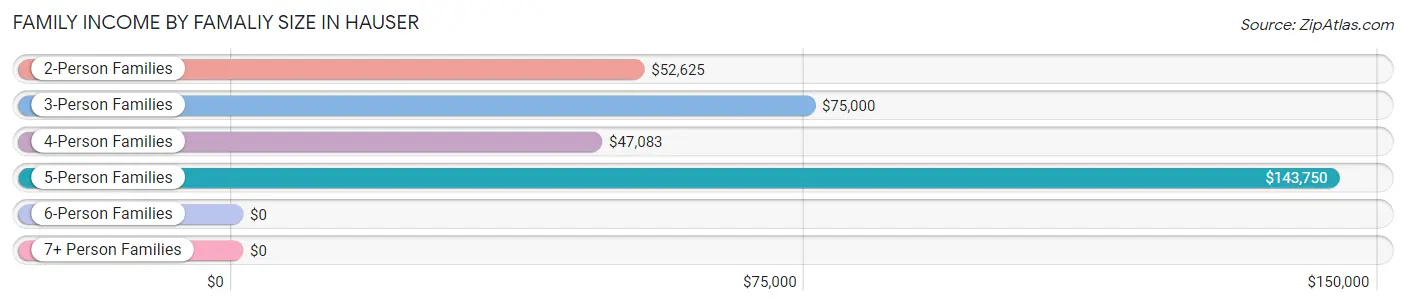
| Income Bracket | # Families | Median Income |
| 2-Person Families | 215 (76.5%) | $52,625 |
| 3-Person Families | 34 (12.1%) | $75,000 |
| 4-Person Families | 26 (9.2%) | $47,083 |
| 5-Person Families | 4 (1.4%) | $143,750 |
| 6-Person Families | 2 (0.7%) | $0 |
| 7+ Person Families | 0 (0.0%) | $0 |
| Total | 281 (100.0%) | $55,417 |
Family Income by Number of Earners in Hauser
The median family income in Hauser is $55,417, with families comprising 2 earners (119) having the highest median family income of $105,096, while families with no earners (36) have the lowest median family income of $28,750, accounting for 42.3% and 12.8% of families, respectively.
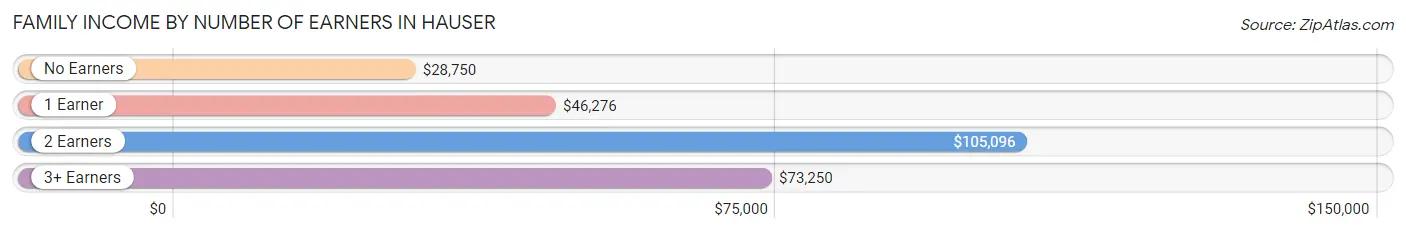
| Number of Earners | # Families | Median Income |
| No Earners | 36 (12.8%) | $28,750 |
| 1 Earner | 117 (41.6%) | $46,276 |
| 2 Earners | 119 (42.3%) | $105,096 |
| 3+ Earners | 9 (3.2%) | $73,250 |
| Total | 281 (100.0%) | $55,417 |
Household Income in Hauser
Household Income Brackets in Hauser
With 93 households falling in the category, the $35,000 to $49,999 income range is the most frequent in Hauser, accounting for 22.9% of all households. In contrast, only 9 households (2.2%) fall into the $150,000 to $199,999 income bracket, making it the least populous group.
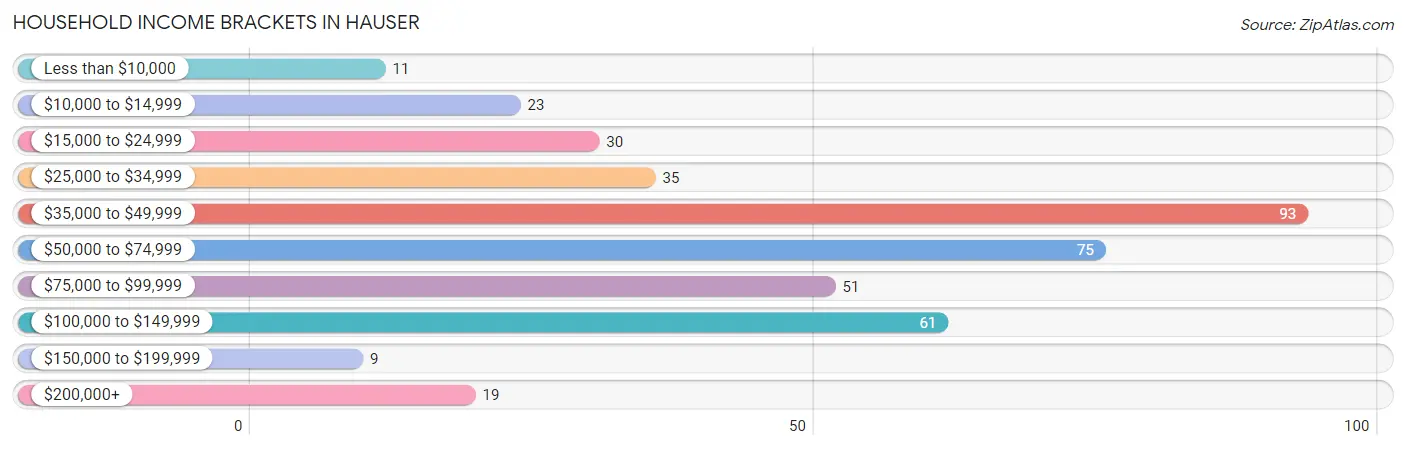
| Income Bracket | # Households | % Households |
| Less than $10,000 | 11 | 2.7% |
| $10,000 to $14,999 | 23 | 5.7% |
| $15,000 to $24,999 | 30 | 7.4% |
| $25,000 to $34,999 | 35 | 8.6% |
| $35,000 to $49,999 | 93 | 22.9% |
| $50,000 to $74,999 | 75 | 18.4% |
| $75,000 to $99,999 | 51 | 12.5% |
| $100,000 to $149,999 | 61 | 15.0% |
| $150,000 to $199,999 | 9 | 2.2% |
| $200,000+ | 19 | 4.7% |
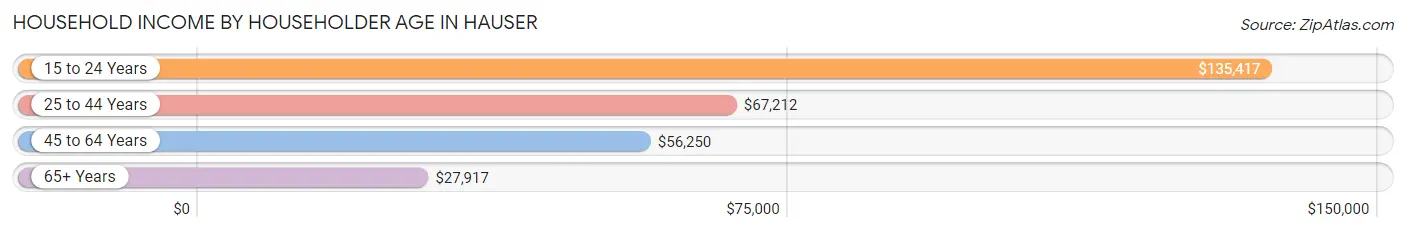
Household Income by Householder Age in Hauser
The median household income in Hauser is $54,875, with the highest median household income of $135,417 found in the 15 to 24 years age bracket for the primary householder. A total of 15 households (3.7%) fall into this category. Meanwhile, the 65+ years age bracket for the primary householder has the lowest median household income of $27,917, with 73 households (17.9%) in this group.
| Income Bracket | # Households | Median Income |
| 15 to 24 Years | 15 (3.7%) | $135,417 |
| 25 to 44 Years | 81 (19.9%) | $67,212 |
| 45 to 64 Years | 238 (58.5%) | $56,250 |
| 65+ Years | 73 (17.9%) | $27,917 |
| Total | 407 (100.0%) | $54,875 |
Poverty in Hauser
Income Below Poverty by Sex and Age in Hauser
With 5.0% poverty level for males and 11.4% for females among the residents of Hauser, 65 to 74 year old males and 18 to 24 year old females are the most vulnerable to poverty, with 9 males (26.5%) and 16 females (51.6%) in their respective age groups living below the poverty level.
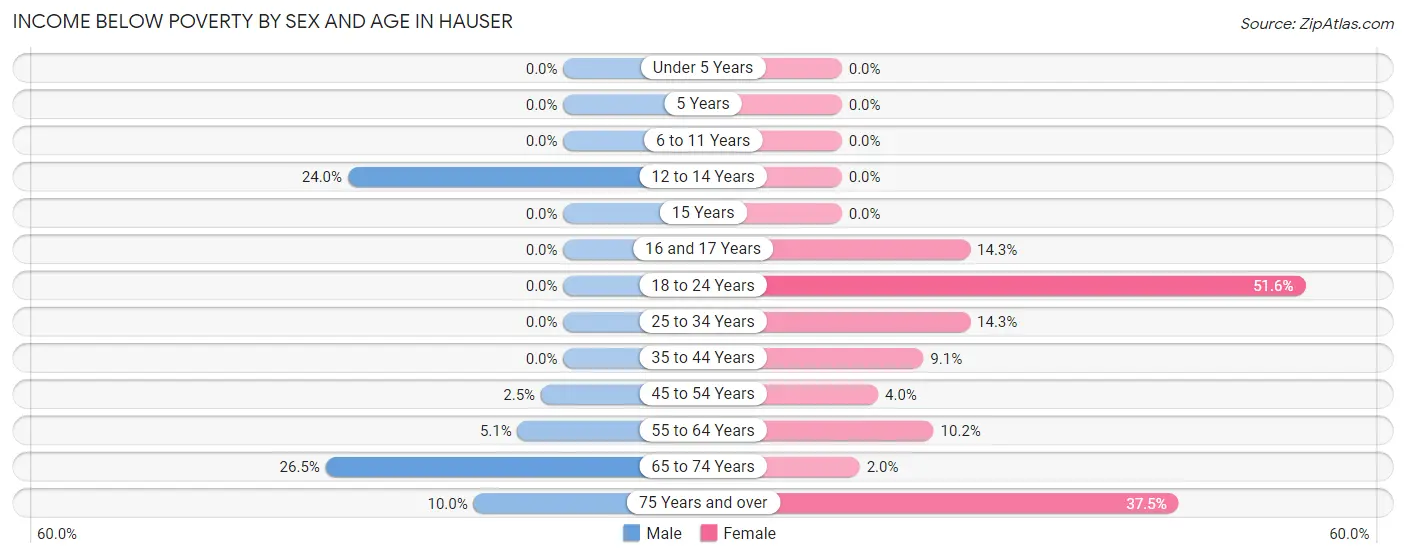
| Age Bracket | Male | Female |
| Under 5 Years | 0 (0.0%) | 0 (0.0%) |
| 5 Years | 0 (0.0%) | 0 (0.0%) |
| 6 to 11 Years | 0 (0.0%) | 0 (0.0%) |
| 12 to 14 Years | 6 (24.0%) | 0 (0.0%) |
| 15 Years | 0 (0.0%) | 0 (0.0%) |
| 16 and 17 Years | 0 (0.0%) | 1 (14.3%) |
| 18 to 24 Years | 0 (0.0%) | 16 (51.6%) |
| 25 to 34 Years | 0 (0.0%) | 5 (14.3%) |
| 35 to 44 Years | 0 (0.0%) | 5 (9.1%) |
| 45 to 54 Years | 2 (2.5%) | 4 (4.0%) |
| 55 to 64 Years | 8 (5.1%) | 9 (10.2%) |
| 65 to 74 Years | 9 (26.5%) | 1 (2.0%) |
| 75 Years and over | 1 (10.0%) | 6 (37.5%) |
| Total | 26 (5.0%) | 47 (11.4%) |
Income Above Poverty by Sex and Age in Hauser
According to the poverty statistics in Hauser, males aged under 5 years and females aged under 5 years are the age groups that are most secure financially, with 100.0% of males and 100.0% of females in these age groups living above the poverty line.
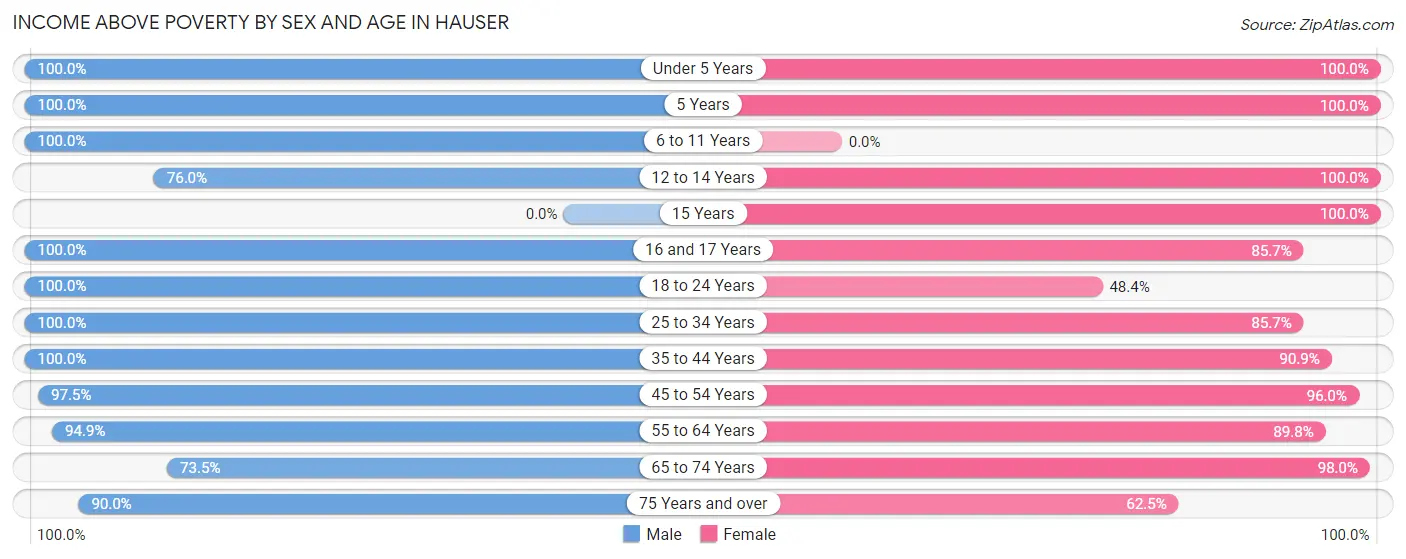
| Age Bracket | Male | Female |
| Under 5 Years | 13 (100.0%) | 20 (100.0%) |
| 5 Years | 6 (100.0%) | 1 (100.0%) |
| 6 to 11 Years | 34 (100.0%) | 0 (0.0%) |
| 12 to 14 Years | 19 (76.0%) | 9 (100.0%) |
| 15 Years | 0 (0.0%) | 1 (100.0%) |
| 16 and 17 Years | 1 (100.0%) | 6 (85.7%) |
| 18 to 24 Years | 29 (100.0%) | 15 (48.4%) |
| 25 to 34 Years | 89 (100.0%) | 30 (85.7%) |
| 35 to 44 Years | 42 (100.0%) | 50 (90.9%) |
| 45 to 54 Years | 78 (97.5%) | 95 (96.0%) |
| 55 to 64 Years | 149 (94.9%) | 79 (89.8%) |
| 65 to 74 Years | 25 (73.5%) | 49 (98.0%) |
| 75 Years and over | 9 (90.0%) | 10 (62.5%) |
| Total | 494 (95.0%) | 365 (88.6%) |
Income Below Poverty Among Married-Couple Families in Hauser
The poverty statistics for married-couple families in Hauser show that 2.4% or 5 of the total 210 families live below the poverty line. Families with no children have the highest poverty rate of 2.7%, comprising of 5 families. On the other hand, families with 1 or 2 children have the lowest poverty rate of 0.0%, which includes 0 families.
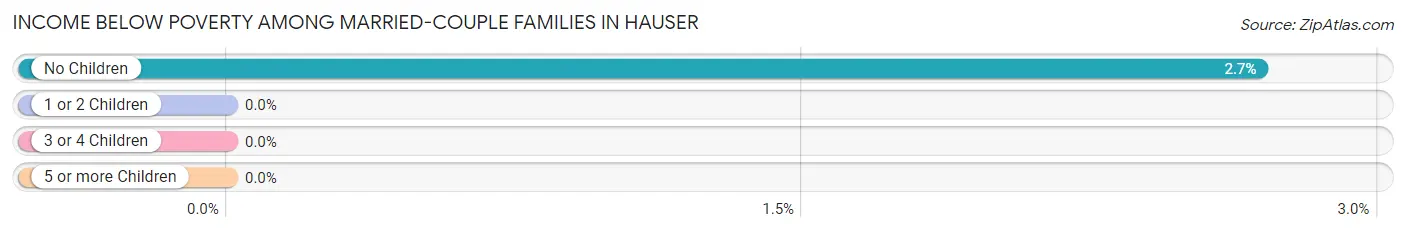
| Children | Above Poverty | Below Poverty |
| No Children | 181 (97.3%) | 5 (2.7%) |
| 1 or 2 Children | 20 (100.0%) | 0 (0.0%) |
| 3 or 4 Children | 4 (100.0%) | 0 (0.0%) |
| 5 or more Children | 0 (0.0%) | 0 (0.0%) |
| Total | 205 (97.6%) | 5 (2.4%) |
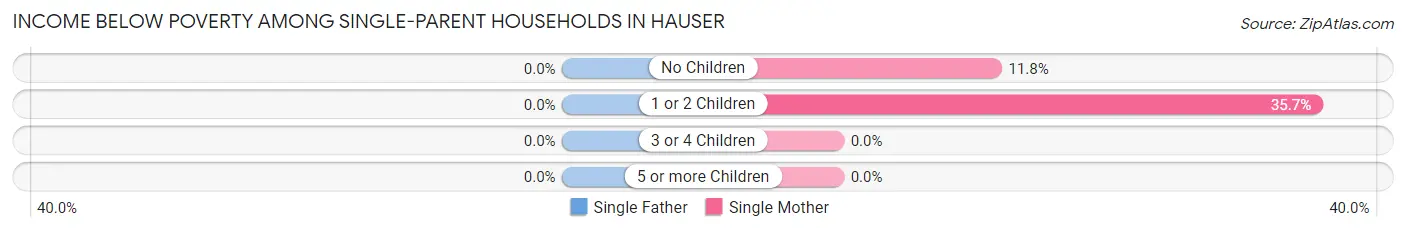
Income Below Poverty Among Single-Parent Households in Hauser
| Children | Single Father | Single Mother |
| No Children | 0 (0.0%) | 2 (11.8%) |
| 1 or 2 Children | 0 (0.0%) | 5 (35.7%) |
| 3 or 4 Children | 0 (0.0%) | 0 (0.0%) |
| 5 or more Children | 0 (0.0%) | 0 (0.0%) |
| Total | 0 (0.0%) | 7 (22.6%) |
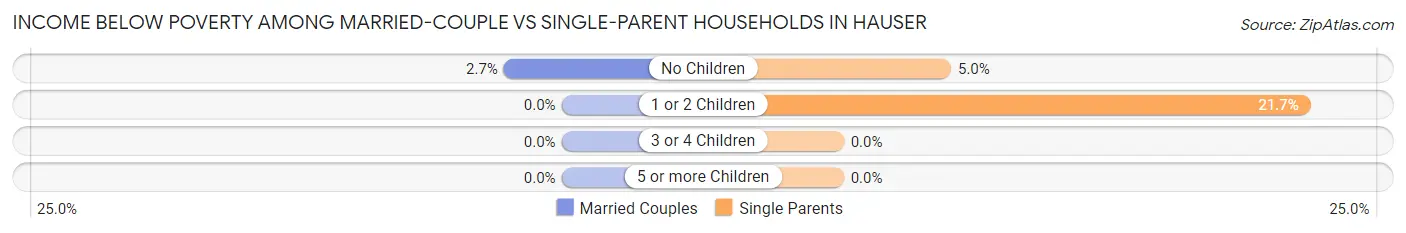
Income Below Poverty Among Married-Couple vs Single-Parent Households in Hauser
The poverty data for Hauser shows that 5 of the married-couple family households (2.4%) and 7 of the single-parent households (9.9%) are living below the poverty level. Within the married-couple family households, those with no children have the highest poverty rate, with 5 households (2.7%) falling below the poverty line. Among the single-parent households, those with 1 or 2 children have the highest poverty rate, with 5 household (21.7%) living below poverty.
| Children | Married-Couple Families | Single-Parent Households |
| No Children | 5 (2.7%) | 2 (5.0%) |
| 1 or 2 Children | 0 (0.0%) | 5 (21.7%) |
| 3 or 4 Children | 0 (0.0%) | 0 (0.0%) |
| 5 or more Children | 0 (0.0%) | 0 (0.0%) |
| Total | 5 (2.4%) | 7 (9.9%) |
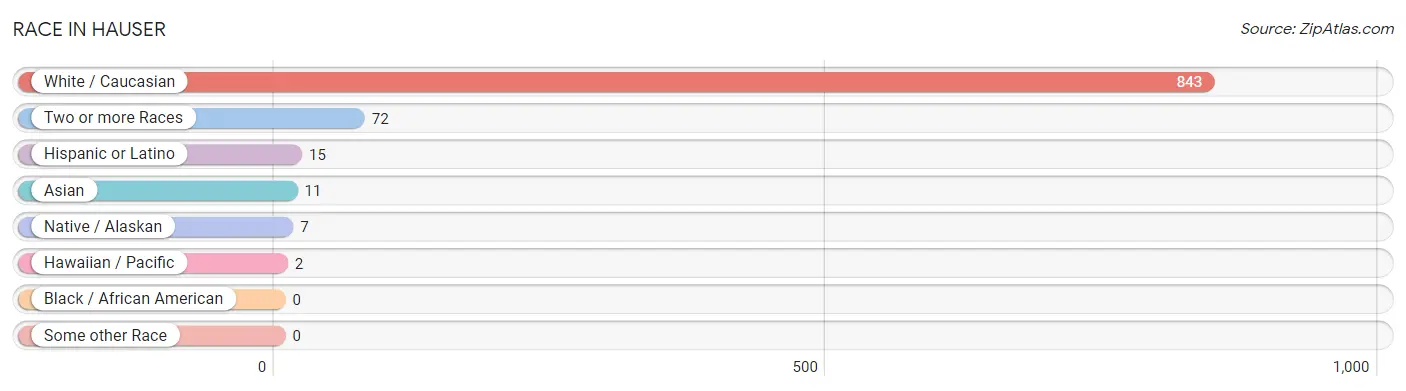
Race in Hauser
The most populous races in Hauser are White / Caucasian (843 | 90.2%), Two or more Races (72 | 7.7%), and Hispanic or Latino (15 | 1.6%).
| Race | # Population | % Population |
| Asian | 11 | 1.2% |
| Black / African American | 0 | 0.0% |
| Hawaiian / Pacific | 2 | 0.2% |
| Hispanic or Latino | 15 | 1.6% |
| Native / Alaskan | 7 | 0.7% |
| White / Caucasian | 843 | 90.2% |
| Two or more Races | 72 | 7.7% |
| Some other Race | 0 | 0.0% |
| Total | 935 | 100.0% |
Ancestry in Hauser
The most populous ancestries reported in Hauser are German (263 | 28.1%), English (131 | 14.0%), French (96 | 10.3%), Irish (73 | 7.8%), and Norwegian (66 | 7.1%), together accounting for 67.3% of all Hauser residents.

| Ancestry | # Population | % Population |
| American | 29 | 3.1% |
| Bhutanese | 4 | 0.4% |
| Blackfeet | 4 | 0.4% |
| Cuban | 2 | 0.2% |
| Czech | 5 | 0.5% |
| Czechoslovakian | 1 | 0.1% |
| Dutch | 3 | 0.3% |
| Eastern European | 8 | 0.9% |
| English | 131 | 14.0% |
| European | 3 | 0.3% |
| Finnish | 6 | 0.6% |
| French | 96 | 10.3% |
| French Canadian | 7 | 0.7% |
| German | 263 | 28.1% |
| Guamanian / Chamorro | 2 | 0.2% |
| Hungarian | 10 | 1.1% |
| Indian (Asian) | 2 | 0.2% |
| Irish | 73 | 7.8% |
| Italian | 26 | 2.8% |
| Jamaican | 2 | 0.2% |
| Korean | 5 | 0.5% |
| Mexican | 11 | 1.2% |
| Norwegian | 66 | 7.1% |
| Paiute | 9 | 1.0% |
| Polish | 14 | 1.5% |
| Puerto Rican | 2 | 0.2% |
| Russian | 3 | 0.3% |
| Scandinavian | 5 | 0.5% |
| Scotch-Irish | 6 | 0.6% |
| Scottish | 42 | 4.5% |
| Slovene | 1 | 0.1% |
| Swedish | 24 | 2.6% | View All 32 Rows |
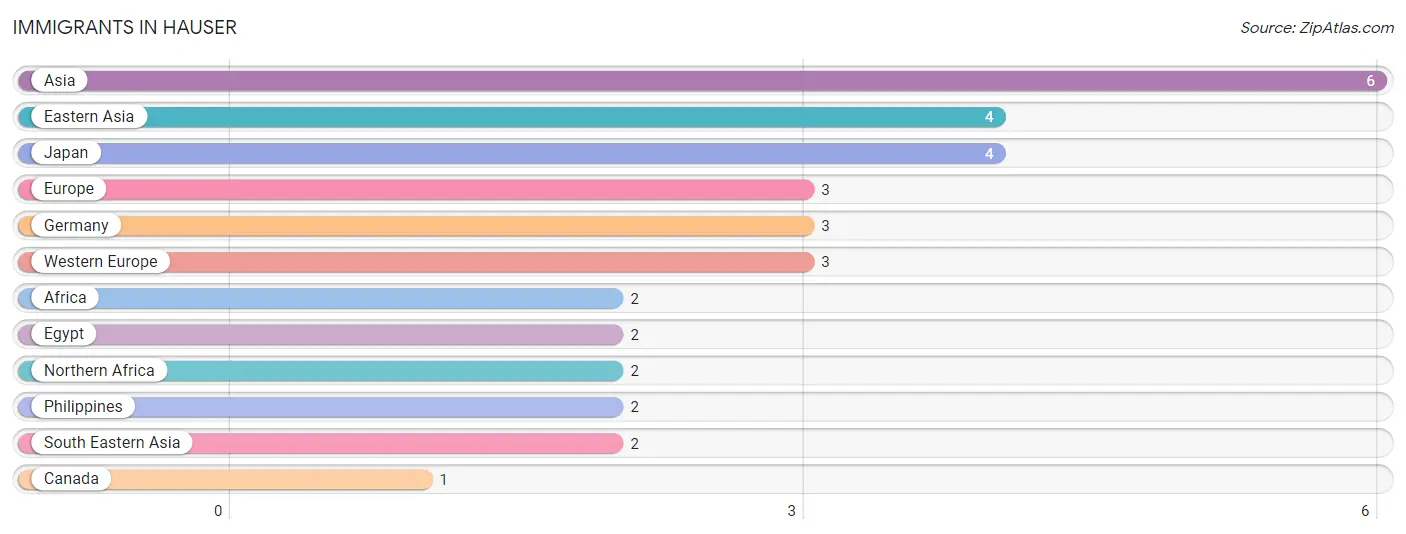
Immigrants in Hauser
The most numerous immigrant groups reported in Hauser came from Asia (6 | 0.6%), Eastern Asia (4 | 0.4%), Japan (4 | 0.4%), Europe (3 | 0.3%), and Germany (3 | 0.3%), together accounting for 2.1% of all Hauser residents.
| Immigration Origin | # Population | % Population |
| Africa | 2 | 0.2% |
| Asia | 6 | 0.6% |
| Canada | 1 | 0.1% |
| Eastern Asia | 4 | 0.4% |
| Egypt | 2 | 0.2% |
| Europe | 3 | 0.3% |
| Germany | 3 | 0.3% |
| Japan | 4 | 0.4% |
| Northern Africa | 2 | 0.2% |
| Philippines | 2 | 0.2% |
| South Eastern Asia | 2 | 0.2% |
| Western Europe | 3 | 0.3% | View All 12 Rows |
Sex and Age in Hauser
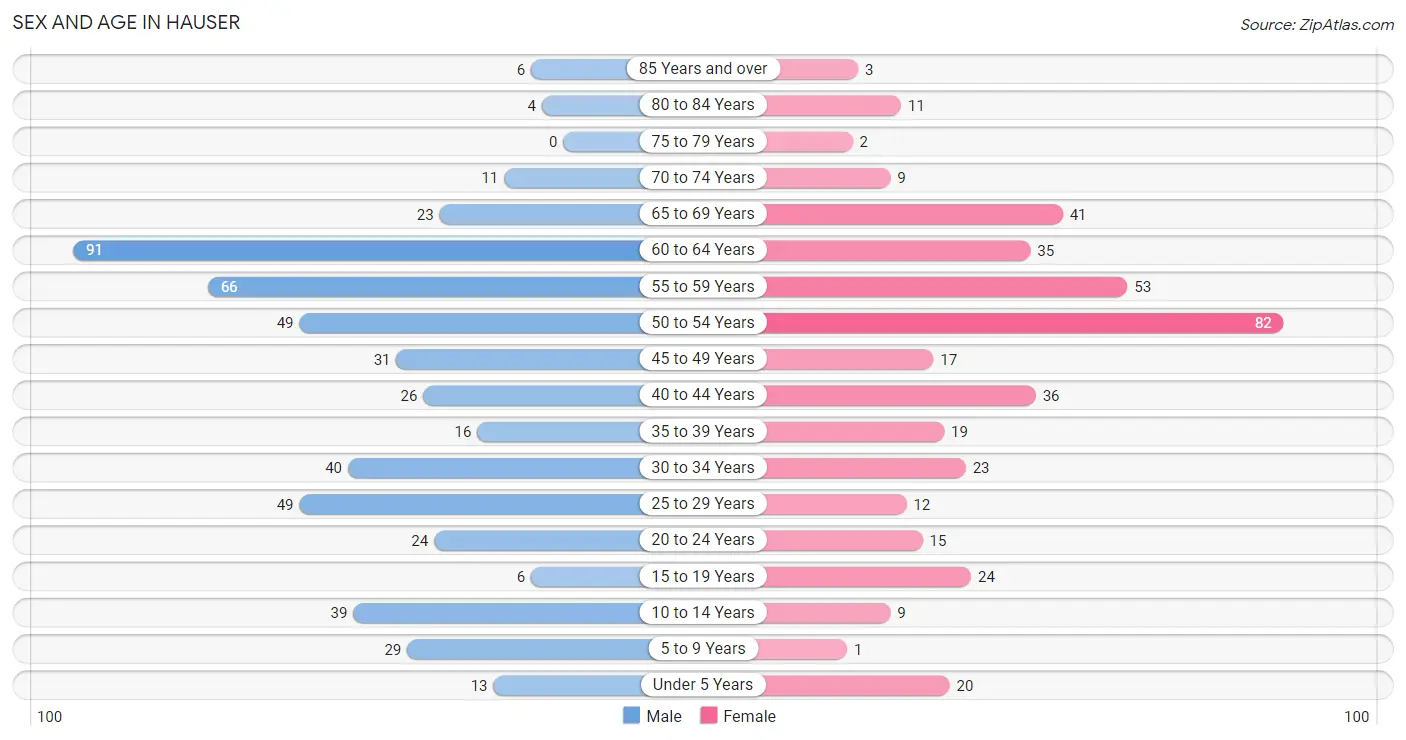
Sex and Age in Hauser
The most populous age groups in Hauser are 60 to 64 Years (91 | 17.4%) for men and 50 to 54 Years (82 | 19.9%) for women.
| Age Bracket | Male | Female |
| Under 5 Years | 13 (2.5%) | 20 (4.9%) |
| 5 to 9 Years | 29 (5.5%) | 1 (0.2%) |
| 10 to 14 Years | 39 (7.5%) | 9 (2.2%) |
| 15 to 19 Years | 6 (1.1%) | 24 (5.8%) |
| 20 to 24 Years | 24 (4.6%) | 15 (3.6%) |
| 25 to 29 Years | 49 (9.4%) | 12 (2.9%) |
| 30 to 34 Years | 40 (7.6%) | 23 (5.6%) |
| 35 to 39 Years | 16 (3.1%) | 19 (4.6%) |
| 40 to 44 Years | 26 (5.0%) | 36 (8.7%) |
| 45 to 49 Years | 31 (5.9%) | 17 (4.1%) |
| 50 to 54 Years | 49 (9.4%) | 82 (19.9%) |
| 55 to 59 Years | 66 (12.6%) | 53 (12.9%) |
| 60 to 64 Years | 91 (17.4%) | 35 (8.5%) |
| 65 to 69 Years | 23 (4.4%) | 41 (10.0%) |
| 70 to 74 Years | 11 (2.1%) | 9 (2.2%) |
| 75 to 79 Years | 0 (0.0%) | 2 (0.5%) |
| 80 to 84 Years | 4 (0.8%) | 11 (2.7%) |
| 85 Years and over | 6 (1.1%) | 3 (0.7%) |
| Total | 523 (100.0%) | 412 (100.0%) |
Families and Households in Hauser
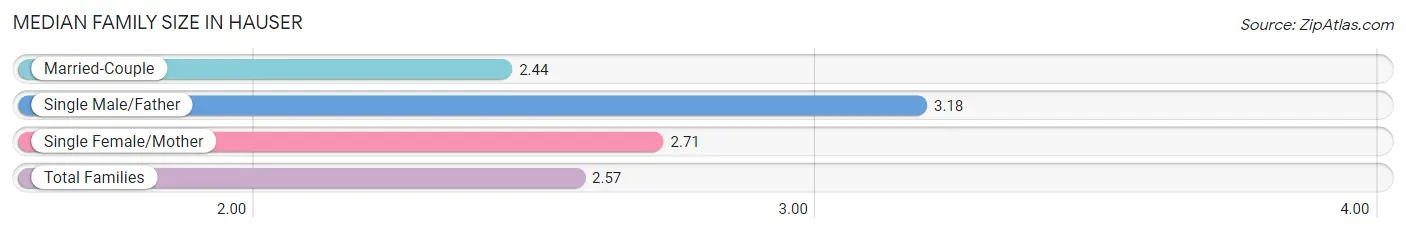
Median Family Size in Hauser
The median family size in Hauser is 2.57 persons per family, with single male/father families (40 | 14.2%) accounting for the largest median family size of 3.18 persons per family. On the other hand, married-couple families (210 | 74.7%) represent the smallest median family size with 2.44 persons per family.
| Family Type | # Families | Family Size |
| Married-Couple | 210 (74.7%) | 2.44 |
| Single Male/Father | 40 (14.2%) | 3.18 |
| Single Female/Mother | 31 (11.0%) | 2.71 |
| Total Families | 281 (100.0%) | 2.57 |
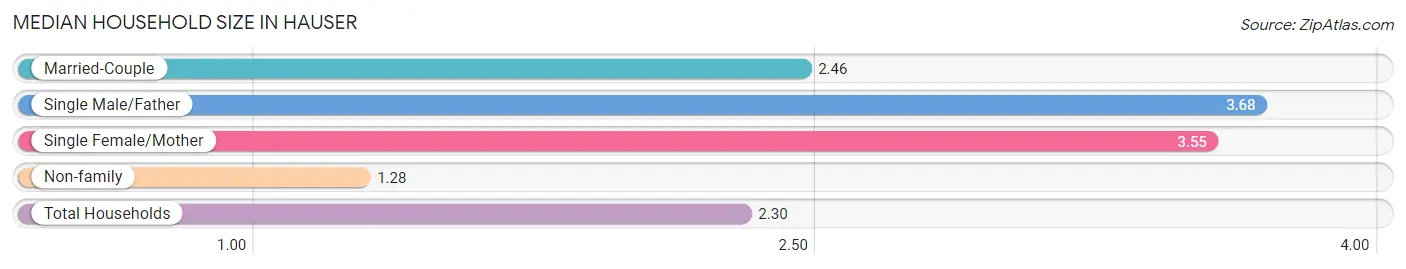
Median Household Size in Hauser
The median household size in Hauser is 2.30 persons per household, with single male/father households (40 | 9.8%) accounting for the largest median household size of 3.68 persons per household. non-family households (126 | 31.0%) represent the smallest median household size with 1.28 persons per household.
| Household Type | # Households | Household Size |
| Married-Couple | 210 (51.6%) | 2.46 |
| Single Male/Father | 40 (9.8%) | 3.68 |
| Single Female/Mother | 31 (7.6%) | 3.55 |
| Non-family | 126 (31.0%) | 1.28 |
| Total Households | 407 (100.0%) | 2.30 |
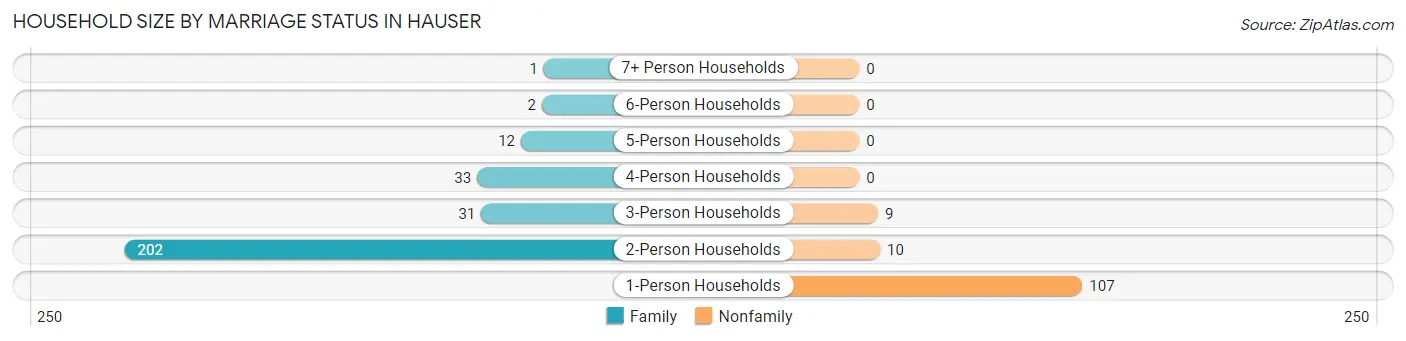
Household Size by Marriage Status in Hauser
Out of a total of 407 households in Hauser, 281 (69.0%) are family households, while 126 (31.0%) are nonfamily households. The most numerous type of family households are 2-person households, comprising 202, and the most common type of nonfamily households are 1-person households, comprising 107.
| Household Size | Family Households | Nonfamily Households |
| 1-Person Households | - | 107 (26.3%) |
| 2-Person Households | 202 (49.6%) | 10 (2.5%) |
| 3-Person Households | 31 (7.6%) | 9 (2.2%) |
| 4-Person Households | 33 (8.1%) | 0 (0.0%) |
| 5-Person Households | 12 (2.9%) | 0 (0.0%) |
| 6-Person Households | 2 (0.5%) | 0 (0.0%) |
| 7+ Person Households | 1 (0.3%) | 0 (0.0%) |
| Total | 281 (69.0%) | 126 (31.0%) |
Female Fertility in Hauser
Fertility by Age in Hauser
Average fertility rate in Hauser is 73.0 births per 1,000 women. Women in the age bracket of 20 to 34 years have the highest fertility rate with 200.0 births per 1,000 women. Women in the age bracket of 20 to 34 years acount for 83.3% of all women with births.
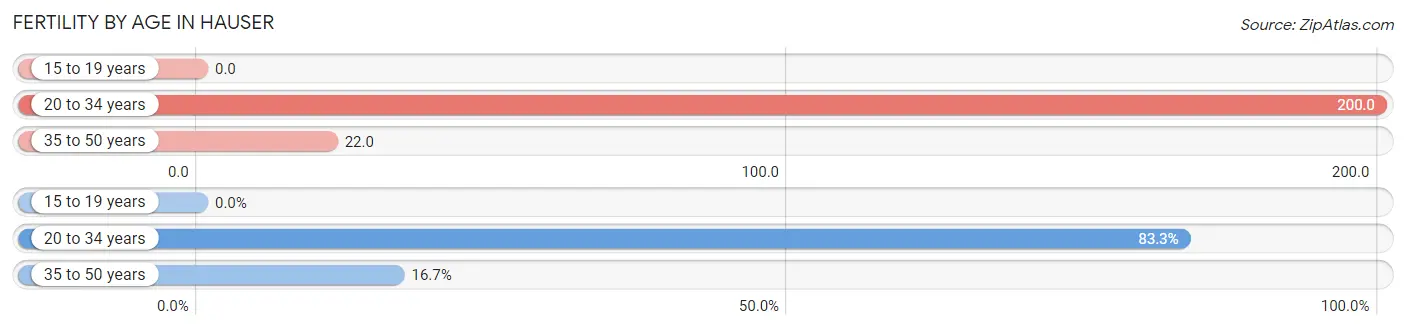
| Age Bracket | Women with Births | Births / 1,000 Women |
| 15 to 19 years | 0 (0.0%) | 0.0 |
| 20 to 34 years | 10 (83.3%) | 200.0 |
| 35 to 50 years | 2 (16.7%) | 22.0 |
| Total | 12 (100.0%) | 73.0 |
Fertility by Age by Marriage Status in Hauser
16.7% of women with births (12) in Hauser are married. The highest percentage of unmarried women with births falls into 20 to 34 years age bracket with 100.0% of them unmarried at the time of birth, while the lowest percentage of unmarried women with births belong to 35 to 50 years age bracket with 0.0% of them unmarried.
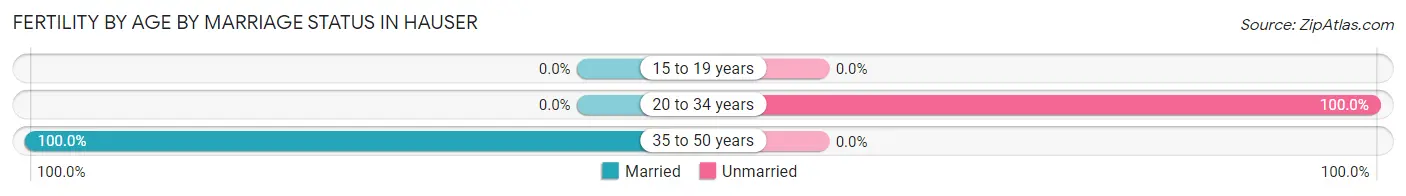
| Age Bracket | Married | Unmarried |
| 15 to 19 years | 0 (0.0%) | 0 (0.0%) |
| 20 to 34 years | 0 (0.0%) | 10 (100.0%) |
| 35 to 50 years | 2 (100.0%) | 0 (0.0%) |
| Total | 2 (16.7%) | 10 (83.3%) |
Fertility by Education in Hauser
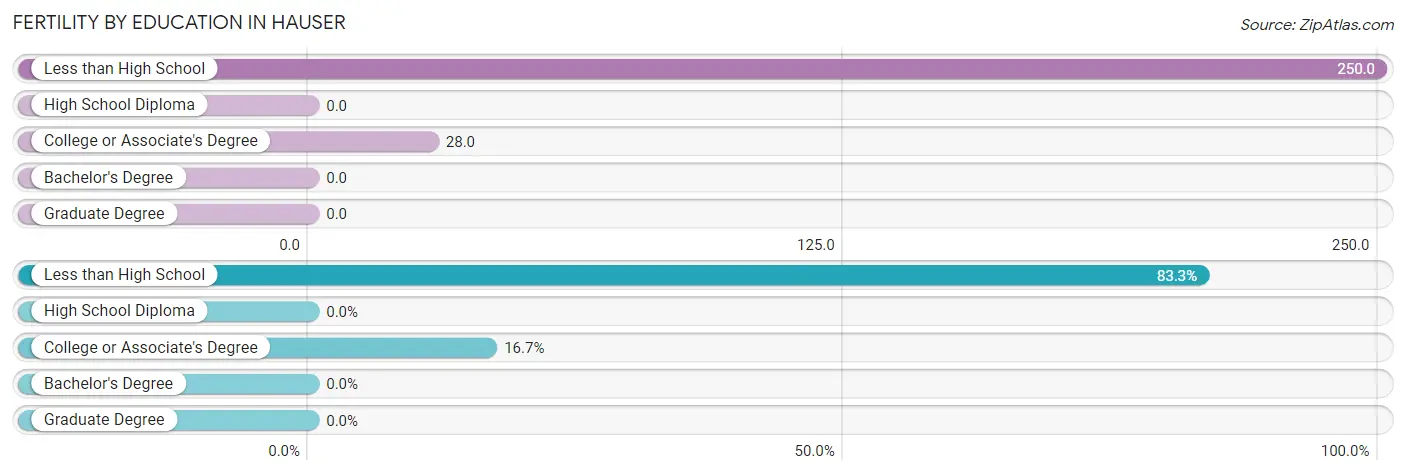
| Educational Attainment | Women with Births | Births / 1,000 Women |
| Less than High School | 10 (83.3%) | 250.0 |
| High School Diploma | 0 (0.0%) | 0.0 |
| College or Associate's Degree | 2 (16.7%) | 28.0 |
| Bachelor's Degree | 0 (0.0%) | 0.0 |
| Graduate Degree | 0 (0.0%) | 0.0 |
| Total | 12 (100.0%) | 73.0 |
Fertility by Education by Marriage Status in Hauser
83.3% of women with births in Hauser are unmarried. Women with the educational attainment of college or associate's degree are most likely to be married with 100.0% of them married at childbirth, while women with the educational attainment of less than high school are least likely to be married with 100.0% of them unmarried at childbirth.
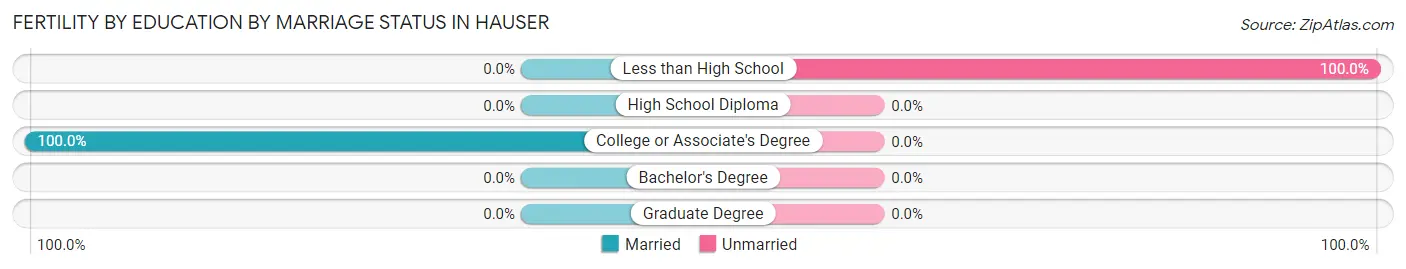
| Educational Attainment | Married | Unmarried |
| Less than High School | 0 (0.0%) | 10 (100.0%) |
| High School Diploma | 0 (0.0%) | 0 (0.0%) |
| College or Associate's Degree | 2 (100.0%) | 0 (0.0%) |
| Bachelor's Degree | 0 (0.0%) | 0 (0.0%) |
| Graduate Degree | 0 (0.0%) | 0 (0.0%) |
| Total | 2 (16.7%) | 10 (83.3%) |
Employment Characteristics in Hauser
Employment by Class of Employer in Hauser
Among the 513 employed individuals in Hauser, private company employees (390 | 76.0%), self-employed (not incorporated) (38 | 7.4%), and local government employees (30 | 5.9%) make up the most common classes of employment.
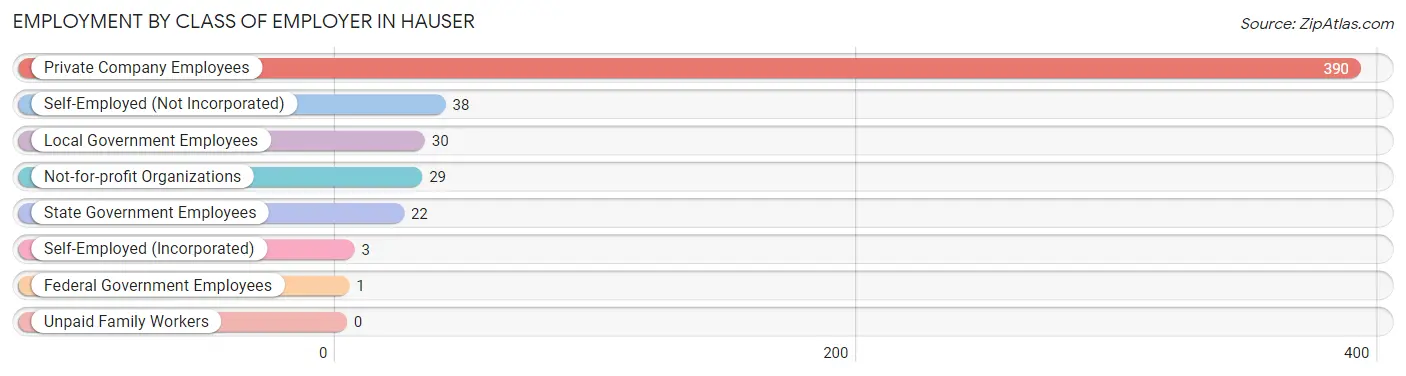
| Employer Class | # Employees | % Employees |
| Private Company Employees | 390 | 76.0% |
| Self-Employed (Incorporated) | 3 | 0.6% |
| Self-Employed (Not Incorporated) | 38 | 7.4% |
| Not-for-profit Organizations | 29 | 5.7% |
| Local Government Employees | 30 | 5.9% |
| State Government Employees | 22 | 4.3% |
| Federal Government Employees | 1 | 0.2% |
| Unpaid Family Workers | 0 | 0.0% |
| Total | 513 | 100.0% |
Employment Status by Age in Hauser
According to the labor force statistics for Hauser, out of the total population over 16 years of age (823), 65.9% or 542 individuals are in the labor force, with 3.7% or 20 of them unemployed. The age group with the highest labor force participation rate is 20 to 24 years, with 100.0% or 39 individuals in the labor force. Within the labor force, the 35 to 44 years age range has the highest percentage of unemployed individuals, with 9.5% or 8 of them being unemployed.
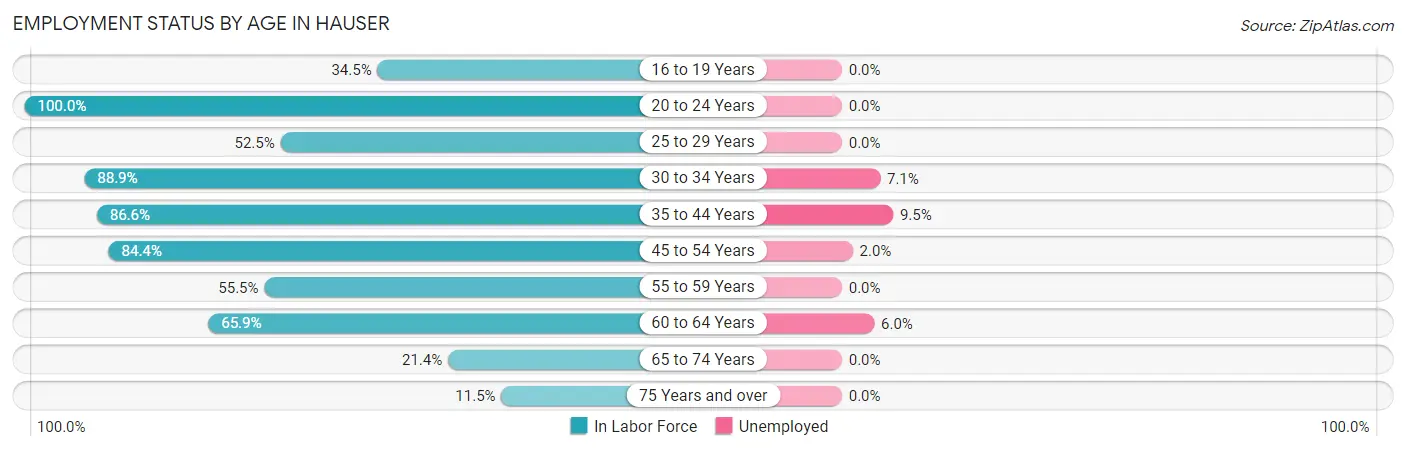
| Age Bracket | In Labor Force | Unemployed |
| 16 to 19 Years | 10 (34.5%) | 0 (0.0%) |
| 20 to 24 Years | 39 (100.0%) | 0 (0.0%) |
| 25 to 29 Years | 32 (52.5%) | 0 (0.0%) |
| 30 to 34 Years | 56 (88.9%) | 4 (7.1%) |
| 35 to 44 Years | 84 (86.6%) | 8 (9.5%) |
| 45 to 54 Years | 151 (84.4%) | 3 (2.0%) |
| 55 to 59 Years | 66 (55.5%) | 0 (0.0%) |
| 60 to 64 Years | 83 (65.9%) | 5 (6.0%) |
| 65 to 74 Years | 18 (21.4%) | 0 (0.0%) |
| 75 Years and over | 3 (11.5%) | 0 (0.0%) |
| Total | 542 (65.9%) | 20 (3.7%) |
Employment Status by Educational Attainment in Hauser
According to labor force statistics for Hauser, 73.2% of individuals (472) out of the total population between 25 and 64 years of age (645) are in the labor force, with 4.2% or 20 of them being unemployed. The group with the highest labor force participation rate are those with the educational attainment of bachelor's degree or higher, with 92.4% or 85 individuals in the labor force. Within the labor force, individuals with less than high school education have the highest percentage of unemployment, with 20.0% or 6 of them being unemployed.
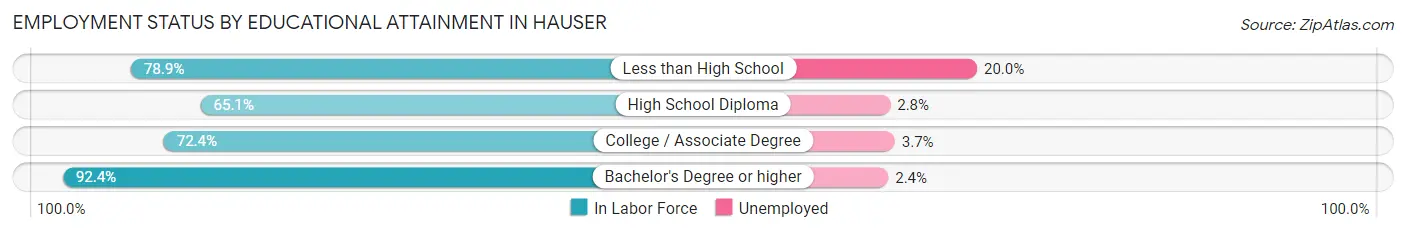
| Educational Attainment | In Labor Force | Unemployed |
| Less than High School | 30 (78.9%) | 8 (20.0%) |
| High School Diploma | 142 (65.1%) | 6 (2.8%) |
| College / Associate Degree | 215 (72.4%) | 11 (3.7%) |
| Bachelor's Degree or higher | 85 (92.4%) | 2 (2.4%) |
| Total | 472 (73.2%) | 27 (4.2%) |
Employment Occupations by Sex in Hauser
Management, Business, Science and Arts Occupations
The most common Management, Business, Science and Arts occupations in Hauser are Community & Social Service (63 | 12.1%), Education Instruction & Library (32 | 6.1%), Management (29 | 5.6%), Education, Arts & Media (23 | 4.4%), and Computers, Engineering & Science (19 | 3.6%).
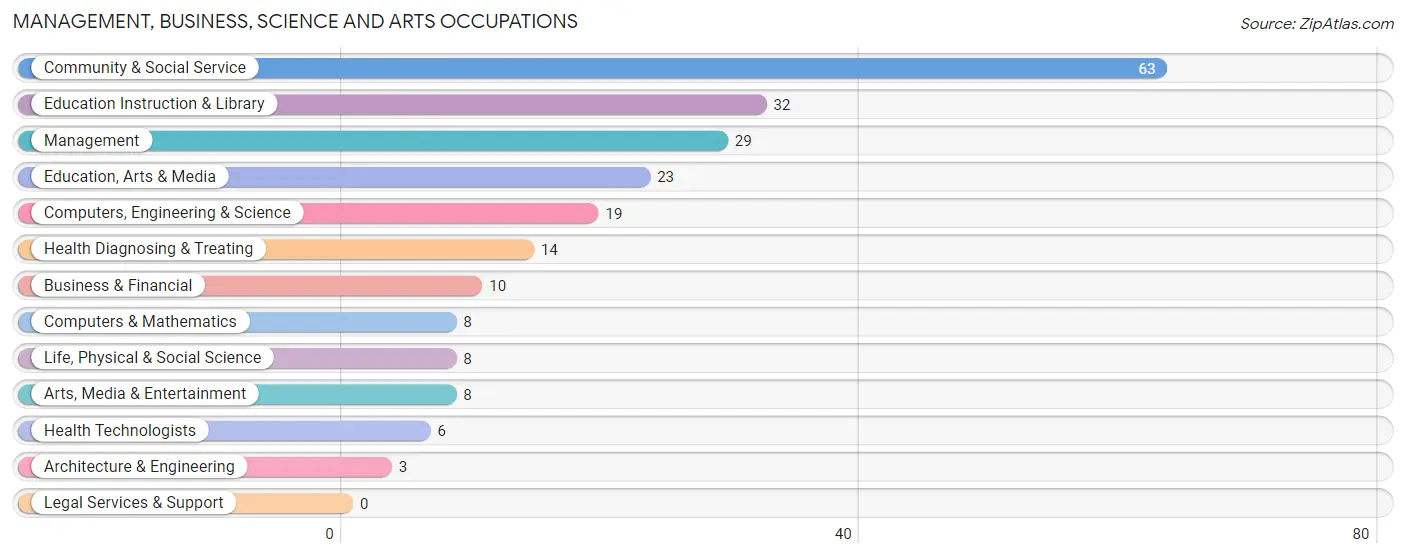
Management, Business, Science and Arts Occupations by Sex
Within the Management, Business, Science and Arts occupations in Hauser, the most male-oriented occupations are Arts, Media & Entertainment (100.0%), Computers & Mathematics (75.0%), and Management (69.0%), while the most female-oriented occupations are Business & Financial (100.0%), Health Diagnosing & Treating (100.0%), and Health Technologists (100.0%).
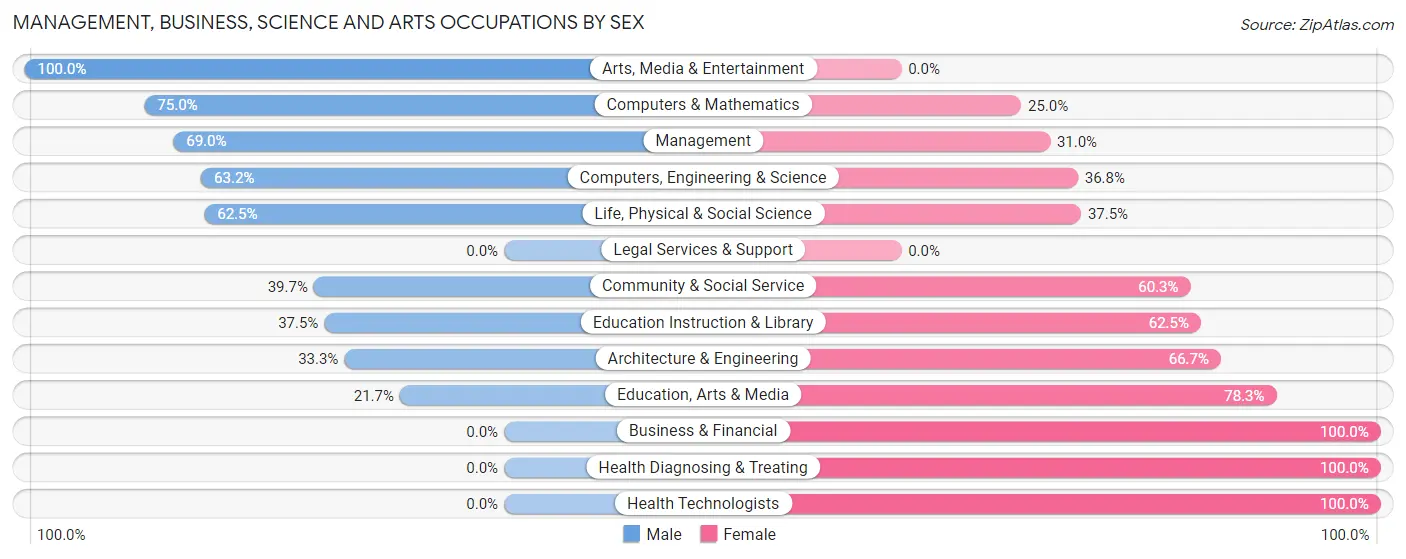
| Occupation | Male | Female |
| Management | 20 (69.0%) | 9 (31.0%) |
| Business & Financial | 0 (0.0%) | 10 (100.0%) |
| Computers, Engineering & Science | 12 (63.2%) | 7 (36.8%) |
| Computers & Mathematics | 6 (75.0%) | 2 (25.0%) |
| Architecture & Engineering | 1 (33.3%) | 2 (66.7%) |
| Life, Physical & Social Science | 5 (62.5%) | 3 (37.5%) |
| Community & Social Service | 25 (39.7%) | 38 (60.3%) |
| Education, Arts & Media | 5 (21.7%) | 18 (78.3%) |
| Legal Services & Support | 0 (0.0%) | 0 (0.0%) |
| Education Instruction & Library | 12 (37.5%) | 20 (62.5%) |
| Arts, Media & Entertainment | 8 (100.0%) | 0 (0.0%) |
| Health Diagnosing & Treating | 0 (0.0%) | 14 (100.0%) |
| Health Technologists | 0 (0.0%) | 6 (100.0%) |
| Total (Category) | 57 (42.2%) | 78 (57.8%) |
| Total (Overall) | 275 (52.7%) | 247 (47.3%) |
Services Occupations
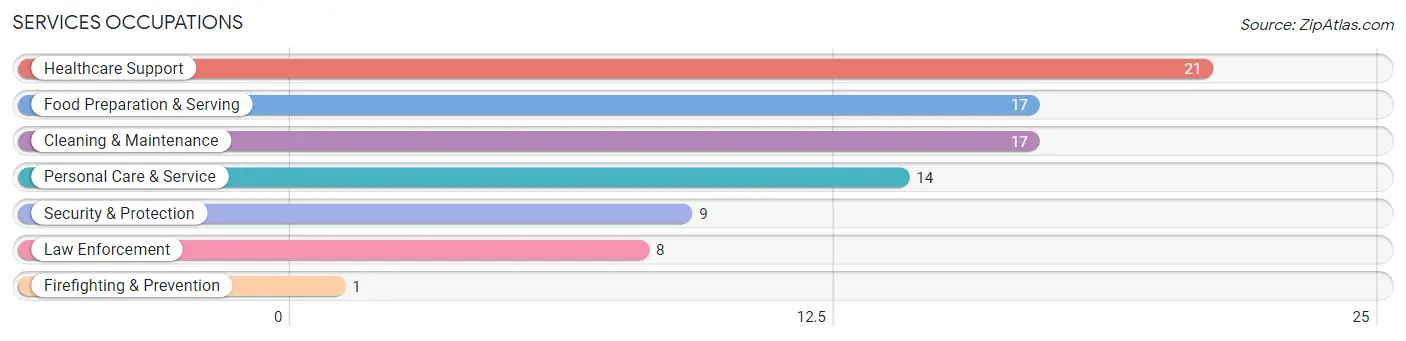
The most common Services occupations in Hauser are Healthcare Support (21 | 4.0%), Food Preparation & Serving (17 | 3.3%), Cleaning & Maintenance (17 | 3.3%), Personal Care & Service (14 | 2.7%), and Security & Protection (9 | 1.7%).
Services Occupations by Sex
Within the Services occupations in Hauser, the most male-oriented occupations are Security & Protection (100.0%), Firefighting & Prevention (100.0%), and Law Enforcement (100.0%), while the most female-oriented occupations are Personal Care & Service (100.0%), Healthcare Support (95.2%), and Food Preparation & Serving (47.1%).
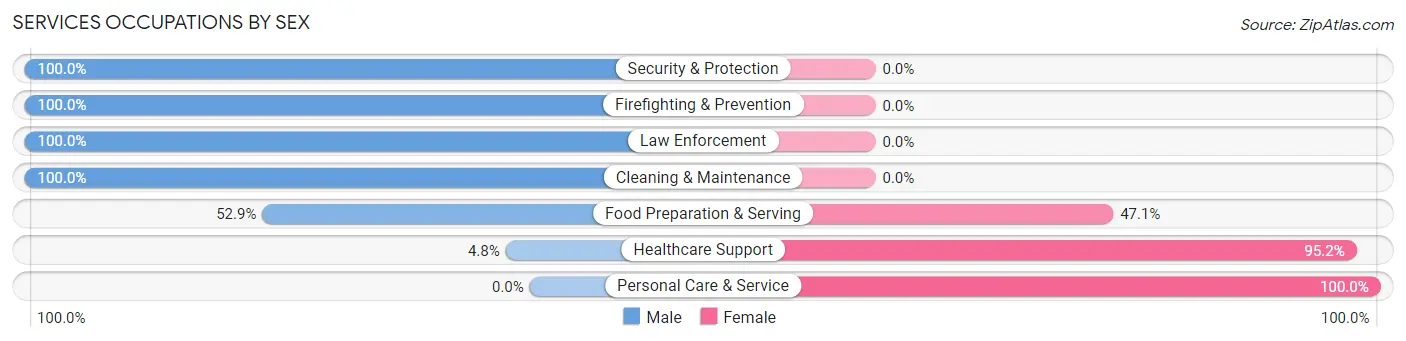
| Occupation | Male | Female |
| Healthcare Support | 1 (4.8%) | 20 (95.2%) |
| Security & Protection | 9 (100.0%) | 0 (0.0%) |
| Firefighting & Prevention | 1 (100.0%) | 0 (0.0%) |
| Law Enforcement | 8 (100.0%) | 0 (0.0%) |
| Food Preparation & Serving | 9 (52.9%) | 8 (47.1%) |
| Cleaning & Maintenance | 17 (100.0%) | 0 (0.0%) |
| Personal Care & Service | 0 (0.0%) | 14 (100.0%) |
| Total (Category) | 36 (46.2%) | 42 (53.8%) |
| Total (Overall) | 275 (52.7%) | 247 (47.3%) |
Sales and Office Occupations
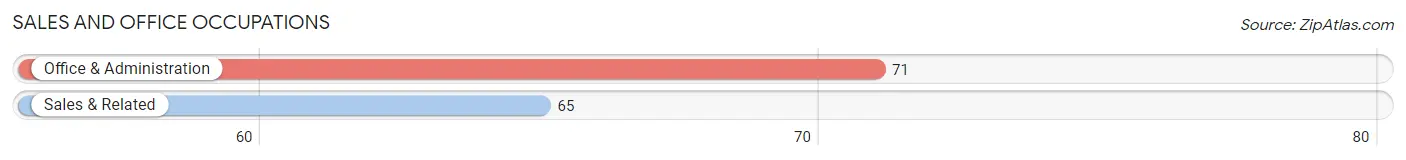
The most common Sales and Office occupations in Hauser are Office & Administration (71 | 13.6%), and Sales & Related (65 | 12.4%).
Sales and Office Occupations by Sex
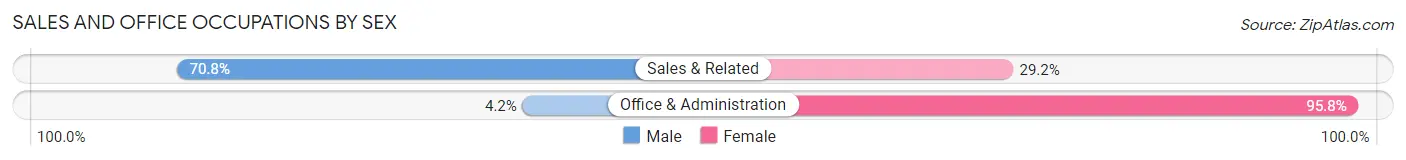
| Occupation | Male | Female |
| Sales & Related | 46 (70.8%) | 19 (29.2%) |
| Office & Administration | 3 (4.2%) | 68 (95.8%) |
| Total (Category) | 49 (36.0%) | 87 (64.0%) |
| Total (Overall) | 275 (52.7%) | 247 (47.3%) |
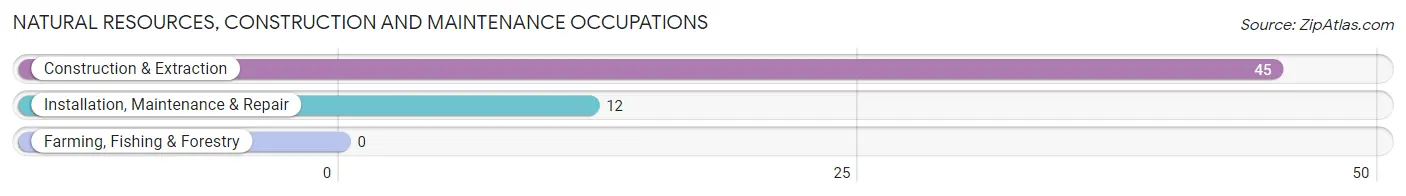
Natural Resources, Construction and Maintenance Occupations
The most common Natural Resources, Construction and Maintenance occupations in Hauser are Construction & Extraction (45 | 8.6%), and Installation, Maintenance & Repair (12 | 2.3%).
Natural Resources, Construction and Maintenance Occupations by Sex
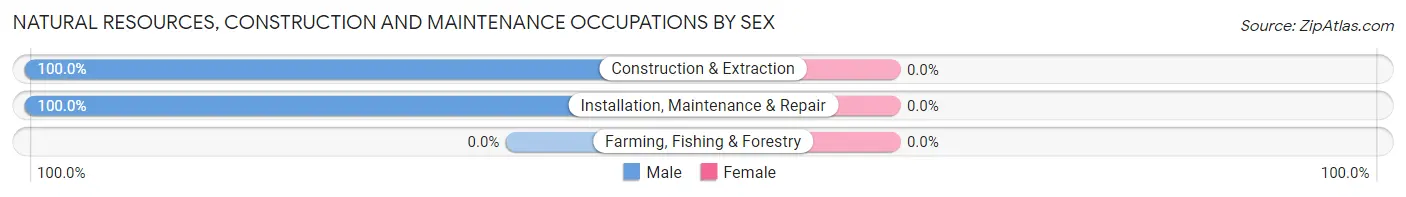
| Occupation | Male | Female |
| Farming, Fishing & Forestry | 0 (0.0%) | 0 (0.0%) |
| Construction & Extraction | 45 (100.0%) | 0 (0.0%) |
| Installation, Maintenance & Repair | 12 (100.0%) | 0 (0.0%) |
| Total (Category) | 57 (100.0%) | 0 (0.0%) |
| Total (Overall) | 275 (52.7%) | 247 (47.3%) |
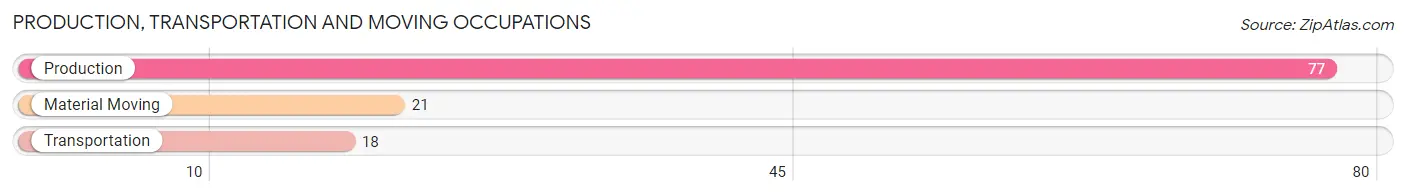
Production, Transportation and Moving Occupations
The most common Production, Transportation and Moving occupations in Hauser are Production (77 | 14.7%), Material Moving (21 | 4.0%), and Transportation (18 | 3.5%).
Production, Transportation and Moving Occupations by Sex
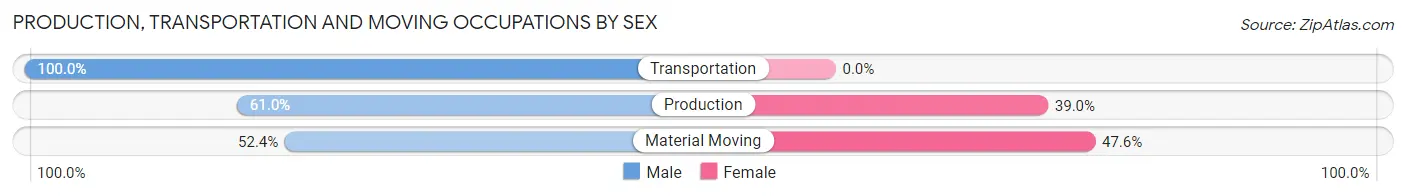
| Occupation | Male | Female |
| Production | 47 (61.0%) | 30 (39.0%) |
| Transportation | 18 (100.0%) | 0 (0.0%) |
| Material Moving | 11 (52.4%) | 10 (47.6%) |
| Total (Category) | 76 (65.5%) | 40 (34.5%) |
| Total (Overall) | 275 (52.7%) | 247 (47.3%) |
Employment Industries by Sex in Hauser
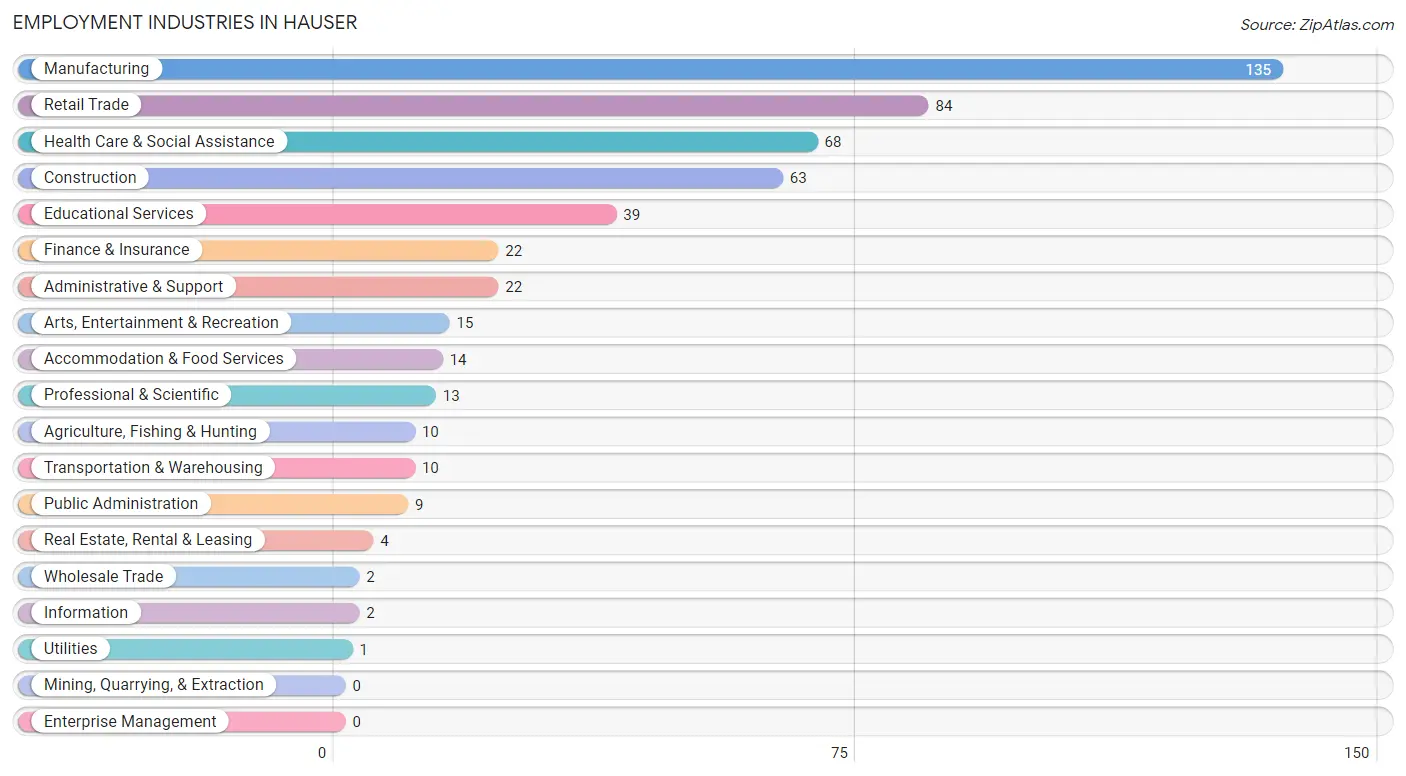
Employment Industries in Hauser
The major employment industries in Hauser include Manufacturing (135 | 25.9%), Retail Trade (84 | 16.1%), Health Care & Social Assistance (68 | 13.0%), Construction (63 | 12.1%), and Educational Services (39 | 7.5%).
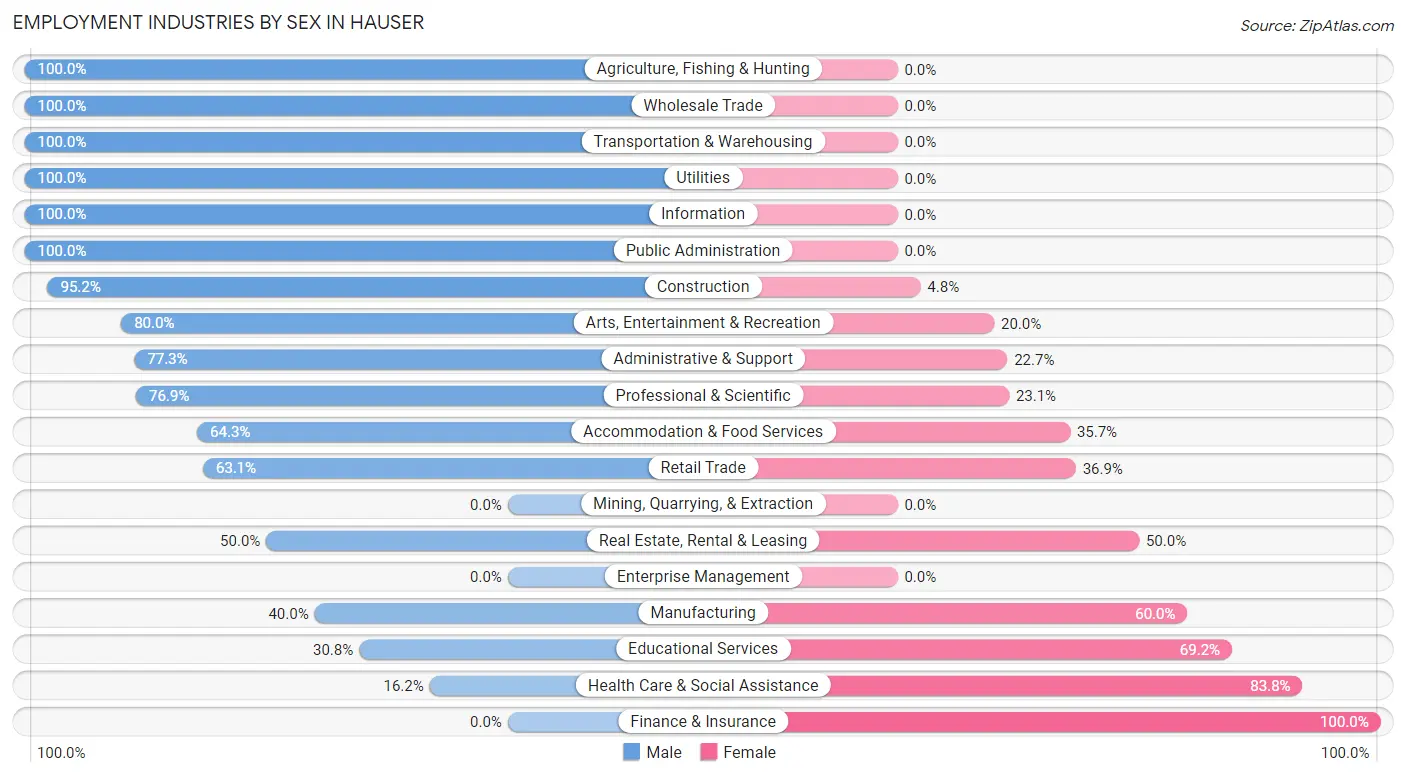
Employment Industries by Sex in Hauser
The Hauser industries that see more men than women are Agriculture, Fishing & Hunting (100.0%), Wholesale Trade (100.0%), and Transportation & Warehousing (100.0%), whereas the industries that tend to have a higher number of women are Finance & Insurance (100.0%), Health Care & Social Assistance (83.8%), and Educational Services (69.2%).
| Industry | Male | Female |
| Agriculture, Fishing & Hunting | 10 (100.0%) | 0 (0.0%) |
| Mining, Quarrying, & Extraction | 0 (0.0%) | 0 (0.0%) |
| Construction | 60 (95.2%) | 3 (4.8%) |
| Manufacturing | 54 (40.0%) | 81 (60.0%) |
| Wholesale Trade | 2 (100.0%) | 0 (0.0%) |
| Retail Trade | 53 (63.1%) | 31 (36.9%) |
| Transportation & Warehousing | 10 (100.0%) | 0 (0.0%) |
| Utilities | 1 (100.0%) | 0 (0.0%) |
| Information | 2 (100.0%) | 0 (0.0%) |
| Finance & Insurance | 0 (0.0%) | 22 (100.0%) |
| Real Estate, Rental & Leasing | 2 (50.0%) | 2 (50.0%) |
| Professional & Scientific | 10 (76.9%) | 3 (23.1%) |
| Enterprise Management | 0 (0.0%) | 0 (0.0%) |
| Administrative & Support | 17 (77.3%) | 5 (22.7%) |
| Educational Services | 12 (30.8%) | 27 (69.2%) |
| Health Care & Social Assistance | 11 (16.2%) | 57 (83.8%) |
| Arts, Entertainment & Recreation | 12 (80.0%) | 3 (20.0%) |
| Accommodation & Food Services | 9 (64.3%) | 5 (35.7%) |
| Public Administration | 9 (100.0%) | 0 (0.0%) |
| Total | 275 (52.7%) | 247 (47.3%) |
Education in Hauser
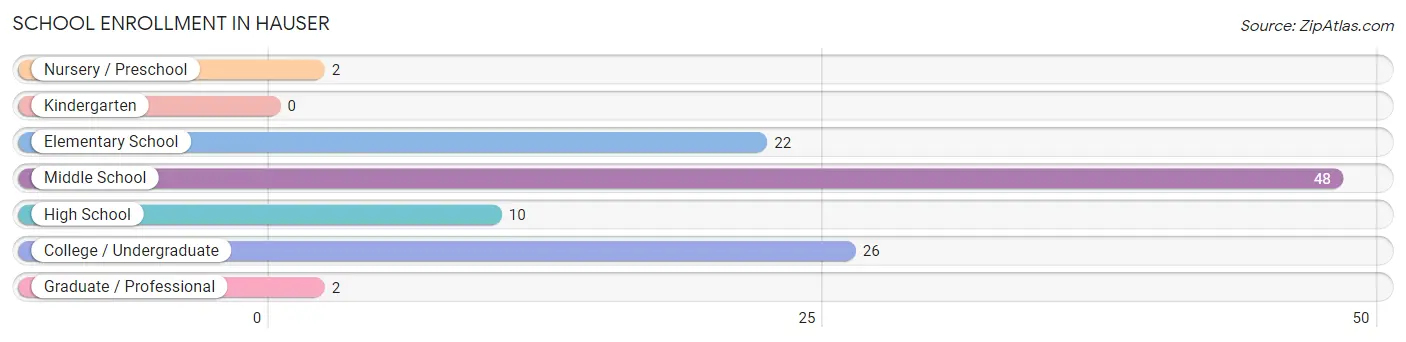
School Enrollment in Hauser
The most common levels of schooling among the 110 students in Hauser are middle school (48 | 43.6%), college / undergraduate (26 | 23.6%), and elementary school (22 | 20.0%).
| School Level | # Students | % Students |
| Nursery / Preschool | 2 | 1.8% |
| Kindergarten | 0 | 0.0% |
| Elementary School | 22 | 20.0% |
| Middle School | 48 | 43.6% |
| High School | 10 | 9.1% |
| College / Undergraduate | 26 | 23.6% |
| Graduate / Professional | 2 | 1.8% |
| Total | 110 | 100.0% |
School Enrollment by Age by Funding Source in Hauser
Out of a total of 110 students who are enrolled in schools in Hauser, 13 (11.8%) attend a private institution, while the remaining 97 (88.2%) are enrolled in public schools. The age group of 15 to 17 year olds has the highest likelihood of being enrolled in private schools, with 4 (44.4% in the age bracket) enrolled. Conversely, the age group of 18 to 19 year olds has the lowest likelihood of being enrolled in a private school, with 10 (100.0% in the age bracket) attending a public institution.
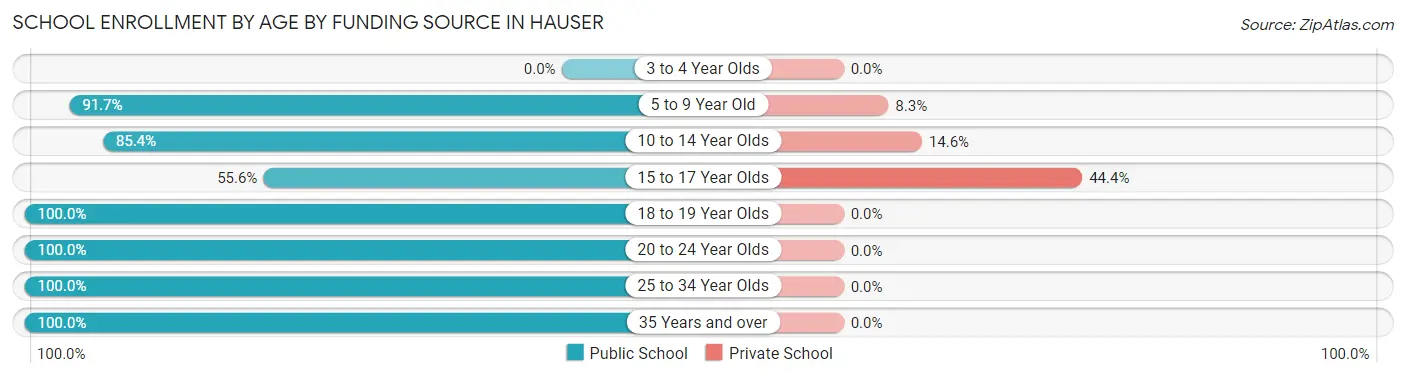
| Age Bracket | Public School | Private School |
| 3 to 4 Year Olds | 0 (0.0%) | 0 (0.0%) |
| 5 to 9 Year Old | 22 (91.7%) | 2 (8.3%) |
| 10 to 14 Year Olds | 41 (85.4%) | 7 (14.6%) |
| 15 to 17 Year Olds | 5 (55.6%) | 4 (44.4%) |
| 18 to 19 Year Olds | 10 (100.0%) | 0 (0.0%) |
| 20 to 24 Year Olds | 8 (100.0%) | 0 (0.0%) |
| 25 to 34 Year Olds | 5 (100.0%) | 0 (0.0%) |
| 35 Years and over | 6 (100.0%) | 0 (0.0%) |
| Total | 97 (88.2%) | 13 (11.8%) |
Educational Attainment by Field of Study in Hauser
Science & technology (27 | 22.5%), business (23 | 19.2%), psychology (15 | 12.5%), bio, nature & agricultural (12 | 10.0%), and education (12 | 10.0%) are the most common fields of study among 120 individuals in Hauser who have obtained a bachelor's degree or higher.
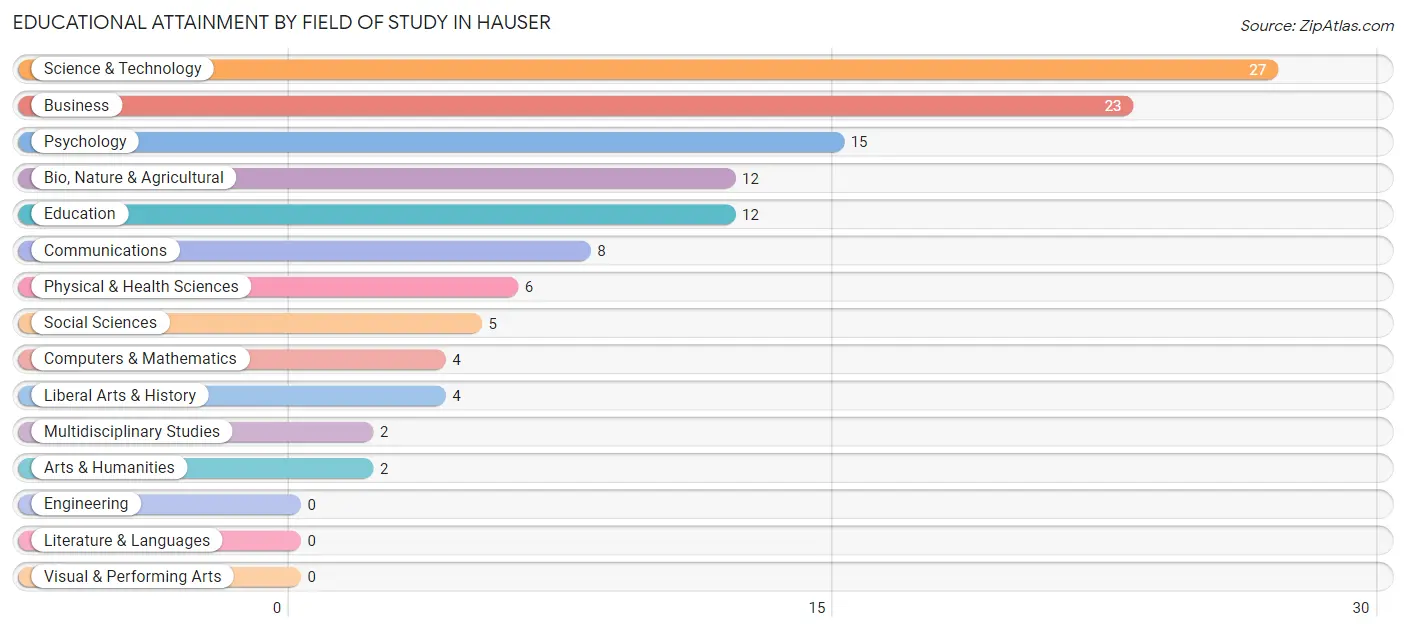
| Field of Study | # Graduates | % Graduates |
| Computers & Mathematics | 4 | 3.3% |
| Bio, Nature & Agricultural | 12 | 10.0% |
| Physical & Health Sciences | 6 | 5.0% |
| Psychology | 15 | 12.5% |
| Social Sciences | 5 | 4.2% |
| Engineering | 0 | 0.0% |
| Multidisciplinary Studies | 2 | 1.7% |
| Science & Technology | 27 | 22.5% |
| Business | 23 | 19.2% |
| Education | 12 | 10.0% |
| Literature & Languages | 0 | 0.0% |
| Liberal Arts & History | 4 | 3.3% |
| Visual & Performing Arts | 0 | 0.0% |
| Communications | 8 | 6.7% |
| Arts & Humanities | 2 | 1.7% |
| Total | 120 | 100.0% |
Transportation & Commute in Hauser
Vehicle Availability by Sex in Hauser
The most prevalent vehicle ownership categories in Hauser are males with 3 vehicles (118, accounting for 43.5%) and females with 3 vehicles (143, making up 48.8%).
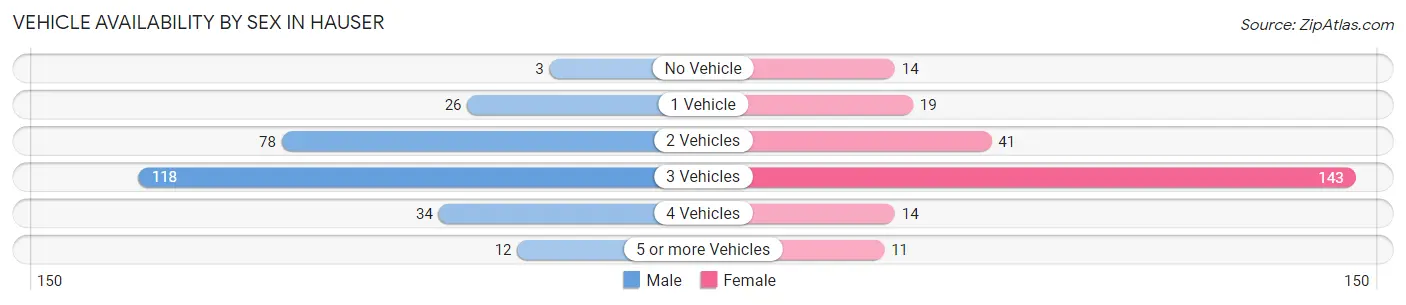
| Vehicles Available | Male | Female |
| No Vehicle | 3 (1.1%) | 14 (5.8%) |
| 1 Vehicle | 26 (9.6%) | 19 (7.9%) |
| 2 Vehicles | 78 (28.8%) | 41 (16.9%) |
| 3 Vehicles | 118 (43.5%) | 143 (59.1%) |
| 4 Vehicles | 34 (12.6%) | 14 (5.8%) |
| 5 or more Vehicles | 12 (4.4%) | 11 (4.5%) |
| Total | 271 (100.0%) | 242 (100.0%) |
Commute Time in Hauser
The most frequently occuring commute durations in Hauser are 20 to 24 minutes (154 commuters, 36.5%), 15 to 19 minutes (62 commuters, 14.7%), and 25 to 29 minutes (53 commuters, 12.6%).
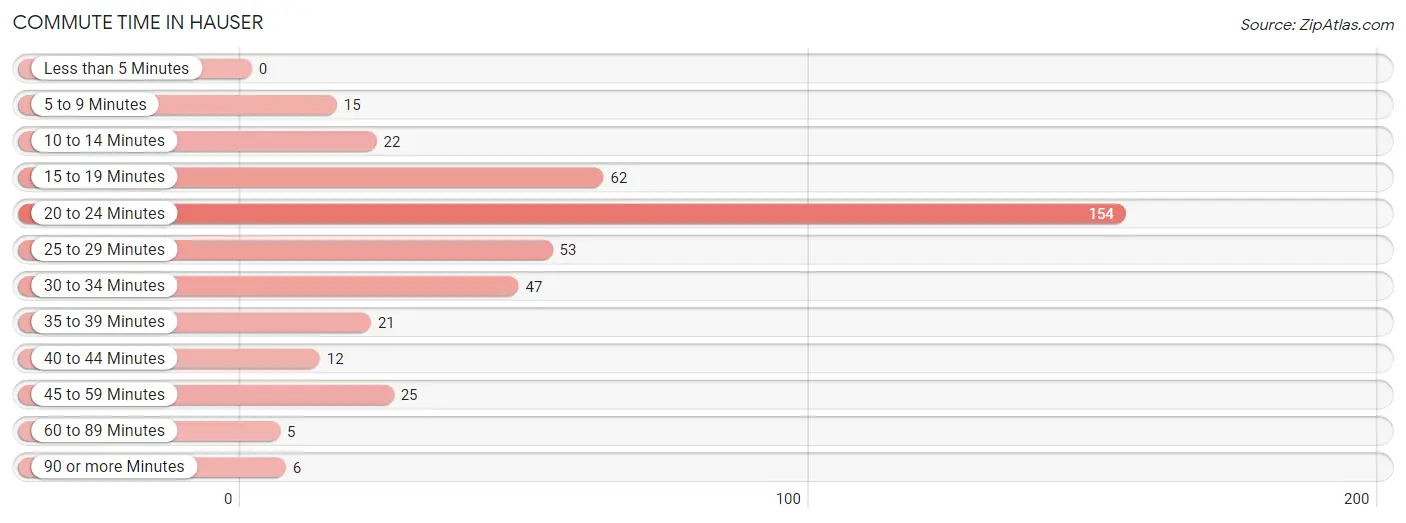
| Commute Time | # Commuters | % Commuters |
| Less than 5 Minutes | 0 | 0.0% |
| 5 to 9 Minutes | 15 | 3.5% |
| 10 to 14 Minutes | 22 | 5.2% |
| 15 to 19 Minutes | 62 | 14.7% |
| 20 to 24 Minutes | 154 | 36.5% |
| 25 to 29 Minutes | 53 | 12.6% |
| 30 to 34 Minutes | 47 | 11.1% |
| 35 to 39 Minutes | 21 | 5.0% |
| 40 to 44 Minutes | 12 | 2.8% |
| 45 to 59 Minutes | 25 | 5.9% |
| 60 to 89 Minutes | 5 | 1.2% |
| 90 or more Minutes | 6 | 1.4% |
Commute Time by Sex in Hauser
The most common commute times in Hauser are 20 to 24 minutes (84 commuters, 39.6%) for males and 20 to 24 minutes (70 commuters, 33.3%) for females.
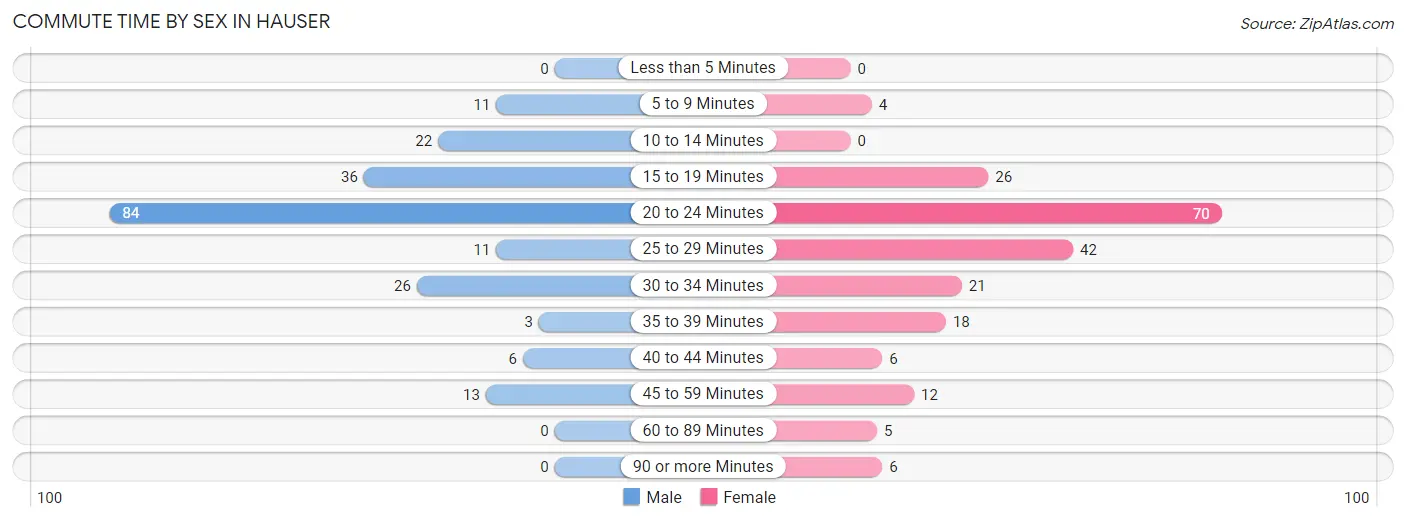
| Commute Time | Male | Female |
| Less than 5 Minutes | 0 (0.0%) | 0 (0.0%) |
| 5 to 9 Minutes | 11 (5.2%) | 4 (1.9%) |
| 10 to 14 Minutes | 22 (10.4%) | 0 (0.0%) |
| 15 to 19 Minutes | 36 (17.0%) | 26 (12.4%) |
| 20 to 24 Minutes | 84 (39.6%) | 70 (33.3%) |
| 25 to 29 Minutes | 11 (5.2%) | 42 (20.0%) |
| 30 to 34 Minutes | 26 (12.3%) | 21 (10.0%) |
| 35 to 39 Minutes | 3 (1.4%) | 18 (8.6%) |
| 40 to 44 Minutes | 6 (2.8%) | 6 (2.9%) |
| 45 to 59 Minutes | 13 (6.1%) | 12 (5.7%) |
| 60 to 89 Minutes | 0 (0.0%) | 5 (2.4%) |
| 90 or more Minutes | 0 (0.0%) | 6 (2.9%) |
Time of Departure to Work by Sex in Hauser
The most frequent times of departure to work in Hauser are 6:00 AM to 6:29 AM (48, 22.6%) for males and 7:30 AM to 7:59 AM (50, 23.8%) for females.
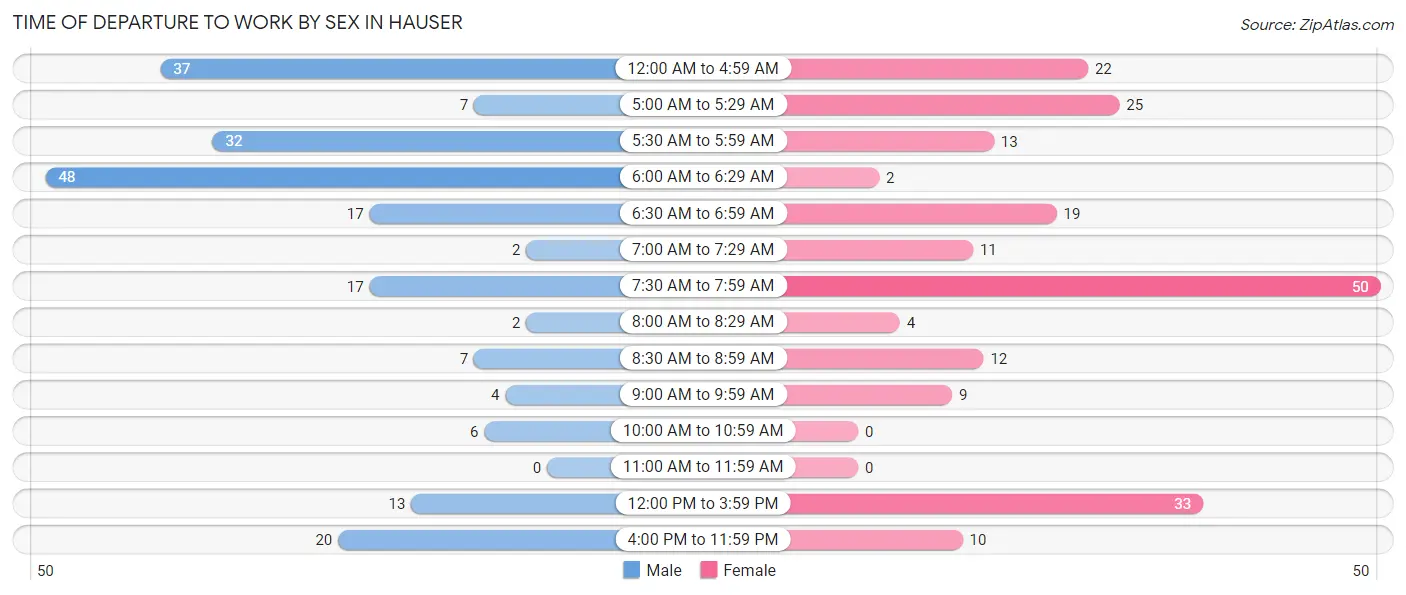
| Time of Departure | Male | Female |
| 12:00 AM to 4:59 AM | 37 (17.4%) | 22 (10.5%) |
| 5:00 AM to 5:29 AM | 7 (3.3%) | 25 (11.9%) |
| 5:30 AM to 5:59 AM | 32 (15.1%) | 13 (6.2%) |
| 6:00 AM to 6:29 AM | 48 (22.6%) | 2 (0.9%) |
| 6:30 AM to 6:59 AM | 17 (8.0%) | 19 (9.0%) |
| 7:00 AM to 7:29 AM | 2 (0.9%) | 11 (5.2%) |
| 7:30 AM to 7:59 AM | 17 (8.0%) | 50 (23.8%) |
| 8:00 AM to 8:29 AM | 2 (0.9%) | 4 (1.9%) |
| 8:30 AM to 8:59 AM | 7 (3.3%) | 12 (5.7%) |
| 9:00 AM to 9:59 AM | 4 (1.9%) | 9 (4.3%) |
| 10:00 AM to 10:59 AM | 6 (2.8%) | 0 (0.0%) |
| 11:00 AM to 11:59 AM | 0 (0.0%) | 0 (0.0%) |
| 12:00 PM to 3:59 PM | 13 (6.1%) | 33 (15.7%) |
| 4:00 PM to 11:59 PM | 20 (9.4%) | 10 (4.8%) |
| Total | 212 (100.0%) | 210 (100.0%) |
Housing Occupancy in Hauser
Occupancy by Ownership in Hauser
Of the total 407 dwellings in Hauser, owner-occupied units account for 372 (91.4%), while renter-occupied units make up 35 (8.6%).
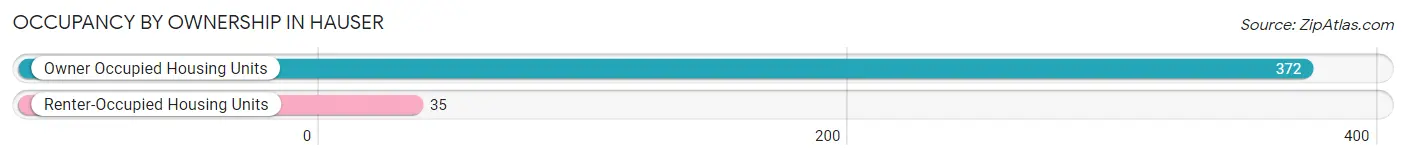
| Occupancy | # Housing Units | % Housing Units |
| Owner Occupied Housing Units | 372 | 91.4% |
| Renter-Occupied Housing Units | 35 | 8.6% |
| Total Occupied Housing Units | 407 | 100.0% |
Occupancy by Household Size in Hauser
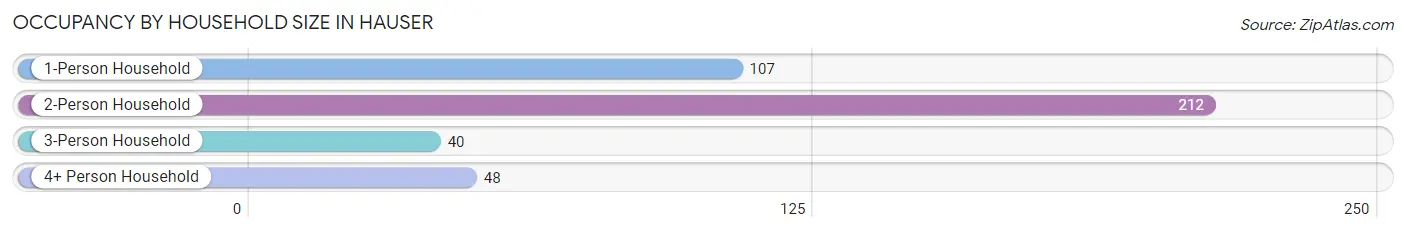
| Household Size | # Housing Units | % Housing Units |
| 1-Person Household | 107 | 26.3% |
| 2-Person Household | 212 | 52.1% |
| 3-Person Household | 40 | 9.8% |
| 4+ Person Household | 48 | 11.8% |
| Total Housing Units | 407 | 100.0% |
Occupancy by Ownership by Household Size in Hauser
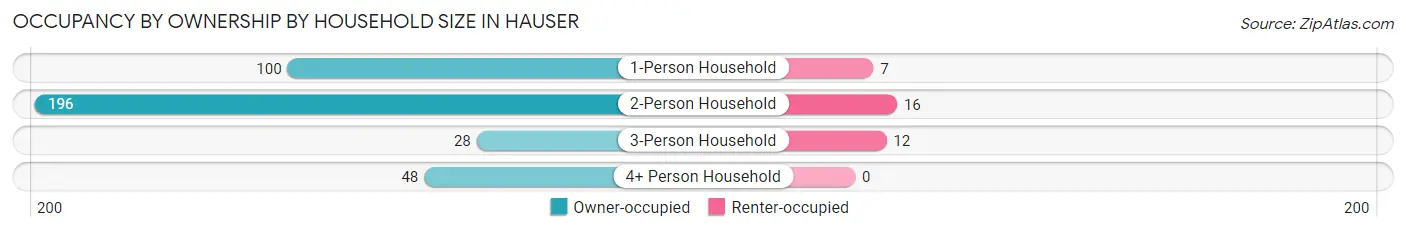
| Household Size | Owner-occupied | Renter-occupied |
| 1-Person Household | 100 (93.5%) | 7 (6.5%) |
| 2-Person Household | 196 (92.4%) | 16 (7.5%) |
| 3-Person Household | 28 (70.0%) | 12 (30.0%) |
| 4+ Person Household | 48 (100.0%) | 0 (0.0%) |
| Total Housing Units | 372 (91.4%) | 35 (8.6%) |
Occupancy by Educational Attainment in Hauser
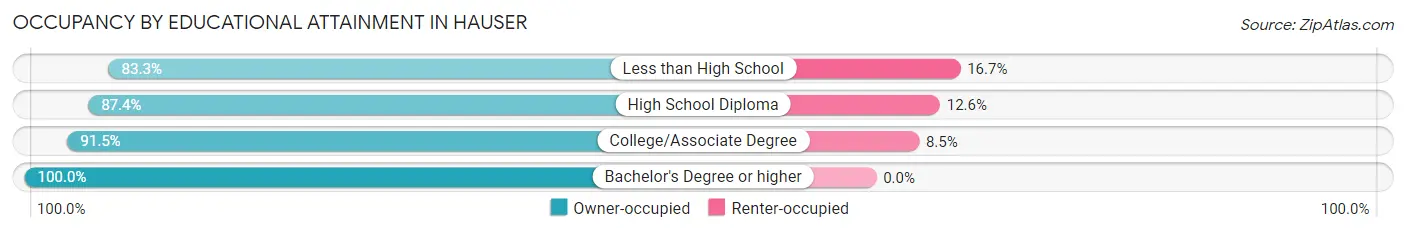
| Household Size | Owner-occupied | Renter-occupied |
| Less than High School | 20 (83.3%) | 4 (16.7%) |
| High School Diploma | 90 (87.4%) | 13 (12.6%) |
| College/Associate Degree | 194 (91.5%) | 18 (8.5%) |
| Bachelor's Degree or higher | 68 (100.0%) | 0 (0.0%) |
Occupancy by Age of Householder in Hauser
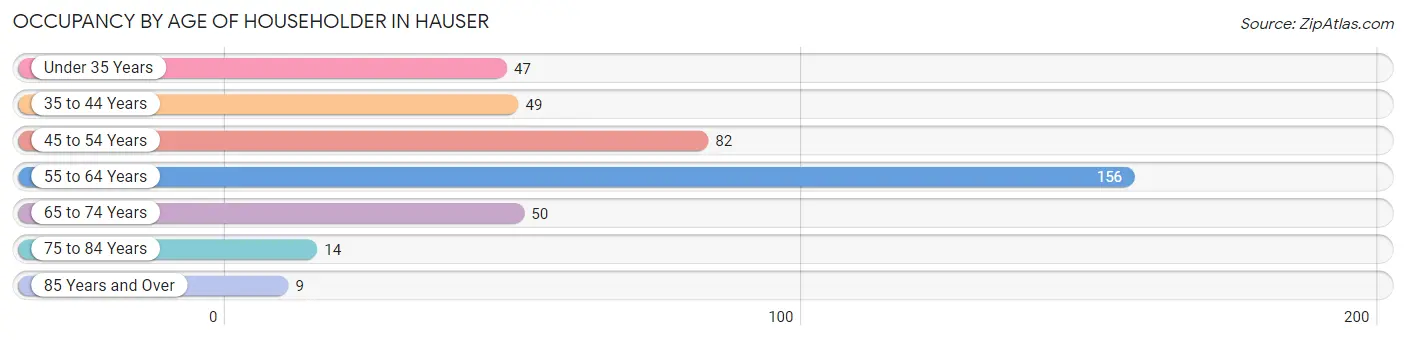
| Age Bracket | # Households | % Households |
| Under 35 Years | 47 | 11.6% |
| 35 to 44 Years | 49 | 12.0% |
| 45 to 54 Years | 82 | 20.2% |
| 55 to 64 Years | 156 | 38.3% |
| 65 to 74 Years | 50 | 12.3% |
| 75 to 84 Years | 14 | 3.4% |
| 85 Years and Over | 9 | 2.2% |
| Total | 407 | 100.0% |
Housing Finances in Hauser
Median Income by Occupancy in Hauser
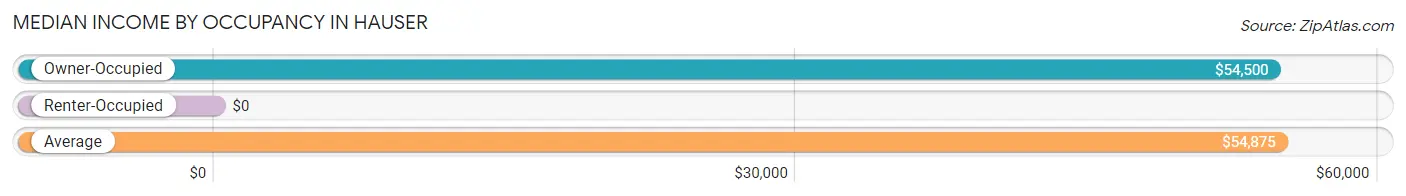
| Occupancy Type | # Households | Median Income |
| Owner-Occupied | 372 (91.4%) | $54,500 |
| Renter-Occupied | 35 (8.6%) | $0 |
| Average | 407 (100.0%) | $54,875 |
Occupancy by Householder Income Bracket in Hauser
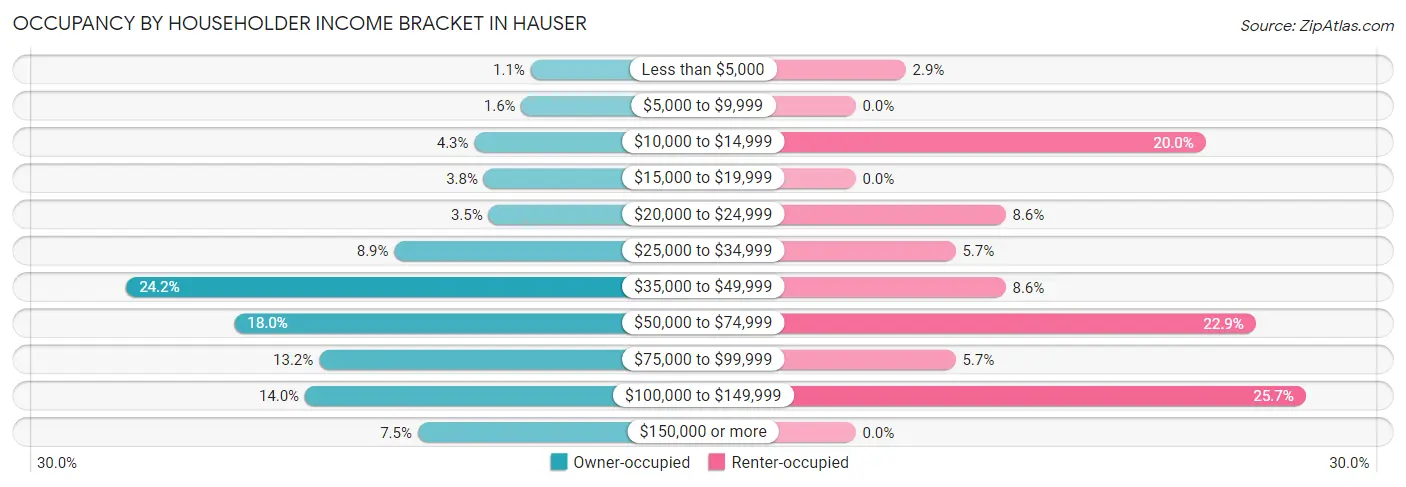
| Income Bracket | Owner-occupied | Renter-occupied |
| Less than $5,000 | 4 (1.1%) | 1 (2.9%) |
| $5,000 to $9,999 | 6 (1.6%) | 0 (0.0%) |
| $10,000 to $14,999 | 16 (4.3%) | 7 (20.0%) |
| $15,000 to $19,999 | 14 (3.8%) | 0 (0.0%) |
| $20,000 to $24,999 | 13 (3.5%) | 3 (8.6%) |
| $25,000 to $34,999 | 33 (8.9%) | 2 (5.7%) |
| $35,000 to $49,999 | 90 (24.2%) | 3 (8.6%) |
| $50,000 to $74,999 | 67 (18.0%) | 8 (22.9%) |
| $75,000 to $99,999 | 49 (13.2%) | 2 (5.7%) |
| $100,000 to $149,999 | 52 (14.0%) | 9 (25.7%) |
| $150,000 or more | 28 (7.5%) | 0 (0.0%) |
| Total | 372 (100.0%) | 35 (100.0%) |
Monthly Housing Cost Tiers in Hauser
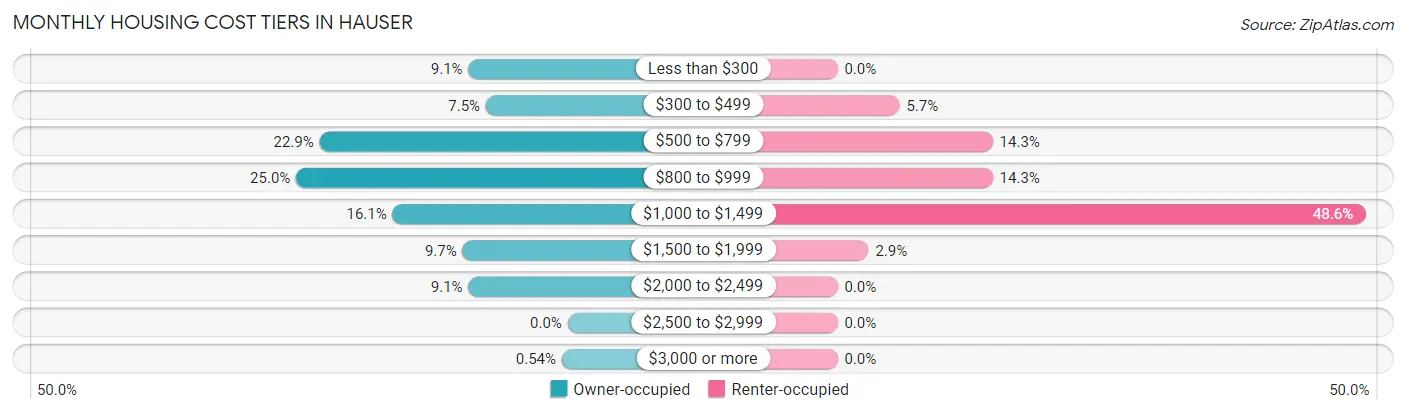
| Monthly Cost | Owner-occupied | Renter-occupied |
| Less than $300 | 34 (9.1%) | 0 (0.0%) |
| $300 to $499 | 28 (7.5%) | 2 (5.7%) |
| $500 to $799 | 85 (22.9%) | 5 (14.3%) |
| $800 to $999 | 93 (25.0%) | 5 (14.3%) |
| $1,000 to $1,499 | 60 (16.1%) | 17 (48.6%) |
| $1,500 to $1,999 | 36 (9.7%) | 1 (2.9%) |
| $2,000 to $2,499 | 34 (9.1%) | 0 (0.0%) |
| $2,500 to $2,999 | 0 (0.0%) | 0 (0.0%) |
| $3,000 or more | 2 (0.5%) | 0 (0.0%) |
| Total | 372 (100.0%) | 35 (100.0%) |
Physical Housing Characteristics in Hauser
Housing Structures in Hauser
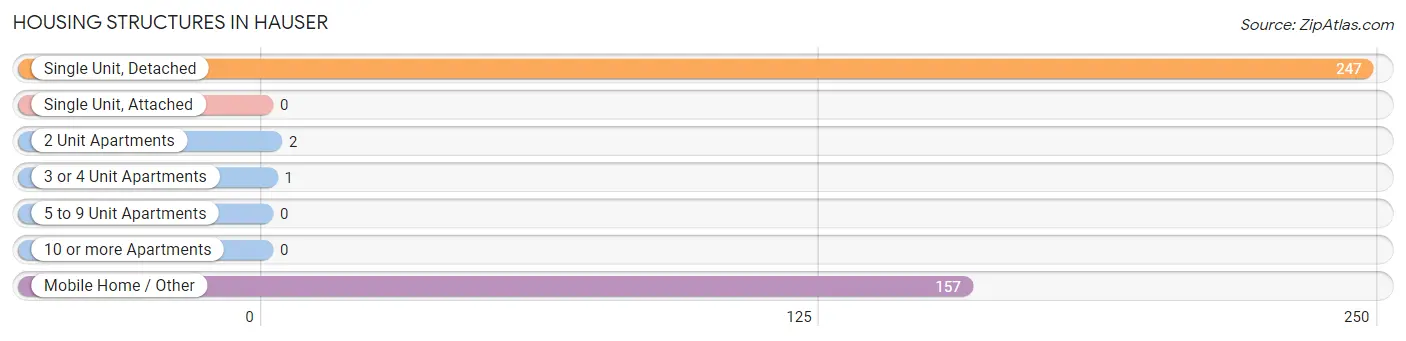
| Structure Type | # Housing Units | % Housing Units |
| Single Unit, Detached | 247 | 60.7% |
| Single Unit, Attached | 0 | 0.0% |
| 2 Unit Apartments | 2 | 0.5% |
| 3 or 4 Unit Apartments | 1 | 0.3% |
| 5 to 9 Unit Apartments | 0 | 0.0% |
| 10 or more Apartments | 0 | 0.0% |
| Mobile Home / Other | 157 | 38.6% |
| Total | 407 | 100.0% |
Housing Structures by Occupancy in Hauser
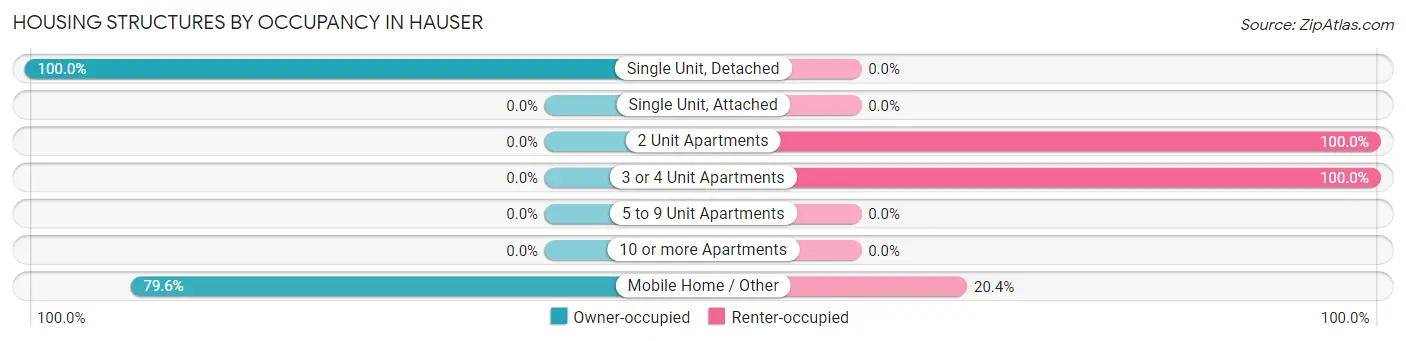
| Structure Type | Owner-occupied | Renter-occupied |
| Single Unit, Detached | 247 (100.0%) | 0 (0.0%) |
| Single Unit, Attached | 0 (0.0%) | 0 (0.0%) |
| 2 Unit Apartments | 0 (0.0%) | 2 (100.0%) |
| 3 or 4 Unit Apartments | 0 (0.0%) | 1 (100.0%) |
| 5 to 9 Unit Apartments | 0 (0.0%) | 0 (0.0%) |
| 10 or more Apartments | 0 (0.0%) | 0 (0.0%) |
| Mobile Home / Other | 125 (79.6%) | 32 (20.4%) |
| Total | 372 (91.4%) | 35 (8.6%) |
Housing Structures by Number of Rooms in Hauser
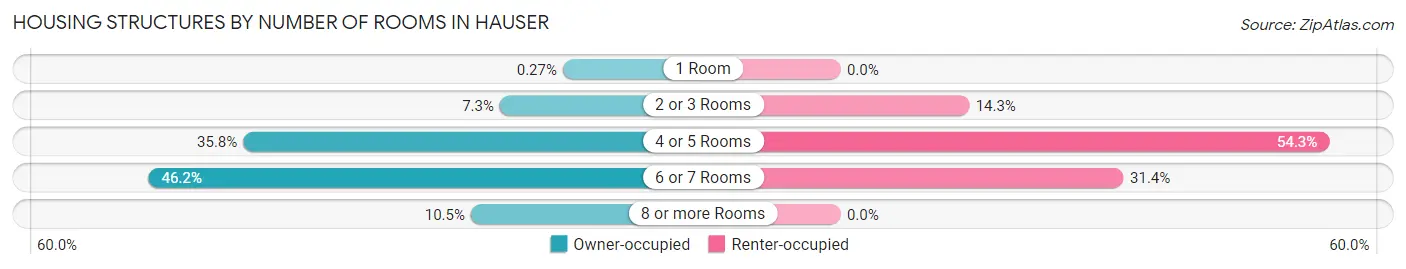
| Number of Rooms | Owner-occupied | Renter-occupied |
| 1 Room | 1 (0.3%) | 0 (0.0%) |
| 2 or 3 Rooms | 27 (7.3%) | 5 (14.3%) |
| 4 or 5 Rooms | 133 (35.7%) | 19 (54.3%) |
| 6 or 7 Rooms | 172 (46.2%) | 11 (31.4%) |
| 8 or more Rooms | 39 (10.5%) | 0 (0.0%) |
| Total | 372 (100.0%) | 35 (100.0%) |
Housing Structure by Heating Type in Hauser
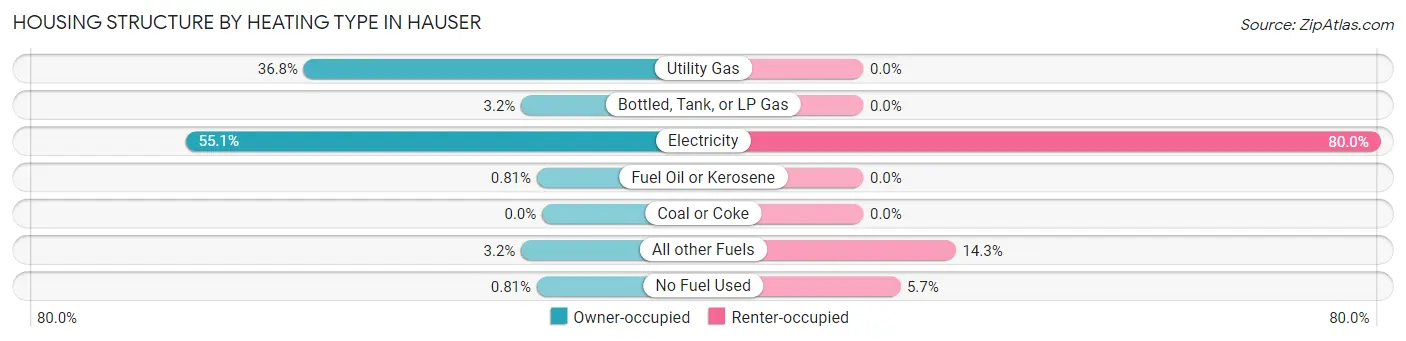
| Heating Type | Owner-occupied | Renter-occupied |
| Utility Gas | 137 (36.8%) | 0 (0.0%) |
| Bottled, Tank, or LP Gas | 12 (3.2%) | 0 (0.0%) |
| Electricity | 205 (55.1%) | 28 (80.0%) |
| Fuel Oil or Kerosene | 3 (0.8%) | 0 (0.0%) |
| Coal or Coke | 0 (0.0%) | 0 (0.0%) |
| All other Fuels | 12 (3.2%) | 5 (14.3%) |
| No Fuel Used | 3 (0.8%) | 2 (5.7%) |
| Total | 372 (100.0%) | 35 (100.0%) |
Household Vehicle Usage in Hauser
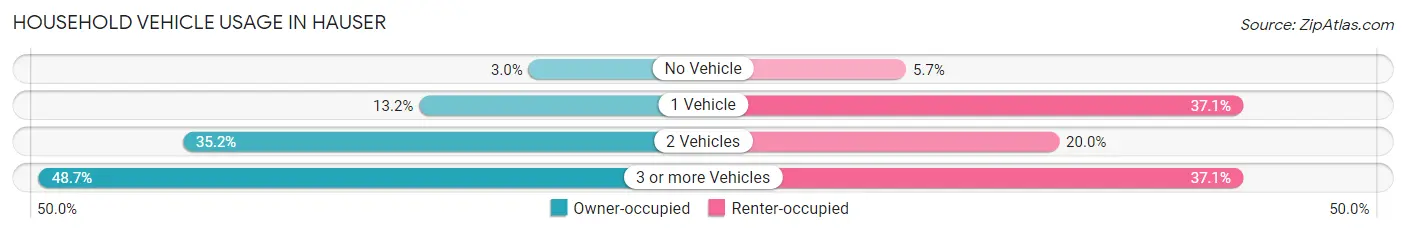
| Vehicles per Household | Owner-occupied | Renter-occupied |
| No Vehicle | 11 (3.0%) | 2 (5.7%) |
| 1 Vehicle | 49 (13.2%) | 13 (37.1%) |
| 2 Vehicles | 131 (35.2%) | 7 (20.0%) |
| 3 or more Vehicles | 181 (48.7%) | 13 (37.1%) |
| Total | 372 (100.0%) | 35 (100.0%) |
Real Estate & Mortgages in Hauser
Real Estate and Mortgage Overview in Hauser
| Characteristic | Without Mortgage | With Mortgage |
| Housing Units | 136 | 236 |
| Median Property Value | $64,000 | $331,400 |
| Median Household Income | $39,375 | $16 |
| Monthly Housing Costs | $520 | $2 |
| Real Estate Taxes | $386 | $13 |
Property Value by Mortgage Status in Hauser
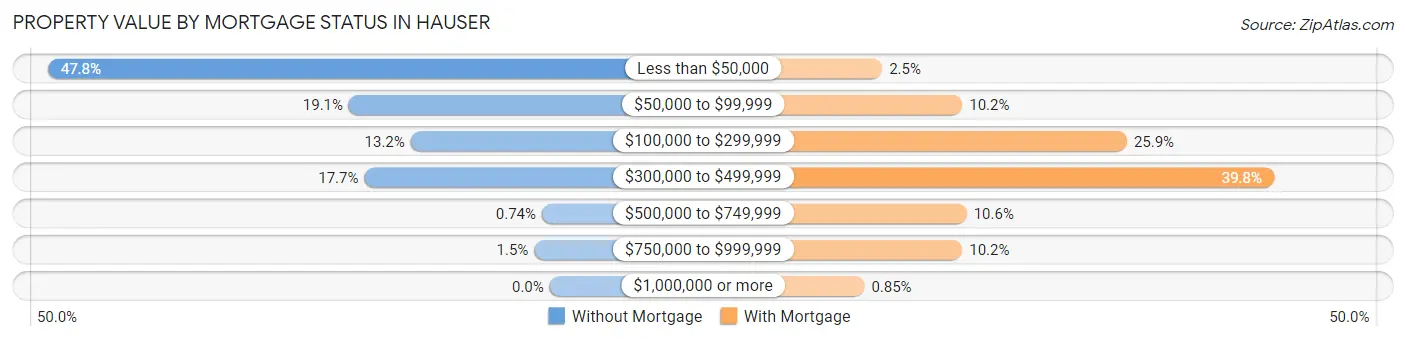
| Property Value | Without Mortgage | With Mortgage |
| Less than $50,000 | 65 (47.8%) | 6 (2.5%) |
| $50,000 to $99,999 | 26 (19.1%) | 24 (10.2%) |
| $100,000 to $299,999 | 18 (13.2%) | 61 (25.9%) |
| $300,000 to $499,999 | 24 (17.6%) | 94 (39.8%) |
| $500,000 to $749,999 | 1 (0.7%) | 25 (10.6%) |
| $750,000 to $999,999 | 2 (1.5%) | 24 (10.2%) |
| $1,000,000 or more | 0 (0.0%) | 2 (0.9%) |
| Total | 136 (100.0%) | 236 (100.0%) |
Household Income by Mortgage Status in Hauser
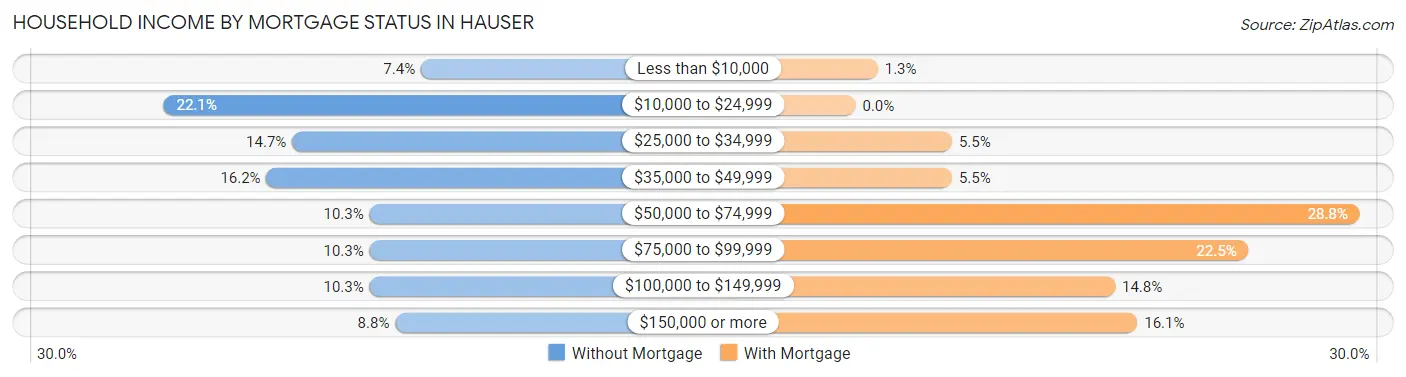
| Household Income | Without Mortgage | With Mortgage |
| Less than $10,000 | 10 (7.3%) | 3 (1.3%) |
| $10,000 to $24,999 | 30 (22.1%) | 0 (0.0%) |
| $25,000 to $34,999 | 20 (14.7%) | 13 (5.5%) |
| $35,000 to $49,999 | 22 (16.2%) | 13 (5.5%) |
| $50,000 to $74,999 | 14 (10.3%) | 68 (28.8%) |
| $75,000 to $99,999 | 14 (10.3%) | 53 (22.5%) |
| $100,000 to $149,999 | 14 (10.3%) | 35 (14.8%) |
| $150,000 or more | 12 (8.8%) | 38 (16.1%) |
| Total | 136 (100.0%) | 236 (100.0%) |
Property Value to Household Income Ratio in Hauser
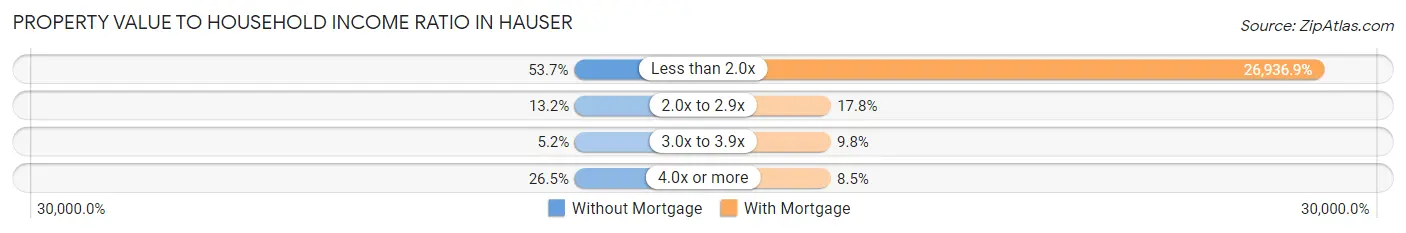
| Value-to-Income Ratio | Without Mortgage | With Mortgage |
| Less than 2.0x | 73 (53.7%) | 63,571 (26,936.9%) |
| 2.0x to 2.9x | 18 (13.2%) | 42 (17.8%) |
| 3.0x to 3.9x | 7 (5.1%) | 23 (9.8%) |
| 4.0x or more | 36 (26.5%) | 20 (8.5%) |
| Total | 136 (100.0%) | 236 (100.0%) |
Real Estate Taxes by Mortgage Status in Hauser
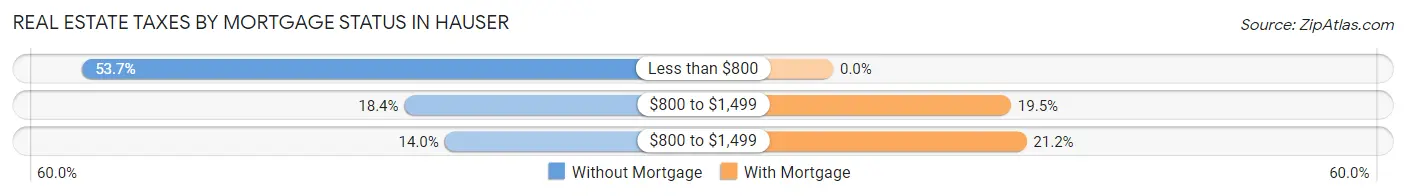
| Property Taxes | Without Mortgage | With Mortgage |
| Less than $800 | 73 (53.7%) | 0 (0.0%) |
| $800 to $1,499 | 25 (18.4%) | 46 (19.5%) |
| $800 to $1,499 | 19 (14.0%) | 50 (21.2%) |
| Total | 136 (100.0%) | 236 (100.0%) |
Health & Disability in Hauser
Health Insurance Coverage by Age in Hauser
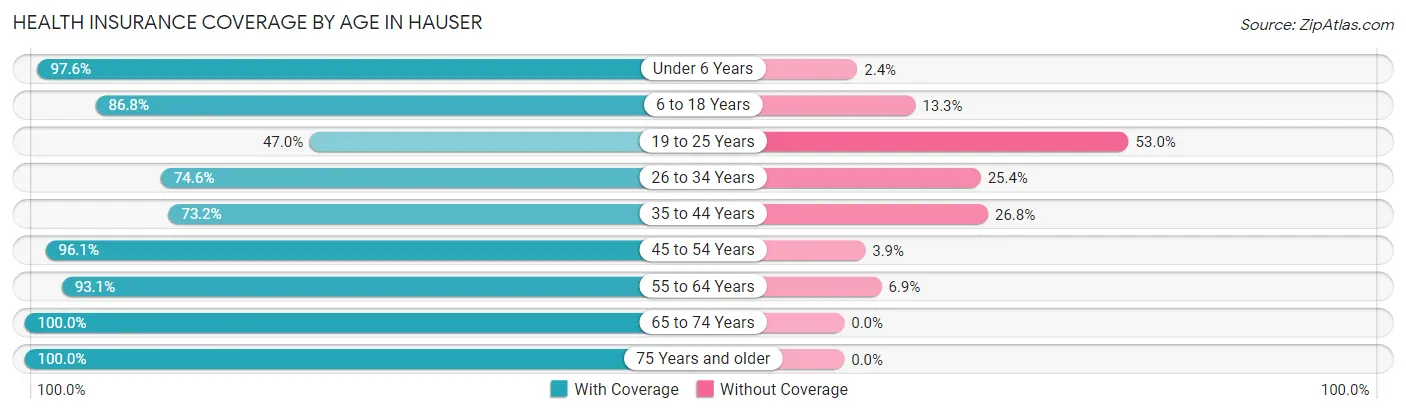
| Age Bracket | With Coverage | Without Coverage |
| Under 6 Years | 40 (97.6%) | 1 (2.4%) |
| 6 to 18 Years | 72 (86.8%) | 11 (13.3%) |
| 19 to 25 Years | 31 (47.0%) | 35 (53.0%) |
| 26 to 34 Years | 85 (74.6%) | 29 (25.4%) |
| 35 to 44 Years | 71 (73.2%) | 26 (26.8%) |
| 45 to 54 Years | 172 (96.1%) | 7 (3.9%) |
| 55 to 64 Years | 228 (93.1%) | 17 (6.9%) |
| 65 to 74 Years | 84 (100.0%) | 0 (0.0%) |
| 75 Years and older | 26 (100.0%) | 0 (0.0%) |
| Total | 809 (86.5%) | 126 (13.5%) |
Health Insurance Coverage by Citizenship Status in Hauser
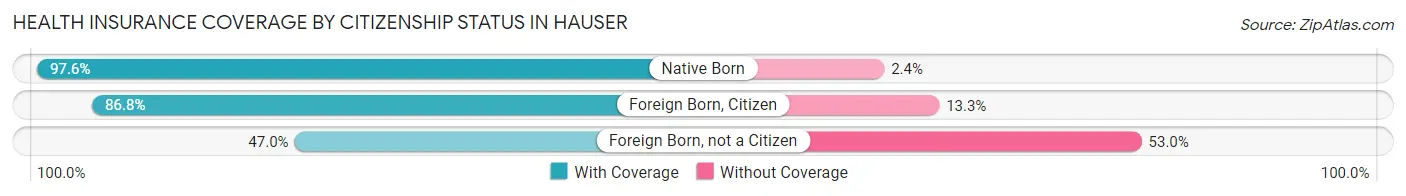
| Citizenship Status | With Coverage | Without Coverage |
| Native Born | 40 (97.6%) | 1 (2.4%) |
| Foreign Born, Citizen | 72 (86.8%) | 11 (13.3%) |
| Foreign Born, not a Citizen | 31 (47.0%) | 35 (53.0%) |
Health Insurance Coverage by Household Income in Hauser
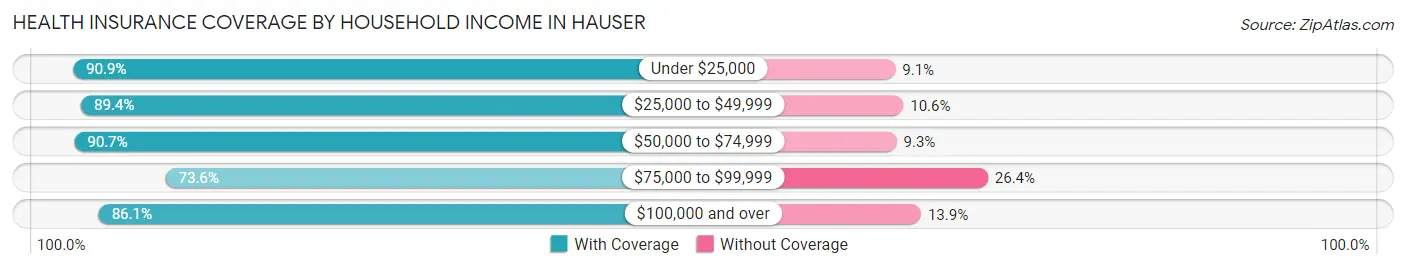
| Household Income | With Coverage | Without Coverage |
| Under $25,000 | 80 (90.9%) | 8 (9.1%) |
| $25,000 to $49,999 | 228 (89.4%) | 27 (10.6%) |
| $50,000 to $74,999 | 175 (90.7%) | 18 (9.3%) |
| $75,000 to $99,999 | 103 (73.6%) | 37 (26.4%) |
| $100,000 and over | 223 (86.1%) | 36 (13.9%) |
Public vs Private Health Insurance Coverage by Age in Hauser
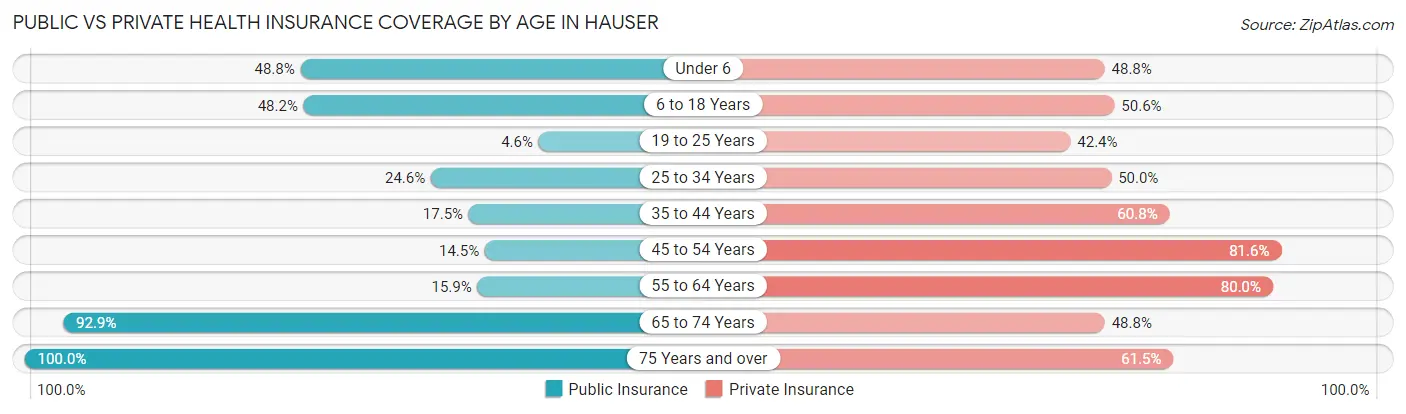
| Age Bracket | Public Insurance | Private Insurance |
| Under 6 | 20 (48.8%) | 20 (48.8%) |
| 6 to 18 Years | 40 (48.2%) | 42 (50.6%) |
| 19 to 25 Years | 3 (4.5%) | 28 (42.4%) |
| 25 to 34 Years | 28 (24.6%) | 57 (50.0%) |
| 35 to 44 Years | 17 (17.5%) | 59 (60.8%) |
| 45 to 54 Years | 26 (14.5%) | 146 (81.6%) |
| 55 to 64 Years | 39 (15.9%) | 196 (80.0%) |
| 65 to 74 Years | 78 (92.9%) | 41 (48.8%) |
| 75 Years and over | 26 (100.0%) | 16 (61.5%) |
| Total | 277 (29.6%) | 605 (64.7%) |
Disability Status by Sex by Age in Hauser
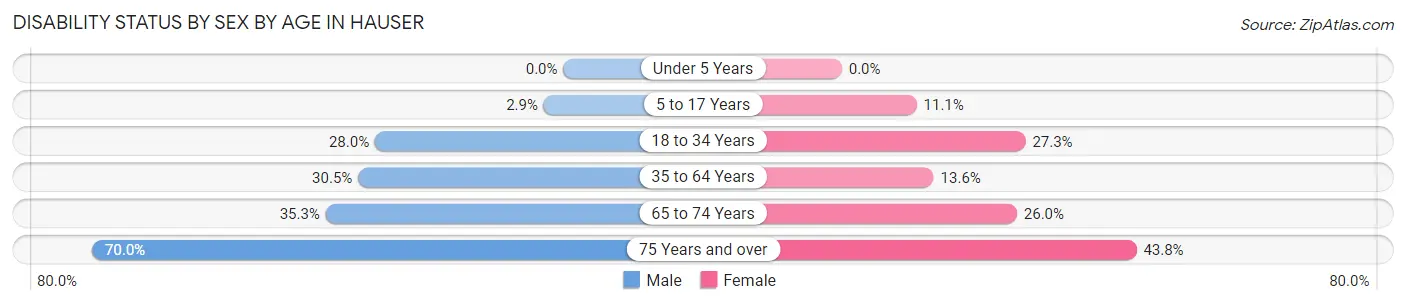
| Age Bracket | Male | Female |
| Under 5 Years | 0 (0.0%) | 0 (0.0%) |
| 5 to 17 Years | 2 (2.9%) | 2 (11.1%) |
| 18 to 34 Years | 33 (28.0%) | 18 (27.3%) |
| 35 to 64 Years | 85 (30.5%) | 33 (13.6%) |
| 65 to 74 Years | 12 (35.3%) | 13 (26.0%) |
| 75 Years and over | 7 (70.0%) | 7 (43.8%) |
Disability Class by Sex by Age in Hauser
Disability Class: Hearing Difficulty
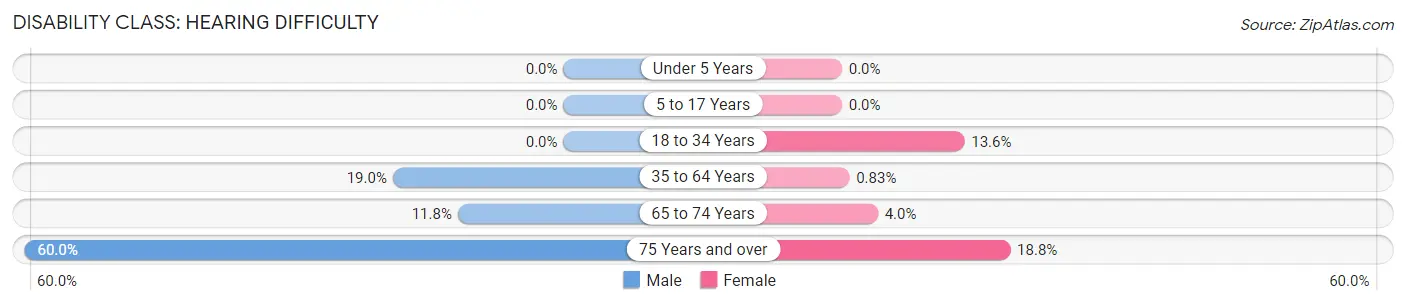
| Age Bracket | Male | Female |
| Under 5 Years | 0 (0.0%) | 0 (0.0%) |
| 5 to 17 Years | 0 (0.0%) | 0 (0.0%) |
| 18 to 34 Years | 0 (0.0%) | 9 (13.6%) |
| 35 to 64 Years | 53 (19.0%) | 2 (0.8%) |
| 65 to 74 Years | 4 (11.8%) | 2 (4.0%) |
| 75 Years and over | 6 (60.0%) | 3 (18.8%) |
Disability Class: Vision Difficulty
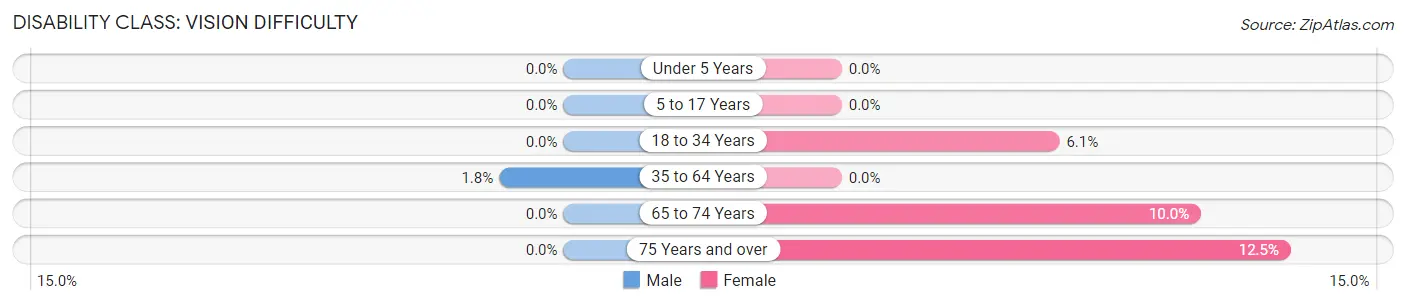
| Age Bracket | Male | Female |
| Under 5 Years | 0 (0.0%) | 0 (0.0%) |
| 5 to 17 Years | 0 (0.0%) | 0 (0.0%) |
| 18 to 34 Years | 0 (0.0%) | 4 (6.1%) |
| 35 to 64 Years | 5 (1.8%) | 0 (0.0%) |
| 65 to 74 Years | 0 (0.0%) | 5 (10.0%) |
| 75 Years and over | 0 (0.0%) | 2 (12.5%) |
Disability Class: Cognitive Difficulty
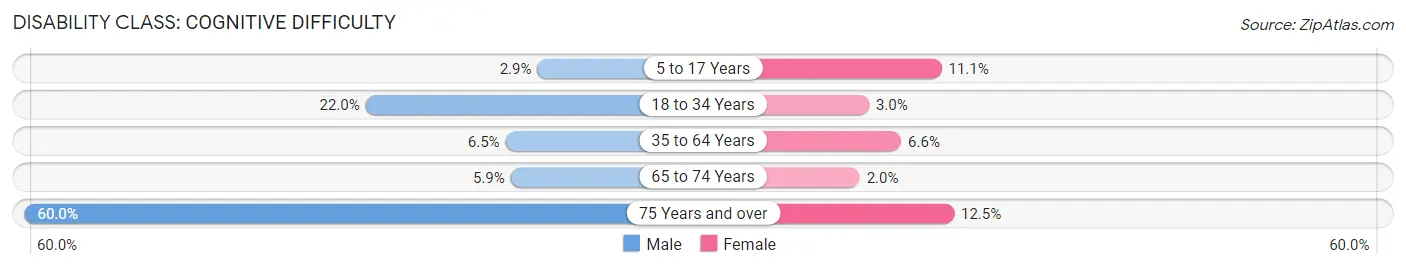
| Age Bracket | Male | Female |
| 5 to 17 Years | 2 (2.9%) | 2 (11.1%) |
| 18 to 34 Years | 26 (22.0%) | 2 (3.0%) |
| 35 to 64 Years | 18 (6.5%) | 16 (6.6%) |
| 65 to 74 Years | 2 (5.9%) | 1 (2.0%) |
| 75 Years and over | 6 (60.0%) | 2 (12.5%) |
Disability Class: Ambulatory Difficulty
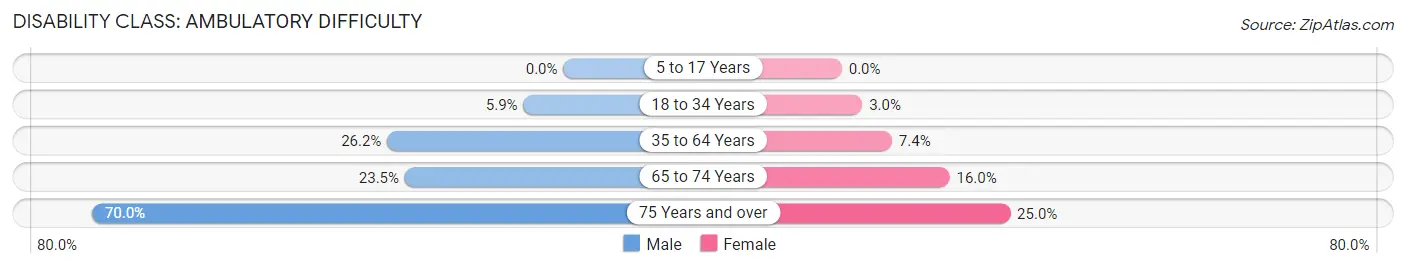
| Age Bracket | Male | Female |
| 5 to 17 Years | 0 (0.0%) | 0 (0.0%) |
| 18 to 34 Years | 7 (5.9%) | 2 (3.0%) |
| 35 to 64 Years | 73 (26.2%) | 18 (7.4%) |
| 65 to 74 Years | 8 (23.5%) | 8 (16.0%) |
| 75 Years and over | 7 (70.0%) | 4 (25.0%) |
Disability Class: Self-Care Difficulty
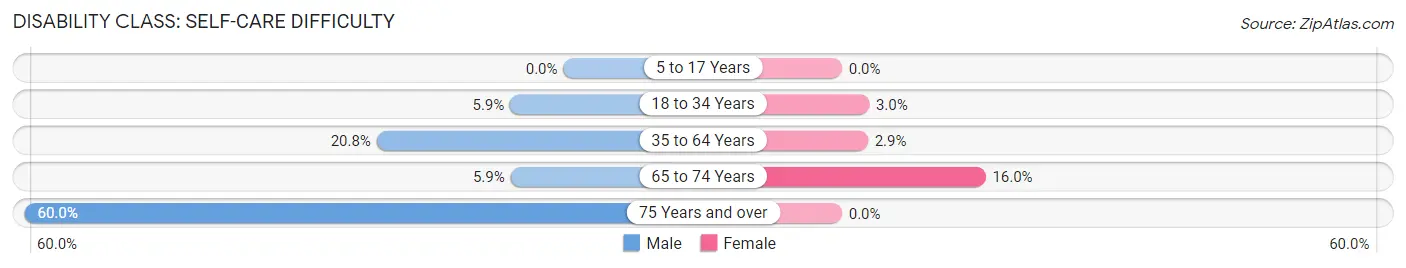
| Age Bracket | Male | Female |
| 5 to 17 Years | 0 (0.0%) | 0 (0.0%) |
| 18 to 34 Years | 7 (5.9%) | 2 (3.0%) |
| 35 to 64 Years | 58 (20.8%) | 7 (2.9%) |
| 65 to 74 Years | 2 (5.9%) | 8 (16.0%) |
| 75 Years and over | 6 (60.0%) | 0 (0.0%) |
Technology Access in Hauser
Computing Device Access in Hauser
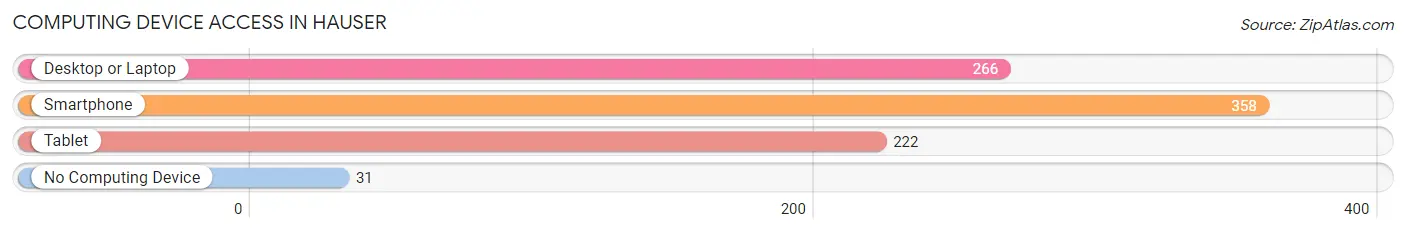
| Device Type | # Households | % Households |
| Desktop or Laptop | 266 | 65.4% |
| Smartphone | 358 | 88.0% |
| Tablet | 222 | 54.5% |
| No Computing Device | 31 | 7.6% |
| Total | 407 | 100.0% |
Internet Access in Hauser
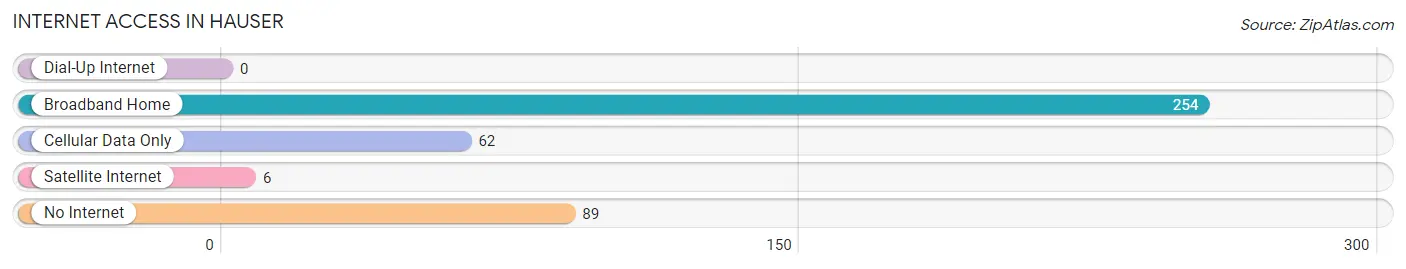
| Internet Type | # Households | % Households |
| Dial-Up Internet | 0 | 0.0% |
| Broadband Home | 254 | 62.4% |
| Cellular Data Only | 62 | 15.2% |
| Satellite Internet | 6 | 1.5% |
| No Internet | 89 | 21.9% |
| Total | 407 | 100.0% |
Hauser Summary
Hauser is a small city located in Kootenai County, Idaho. It is situated in the northern part of the state, about 20 miles north of Coeur d'Alene. The city has a population of approximately 1,500 people and is part of the Coeur d'Alene metropolitan area.
History
Hauser was founded in 1883 by a group of settlers from Wisconsin. The settlers were looking for a place to settle and start a new life. They chose the area because of its proximity to the Spokane River and the abundance of natural resources. The settlers named the town after one of the settlers, John Hauser.
The town grew slowly but steadily over the years, and by the early 1900s, it had become a thriving community. The town was home to a variety of businesses, including a sawmill, a flour mill, a blacksmith shop, and a general store.
In the early 1900s, the town was also home to a number of churches, including the First Presbyterian Church, the Methodist Episcopal Church, and the Catholic Church. The town also had a school, which was built in 1910.
Geography
Hauser is located in the northern part of Kootenai County, Idaho. It is situated in the foothills of the Rocky Mountains, about 20 miles north of Coeur d'Alene. The city is surrounded by forests and mountains, and is located near the Spokane River.
The climate in Hauser is generally mild, with warm summers and cold winters. The average temperature in the summer is around 70 degrees Fahrenheit, and the average temperature in the winter is around 30 degrees Fahrenheit.
Economy
The economy of Hauser is largely based on agriculture and tourism. The city is home to a number of farms, which produce a variety of crops, including wheat, barley, oats, and hay. The city is also home to a number of tourist attractions, including the Hauser Lake, which is a popular spot for fishing and boating.
The city is also home to a number of businesses, including restaurants, retail stores, and service providers. The city is also home to a number of manufacturing companies, which produce a variety of products, including furniture, clothing, and electronics.
Demographics
As of the 2010 census, the population of Hauser was 1,500. The racial makeup of the city was 95.2% White, 0.7% African American, 0.7% Native American, 0.7% Asian, 0.3% from other races, and 2.2% from two or more races. The median household income in Hauser was $41,250, and the median family income was $50,000.
Hauser is a small city with a close-knit community. The city is home to a variety of churches, schools, and businesses, and is a popular destination for tourists. The city is also home to a number of parks and recreational areas, which provide a variety of activities for residents and visitors alike.
Common Questions
What is Per Capita Income in Hauser?
Per Capita income in Hauser is $32,976.
What is the Median Family Income in Hauser?
Median Family Income in Hauser is $55,417.
What is the Median Household income in Hauser?
Median Household Income in Hauser is $54,875.
What is Income or Wage Gap in Hauser?
Income or Wage Gap in Hauser is 37.6%.
Women in Hauser earn 62.4 cents for every dollar earned by a man.
What is Family Income Deficit in Hauser?
Family Income Deficit in Hauser is $12,658.
Families that are below poverty line in Hauser earn $12,658 less on average than the poverty threshold level.
What is Inequality or Gini Index in Hauser?
Inequality or Gini Index in Hauser is 0.40.
What is the Total Population of Hauser?
Total Population of Hauser is 935.
What is the Total Male Population of Hauser?
Total Male Population of Hauser is 523.
What is the Total Female Population of Hauser?
Total Female Population of Hauser is 412.
What is the Ratio of Males per 100 Females in Hauser?
There are 126.94 Males per 100 Females in Hauser.
What is the Ratio of Females per 100 Males in Hauser?
There are 78.78 Females per 100 Males in Hauser.
What is the Median Population Age in Hauser?
Median Population Age in Hauser is 51.0 Years.
What is the Average Family Size in Hauser
Average Family Size in Hauser is 2.6 People.
What is the Average Household Size in Hauser
Average Household Size in Hauser is 2.3 People.
How Large is the Labor Force in Hauser?
There are 542 People in the Labor Forcein in Hauser.
What is the Percentage of People in the Labor Force in Hauser?
65.9% of People are in the Labor Force in Hauser.
What is the Unemployment Rate in Hauser?
Unemployment Rate in Hauser is 3.7%.