New Plymouth, ID Map & Demographics
New Plymouth Map
New Plymouth Overview
$23,634
PER CAPITA INCOME
$71,797
AVG FAMILY INCOME
$57,250
AVG HOUSEHOLD INCOME
44.8%
WAGE / INCOME GAP [ % ]
55.2¢/ $1
WAGE / INCOME GAP [ $ ]
0.34
INEQUALITY / GINI INDEX
1,645
TOTAL POPULATION
804
MALE POPULATION
841
FEMALE POPULATION
95.60
MALES / 100 FEMALES
104.60
FEMALES / 100 MALES
39.5
MEDIAN AGE
2.8
AVG FAMILY SIZE
2.4
AVG HOUSEHOLD SIZE
726
LABOR FORCE [ PEOPLE ]
59.0%
PERCENT IN LABOR FORCE
8.0%
UNEMPLOYMENT RATE
New Plymouth Zip Codes
New Plymouth Area Codes
Income in New Plymouth
Income Overview in New Plymouth
Per Capita Income in New Plymouth is $23,634, while median incomes of families and households are $71,797 and $57,250 respectively.
| Characteristic | Number | Measure |
| Per Capita Income | 1,645 | $23,634 |
| Median Family Income | 479 | $71,797 |
| Mean Family Income | 479 | $73,939 |
| Median Household Income | 689 | $57,250 |
| Mean Household Income | 689 | $61,490 |
| Income Deficit | 479 | $0 |
| Wage / Income Gap (%) | 1,645 | 44.82% |
| Wage / Income Gap ($) | 1,645 | 55.18¢ per $1 |
| Gini / Inequality Index | 1,645 | 0.34 |
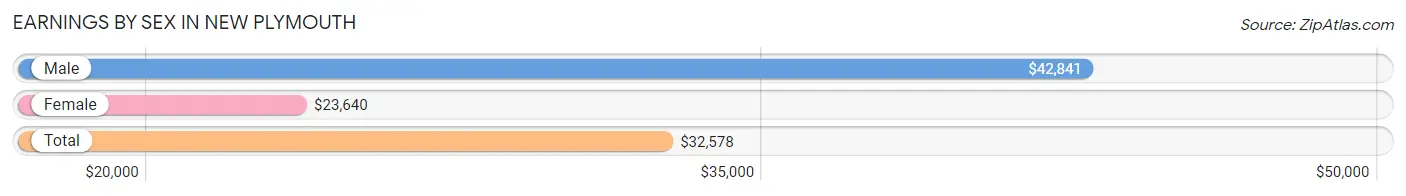
Earnings by Sex in New Plymouth
Average Earnings in New Plymouth are $32,578, $42,841 for men and $23,640 for women, a difference of 44.8%.
| Sex | Number | Average Earnings |
| Male | 377 (45.9%) | $42,841 |
| Female | 444 (54.1%) | $23,640 |
| Total | 821 (100.0%) | $32,578 |
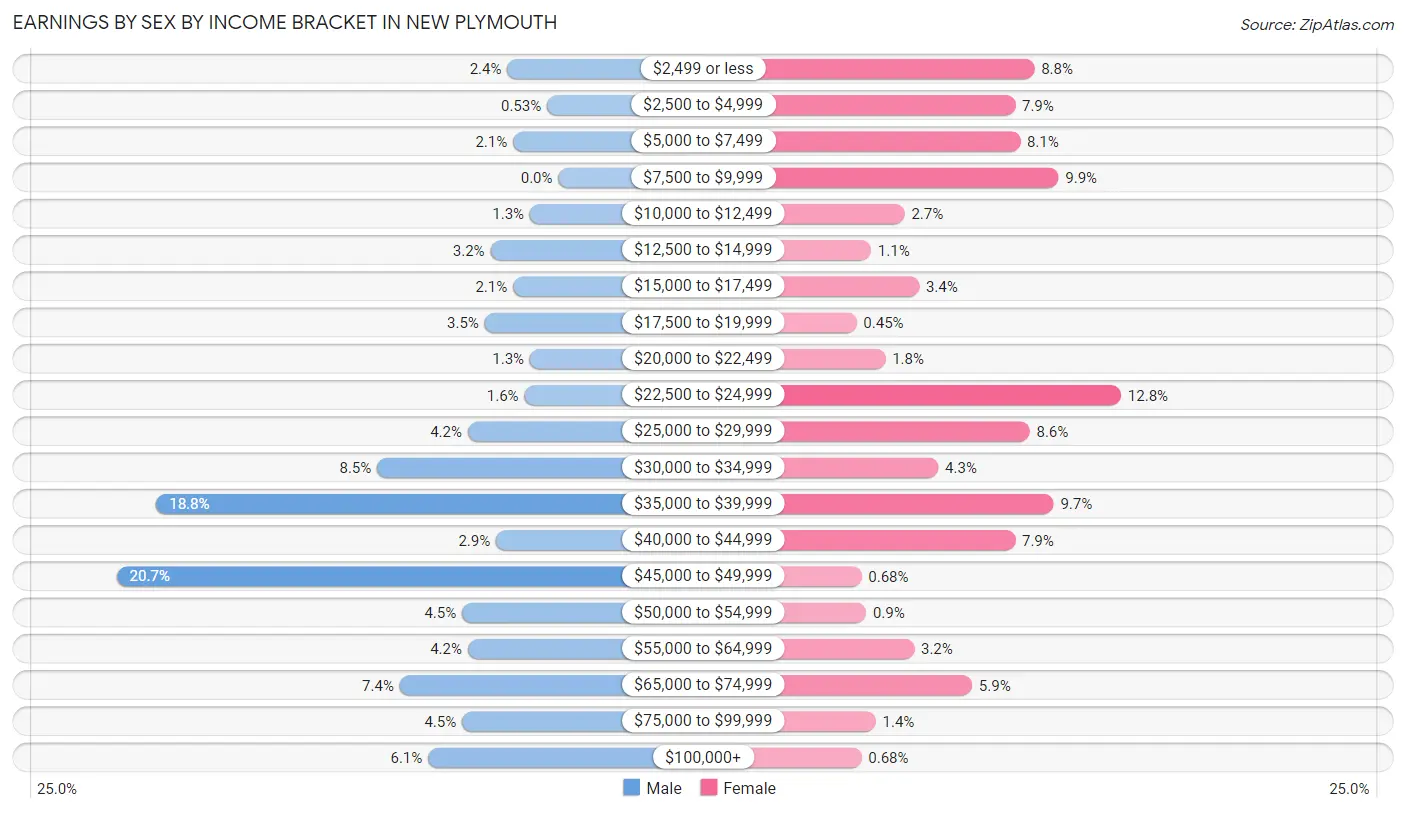
Earnings by Sex by Income Bracket in New Plymouth
The most common earnings brackets in New Plymouth are $45,000 to $49,999 for men (78 | 20.7%) and $22,500 to $24,999 for women (57 | 12.8%).
| Income | Male | Female |
| $2,499 or less | 9 (2.4%) | 39 (8.8%) |
| $2,500 to $4,999 | 2 (0.5%) | 35 (7.9%) |
| $5,000 to $7,499 | 8 (2.1%) | 36 (8.1%) |
| $7,500 to $9,999 | 0 (0.0%) | 44 (9.9%) |
| $10,000 to $12,499 | 5 (1.3%) | 12 (2.7%) |
| $12,500 to $14,999 | 12 (3.2%) | 5 (1.1%) |
| $15,000 to $17,499 | 8 (2.1%) | 15 (3.4%) |
| $17,500 to $19,999 | 13 (3.5%) | 2 (0.4%) |
| $20,000 to $22,499 | 5 (1.3%) | 8 (1.8%) |
| $22,500 to $24,999 | 6 (1.6%) | 57 (12.8%) |
| $25,000 to $29,999 | 16 (4.2%) | 38 (8.6%) |
| $30,000 to $34,999 | 32 (8.5%) | 19 (4.3%) |
| $35,000 to $39,999 | 71 (18.8%) | 43 (9.7%) |
| $40,000 to $44,999 | 11 (2.9%) | 35 (7.9%) |
| $45,000 to $49,999 | 78 (20.7%) | 3 (0.7%) |
| $50,000 to $54,999 | 17 (4.5%) | 4 (0.9%) |
| $55,000 to $64,999 | 16 (4.2%) | 14 (3.2%) |
| $65,000 to $74,999 | 28 (7.4%) | 26 (5.9%) |
| $75,000 to $99,999 | 17 (4.5%) | 6 (1.3%) |
| $100,000+ | 23 (6.1%) | 3 (0.7%) |
| Total | 377 (100.0%) | 444 (100.0%) |
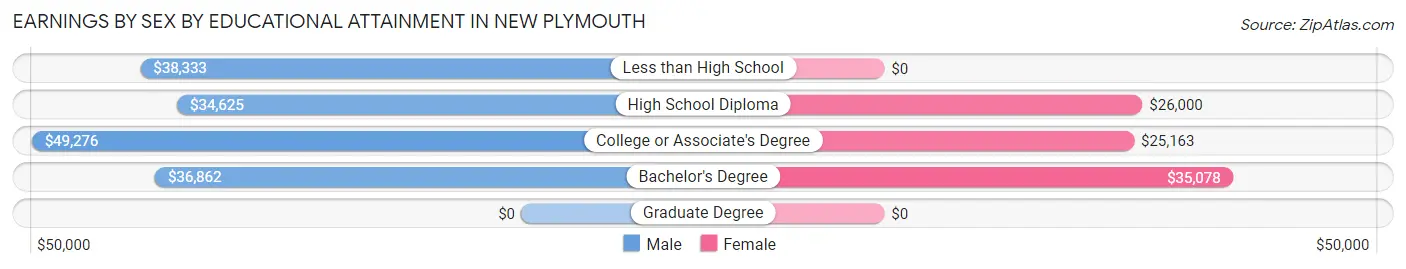
Earnings by Sex by Educational Attainment in New Plymouth
Average earnings in New Plymouth are $43,750 for men and $25,134 for women, a difference of 42.5%. Men with an educational attainment of college or associate's degree enjoy the highest average annual earnings of $49,276, while those with high school diploma education earn the least with $34,625. Women with an educational attainment of bachelor's degree earn the most with the average annual earnings of $35,078, while those with college or associate's degree education have the smallest earnings of $25,163.
| Educational Attainment | Male Income | Female Income |
| Less than High School | $38,333 | $0 |
| High School Diploma | $34,625 | $26,000 |
| College or Associate's Degree | $49,276 | $25,163 |
| Bachelor's Degree | $36,862 | $35,078 |
| Graduate Degree | - | - |
| Total | $43,750 | $25,134 |
Family Income in New Plymouth
Family Income Brackets in New Plymouth
According to the New Plymouth family income data, there are 131 families falling into the $75,000 to $99,999 income range, which is the most common income bracket and makes up 27.4% of all families. Conversely, the less than $10,000 income bracket is the least frequent group with only 4 families (0.8%) belonging to this category.
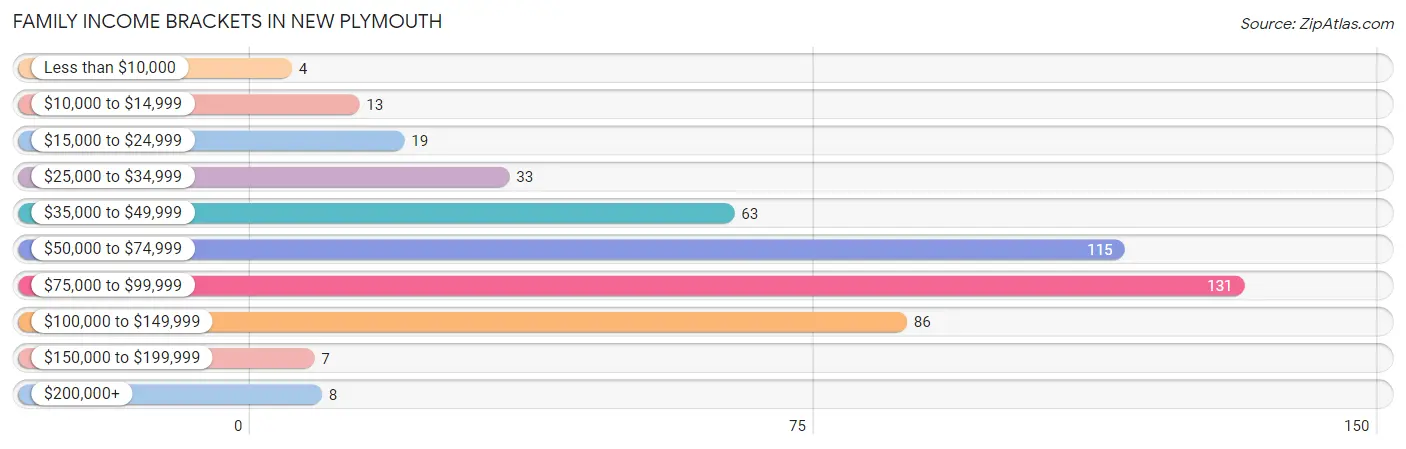
| Income Bracket | # Families | % Families |
| Less than $10,000 | 4 | 0.8% |
| $10,000 to $14,999 | 13 | 2.7% |
| $15,000 to $24,999 | 19 | 4.0% |
| $25,000 to $34,999 | 33 | 6.9% |
| $35,000 to $49,999 | 63 | 13.2% |
| $50,000 to $74,999 | 115 | 24.0% |
| $75,000 to $99,999 | 131 | 27.3% |
| $100,000 to $149,999 | 86 | 18.0% |
| $150,000 to $199,999 | 7 | 1.5% |
| $200,000+ | 8 | 1.7% |
Family Income by Famaliy Size in New Plymouth
3-person families (160 | 33.4%) account for the highest median family income in New Plymouth with $81,491 per family, while 2-person families (190 | 39.7%) have the highest median income of $32,841 per family member.
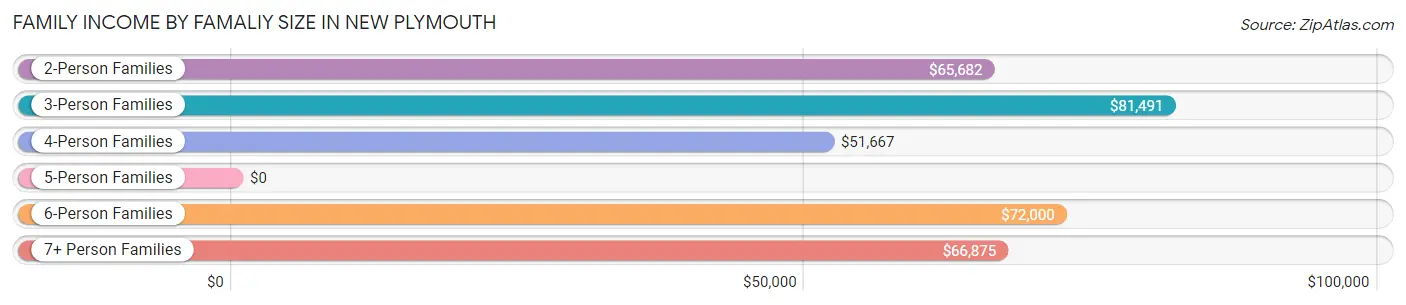
| Income Bracket | # Families | Median Income |
| 2-Person Families | 190 (39.7%) | $65,682 |
| 3-Person Families | 160 (33.4%) | $81,491 |
| 4-Person Families | 88 (18.4%) | $51,667 |
| 5-Person Families | 14 (2.9%) | $0 |
| 6-Person Families | 20 (4.2%) | $72,000 |
| 7+ Person Families | 7 (1.5%) | $66,875 |
| Total | 479 (100.0%) | $71,797 |
Family Income by Number of Earners in New Plymouth
The median family income in New Plymouth is $71,797, with families comprising 2 earners (185) having the highest median family income of $97,083, while families with no earners (66) have the lowest median family income of $50,000, accounting for 38.6% and 13.8% of families, respectively.
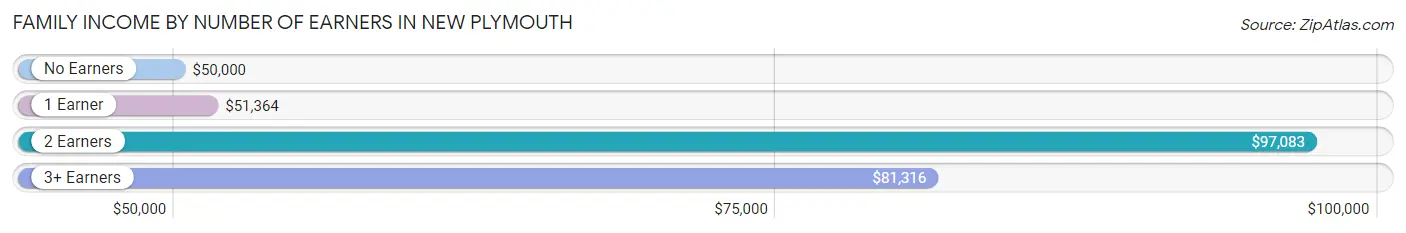
| Number of Earners | # Families | Median Income |
| No Earners | 66 (13.8%) | $50,000 |
| 1 Earner | 162 (33.8%) | $51,364 |
| 2 Earners | 185 (38.6%) | $97,083 |
| 3+ Earners | 66 (13.8%) | $81,316 |
| Total | 479 (100.0%) | $71,797 |
Household Income in New Plymouth
Household Income Brackets in New Plymouth
With 137 households falling in the category, the $75,000 to $99,999 income range is the most frequent in New Plymouth, accounting for 19.9% of all households. In contrast, only 7 households (1.0%) fall into the $150,000 to $199,999 income bracket, making it the least populous group.
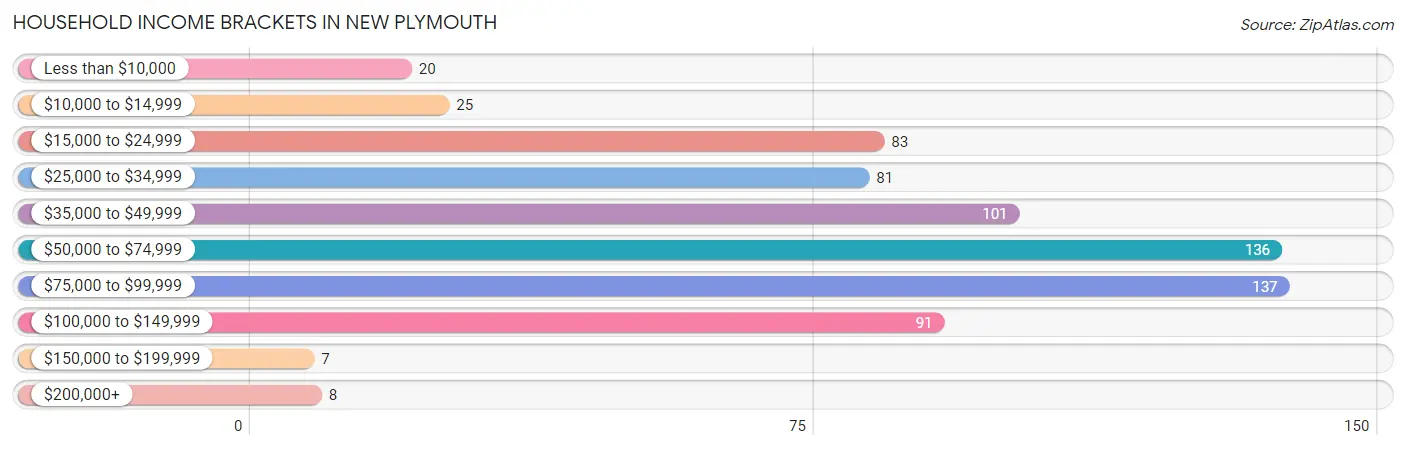
| Income Bracket | # Households | % Households |
| Less than $10,000 | 20 | 2.9% |
| $10,000 to $14,999 | 25 | 3.6% |
| $15,000 to $24,999 | 83 | 12.0% |
| $25,000 to $34,999 | 81 | 11.8% |
| $35,000 to $49,999 | 101 | 14.7% |
| $50,000 to $74,999 | 136 | 19.7% |
| $75,000 to $99,999 | 137 | 19.9% |
| $100,000 to $149,999 | 91 | 13.2% |
| $150,000 to $199,999 | 7 | 1.0% |
| $200,000+ | 8 | 1.2% |
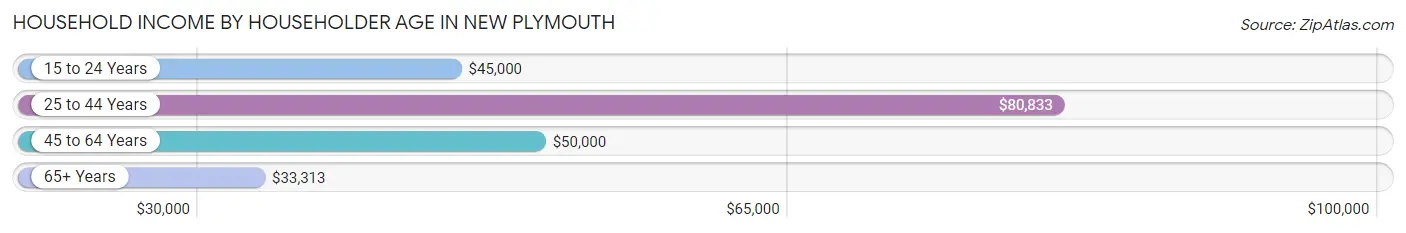
Household Income by Householder Age in New Plymouth
The median household income in New Plymouth is $57,250, with the highest median household income of $80,833 found in the 25 to 44 years age bracket for the primary householder. A total of 290 households (42.1%) fall into this category. Meanwhile, the 65+ years age bracket for the primary householder has the lowest median household income of $33,313, with 173 households (25.1%) in this group.
| Income Bracket | # Households | Median Income |
| 15 to 24 Years | 30 (4.3%) | $45,000 |
| 25 to 44 Years | 290 (42.1%) | $80,833 |
| 45 to 64 Years | 196 (28.4%) | $50,000 |
| 65+ Years | 173 (25.1%) | $33,313 |
| Total | 689 (100.0%) | $57,250 |
Poverty in New Plymouth
Income Below Poverty by Sex and Age in New Plymouth
With 5.9% poverty level for males and 11.2% for females among the residents of New Plymouth, 16 and 17 year old males and 12 to 14 year old females are the most vulnerable to poverty, with 6 males (85.7%) and 20 females (60.6%) in their respective age groups living below the poverty level.
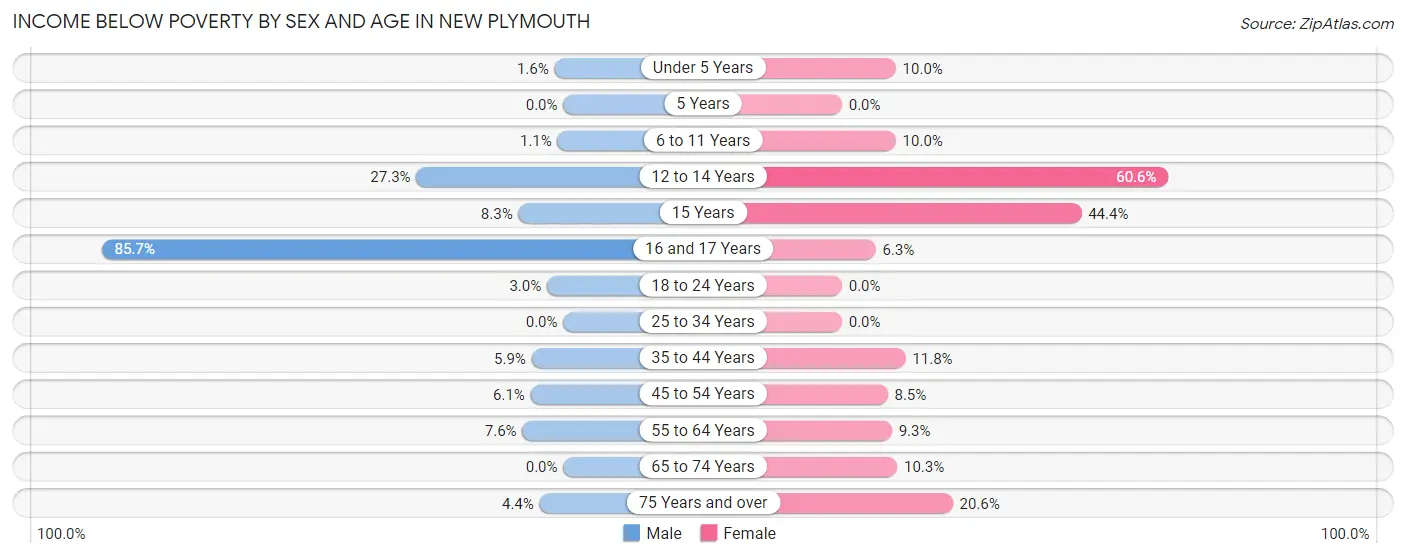
| Age Bracket | Male | Female |
| Under 5 Years | 1 (1.6%) | 3 (10.0%) |
| 5 Years | 0 (0.0%) | 0 (0.0%) |
| 6 to 11 Years | 1 (1.1%) | 4 (10.0%) |
| 12 to 14 Years | 15 (27.3%) | 20 (60.6%) |
| 15 Years | 1 (8.3%) | 4 (44.4%) |
| 16 and 17 Years | 6 (85.7%) | 2 (6.2%) |
| 18 to 24 Years | 1 (3.0%) | 0 (0.0%) |
| 25 to 34 Years | 0 (0.0%) | 0 (0.0%) |
| 35 to 44 Years | 7 (5.9%) | 17 (11.8%) |
| 45 to 54 Years | 4 (6.1%) | 9 (8.5%) |
| 55 to 64 Years | 6 (7.6%) | 10 (9.3%) |
| 65 to 74 Years | 0 (0.0%) | 8 (10.3%) |
| 75 Years and over | 3 (4.4%) | 15 (20.5%) |
| Total | 45 (5.9%) | 92 (11.2%) |
Income Above Poverty by Sex and Age in New Plymouth
According to the poverty statistics in New Plymouth, males aged 5 years and females aged 5 years are the age groups that are most secure financially, with 100.0% of males and 100.0% of females in these age groups living above the poverty line.
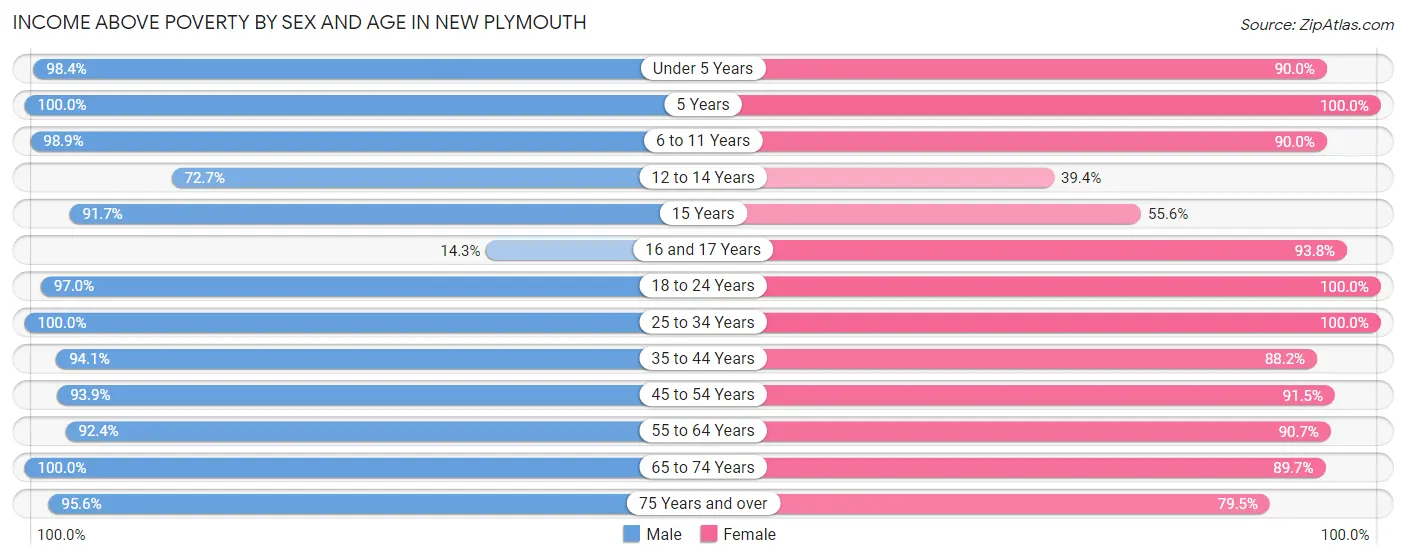
| Age Bracket | Male | Female |
| Under 5 Years | 60 (98.4%) | 27 (90.0%) |
| 5 Years | 4 (100.0%) | 15 (100.0%) |
| 6 to 11 Years | 93 (98.9%) | 36 (90.0%) |
| 12 to 14 Years | 40 (72.7%) | 13 (39.4%) |
| 15 Years | 11 (91.7%) | 5 (55.6%) |
| 16 and 17 Years | 1 (14.3%) | 30 (93.8%) |
| 18 to 24 Years | 32 (97.0%) | 87 (100.0%) |
| 25 to 34 Years | 120 (100.0%) | 69 (100.0%) |
| 35 to 44 Years | 112 (94.1%) | 127 (88.2%) |
| 45 to 54 Years | 62 (93.9%) | 97 (91.5%) |
| 55 to 64 Years | 73 (92.4%) | 98 (90.7%) |
| 65 to 74 Years | 41 (100.0%) | 70 (89.7%) |
| 75 Years and over | 65 (95.6%) | 58 (79.4%) |
| Total | 714 (94.1%) | 732 (88.8%) |
Income Below Poverty Among Married-Couple Families in New Plymouth
The poverty statistics for married-couple families in New Plymouth show that 2.3% or 9 of the total 384 families live below the poverty line. Families with 5 or more children have the highest poverty rate of 28.6%, comprising of 2 families. On the other hand, families with 1 or 2 children have the lowest poverty rate of 0.0%, which includes 0 families.
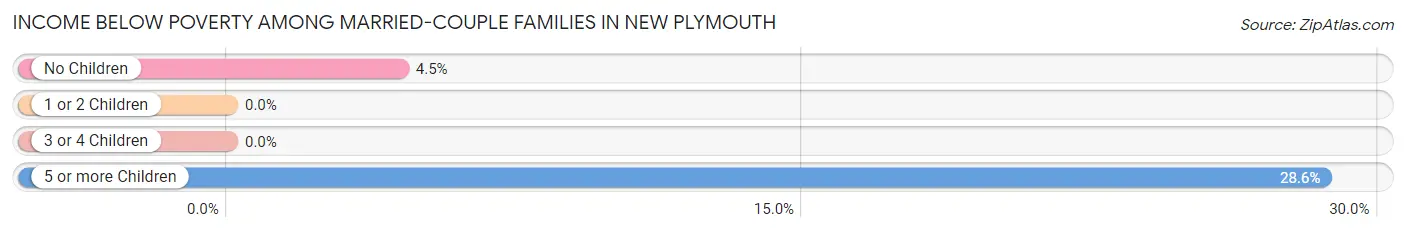
| Children | Above Poverty | Below Poverty |
| No Children | 150 (95.5%) | 7 (4.5%) |
| 1 or 2 Children | 201 (100.0%) | 0 (0.0%) |
| 3 or 4 Children | 19 (100.0%) | 0 (0.0%) |
| 5 or more Children | 5 (71.4%) | 2 (28.6%) |
| Total | 375 (97.7%) | 9 (2.3%) |
Income Below Poverty Among Single-Parent Households in New Plymouth
According to the poverty data in New Plymouth, 20.6% or 7 single-father households and 27.9% or 17 single-mother households are living below the poverty line. Among single-father households, those with 1 or 2 children have the highest poverty rate, with 7 households (38.9%) experiencing poverty. Likewise, among single-mother households, those with 3 or 4 children have the highest poverty rate, with 10 households (40.0%) falling below the poverty line.
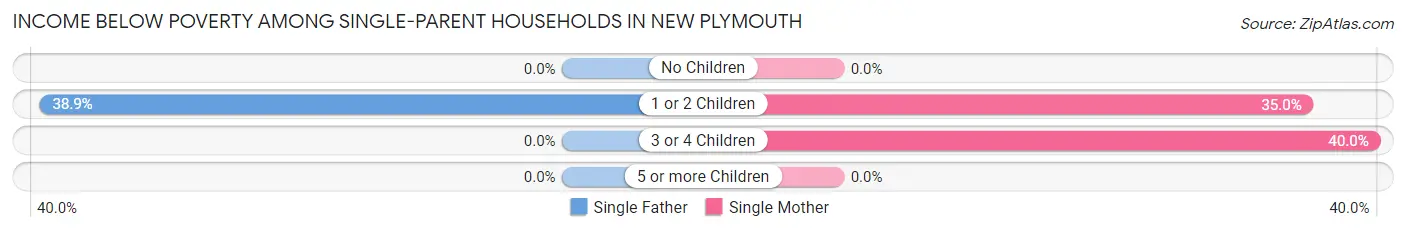
| Children | Single Father | Single Mother |
| No Children | 0 (0.0%) | 0 (0.0%) |
| 1 or 2 Children | 7 (38.9%) | 7 (35.0%) |
| 3 or 4 Children | 0 (0.0%) | 10 (40.0%) |
| 5 or more Children | 0 (0.0%) | 0 (0.0%) |
| Total | 7 (20.6%) | 17 (27.9%) |
Income Below Poverty Among Married-Couple vs Single-Parent Households in New Plymouth
The poverty data for New Plymouth shows that 9 of the married-couple family households (2.3%) and 24 of the single-parent households (25.3%) are living below the poverty level. Within the married-couple family households, those with 5 or more children have the highest poverty rate, with 2 households (28.6%) falling below the poverty line. Among the single-parent households, those with 3 or 4 children have the highest poverty rate, with 10 household (37.0%) living below poverty.
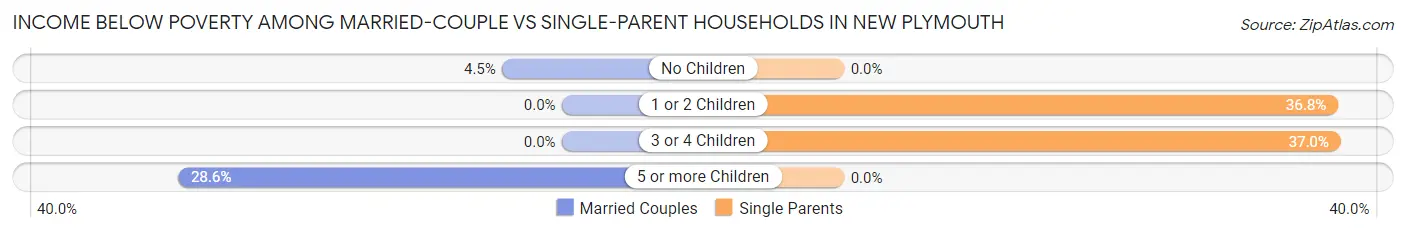
| Children | Married-Couple Families | Single-Parent Households |
| No Children | 7 (4.5%) | 0 (0.0%) |
| 1 or 2 Children | 0 (0.0%) | 14 (36.8%) |
| 3 or 4 Children | 0 (0.0%) | 10 (37.0%) |
| 5 or more Children | 2 (28.6%) | 0 (0.0%) |
| Total | 9 (2.3%) | 24 (25.3%) |
Race in New Plymouth
The most populous races in New Plymouth are White / Caucasian (1,375 | 83.6%), Hispanic or Latino (324 | 19.7%), and Two or more Races (185 | 11.3%).
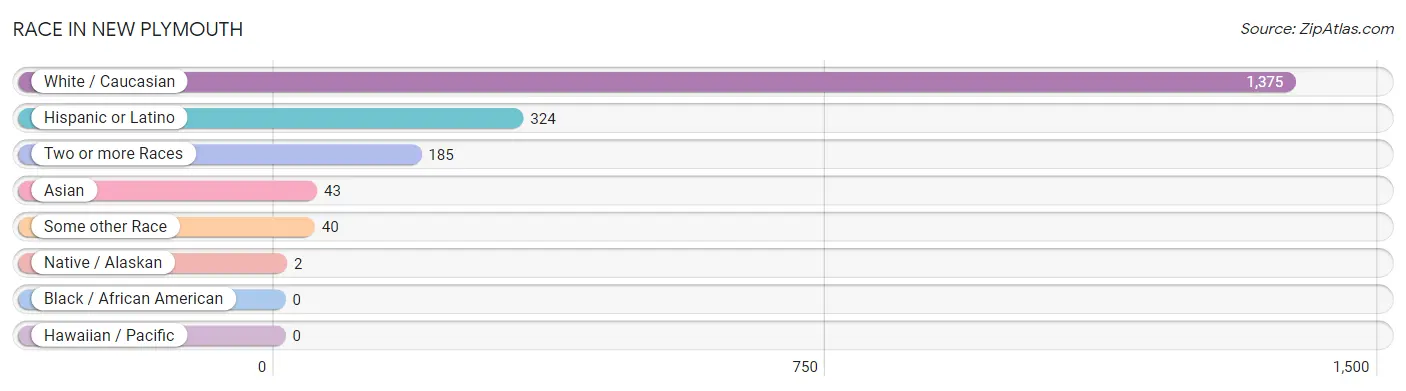
| Race | # Population | % Population |
| Asian | 43 | 2.6% |
| Black / African American | 0 | 0.0% |
| Hawaiian / Pacific | 0 | 0.0% |
| Hispanic or Latino | 324 | 19.7% |
| Native / Alaskan | 2 | 0.1% |
| White / Caucasian | 1,375 | 83.6% |
| Two or more Races | 185 | 11.3% |
| Some other Race | 40 | 2.4% |
| Total | 1,645 | 100.0% |
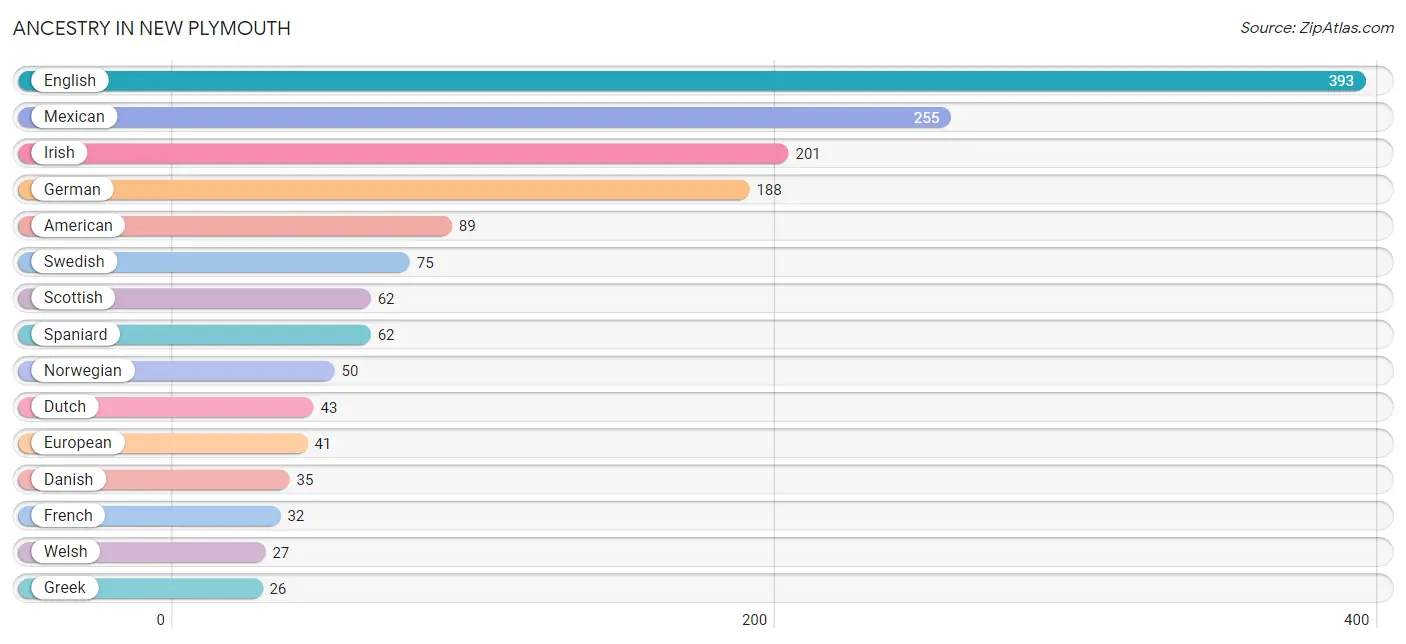
Ancestry in New Plymouth
The most populous ancestries reported in New Plymouth are English (393 | 23.9%), Mexican (255 | 15.5%), Irish (201 | 12.2%), German (188 | 11.4%), and American (89 | 5.4%), together accounting for 68.4% of all New Plymouth residents.
| Ancestry | # Population | % Population |
| American | 89 | 5.4% |
| Apache | 13 | 0.8% |
| Bhutanese | 4 | 0.2% |
| Burmese | 17 | 1.0% |
| Cherokee | 6 | 0.4% |
| Colombian | 7 | 0.4% |
| Danish | 35 | 2.1% |
| Dutch | 43 | 2.6% |
| Dutch West Indian | 4 | 0.2% |
| English | 393 | 23.9% |
| European | 41 | 2.5% |
| Finnish | 16 | 1.0% |
| French | 32 | 1.9% |
| French Canadian | 15 | 0.9% |
| German | 188 | 11.4% |
| Greek | 26 | 1.6% |
| Indian (Asian) | 19 | 1.2% |
| Irish | 201 | 12.2% |
| Italian | 19 | 1.2% |
| Korean | 22 | 1.3% |
| Mexican | 255 | 15.5% |
| Norwegian | 50 | 3.0% |
| Osage | 12 | 0.7% |
| Paiute | 2 | 0.1% |
| Polish | 4 | 0.2% |
| Portuguese | 8 | 0.5% |
| Romanian | 2 | 0.1% |
| Scandinavian | 4 | 0.2% |
| Scotch-Irish | 10 | 0.6% |
| Scottish | 62 | 3.8% |
| South American | 7 | 0.4% |
| Spaniard | 62 | 3.8% |
| Swedish | 75 | 4.6% |
| Thai | 16 | 1.0% |
| Welsh | 27 | 1.6% | View All 35 Rows |
Immigrants in New Plymouth
The most numerous immigrant groups reported in New Plymouth came from Latin America (57 | 3.5%), Central America (50 | 3.0%), Mexico (50 | 3.0%), Asia (12 | 0.7%), and Colombia (7 | 0.4%), together accounting for 10.7% of all New Plymouth residents.
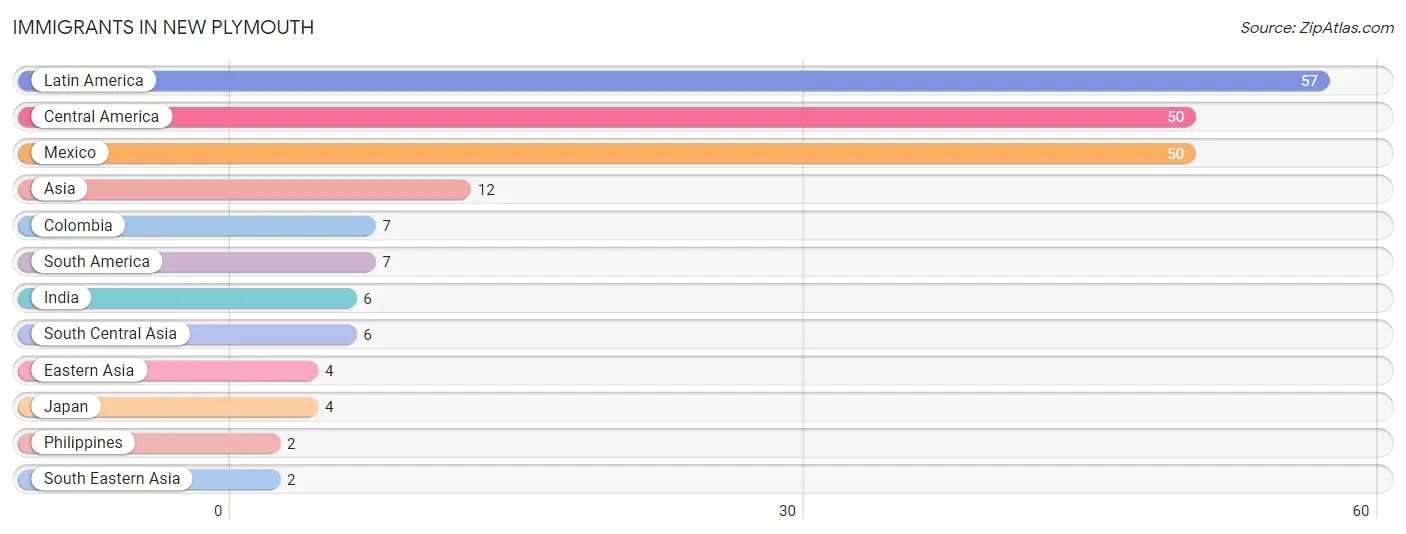
| Immigration Origin | # Population | % Population |
| Asia | 12 | 0.7% |
| Central America | 50 | 3.0% |
| Colombia | 7 | 0.4% |
| Eastern Asia | 4 | 0.2% |
| India | 6 | 0.4% |
| Japan | 4 | 0.2% |
| Latin America | 57 | 3.5% |
| Mexico | 50 | 3.0% |
| Philippines | 2 | 0.1% |
| South America | 7 | 0.4% |
| South Central Asia | 6 | 0.4% |
| South Eastern Asia | 2 | 0.1% | View All 12 Rows |
Sex and Age in New Plymouth
Sex and Age in New Plymouth
The most populous age groups in New Plymouth are 10 to 14 Years (120 | 14.9%) for men and 40 to 44 Years (119 | 14.1%) for women.
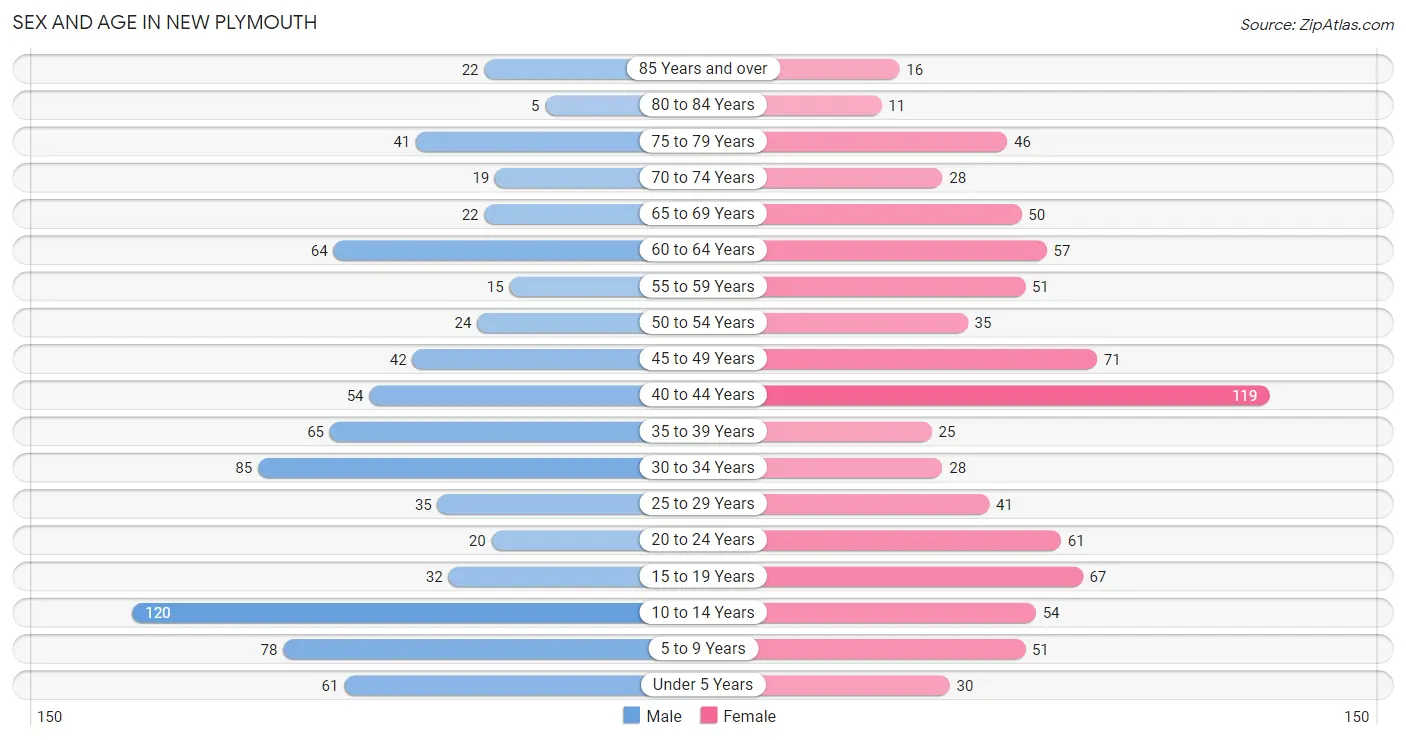
| Age Bracket | Male | Female |
| Under 5 Years | 61 (7.6%) | 30 (3.6%) |
| 5 to 9 Years | 78 (9.7%) | 51 (6.1%) |
| 10 to 14 Years | 120 (14.9%) | 54 (6.4%) |
| 15 to 19 Years | 32 (4.0%) | 67 (8.0%) |
| 20 to 24 Years | 20 (2.5%) | 61 (7.2%) |
| 25 to 29 Years | 35 (4.3%) | 41 (4.9%) |
| 30 to 34 Years | 85 (10.6%) | 28 (3.3%) |
| 35 to 39 Years | 65 (8.1%) | 25 (3.0%) |
| 40 to 44 Years | 54 (6.7%) | 119 (14.1%) |
| 45 to 49 Years | 42 (5.2%) | 71 (8.4%) |
| 50 to 54 Years | 24 (3.0%) | 35 (4.2%) |
| 55 to 59 Years | 15 (1.9%) | 51 (6.1%) |
| 60 to 64 Years | 64 (8.0%) | 57 (6.8%) |
| 65 to 69 Years | 22 (2.7%) | 50 (5.9%) |
| 70 to 74 Years | 19 (2.4%) | 28 (3.3%) |
| 75 to 79 Years | 41 (5.1%) | 46 (5.5%) |
| 80 to 84 Years | 5 (0.6%) | 11 (1.3%) |
| 85 Years and over | 22 (2.7%) | 16 (1.9%) |
| Total | 804 (100.0%) | 841 (100.0%) |
Families and Households in New Plymouth
Median Family Size in New Plymouth
The median family size in New Plymouth is 2.79 persons per family, with single female/mother families (61 | 12.7%) accounting for the largest median family size of 3.25 persons per family. On the other hand, single male/father families (34 | 7.1%) represent the smallest median family size with 2.47 persons per family.
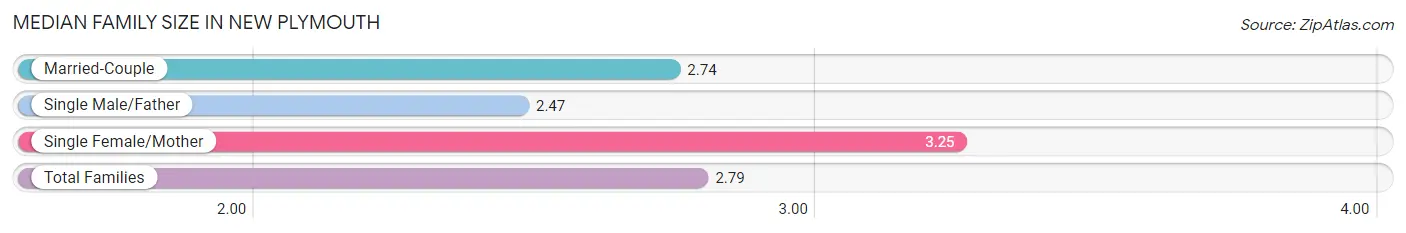
| Family Type | # Families | Family Size |
| Married-Couple | 384 (80.2%) | 2.74 |
| Single Male/Father | 34 (7.1%) | 2.47 |
| Single Female/Mother | 61 (12.7%) | 3.25 |
| Total Families | 479 (100.0%) | 2.79 |
Median Household Size in New Plymouth
The median household size in New Plymouth is 2.39 persons per household, with single female/mother households (61 | 8.8%) accounting for the largest median household size of 4.41 persons per household. non-family households (210 | 30.5%) represent the smallest median household size with 1.12 persons per household.
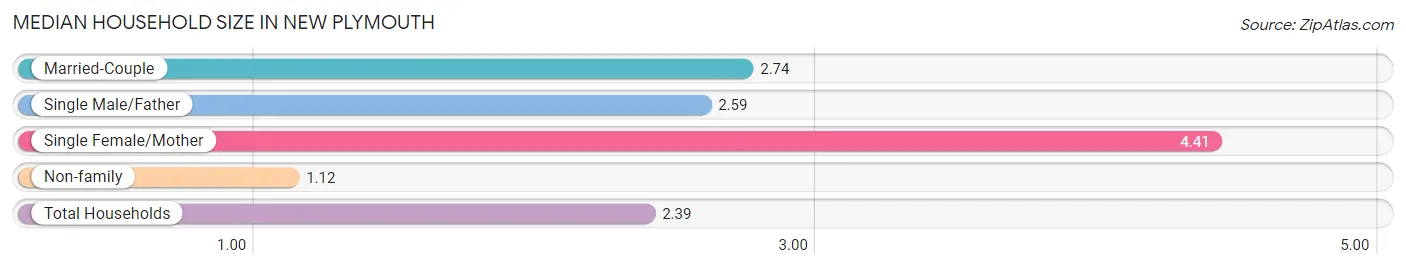
| Household Type | # Households | Household Size |
| Married-Couple | 384 (55.7%) | 2.74 |
| Single Male/Father | 34 (4.9%) | 2.59 |
| Single Female/Mother | 61 (8.8%) | 4.41 |
| Non-family | 210 (30.5%) | 1.12 |
| Total Households | 689 (100.0%) | 2.39 |
Household Size by Marriage Status in New Plymouth
Out of a total of 689 households in New Plymouth, 479 (69.5%) are family households, while 210 (30.5%) are nonfamily households. The most numerous type of family households are 2-person households, comprising 185, and the most common type of nonfamily households are 1-person households, comprising 193.
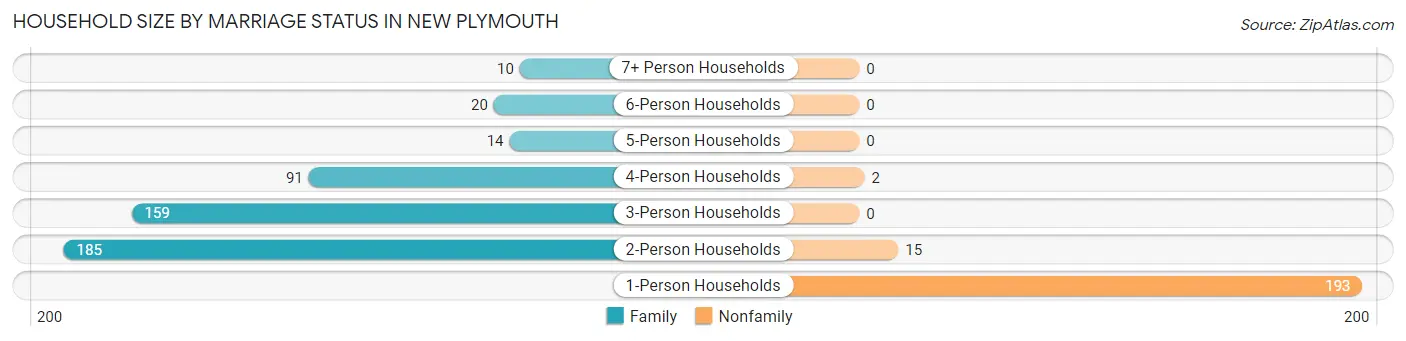
| Household Size | Family Households | Nonfamily Households |
| 1-Person Households | - | 193 (28.0%) |
| 2-Person Households | 185 (26.9%) | 15 (2.2%) |
| 3-Person Households | 159 (23.1%) | 0 (0.0%) |
| 4-Person Households | 91 (13.2%) | 2 (0.3%) |
| 5-Person Households | 14 (2.0%) | 0 (0.0%) |
| 6-Person Households | 20 (2.9%) | 0 (0.0%) |
| 7+ Person Households | 10 (1.5%) | 0 (0.0%) |
| Total | 479 (69.5%) | 210 (30.5%) |
Female Fertility in New Plymouth
Fertility by Age in New Plymouth
Average fertility rate in New Plymouth is 70.0 births per 1,000 women. Women in the age bracket of 20 to 34 years have the highest fertility rate with 208.0 births per 1,000 women. Women in the age bracket of 20 to 34 years acount for 93.1% of all women with births.
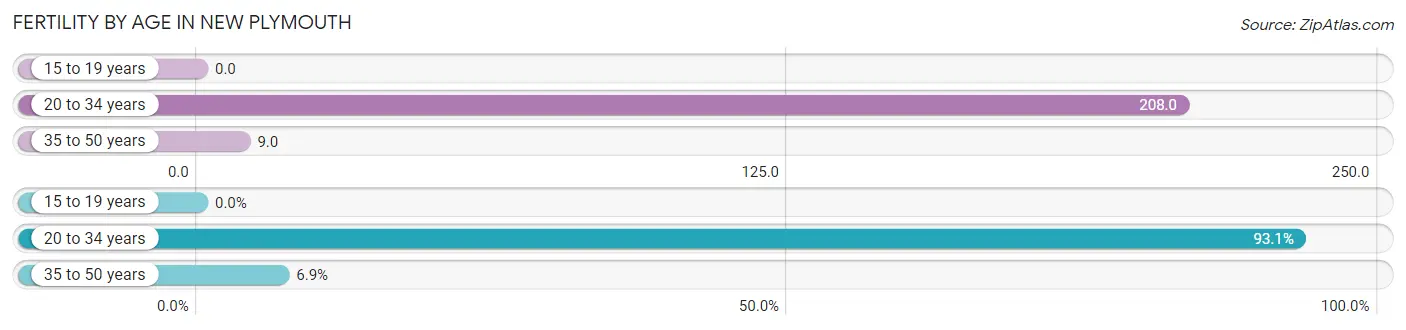
| Age Bracket | Women with Births | Births / 1,000 Women |
| 15 to 19 years | 0 (0.0%) | 0.0 |
| 20 to 34 years | 27 (93.1%) | 208.0 |
| 35 to 50 years | 2 (6.9%) | 9.0 |
| Total | 29 (100.0%) | 70.0 |
Fertility by Age by Marriage Status in New Plymouth
69.0% of women with births (29) in New Plymouth are married. The highest percentage of unmarried women with births falls into 20 to 34 years age bracket with 33.3% of them unmarried at the time of birth, while the lowest percentage of unmarried women with births belong to 35 to 50 years age bracket with 0.0% of them unmarried.
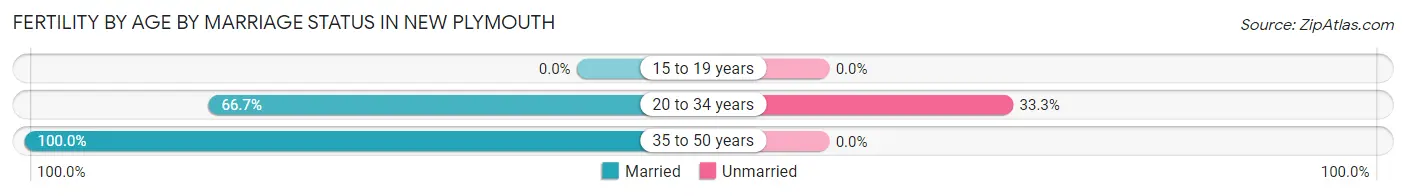
| Age Bracket | Married | Unmarried |
| 15 to 19 years | 0 (0.0%) | 0 (0.0%) |
| 20 to 34 years | 18 (66.7%) | 9 (33.3%) |
| 35 to 50 years | 2 (100.0%) | 0 (0.0%) |
| Total | 20 (69.0%) | 9 (31.0%) |
Fertility by Education in New Plymouth
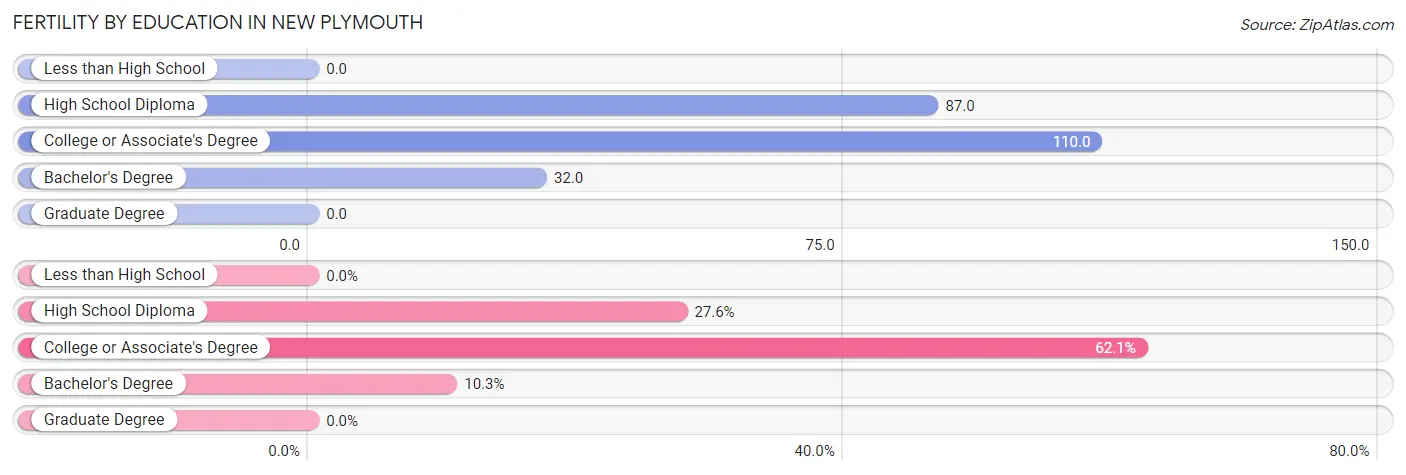
| Educational Attainment | Women with Births | Births / 1,000 Women |
| Less than High School | 0 (0.0%) | 0.0 |
| High School Diploma | 8 (27.6%) | 87.0 |
| College or Associate's Degree | 18 (62.1%) | 110.0 |
| Bachelor's Degree | 3 (10.3%) | 32.0 |
| Graduate Degree | 0 (0.0%) | 0.0 |
| Total | 29 (100.0%) | 70.0 |
Fertility by Education by Marriage Status in New Plymouth
31.0% of women with births in New Plymouth are unmarried. Women with the educational attainment of bachelor's degree are most likely to be married with 100.0% of them married at childbirth, while women with the educational attainment of high school diploma are least likely to be married with 75.0% of them unmarried at childbirth.
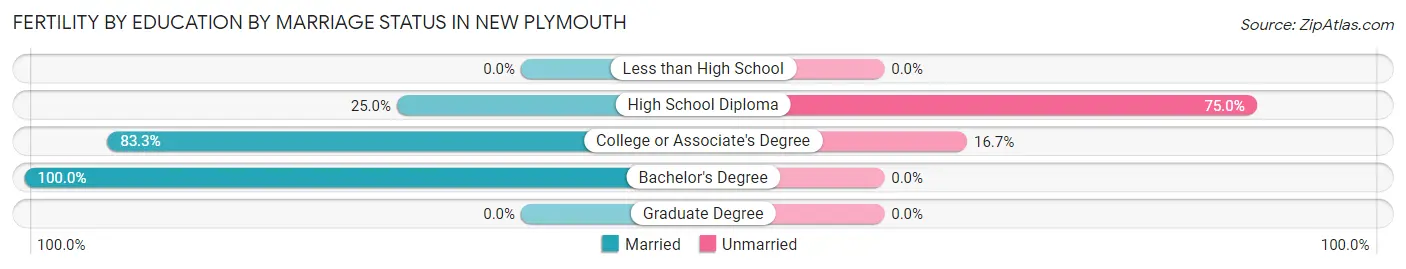
| Educational Attainment | Married | Unmarried |
| Less than High School | 0 (0.0%) | 0 (0.0%) |
| High School Diploma | 2 (25.0%) | 6 (75.0%) |
| College or Associate's Degree | 15 (83.3%) | 3 (16.7%) |
| Bachelor's Degree | 3 (100.0%) | 0 (0.0%) |
| Graduate Degree | 0 (0.0%) | 0 (0.0%) |
| Total | 20 (69.0%) | 9 (31.0%) |
Employment Characteristics in New Plymouth
Employment by Class of Employer in New Plymouth
Among the 668 employed individuals in New Plymouth, private company employees (360 | 53.9%), local government employees (129 | 19.3%), and self-employed (not incorporated) (77 | 11.5%) make up the most common classes of employment.
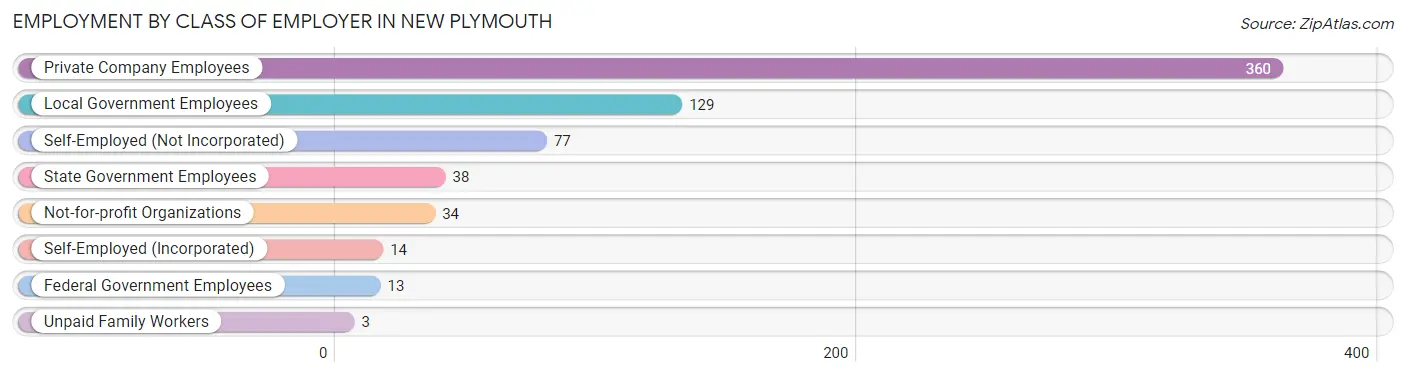
| Employer Class | # Employees | % Employees |
| Private Company Employees | 360 | 53.9% |
| Self-Employed (Incorporated) | 14 | 2.1% |
| Self-Employed (Not Incorporated) | 77 | 11.5% |
| Not-for-profit Organizations | 34 | 5.1% |
| Local Government Employees | 129 | 19.3% |
| State Government Employees | 38 | 5.7% |
| Federal Government Employees | 13 | 1.9% |
| Unpaid Family Workers | 3 | 0.4% |
| Total | 668 | 100.0% |
Employment Status by Age in New Plymouth
According to the labor force statistics for New Plymouth, out of the total population over 16 years of age (1,230), 59.0% or 726 individuals are in the labor force, with 8.0% or 58 of them unemployed. The age group with the highest labor force participation rate is 30 to 34 years, with 100.0% or 113 individuals in the labor force. Within the labor force, the 35 to 44 years age range has the highest percentage of unemployed individuals, with 21.4% or 52 of them being unemployed.
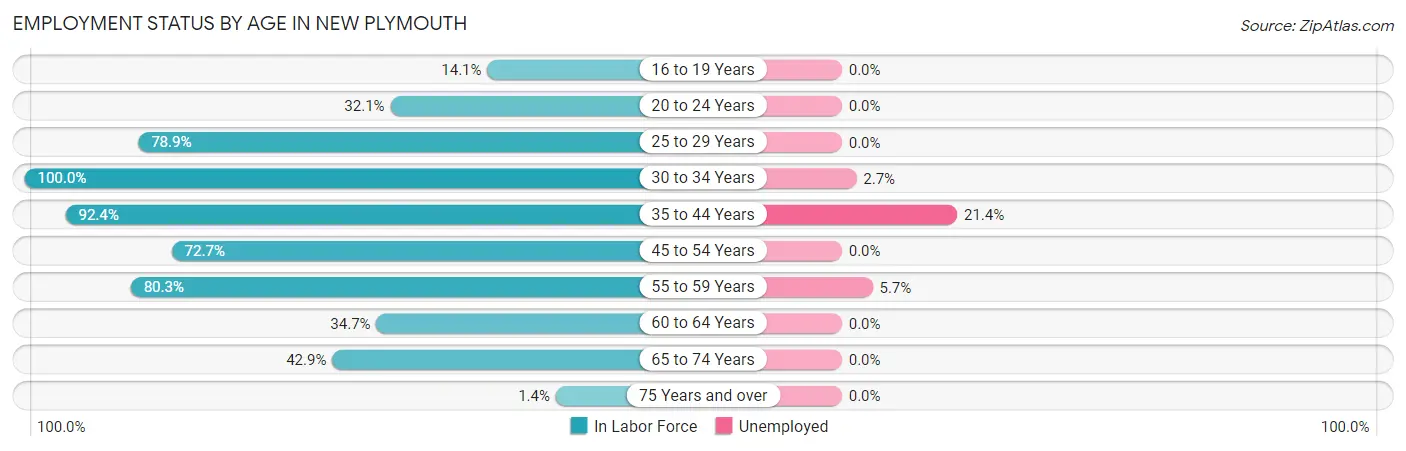
| Age Bracket | In Labor Force | Unemployed |
| 16 to 19 Years | 11 (14.1%) | 0 (0.0%) |
| 20 to 24 Years | 26 (32.1%) | 0 (0.0%) |
| 25 to 29 Years | 60 (78.9%) | 0 (0.0%) |
| 30 to 34 Years | 113 (100.0%) | 3 (2.7%) |
| 35 to 44 Years | 243 (92.4%) | 52 (21.4%) |
| 45 to 54 Years | 125 (72.7%) | 0 (0.0%) |
| 55 to 59 Years | 53 (80.3%) | 3 (5.7%) |
| 60 to 64 Years | 42 (34.7%) | 0 (0.0%) |
| 65 to 74 Years | 51 (42.9%) | 0 (0.0%) |
| 75 Years and over | 2 (1.4%) | 0 (0.0%) |
| Total | 726 (59.0%) | 58 (8.0%) |
Employment Status by Educational Attainment in New Plymouth
According to labor force statistics for New Plymouth, 78.4% of individuals (636) out of the total population between 25 and 64 years of age (811) are in the labor force, with 9.1% or 58 of them being unemployed. The group with the highest labor force participation rate are those with the educational attainment of bachelor's degree or higher, with 92.2% or 237 individuals in the labor force. Within the labor force, individuals with less than high school education have the highest percentage of unemployment, with 20.0% or 6 of them being unemployed.
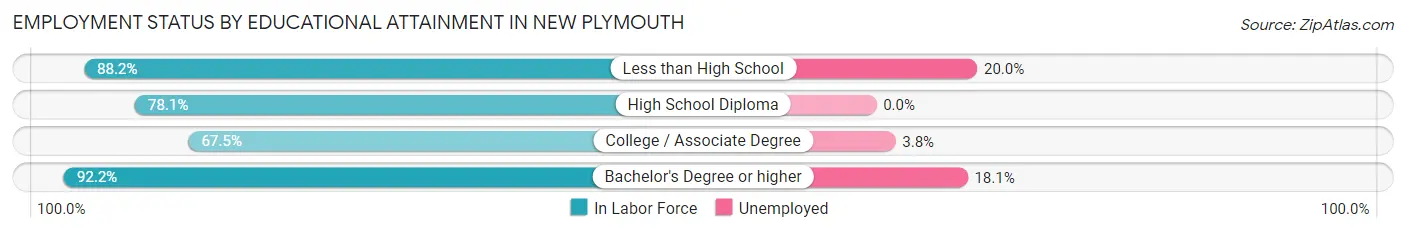
| Educational Attainment | In Labor Force | Unemployed |
| Less than High School | 30 (88.2%) | 7 (20.0%) |
| High School Diploma | 132 (78.1%) | 0 (0.0%) |
| College / Associate Degree | 237 (67.5%) | 13 (3.8%) |
| Bachelor's Degree or higher | 237 (92.2%) | 47 (18.1%) |
| Total | 636 (78.4%) | 74 (9.1%) |
Employment Occupations by Sex in New Plymouth
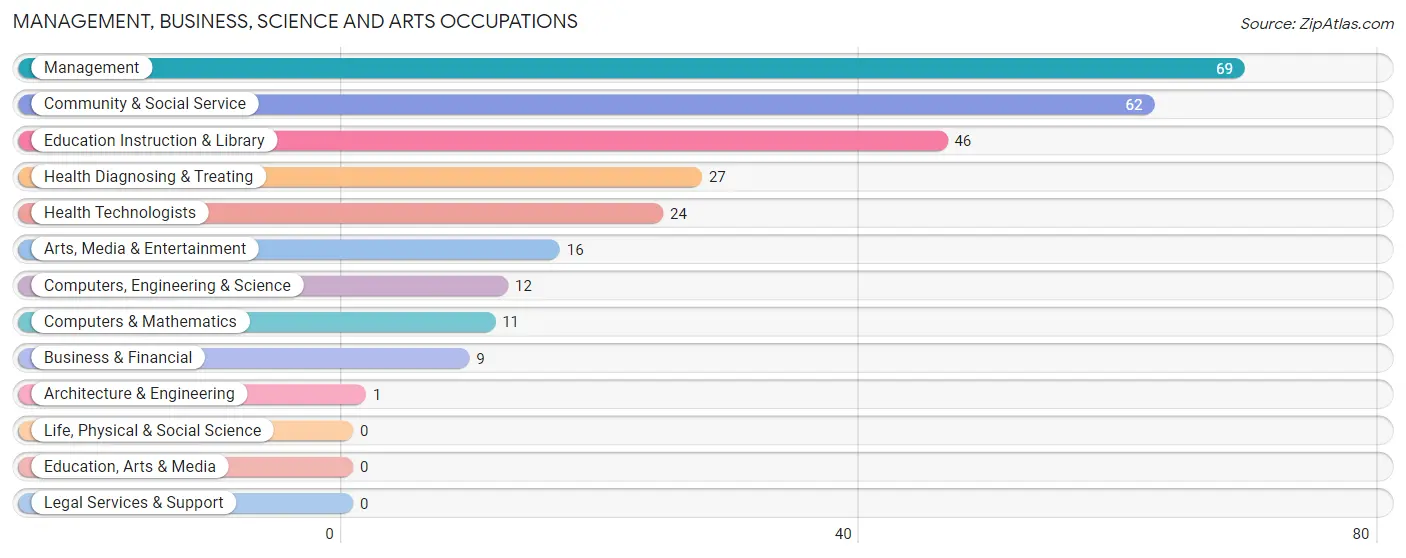
Management, Business, Science and Arts Occupations
The most common Management, Business, Science and Arts occupations in New Plymouth are Management (69 | 10.3%), Community & Social Service (62 | 9.3%), Education Instruction & Library (46 | 6.9%), Health Diagnosing & Treating (27 | 4.0%), and Health Technologists (24 | 3.6%).
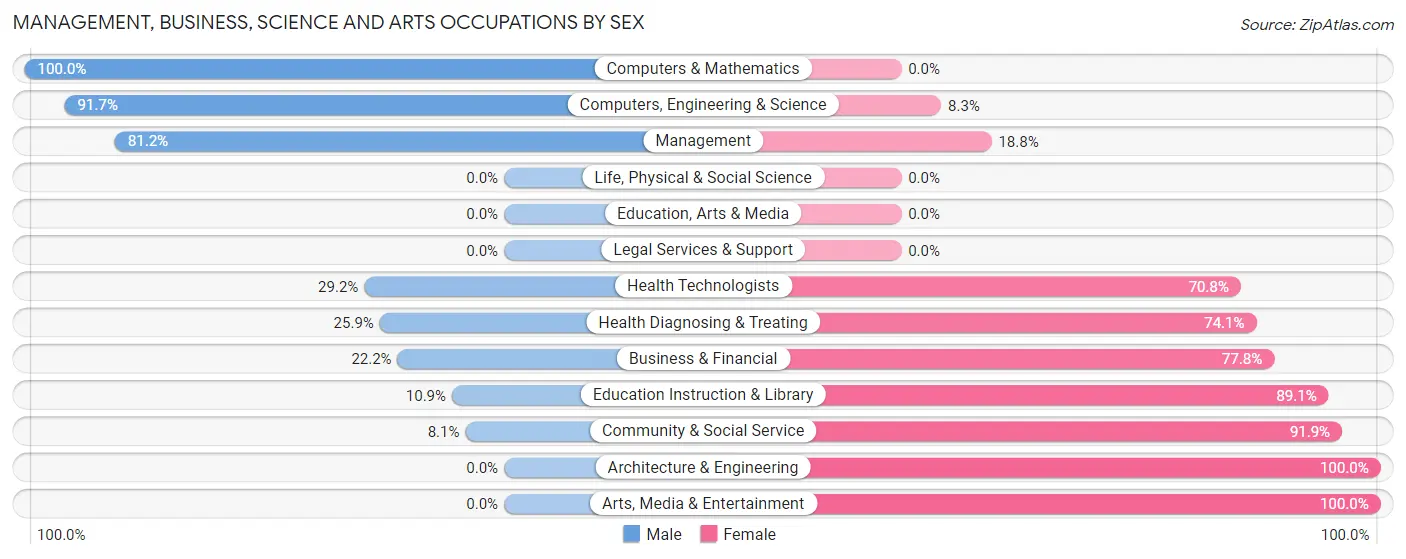
Management, Business, Science and Arts Occupations by Sex
Within the Management, Business, Science and Arts occupations in New Plymouth, the most male-oriented occupations are Computers & Mathematics (100.0%), Computers, Engineering & Science (91.7%), and Management (81.2%), while the most female-oriented occupations are Architecture & Engineering (100.0%), Arts, Media & Entertainment (100.0%), and Community & Social Service (91.9%).
| Occupation | Male | Female |
| Management | 56 (81.2%) | 13 (18.8%) |
| Business & Financial | 2 (22.2%) | 7 (77.8%) |
| Computers, Engineering & Science | 11 (91.7%) | 1 (8.3%) |
| Computers & Mathematics | 11 (100.0%) | 0 (0.0%) |
| Architecture & Engineering | 0 (0.0%) | 1 (100.0%) |
| Life, Physical & Social Science | 0 (0.0%) | 0 (0.0%) |
| Community & Social Service | 5 (8.1%) | 57 (91.9%) |
| Education, Arts & Media | 0 (0.0%) | 0 (0.0%) |
| Legal Services & Support | 0 (0.0%) | 0 (0.0%) |
| Education Instruction & Library | 5 (10.9%) | 41 (89.1%) |
| Arts, Media & Entertainment | 0 (0.0%) | 16 (100.0%) |
| Health Diagnosing & Treating | 7 (25.9%) | 20 (74.1%) |
| Health Technologists | 7 (29.2%) | 17 (70.8%) |
| Total (Category) | 81 (45.3%) | 98 (54.7%) |
| Total (Overall) | 315 (47.2%) | 353 (52.8%) |
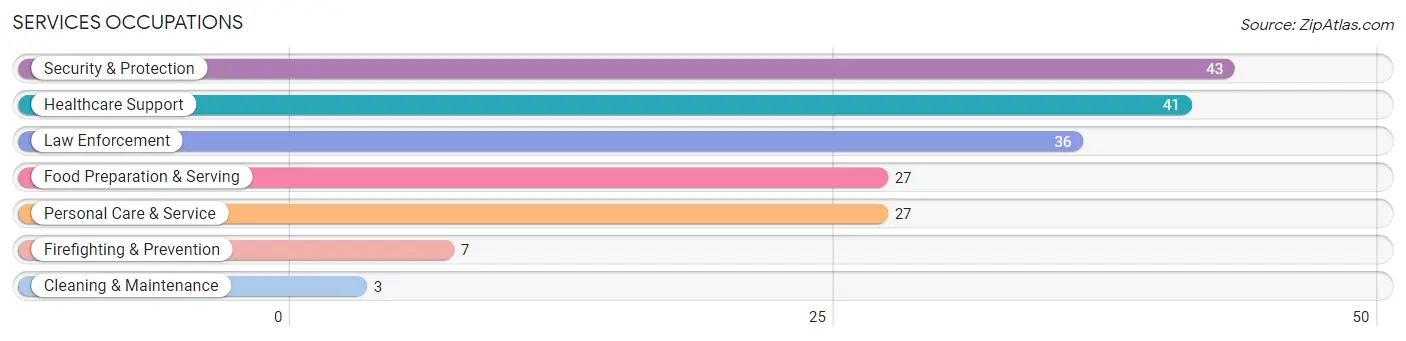
Services Occupations
The most common Services occupations in New Plymouth are Security & Protection (43 | 6.4%), Healthcare Support (41 | 6.1%), Law Enforcement (36 | 5.4%), Food Preparation & Serving (27 | 4.0%), and Personal Care & Service (27 | 4.0%).
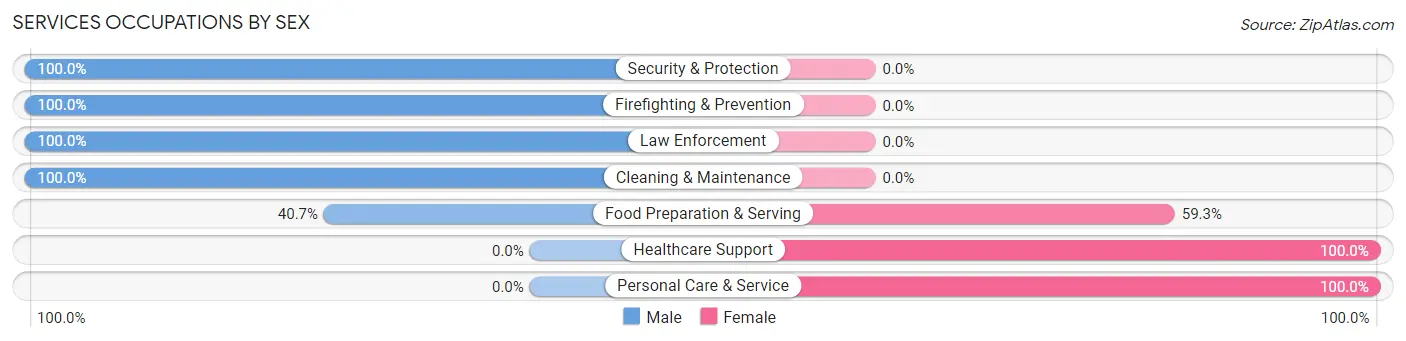
Services Occupations by Sex
Within the Services occupations in New Plymouth, the most male-oriented occupations are Security & Protection (100.0%), Firefighting & Prevention (100.0%), and Law Enforcement (100.0%), while the most female-oriented occupations are Healthcare Support (100.0%), Personal Care & Service (100.0%), and Food Preparation & Serving (59.3%).
| Occupation | Male | Female |
| Healthcare Support | 0 (0.0%) | 41 (100.0%) |
| Security & Protection | 43 (100.0%) | 0 (0.0%) |
| Firefighting & Prevention | 7 (100.0%) | 0 (0.0%) |
| Law Enforcement | 36 (100.0%) | 0 (0.0%) |
| Food Preparation & Serving | 11 (40.7%) | 16 (59.3%) |
| Cleaning & Maintenance | 3 (100.0%) | 0 (0.0%) |
| Personal Care & Service | 0 (0.0%) | 27 (100.0%) |
| Total (Category) | 57 (40.4%) | 84 (59.6%) |
| Total (Overall) | 315 (47.2%) | 353 (52.8%) |
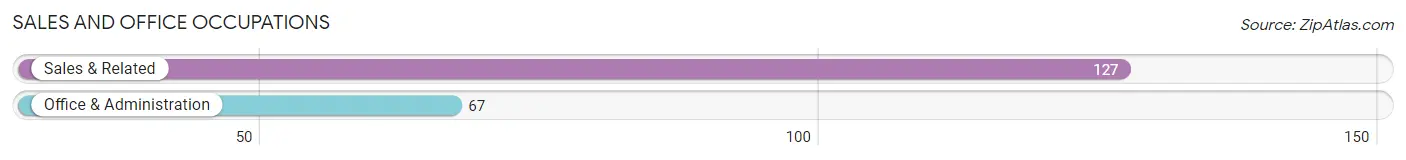
Sales and Office Occupations
The most common Sales and Office occupations in New Plymouth are Sales & Related (127 | 19.0%), and Office & Administration (67 | 10.0%).
Sales and Office Occupations by Sex
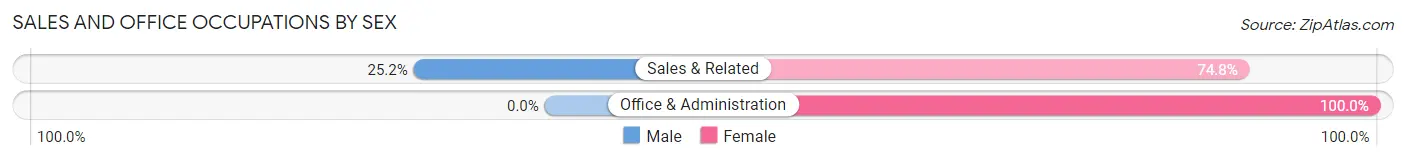
| Occupation | Male | Female |
| Sales & Related | 32 (25.2%) | 95 (74.8%) |
| Office & Administration | 0 (0.0%) | 67 (100.0%) |
| Total (Category) | 32 (16.5%) | 162 (83.5%) |
| Total (Overall) | 315 (47.2%) | 353 (52.8%) |
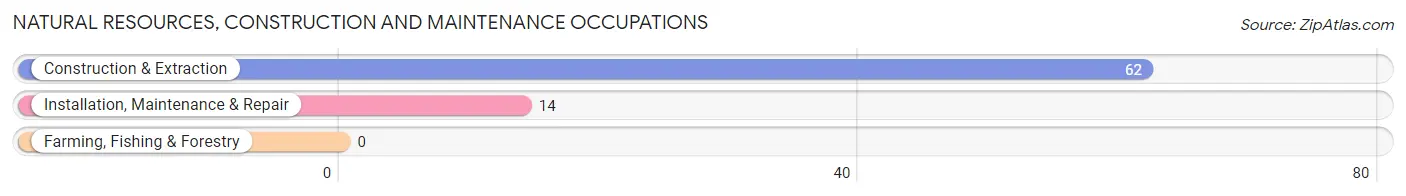
Natural Resources, Construction and Maintenance Occupations
The most common Natural Resources, Construction and Maintenance occupations in New Plymouth are Construction & Extraction (62 | 9.3%), and Installation, Maintenance & Repair (14 | 2.1%).
Natural Resources, Construction and Maintenance Occupations by Sex
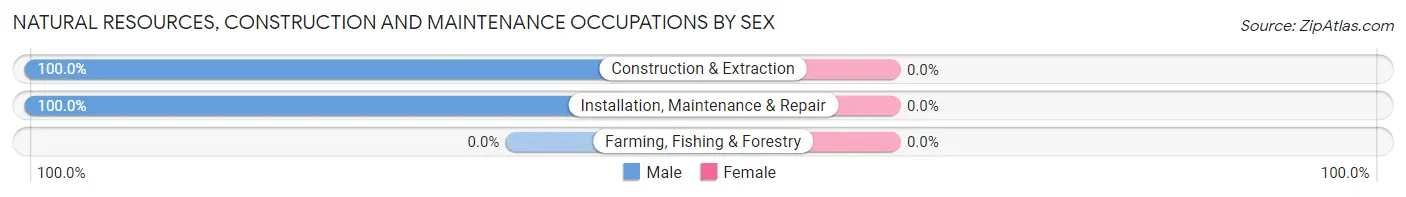
| Occupation | Male | Female |
| Farming, Fishing & Forestry | 0 (0.0%) | 0 (0.0%) |
| Construction & Extraction | 62 (100.0%) | 0 (0.0%) |
| Installation, Maintenance & Repair | 14 (100.0%) | 0 (0.0%) |
| Total (Category) | 76 (100.0%) | 0 (0.0%) |
| Total (Overall) | 315 (47.2%) | 353 (52.8%) |
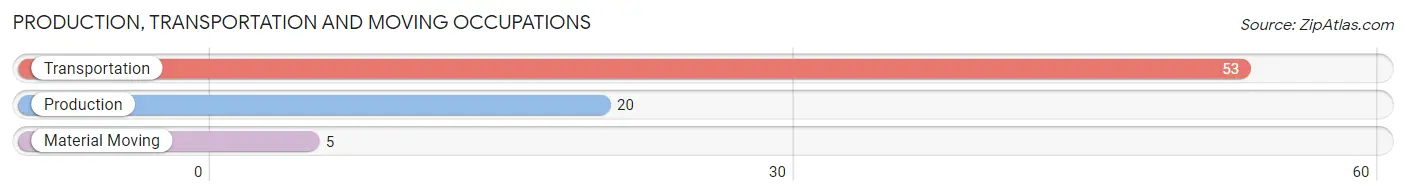
Production, Transportation and Moving Occupations
The most common Production, Transportation and Moving occupations in New Plymouth are Transportation (53 | 7.9%), Production (20 | 3.0%), and Material Moving (5 | 0.7%).
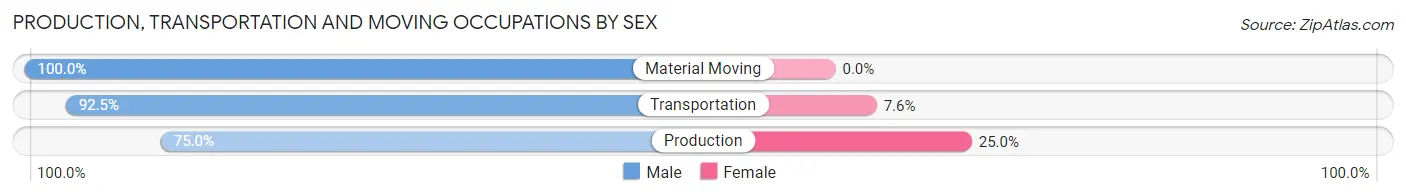
Production, Transportation and Moving Occupations by Sex
| Occupation | Male | Female |
| Production | 15 (75.0%) | 5 (25.0%) |
| Transportation | 49 (92.4%) | 4 (7.5%) |
| Material Moving | 5 (100.0%) | 0 (0.0%) |
| Total (Category) | 69 (88.5%) | 9 (11.5%) |
| Total (Overall) | 315 (47.2%) | 353 (52.8%) |
Employment Industries by Sex in New Plymouth
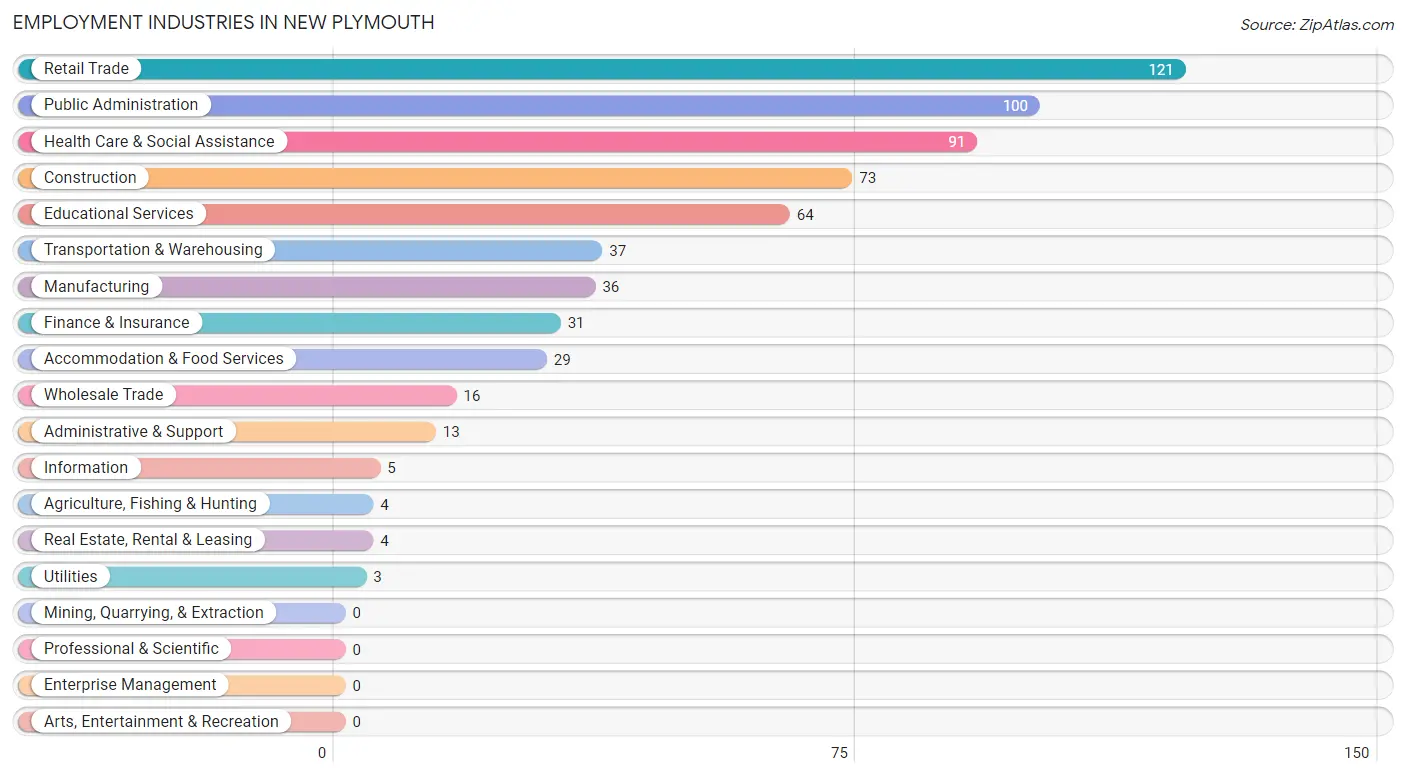
Employment Industries in New Plymouth
The major employment industries in New Plymouth include Retail Trade (121 | 18.1%), Public Administration (100 | 15.0%), Health Care & Social Assistance (91 | 13.6%), Construction (73 | 10.9%), and Educational Services (64 | 9.6%).
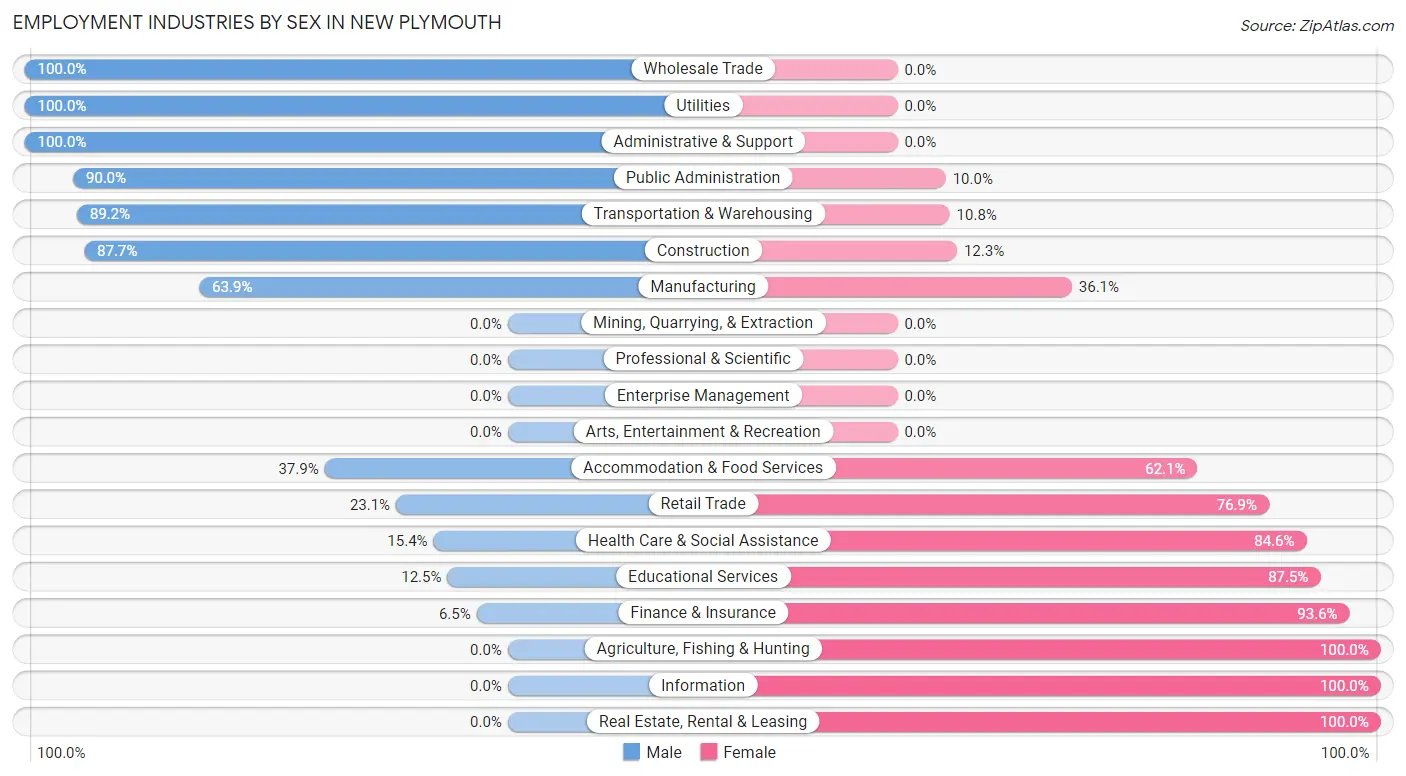
Employment Industries by Sex in New Plymouth
The New Plymouth industries that see more men than women are Wholesale Trade (100.0%), Utilities (100.0%), and Administrative & Support (100.0%), whereas the industries that tend to have a higher number of women are Agriculture, Fishing & Hunting (100.0%), Information (100.0%), and Real Estate, Rental & Leasing (100.0%).
| Industry | Male | Female |
| Agriculture, Fishing & Hunting | 0 (0.0%) | 4 (100.0%) |
| Mining, Quarrying, & Extraction | 0 (0.0%) | 0 (0.0%) |
| Construction | 64 (87.7%) | 9 (12.3%) |
| Manufacturing | 23 (63.9%) | 13 (36.1%) |
| Wholesale Trade | 16 (100.0%) | 0 (0.0%) |
| Retail Trade | 28 (23.1%) | 93 (76.9%) |
| Transportation & Warehousing | 33 (89.2%) | 4 (10.8%) |
| Utilities | 3 (100.0%) | 0 (0.0%) |
| Information | 0 (0.0%) | 5 (100.0%) |
| Finance & Insurance | 2 (6.5%) | 29 (93.5%) |
| Real Estate, Rental & Leasing | 0 (0.0%) | 4 (100.0%) |
| Professional & Scientific | 0 (0.0%) | 0 (0.0%) |
| Enterprise Management | 0 (0.0%) | 0 (0.0%) |
| Administrative & Support | 13 (100.0%) | 0 (0.0%) |
| Educational Services | 8 (12.5%) | 56 (87.5%) |
| Health Care & Social Assistance | 14 (15.4%) | 77 (84.6%) |
| Arts, Entertainment & Recreation | 0 (0.0%) | 0 (0.0%) |
| Accommodation & Food Services | 11 (37.9%) | 18 (62.1%) |
| Public Administration | 90 (90.0%) | 10 (10.0%) |
| Total | 315 (47.2%) | 353 (52.8%) |
Education in New Plymouth
School Enrollment in New Plymouth
The most common levels of schooling among the 514 students in New Plymouth are middle school (143 | 27.8%), elementary school (102 | 19.8%), and college / undergraduate (102 | 19.8%).
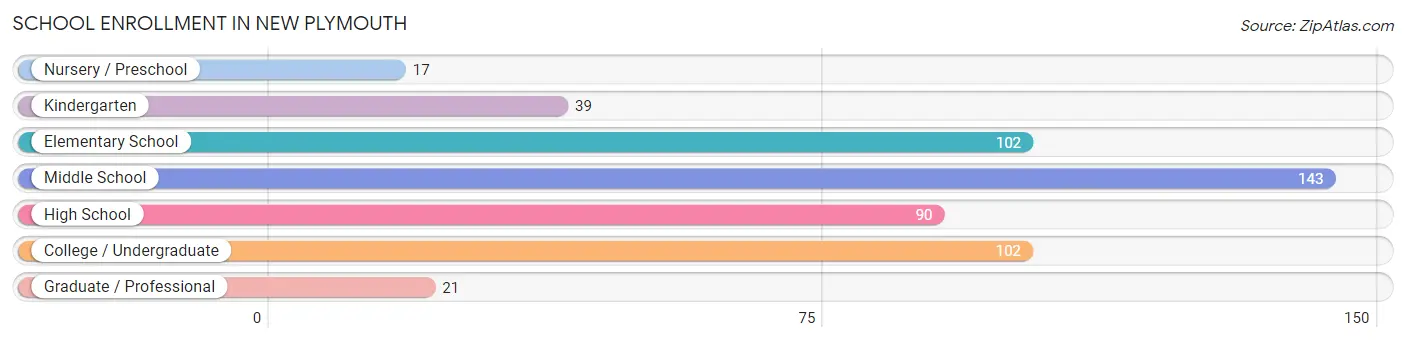
| School Level | # Students | % Students |
| Nursery / Preschool | 17 | 3.3% |
| Kindergarten | 39 | 7.6% |
| Elementary School | 102 | 19.8% |
| Middle School | 143 | 27.8% |
| High School | 90 | 17.5% |
| College / Undergraduate | 102 | 19.8% |
| Graduate / Professional | 21 | 4.1% |
| Total | 514 | 100.0% |
School Enrollment by Age by Funding Source in New Plymouth
Out of a total of 514 students who are enrolled in schools in New Plymouth, 88 (17.1%) attend a private institution, while the remaining 426 (82.9%) are enrolled in public schools. The age group of 3 to 4 year olds has the highest likelihood of being enrolled in private schools, with 9 (75.0% in the age bracket) enrolled. Conversely, the age group of 20 to 24 year olds has the lowest likelihood of being enrolled in a private school, with 31 (100.0% in the age bracket) attending a public institution.
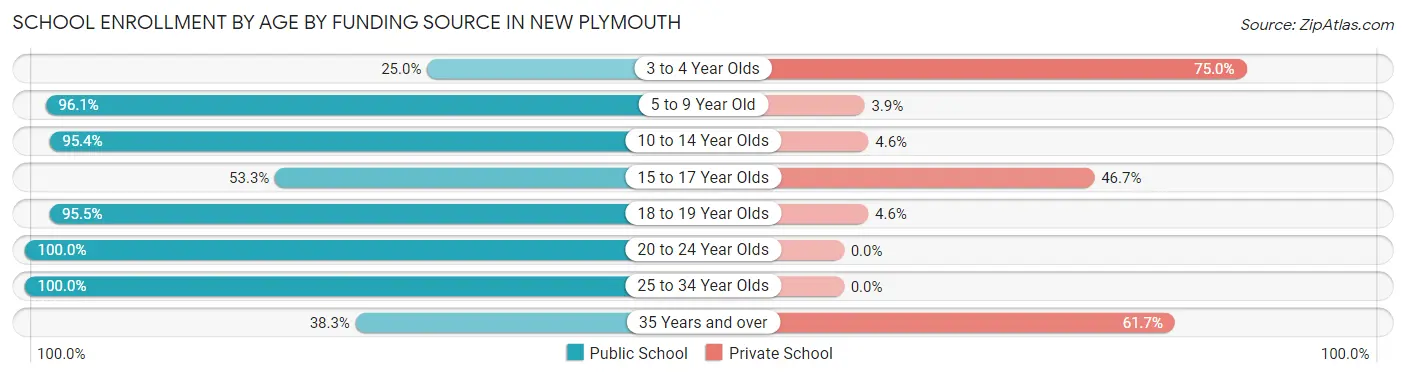
| Age Bracket | Public School | Private School |
| 3 to 4 Year Olds | 3 (25.0%) | 9 (75.0%) |
| 5 to 9 Year Old | 124 (96.1%) | 5 (3.9%) |
| 10 to 14 Year Olds | 166 (95.4%) | 8 (4.6%) |
| 15 to 17 Year Olds | 32 (53.3%) | 28 (46.7%) |
| 18 to 19 Year Olds | 21 (95.5%) | 1 (4.5%) |
| 20 to 24 Year Olds | 31 (100.0%) | 0 (0.0%) |
| 25 to 34 Year Olds | 26 (100.0%) | 0 (0.0%) |
| 35 Years and over | 23 (38.3%) | 37 (61.7%) |
| Total | 426 (82.9%) | 88 (17.1%) |
Educational Attainment by Field of Study in New Plymouth
Arts & humanities (99 | 30.0%), science & technology (82 | 24.8%), engineering (45 | 13.6%), education (43 | 13.0%), and social sciences (29 | 8.8%) are the most common fields of study among 330 individuals in New Plymouth who have obtained a bachelor's degree or higher.
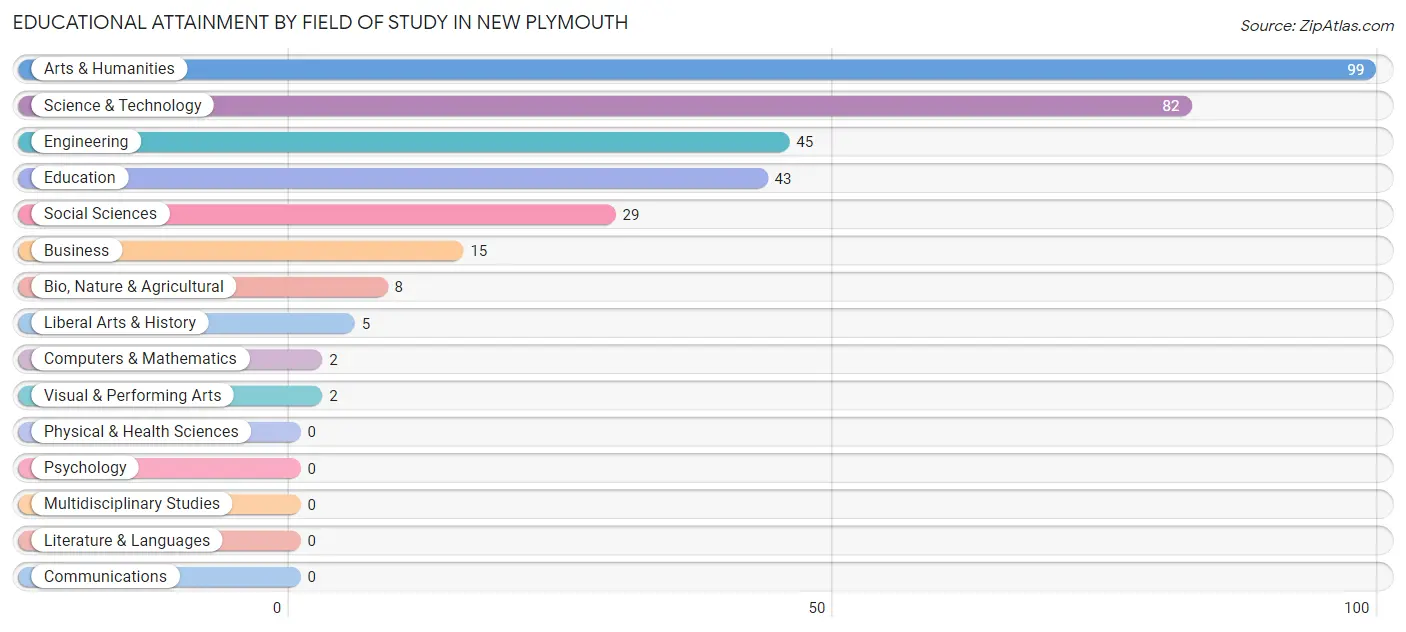
| Field of Study | # Graduates | % Graduates |
| Computers & Mathematics | 2 | 0.6% |
| Bio, Nature & Agricultural | 8 | 2.4% |
| Physical & Health Sciences | 0 | 0.0% |
| Psychology | 0 | 0.0% |
| Social Sciences | 29 | 8.8% |
| Engineering | 45 | 13.6% |
| Multidisciplinary Studies | 0 | 0.0% |
| Science & Technology | 82 | 24.8% |
| Business | 15 | 4.5% |
| Education | 43 | 13.0% |
| Literature & Languages | 0 | 0.0% |
| Liberal Arts & History | 5 | 1.5% |
| Visual & Performing Arts | 2 | 0.6% |
| Communications | 0 | 0.0% |
| Arts & Humanities | 99 | 30.0% |
| Total | 330 | 100.0% |
Transportation & Commute in New Plymouth
Vehicle Availability by Sex in New Plymouth
The most prevalent vehicle ownership categories in New Plymouth are males with 2 vehicles (126, accounting for 40.0%) and females with 2 vehicles (142, making up 35.7%).
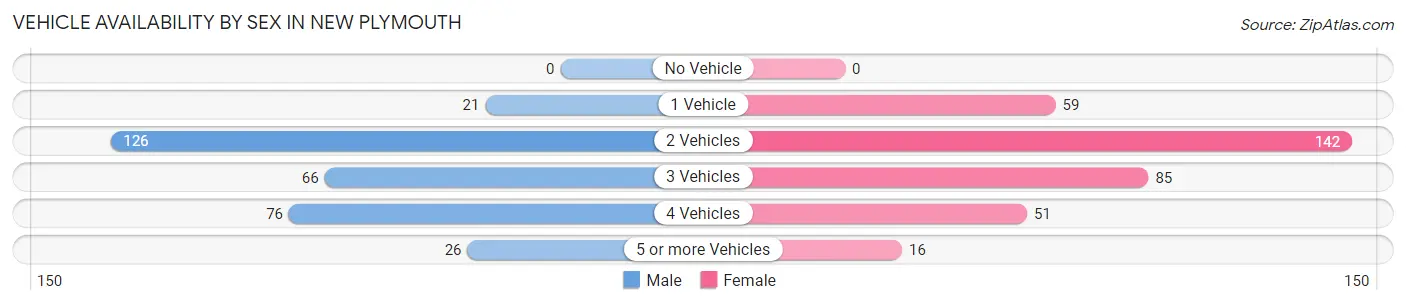
| Vehicles Available | Male | Female |
| No Vehicle | 0 (0.0%) | 0 (0.0%) |
| 1 Vehicle | 21 (6.7%) | 59 (16.7%) |
| 2 Vehicles | 126 (40.0%) | 142 (40.2%) |
| 3 Vehicles | 66 (20.9%) | 85 (24.1%) |
| 4 Vehicles | 76 (24.1%) | 51 (14.4%) |
| 5 or more Vehicles | 26 (8.3%) | 16 (4.5%) |
| Total | 315 (100.0%) | 353 (100.0%) |
Commute Time in New Plymouth
The most frequently occuring commute durations in New Plymouth are 20 to 24 minutes (204 commuters, 31.9%), 15 to 19 minutes (108 commuters, 16.9%), and 30 to 34 minutes (75 commuters, 11.7%).
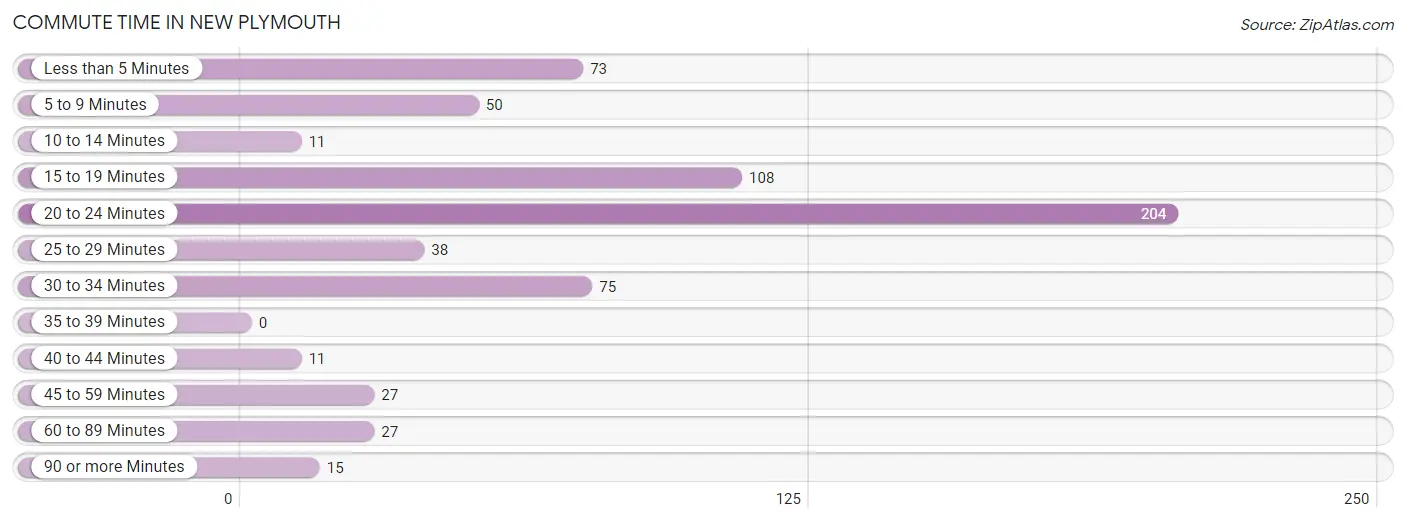
| Commute Time | # Commuters | % Commuters |
| Less than 5 Minutes | 73 | 11.4% |
| 5 to 9 Minutes | 50 | 7.8% |
| 10 to 14 Minutes | 11 | 1.7% |
| 15 to 19 Minutes | 108 | 16.9% |
| 20 to 24 Minutes | 204 | 31.9% |
| 25 to 29 Minutes | 38 | 5.9% |
| 30 to 34 Minutes | 75 | 11.7% |
| 35 to 39 Minutes | 0 | 0.0% |
| 40 to 44 Minutes | 11 | 1.7% |
| 45 to 59 Minutes | 27 | 4.2% |
| 60 to 89 Minutes | 27 | 4.2% |
| 90 or more Minutes | 15 | 2.4% |
Commute Time by Sex in New Plymouth
The most common commute times in New Plymouth are 20 to 24 minutes (103 commuters, 32.9%) for males and 20 to 24 minutes (101 commuters, 31.0%) for females.
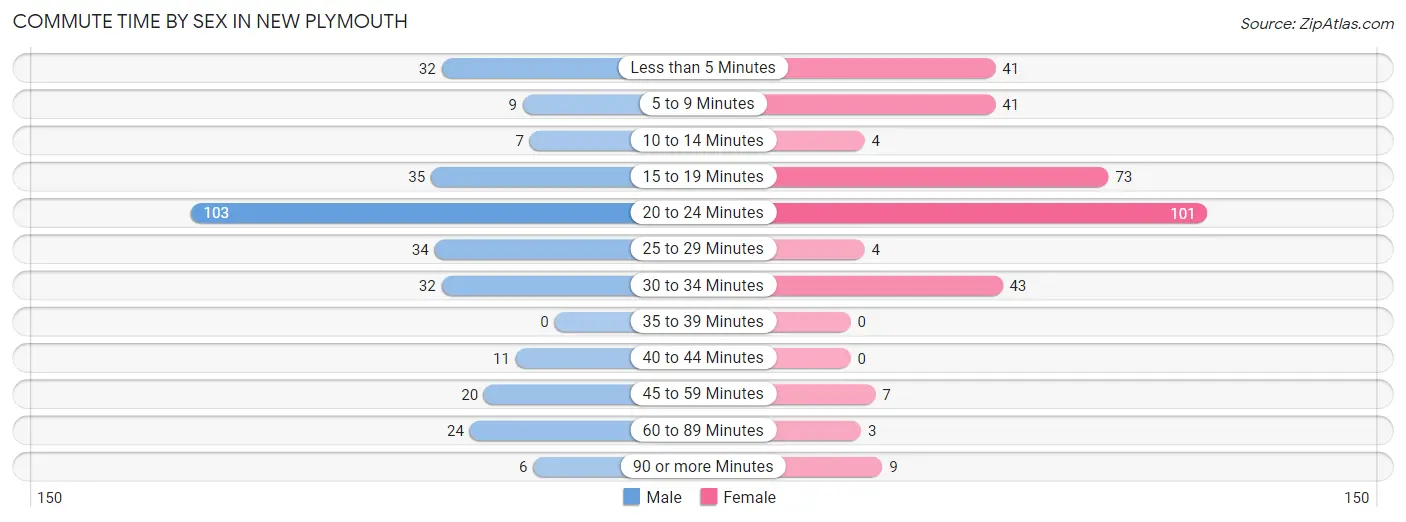
| Commute Time | Male | Female |
| Less than 5 Minutes | 32 (10.2%) | 41 (12.6%) |
| 5 to 9 Minutes | 9 (2.9%) | 41 (12.6%) |
| 10 to 14 Minutes | 7 (2.2%) | 4 (1.2%) |
| 15 to 19 Minutes | 35 (11.2%) | 73 (22.4%) |
| 20 to 24 Minutes | 103 (32.9%) | 101 (31.0%) |
| 25 to 29 Minutes | 34 (10.9%) | 4 (1.2%) |
| 30 to 34 Minutes | 32 (10.2%) | 43 (13.2%) |
| 35 to 39 Minutes | 0 (0.0%) | 0 (0.0%) |
| 40 to 44 Minutes | 11 (3.5%) | 0 (0.0%) |
| 45 to 59 Minutes | 20 (6.4%) | 7 (2.1%) |
| 60 to 89 Minutes | 24 (7.7%) | 3 (0.9%) |
| 90 or more Minutes | 6 (1.9%) | 9 (2.8%) |
Time of Departure to Work by Sex in New Plymouth
The most frequent times of departure to work in New Plymouth are 6:30 AM to 6:59 AM (104, 33.2%) for males and 7:30 AM to 7:59 AM (63, 19.3%) for females.
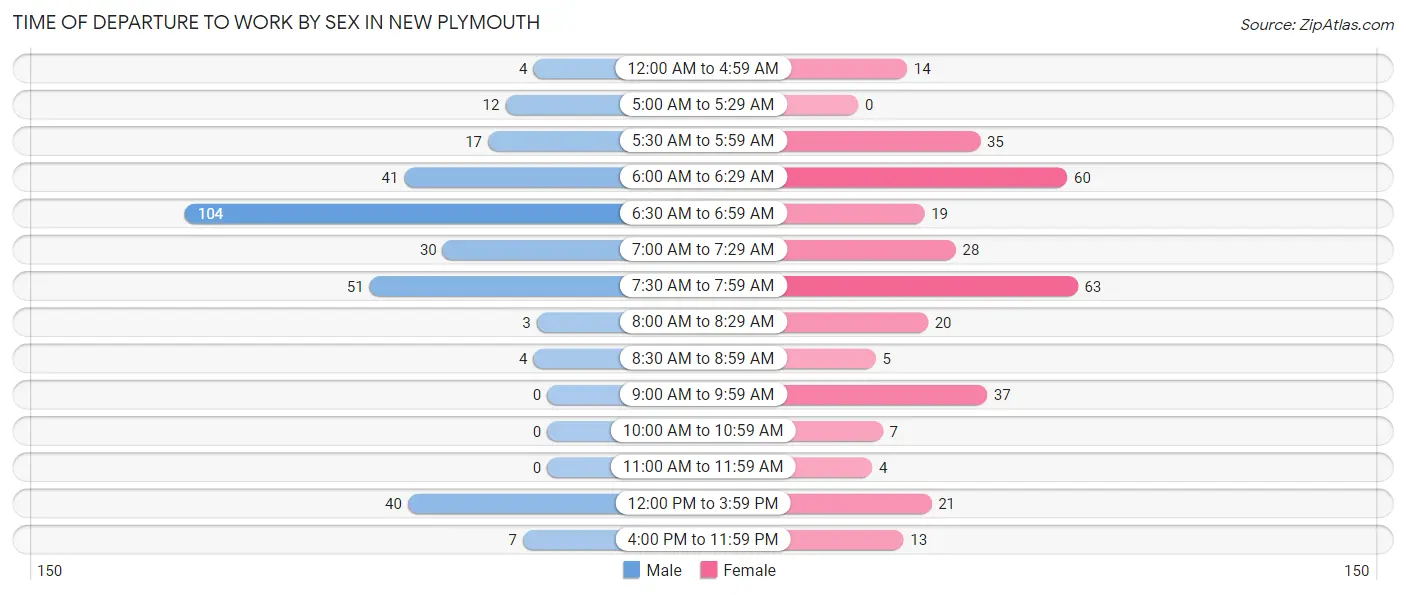
| Time of Departure | Male | Female |
| 12:00 AM to 4:59 AM | 4 (1.3%) | 14 (4.3%) |
| 5:00 AM to 5:29 AM | 12 (3.8%) | 0 (0.0%) |
| 5:30 AM to 5:59 AM | 17 (5.4%) | 35 (10.7%) |
| 6:00 AM to 6:29 AM | 41 (13.1%) | 60 (18.4%) |
| 6:30 AM to 6:59 AM | 104 (33.2%) | 19 (5.8%) |
| 7:00 AM to 7:29 AM | 30 (9.6%) | 28 (8.6%) |
| 7:30 AM to 7:59 AM | 51 (16.3%) | 63 (19.3%) |
| 8:00 AM to 8:29 AM | 3 (1.0%) | 20 (6.1%) |
| 8:30 AM to 8:59 AM | 4 (1.3%) | 5 (1.5%) |
| 9:00 AM to 9:59 AM | 0 (0.0%) | 37 (11.4%) |
| 10:00 AM to 10:59 AM | 0 (0.0%) | 7 (2.1%) |
| 11:00 AM to 11:59 AM | 0 (0.0%) | 4 (1.2%) |
| 12:00 PM to 3:59 PM | 40 (12.8%) | 21 (6.4%) |
| 4:00 PM to 11:59 PM | 7 (2.2%) | 13 (4.0%) |
| Total | 313 (100.0%) | 326 (100.0%) |
Housing Occupancy in New Plymouth
Occupancy by Ownership in New Plymouth
Of the total 689 dwellings in New Plymouth, owner-occupied units account for 441 (64.0%), while renter-occupied units make up 248 (36.0%).
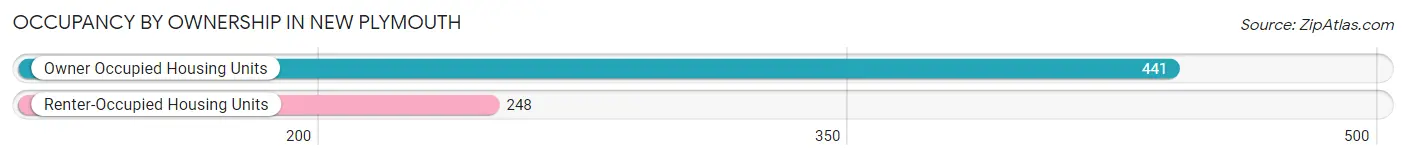
| Occupancy | # Housing Units | % Housing Units |
| Owner Occupied Housing Units | 441 | 64.0% |
| Renter-Occupied Housing Units | 248 | 36.0% |
| Total Occupied Housing Units | 689 | 100.0% |
Occupancy by Household Size in New Plymouth
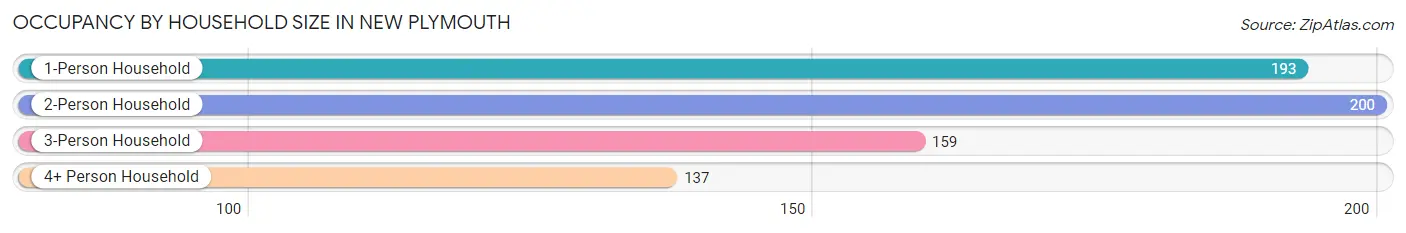
| Household Size | # Housing Units | % Housing Units |
| 1-Person Household | 193 | 28.0% |
| 2-Person Household | 200 | 29.0% |
| 3-Person Household | 159 | 23.1% |
| 4+ Person Household | 137 | 19.9% |
| Total Housing Units | 689 | 100.0% |
Occupancy by Ownership by Household Size in New Plymouth
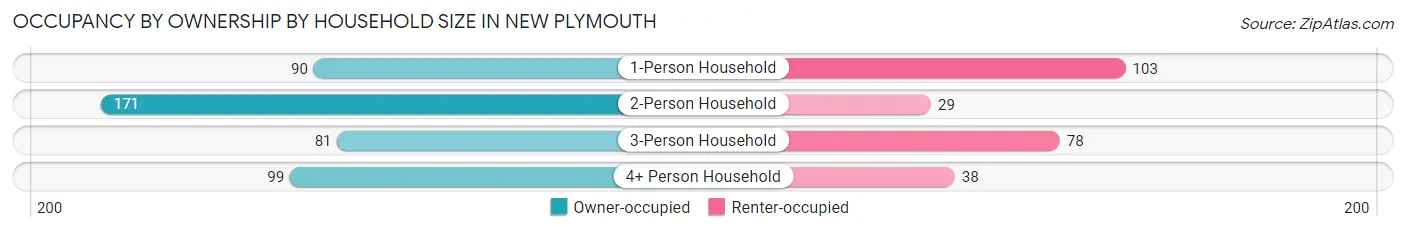
| Household Size | Owner-occupied | Renter-occupied |
| 1-Person Household | 90 (46.6%) | 103 (53.4%) |
| 2-Person Household | 171 (85.5%) | 29 (14.5%) |
| 3-Person Household | 81 (50.9%) | 78 (49.1%) |
| 4+ Person Household | 99 (72.3%) | 38 (27.7%) |
| Total Housing Units | 441 (64.0%) | 248 (36.0%) |
Occupancy by Educational Attainment in New Plymouth
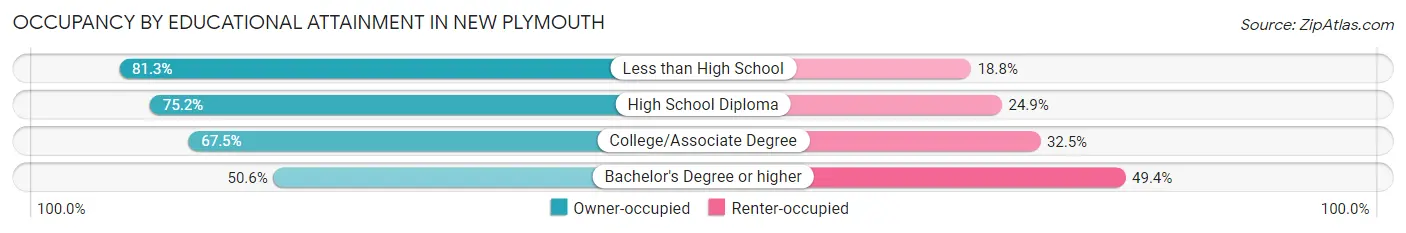
| Household Size | Owner-occupied | Renter-occupied |
| Less than High School | 13 (81.2%) | 3 (18.8%) |
| High School Diploma | 127 (75.1%) | 42 (24.8%) |
| College/Associate Degree | 183 (67.5%) | 88 (32.5%) |
| Bachelor's Degree or higher | 118 (50.6%) | 115 (49.4%) |
Occupancy by Age of Householder in New Plymouth
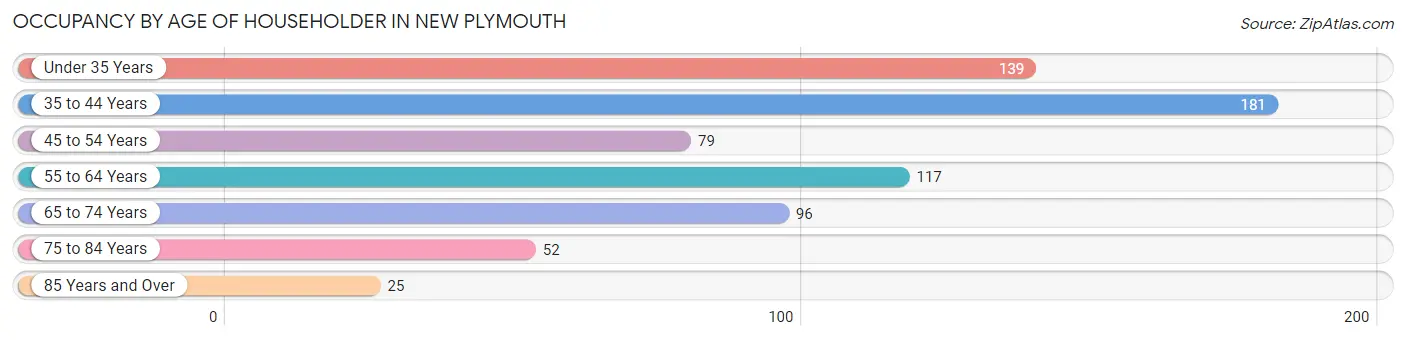
| Age Bracket | # Households | % Households |
| Under 35 Years | 139 | 20.2% |
| 35 to 44 Years | 181 | 26.3% |
| 45 to 54 Years | 79 | 11.5% |
| 55 to 64 Years | 117 | 17.0% |
| 65 to 74 Years | 96 | 13.9% |
| 75 to 84 Years | 52 | 7.5% |
| 85 Years and Over | 25 | 3.6% |
| Total | 689 | 100.0% |
Housing Finances in New Plymouth
Median Income by Occupancy in New Plymouth
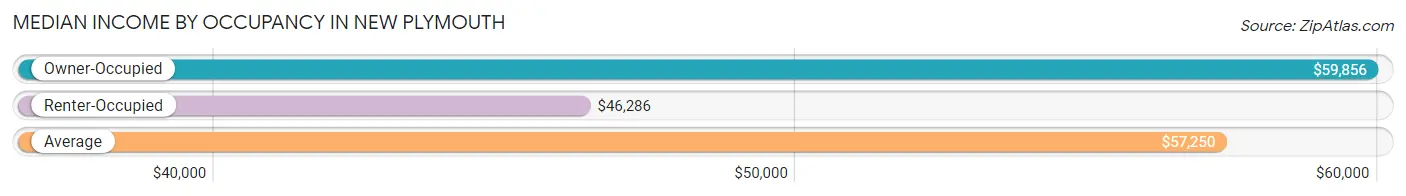
| Occupancy Type | # Households | Median Income |
| Owner-Occupied | 441 (64.0%) | $59,856 |
| Renter-Occupied | 248 (36.0%) | $46,286 |
| Average | 689 (100.0%) | $57,250 |
Occupancy by Householder Income Bracket in New Plymouth
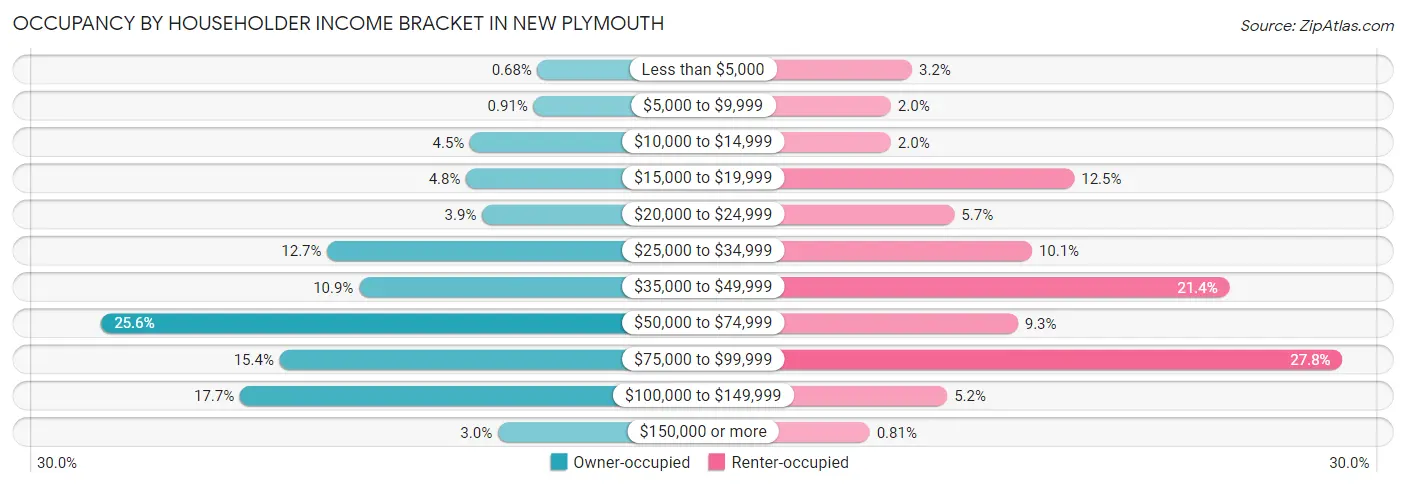
| Income Bracket | Owner-occupied | Renter-occupied |
| Less than $5,000 | 3 (0.7%) | 8 (3.2%) |
| $5,000 to $9,999 | 4 (0.9%) | 5 (2.0%) |
| $10,000 to $14,999 | 20 (4.5%) | 5 (2.0%) |
| $15,000 to $19,999 | 21 (4.8%) | 31 (12.5%) |
| $20,000 to $24,999 | 17 (3.8%) | 14 (5.7%) |
| $25,000 to $34,999 | 56 (12.7%) | 25 (10.1%) |
| $35,000 to $49,999 | 48 (10.9%) | 53 (21.4%) |
| $50,000 to $74,999 | 113 (25.6%) | 23 (9.3%) |
| $75,000 to $99,999 | 68 (15.4%) | 69 (27.8%) |
| $100,000 to $149,999 | 78 (17.7%) | 13 (5.2%) |
| $150,000 or more | 13 (2.9%) | 2 (0.8%) |
| Total | 441 (100.0%) | 248 (100.0%) |
Monthly Housing Cost Tiers in New Plymouth
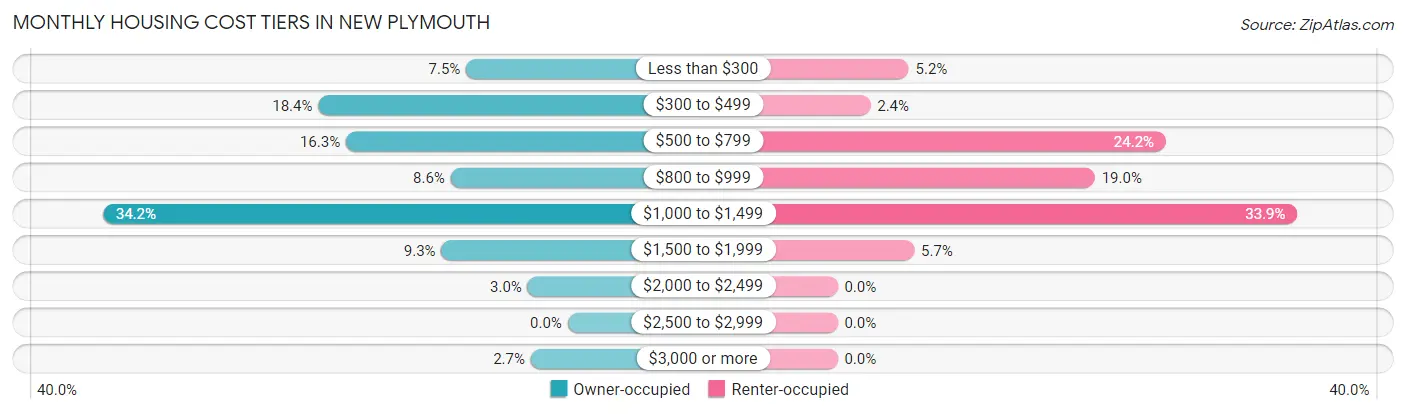
| Monthly Cost | Owner-occupied | Renter-occupied |
| Less than $300 | 33 (7.5%) | 13 (5.2%) |
| $300 to $499 | 81 (18.4%) | 6 (2.4%) |
| $500 to $799 | 72 (16.3%) | 60 (24.2%) |
| $800 to $999 | 38 (8.6%) | 47 (19.0%) |
| $1,000 to $1,499 | 151 (34.2%) | 84 (33.9%) |
| $1,500 to $1,999 | 41 (9.3%) | 14 (5.7%) |
| $2,000 to $2,499 | 13 (2.9%) | 0 (0.0%) |
| $2,500 to $2,999 | 0 (0.0%) | 0 (0.0%) |
| $3,000 or more | 12 (2.7%) | 0 (0.0%) |
| Total | 441 (100.0%) | 248 (100.0%) |
Physical Housing Characteristics in New Plymouth
Housing Structures in New Plymouth
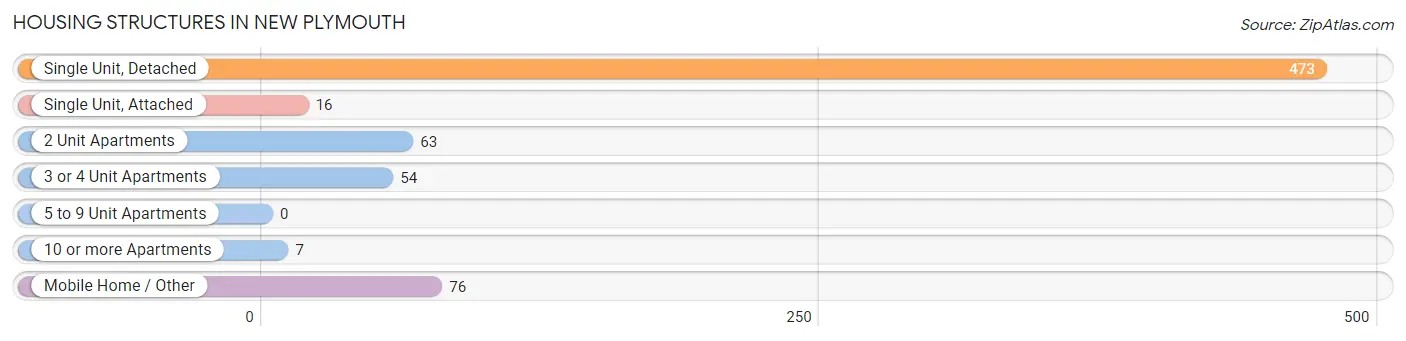
| Structure Type | # Housing Units | % Housing Units |
| Single Unit, Detached | 473 | 68.6% |
| Single Unit, Attached | 16 | 2.3% |
| 2 Unit Apartments | 63 | 9.1% |
| 3 or 4 Unit Apartments | 54 | 7.8% |
| 5 to 9 Unit Apartments | 0 | 0.0% |
| 10 or more Apartments | 7 | 1.0% |
| Mobile Home / Other | 76 | 11.0% |
| Total | 689 | 100.0% |
Housing Structures by Occupancy in New Plymouth
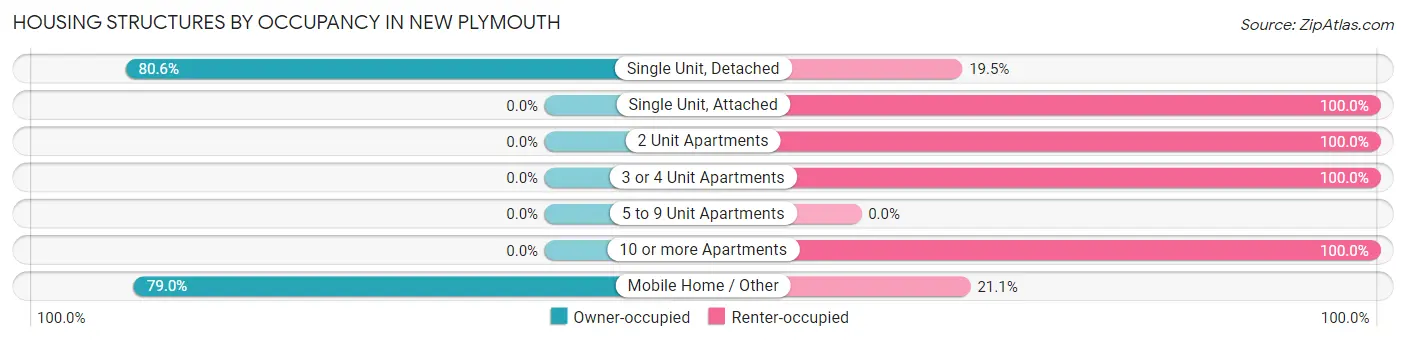
| Structure Type | Owner-occupied | Renter-occupied |
| Single Unit, Detached | 381 (80.5%) | 92 (19.5%) |
| Single Unit, Attached | 0 (0.0%) | 16 (100.0%) |
| 2 Unit Apartments | 0 (0.0%) | 63 (100.0%) |
| 3 or 4 Unit Apartments | 0 (0.0%) | 54 (100.0%) |
| 5 to 9 Unit Apartments | 0 (0.0%) | 0 (0.0%) |
| 10 or more Apartments | 0 (0.0%) | 7 (100.0%) |
| Mobile Home / Other | 60 (78.9%) | 16 (21.0%) |
| Total | 441 (64.0%) | 248 (36.0%) |
Housing Structures by Number of Rooms in New Plymouth
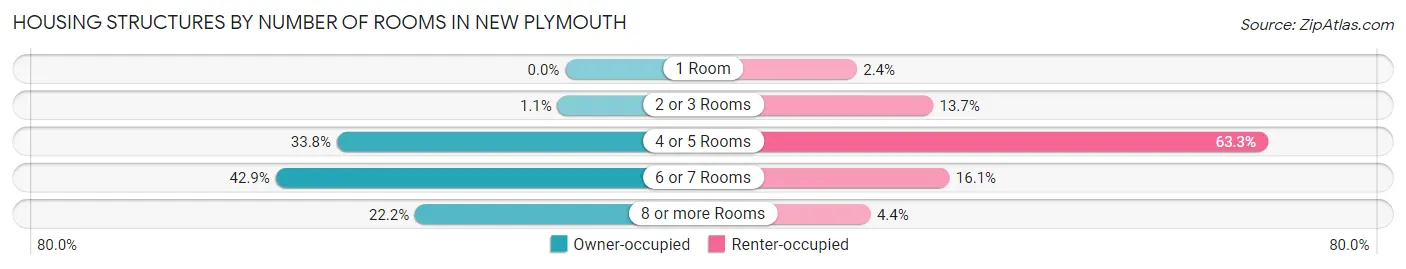
| Number of Rooms | Owner-occupied | Renter-occupied |
| 1 Room | 0 (0.0%) | 6 (2.4%) |
| 2 or 3 Rooms | 5 (1.1%) | 34 (13.7%) |
| 4 or 5 Rooms | 149 (33.8%) | 157 (63.3%) |
| 6 or 7 Rooms | 189 (42.9%) | 40 (16.1%) |
| 8 or more Rooms | 98 (22.2%) | 11 (4.4%) |
| Total | 441 (100.0%) | 248 (100.0%) |
Housing Structure by Heating Type in New Plymouth
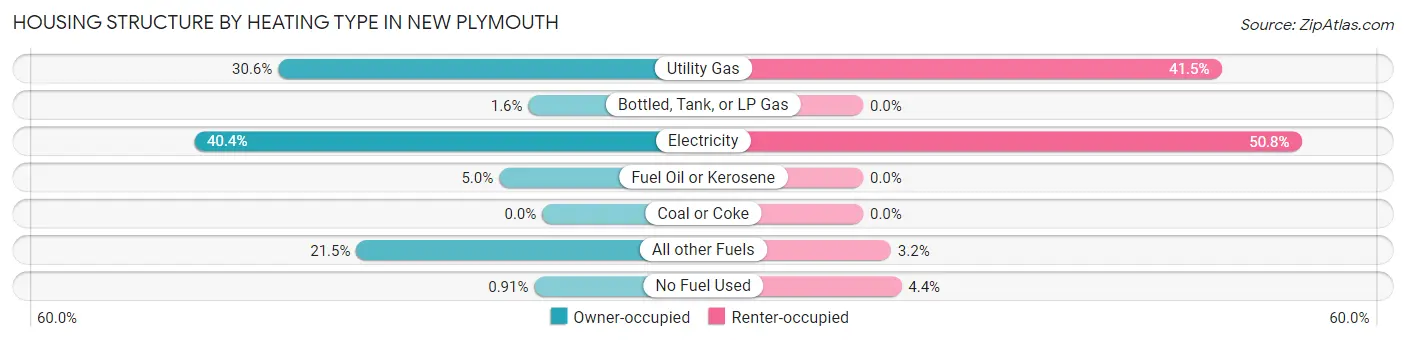
| Heating Type | Owner-occupied | Renter-occupied |
| Utility Gas | 135 (30.6%) | 103 (41.5%) |
| Bottled, Tank, or LP Gas | 7 (1.6%) | 0 (0.0%) |
| Electricity | 178 (40.4%) | 126 (50.8%) |
| Fuel Oil or Kerosene | 22 (5.0%) | 0 (0.0%) |
| Coal or Coke | 0 (0.0%) | 0 (0.0%) |
| All other Fuels | 95 (21.5%) | 8 (3.2%) |
| No Fuel Used | 4 (0.9%) | 11 (4.4%) |
| Total | 441 (100.0%) | 248 (100.0%) |
Household Vehicle Usage in New Plymouth
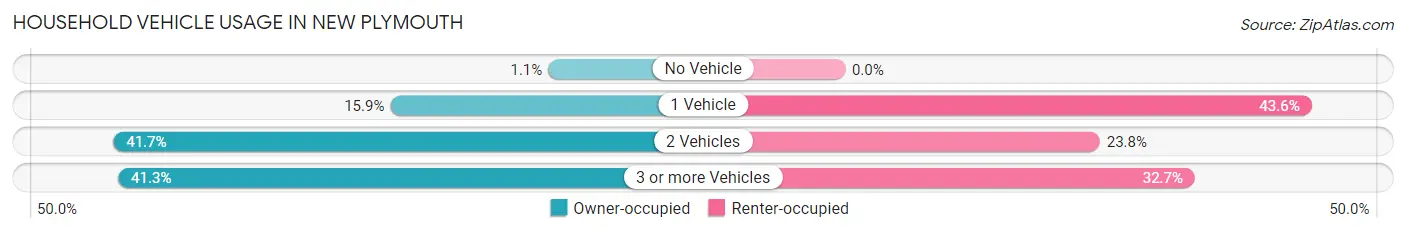
| Vehicles per Household | Owner-occupied | Renter-occupied |
| No Vehicle | 5 (1.1%) | 0 (0.0%) |
| 1 Vehicle | 70 (15.9%) | 108 (43.5%) |
| 2 Vehicles | 184 (41.7%) | 59 (23.8%) |
| 3 or more Vehicles | 182 (41.3%) | 81 (32.7%) |
| Total | 441 (100.0%) | 248 (100.0%) |
Real Estate & Mortgages in New Plymouth
Real Estate and Mortgage Overview in New Plymouth
| Characteristic | Without Mortgage | With Mortgage |
| Housing Units | 170 | 271 |
| Median Property Value | $147,500 | $192,100 |
| Median Household Income | $39,375 | $6 |
| Monthly Housing Costs | $382 | $0 |
| Real Estate Taxes | $1,175 | $0 |
Property Value by Mortgage Status in New Plymouth
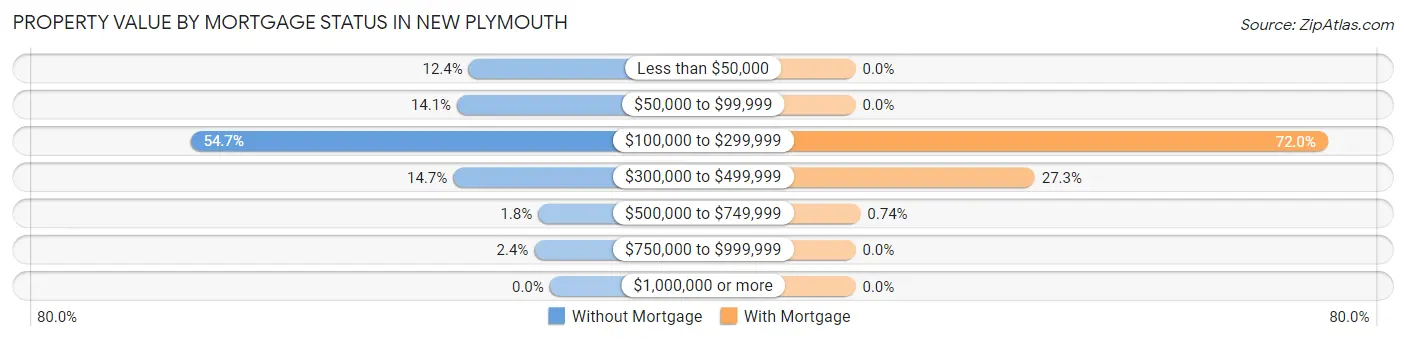
| Property Value | Without Mortgage | With Mortgage |
| Less than $50,000 | 21 (12.3%) | 0 (0.0%) |
| $50,000 to $99,999 | 24 (14.1%) | 0 (0.0%) |
| $100,000 to $299,999 | 93 (54.7%) | 195 (72.0%) |
| $300,000 to $499,999 | 25 (14.7%) | 74 (27.3%) |
| $500,000 to $749,999 | 3 (1.8%) | 2 (0.7%) |
| $750,000 to $999,999 | 4 (2.4%) | 0 (0.0%) |
| $1,000,000 or more | 0 (0.0%) | 0 (0.0%) |
| Total | 170 (100.0%) | 271 (100.0%) |
Household Income by Mortgage Status in New Plymouth
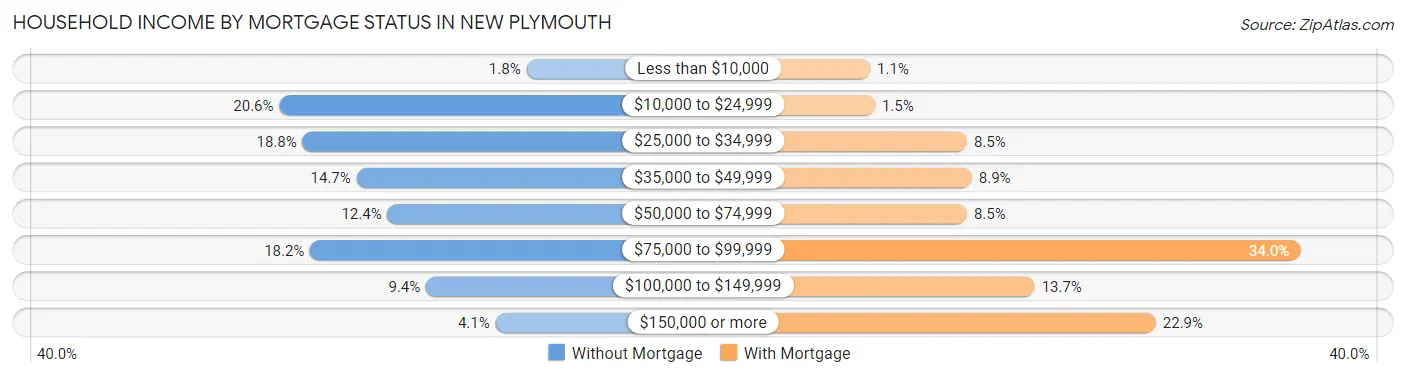
| Household Income | Without Mortgage | With Mortgage |
| Less than $10,000 | 3 (1.8%) | 3 (1.1%) |
| $10,000 to $24,999 | 35 (20.6%) | 4 (1.5%) |
| $25,000 to $34,999 | 32 (18.8%) | 23 (8.5%) |
| $35,000 to $49,999 | 25 (14.7%) | 24 (8.9%) |
| $50,000 to $74,999 | 21 (12.3%) | 23 (8.5%) |
| $75,000 to $99,999 | 31 (18.2%) | 92 (34.0%) |
| $100,000 to $149,999 | 16 (9.4%) | 37 (13.7%) |
| $150,000 or more | 7 (4.1%) | 62 (22.9%) |
| Total | 170 (100.0%) | 271 (100.0%) |
Property Value to Household Income Ratio in New Plymouth
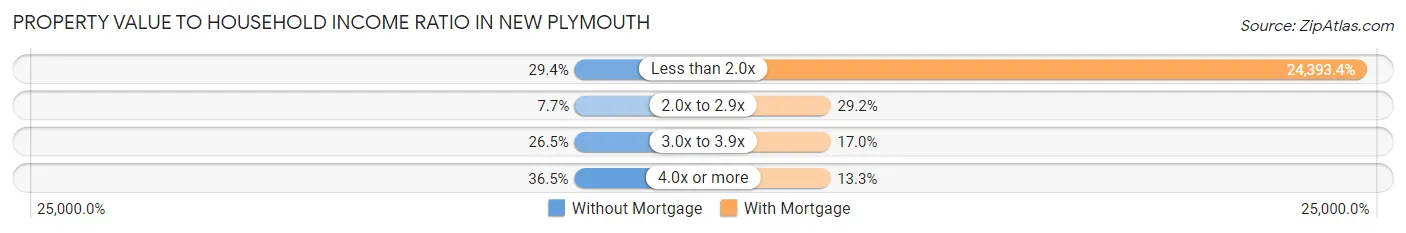
| Value-to-Income Ratio | Without Mortgage | With Mortgage |
| Less than 2.0x | 50 (29.4%) | 66,106 (24,393.4%) |
| 2.0x to 2.9x | 13 (7.6%) | 79 (29.1%) |
| 3.0x to 3.9x | 45 (26.5%) | 46 (17.0%) |
| 4.0x or more | 62 (36.5%) | 36 (13.3%) |
| Total | 170 (100.0%) | 271 (100.0%) |
Real Estate Taxes by Mortgage Status in New Plymouth
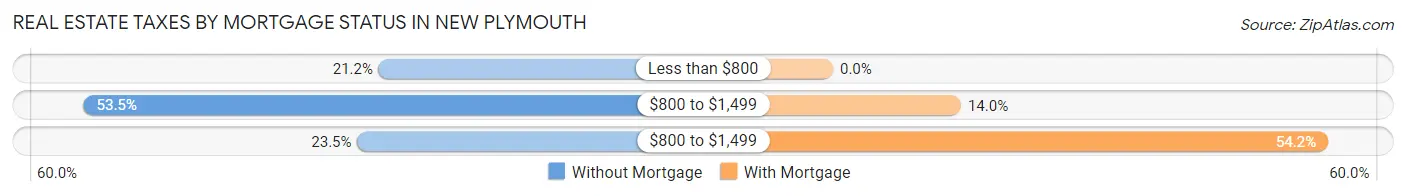
| Property Taxes | Without Mortgage | With Mortgage |
| Less than $800 | 36 (21.2%) | 0 (0.0%) |
| $800 to $1,499 | 91 (53.5%) | 38 (14.0%) |
| $800 to $1,499 | 40 (23.5%) | 147 (54.2%) |
| Total | 170 (100.0%) | 271 (100.0%) |
Health & Disability in New Plymouth
Health Insurance Coverage by Age in New Plymouth
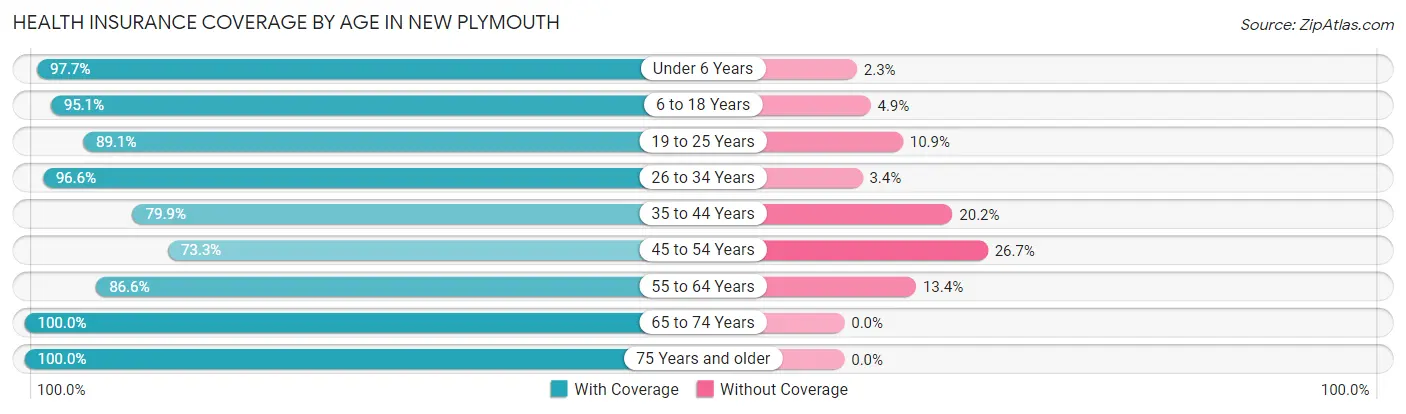
| Age Bracket | With Coverage | Without Coverage |
| Under 6 Years | 125 (97.7%) | 3 (2.3%) |
| 6 to 18 Years | 331 (95.1%) | 17 (4.9%) |
| 19 to 25 Years | 98 (89.1%) | 12 (10.9%) |
| 26 to 34 Years | 171 (96.6%) | 6 (3.4%) |
| 35 to 44 Years | 210 (79.8%) | 53 (20.2%) |
| 45 to 54 Years | 126 (73.3%) | 46 (26.7%) |
| 55 to 64 Years | 162 (86.6%) | 25 (13.4%) |
| 65 to 74 Years | 119 (100.0%) | 0 (0.0%) |
| 75 Years and older | 141 (100.0%) | 0 (0.0%) |
| Total | 1,483 (90.1%) | 162 (9.9%) |
Health Insurance Coverage by Citizenship Status in New Plymouth
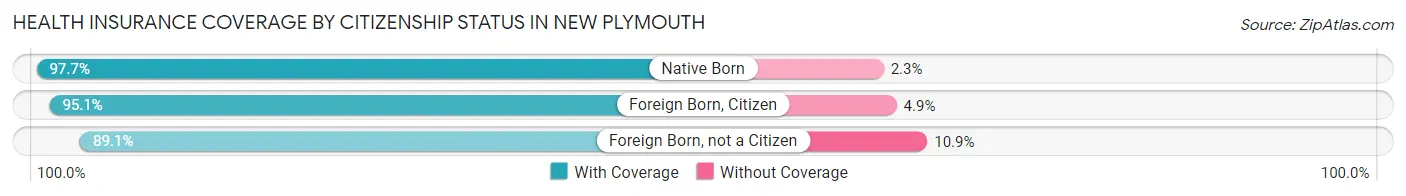
| Citizenship Status | With Coverage | Without Coverage |
| Native Born | 125 (97.7%) | 3 (2.3%) |
| Foreign Born, Citizen | 331 (95.1%) | 17 (4.9%) |
| Foreign Born, not a Citizen | 98 (89.1%) | 12 (10.9%) |
Health Insurance Coverage by Household Income in New Plymouth
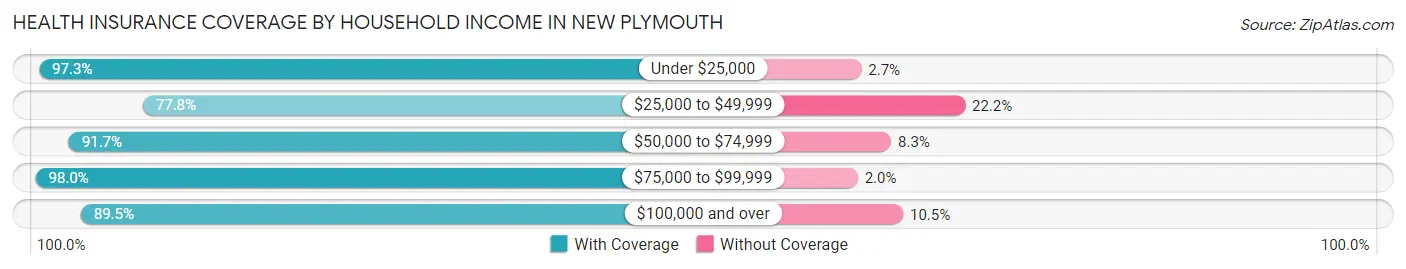
| Household Income | With Coverage | Without Coverage |
| Under $25,000 | 179 (97.3%) | 5 (2.7%) |
| $25,000 to $49,999 | 260 (77.8%) | 74 (22.2%) |
| $50,000 to $74,999 | 442 (91.7%) | 40 (8.3%) |
| $75,000 to $99,999 | 288 (98.0%) | 6 (2.0%) |
| $100,000 and over | 314 (89.5%) | 37 (10.5%) |
Public vs Private Health Insurance Coverage by Age in New Plymouth
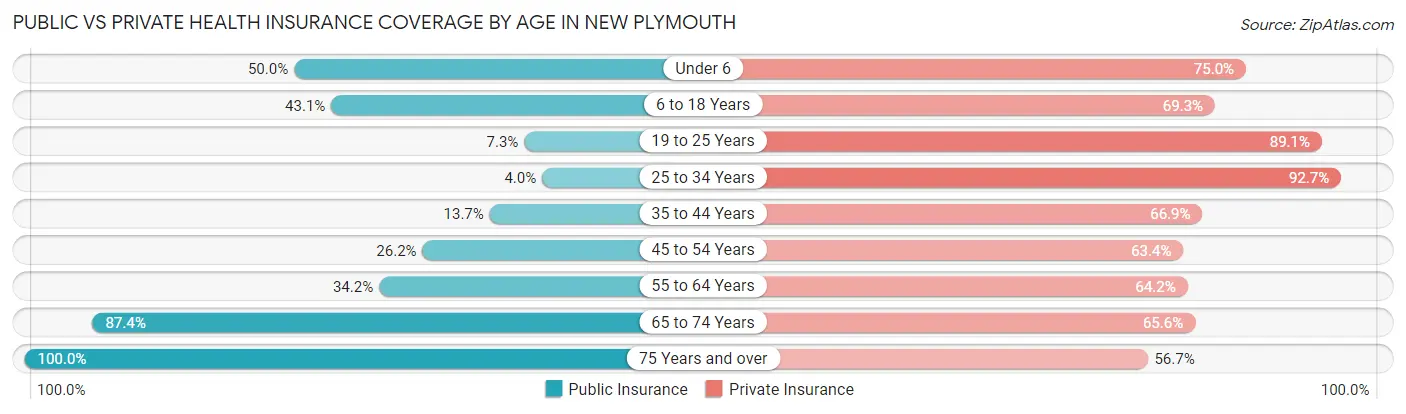
| Age Bracket | Public Insurance | Private Insurance |
| Under 6 | 64 (50.0%) | 96 (75.0%) |
| 6 to 18 Years | 150 (43.1%) | 241 (69.3%) |
| 19 to 25 Years | 8 (7.3%) | 98 (89.1%) |
| 25 to 34 Years | 7 (4.0%) | 164 (92.7%) |
| 35 to 44 Years | 36 (13.7%) | 176 (66.9%) |
| 45 to 54 Years | 45 (26.2%) | 109 (63.4%) |
| 55 to 64 Years | 64 (34.2%) | 120 (64.2%) |
| 65 to 74 Years | 104 (87.4%) | 78 (65.5%) |
| 75 Years and over | 141 (100.0%) | 80 (56.7%) |
| Total | 619 (37.6%) | 1,162 (70.6%) |
Disability Status by Sex by Age in New Plymouth
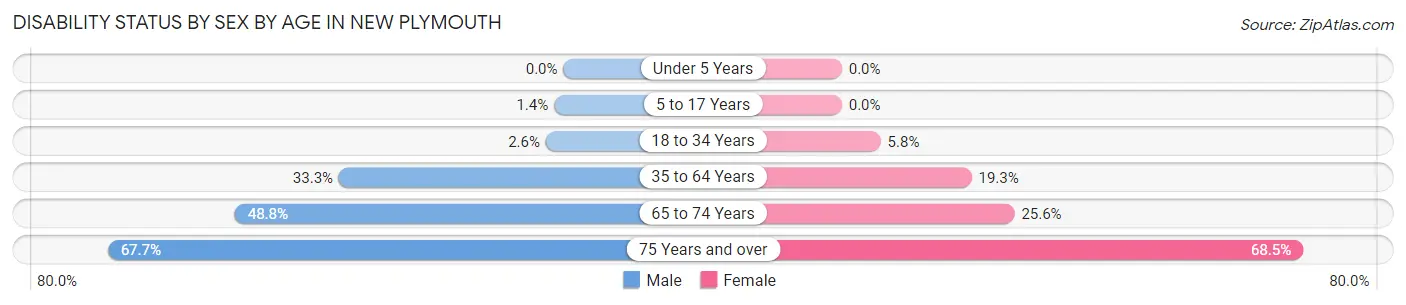
| Age Bracket | Male | Female |
| Under 5 Years | 0 (0.0%) | 0 (0.0%) |
| 5 to 17 Years | 3 (1.4%) | 0 (0.0%) |
| 18 to 34 Years | 4 (2.6%) | 9 (5.8%) |
| 35 to 64 Years | 88 (33.3%) | 69 (19.3%) |
| 65 to 74 Years | 20 (48.8%) | 20 (25.6%) |
| 75 Years and over | 46 (67.6%) | 50 (68.5%) |
Disability Class by Sex by Age in New Plymouth
Disability Class: Hearing Difficulty
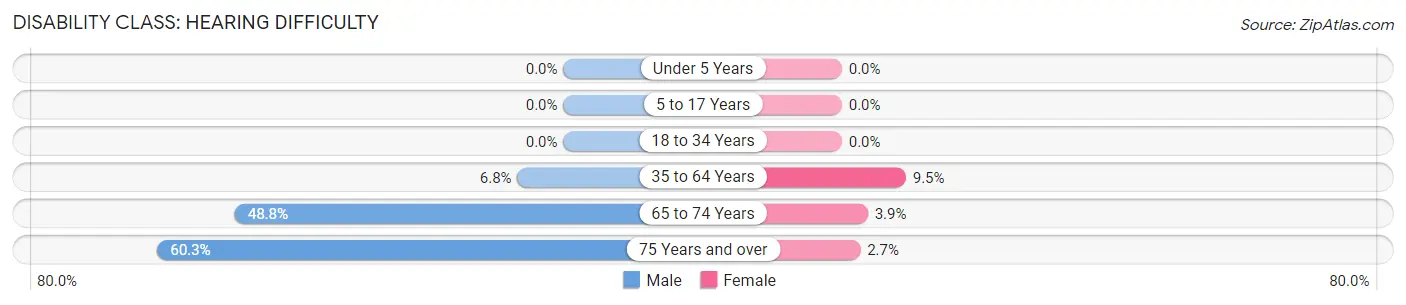
| Age Bracket | Male | Female |
| Under 5 Years | 0 (0.0%) | 0 (0.0%) |
| 5 to 17 Years | 0 (0.0%) | 0 (0.0%) |
| 18 to 34 Years | 0 (0.0%) | 0 (0.0%) |
| 35 to 64 Years | 18 (6.8%) | 34 (9.5%) |
| 65 to 74 Years | 20 (48.8%) | 3 (3.8%) |
| 75 Years and over | 41 (60.3%) | 2 (2.7%) |
Disability Class: Vision Difficulty
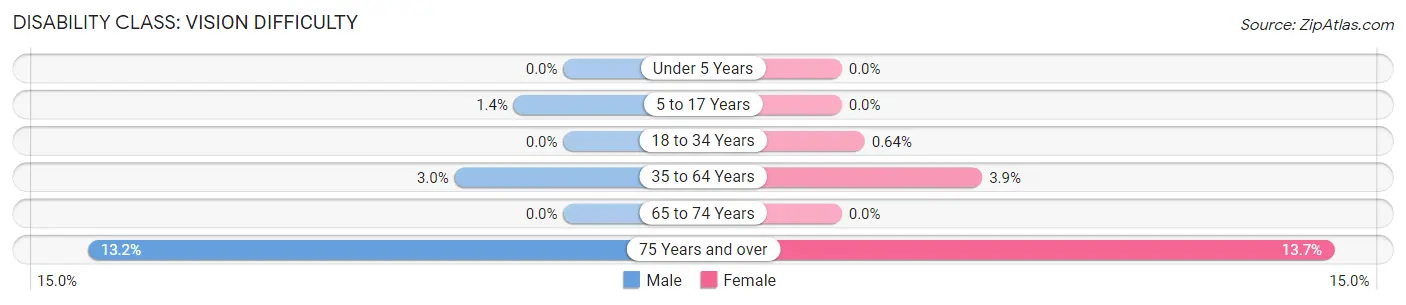
| Age Bracket | Male | Female |
| Under 5 Years | 0 (0.0%) | 0 (0.0%) |
| 5 to 17 Years | 3 (1.4%) | 0 (0.0%) |
| 18 to 34 Years | 0 (0.0%) | 1 (0.6%) |
| 35 to 64 Years | 8 (3.0%) | 14 (3.9%) |
| 65 to 74 Years | 0 (0.0%) | 0 (0.0%) |
| 75 Years and over | 9 (13.2%) | 10 (13.7%) |
Disability Class: Cognitive Difficulty
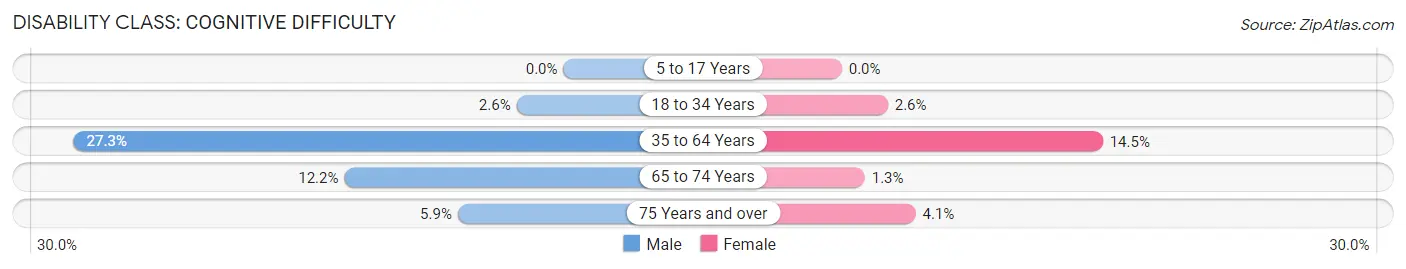
| Age Bracket | Male | Female |
| 5 to 17 Years | 0 (0.0%) | 0 (0.0%) |
| 18 to 34 Years | 4 (2.6%) | 4 (2.6%) |
| 35 to 64 Years | 72 (27.3%) | 52 (14.5%) |
| 65 to 74 Years | 5 (12.2%) | 1 (1.3%) |
| 75 Years and over | 4 (5.9%) | 3 (4.1%) |
Disability Class: Ambulatory Difficulty
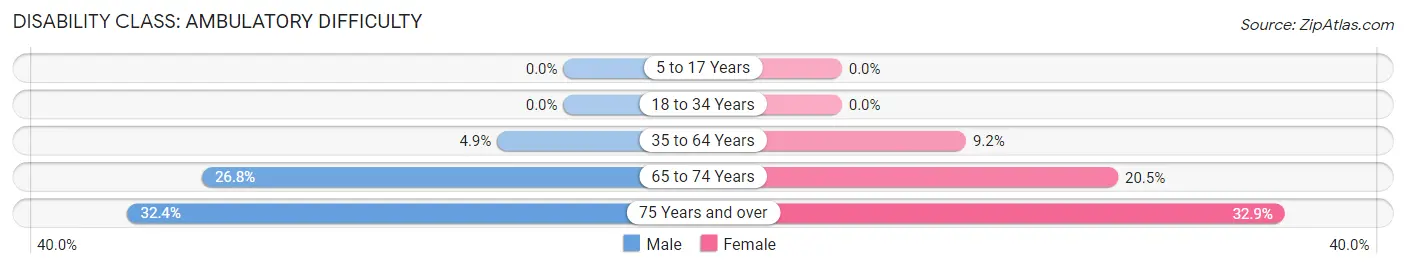
| Age Bracket | Male | Female |
| 5 to 17 Years | 0 (0.0%) | 0 (0.0%) |
| 18 to 34 Years | 0 (0.0%) | 0 (0.0%) |
| 35 to 64 Years | 13 (4.9%) | 33 (9.2%) |
| 65 to 74 Years | 11 (26.8%) | 16 (20.5%) |
| 75 Years and over | 22 (32.4%) | 24 (32.9%) |
Disability Class: Self-Care Difficulty
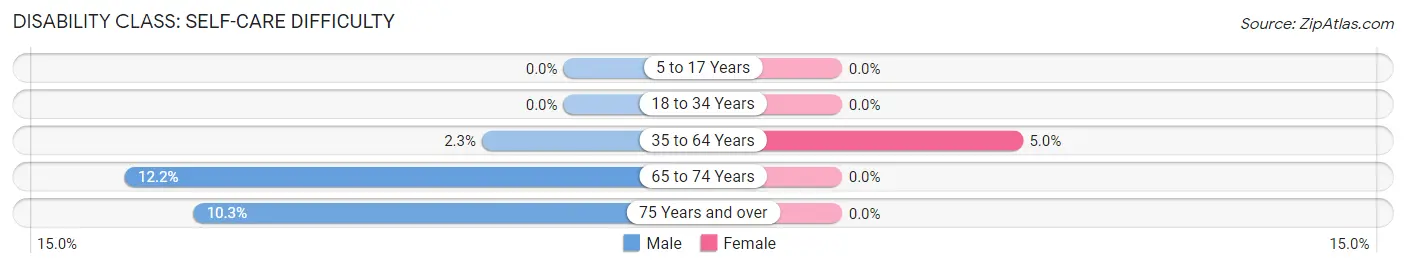
| Age Bracket | Male | Female |
| 5 to 17 Years | 0 (0.0%) | 0 (0.0%) |
| 18 to 34 Years | 0 (0.0%) | 0 (0.0%) |
| 35 to 64 Years | 6 (2.3%) | 18 (5.0%) |
| 65 to 74 Years | 5 (12.2%) | 0 (0.0%) |
| 75 Years and over | 7 (10.3%) | 0 (0.0%) |
Technology Access in New Plymouth
Computing Device Access in New Plymouth
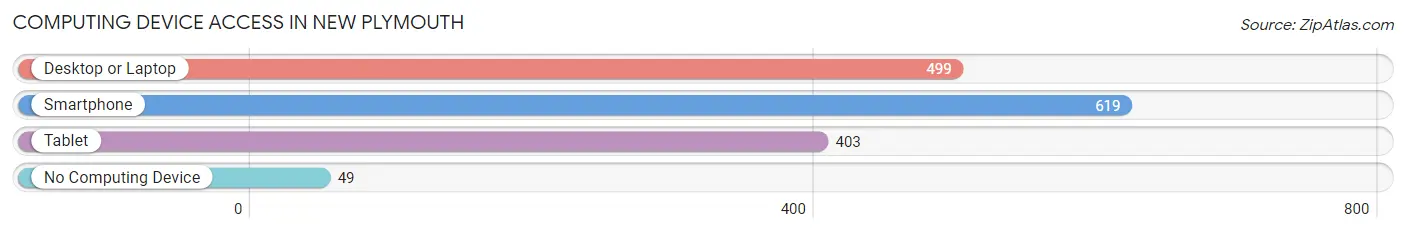
| Device Type | # Households | % Households |
| Desktop or Laptop | 499 | 72.4% |
| Smartphone | 619 | 89.8% |
| Tablet | 403 | 58.5% |
| No Computing Device | 49 | 7.1% |
| Total | 689 | 100.0% |
Internet Access in New Plymouth
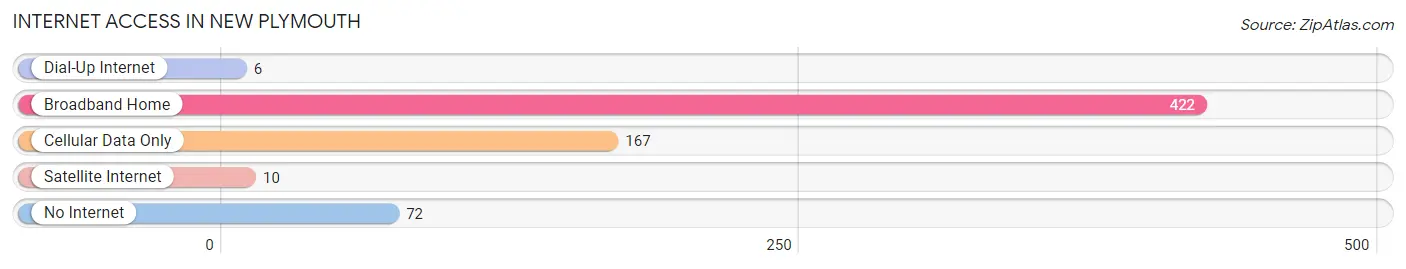
| Internet Type | # Households | % Households |
| Dial-Up Internet | 6 | 0.9% |
| Broadband Home | 422 | 61.3% |
| Cellular Data Only | 167 | 24.2% |
| Satellite Internet | 10 | 1.5% |
| No Internet | 72 | 10.4% |
| Total | 689 | 100.0% |
New Plymouth Summary
New Plymouth is a city located in the western part of Idaho, United States. It is the county seat of Payette County and is the largest city in the county. The city is located on the Payette River, which is a tributary of the Snake River. The population of New Plymouth was 2,945 at the 2010 census.
History
The area that is now New Plymouth was first settled in the late 1800s by settlers from the Midwest. The first settlers were mostly farmers and ranchers who were attracted to the area by the fertile soil and abundant water. The first post office was established in 1883 and the town was officially incorporated in 1891.
The city was named after Plymouth, Massachusetts, which was the original settlement of the Pilgrims in 1620. The city was originally known as "Plymouth City" but the name was changed to New Plymouth in 1891.
The city grew rapidly in the early 1900s due to the construction of the Oregon Short Line Railroad. The railroad connected the city to the rest of the state and allowed for the transportation of goods and services. The city also became a hub for the timber industry, which was a major source of employment for the area.
Geography
New Plymouth is located in the western part of Idaho, in Payette County. The city is situated on the Payette River, which is a tributary of the Snake River. The city is located at an elevation of 2,845 feet (867 m).
The city has a total area of 2.2 square miles (5.7 km2), all of which is land. The climate in New Plymouth is semi-arid, with hot summers and cold winters. The average annual precipitation is 11.2 inches (284 mm).
Economy
The economy of New Plymouth is largely based on agriculture and timber. The city is home to several large farms and ranches, as well as several timber mills. The city is also home to several manufacturing companies, including a furniture factory and a plastics factory.
The city is also home to several retail stores, restaurants, and other businesses. The city is served by the Payette County Airport, which provides air service to the area.
Demographics
As of the 2010 census, the population of New Plymouth was 2,945. The racial makeup of the city was 94.3% White, 0.3% African American, 0.7% Native American, 0.3% Asian, 0.1% Pacific Islander, 1.7% from other races, and 2.0% from two or more races. Hispanic or Latino of any race were 4.2% of the population.
The median income for a household in the city was $35,938, and the median income for a family was $41,250. The per capita income for the city was $17,845. About 11.2% of families and 14.2% of the population were below the poverty line, including 19.2% of those under age 18 and 8.3% of those age 65 or over.
New Plymouth is served by the Payette County School District, which includes two elementary schools, one middle school, and one high school. The city is also home to a branch of the College of Western Idaho.
Common Questions
What is Per Capita Income in New Plymouth?
Per Capita income in New Plymouth is $23,634.
What is the Median Family Income in New Plymouth?
Median Family Income in New Plymouth is $71,797.
What is the Median Household income in New Plymouth?
Median Household Income in New Plymouth is $57,250.
What is Income or Wage Gap in New Plymouth?
Income or Wage Gap in New Plymouth is 44.8%.
Women in New Plymouth earn 55.2 cents for every dollar earned by a man.
What is Inequality or Gini Index in New Plymouth?
Inequality or Gini Index in New Plymouth is 0.34.
What is the Total Population of New Plymouth?
Total Population of New Plymouth is 1,645.
What is the Total Male Population of New Plymouth?
Total Male Population of New Plymouth is 804.
What is the Total Female Population of New Plymouth?
Total Female Population of New Plymouth is 841.
What is the Ratio of Males per 100 Females in New Plymouth?
There are 95.60 Males per 100 Females in New Plymouth.
What is the Ratio of Females per 100 Males in New Plymouth?
There are 104.60 Females per 100 Males in New Plymouth.
What is the Median Population Age in New Plymouth?
Median Population Age in New Plymouth is 39.5 Years.
What is the Average Family Size in New Plymouth
Average Family Size in New Plymouth is 2.8 People.
What is the Average Household Size in New Plymouth
Average Household Size in New Plymouth is 2.4 People.
How Large is the Labor Force in New Plymouth?
There are 726 People in the Labor Forcein in New Plymouth.
What is the Percentage of People in the Labor Force in New Plymouth?
59.0% of People are in the Labor Force in New Plymouth.
What is the Unemployment Rate in New Plymouth?
Unemployment Rate in New Plymouth is 8.0%.