Georgetown, ID Map & Demographics
Georgetown Map
Georgetown Overview
$26,134
PER CAPITA INCOME
$79,167
AVG FAMILY INCOME
$70,417
AVG HOUSEHOLD INCOME
63.4%
WAGE / INCOME GAP [ % ]
36.6¢/ $1
WAGE / INCOME GAP [ $ ]
0.41
INEQUALITY / GINI INDEX
757
TOTAL POPULATION
347
MALE POPULATION
410
FEMALE POPULATION
84.63
MALES / 100 FEMALES
118.16
FEMALES / 100 MALES
29.0
MEDIAN AGE
4.2
AVG FAMILY SIZE
4.0
AVG HOUSEHOLD SIZE
363
LABOR FORCE [ PEOPLE ]
62.5%
PERCENT IN LABOR FORCE
5.5%
UNEMPLOYMENT RATE
Georgetown Zip Codes
Georgetown Area Codes
Income in Georgetown
Income Overview in Georgetown
Per Capita Income in Georgetown is $26,134, while median incomes of families and households are $79,167 and $70,417 respectively.
| Characteristic | Number | Measure |
| Per Capita Income | 757 | $26,134 |
| Median Family Income | 160 | $79,167 |
| Mean Family Income | 160 | $98,093 |
| Median Household Income | 187 | $70,417 |
| Mean Household Income | 187 | $90,106 |
| Income Deficit | 160 | $0 |
| Wage / Income Gap (%) | 757 | 63.41% |
| Wage / Income Gap ($) | 757 | 36.59¢ per $1 |
| Gini / Inequality Index | 757 | 0.41 |
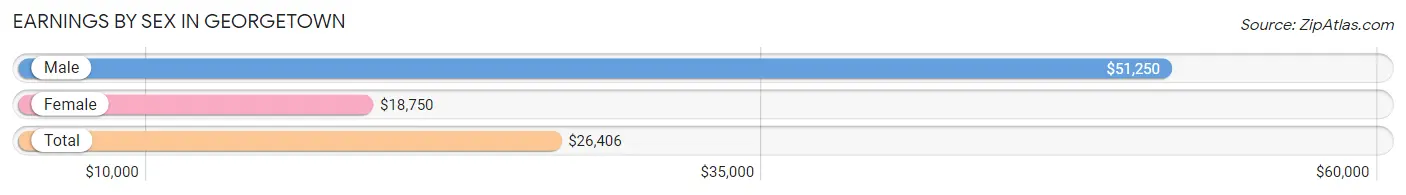
Earnings by Sex in Georgetown
Average Earnings in Georgetown are $26,406, $51,250 for men and $18,750 for women, a difference of 63.4%.
| Sex | Number | Average Earnings |
| Male | 210 (54.4%) | $51,250 |
| Female | 176 (45.6%) | $18,750 |
| Total | 386 (100.0%) | $26,406 |
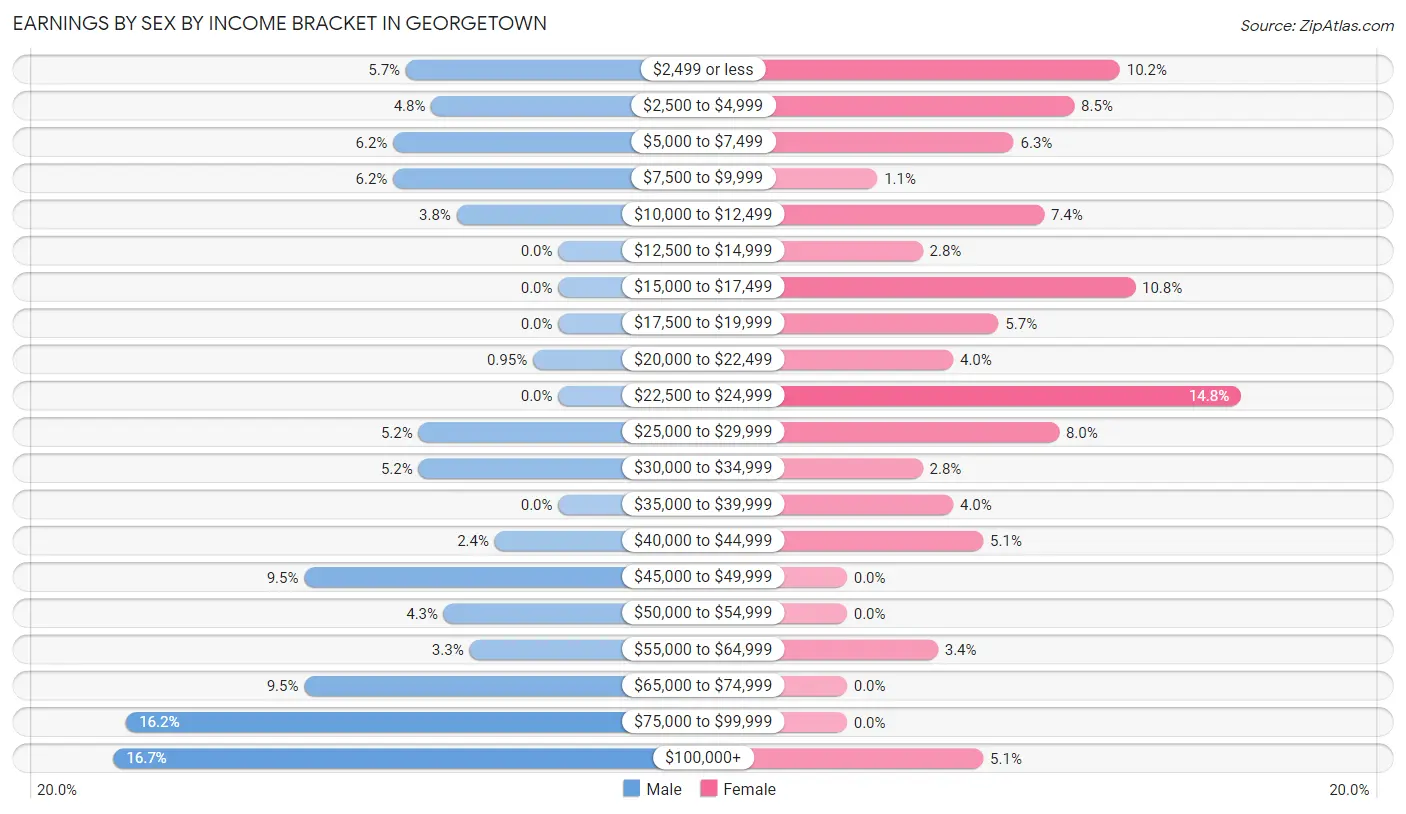
Earnings by Sex by Income Bracket in Georgetown
The most common earnings brackets in Georgetown are $100,000+ for men (35 | 16.7%) and $22,500 to $24,999 for women (26 | 14.8%).
| Income | Male | Female |
| $2,499 or less | 12 (5.7%) | 18 (10.2%) |
| $2,500 to $4,999 | 10 (4.8%) | 15 (8.5%) |
| $5,000 to $7,499 | 13 (6.2%) | 11 (6.2%) |
| $7,500 to $9,999 | 13 (6.2%) | 2 (1.1%) |
| $10,000 to $12,499 | 8 (3.8%) | 13 (7.4%) |
| $12,500 to $14,999 | 0 (0.0%) | 5 (2.8%) |
| $15,000 to $17,499 | 0 (0.0%) | 19 (10.8%) |
| $17,500 to $19,999 | 0 (0.0%) | 10 (5.7%) |
| $20,000 to $22,499 | 2 (0.9%) | 7 (4.0%) |
| $22,500 to $24,999 | 0 (0.0%) | 26 (14.8%) |
| $25,000 to $29,999 | 11 (5.2%) | 14 (8.0%) |
| $30,000 to $34,999 | 11 (5.2%) | 5 (2.8%) |
| $35,000 to $39,999 | 0 (0.0%) | 7 (4.0%) |
| $40,000 to $44,999 | 5 (2.4%) | 9 (5.1%) |
| $45,000 to $49,999 | 20 (9.5%) | 0 (0.0%) |
| $50,000 to $54,999 | 9 (4.3%) | 0 (0.0%) |
| $55,000 to $64,999 | 7 (3.3%) | 6 (3.4%) |
| $65,000 to $74,999 | 20 (9.5%) | 0 (0.0%) |
| $75,000 to $99,999 | 34 (16.2%) | 0 (0.0%) |
| $100,000+ | 35 (16.7%) | 9 (5.1%) |
| Total | 210 (100.0%) | 176 (100.0%) |
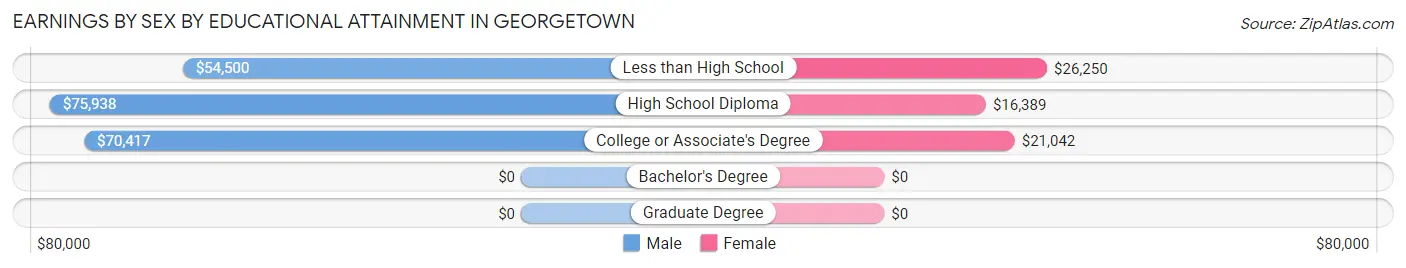
Earnings by Sex by Educational Attainment in Georgetown
Average earnings in Georgetown are $70,625 for men and $20,536 for women, a difference of 70.9%. Men with an educational attainment of high school diploma enjoy the highest average annual earnings of $75,938, while those with less than high school education earn the least with $54,500. Women with an educational attainment of less than high school earn the most with the average annual earnings of $26,250, while those with high school diploma education have the smallest earnings of $16,389.
| Educational Attainment | Male Income | Female Income |
| Less than High School | $54,500 | $26,250 |
| High School Diploma | $75,938 | $16,389 |
| College or Associate's Degree | $70,417 | $21,042 |
| Bachelor's Degree | - | - |
| Graduate Degree | - | - |
| Total | $70,625 | $20,536 |
Family Income in Georgetown
Family Income Brackets in Georgetown
According to the Georgetown family income data, there are 39 families falling into the $150,000 to $199,999 income range, which is the most common income bracket and makes up 24.4% of all families. Conversely, the less than $10,000 income bracket is the least frequent group with only 4 families (2.5%) belonging to this category.
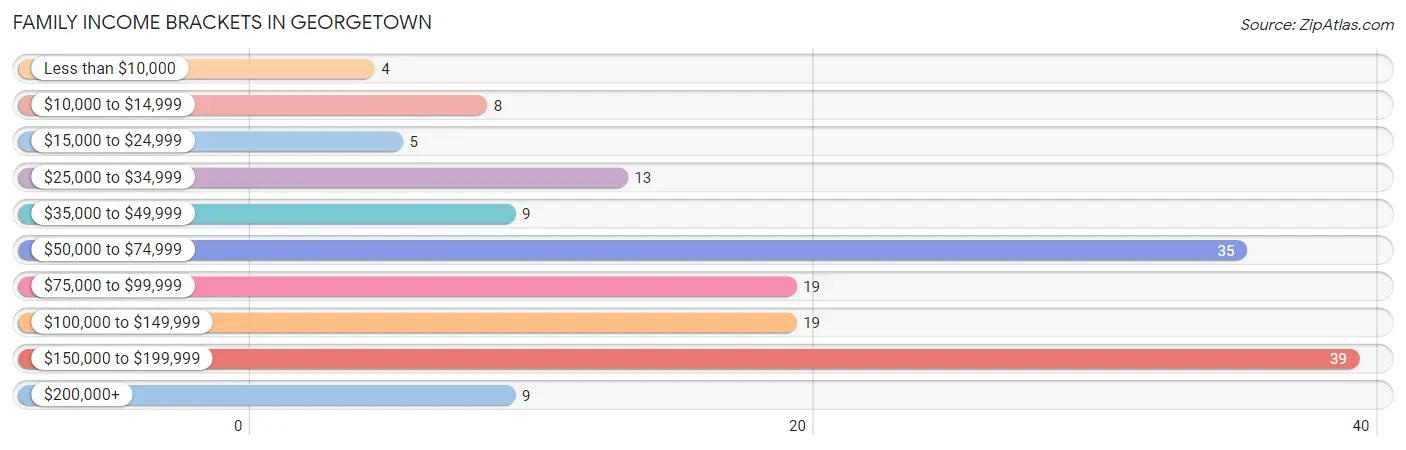
| Income Bracket | # Families | % Families |
| Less than $10,000 | 4 | 2.5% |
| $10,000 to $14,999 | 8 | 5.0% |
| $15,000 to $24,999 | 5 | 3.1% |
| $25,000 to $34,999 | 13 | 8.1% |
| $35,000 to $49,999 | 9 | 5.6% |
| $50,000 to $74,999 | 35 | 21.9% |
| $75,000 to $99,999 | 19 | 11.9% |
| $100,000 to $149,999 | 19 | 11.9% |
| $150,000 to $199,999 | 39 | 24.4% |
| $200,000+ | 9 | 5.6% |
Family Income by Famaliy Size in Georgetown
5-person families (28 | 17.5%) account for the highest median family income in Georgetown with $101,250 per family, while 2-person families (66 | 41.2%) have the highest median income of $40,625 per family member.
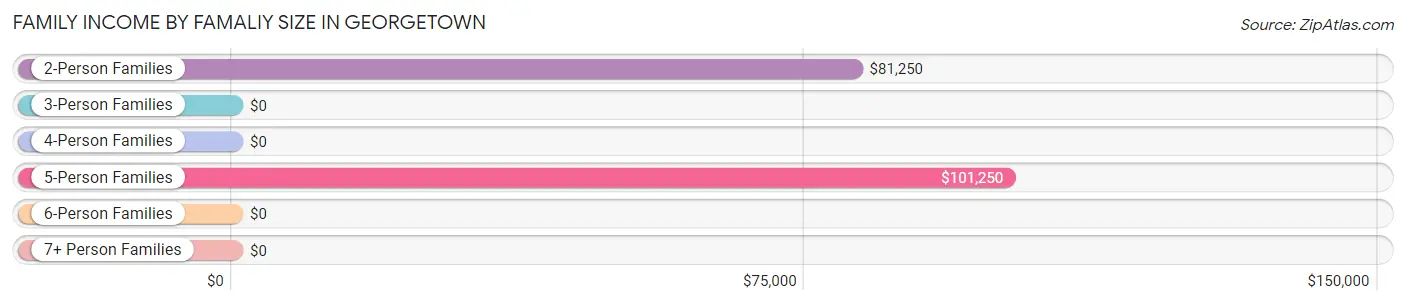
| Income Bracket | # Families | Median Income |
| 2-Person Families | 66 (41.2%) | $81,250 |
| 3-Person Families | 39 (24.4%) | $0 |
| 4-Person Families | 12 (7.5%) | $0 |
| 5-Person Families | 28 (17.5%) | $101,250 |
| 6-Person Families | 4 (2.5%) | $0 |
| 7+ Person Families | 11 (6.9%) | $0 |
| Total | 160 (100.0%) | $79,167 |
Family Income by Number of Earners in Georgetown
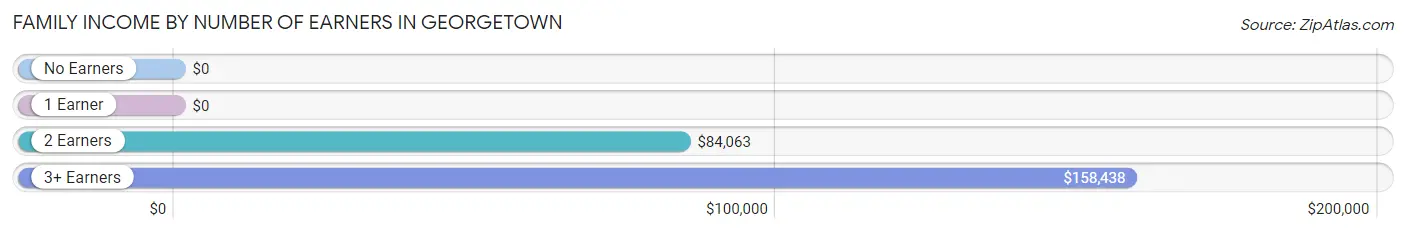
| Number of Earners | # Families | Median Income |
| No Earners | 23 (14.4%) | $0 |
| 1 Earner | 55 (34.4%) | $0 |
| 2 Earners | 59 (36.9%) | $84,063 |
| 3+ Earners | 23 (14.4%) | $158,438 |
| Total | 160 (100.0%) | $79,167 |
Household Income in Georgetown
Household Income Brackets in Georgetown
With 43 households falling in the category, the $50,000 to $74,999 income range is the most frequent in Georgetown, accounting for 23.0% of all households. In contrast, only 7 households (3.7%) fall into the less than $10,000 income bracket, making it the least populous group.
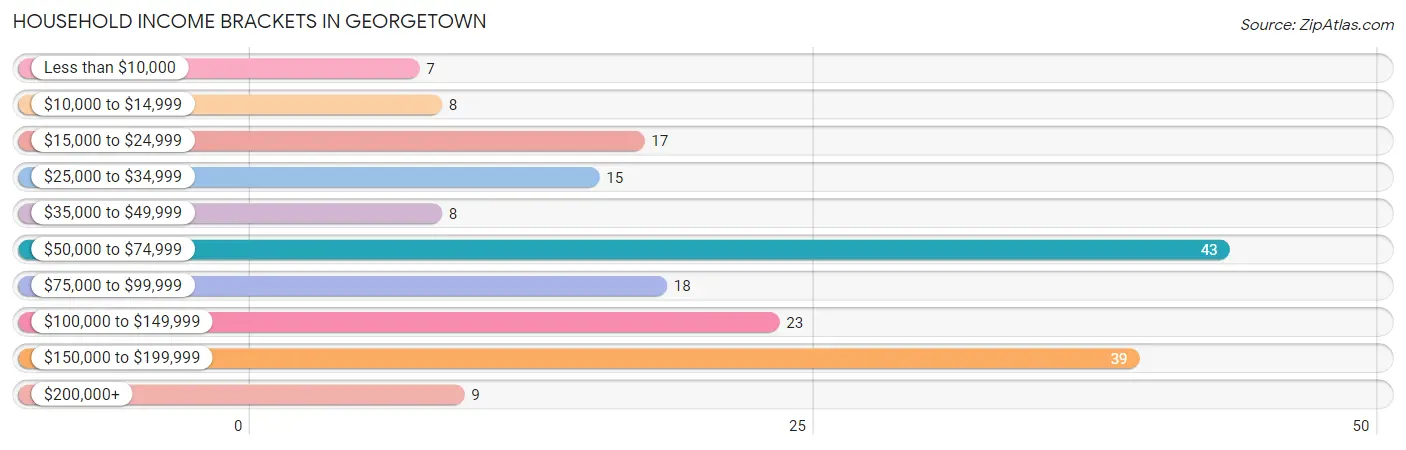
| Income Bracket | # Households | % Households |
| Less than $10,000 | 7 | 3.7% |
| $10,000 to $14,999 | 8 | 4.3% |
| $15,000 to $24,999 | 17 | 9.1% |
| $25,000 to $34,999 | 15 | 8.0% |
| $35,000 to $49,999 | 8 | 4.3% |
| $50,000 to $74,999 | 43 | 23.0% |
| $75,000 to $99,999 | 18 | 9.6% |
| $100,000 to $149,999 | 23 | 12.3% |
| $150,000 to $199,999 | 39 | 20.9% |
| $200,000+ | 9 | 4.8% |
Household Income by Householder Age in Georgetown
The median household income in Georgetown is $70,417, with the highest median household income of $134,375 found in the 45 to 64 years age bracket for the primary householder. A total of 61 households (32.6%) fall into this category. Meanwhile, the 15 to 24 years age bracket for the primary householder has the lowest median household income of $0, with 5 households (2.7%) in this group.
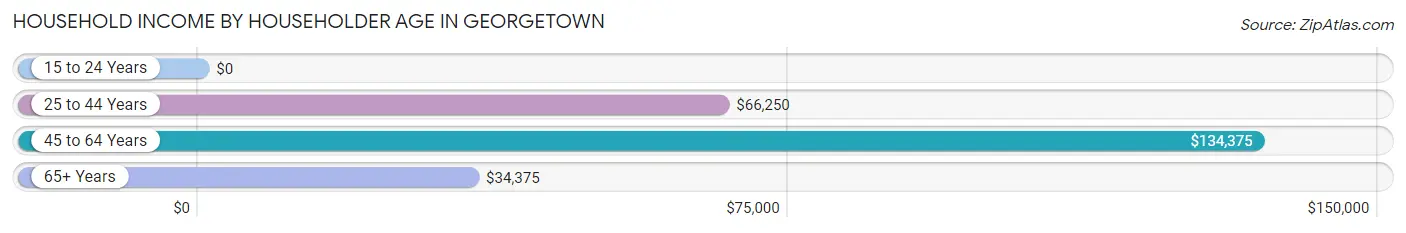
| Income Bracket | # Households | Median Income |
| 15 to 24 Years | 5 (2.7%) | $0 |
| 25 to 44 Years | 70 (37.4%) | $66,250 |
| 45 to 64 Years | 61 (32.6%) | $134,375 |
| 65+ Years | 51 (27.3%) | $34,375 |
| Total | 187 (100.0%) | $70,417 |
Poverty in Georgetown
Income Below Poverty by Sex and Age in Georgetown
With 4.3% poverty level for males and 13.5% for females among the residents of Georgetown, under 5 year old males and 15 year old females are the most vulnerable to poverty, with 2 males (14.3%) and 3 females (100.0%) in their respective age groups living below the poverty level.
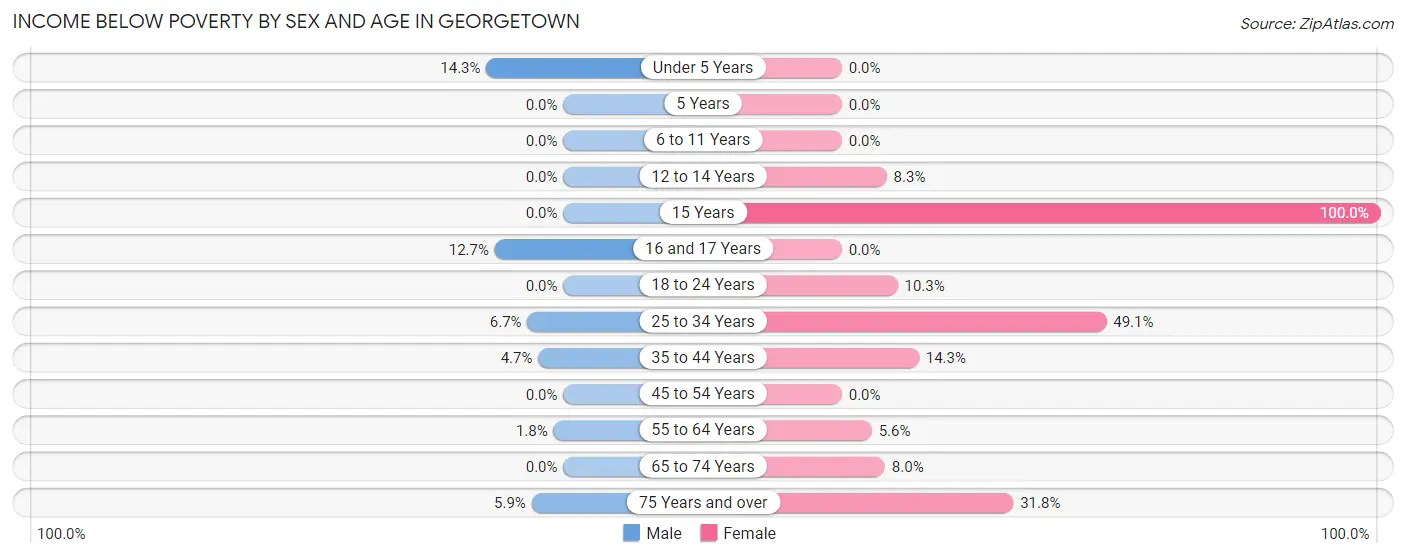
| Age Bracket | Male | Female |
| Under 5 Years | 2 (14.3%) | 0 (0.0%) |
| 5 Years | 0 (0.0%) | 0 (0.0%) |
| 6 to 11 Years | 0 (0.0%) | 0 (0.0%) |
| 12 to 14 Years | 0 (0.0%) | 2 (8.3%) |
| 15 Years | 0 (0.0%) | 3 (100.0%) |
| 16 and 17 Years | 7 (12.7%) | 0 (0.0%) |
| 18 to 24 Years | 0 (0.0%) | 6 (10.3%) |
| 25 to 34 Years | 2 (6.7%) | 27 (49.1%) |
| 35 to 44 Years | 2 (4.6%) | 6 (14.3%) |
| 45 to 54 Years | 0 (0.0%) | 0 (0.0%) |
| 55 to 64 Years | 1 (1.8%) | 2 (5.6%) |
| 65 to 74 Years | 0 (0.0%) | 2 (8.0%) |
| 75 Years and over | 1 (5.9%) | 7 (31.8%) |
| Total | 15 (4.3%) | 55 (13.5%) |
Income Above Poverty by Sex and Age in Georgetown
According to the poverty statistics in Georgetown, males aged 5 years and females aged under 5 years are the age groups that are most secure financially, with 100.0% of males and 100.0% of females in these age groups living above the poverty line.
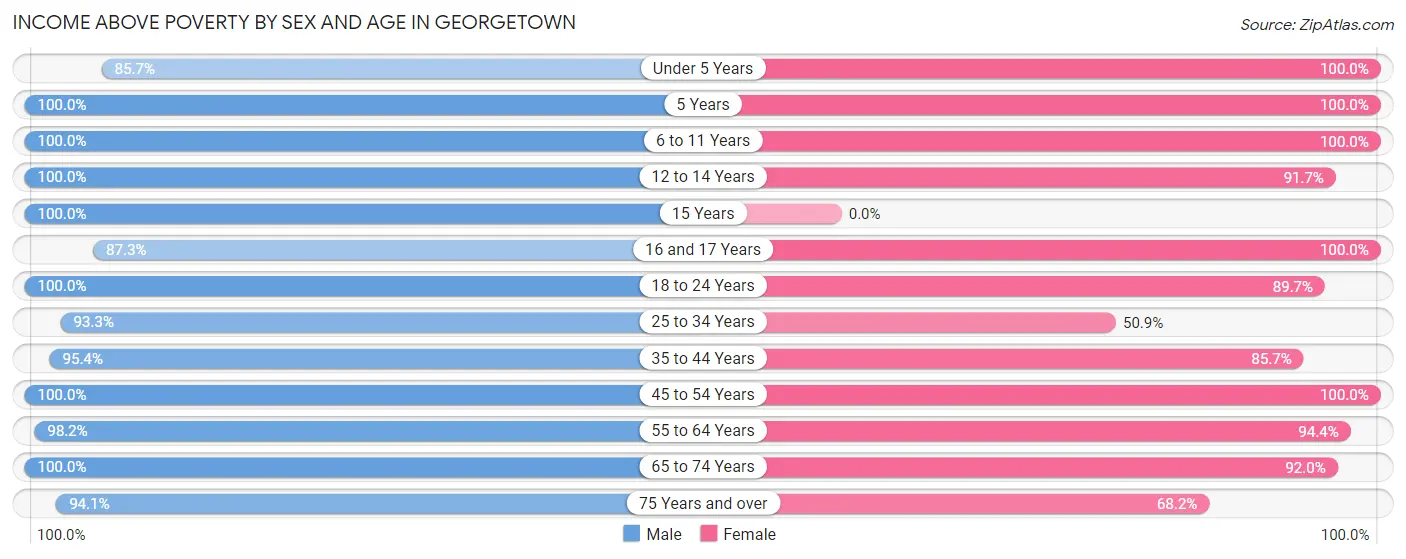
| Age Bracket | Male | Female |
| Under 5 Years | 12 (85.7%) | 12 (100.0%) |
| 5 Years | 17 (100.0%) | 2 (100.0%) |
| 6 to 11 Years | 14 (100.0%) | 71 (100.0%) |
| 12 to 14 Years | 12 (100.0%) | 22 (91.7%) |
| 15 Years | 5 (100.0%) | 0 (0.0%) |
| 16 and 17 Years | 48 (87.3%) | 30 (100.0%) |
| 18 to 24 Years | 38 (100.0%) | 52 (89.7%) |
| 25 to 34 Years | 28 (93.3%) | 28 (50.9%) |
| 35 to 44 Years | 41 (95.4%) | 36 (85.7%) |
| 45 to 54 Years | 32 (100.0%) | 28 (100.0%) |
| 55 to 64 Years | 54 (98.2%) | 34 (94.4%) |
| 65 to 74 Years | 15 (100.0%) | 23 (92.0%) |
| 75 Years and over | 16 (94.1%) | 15 (68.2%) |
| Total | 332 (95.7%) | 353 (86.5%) |
Income Below Poverty Among Married-Couple Families in Georgetown
The poverty statistics for married-couple families in Georgetown show that 0.9% or 1 of the total 114 families live below the poverty line. Families with no children have the highest poverty rate of 1.6%, comprising of 1 families. On the other hand, families with 1 or 2 children have the lowest poverty rate of 0.0%, which includes 0 families.
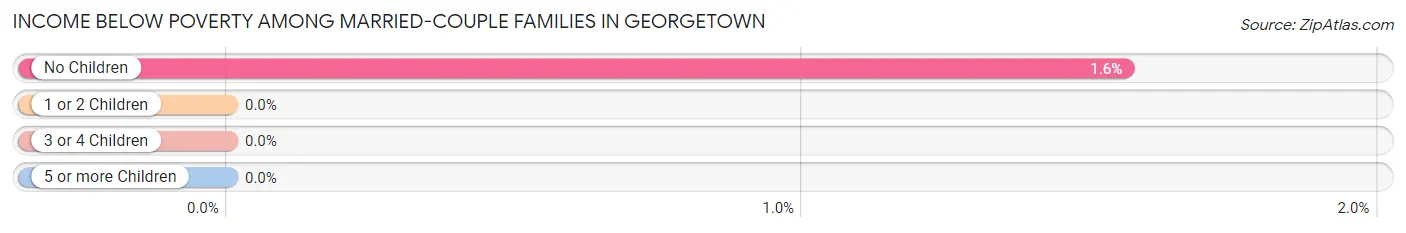
| Children | Above Poverty | Below Poverty |
| No Children | 63 (98.4%) | 1 (1.6%) |
| 1 or 2 Children | 24 (100.0%) | 0 (0.0%) |
| 3 or 4 Children | 20 (100.0%) | 0 (0.0%) |
| 5 or more Children | 6 (100.0%) | 0 (0.0%) |
| Total | 113 (99.1%) | 1 (0.9%) |
Income Below Poverty Among Single-Parent Households in Georgetown
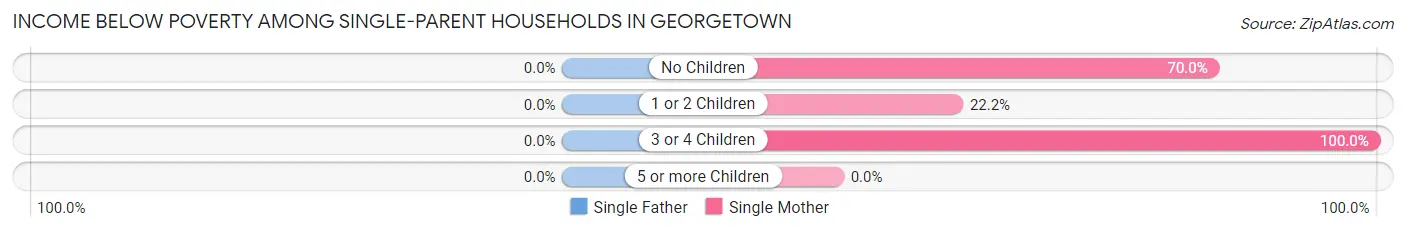
| Children | Single Father | Single Mother |
| No Children | 0 (0.0%) | 7 (70.0%) |
| 1 or 2 Children | 0 (0.0%) | 4 (22.2%) |
| 3 or 4 Children | 0 (0.0%) | 2 (100.0%) |
| 5 or more Children | 0 (0.0%) | 0 (0.0%) |
| Total | 0 (0.0%) | 13 (43.3%) |
Income Below Poverty Among Married-Couple vs Single-Parent Households in Georgetown
The poverty data for Georgetown shows that 1 of the married-couple family households (0.9%) and 13 of the single-parent households (28.3%) are living below the poverty level. Within the married-couple family households, those with no children have the highest poverty rate, with 1 households (1.6%) falling below the poverty line. Among the single-parent households, those with no children have the highest poverty rate, with 7 household (58.3%) living below poverty.
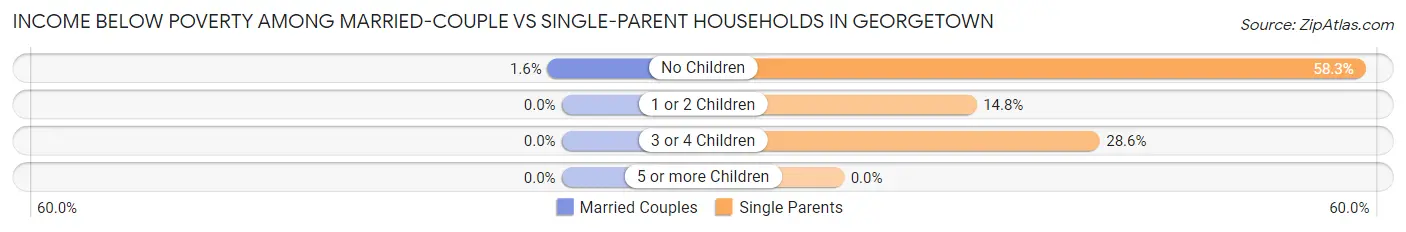
| Children | Married-Couple Families | Single-Parent Households |
| No Children | 1 (1.6%) | 7 (58.3%) |
| 1 or 2 Children | 0 (0.0%) | 4 (14.8%) |
| 3 or 4 Children | 0 (0.0%) | 2 (28.6%) |
| 5 or more Children | 0 (0.0%) | 0 (0.0%) |
| Total | 1 (0.9%) | 13 (28.3%) |
Race in Georgetown
The most populous races in Georgetown are White / Caucasian (711 | 93.9%), Asian (22 | 2.9%), and Hispanic or Latino (14 | 1.8%).
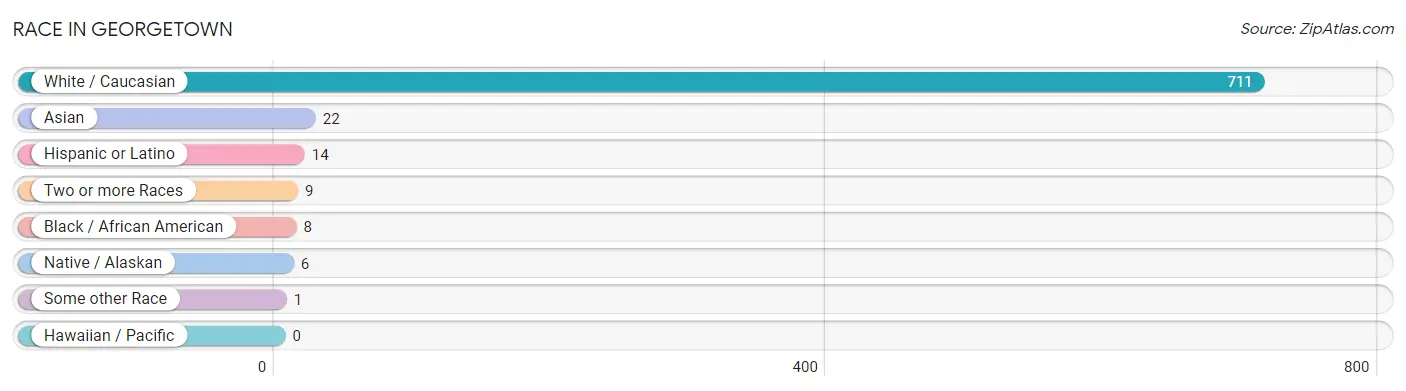
| Race | # Population | % Population |
| Asian | 22 | 2.9% |
| Black / African American | 8 | 1.1% |
| Hawaiian / Pacific | 0 | 0.0% |
| Hispanic or Latino | 14 | 1.8% |
| Native / Alaskan | 6 | 0.8% |
| White / Caucasian | 711 | 93.9% |
| Two or more Races | 9 | 1.2% |
| Some other Race | 1 | 0.1% |
| Total | 757 | 100.0% |
Ancestry in Georgetown
The most populous ancestries reported in Georgetown are English (153 | 20.2%), German (71 | 9.4%), Swiss (68 | 9.0%), American (54 | 7.1%), and Irish (30 | 4.0%), together accounting for 49.7% of all Georgetown residents.
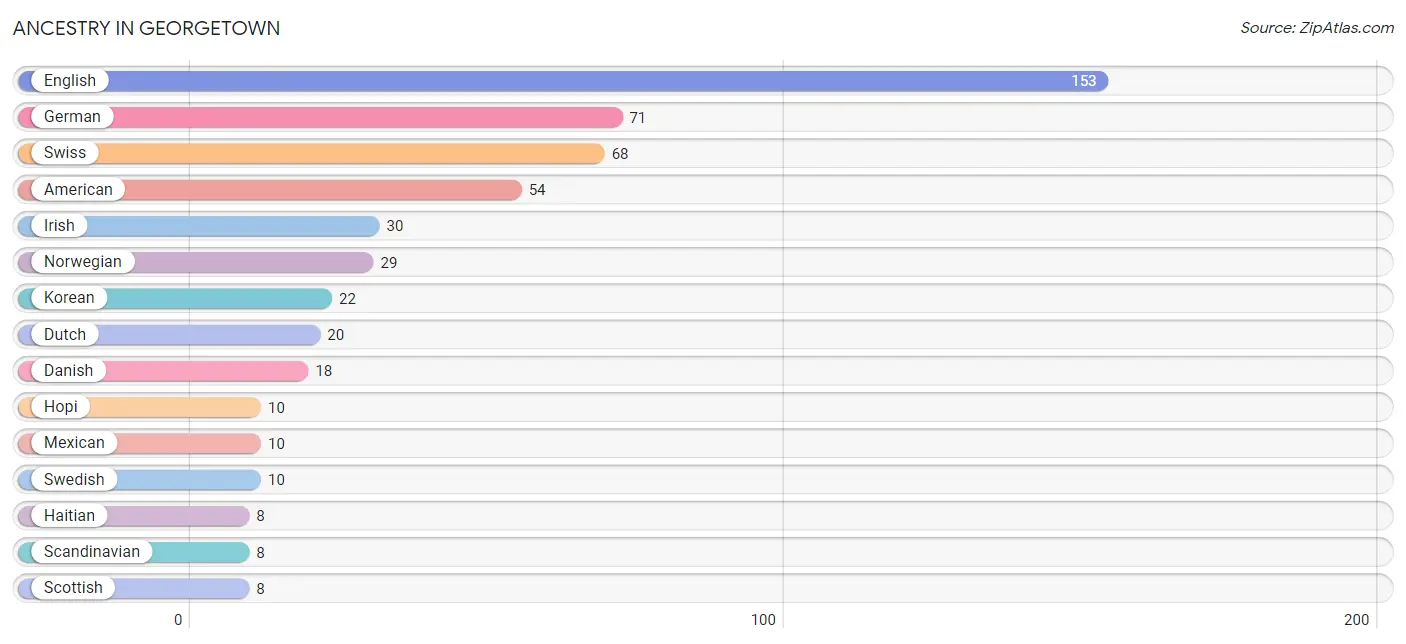
| Ancestry | # Population | % Population |
| American | 54 | 7.1% |
| British | 4 | 0.5% |
| Celtic | 3 | 0.4% |
| Danish | 18 | 2.4% |
| Dutch | 20 | 2.6% |
| English | 153 | 20.2% |
| European | 2 | 0.3% |
| French | 7 | 0.9% |
| German | 71 | 9.4% |
| Haitian | 8 | 1.1% |
| Hopi | 10 | 1.3% |
| Icelander | 7 | 0.9% |
| Irish | 30 | 4.0% |
| Korean | 22 | 2.9% |
| Lithuanian | 4 | 0.5% |
| Mexican | 10 | 1.3% |
| Norwegian | 29 | 3.8% |
| Polish | 7 | 0.9% |
| Puerto Rican | 4 | 0.5% |
| Scandinavian | 8 | 1.1% |
| Scotch-Irish | 3 | 0.4% |
| Scottish | 8 | 1.1% |
| Swedish | 10 | 1.3% |
| Swiss | 68 | 9.0% |
| Welsh | 4 | 0.5% | View All 25 Rows |
Immigrants in Georgetown
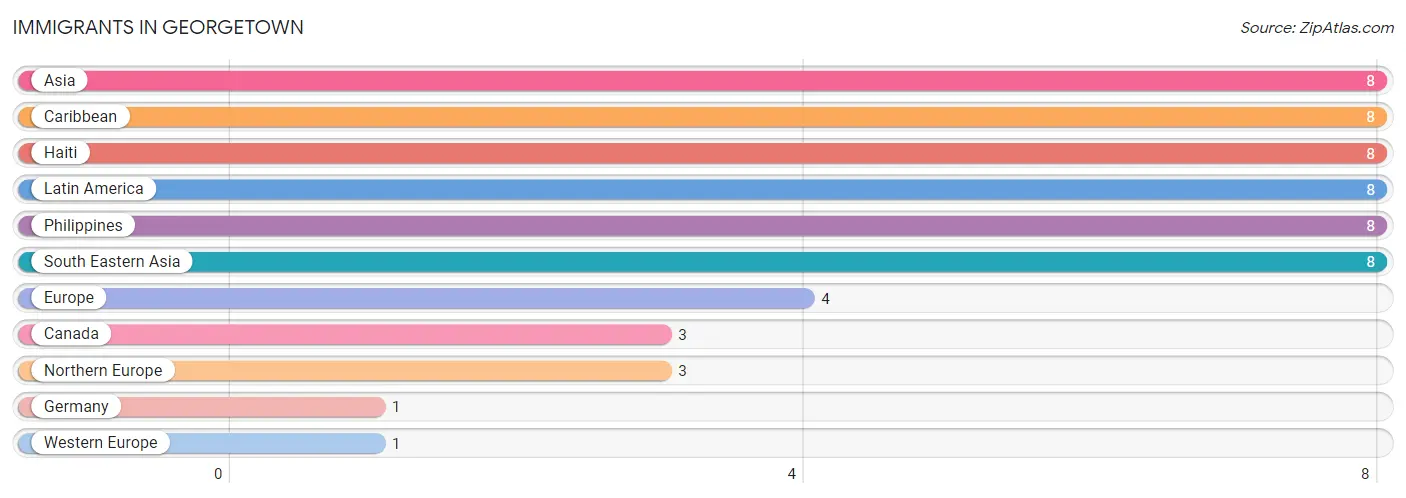
The most numerous immigrant groups reported in Georgetown came from Asia (8 | 1.1%), Caribbean (8 | 1.1%), Haiti (8 | 1.1%), Latin America (8 | 1.1%), and Philippines (8 | 1.1%), together accounting for 5.3% of all Georgetown residents.
| Immigration Origin | # Population | % Population |
| Asia | 8 | 1.1% |
| Canada | 3 | 0.4% |
| Caribbean | 8 | 1.1% |
| Europe | 4 | 0.5% |
| Germany | 1 | 0.1% |
| Haiti | 8 | 1.1% |
| Latin America | 8 | 1.1% |
| Northern Europe | 3 | 0.4% |
| Philippines | 8 | 1.1% |
| South Eastern Asia | 8 | 1.1% |
| Western Europe | 1 | 0.1% | View All 11 Rows |
Sex and Age in Georgetown
Sex and Age in Georgetown
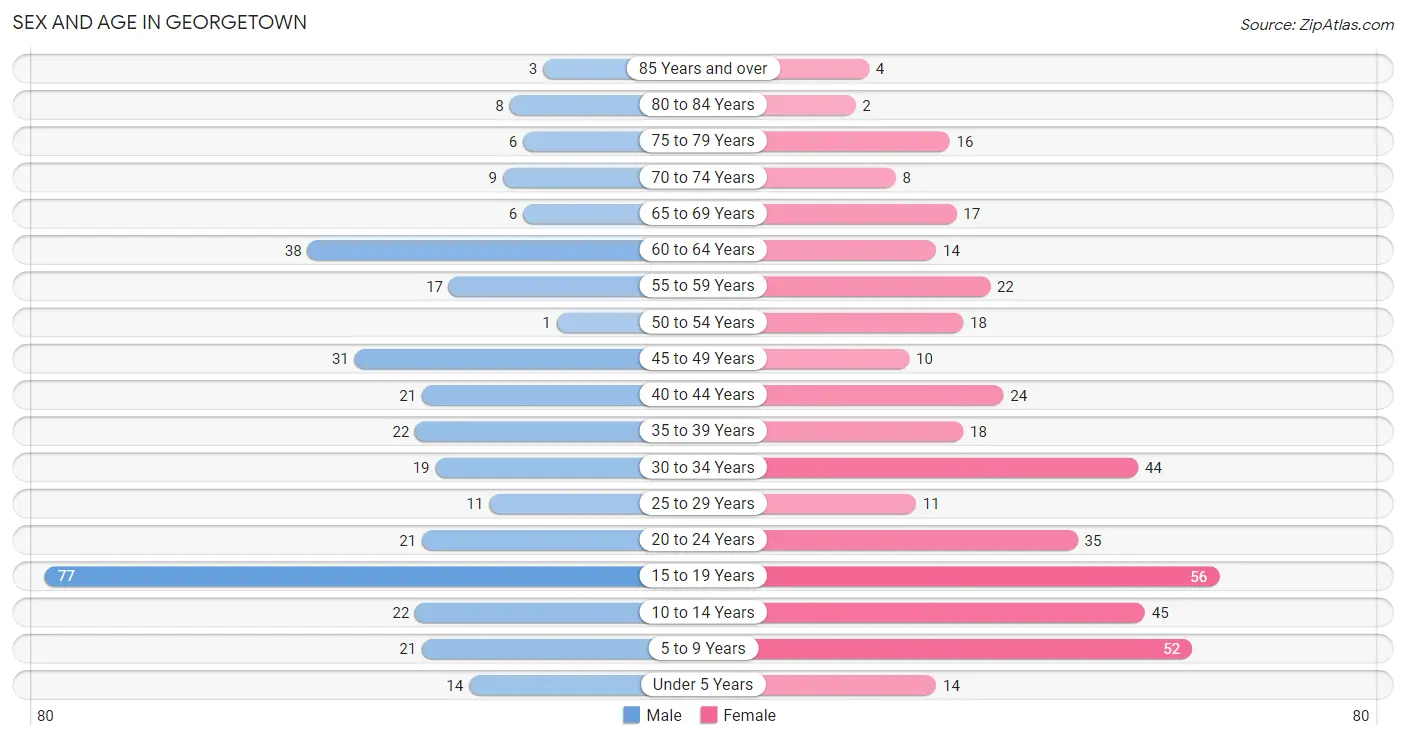
The most populous age groups in Georgetown are 15 to 19 Years (77 | 22.2%) for men and 15 to 19 Years (56 | 13.7%) for women.
| Age Bracket | Male | Female |
| Under 5 Years | 14 (4.0%) | 14 (3.4%) |
| 5 to 9 Years | 21 (6.0%) | 52 (12.7%) |
| 10 to 14 Years | 22 (6.3%) | 45 (11.0%) |
| 15 to 19 Years | 77 (22.2%) | 56 (13.7%) |
| 20 to 24 Years | 21 (6.0%) | 35 (8.5%) |
| 25 to 29 Years | 11 (3.2%) | 11 (2.7%) |
| 30 to 34 Years | 19 (5.5%) | 44 (10.7%) |
| 35 to 39 Years | 22 (6.3%) | 18 (4.4%) |
| 40 to 44 Years | 21 (6.0%) | 24 (5.9%) |
| 45 to 49 Years | 31 (8.9%) | 10 (2.4%) |
| 50 to 54 Years | 1 (0.3%) | 18 (4.4%) |
| 55 to 59 Years | 17 (4.9%) | 22 (5.4%) |
| 60 to 64 Years | 38 (11.0%) | 14 (3.4%) |
| 65 to 69 Years | 6 (1.7%) | 17 (4.2%) |
| 70 to 74 Years | 9 (2.6%) | 8 (1.9%) |
| 75 to 79 Years | 6 (1.7%) | 16 (3.9%) |
| 80 to 84 Years | 8 (2.3%) | 2 (0.5%) |
| 85 Years and over | 3 (0.9%) | 4 (1.0%) |
| Total | 347 (100.0%) | 410 (100.0%) |
Families and Households in Georgetown
Median Family Size in Georgetown
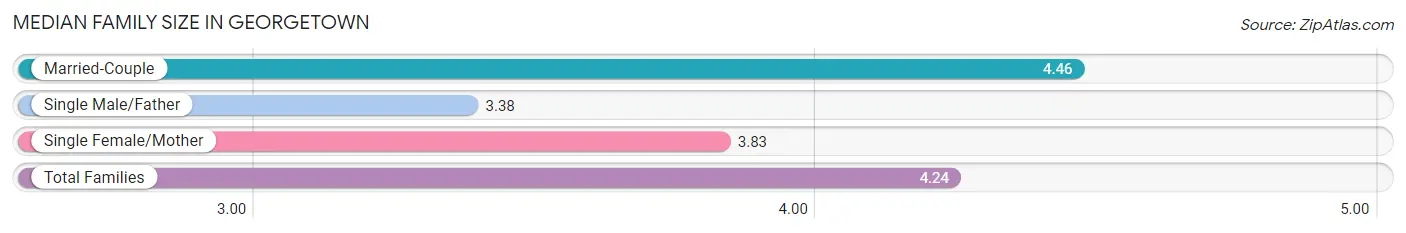
The median family size in Georgetown is 4.24 persons per family, with married-couple families (114 | 71.3%) accounting for the largest median family size of 4.46 persons per family. On the other hand, single male/father families (16 | 10.0%) represent the smallest median family size with 3.38 persons per family.
| Family Type | # Families | Family Size |
| Married-Couple | 114 (71.3%) | 4.46 |
| Single Male/Father | 16 (10.0%) | 3.38 |
| Single Female/Mother | 30 (18.8%) | 3.83 |
| Total Families | 160 (100.0%) | 4.24 |
Median Household Size in Georgetown
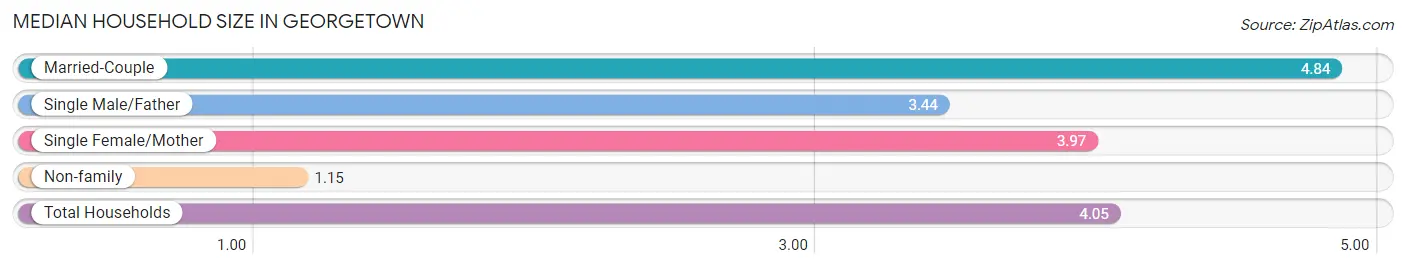
The median household size in Georgetown is 4.05 persons per household, with married-couple households (114 | 61.0%) accounting for the largest median household size of 4.84 persons per household. non-family households (27 | 14.4%) represent the smallest median household size with 1.15 persons per household.
| Household Type | # Households | Household Size |
| Married-Couple | 114 (61.0%) | 4.84 |
| Single Male/Father | 16 (8.6%) | 3.44 |
| Single Female/Mother | 30 (16.0%) | 3.97 |
| Non-family | 27 (14.4%) | 1.15 |
| Total Households | 187 (100.0%) | 4.05 |
Household Size by Marriage Status in Georgetown
Out of a total of 187 households in Georgetown, 160 (85.6%) are family households, while 27 (14.4%) are nonfamily households. The most numerous type of family households are 2-person households, comprising 64, and the most common type of nonfamily households are 1-person households, comprising 22.
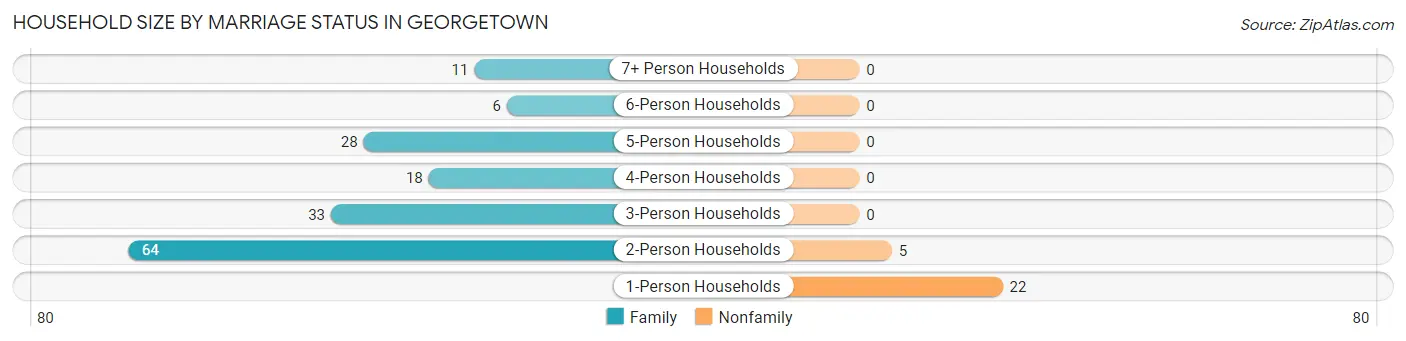
| Household Size | Family Households | Nonfamily Households |
| 1-Person Households | - | 22 (11.8%) |
| 2-Person Households | 64 (34.2%) | 5 (2.7%) |
| 3-Person Households | 33 (17.6%) | 0 (0.0%) |
| 4-Person Households | 18 (9.6%) | 0 (0.0%) |
| 5-Person Households | 28 (15.0%) | 0 (0.0%) |
| 6-Person Households | 6 (3.2%) | 0 (0.0%) |
| 7+ Person Households | 11 (5.9%) | 0 (0.0%) |
| Total | 160 (85.6%) | 27 (14.4%) |
Female Fertility in Georgetown
Fertility by Age in Georgetown
Average fertility rate in Georgetown is 66.0 births per 1,000 women. Women in the age bracket of 20 to 34 years have the highest fertility rate with 144.0 births per 1,000 women. Women in the age bracket of 20 to 34 years acount for 100.0% of all women with births.
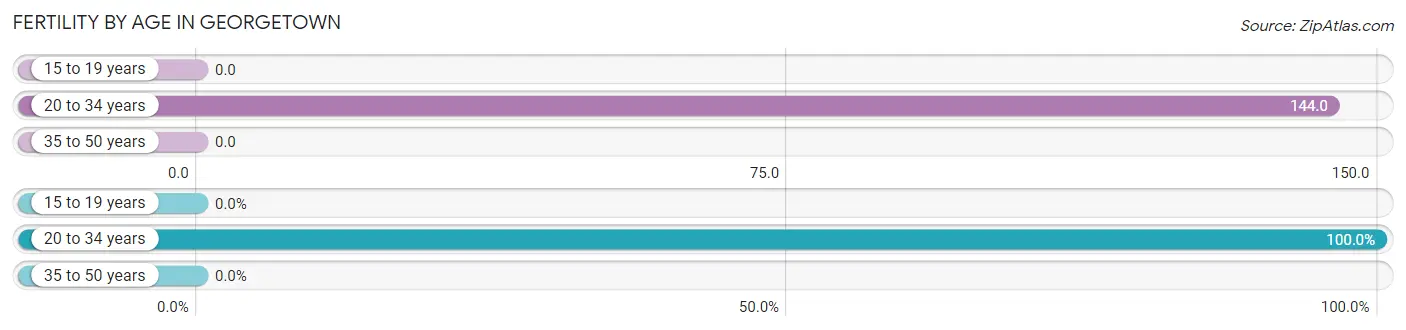
| Age Bracket | Women with Births | Births / 1,000 Women |
| 15 to 19 years | 0 (0.0%) | 0.0 |
| 20 to 34 years | 13 (100.0%) | 144.0 |
| 35 to 50 years | 0 (0.0%) | 0.0 |
| Total | 13 (100.0%) | 66.0 |
Fertility by Age by Marriage Status in Georgetown
69.2% of women with births (13) in Georgetown are married. The highest percentage of unmarried women with births falls into 20 to 34 years age bracket with 30.8% of them unmarried at the time of birth, while the lowest percentage of unmarried women with births belong to 20 to 34 years age bracket with 30.8% of them unmarried.
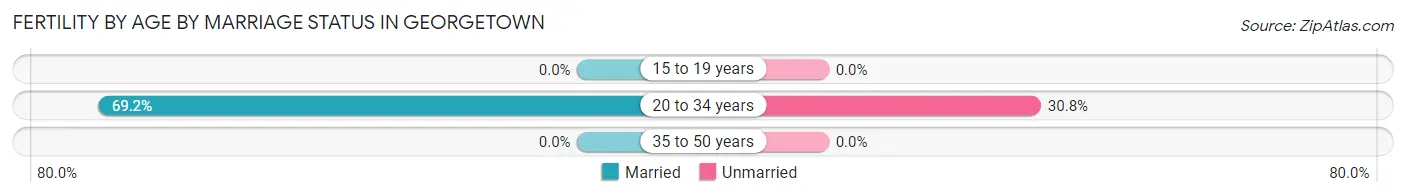
| Age Bracket | Married | Unmarried |
| 15 to 19 years | 0 (0.0%) | 0 (0.0%) |
| 20 to 34 years | 9 (69.2%) | 4 (30.8%) |
| 35 to 50 years | 0 (0.0%) | 0 (0.0%) |
| Total | 9 (69.2%) | 4 (30.8%) |
Fertility by Education in Georgetown
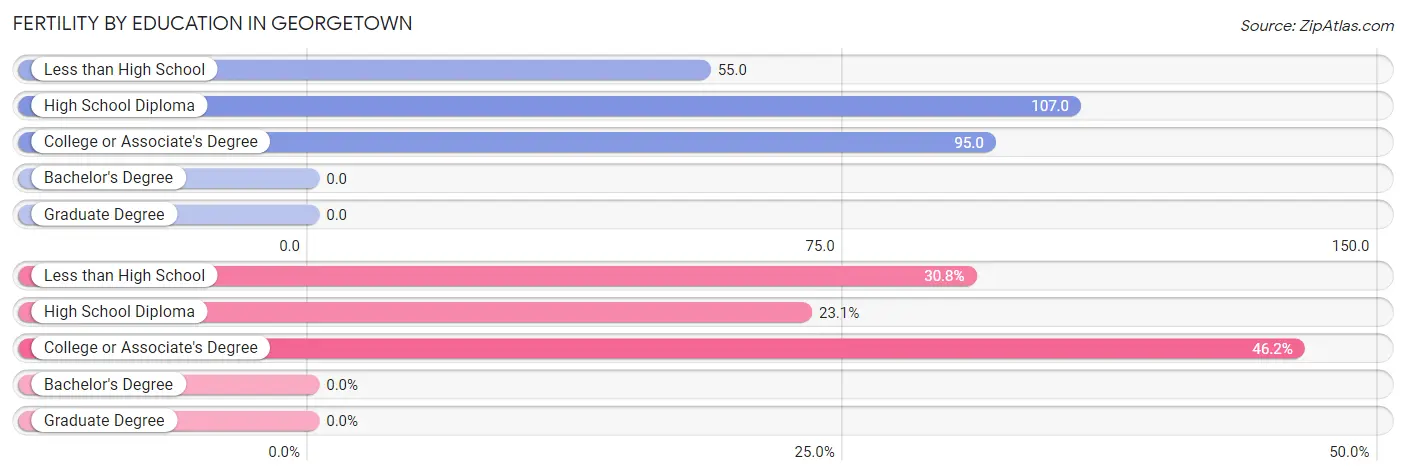
| Educational Attainment | Women with Births | Births / 1,000 Women |
| Less than High School | 4 (30.8%) | 55.0 |
| High School Diploma | 3 (23.1%) | 107.0 |
| College or Associate's Degree | 6 (46.2%) | 95.0 |
| Bachelor's Degree | 0 (0.0%) | 0.0 |
| Graduate Degree | 0 (0.0%) | 0.0 |
| Total | 13 (100.0%) | 66.0 |
Fertility by Education by Marriage Status in Georgetown
30.8% of women with births in Georgetown are unmarried. Women with the educational attainment of high school diploma are most likely to be married with 100.0% of them married at childbirth, while women with the educational attainment of less than high school are least likely to be married with 100.0% of them unmarried at childbirth.
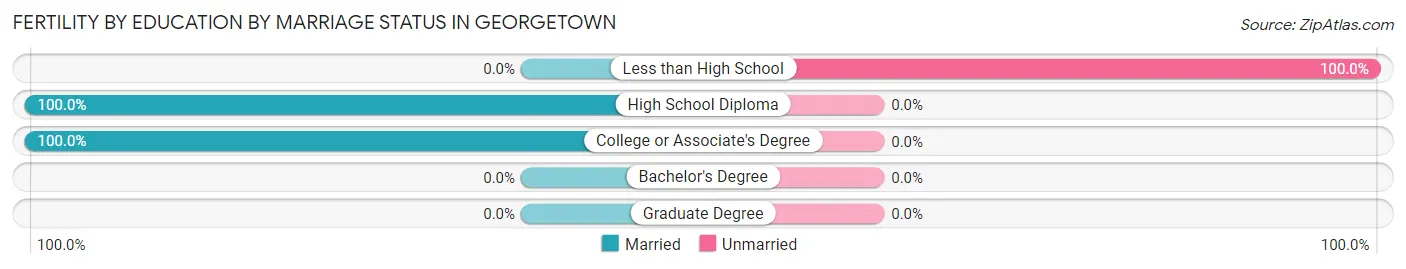
| Educational Attainment | Married | Unmarried |
| Less than High School | 0 (0.0%) | 4 (100.0%) |
| High School Diploma | 3 (100.0%) | 0 (0.0%) |
| College or Associate's Degree | 6 (100.0%) | 0 (0.0%) |
| Bachelor's Degree | 0 (0.0%) | 0 (0.0%) |
| Graduate Degree | 0 (0.0%) | 0 (0.0%) |
| Total | 9 (69.2%) | 4 (30.8%) |
Employment Characteristics in Georgetown
Employment by Class of Employer in Georgetown
Among the 337 employed individuals in Georgetown, private company employees (240 | 71.2%), self-employed (incorporated) (34 | 10.1%), and local government employees (20 | 5.9%) make up the most common classes of employment.
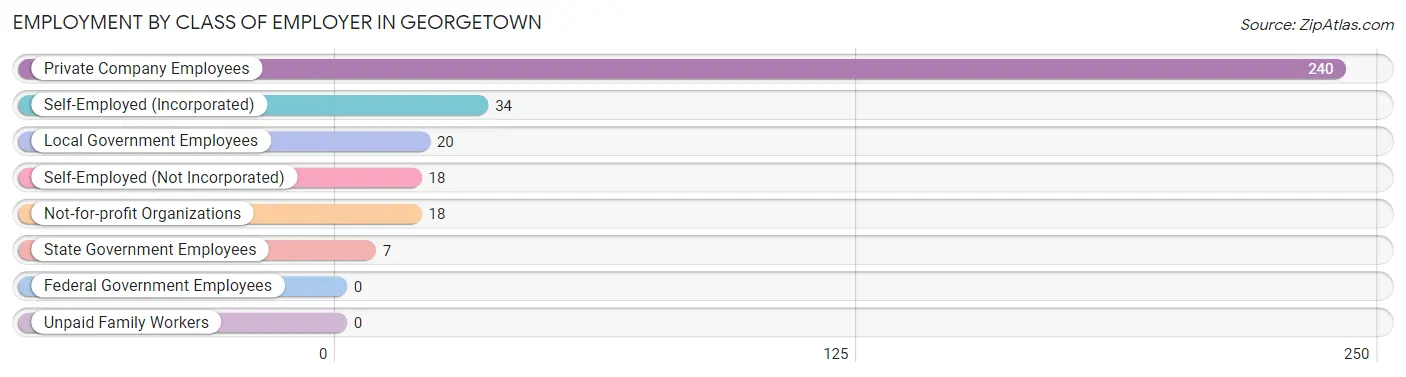
| Employer Class | # Employees | % Employees |
| Private Company Employees | 240 | 71.2% |
| Self-Employed (Incorporated) | 34 | 10.1% |
| Self-Employed (Not Incorporated) | 18 | 5.3% |
| Not-for-profit Organizations | 18 | 5.3% |
| Local Government Employees | 20 | 5.9% |
| State Government Employees | 7 | 2.1% |
| Federal Government Employees | 0 | 0.0% |
| Unpaid Family Workers | 0 | 0.0% |
| Total | 337 | 100.0% |
Employment Status by Age in Georgetown
According to the labor force statistics for Georgetown, out of the total population over 16 years of age (581), 62.5% or 363 individuals are in the labor force, with 5.5% or 20 of them unemployed. The age group with the highest labor force participation rate is 45 to 54 years, with 93.3% or 56 individuals in the labor force. Within the labor force, the 16 to 19 years age range has the highest percentage of unemployed individuals, with 23.5% or 12 of them being unemployed.
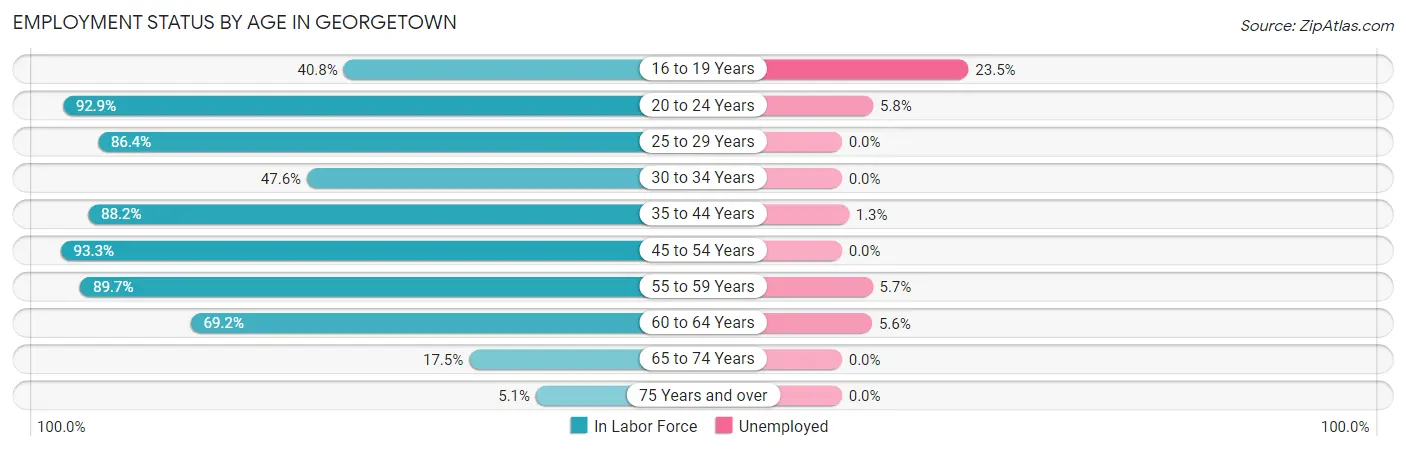
| Age Bracket | In Labor Force | Unemployed |
| 16 to 19 Years | 51 (40.8%) | 12 (23.5%) |
| 20 to 24 Years | 52 (92.9%) | 3 (5.8%) |
| 25 to 29 Years | 19 (86.4%) | 0 (0.0%) |
| 30 to 34 Years | 30 (47.6%) | 0 (0.0%) |
| 35 to 44 Years | 75 (88.2%) | 1 (1.3%) |
| 45 to 54 Years | 56 (93.3%) | 0 (0.0%) |
| 55 to 59 Years | 35 (89.7%) | 2 (5.7%) |
| 60 to 64 Years | 36 (69.2%) | 2 (5.6%) |
| 65 to 74 Years | 7 (17.5%) | 0 (0.0%) |
| 75 Years and over | 2 (5.1%) | 0 (0.0%) |
| Total | 363 (62.5%) | 20 (5.5%) |
Employment Status by Educational Attainment in Georgetown
According to labor force statistics for Georgetown, 78.2% of individuals (251) out of the total population between 25 and 64 years of age (321) are in the labor force, with 2.0% or 5 of them being unemployed. The group with the highest labor force participation rate are those with the educational attainment of high school diploma, with 88.1% or 119 individuals in the labor force. Within the labor force, individuals with bachelor's degree or higher education have the highest percentage of unemployment, with 4.7% or 2 of them being unemployed.
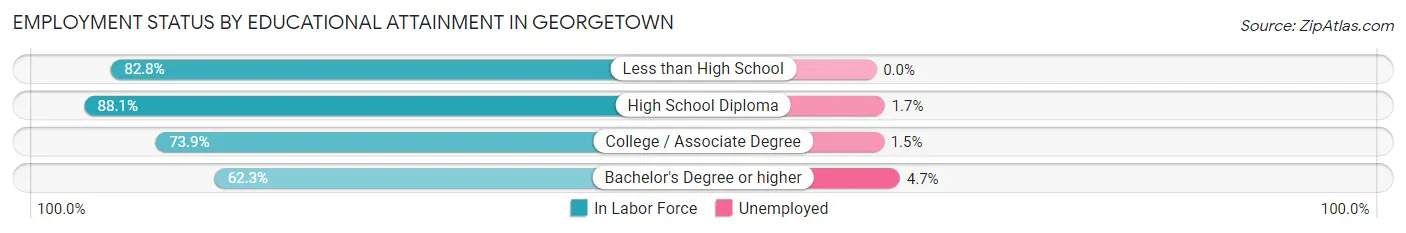
| Educational Attainment | In Labor Force | Unemployed |
| Less than High School | 24 (82.8%) | 0 (0.0%) |
| High School Diploma | 119 (88.1%) | 2 (1.7%) |
| College / Associate Degree | 65 (73.9%) | 1 (1.5%) |
| Bachelor's Degree or higher | 43 (62.3%) | 3 (4.7%) |
| Total | 251 (78.2%) | 6 (2.0%) |
Employment Occupations by Sex in Georgetown
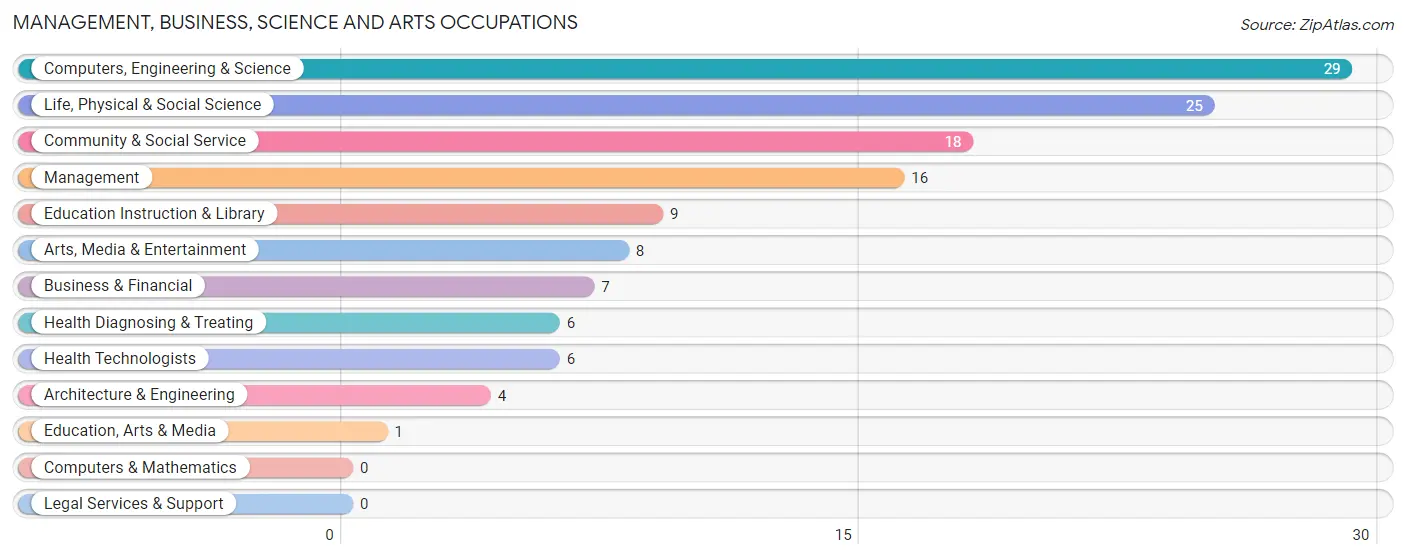
Management, Business, Science and Arts Occupations
The most common Management, Business, Science and Arts occupations in Georgetown are Computers, Engineering & Science (29 | 8.5%), Life, Physical & Social Science (25 | 7.3%), Community & Social Service (18 | 5.2%), Management (16 | 4.7%), and Education Instruction & Library (9 | 2.6%).
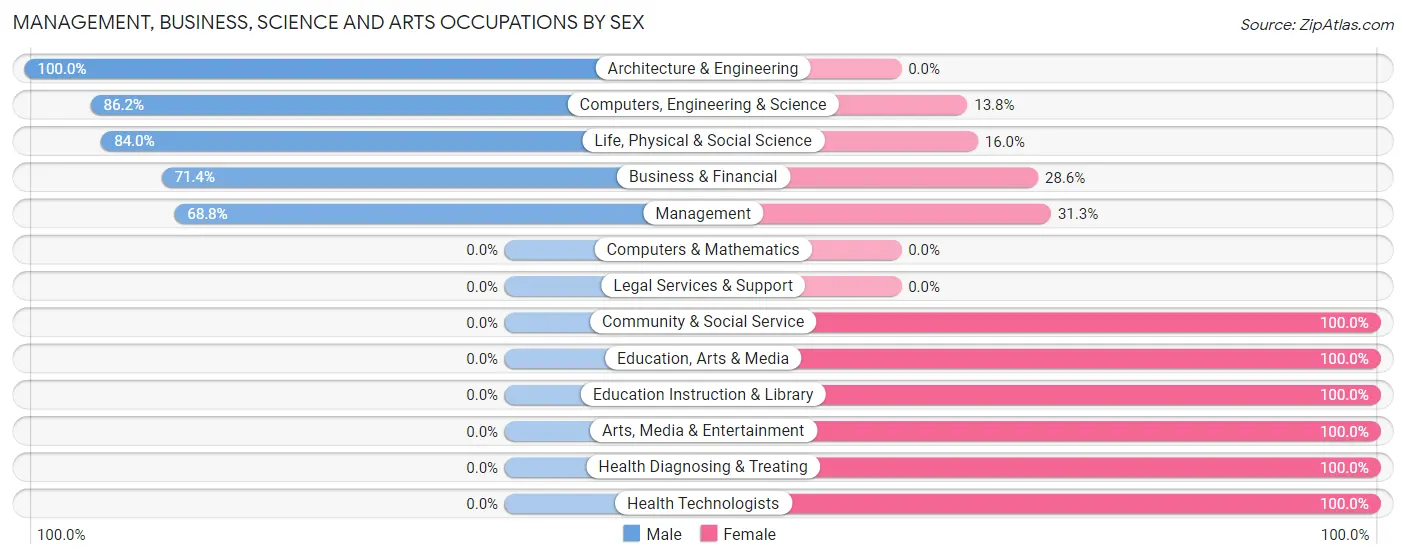
Management, Business, Science and Arts Occupations by Sex
Within the Management, Business, Science and Arts occupations in Georgetown, the most male-oriented occupations are Architecture & Engineering (100.0%), Computers, Engineering & Science (86.2%), and Life, Physical & Social Science (84.0%), while the most female-oriented occupations are Community & Social Service (100.0%), Education, Arts & Media (100.0%), and Education Instruction & Library (100.0%).
| Occupation | Male | Female |
| Management | 11 (68.8%) | 5 (31.2%) |
| Business & Financial | 5 (71.4%) | 2 (28.6%) |
| Computers, Engineering & Science | 25 (86.2%) | 4 (13.8%) |
| Computers & Mathematics | 0 (0.0%) | 0 (0.0%) |
| Architecture & Engineering | 4 (100.0%) | 0 (0.0%) |
| Life, Physical & Social Science | 21 (84.0%) | 4 (16.0%) |
| Community & Social Service | 0 (0.0%) | 18 (100.0%) |
| Education, Arts & Media | 0 (0.0%) | 1 (100.0%) |
| Legal Services & Support | 0 (0.0%) | 0 (0.0%) |
| Education Instruction & Library | 0 (0.0%) | 9 (100.0%) |
| Arts, Media & Entertainment | 0 (0.0%) | 8 (100.0%) |
| Health Diagnosing & Treating | 0 (0.0%) | 6 (100.0%) |
| Health Technologists | 0 (0.0%) | 6 (100.0%) |
| Total (Category) | 41 (53.9%) | 35 (46.1%) |
| Total (Overall) | 190 (55.4%) | 153 (44.6%) |
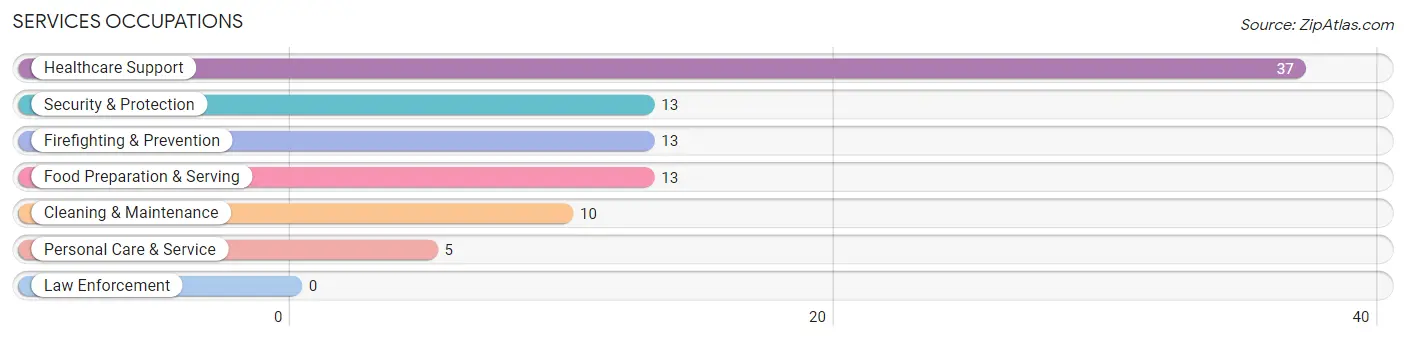
Services Occupations
The most common Services occupations in Georgetown are Healthcare Support (37 | 10.8%), Security & Protection (13 | 3.8%), Firefighting & Prevention (13 | 3.8%), Food Preparation & Serving (13 | 3.8%), and Cleaning & Maintenance (10 | 2.9%).
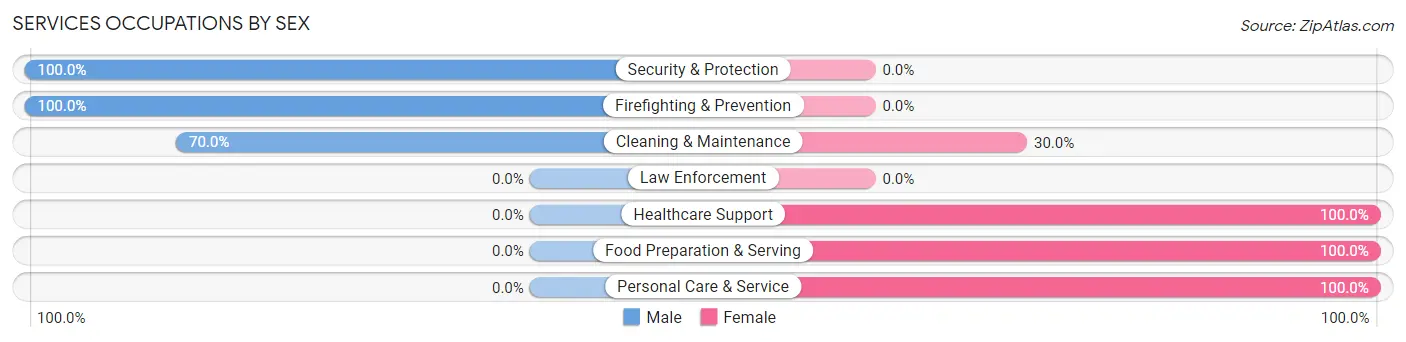
Services Occupations by Sex
Within the Services occupations in Georgetown, the most male-oriented occupations are Security & Protection (100.0%), Firefighting & Prevention (100.0%), and Cleaning & Maintenance (70.0%), while the most female-oriented occupations are Healthcare Support (100.0%), Food Preparation & Serving (100.0%), and Personal Care & Service (100.0%).
| Occupation | Male | Female |
| Healthcare Support | 0 (0.0%) | 37 (100.0%) |
| Security & Protection | 13 (100.0%) | 0 (0.0%) |
| Firefighting & Prevention | 13 (100.0%) | 0 (0.0%) |
| Law Enforcement | 0 (0.0%) | 0 (0.0%) |
| Food Preparation & Serving | 0 (0.0%) | 13 (100.0%) |
| Cleaning & Maintenance | 7 (70.0%) | 3 (30.0%) |
| Personal Care & Service | 0 (0.0%) | 5 (100.0%) |
| Total (Category) | 20 (25.6%) | 58 (74.4%) |
| Total (Overall) | 190 (55.4%) | 153 (44.6%) |
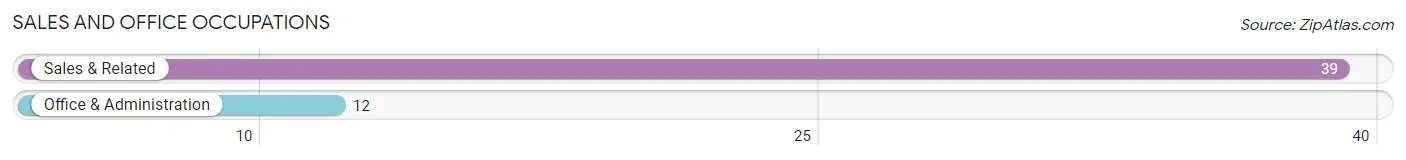
Sales and Office Occupations
The most common Sales and Office occupations in Georgetown are Sales & Related (39 | 11.4%), and Office & Administration (12 | 3.5%).
Sales and Office Occupations by Sex
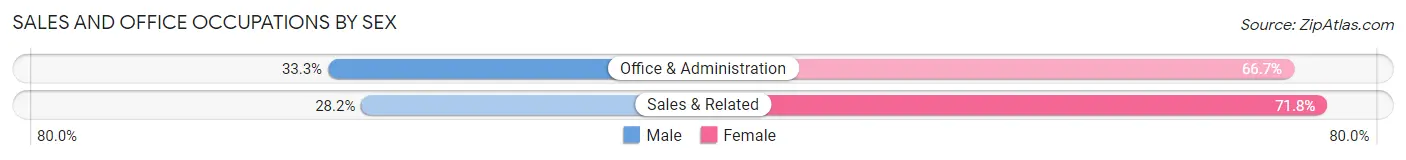
| Occupation | Male | Female |
| Sales & Related | 11 (28.2%) | 28 (71.8%) |
| Office & Administration | 4 (33.3%) | 8 (66.7%) |
| Total (Category) | 15 (29.4%) | 36 (70.6%) |
| Total (Overall) | 190 (55.4%) | 153 (44.6%) |
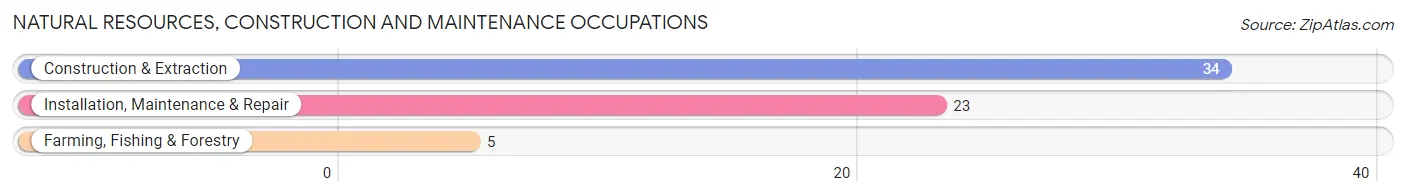
Natural Resources, Construction and Maintenance Occupations
The most common Natural Resources, Construction and Maintenance occupations in Georgetown are Construction & Extraction (34 | 9.9%), Installation, Maintenance & Repair (23 | 6.7%), and Farming, Fishing & Forestry (5 | 1.5%).
Natural Resources, Construction and Maintenance Occupations by Sex
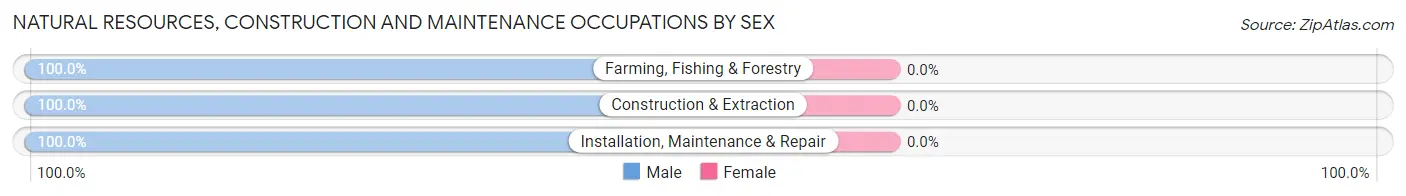
| Occupation | Male | Female |
| Farming, Fishing & Forestry | 5 (100.0%) | 0 (0.0%) |
| Construction & Extraction | 34 (100.0%) | 0 (0.0%) |
| Installation, Maintenance & Repair | 23 (100.0%) | 0 (0.0%) |
| Total (Category) | 62 (100.0%) | 0 (0.0%) |
| Total (Overall) | 190 (55.4%) | 153 (44.6%) |
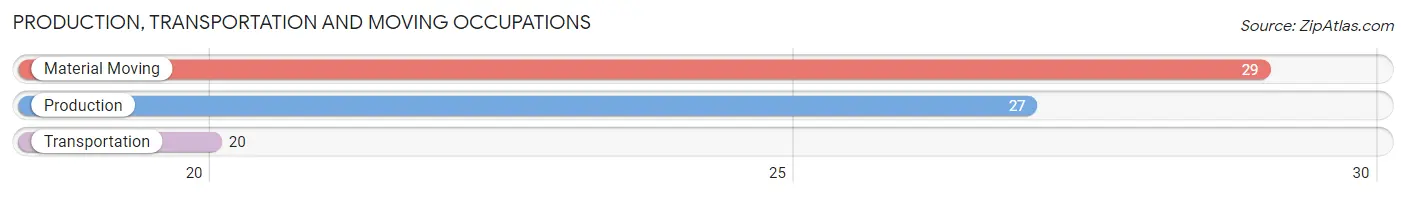
Production, Transportation and Moving Occupations
The most common Production, Transportation and Moving occupations in Georgetown are Material Moving (29 | 8.5%), Production (27 | 7.9%), and Transportation (20 | 5.8%).
Production, Transportation and Moving Occupations by Sex
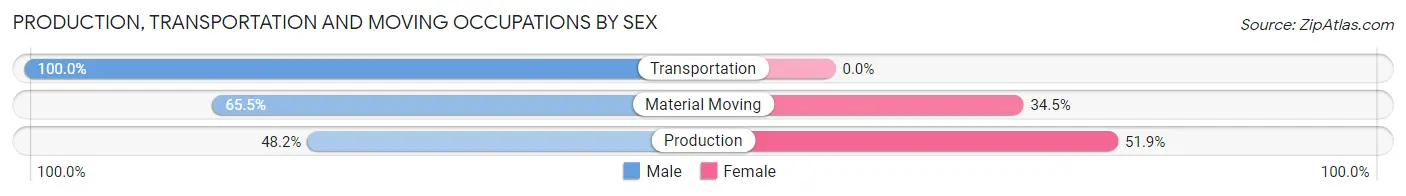
| Occupation | Male | Female |
| Production | 13 (48.1%) | 14 (51.8%) |
| Transportation | 20 (100.0%) | 0 (0.0%) |
| Material Moving | 19 (65.5%) | 10 (34.5%) |
| Total (Category) | 52 (68.4%) | 24 (31.6%) |
| Total (Overall) | 190 (55.4%) | 153 (44.6%) |
Employment Industries by Sex in Georgetown
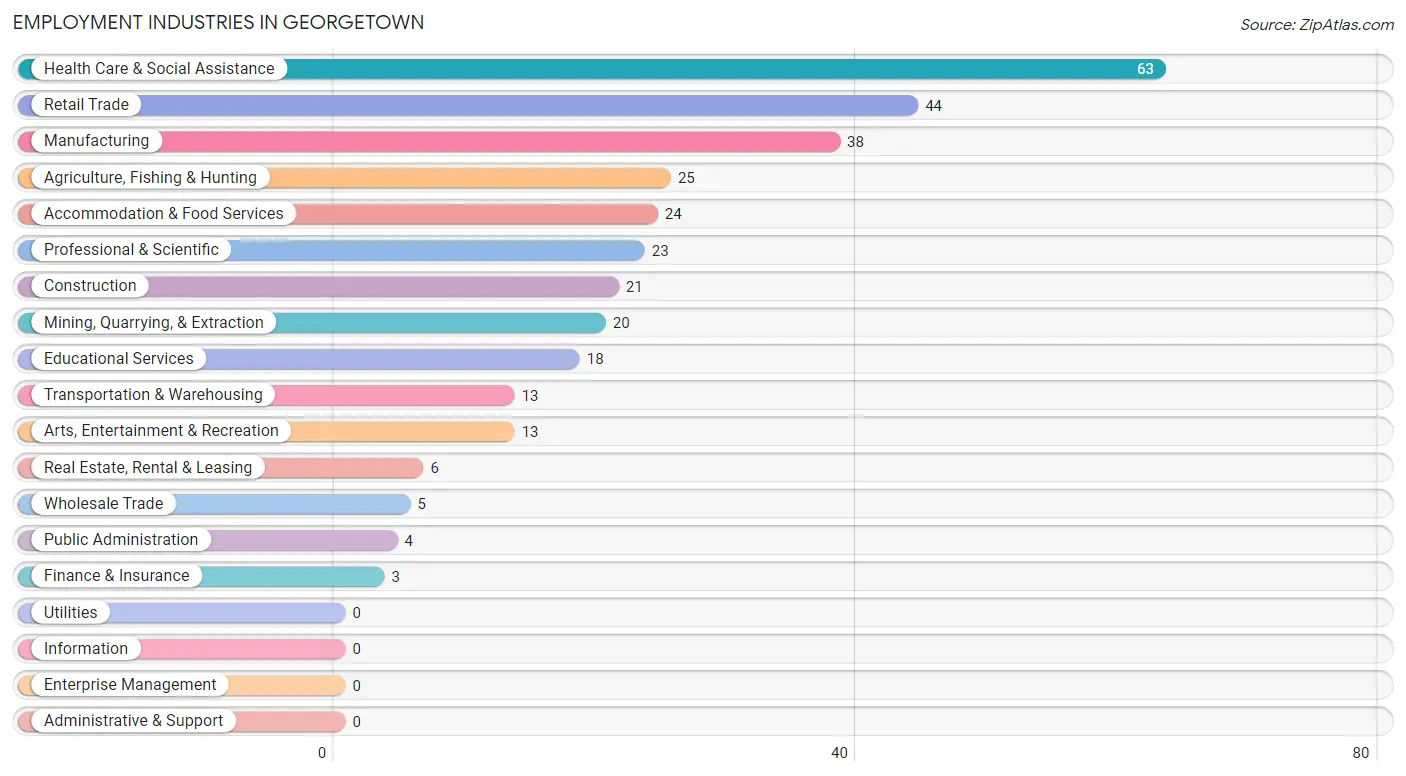
Employment Industries in Georgetown
The major employment industries in Georgetown include Health Care & Social Assistance (63 | 18.4%), Retail Trade (44 | 12.8%), Manufacturing (38 | 11.1%), Agriculture, Fishing & Hunting (25 | 7.3%), and Accommodation & Food Services (24 | 7.0%).
Employment Industries by Sex in Georgetown
The Georgetown industries that see more men than women are Agriculture, Fishing & Hunting (100.0%), Construction (100.0%), and Finance & Insurance (100.0%), whereas the industries that tend to have a higher number of women are Real Estate, Rental & Leasing (100.0%), Health Care & Social Assistance (100.0%), and Accommodation & Food Services (100.0%).
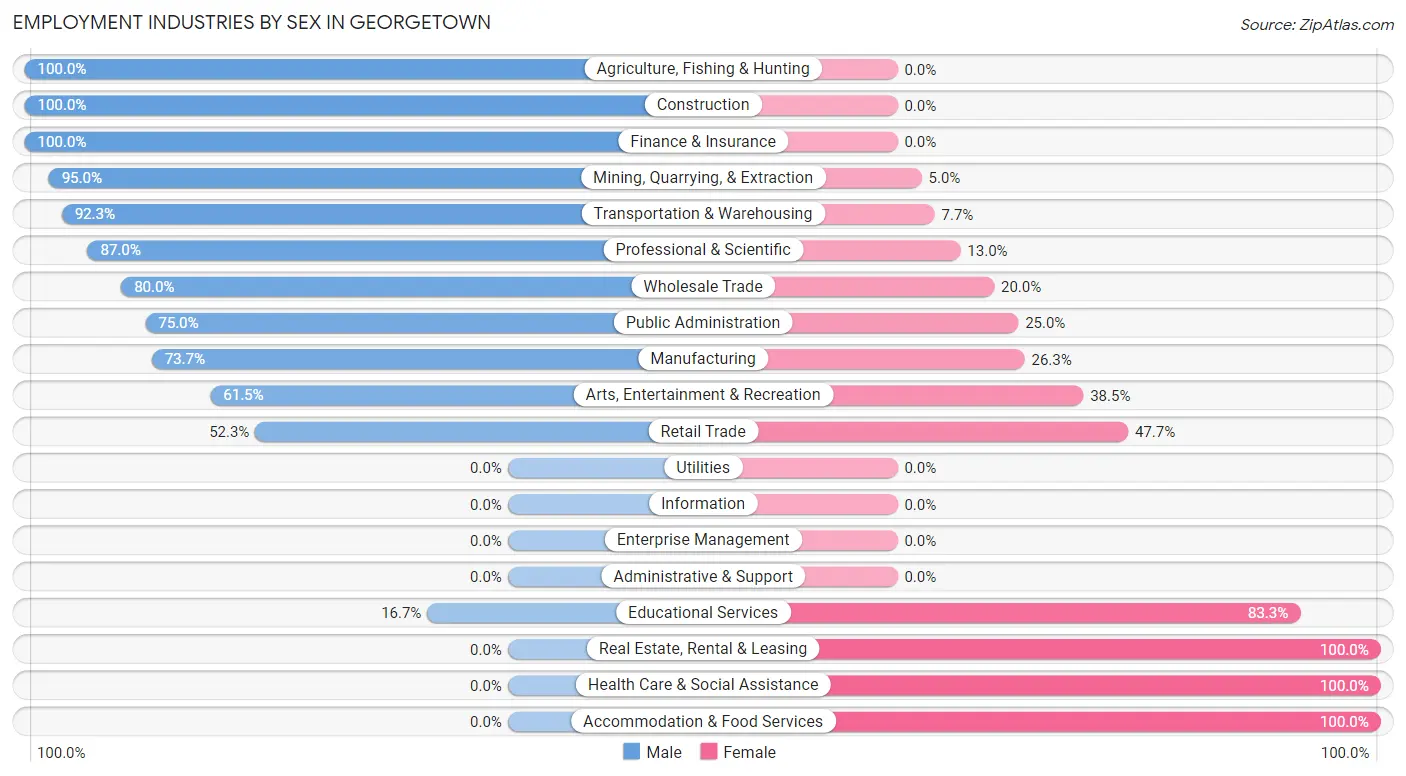
| Industry | Male | Female |
| Agriculture, Fishing & Hunting | 25 (100.0%) | 0 (0.0%) |
| Mining, Quarrying, & Extraction | 19 (95.0%) | 1 (5.0%) |
| Construction | 21 (100.0%) | 0 (0.0%) |
| Manufacturing | 28 (73.7%) | 10 (26.3%) |
| Wholesale Trade | 4 (80.0%) | 1 (20.0%) |
| Retail Trade | 23 (52.3%) | 21 (47.7%) |
| Transportation & Warehousing | 12 (92.3%) | 1 (7.7%) |
| Utilities | 0 (0.0%) | 0 (0.0%) |
| Information | 0 (0.0%) | 0 (0.0%) |
| Finance & Insurance | 3 (100.0%) | 0 (0.0%) |
| Real Estate, Rental & Leasing | 0 (0.0%) | 6 (100.0%) |
| Professional & Scientific | 20 (87.0%) | 3 (13.0%) |
| Enterprise Management | 0 (0.0%) | 0 (0.0%) |
| Administrative & Support | 0 (0.0%) | 0 (0.0%) |
| Educational Services | 3 (16.7%) | 15 (83.3%) |
| Health Care & Social Assistance | 0 (0.0%) | 63 (100.0%) |
| Arts, Entertainment & Recreation | 8 (61.5%) | 5 (38.5%) |
| Accommodation & Food Services | 0 (0.0%) | 24 (100.0%) |
| Public Administration | 3 (75.0%) | 1 (25.0%) |
| Total | 190 (55.4%) | 153 (44.6%) |
Education in Georgetown
School Enrollment in Georgetown
The most common levels of schooling among the 310 students in Georgetown are high school (129 | 41.6%), elementary school (59 | 19.0%), and middle school (50 | 16.1%).
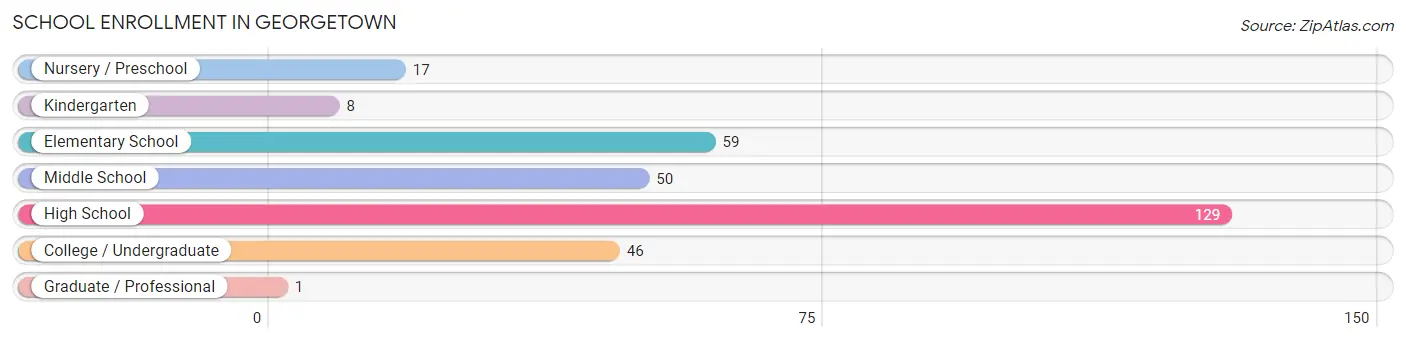
| School Level | # Students | % Students |
| Nursery / Preschool | 17 | 5.5% |
| Kindergarten | 8 | 2.6% |
| Elementary School | 59 | 19.0% |
| Middle School | 50 | 16.1% |
| High School | 129 | 41.6% |
| College / Undergraduate | 46 | 14.8% |
| Graduate / Professional | 1 | 0.3% |
| Total | 310 | 100.0% |
School Enrollment by Age by Funding Source in Georgetown
Out of a total of 310 students who are enrolled in schools in Georgetown, 30 (9.7%) attend a private institution, while the remaining 280 (90.3%) are enrolled in public schools. The age group of 35 years and over has the highest likelihood of being enrolled in private schools, with 2 (100.0% in the age bracket) enrolled. Conversely, the age group of 3 to 4 year olds has the lowest likelihood of being enrolled in a private school, with 6 (100.0% in the age bracket) attending a public institution.
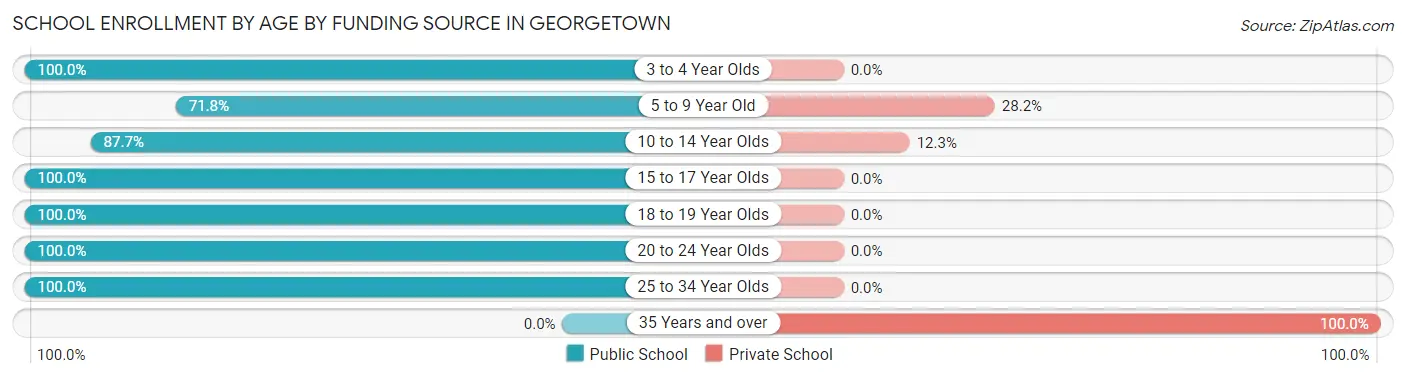
| Age Bracket | Public School | Private School |
| 3 to 4 Year Olds | 6 (100.0%) | 0 (0.0%) |
| 5 to 9 Year Old | 51 (71.8%) | 20 (28.2%) |
| 10 to 14 Year Olds | 57 (87.7%) | 8 (12.3%) |
| 15 to 17 Year Olds | 84 (100.0%) | 0 (0.0%) |
| 18 to 19 Year Olds | 37 (100.0%) | 0 (0.0%) |
| 20 to 24 Year Olds | 31 (100.0%) | 0 (0.0%) |
| 25 to 34 Year Olds | 14 (100.0%) | 0 (0.0%) |
| 35 Years and over | 0 (0.0%) | 2 (100.0%) |
| Total | 280 (90.3%) | 30 (9.7%) |
Educational Attainment by Field of Study in Georgetown
Literature & languages (28 | 37.8%), science & technology (10 | 13.5%), social sciences (8 | 10.8%), engineering (6 | 8.1%), and business (6 | 8.1%) are the most common fields of study among 74 individuals in Georgetown who have obtained a bachelor's degree or higher.
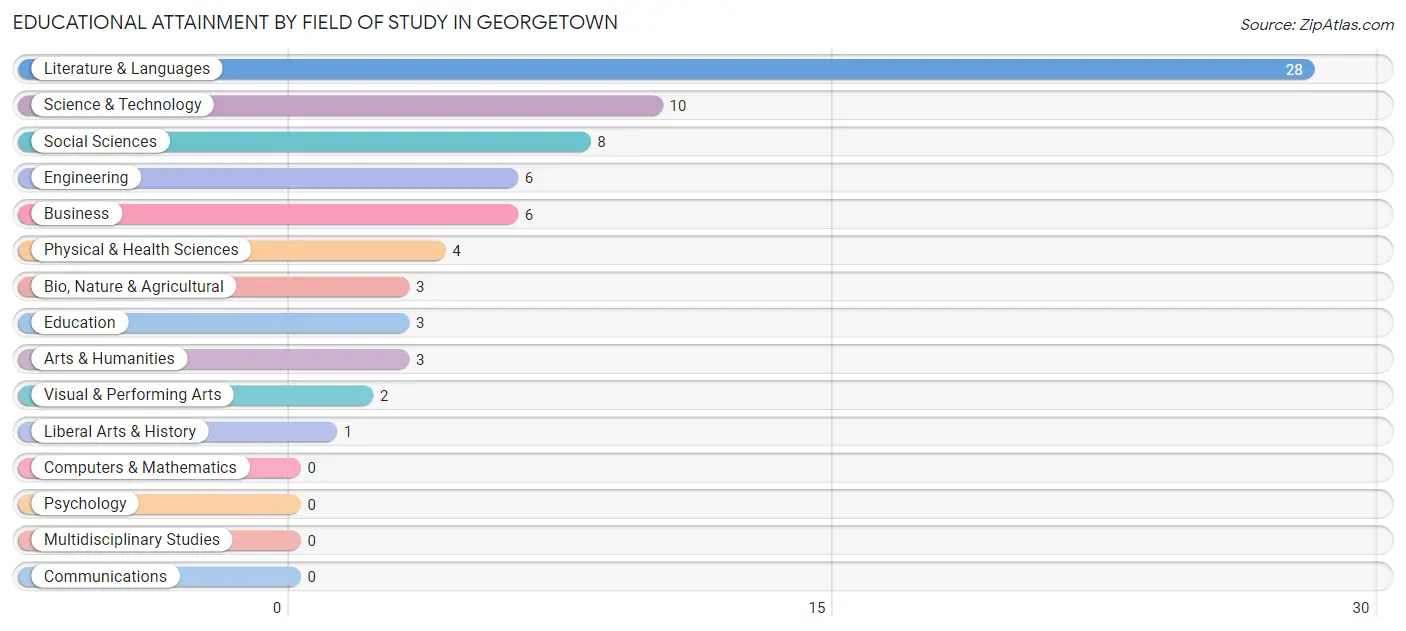
| Field of Study | # Graduates | % Graduates |
| Computers & Mathematics | 0 | 0.0% |
| Bio, Nature & Agricultural | 3 | 4.1% |
| Physical & Health Sciences | 4 | 5.4% |
| Psychology | 0 | 0.0% |
| Social Sciences | 8 | 10.8% |
| Engineering | 6 | 8.1% |
| Multidisciplinary Studies | 0 | 0.0% |
| Science & Technology | 10 | 13.5% |
| Business | 6 | 8.1% |
| Education | 3 | 4.1% |
| Literature & Languages | 28 | 37.8% |
| Liberal Arts & History | 1 | 1.3% |
| Visual & Performing Arts | 2 | 2.7% |
| Communications | 0 | 0.0% |
| Arts & Humanities | 3 | 4.1% |
| Total | 74 | 100.0% |
Transportation & Commute in Georgetown
Vehicle Availability by Sex in Georgetown
The most prevalent vehicle ownership categories in Georgetown are males with 5 or more vehicles (67, accounting for 36.4%) and females with 5 or more vehicles (22, making up 43.8%).
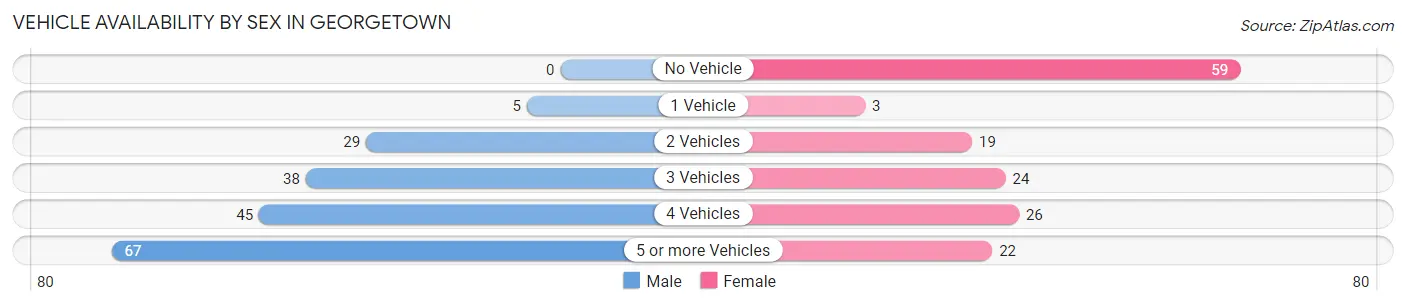
| Vehicles Available | Male | Female |
| No Vehicle | 0 (0.0%) | 59 (38.6%) |
| 1 Vehicle | 5 (2.7%) | 3 (2.0%) |
| 2 Vehicles | 29 (15.8%) | 19 (12.4%) |
| 3 Vehicles | 38 (20.6%) | 24 (15.7%) |
| 4 Vehicles | 45 (24.5%) | 26 (17.0%) |
| 5 or more Vehicles | 67 (36.4%) | 22 (14.4%) |
| Total | 184 (100.0%) | 153 (100.0%) |
Commute Time in Georgetown
The most frequently occuring commute durations in Georgetown are 15 to 19 minutes (106 commuters, 32.8%), 60 to 89 minutes (57 commuters, 17.6%), and 30 to 34 minutes (31 commuters, 9.6%).
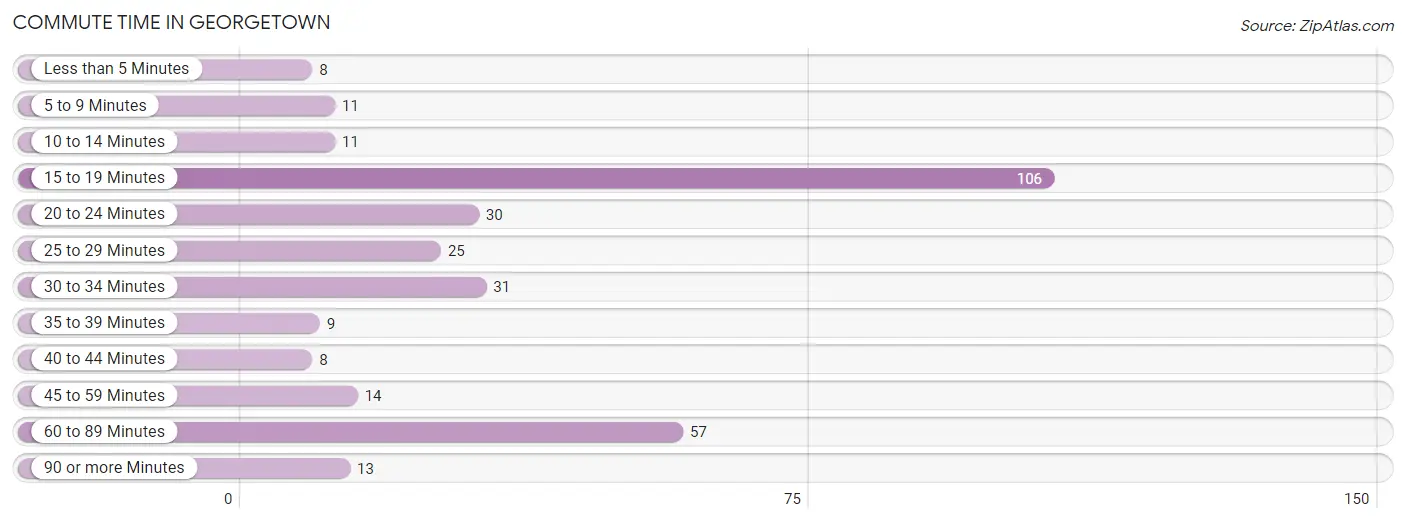
| Commute Time | # Commuters | % Commuters |
| Less than 5 Minutes | 8 | 2.5% |
| 5 to 9 Minutes | 11 | 3.4% |
| 10 to 14 Minutes | 11 | 3.4% |
| 15 to 19 Minutes | 106 | 32.8% |
| 20 to 24 Minutes | 30 | 9.3% |
| 25 to 29 Minutes | 25 | 7.7% |
| 30 to 34 Minutes | 31 | 9.6% |
| 35 to 39 Minutes | 9 | 2.8% |
| 40 to 44 Minutes | 8 | 2.5% |
| 45 to 59 Minutes | 14 | 4.3% |
| 60 to 89 Minutes | 57 | 17.6% |
| 90 or more Minutes | 13 | 4.0% |
Commute Time by Sex in Georgetown
The most common commute times in Georgetown are 60 to 89 minutes (49 commuters, 27.2%) for males and 15 to 19 minutes (88 commuters, 61.5%) for females.
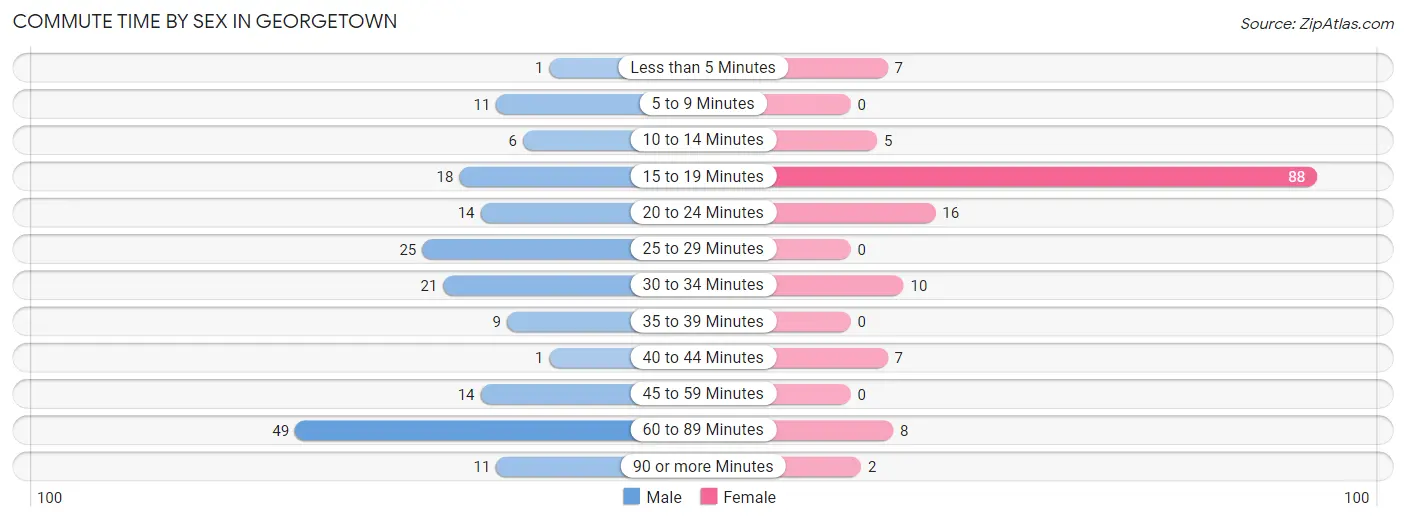
| Commute Time | Male | Female |
| Less than 5 Minutes | 1 (0.6%) | 7 (4.9%) |
| 5 to 9 Minutes | 11 (6.1%) | 0 (0.0%) |
| 10 to 14 Minutes | 6 (3.3%) | 5 (3.5%) |
| 15 to 19 Minutes | 18 (10.0%) | 88 (61.5%) |
| 20 to 24 Minutes | 14 (7.8%) | 16 (11.2%) |
| 25 to 29 Minutes | 25 (13.9%) | 0 (0.0%) |
| 30 to 34 Minutes | 21 (11.7%) | 10 (7.0%) |
| 35 to 39 Minutes | 9 (5.0%) | 0 (0.0%) |
| 40 to 44 Minutes | 1 (0.6%) | 7 (4.9%) |
| 45 to 59 Minutes | 14 (7.8%) | 0 (0.0%) |
| 60 to 89 Minutes | 49 (27.2%) | 8 (5.6%) |
| 90 or more Minutes | 11 (6.1%) | 2 (1.4%) |
Time of Departure to Work by Sex in Georgetown
The most frequent times of departure to work in Georgetown are 12:00 AM to 4:59 AM (57, 31.7%) for males and 6:30 AM to 6:59 AM (37, 25.9%) for females.
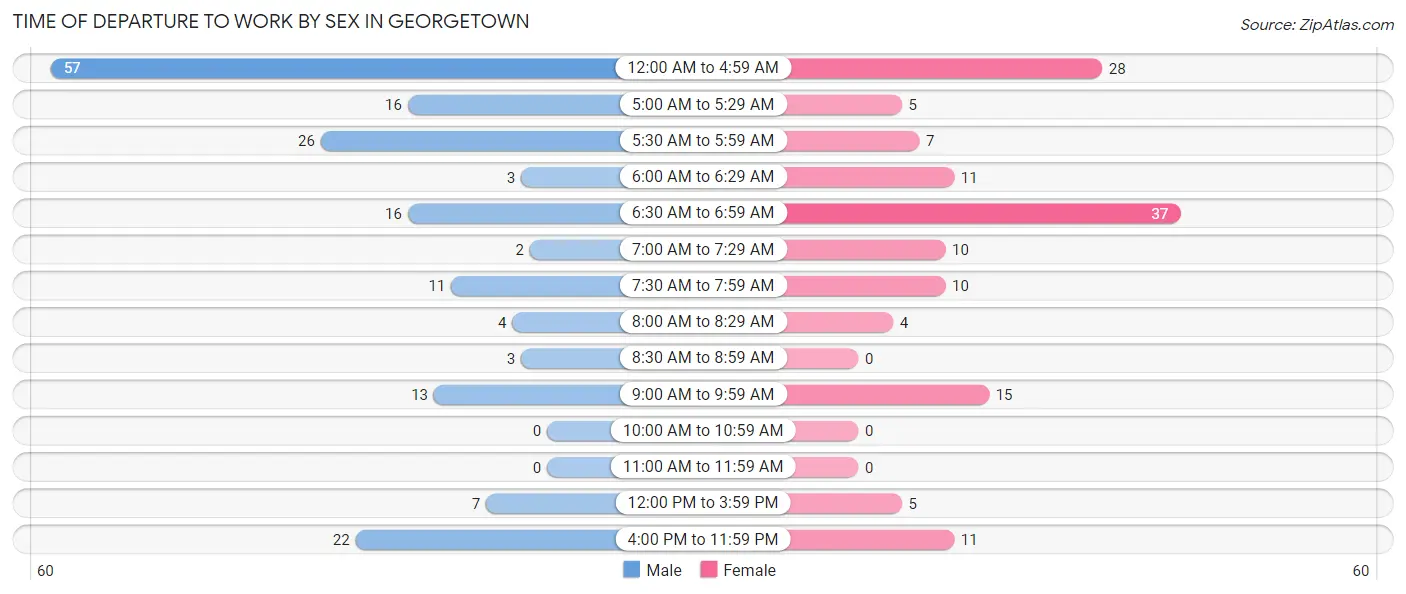
| Time of Departure | Male | Female |
| 12:00 AM to 4:59 AM | 57 (31.7%) | 28 (19.6%) |
| 5:00 AM to 5:29 AM | 16 (8.9%) | 5 (3.5%) |
| 5:30 AM to 5:59 AM | 26 (14.4%) | 7 (4.9%) |
| 6:00 AM to 6:29 AM | 3 (1.7%) | 11 (7.7%) |
| 6:30 AM to 6:59 AM | 16 (8.9%) | 37 (25.9%) |
| 7:00 AM to 7:29 AM | 2 (1.1%) | 10 (7.0%) |
| 7:30 AM to 7:59 AM | 11 (6.1%) | 10 (7.0%) |
| 8:00 AM to 8:29 AM | 4 (2.2%) | 4 (2.8%) |
| 8:30 AM to 8:59 AM | 3 (1.7%) | 0 (0.0%) |
| 9:00 AM to 9:59 AM | 13 (7.2%) | 15 (10.5%) |
| 10:00 AM to 10:59 AM | 0 (0.0%) | 0 (0.0%) |
| 11:00 AM to 11:59 AM | 0 (0.0%) | 0 (0.0%) |
| 12:00 PM to 3:59 PM | 7 (3.9%) | 5 (3.5%) |
| 4:00 PM to 11:59 PM | 22 (12.2%) | 11 (7.7%) |
| Total | 180 (100.0%) | 143 (100.0%) |
Housing Occupancy in Georgetown
Occupancy by Ownership in Georgetown
Of the total 187 dwellings in Georgetown, owner-occupied units account for 172 (92.0%), while renter-occupied units make up 15 (8.0%).
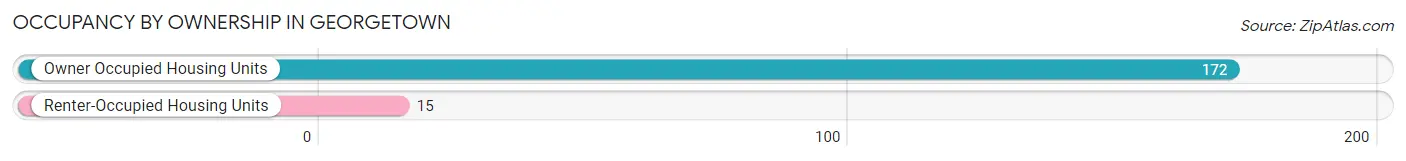
| Occupancy | # Housing Units | % Housing Units |
| Owner Occupied Housing Units | 172 | 92.0% |
| Renter-Occupied Housing Units | 15 | 8.0% |
| Total Occupied Housing Units | 187 | 100.0% |
Occupancy by Household Size in Georgetown
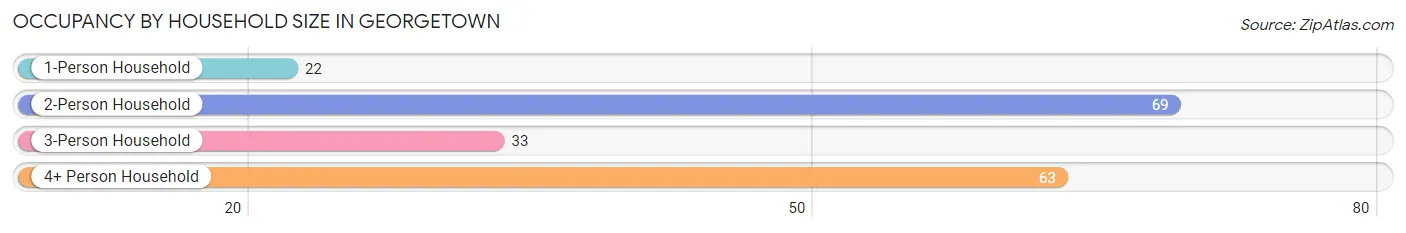
| Household Size | # Housing Units | % Housing Units |
| 1-Person Household | 22 | 11.8% |
| 2-Person Household | 69 | 36.9% |
| 3-Person Household | 33 | 17.6% |
| 4+ Person Household | 63 | 33.7% |
| Total Housing Units | 187 | 100.0% |
Occupancy by Ownership by Household Size in Georgetown
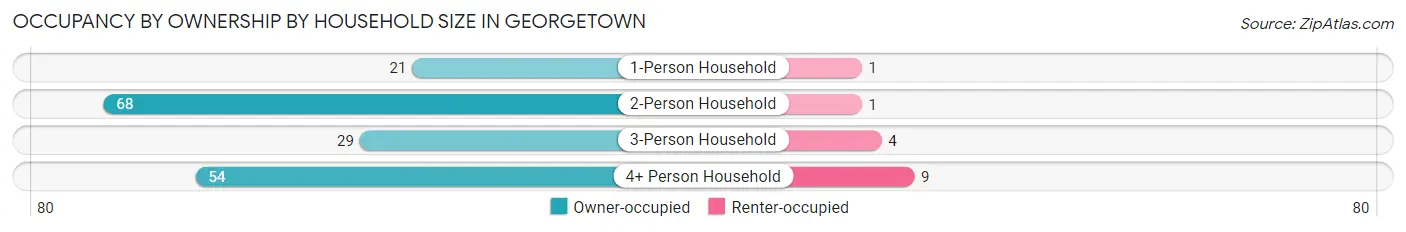
| Household Size | Owner-occupied | Renter-occupied |
| 1-Person Household | 21 (95.5%) | 1 (4.5%) |
| 2-Person Household | 68 (98.6%) | 1 (1.5%) |
| 3-Person Household | 29 (87.9%) | 4 (12.1%) |
| 4+ Person Household | 54 (85.7%) | 9 (14.3%) |
| Total Housing Units | 172 (92.0%) | 15 (8.0%) |
Occupancy by Educational Attainment in Georgetown
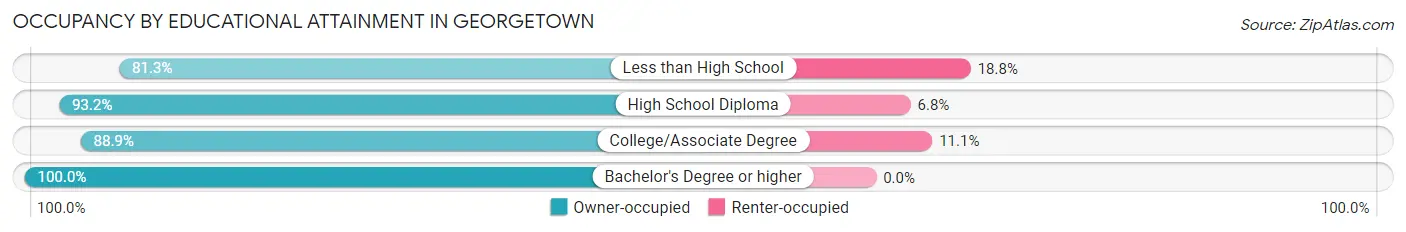
| Household Size | Owner-occupied | Renter-occupied |
| Less than High School | 13 (81.2%) | 3 (18.8%) |
| High School Diploma | 82 (93.2%) | 6 (6.8%) |
| College/Associate Degree | 48 (88.9%) | 6 (11.1%) |
| Bachelor's Degree or higher | 29 (100.0%) | 0 (0.0%) |
Occupancy by Age of Householder in Georgetown
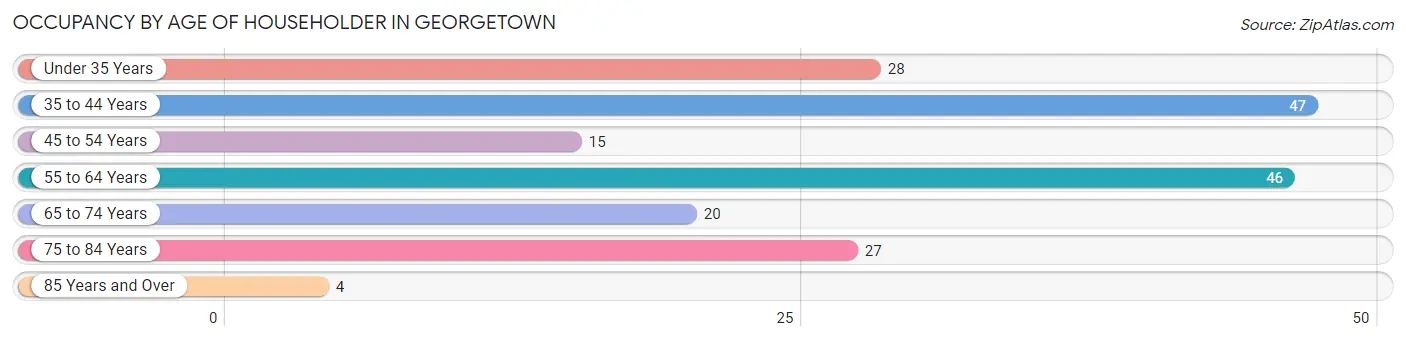
| Age Bracket | # Households | % Households |
| Under 35 Years | 28 | 15.0% |
| 35 to 44 Years | 47 | 25.1% |
| 45 to 54 Years | 15 | 8.0% |
| 55 to 64 Years | 46 | 24.6% |
| 65 to 74 Years | 20 | 10.7% |
| 75 to 84 Years | 27 | 14.4% |
| 85 Years and Over | 4 | 2.1% |
| Total | 187 | 100.0% |
Housing Finances in Georgetown
Median Income by Occupancy in Georgetown
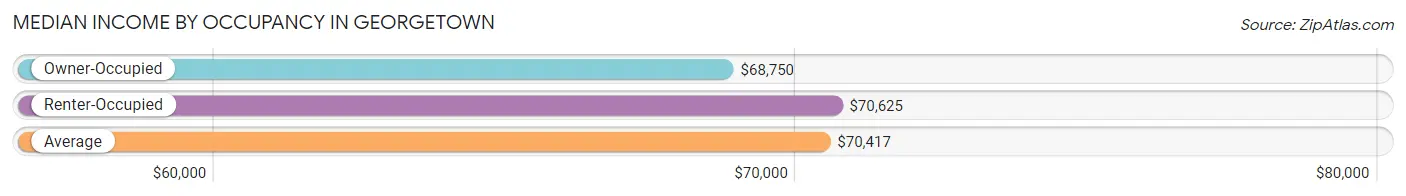
| Occupancy Type | # Households | Median Income |
| Owner-Occupied | 172 (92.0%) | $68,750 |
| Renter-Occupied | 15 (8.0%) | $70,625 |
| Average | 187 (100.0%) | $70,417 |
Occupancy by Householder Income Bracket in Georgetown
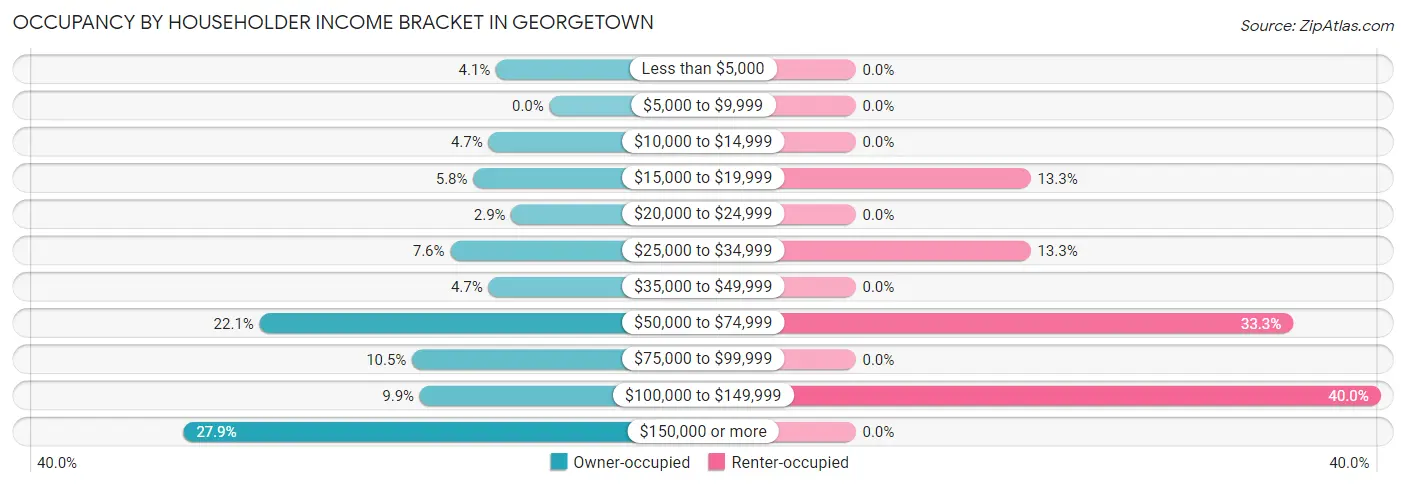
| Income Bracket | Owner-occupied | Renter-occupied |
| Less than $5,000 | 7 (4.1%) | 0 (0.0%) |
| $5,000 to $9,999 | 0 (0.0%) | 0 (0.0%) |
| $10,000 to $14,999 | 8 (4.6%) | 0 (0.0%) |
| $15,000 to $19,999 | 10 (5.8%) | 2 (13.3%) |
| $20,000 to $24,999 | 5 (2.9%) | 0 (0.0%) |
| $25,000 to $34,999 | 13 (7.6%) | 2 (13.3%) |
| $35,000 to $49,999 | 8 (4.6%) | 0 (0.0%) |
| $50,000 to $74,999 | 38 (22.1%) | 5 (33.3%) |
| $75,000 to $99,999 | 18 (10.5%) | 0 (0.0%) |
| $100,000 to $149,999 | 17 (9.9%) | 6 (40.0%) |
| $150,000 or more | 48 (27.9%) | 0 (0.0%) |
| Total | 172 (100.0%) | 15 (100.0%) |
Monthly Housing Cost Tiers in Georgetown
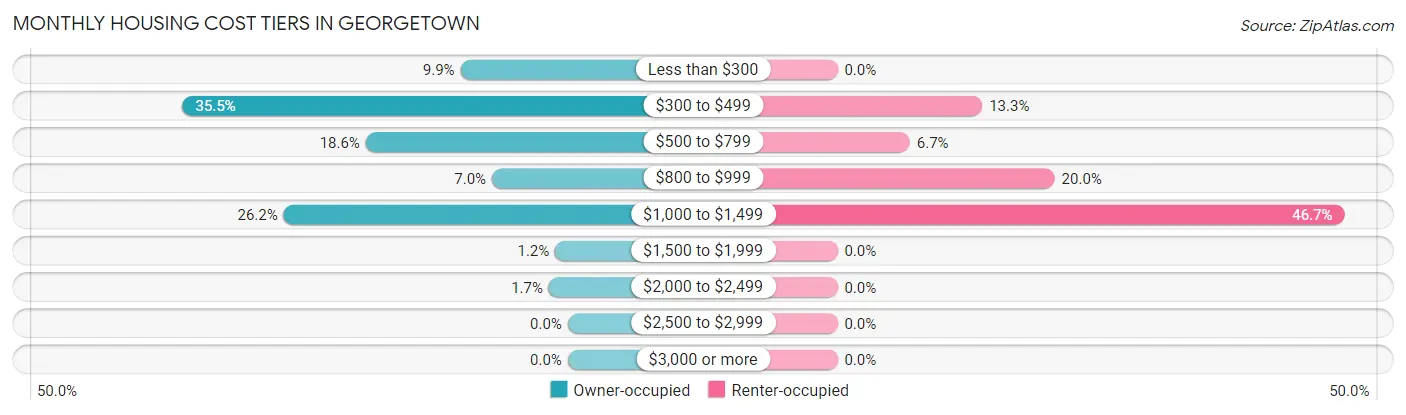
| Monthly Cost | Owner-occupied | Renter-occupied |
| Less than $300 | 17 (9.9%) | 0 (0.0%) |
| $300 to $499 | 61 (35.5%) | 2 (13.3%) |
| $500 to $799 | 32 (18.6%) | 1 (6.7%) |
| $800 to $999 | 12 (7.0%) | 3 (20.0%) |
| $1,000 to $1,499 | 45 (26.2%) | 7 (46.7%) |
| $1,500 to $1,999 | 2 (1.2%) | 0 (0.0%) |
| $2,000 to $2,499 | 3 (1.7%) | 0 (0.0%) |
| $2,500 to $2,999 | 0 (0.0%) | 0 (0.0%) |
| $3,000 or more | 0 (0.0%) | 0 (0.0%) |
| Total | 172 (100.0%) | 15 (100.0%) |
Physical Housing Characteristics in Georgetown
Housing Structures in Georgetown

| Structure Type | # Housing Units | % Housing Units |
| Single Unit, Detached | 168 | 89.8% |
| Single Unit, Attached | 0 | 0.0% |
| 2 Unit Apartments | 0 | 0.0% |
| 3 or 4 Unit Apartments | 0 | 0.0% |
| 5 to 9 Unit Apartments | 0 | 0.0% |
| 10 or more Apartments | 0 | 0.0% |
| Mobile Home / Other | 19 | 10.2% |
| Total | 187 | 100.0% |
Housing Structures by Occupancy in Georgetown
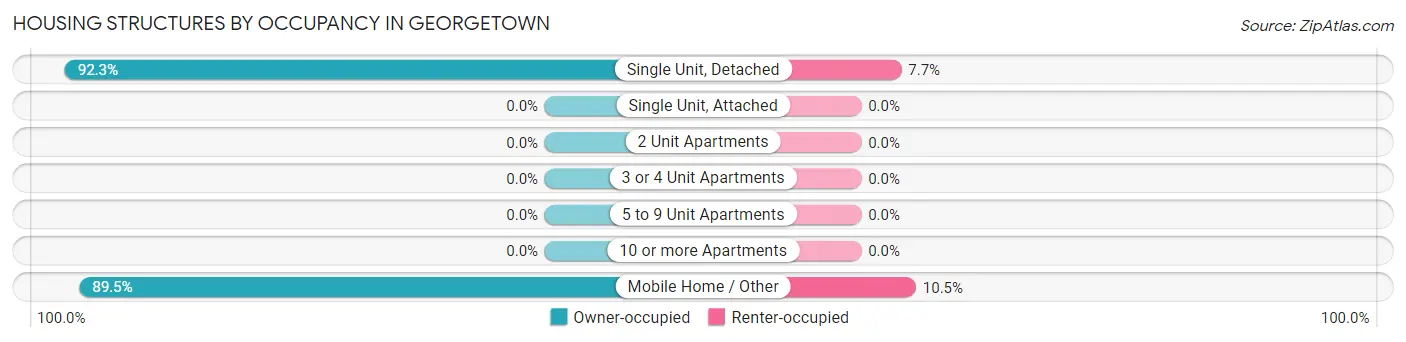
| Structure Type | Owner-occupied | Renter-occupied |
| Single Unit, Detached | 155 (92.3%) | 13 (7.7%) |
| Single Unit, Attached | 0 (0.0%) | 0 (0.0%) |
| 2 Unit Apartments | 0 (0.0%) | 0 (0.0%) |
| 3 or 4 Unit Apartments | 0 (0.0%) | 0 (0.0%) |
| 5 to 9 Unit Apartments | 0 (0.0%) | 0 (0.0%) |
| 10 or more Apartments | 0 (0.0%) | 0 (0.0%) |
| Mobile Home / Other | 17 (89.5%) | 2 (10.5%) |
| Total | 172 (92.0%) | 15 (8.0%) |
Housing Structures by Number of Rooms in Georgetown
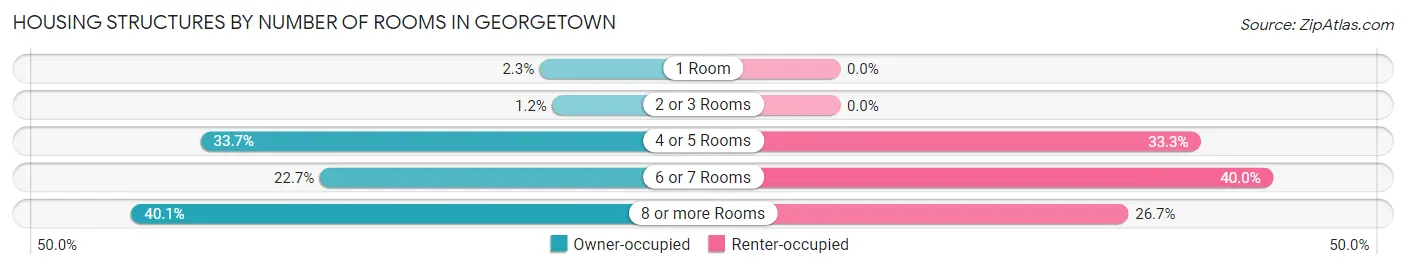
| Number of Rooms | Owner-occupied | Renter-occupied |
| 1 Room | 4 (2.3%) | 0 (0.0%) |
| 2 or 3 Rooms | 2 (1.2%) | 0 (0.0%) |
| 4 or 5 Rooms | 58 (33.7%) | 5 (33.3%) |
| 6 or 7 Rooms | 39 (22.7%) | 6 (40.0%) |
| 8 or more Rooms | 69 (40.1%) | 4 (26.7%) |
| Total | 172 (100.0%) | 15 (100.0%) |
Housing Structure by Heating Type in Georgetown
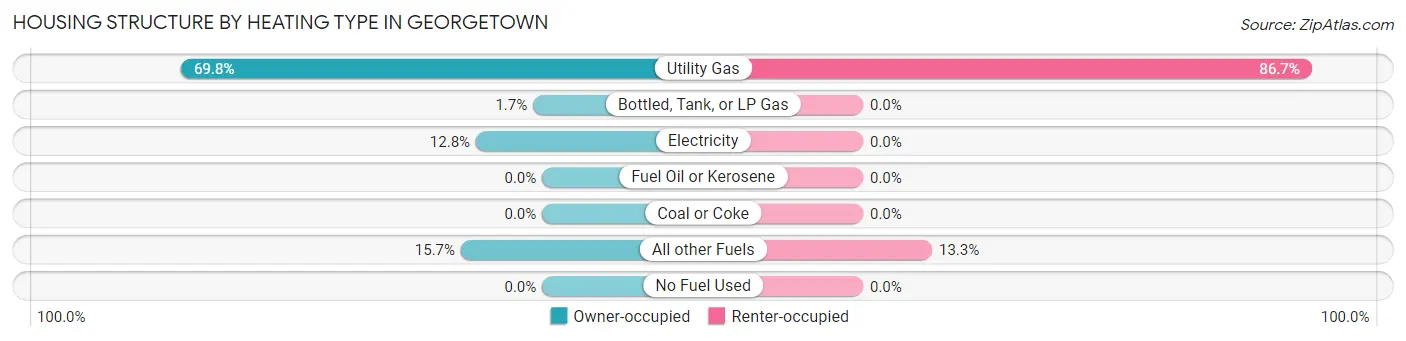
| Heating Type | Owner-occupied | Renter-occupied |
| Utility Gas | 120 (69.8%) | 13 (86.7%) |
| Bottled, Tank, or LP Gas | 3 (1.7%) | 0 (0.0%) |
| Electricity | 22 (12.8%) | 0 (0.0%) |
| Fuel Oil or Kerosene | 0 (0.0%) | 0 (0.0%) |
| Coal or Coke | 0 (0.0%) | 0 (0.0%) |
| All other Fuels | 27 (15.7%) | 2 (13.3%) |
| No Fuel Used | 0 (0.0%) | 0 (0.0%) |
| Total | 172 (100.0%) | 15 (100.0%) |
Household Vehicle Usage in Georgetown
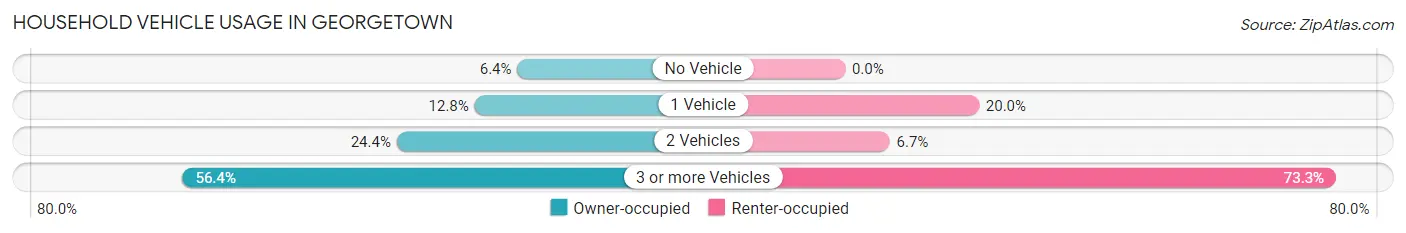
| Vehicles per Household | Owner-occupied | Renter-occupied |
| No Vehicle | 11 (6.4%) | 0 (0.0%) |
| 1 Vehicle | 22 (12.8%) | 3 (20.0%) |
| 2 Vehicles | 42 (24.4%) | 1 (6.7%) |
| 3 or more Vehicles | 97 (56.4%) | 11 (73.3%) |
| Total | 172 (100.0%) | 15 (100.0%) |
Real Estate & Mortgages in Georgetown
Real Estate and Mortgage Overview in Georgetown
| Characteristic | Without Mortgage | With Mortgage |
| Housing Units | 87 | 85 |
| Median Property Value | $124,300 | $178,100 |
| Median Household Income | $74,375 | $23 |
| Monthly Housing Costs | $354 | $0 |
| Real Estate Taxes | $741 | $2 |
Property Value by Mortgage Status in Georgetown
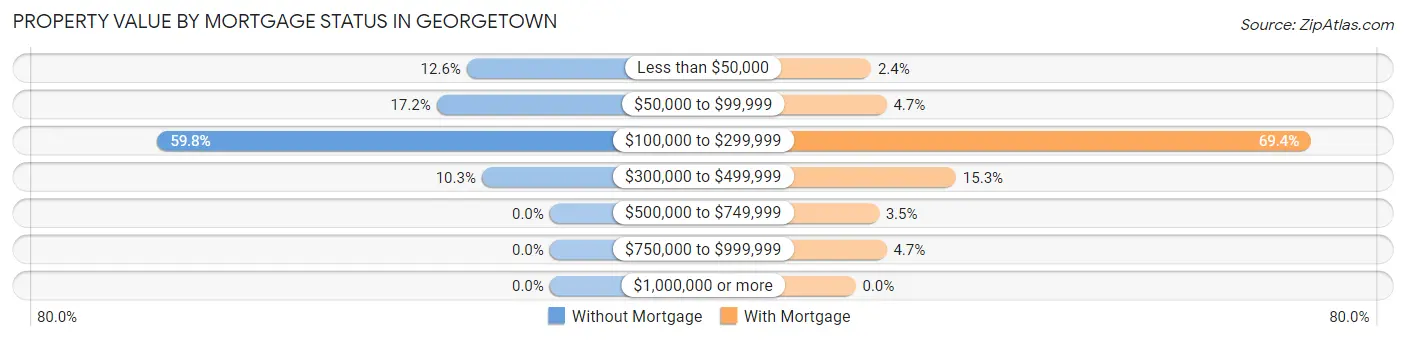
| Property Value | Without Mortgage | With Mortgage |
| Less than $50,000 | 11 (12.6%) | 2 (2.4%) |
| $50,000 to $99,999 | 15 (17.2%) | 4 (4.7%) |
| $100,000 to $299,999 | 52 (59.8%) | 59 (69.4%) |
| $300,000 to $499,999 | 9 (10.3%) | 13 (15.3%) |
| $500,000 to $749,999 | 0 (0.0%) | 3 (3.5%) |
| $750,000 to $999,999 | 0 (0.0%) | 4 (4.7%) |
| $1,000,000 or more | 0 (0.0%) | 0 (0.0%) |
| Total | 87 (100.0%) | 85 (100.0%) |
Household Income by Mortgage Status in Georgetown
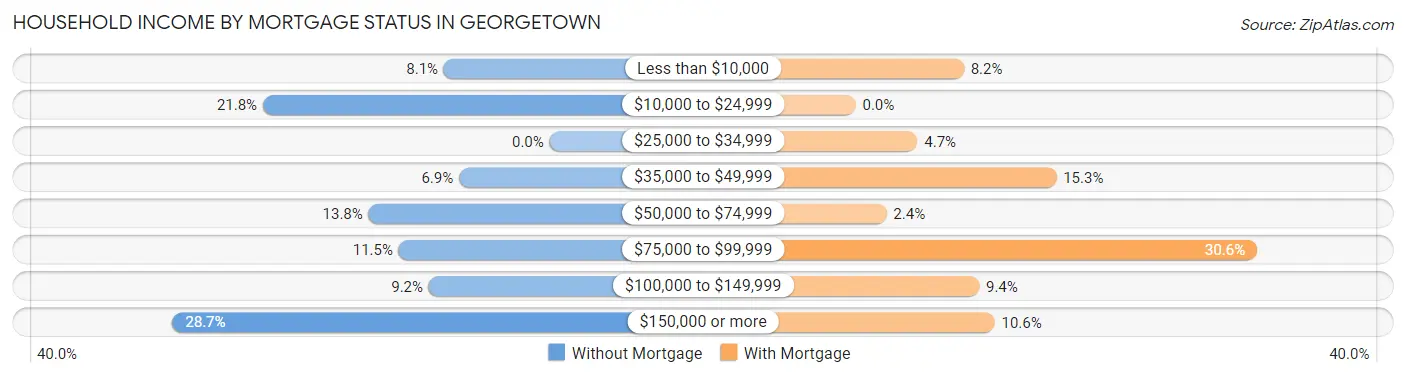
| Household Income | Without Mortgage | With Mortgage |
| Less than $10,000 | 7 (8.1%) | 7 (8.2%) |
| $10,000 to $24,999 | 19 (21.8%) | 0 (0.0%) |
| $25,000 to $34,999 | 0 (0.0%) | 4 (4.7%) |
| $35,000 to $49,999 | 6 (6.9%) | 13 (15.3%) |
| $50,000 to $74,999 | 12 (13.8%) | 2 (2.4%) |
| $75,000 to $99,999 | 10 (11.5%) | 26 (30.6%) |
| $100,000 to $149,999 | 8 (9.2%) | 8 (9.4%) |
| $150,000 or more | 25 (28.7%) | 9 (10.6%) |
| Total | 87 (100.0%) | 85 (100.0%) |
Property Value to Household Income Ratio in Georgetown
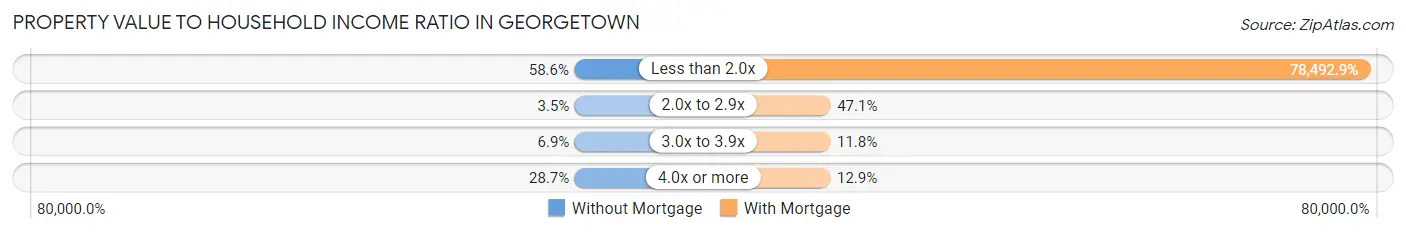
| Value-to-Income Ratio | Without Mortgage | With Mortgage |
| Less than 2.0x | 51 (58.6%) | 66,719 (78,492.9%) |
| 2.0x to 2.9x | 3 (3.5%) | 40 (47.1%) |
| 3.0x to 3.9x | 6 (6.9%) | 10 (11.8%) |
| 4.0x or more | 25 (28.7%) | 11 (12.9%) |
| Total | 87 (100.0%) | 85 (100.0%) |
Real Estate Taxes by Mortgage Status in Georgetown
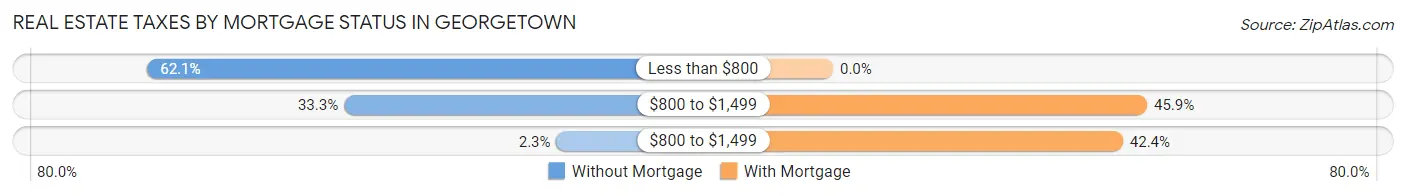
| Property Taxes | Without Mortgage | With Mortgage |
| Less than $800 | 54 (62.1%) | 0 (0.0%) |
| $800 to $1,499 | 29 (33.3%) | 39 (45.9%) |
| $800 to $1,499 | 2 (2.3%) | 36 (42.3%) |
| Total | 87 (100.0%) | 85 (100.0%) |
Health & Disability in Georgetown
Health Insurance Coverage by Age in Georgetown
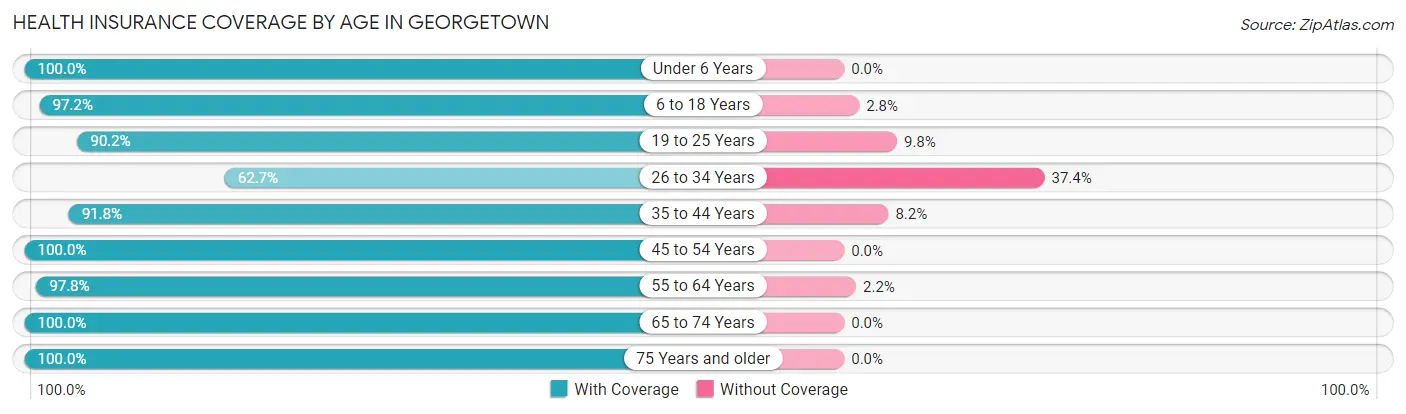
| Age Bracket | With Coverage | Without Coverage |
| Under 6 Years | 47 (100.0%) | 0 (0.0%) |
| 6 to 18 Years | 244 (97.2%) | 7 (2.8%) |
| 19 to 25 Years | 55 (90.2%) | 6 (9.8%) |
| 26 to 34 Years | 52 (62.6%) | 31 (37.3%) |
| 35 to 44 Years | 78 (91.8%) | 7 (8.2%) |
| 45 to 54 Years | 60 (100.0%) | 0 (0.0%) |
| 55 to 64 Years | 89 (97.8%) | 2 (2.2%) |
| 65 to 74 Years | 40 (100.0%) | 0 (0.0%) |
| 75 Years and older | 39 (100.0%) | 0 (0.0%) |
| Total | 704 (93.0%) | 53 (7.0%) |
Health Insurance Coverage by Citizenship Status in Georgetown
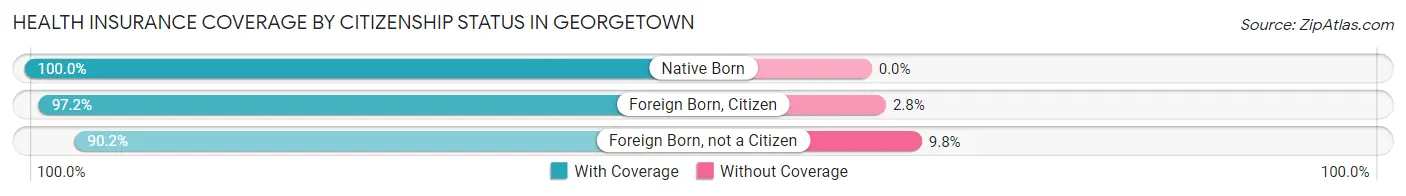
| Citizenship Status | With Coverage | Without Coverage |
| Native Born | 47 (100.0%) | 0 (0.0%) |
| Foreign Born, Citizen | 244 (97.2%) | 7 (2.8%) |
| Foreign Born, not a Citizen | 55 (90.2%) | 6 (9.8%) |
Health Insurance Coverage by Household Income in Georgetown
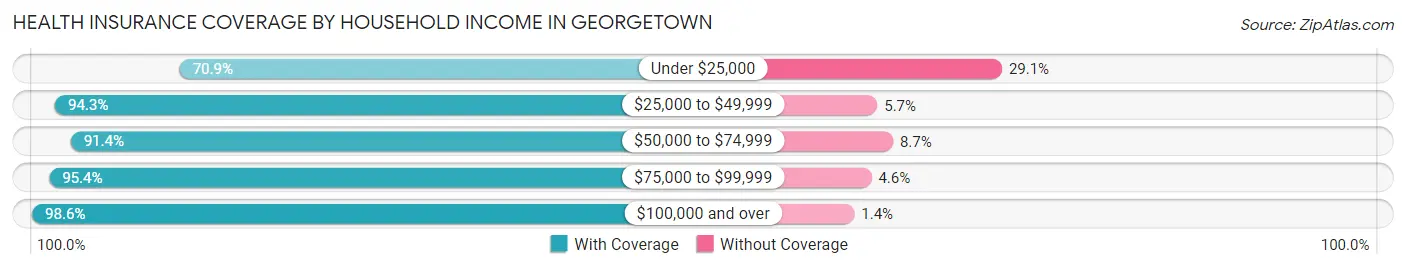
| Household Income | With Coverage | Without Coverage |
| Under $25,000 | 61 (70.9%) | 25 (29.1%) |
| $25,000 to $49,999 | 66 (94.3%) | 4 (5.7%) |
| $50,000 to $74,999 | 169 (91.3%) | 16 (8.6%) |
| $75,000 to $99,999 | 62 (95.4%) | 3 (4.6%) |
| $100,000 and over | 346 (98.6%) | 5 (1.4%) |
Public vs Private Health Insurance Coverage by Age in Georgetown
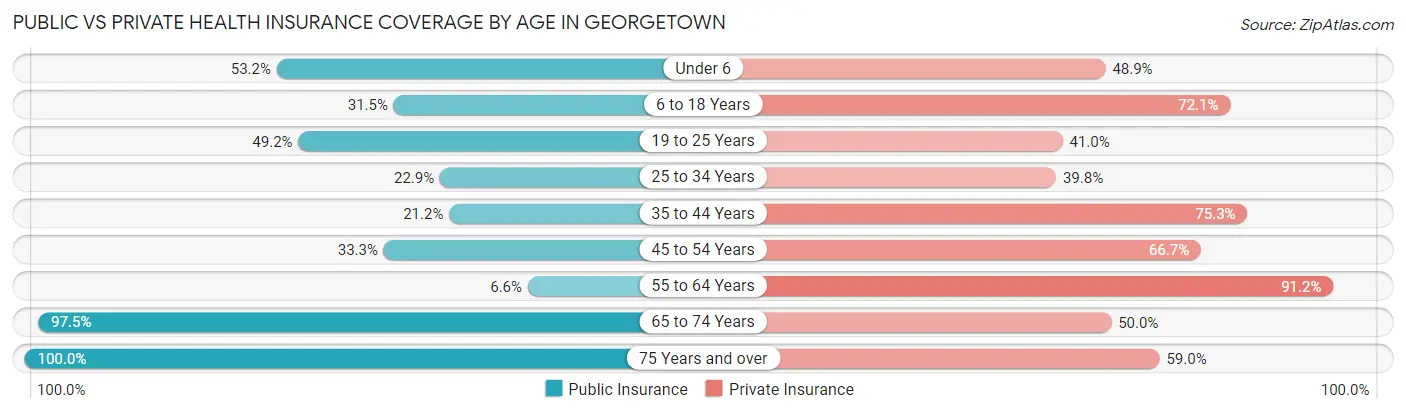
| Age Bracket | Public Insurance | Private Insurance |
| Under 6 | 25 (53.2%) | 23 (48.9%) |
| 6 to 18 Years | 79 (31.5%) | 181 (72.1%) |
| 19 to 25 Years | 30 (49.2%) | 25 (41.0%) |
| 25 to 34 Years | 19 (22.9%) | 33 (39.8%) |
| 35 to 44 Years | 18 (21.2%) | 64 (75.3%) |
| 45 to 54 Years | 20 (33.3%) | 40 (66.7%) |
| 55 to 64 Years | 6 (6.6%) | 83 (91.2%) |
| 65 to 74 Years | 39 (97.5%) | 20 (50.0%) |
| 75 Years and over | 39 (100.0%) | 23 (59.0%) |
| Total | 275 (36.3%) | 492 (65.0%) |
Disability Status by Sex by Age in Georgetown
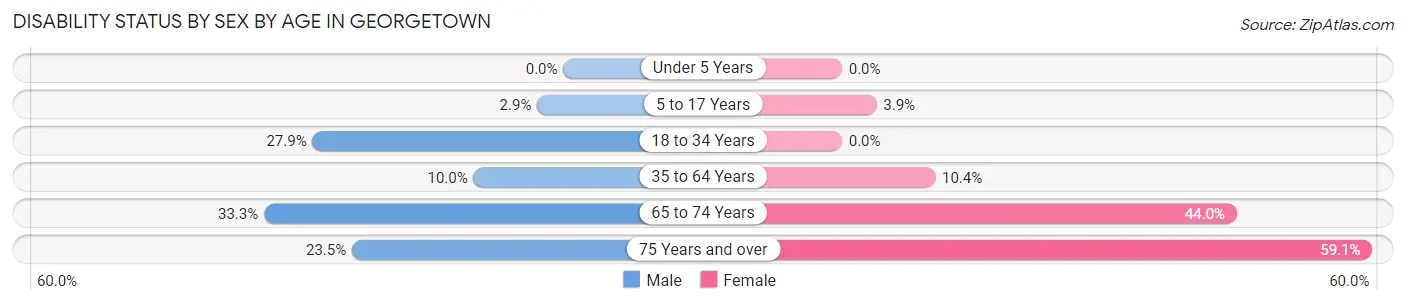
| Age Bracket | Male | Female |
| Under 5 Years | 0 (0.0%) | 0 (0.0%) |
| 5 to 17 Years | 3 (2.9%) | 5 (3.8%) |
| 18 to 34 Years | 19 (27.9%) | 0 (0.0%) |
| 35 to 64 Years | 13 (10.0%) | 11 (10.4%) |
| 65 to 74 Years | 5 (33.3%) | 11 (44.0%) |
| 75 Years and over | 4 (23.5%) | 13 (59.1%) |
Disability Class by Sex by Age in Georgetown
Disability Class: Hearing Difficulty
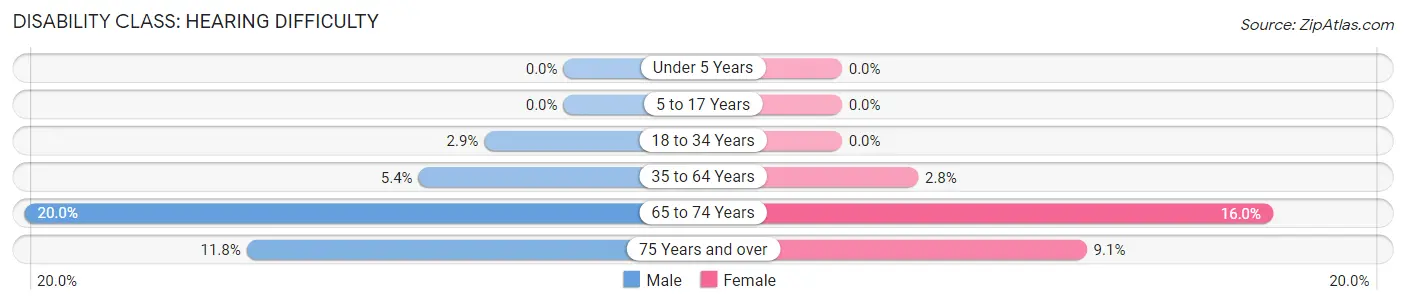
| Age Bracket | Male | Female |
| Under 5 Years | 0 (0.0%) | 0 (0.0%) |
| 5 to 17 Years | 0 (0.0%) | 0 (0.0%) |
| 18 to 34 Years | 2 (2.9%) | 0 (0.0%) |
| 35 to 64 Years | 7 (5.4%) | 3 (2.8%) |
| 65 to 74 Years | 3 (20.0%) | 4 (16.0%) |
| 75 Years and over | 2 (11.8%) | 2 (9.1%) |
Disability Class: Vision Difficulty
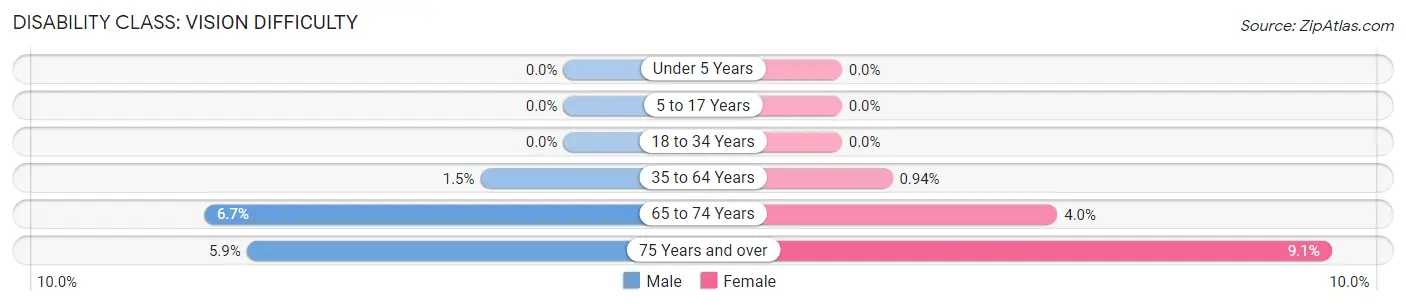
| Age Bracket | Male | Female |
| Under 5 Years | 0 (0.0%) | 0 (0.0%) |
| 5 to 17 Years | 0 (0.0%) | 0 (0.0%) |
| 18 to 34 Years | 0 (0.0%) | 0 (0.0%) |
| 35 to 64 Years | 2 (1.5%) | 1 (0.9%) |
| 65 to 74 Years | 1 (6.7%) | 1 (4.0%) |
| 75 Years and over | 1 (5.9%) | 2 (9.1%) |
Disability Class: Cognitive Difficulty
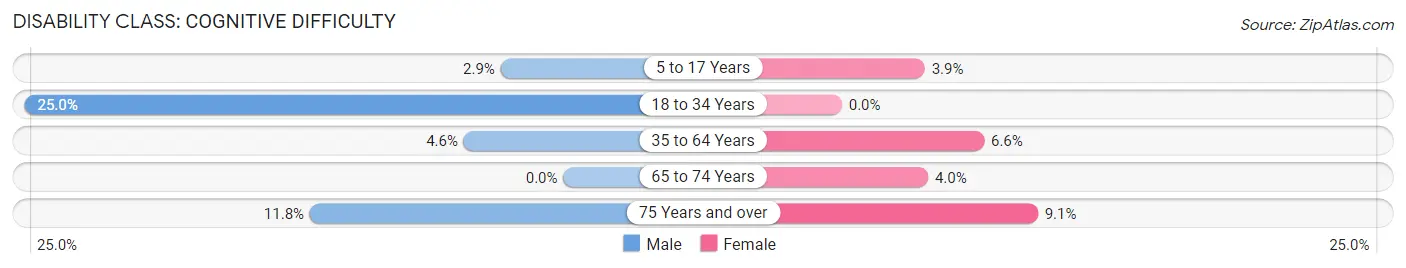
| Age Bracket | Male | Female |
| 5 to 17 Years | 3 (2.9%) | 5 (3.8%) |
| 18 to 34 Years | 17 (25.0%) | 0 (0.0%) |
| 35 to 64 Years | 6 (4.6%) | 7 (6.6%) |
| 65 to 74 Years | 0 (0.0%) | 1 (4.0%) |
| 75 Years and over | 2 (11.8%) | 2 (9.1%) |
Disability Class: Ambulatory Difficulty
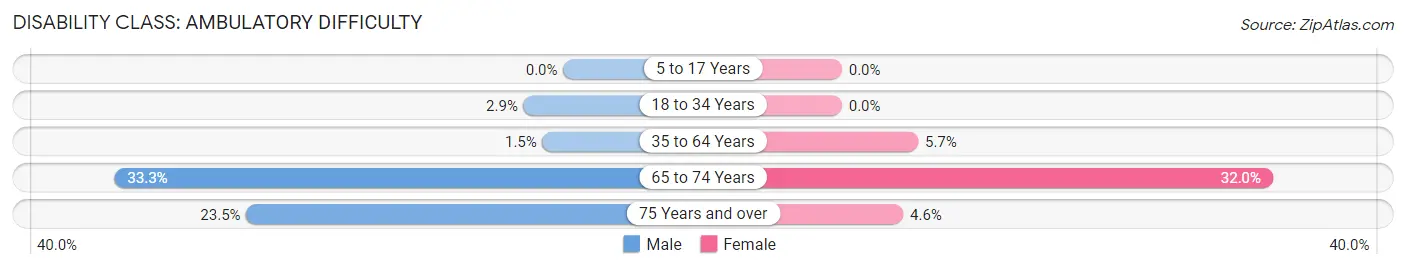
| Age Bracket | Male | Female |
| 5 to 17 Years | 0 (0.0%) | 0 (0.0%) |
| 18 to 34 Years | 2 (2.9%) | 0 (0.0%) |
| 35 to 64 Years | 2 (1.5%) | 6 (5.7%) |
| 65 to 74 Years | 5 (33.3%) | 8 (32.0%) |
| 75 Years and over | 4 (23.5%) | 1 (4.5%) |
Disability Class: Self-Care Difficulty
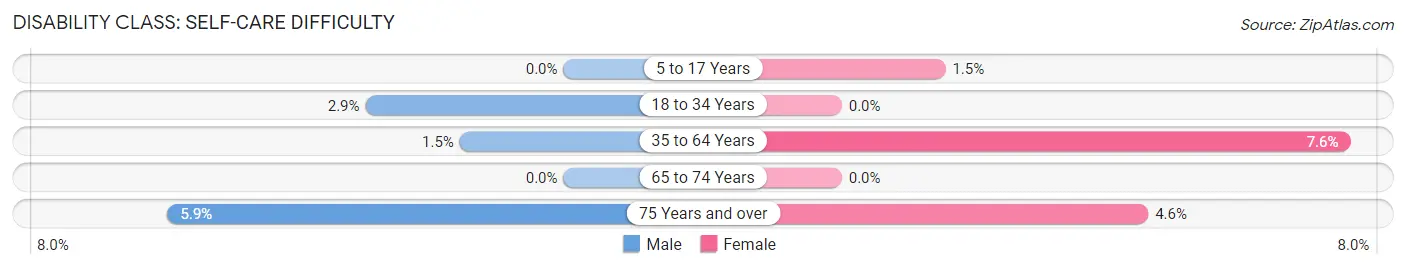
| Age Bracket | Male | Female |
| 5 to 17 Years | 0 (0.0%) | 2 (1.5%) |
| 18 to 34 Years | 2 (2.9%) | 0 (0.0%) |
| 35 to 64 Years | 2 (1.5%) | 8 (7.5%) |
| 65 to 74 Years | 0 (0.0%) | 0 (0.0%) |
| 75 Years and over | 1 (5.9%) | 1 (4.5%) |
Technology Access in Georgetown
Computing Device Access in Georgetown
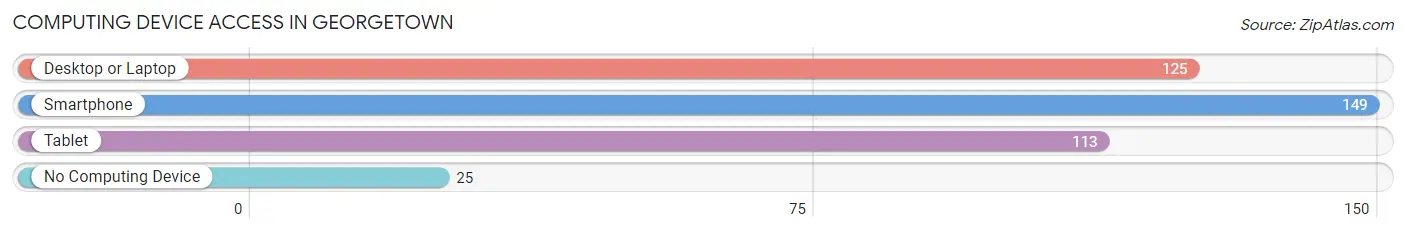
| Device Type | # Households | % Households |
| Desktop or Laptop | 125 | 66.8% |
| Smartphone | 149 | 79.7% |
| Tablet | 113 | 60.4% |
| No Computing Device | 25 | 13.4% |
| Total | 187 | 100.0% |
Internet Access in Georgetown
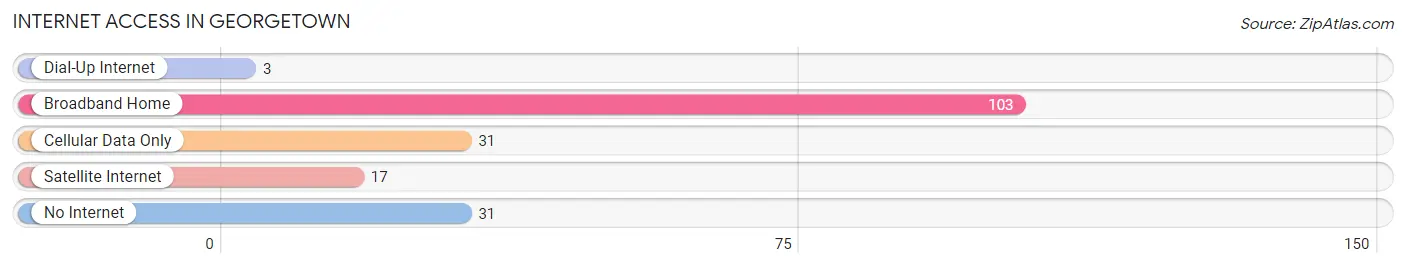
| Internet Type | # Households | % Households |
| Dial-Up Internet | 3 | 1.6% |
| Broadband Home | 103 | 55.1% |
| Cellular Data Only | 31 | 16.6% |
| Satellite Internet | 17 | 9.1% |
| No Internet | 31 | 16.6% |
| Total | 187 | 100.0% |
Georgetown Summary
Georgetown, Idaho is a small town located in the northern part of the state, in Shoshone County. It is situated at the junction of the St. Joe and Coeur d'Alene Rivers, and is surrounded by the Coeur d'Alene National Forest. The town was founded in 1883 by miners who were searching for gold and silver in the area. Georgetown is the county seat of Shoshone County, and is home to a population of approximately 1,000 people.
Geography
Georgetown is located in the northern part of Idaho, in Shoshone County. It is situated at the junction of the St. Joe and Coeur d'Alene Rivers, and is surrounded by the Coeur d'Alene National Forest. The town is located at an elevation of 2,890 feet, and has a total area of 0.7 square miles. The climate in Georgetown is characterized by hot summers and cold winters, with an average annual temperature of 44.3 degrees Fahrenheit.
History
Georgetown was founded in 1883 by miners who were searching for gold and silver in the area. The town was named after George A. Smith, who was the first postmaster of the town. Georgetown quickly grew in size and importance, and by the early 1900s it had become the county seat of Shoshone County. The town was also home to a number of businesses, including a hotel, a bank, a newspaper, and a number of stores.
In the early 1900s, Georgetown was a popular destination for tourists, who came to enjoy the area's natural beauty and outdoor activities. The town was also home to a number of mining operations, which provided employment for many of the town's residents. In the 1950s, the town's economy began to decline, and many of the businesses and mines closed.
Economy
Today, Georgetown's economy is largely based on tourism and outdoor recreation. The town is home to a number of businesses, including restaurants, hotels, and stores. The town is also home to a number of outdoor recreation activities, including fishing, hunting, camping, and hiking. The town is also home to a number of small manufacturing businesses, which provide employment for many of the town's residents.
Demographics
As of the 2010 census, Georgetown had a population of 1,000 people. The racial makeup of the town was 95.2% White, 0.7% Native American, 0.3% Asian, 0.1% Pacific Islander, 0.1% from other races, and 3.7% from two or more races. The median household income in Georgetown was $35,000, and the median family income was $41,000. The per capita income in Georgetown was $17,000.
Conclusion
Georgetown, Idaho is a small town located in the northern part of the state, in Shoshone County. It is situated at the junction of the St. Joe and Coeur d'Alene Rivers, and is surrounded by the Coeur d'Alene National Forest. The town was founded in 1883 by miners who were searching for gold and silver in the area. Georgetown is the county seat of Shoshone County, and is home to a population of approximately 1,000 people. The town's economy is largely based on tourism and outdoor recreation, and the town is home to a number of businesses, including restaurants, hotels, and stores. The town is also home to a number of outdoor recreation activities, including fishing, hunting, camping, and hiking. The racial makeup of the town is 95.2% White, 0.7% Native American, 0.3% Asian, 0.1% Pacific Islander, 0.1% from other races, and 3.7% from two or more races. The median household income in Georgetown was $35,000, and the median family income was $41,000. The per capita income in Georgetown was $17,000.
Common Questions
What is Per Capita Income in Georgetown?
Per Capita income in Georgetown is $26,134.
What is the Median Family Income in Georgetown?
Median Family Income in Georgetown is $79,167.
What is the Median Household income in Georgetown?
Median Household Income in Georgetown is $70,417.
What is Income or Wage Gap in Georgetown?
Income or Wage Gap in Georgetown is 63.4%.
Women in Georgetown earn 36.6 cents for every dollar earned by a man.
What is Inequality or Gini Index in Georgetown?
Inequality or Gini Index in Georgetown is 0.41.
What is the Total Population of Georgetown?
Total Population of Georgetown is 757.
What is the Total Male Population of Georgetown?
Total Male Population of Georgetown is 347.
What is the Total Female Population of Georgetown?
Total Female Population of Georgetown is 410.
What is the Ratio of Males per 100 Females in Georgetown?
There are 84.63 Males per 100 Females in Georgetown.
What is the Ratio of Females per 100 Males in Georgetown?
There are 118.16 Females per 100 Males in Georgetown.
What is the Median Population Age in Georgetown?
Median Population Age in Georgetown is 29.0 Years.
What is the Average Family Size in Georgetown
Average Family Size in Georgetown is 4.2 People.
What is the Average Household Size in Georgetown
Average Household Size in Georgetown is 4.0 People.
How Large is the Labor Force in Georgetown?
There are 363 People in the Labor Forcein in Georgetown.
What is the Percentage of People in the Labor Force in Georgetown?
62.5% of People are in the Labor Force in Georgetown.
What is the Unemployment Rate in Georgetown?
Unemployment Rate in Georgetown is 5.5%.