Aberdeen, ID Map & Demographics
Aberdeen Map
Aberdeen Overview
$20,929
PER CAPITA INCOME
$64,194
AVG FAMILY INCOME
$62,944
AVG HOUSEHOLD INCOME
43.0%
WAGE / INCOME GAP [ % ]
57.0¢/ $1
WAGE / INCOME GAP [ $ ]
0.32
INEQUALITY / GINI INDEX
2,611
TOTAL POPULATION
1,266
MALE POPULATION
1,345
FEMALE POPULATION
94.13
MALES / 100 FEMALES
106.24
FEMALES / 100 MALES
24.4
MEDIAN AGE
3.9
AVG FAMILY SIZE
3.5
AVG HOUSEHOLD SIZE
1,331
LABOR FORCE [ PEOPLE ]
73.5%
PERCENT IN LABOR FORCE
9.2%
UNEMPLOYMENT RATE
Aberdeen Zip Codes
Aberdeen Area Codes
Income in Aberdeen
Income Overview in Aberdeen
Per Capita Income in Aberdeen is $20,929, while median incomes of families and households are $64,194 and $62,944 respectively.
| Characteristic | Number | Measure |
| Per Capita Income | 2,611 | $20,929 |
| Median Family Income | 638 | $64,194 |
| Mean Family Income | 638 | $71,596 |
| Median Household Income | 741 | $62,944 |
| Mean Household Income | 741 | $69,822 |
| Income Deficit | 638 | $0 |
| Wage / Income Gap (%) | 2,611 | 43.04% |
| Wage / Income Gap ($) | 2,611 | 56.96¢ per $1 |
| Gini / Inequality Index | 2,611 | 0.32 |
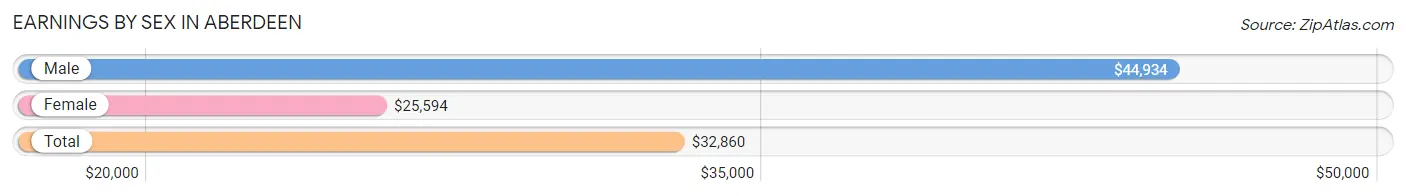
Earnings by Sex in Aberdeen
Average Earnings in Aberdeen are $32,860, $44,934 for men and $25,594 for women, a difference of 43.0%.
| Sex | Number | Average Earnings |
| Male | 737 (54.0%) | $44,934 |
| Female | 628 (46.0%) | $25,594 |
| Total | 1,365 (100.0%) | $32,860 |
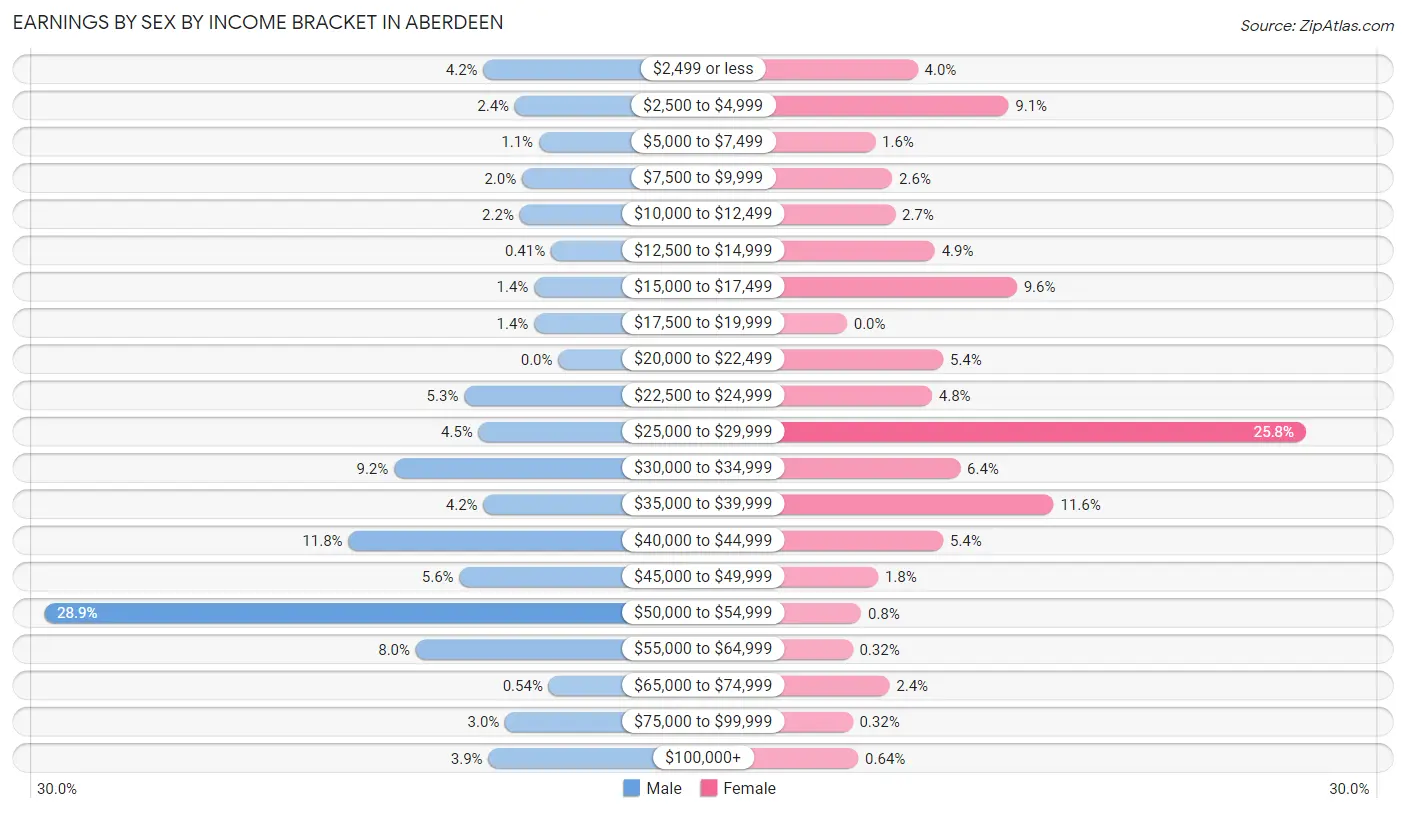
Earnings by Sex by Income Bracket in Aberdeen
The most common earnings brackets in Aberdeen are $50,000 to $54,999 for men (213 | 28.9%) and $25,000 to $29,999 for women (162 | 25.8%).
| Income | Male | Female |
| $2,499 or less | 31 (4.2%) | 25 (4.0%) |
| $2,500 to $4,999 | 18 (2.4%) | 57 (9.1%) |
| $5,000 to $7,499 | 8 (1.1%) | 10 (1.6%) |
| $7,500 to $9,999 | 15 (2.0%) | 16 (2.5%) |
| $10,000 to $12,499 | 16 (2.2%) | 17 (2.7%) |
| $12,500 to $14,999 | 3 (0.4%) | 31 (4.9%) |
| $15,000 to $17,499 | 10 (1.4%) | 60 (9.6%) |
| $17,500 to $19,999 | 10 (1.4%) | 0 (0.0%) |
| $20,000 to $22,499 | 0 (0.0%) | 34 (5.4%) |
| $22,500 to $24,999 | 39 (5.3%) | 30 (4.8%) |
| $25,000 to $29,999 | 33 (4.5%) | 162 (25.8%) |
| $30,000 to $34,999 | 68 (9.2%) | 40 (6.4%) |
| $35,000 to $39,999 | 31 (4.2%) | 73 (11.6%) |
| $40,000 to $44,999 | 87 (11.8%) | 34 (5.4%) |
| $45,000 to $49,999 | 41 (5.6%) | 11 (1.8%) |
| $50,000 to $54,999 | 213 (28.9%) | 5 (0.8%) |
| $55,000 to $64,999 | 59 (8.0%) | 2 (0.3%) |
| $65,000 to $74,999 | 4 (0.5%) | 15 (2.4%) |
| $75,000 to $99,999 | 22 (3.0%) | 2 (0.3%) |
| $100,000+ | 29 (3.9%) | 4 (0.6%) |
| Total | 737 (100.0%) | 628 (100.0%) |
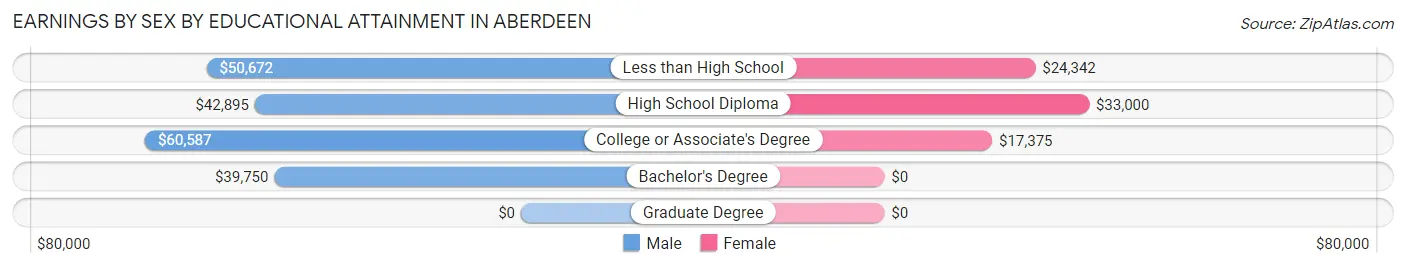
Earnings by Sex by Educational Attainment in Aberdeen
Average earnings in Aberdeen are $50,330 for men and $26,000 for women, a difference of 48.3%. Men with an educational attainment of college or associate's degree enjoy the highest average annual earnings of $60,587, while those with bachelor's degree education earn the least with $39,750. Women with an educational attainment of high school diploma earn the most with the average annual earnings of $33,000, while those with college or associate's degree education have the smallest earnings of $17,375.
| Educational Attainment | Male Income | Female Income |
| Less than High School | $50,672 | $24,342 |
| High School Diploma | $42,895 | $33,000 |
| College or Associate's Degree | $60,587 | $17,375 |
| Bachelor's Degree | $39,750 | $0 |
| Graduate Degree | - | - |
| Total | $50,330 | $26,000 |
Family Income in Aberdeen
Family Income Brackets in Aberdeen
According to the Aberdeen family income data, there are 187 families falling into the $75,000 to $99,999 income range, which is the most common income bracket and makes up 29.3% of all families.
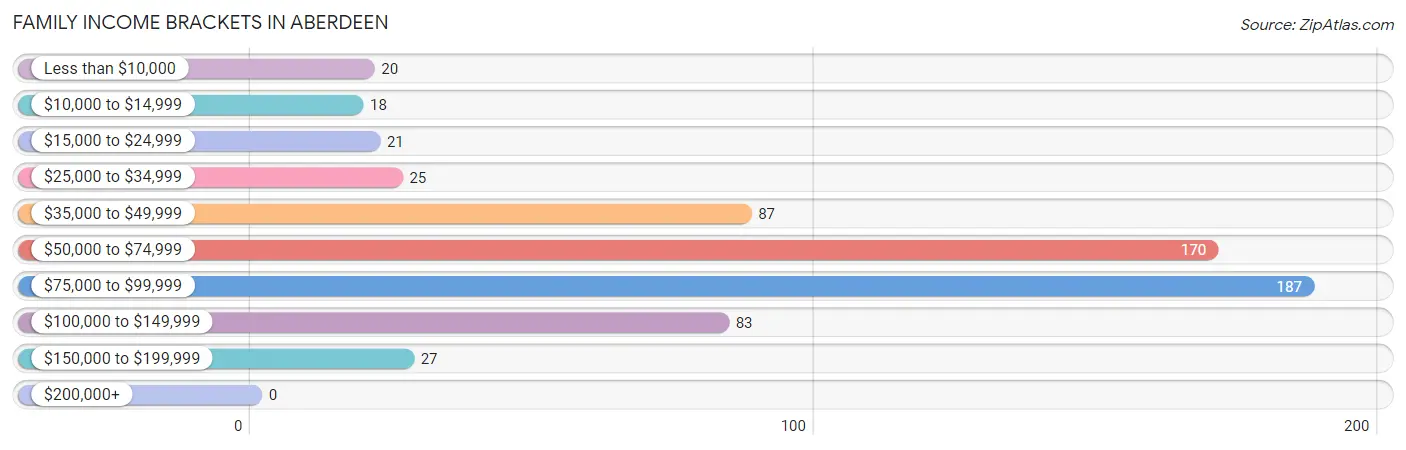
| Income Bracket | # Families | % Families |
| Less than $10,000 | 20 | 3.1% |
| $10,000 to $14,999 | 18 | 2.8% |
| $15,000 to $24,999 | 21 | 3.3% |
| $25,000 to $34,999 | 25 | 3.9% |
| $35,000 to $49,999 | 87 | 13.6% |
| $50,000 to $74,999 | 170 | 26.6% |
| $75,000 to $99,999 | 187 | 29.3% |
| $100,000 to $149,999 | 83 | 13.0% |
| $150,000 to $199,999 | 27 | 4.2% |
| $200,000+ | 0 | 0.0% |
Family Income by Famaliy Size in Aberdeen
5-person families (58 | 9.1%) account for the highest median family income in Aberdeen with $123,000 per family, while 5-person families (58 | 9.1%) have the highest median income of $24,600 per family member.
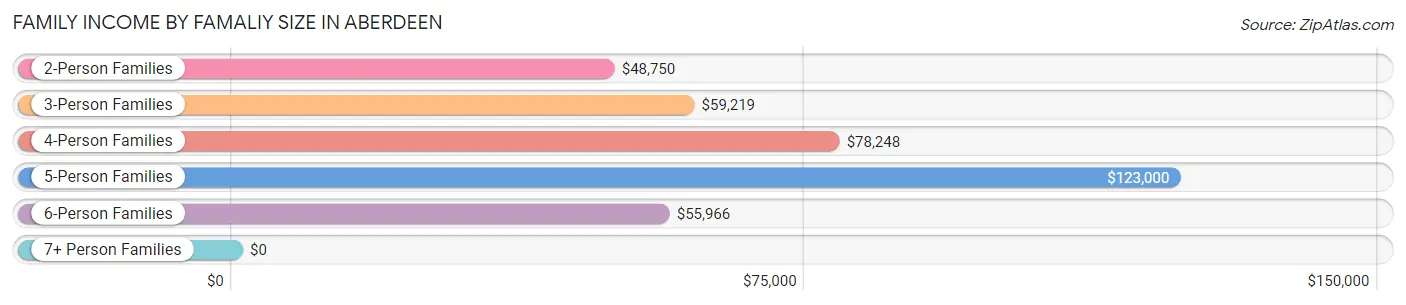
| Income Bracket | # Families | Median Income |
| 2-Person Families | 116 (18.2%) | $48,750 |
| 3-Person Families | 114 (17.9%) | $59,219 |
| 4-Person Families | 255 (40.0%) | $78,248 |
| 5-Person Families | 58 (9.1%) | $123,000 |
| 6-Person Families | 85 (13.3%) | $55,966 |
| 7+ Person Families | 10 (1.6%) | $0 |
| Total | 638 (100.0%) | $64,194 |
Family Income by Number of Earners in Aberdeen
The median family income in Aberdeen is $64,194, with families comprising 3+ earners (178) having the highest median family income of $83,750, while families with no earners (32) have the lowest median family income of $36,667, accounting for 27.9% and 5.0% of families, respectively.
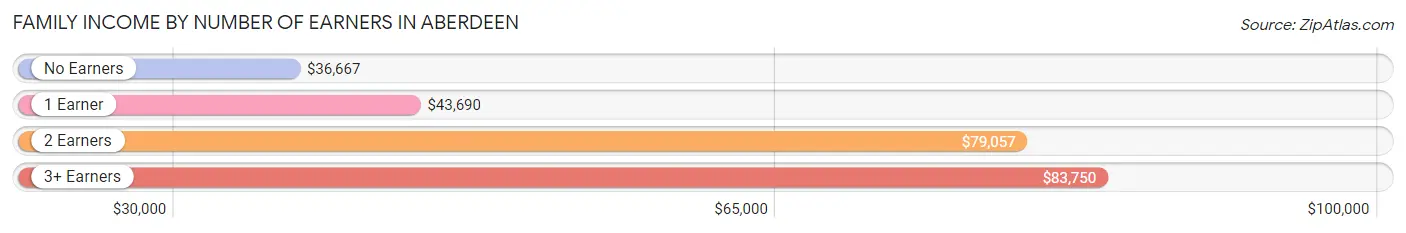
| Number of Earners | # Families | Median Income |
| No Earners | 32 (5.0%) | $36,667 |
| 1 Earner | 214 (33.5%) | $43,690 |
| 2 Earners | 214 (33.5%) | $79,057 |
| 3+ Earners | 178 (27.9%) | $83,750 |
| Total | 638 (100.0%) | $64,194 |
Household Income in Aberdeen
Household Income Brackets in Aberdeen
With 208 households falling in the category, the $75,000 to $99,999 income range is the most frequent in Aberdeen, accounting for 28.1% of all households.
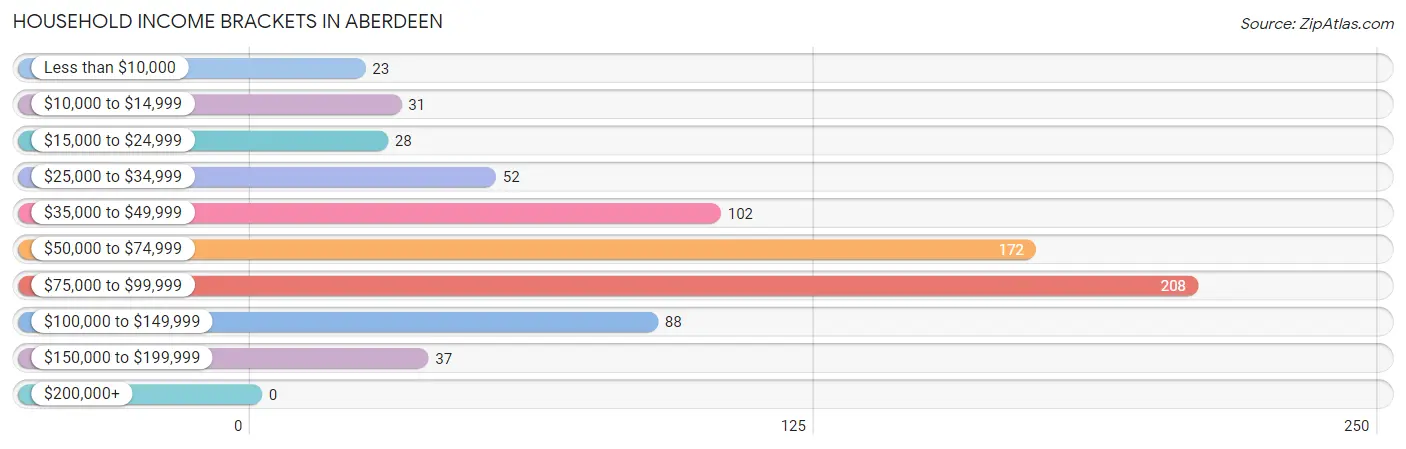
| Income Bracket | # Households | % Households |
| Less than $10,000 | 23 | 3.1% |
| $10,000 to $14,999 | 31 | 4.2% |
| $15,000 to $24,999 | 28 | 3.8% |
| $25,000 to $34,999 | 52 | 7.0% |
| $35,000 to $49,999 | 102 | 13.8% |
| $50,000 to $74,999 | 172 | 23.2% |
| $75,000 to $99,999 | 208 | 28.1% |
| $100,000 to $149,999 | 88 | 11.9% |
| $150,000 to $199,999 | 37 | 5.0% |
| $200,000+ | 0 | 0.0% |
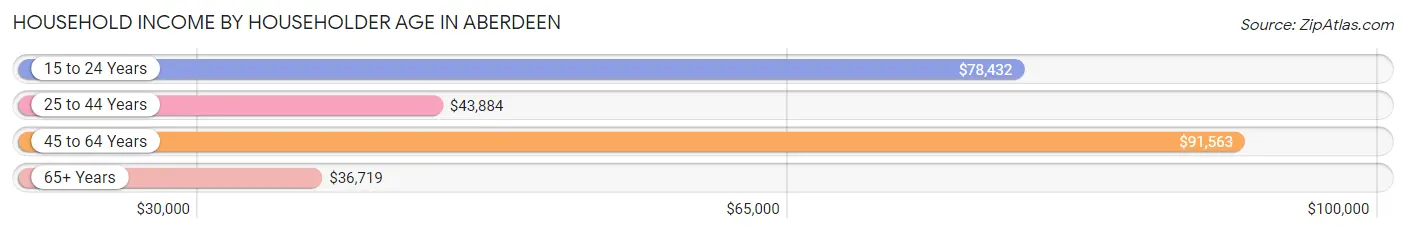
Household Income by Householder Age in Aberdeen
The median household income in Aberdeen is $62,944, with the highest median household income of $91,563 found in the 45 to 64 years age bracket for the primary householder. A total of 247 households (33.3%) fall into this category. Meanwhile, the 65+ years age bracket for the primary householder has the lowest median household income of $36,719, with 130 households (17.5%) in this group.
| Income Bracket | # Households | Median Income |
| 15 to 24 Years | 173 (23.4%) | $78,432 |
| 25 to 44 Years | 191 (25.8%) | $43,884 |
| 45 to 64 Years | 247 (33.3%) | $91,563 |
| 65+ Years | 130 (17.5%) | $36,719 |
| Total | 741 (100.0%) | $62,944 |
Poverty in Aberdeen
Income Below Poverty by Sex and Age in Aberdeen
With 7.5% poverty level for males and 9.3% for females among the residents of Aberdeen, 16 and 17 year old males and 25 to 34 year old females are the most vulnerable to poverty, with 35 males (63.6%) and 20 females (26.7%) in their respective age groups living below the poverty level.
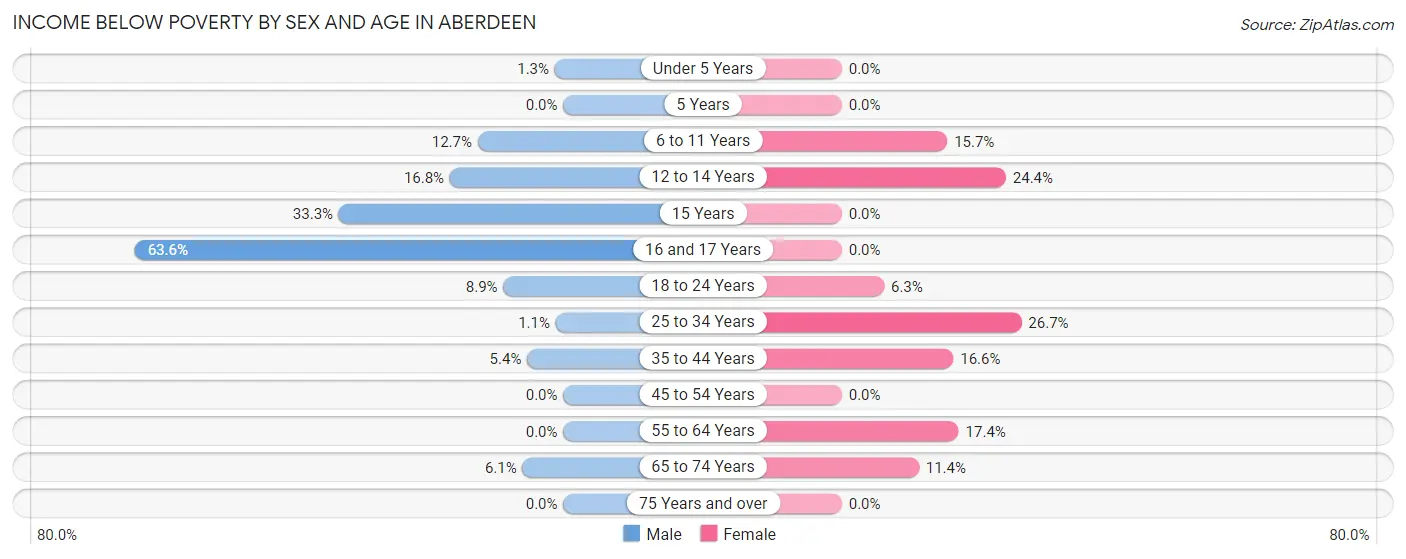
| Age Bracket | Male | Female |
| Under 5 Years | 2 (1.3%) | 0 (0.0%) |
| 5 Years | 0 (0.0%) | 0 (0.0%) |
| 6 to 11 Years | 16 (12.7%) | 18 (15.7%) |
| 12 to 14 Years | 16 (16.8%) | 19 (24.4%) |
| 15 Years | 3 (33.3%) | 0 (0.0%) |
| 16 and 17 Years | 35 (63.6%) | 0 (0.0%) |
| 18 to 24 Years | 13 (8.9%) | 20 (6.3%) |
| 25 to 34 Years | 3 (1.1%) | 20 (26.7%) |
| 35 to 44 Years | 3 (5.4%) | 27 (16.6%) |
| 45 to 54 Years | 0 (0.0%) | 0 (0.0%) |
| 55 to 64 Years | 0 (0.0%) | 17 (17.3%) |
| 65 to 74 Years | 4 (6.1%) | 4 (11.4%) |
| 75 Years and over | 0 (0.0%) | 0 (0.0%) |
| Total | 95 (7.5%) | 125 (9.3%) |
Income Above Poverty by Sex and Age in Aberdeen
According to the poverty statistics in Aberdeen, males aged 5 years and females aged under 5 years are the age groups that are most secure financially, with 100.0% of males and 100.0% of females in these age groups living above the poverty line.
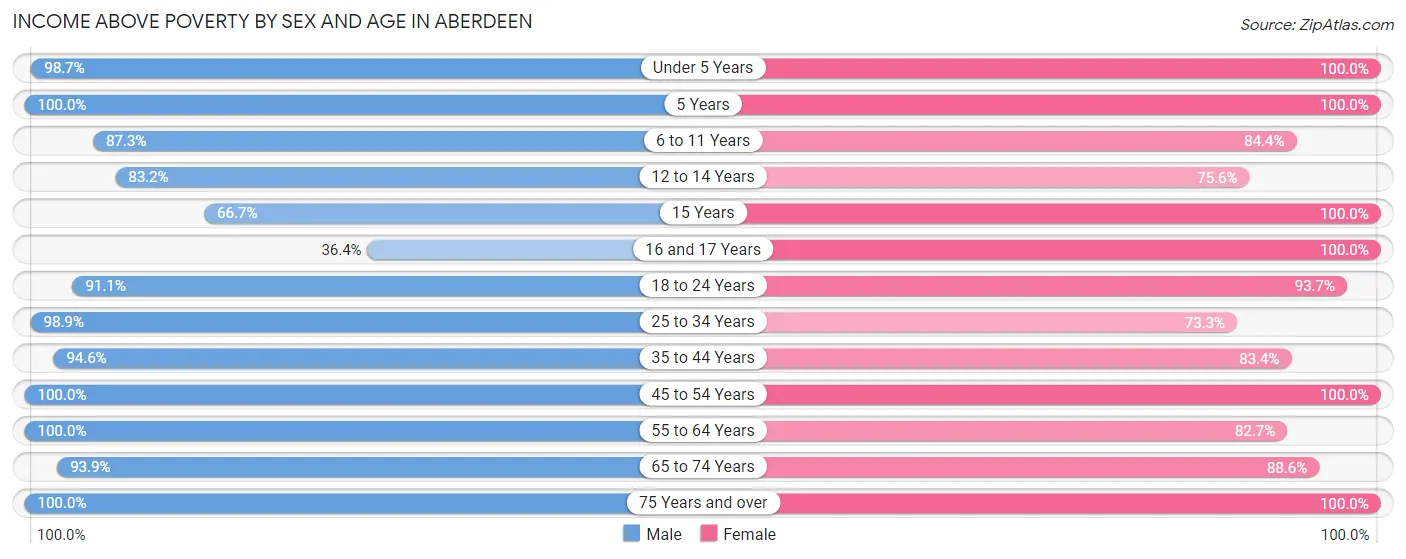
| Age Bracket | Male | Female |
| Under 5 Years | 157 (98.7%) | 152 (100.0%) |
| 5 Years | 18 (100.0%) | 19 (100.0%) |
| 6 to 11 Years | 110 (87.3%) | 97 (84.4%) |
| 12 to 14 Years | 79 (83.2%) | 59 (75.6%) |
| 15 Years | 6 (66.7%) | 29 (100.0%) |
| 16 and 17 Years | 20 (36.4%) | 76 (100.0%) |
| 18 to 24 Years | 133 (91.1%) | 299 (93.7%) |
| 25 to 34 Years | 265 (98.9%) | 55 (73.3%) |
| 35 to 44 Years | 53 (94.6%) | 136 (83.4%) |
| 45 to 54 Years | 119 (100.0%) | 84 (100.0%) |
| 55 to 64 Years | 132 (100.0%) | 81 (82.7%) |
| 65 to 74 Years | 62 (93.9%) | 31 (88.6%) |
| 75 Years and over | 17 (100.0%) | 102 (100.0%) |
| Total | 1,171 (92.5%) | 1,220 (90.7%) |
Income Below Poverty Among Married-Couple Families in Aberdeen
The poverty statistics for married-couple families in Aberdeen show that 1.4% or 7 of the total 486 families live below the poverty line. Families with no children have the highest poverty rate of 2.6%, comprising of 4 families. On the other hand, families with 3 or 4 children have the lowest poverty rate of 0.0%, which includes 0 families.
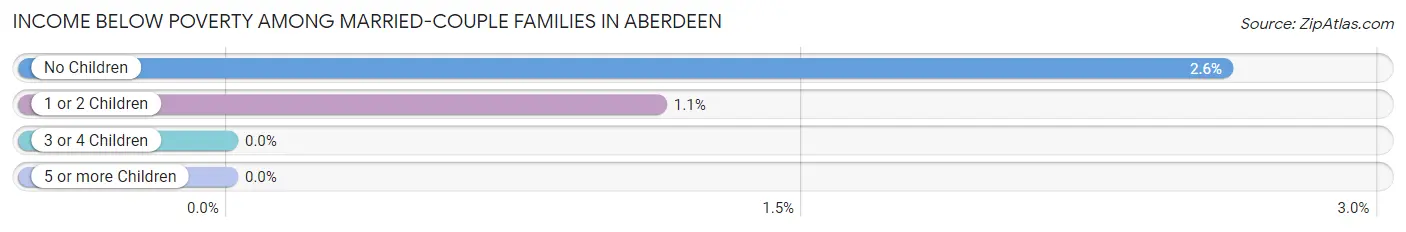
| Children | Above Poverty | Below Poverty |
| No Children | 150 (97.4%) | 4 (2.6%) |
| 1 or 2 Children | 264 (98.9%) | 3 (1.1%) |
| 3 or 4 Children | 65 (100.0%) | 0 (0.0%) |
| 5 or more Children | 0 (0.0%) | 0 (0.0%) |
| Total | 479 (98.6%) | 7 (1.4%) |
Income Below Poverty Among Single-Parent Households in Aberdeen
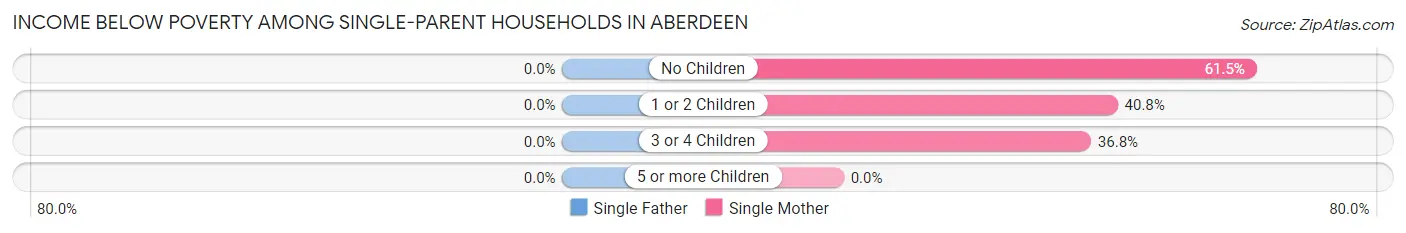
| Children | Single Father | Single Mother |
| No Children | 0 (0.0%) | 8 (61.5%) |
| 1 or 2 Children | 0 (0.0%) | 20 (40.8%) |
| 3 or 4 Children | 0 (0.0%) | 21 (36.8%) |
| 5 or more Children | 0 (0.0%) | 0 (0.0%) |
| Total | 0 (0.0%) | 49 (36.8%) |
Income Below Poverty Among Married-Couple vs Single-Parent Households in Aberdeen
The poverty data for Aberdeen shows that 7 of the married-couple family households (1.4%) and 49 of the single-parent households (32.2%) are living below the poverty level. Within the married-couple family households, those with no children have the highest poverty rate, with 4 households (2.6%) falling below the poverty line. Among the single-parent households, those with 1 or 2 children have the highest poverty rate, with 20 household (40.8%) living below poverty.
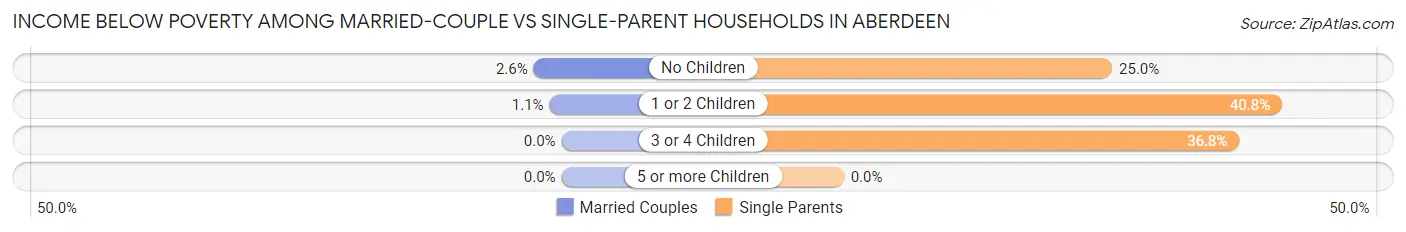
| Children | Married-Couple Families | Single-Parent Households |
| No Children | 4 (2.6%) | 8 (25.0%) |
| 1 or 2 Children | 3 (1.1%) | 20 (40.8%) |
| 3 or 4 Children | 0 (0.0%) | 21 (36.8%) |
| 5 or more Children | 0 (0.0%) | 0 (0.0%) |
| Total | 7 (1.4%) | 49 (32.2%) |
Race in Aberdeen
The most populous races in Aberdeen are Hispanic or Latino (2,089 | 80.0%), Two or more Races (962 | 36.8%), and White / Caucasian (884 | 33.9%).
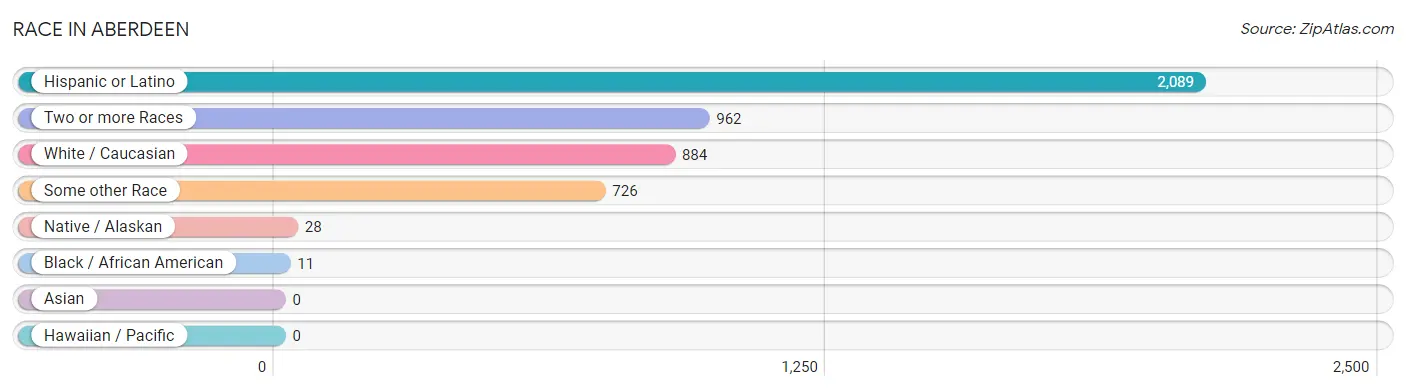
| Race | # Population | % Population |
| Asian | 0 | 0.0% |
| Black / African American | 11 | 0.4% |
| Hawaiian / Pacific | 0 | 0.0% |
| Hispanic or Latino | 2,089 | 80.0% |
| Native / Alaskan | 28 | 1.1% |
| White / Caucasian | 884 | 33.9% |
| Two or more Races | 962 | 36.8% |
| Some other Race | 726 | 27.8% |
| Total | 2,611 | 100.0% |
Ancestry in Aberdeen
The most populous ancestries reported in Aberdeen are Mexican (2,007 | 76.9%), English (114 | 4.4%), American (94 | 3.6%), Scottish (70 | 2.7%), and German (52 | 2.0%), together accounting for 89.5% of all Aberdeen residents.
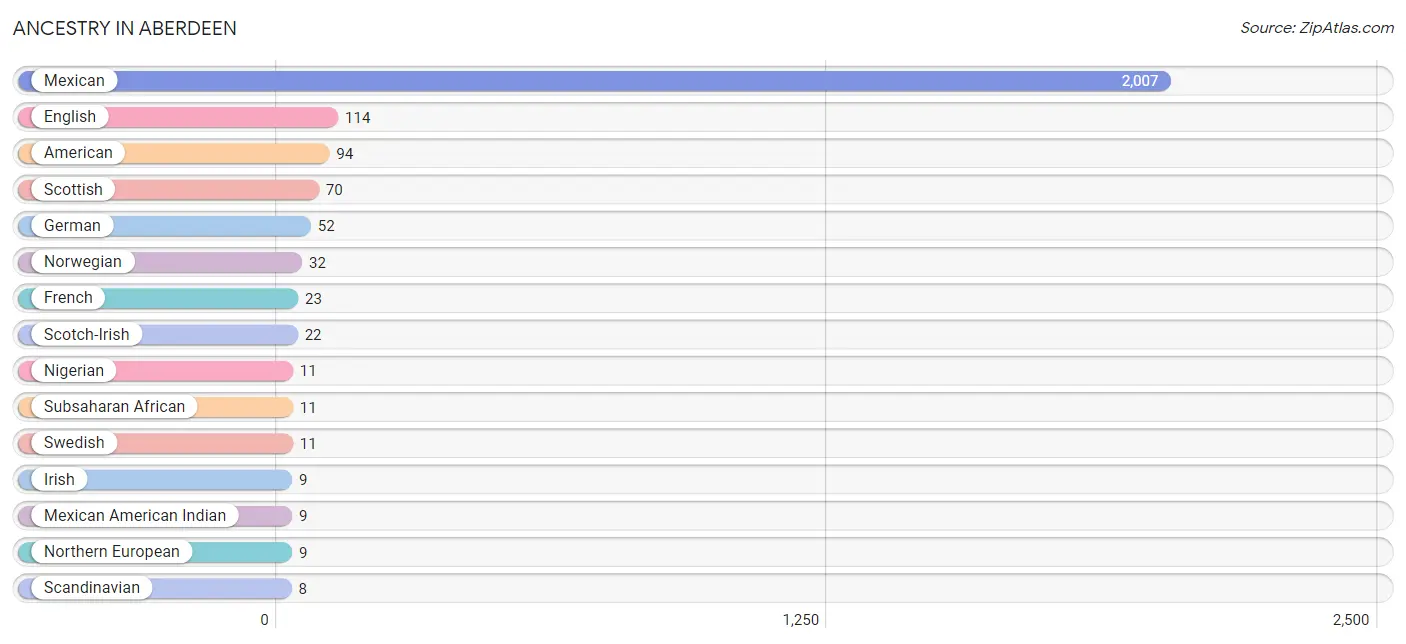
| Ancestry | # Population | % Population |
| American | 94 | 3.6% |
| British | 3 | 0.1% |
| Canadian | 3 | 0.1% |
| Danish | 4 | 0.2% |
| Dutch | 5 | 0.2% |
| English | 114 | 4.4% |
| French | 23 | 0.9% |
| French Canadian | 3 | 0.1% |
| German | 52 | 2.0% |
| Irish | 9 | 0.3% |
| Israeli | 4 | 0.2% |
| Italian | 3 | 0.1% |
| Korean | 3 | 0.1% |
| Mexican | 2,007 | 76.9% |
| Mexican American Indian | 9 | 0.3% |
| Nigerian | 11 | 0.4% |
| Northern European | 9 | 0.3% |
| Norwegian | 32 | 1.2% |
| Scandinavian | 8 | 0.3% |
| Scotch-Irish | 22 | 0.8% |
| Scottish | 70 | 2.7% |
| Subsaharan African | 11 | 0.4% |
| Swedish | 11 | 0.4% |
| Welsh | 3 | 0.1% | View All 24 Rows |
Immigrants in Aberdeen
The most numerous immigrant groups reported in Aberdeen came from Latin America (762 | 29.2%), Central America (757 | 29.0%), Mexico (757 | 29.0%), Europe (22 | 0.8%), and Northern Europe (16 | 0.6%), together accounting for 88.6% of all Aberdeen residents.
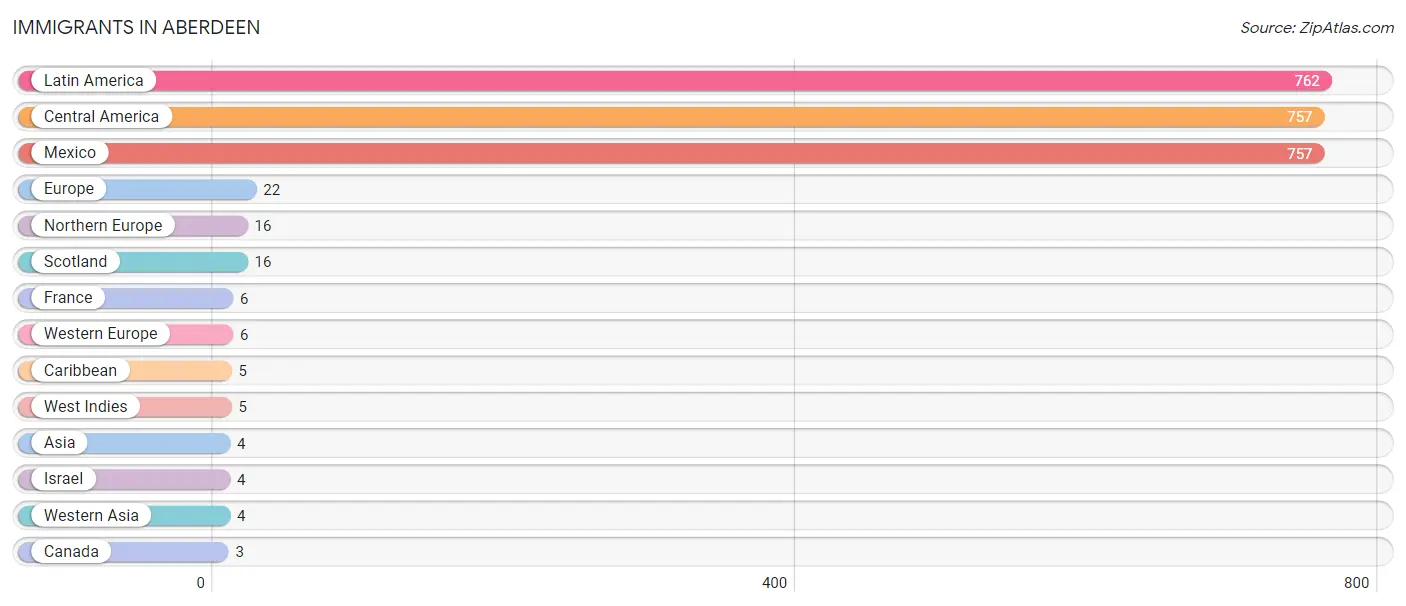
| Immigration Origin | # Population | % Population |
| Asia | 4 | 0.2% |
| Canada | 3 | 0.1% |
| Caribbean | 5 | 0.2% |
| Central America | 757 | 29.0% |
| Europe | 22 | 0.8% |
| France | 6 | 0.2% |
| Israel | 4 | 0.2% |
| Latin America | 762 | 29.2% |
| Mexico | 757 | 29.0% |
| Northern Europe | 16 | 0.6% |
| Scotland | 16 | 0.6% |
| West Indies | 5 | 0.2% |
| Western Asia | 4 | 0.2% |
| Western Europe | 6 | 0.2% | View All 14 Rows |
Sex and Age in Aberdeen
Sex and Age in Aberdeen
The most populous age groups in Aberdeen are 25 to 29 Years (219 | 17.3%) for men and 20 to 24 Years (288 | 21.4%) for women.
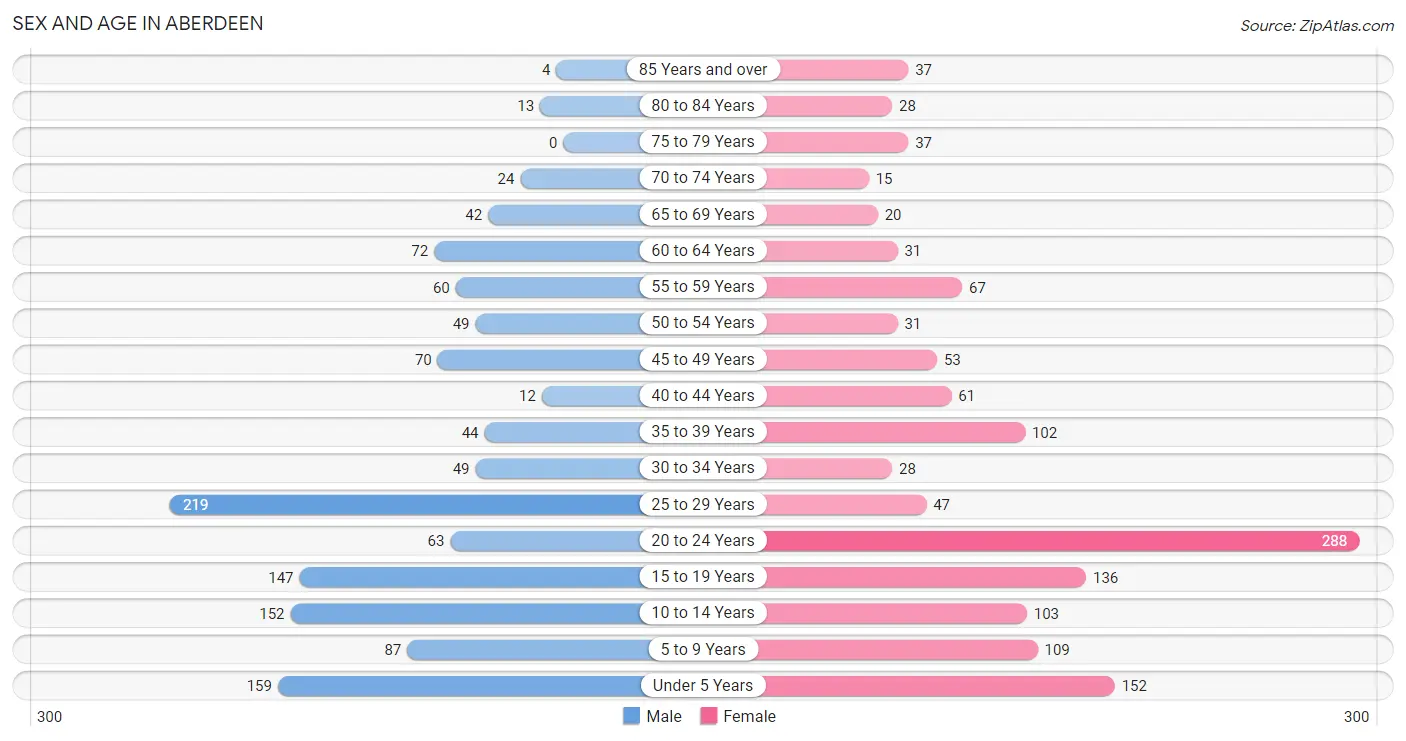
| Age Bracket | Male | Female |
| Under 5 Years | 159 (12.6%) | 152 (11.3%) |
| 5 to 9 Years | 87 (6.9%) | 109 (8.1%) |
| 10 to 14 Years | 152 (12.0%) | 103 (7.7%) |
| 15 to 19 Years | 147 (11.6%) | 136 (10.1%) |
| 20 to 24 Years | 63 (5.0%) | 288 (21.4%) |
| 25 to 29 Years | 219 (17.3%) | 47 (3.5%) |
| 30 to 34 Years | 49 (3.9%) | 28 (2.1%) |
| 35 to 39 Years | 44 (3.5%) | 102 (7.6%) |
| 40 to 44 Years | 12 (0.9%) | 61 (4.5%) |
| 45 to 49 Years | 70 (5.5%) | 53 (3.9%) |
| 50 to 54 Years | 49 (3.9%) | 31 (2.3%) |
| 55 to 59 Years | 60 (4.7%) | 67 (5.0%) |
| 60 to 64 Years | 72 (5.7%) | 31 (2.3%) |
| 65 to 69 Years | 42 (3.3%) | 20 (1.5%) |
| 70 to 74 Years | 24 (1.9%) | 15 (1.1%) |
| 75 to 79 Years | 0 (0.0%) | 37 (2.8%) |
| 80 to 84 Years | 13 (1.0%) | 28 (2.1%) |
| 85 Years and over | 4 (0.3%) | 37 (2.8%) |
| Total | 1,266 (100.0%) | 1,345 (100.0%) |
Families and Households in Aberdeen
Median Family Size in Aberdeen
The median family size in Aberdeen is 3.90 persons per family, with single female/mother families (133 | 20.8%) accounting for the largest median family size of 4.42 persons per family. On the other hand, single male/father families (19 | 3.0%) represent the smallest median family size with 2.95 persons per family.
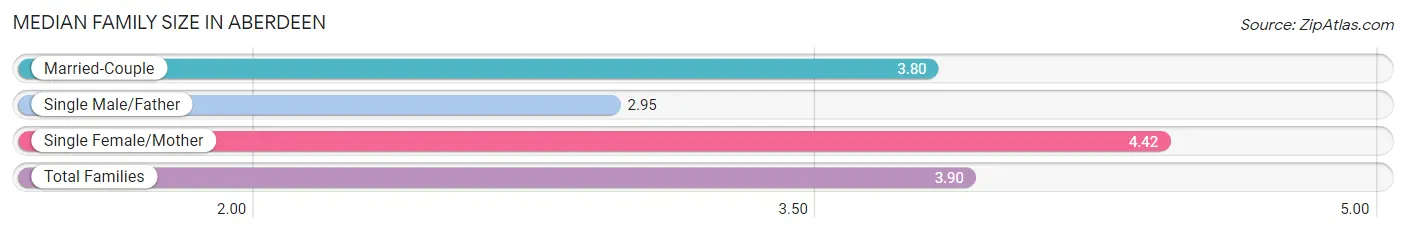
| Family Type | # Families | Family Size |
| Married-Couple | 486 (76.2%) | 3.80 |
| Single Male/Father | 19 (3.0%) | 2.95 |
| Single Female/Mother | 133 (20.8%) | 4.42 |
| Total Families | 638 (100.0%) | 3.90 |
Median Household Size in Aberdeen
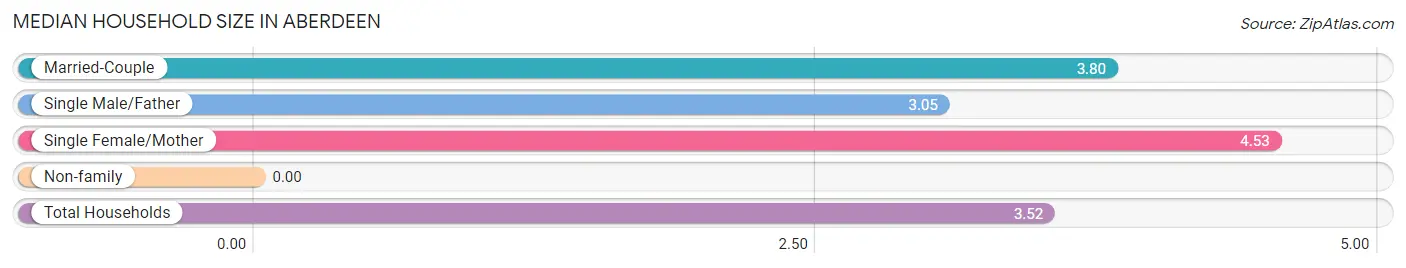
| Household Type | # Households | Household Size |
| Married-Couple | 486 (65.6%) | 3.80 |
| Single Male/Father | 19 (2.6%) | 3.05 |
| Single Female/Mother | 133 (17.9%) | 4.53 |
| Non-family | 103 (13.9%) | - |
| Total Households | 741 (100.0%) | 3.52 |
Household Size by Marriage Status in Aberdeen
Out of a total of 741 households in Aberdeen, 638 (86.1%) are family households, while 103 (13.9%) are nonfamily households. The most numerous type of family households are 4-person households, comprising 252, and the most common type of nonfamily households are 1-person households, comprising 103.
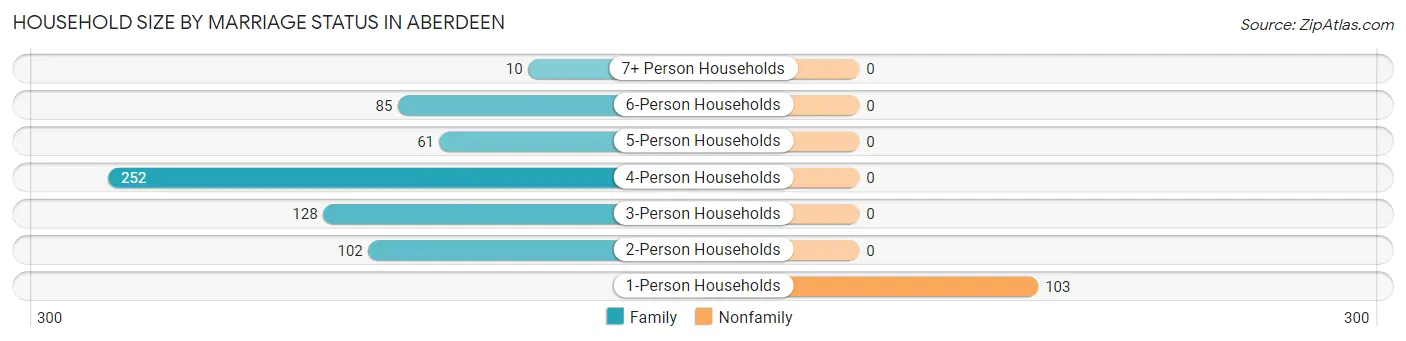
| Household Size | Family Households | Nonfamily Households |
| 1-Person Households | - | 103 (13.9%) |
| 2-Person Households | 102 (13.8%) | 0 (0.0%) |
| 3-Person Households | 128 (17.3%) | 0 (0.0%) |
| 4-Person Households | 252 (34.0%) | 0 (0.0%) |
| 5-Person Households | 61 (8.2%) | 0 (0.0%) |
| 6-Person Households | 85 (11.5%) | 0 (0.0%) |
| 7+ Person Households | 10 (1.3%) | 0 (0.0%) |
| Total | 638 (86.1%) | 103 (13.9%) |
Female Fertility in Aberdeen
Fertility by Age in Aberdeen
Average fertility rate in Aberdeen is 227.0 births per 1,000 women. Women in the age bracket of 20 to 34 years have the highest fertility rate with 455.0 births per 1,000 women. Women in the age bracket of 20 to 34 years acount for 100.0% of all women with births.
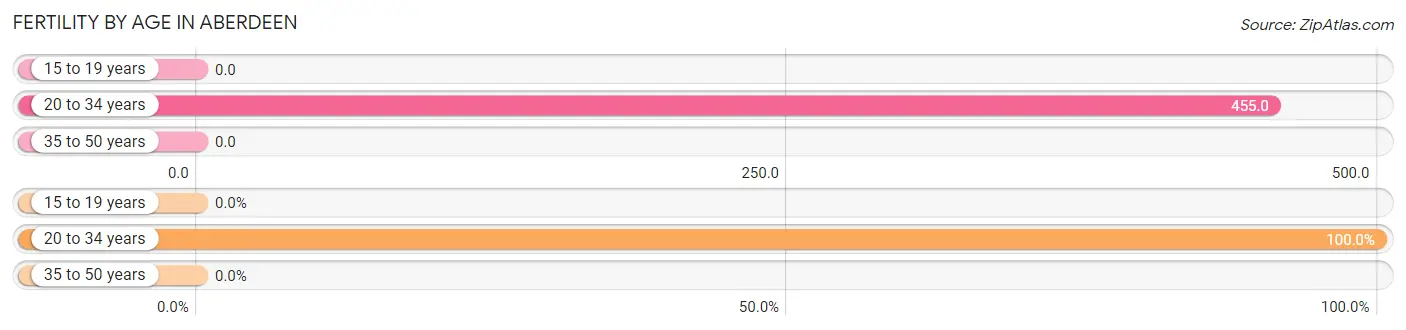
| Age Bracket | Women with Births | Births / 1,000 Women |
| 15 to 19 years | 0 (0.0%) | 0.0 |
| 20 to 34 years | 165 (100.0%) | 455.0 |
| 35 to 50 years | 0 (0.0%) | 0.0 |
| Total | 165 (100.0%) | 227.0 |
Fertility by Age by Marriage Status in Aberdeen
84.2% of women with births (165) in Aberdeen are married. The highest percentage of unmarried women with births falls into 20 to 34 years age bracket with 15.8% of them unmarried at the time of birth, while the lowest percentage of unmarried women with births belong to 20 to 34 years age bracket with 15.8% of them unmarried.
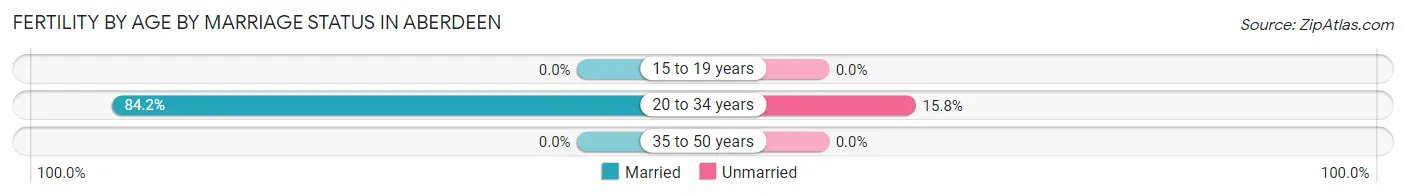
| Age Bracket | Married | Unmarried |
| 15 to 19 years | 0 (0.0%) | 0 (0.0%) |
| 20 to 34 years | 139 (84.2%) | 26 (15.8%) |
| 35 to 50 years | 0 (0.0%) | 0 (0.0%) |
| Total | 139 (84.2%) | 26 (15.8%) |
Fertility by Education in Aberdeen
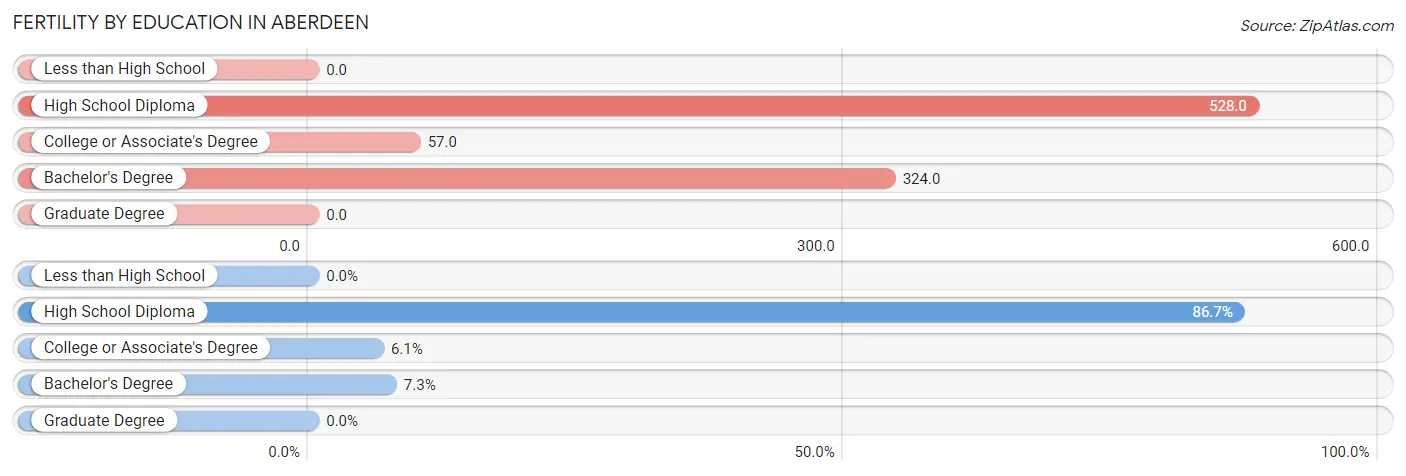
| Educational Attainment | Women with Births | Births / 1,000 Women |
| Less than High School | 0 (0.0%) | 0.0 |
| High School Diploma | 143 (86.7%) | 528.0 |
| College or Associate's Degree | 10 (6.1%) | 57.0 |
| Bachelor's Degree | 12 (7.3%) | 324.0 |
| Graduate Degree | 0 (0.0%) | 0.0 |
| Total | 165 (100.0%) | 227.0 |
Fertility by Education by Marriage Status in Aberdeen
15.8% of women with births in Aberdeen are unmarried. Women with the educational attainment of college or associate's degree are most likely to be married with 100.0% of them married at childbirth, while women with the educational attainment of high school diploma are least likely to be married with 18.2% of them unmarried at childbirth.

| Educational Attainment | Married | Unmarried |
| Less than High School | 0 (0.0%) | 0 (0.0%) |
| High School Diploma | 117 (81.8%) | 26 (18.2%) |
| College or Associate's Degree | 10 (100.0%) | 0 (0.0%) |
| Bachelor's Degree | 12 (100.0%) | 0 (0.0%) |
| Graduate Degree | 0 (0.0%) | 0 (0.0%) |
| Total | 139 (84.2%) | 26 (15.8%) |
Employment Characteristics in Aberdeen
Employment by Class of Employer in Aberdeen
Among the 1,191 employed individuals in Aberdeen, private company employees (1,013 | 85.1%), state government employees (33 | 2.8%), and local government employees (30 | 2.5%) make up the most common classes of employment.
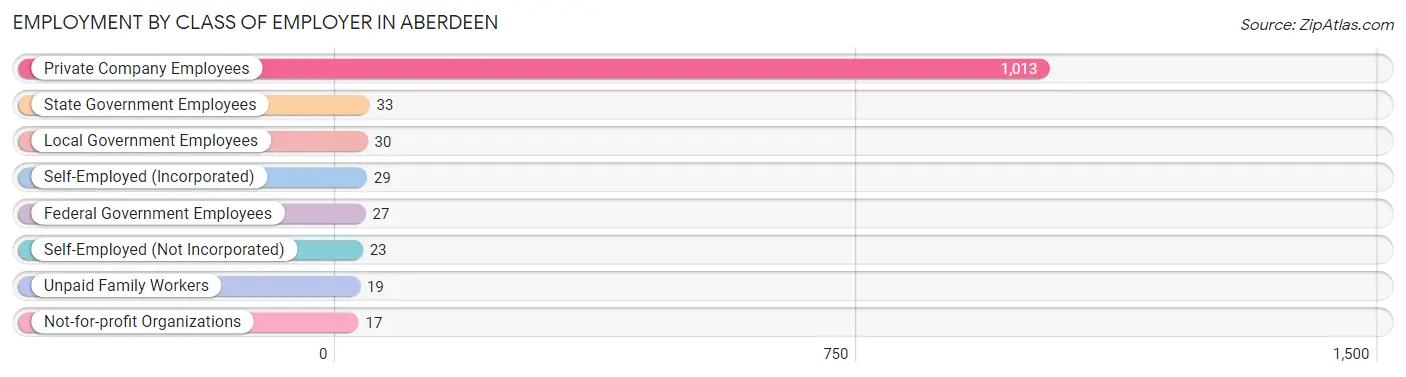
| Employer Class | # Employees | % Employees |
| Private Company Employees | 1,013 | 85.1% |
| Self-Employed (Incorporated) | 29 | 2.4% |
| Self-Employed (Not Incorporated) | 23 | 1.9% |
| Not-for-profit Organizations | 17 | 1.4% |
| Local Government Employees | 30 | 2.5% |
| State Government Employees | 33 | 2.8% |
| Federal Government Employees | 27 | 2.3% |
| Unpaid Family Workers | 19 | 1.6% |
| Total | 1,191 | 100.0% |
Employment Status by Age in Aberdeen
According to the labor force statistics for Aberdeen, out of the total population over 16 years of age (1,811), 73.5% or 1,331 individuals are in the labor force, with 9.2% or 122 of them unemployed. The age group with the highest labor force participation rate is 20 to 24 years, with 96.6% or 339 individuals in the labor force. Within the labor force, the 16 to 19 years age range has the highest percentage of unemployed individuals, with 31.8% or 42 of them being unemployed.
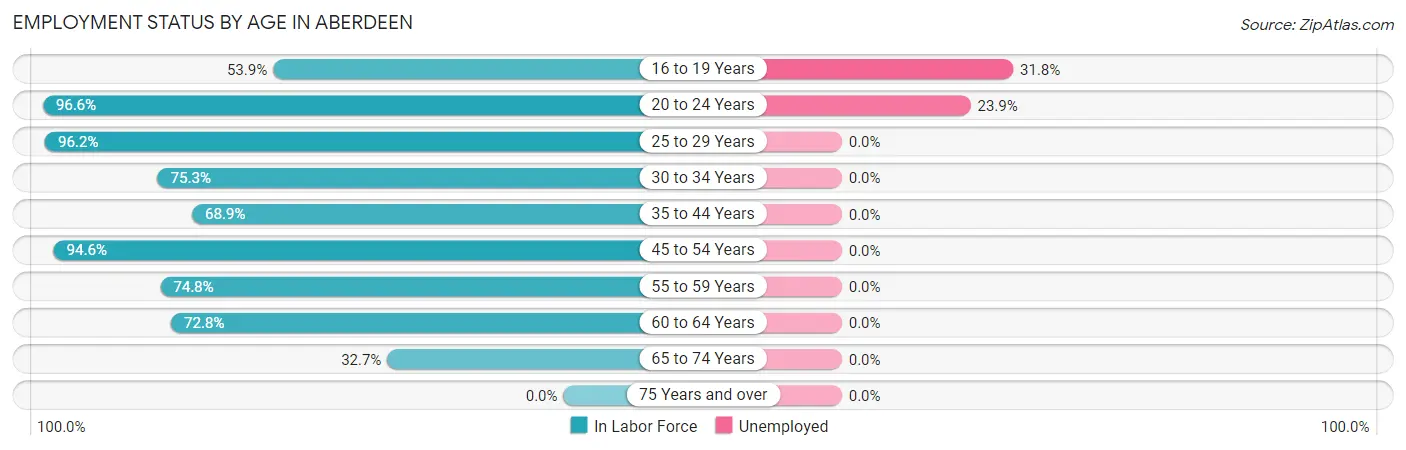
| Age Bracket | In Labor Force | Unemployed |
| 16 to 19 Years | 132 (53.9%) | 42 (31.8%) |
| 20 to 24 Years | 339 (96.6%) | 81 (23.9%) |
| 25 to 29 Years | 256 (96.2%) | 0 (0.0%) |
| 30 to 34 Years | 58 (75.3%) | 0 (0.0%) |
| 35 to 44 Years | 151 (68.9%) | 0 (0.0%) |
| 45 to 54 Years | 192 (94.6%) | 0 (0.0%) |
| 55 to 59 Years | 95 (74.8%) | 0 (0.0%) |
| 60 to 64 Years | 75 (72.8%) | 0 (0.0%) |
| 65 to 74 Years | 33 (32.7%) | 0 (0.0%) |
| 75 Years and over | 0 (0.0%) | 0 (0.0%) |
| Total | 1,331 (73.5%) | 122 (9.2%) |
Employment Status by Educational Attainment in Aberdeen
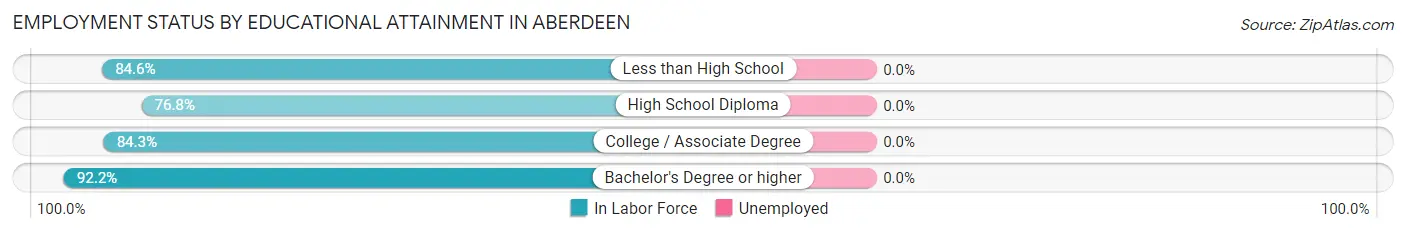
| Educational Attainment | In Labor Force | Unemployed |
| Less than High School | 440 (84.6%) | 0 (0.0%) |
| High School Diploma | 179 (76.8%) | 0 (0.0%) |
| College / Associate Degree | 161 (84.3%) | 0 (0.0%) |
| Bachelor's Degree or higher | 47 (92.2%) | 0 (0.0%) |
| Total | 827 (83.1%) | 0 (0.0%) |
Employment Occupations by Sex in Aberdeen
Management, Business, Science and Arts Occupations
The most common Management, Business, Science and Arts occupations in Aberdeen are Management (44 | 3.6%), Health Diagnosing & Treating (42 | 3.5%), Community & Social Service (41 | 3.4%), Education Instruction & Library (41 | 3.4%), and Business & Financial (21 | 1.7%).
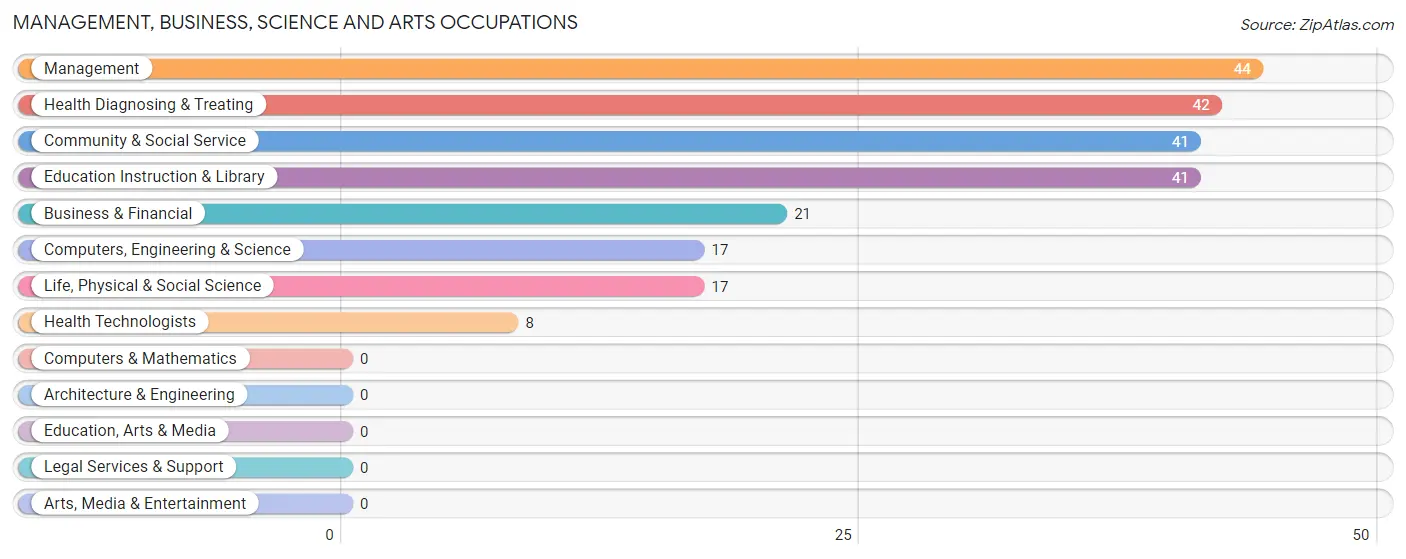
Management, Business, Science and Arts Occupations by Sex
Within the Management, Business, Science and Arts occupations in Aberdeen, the most male-oriented occupations are Business & Financial (100.0%), Computers, Engineering & Science (88.2%), and Life, Physical & Social Science (88.2%), while the most female-oriented occupations are Health Diagnosing & Treating (100.0%), Health Technologists (100.0%), and Community & Social Service (82.9%).
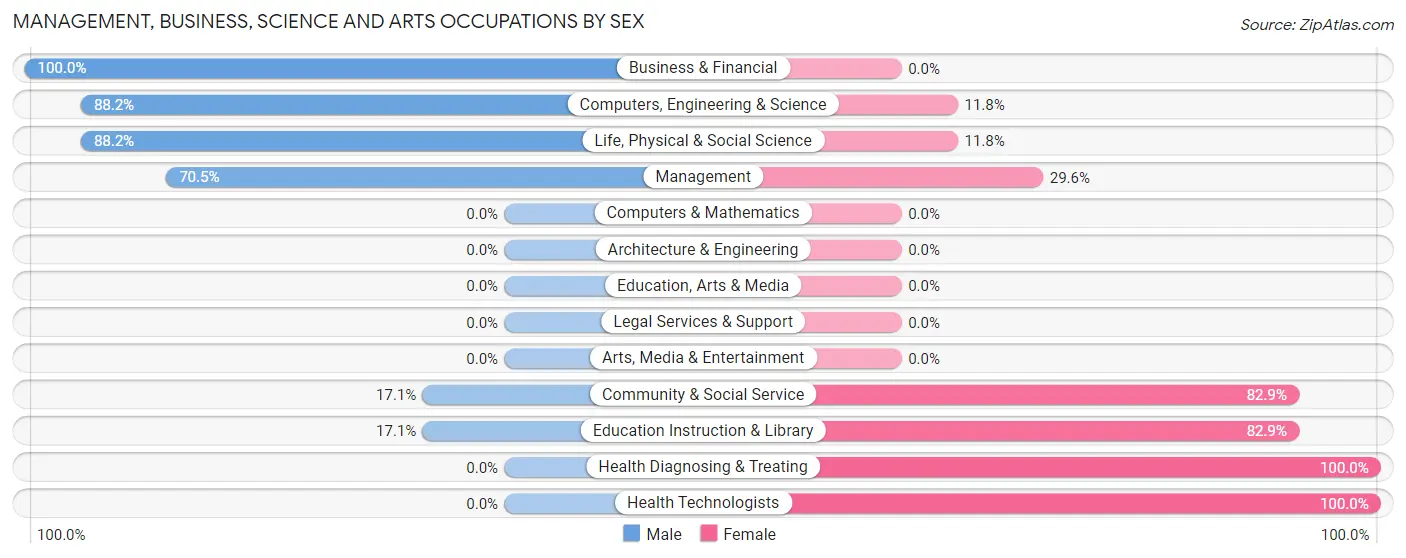
| Occupation | Male | Female |
| Management | 31 (70.5%) | 13 (29.5%) |
| Business & Financial | 21 (100.0%) | 0 (0.0%) |
| Computers, Engineering & Science | 15 (88.2%) | 2 (11.8%) |
| Computers & Mathematics | 0 (0.0%) | 0 (0.0%) |
| Architecture & Engineering | 0 (0.0%) | 0 (0.0%) |
| Life, Physical & Social Science | 15 (88.2%) | 2 (11.8%) |
| Community & Social Service | 7 (17.1%) | 34 (82.9%) |
| Education, Arts & Media | 0 (0.0%) | 0 (0.0%) |
| Legal Services & Support | 0 (0.0%) | 0 (0.0%) |
| Education Instruction & Library | 7 (17.1%) | 34 (82.9%) |
| Arts, Media & Entertainment | 0 (0.0%) | 0 (0.0%) |
| Health Diagnosing & Treating | 0 (0.0%) | 42 (100.0%) |
| Health Technologists | 0 (0.0%) | 8 (100.0%) |
| Total (Category) | 74 (44.9%) | 91 (55.1%) |
| Total (Overall) | 683 (56.5%) | 525 (43.5%) |
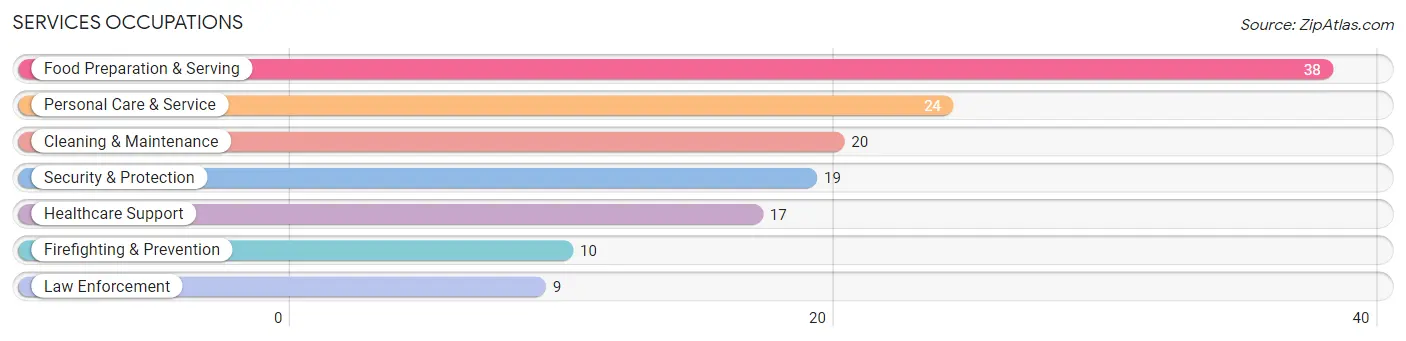
Services Occupations
The most common Services occupations in Aberdeen are Food Preparation & Serving (38 | 3.2%), Personal Care & Service (24 | 2.0%), Cleaning & Maintenance (20 | 1.7%), Security & Protection (19 | 1.6%), and Healthcare Support (17 | 1.4%).
Services Occupations by Sex
Within the Services occupations in Aberdeen, the most male-oriented occupations are Security & Protection (100.0%), Firefighting & Prevention (100.0%), and Law Enforcement (100.0%), while the most female-oriented occupations are Healthcare Support (100.0%), Food Preparation & Serving (100.0%), and Personal Care & Service (100.0%).
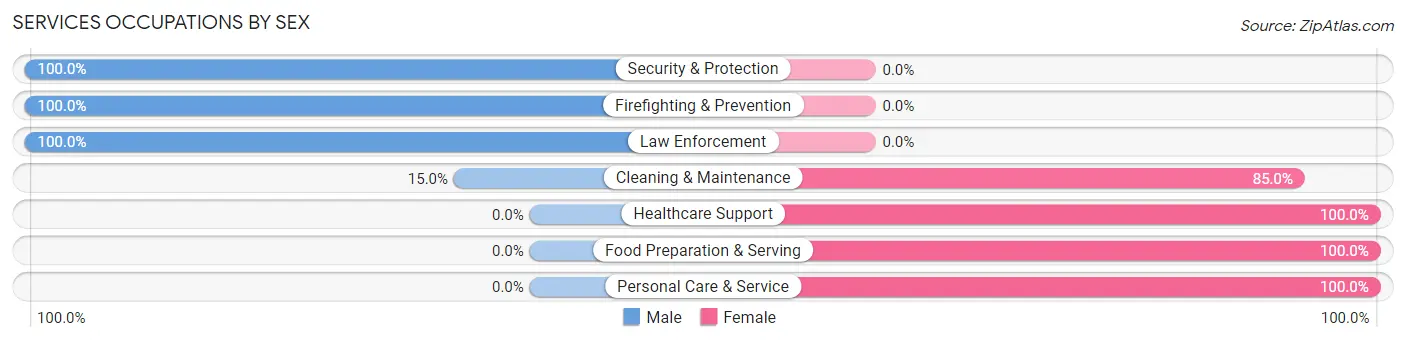
| Occupation | Male | Female |
| Healthcare Support | 0 (0.0%) | 17 (100.0%) |
| Security & Protection | 19 (100.0%) | 0 (0.0%) |
| Firefighting & Prevention | 10 (100.0%) | 0 (0.0%) |
| Law Enforcement | 9 (100.0%) | 0 (0.0%) |
| Food Preparation & Serving | 0 (0.0%) | 38 (100.0%) |
| Cleaning & Maintenance | 3 (15.0%) | 17 (85.0%) |
| Personal Care & Service | 0 (0.0%) | 24 (100.0%) |
| Total (Category) | 22 (18.6%) | 96 (81.4%) |
| Total (Overall) | 683 (56.5%) | 525 (43.5%) |
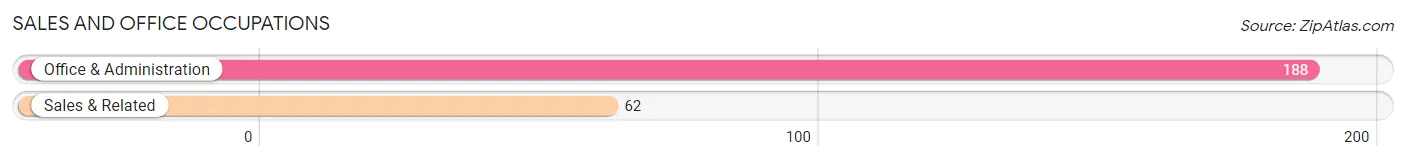
Sales and Office Occupations
The most common Sales and Office occupations in Aberdeen are Office & Administration (188 | 15.6%), and Sales & Related (62 | 5.1%).
Sales and Office Occupations by Sex
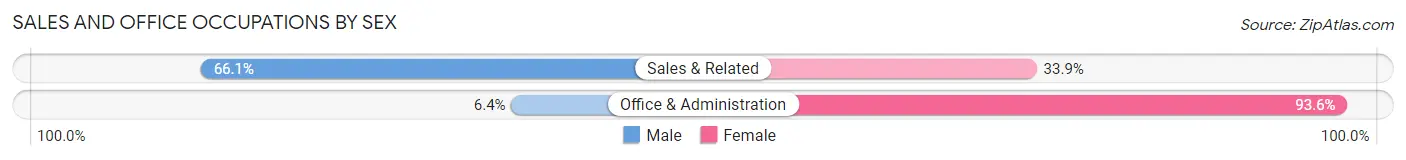
| Occupation | Male | Female |
| Sales & Related | 41 (66.1%) | 21 (33.9%) |
| Office & Administration | 12 (6.4%) | 176 (93.6%) |
| Total (Category) | 53 (21.2%) | 197 (78.8%) |
| Total (Overall) | 683 (56.5%) | 525 (43.5%) |
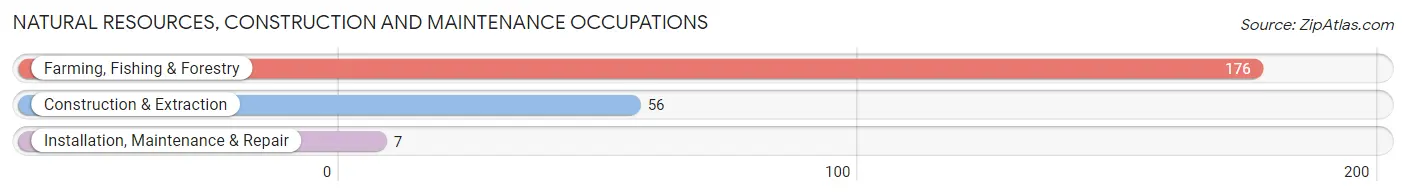
Natural Resources, Construction and Maintenance Occupations
The most common Natural Resources, Construction and Maintenance occupations in Aberdeen are Farming, Fishing & Forestry (176 | 14.6%), Construction & Extraction (56 | 4.6%), and Installation, Maintenance & Repair (7 | 0.6%).
Natural Resources, Construction and Maintenance Occupations by Sex
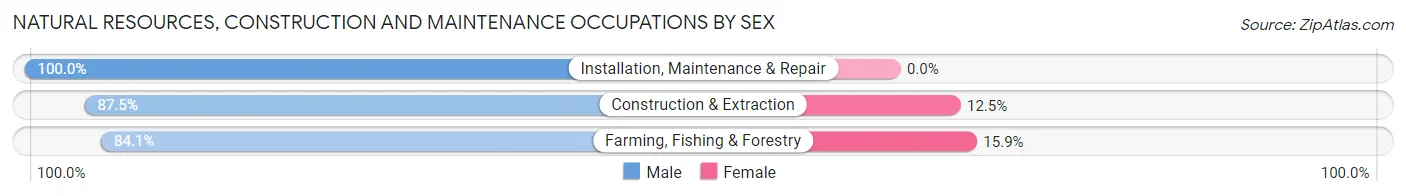
| Occupation | Male | Female |
| Farming, Fishing & Forestry | 148 (84.1%) | 28 (15.9%) |
| Construction & Extraction | 49 (87.5%) | 7 (12.5%) |
| Installation, Maintenance & Repair | 7 (100.0%) | 0 (0.0%) |
| Total (Category) | 204 (85.4%) | 35 (14.6%) |
| Total (Overall) | 683 (56.5%) | 525 (43.5%) |
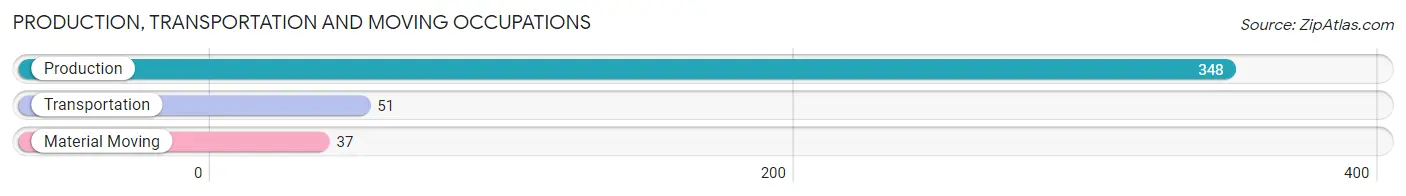
Production, Transportation and Moving Occupations
The most common Production, Transportation and Moving occupations in Aberdeen are Production (348 | 28.8%), Transportation (51 | 4.2%), and Material Moving (37 | 3.1%).
Production, Transportation and Moving Occupations by Sex
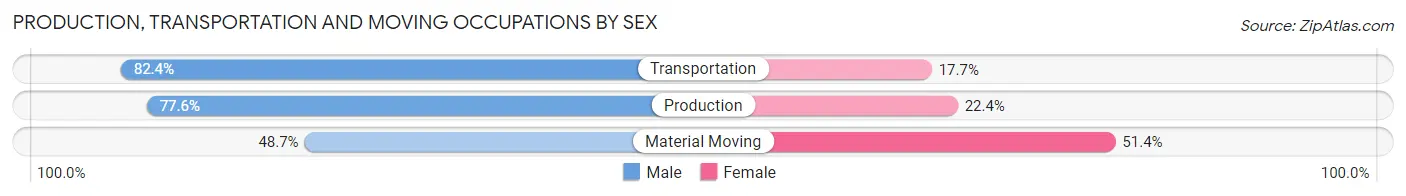
| Occupation | Male | Female |
| Production | 270 (77.6%) | 78 (22.4%) |
| Transportation | 42 (82.4%) | 9 (17.6%) |
| Material Moving | 18 (48.6%) | 19 (51.3%) |
| Total (Category) | 330 (75.7%) | 106 (24.3%) |
| Total (Overall) | 683 (56.5%) | 525 (43.5%) |
Employment Industries by Sex in Aberdeen
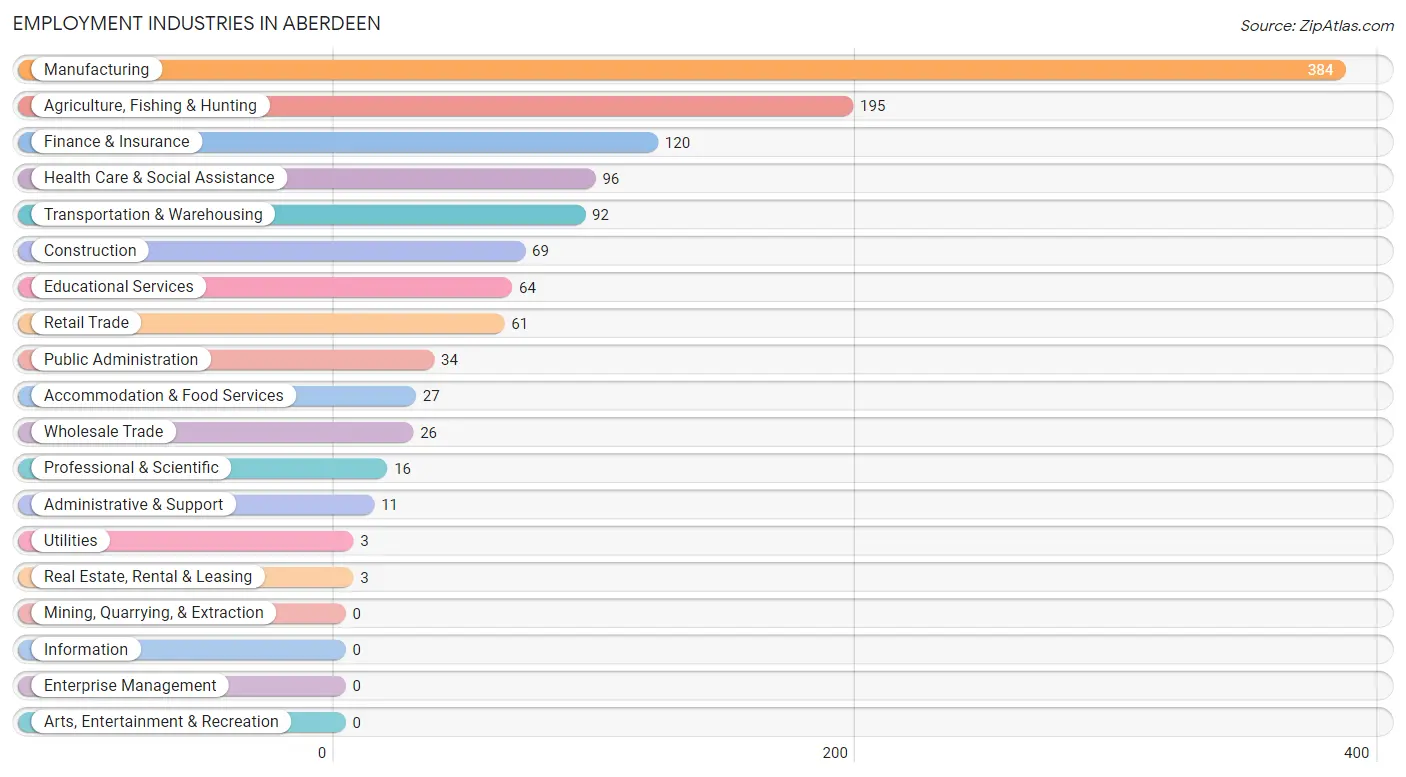
Employment Industries in Aberdeen
The major employment industries in Aberdeen include Manufacturing (384 | 31.8%), Agriculture, Fishing & Hunting (195 | 16.1%), Finance & Insurance (120 | 9.9%), Health Care & Social Assistance (96 | 8.0%), and Transportation & Warehousing (92 | 7.6%).
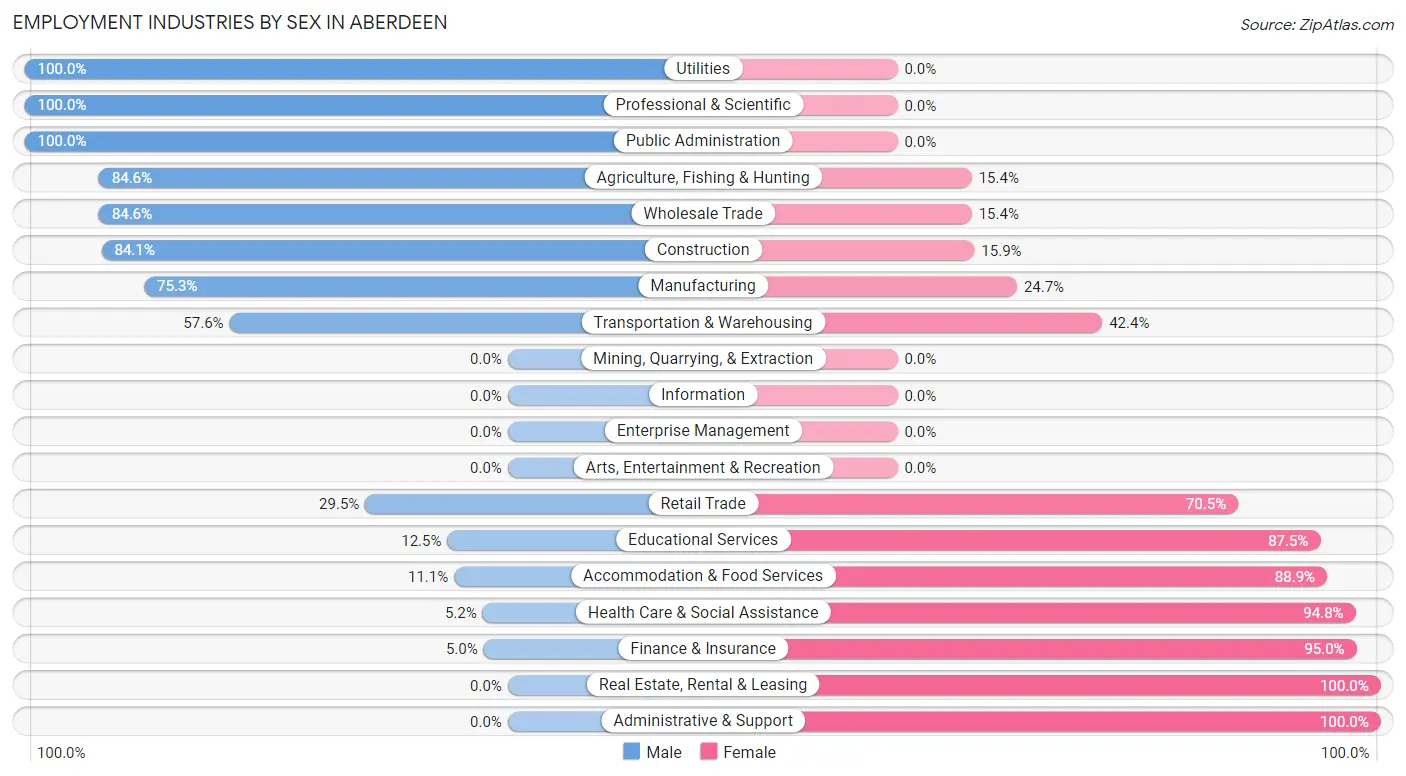
Employment Industries by Sex in Aberdeen
The Aberdeen industries that see more men than women are Utilities (100.0%), Professional & Scientific (100.0%), and Public Administration (100.0%), whereas the industries that tend to have a higher number of women are Real Estate, Rental & Leasing (100.0%), Administrative & Support (100.0%), and Finance & Insurance (95.0%).
| Industry | Male | Female |
| Agriculture, Fishing & Hunting | 165 (84.6%) | 30 (15.4%) |
| Mining, Quarrying, & Extraction | 0 (0.0%) | 0 (0.0%) |
| Construction | 58 (84.1%) | 11 (15.9%) |
| Manufacturing | 289 (75.3%) | 95 (24.7%) |
| Wholesale Trade | 22 (84.6%) | 4 (15.4%) |
| Retail Trade | 18 (29.5%) | 43 (70.5%) |
| Transportation & Warehousing | 53 (57.6%) | 39 (42.4%) |
| Utilities | 3 (100.0%) | 0 (0.0%) |
| Information | 0 (0.0%) | 0 (0.0%) |
| Finance & Insurance | 6 (5.0%) | 114 (95.0%) |
| Real Estate, Rental & Leasing | 0 (0.0%) | 3 (100.0%) |
| Professional & Scientific | 16 (100.0%) | 0 (0.0%) |
| Enterprise Management | 0 (0.0%) | 0 (0.0%) |
| Administrative & Support | 0 (0.0%) | 11 (100.0%) |
| Educational Services | 8 (12.5%) | 56 (87.5%) |
| Health Care & Social Assistance | 5 (5.2%) | 91 (94.8%) |
| Arts, Entertainment & Recreation | 0 (0.0%) | 0 (0.0%) |
| Accommodation & Food Services | 3 (11.1%) | 24 (88.9%) |
| Public Administration | 34 (100.0%) | 0 (0.0%) |
| Total | 683 (56.5%) | 525 (43.5%) |
Education in Aberdeen
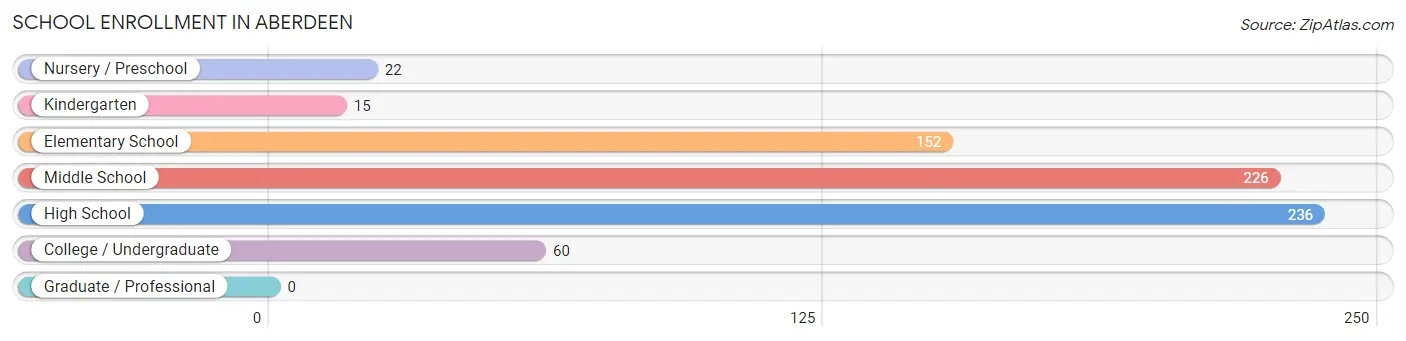
School Enrollment in Aberdeen
The most common levels of schooling among the 711 students in Aberdeen are high school (236 | 33.2%), middle school (226 | 31.8%), and elementary school (152 | 21.4%).
| School Level | # Students | % Students |
| Nursery / Preschool | 22 | 3.1% |
| Kindergarten | 15 | 2.1% |
| Elementary School | 152 | 21.4% |
| Middle School | 226 | 31.8% |
| High School | 236 | 33.2% |
| College / Undergraduate | 60 | 8.4% |
| Graduate / Professional | 0 | 0.0% |
| Total | 711 | 100.0% |
School Enrollment by Age by Funding Source in Aberdeen
Out of a total of 711 students who are enrolled in schools in Aberdeen, 63 (8.9%) attend a private institution, while the remaining 648 (91.1%) are enrolled in public schools. The age group of 3 to 4 year olds has the highest likelihood of being enrolled in private schools, with 2 (25.0% in the age bracket) enrolled. Conversely, the age group of 15 to 17 year olds has the lowest likelihood of being enrolled in a private school, with 151 (100.0% in the age bracket) attending a public institution.
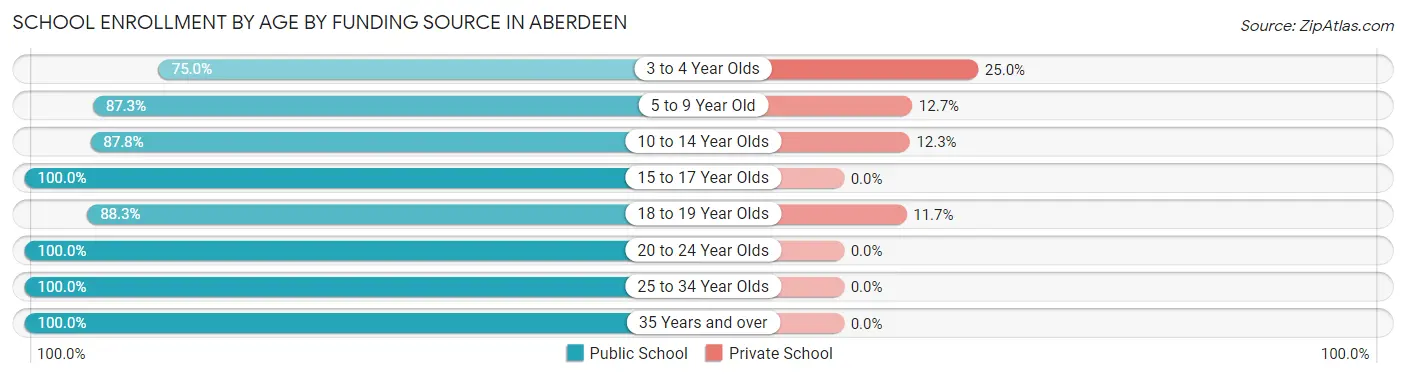
| Age Bracket | Public School | Private School |
| 3 to 4 Year Olds | 6 (75.0%) | 2 (25.0%) |
| 5 to 9 Year Old | 158 (87.3%) | 23 (12.7%) |
| 10 to 14 Year Olds | 222 (87.7%) | 31 (12.2%) |
| 15 to 17 Year Olds | 151 (100.0%) | 0 (0.0%) |
| 18 to 19 Year Olds | 53 (88.3%) | 7 (11.7%) |
| 20 to 24 Year Olds | 21 (100.0%) | 0 (0.0%) |
| 25 to 34 Year Olds | 13 (100.0%) | 0 (0.0%) |
| 35 Years and over | 24 (100.0%) | 0 (0.0%) |
| Total | 648 (91.1%) | 63 (8.9%) |
Educational Attainment by Field of Study in Aberdeen
Bio, nature & agricultural (24 | 22.0%), literature & languages (20 | 18.3%), business (17 | 15.6%), education (16 | 14.7%), and arts & humanities (11 | 10.1%) are the most common fields of study among 109 individuals in Aberdeen who have obtained a bachelor's degree or higher.
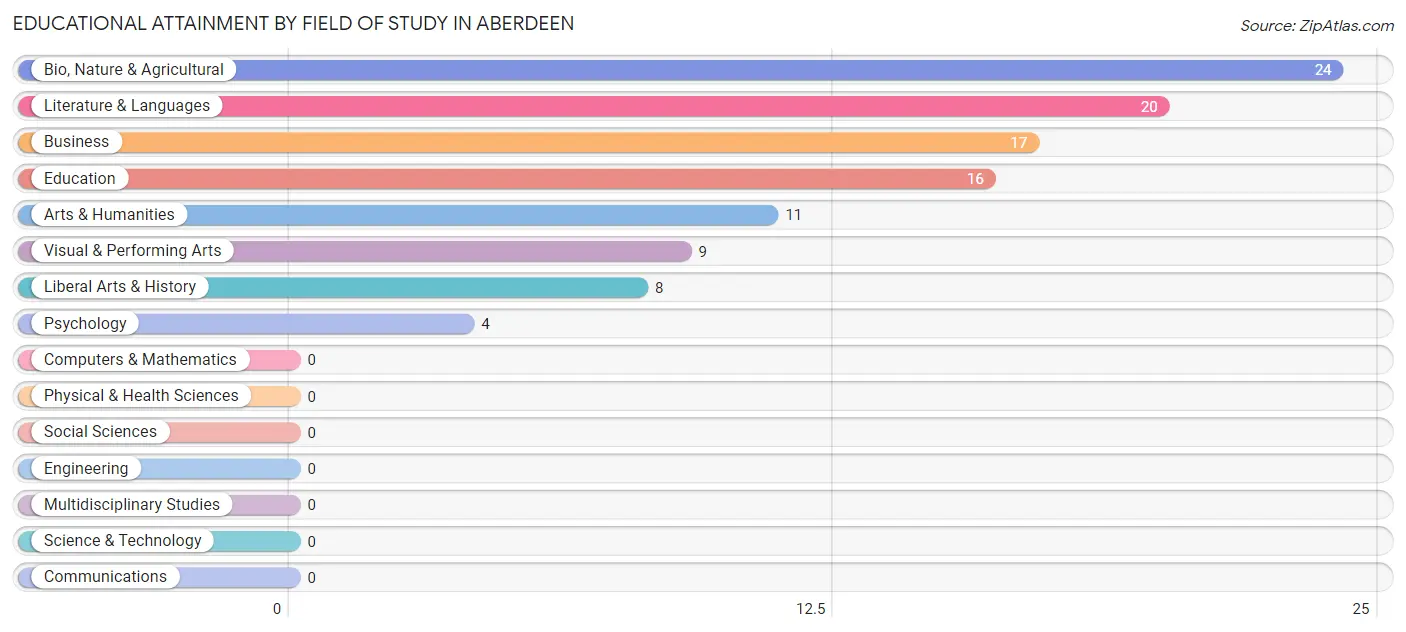
| Field of Study | # Graduates | % Graduates |
| Computers & Mathematics | 0 | 0.0% |
| Bio, Nature & Agricultural | 24 | 22.0% |
| Physical & Health Sciences | 0 | 0.0% |
| Psychology | 4 | 3.7% |
| Social Sciences | 0 | 0.0% |
| Engineering | 0 | 0.0% |
| Multidisciplinary Studies | 0 | 0.0% |
| Science & Technology | 0 | 0.0% |
| Business | 17 | 15.6% |
| Education | 16 | 14.7% |
| Literature & Languages | 20 | 18.3% |
| Liberal Arts & History | 8 | 7.3% |
| Visual & Performing Arts | 9 | 8.3% |
| Communications | 0 | 0.0% |
| Arts & Humanities | 11 | 10.1% |
| Total | 109 | 100.0% |
Transportation & Commute in Aberdeen
Vehicle Availability by Sex in Aberdeen
The most prevalent vehicle ownership categories in Aberdeen are males with 2 vehicles (334, accounting for 49.6%) and females with 2 vehicles (175, making up 64.5%).
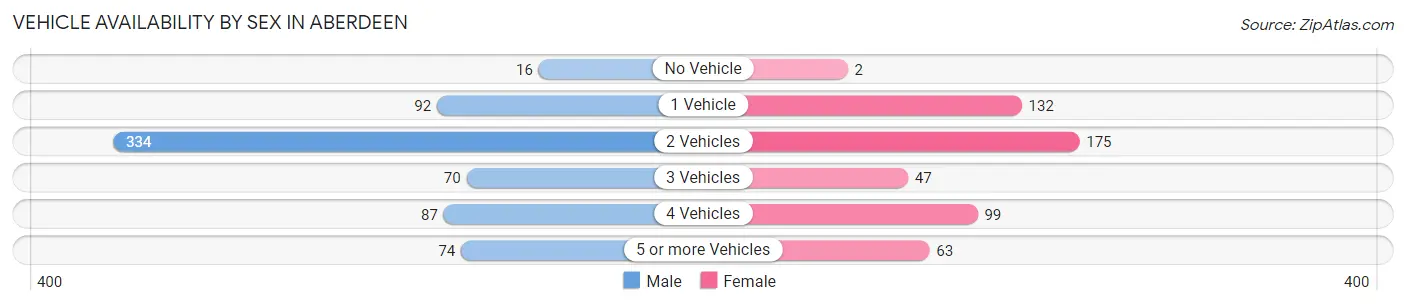
| Vehicles Available | Male | Female |
| No Vehicle | 16 (2.4%) | 2 (0.4%) |
| 1 Vehicle | 92 (13.7%) | 132 (25.5%) |
| 2 Vehicles | 334 (49.6%) | 175 (33.8%) |
| 3 Vehicles | 70 (10.4%) | 47 (9.1%) |
| 4 Vehicles | 87 (12.9%) | 99 (19.1%) |
| 5 or more Vehicles | 74 (11.0%) | 63 (12.2%) |
| Total | 673 (100.0%) | 518 (100.0%) |
Commute Time in Aberdeen
The most frequently occuring commute durations in Aberdeen are 45 to 59 minutes (285 commuters, 24.3%), 5 to 9 minutes (227 commuters, 19.4%), and less than 5 minutes (134 commuters, 11.4%).
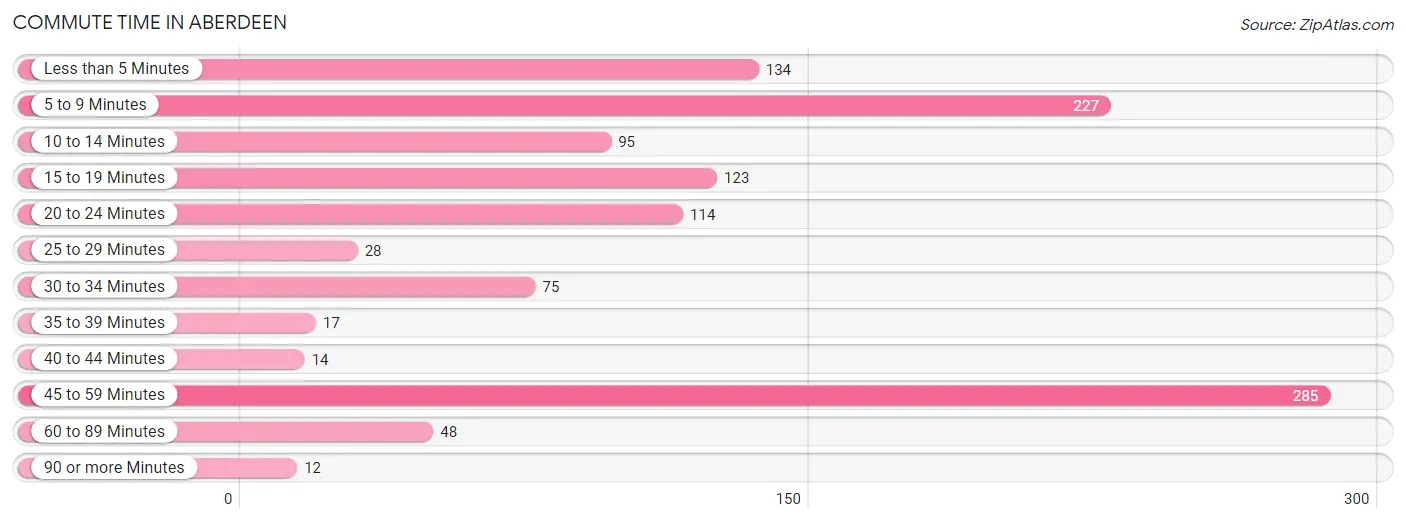
| Commute Time | # Commuters | % Commuters |
| Less than 5 Minutes | 134 | 11.4% |
| 5 to 9 Minutes | 227 | 19.4% |
| 10 to 14 Minutes | 95 | 8.1% |
| 15 to 19 Minutes | 123 | 10.5% |
| 20 to 24 Minutes | 114 | 9.7% |
| 25 to 29 Minutes | 28 | 2.4% |
| 30 to 34 Minutes | 75 | 6.4% |
| 35 to 39 Minutes | 17 | 1.5% |
| 40 to 44 Minutes | 14 | 1.2% |
| 45 to 59 Minutes | 285 | 24.3% |
| 60 to 89 Minutes | 48 | 4.1% |
| 90 or more Minutes | 12 | 1.0% |
Commute Time by Sex in Aberdeen
The most common commute times in Aberdeen are 45 to 59 minutes (219 commuters, 32.5%) for males and 5 to 9 minutes (167 commuters, 33.5%) for females.
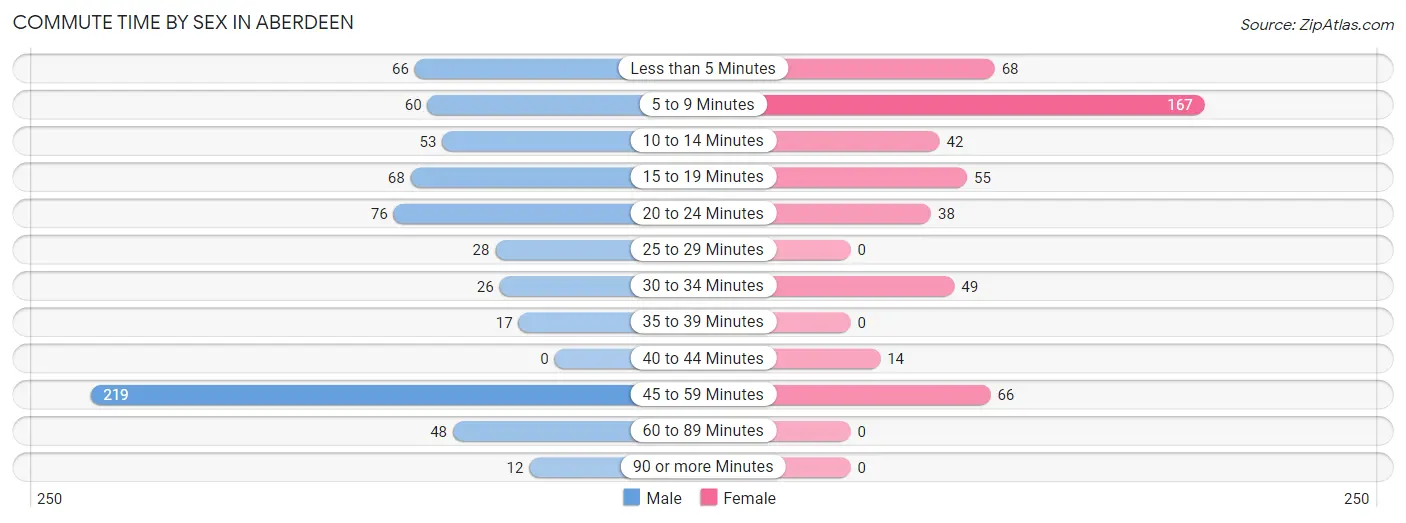
| Commute Time | Male | Female |
| Less than 5 Minutes | 66 (9.8%) | 68 (13.6%) |
| 5 to 9 Minutes | 60 (8.9%) | 167 (33.5%) |
| 10 to 14 Minutes | 53 (7.9%) | 42 (8.4%) |
| 15 to 19 Minutes | 68 (10.1%) | 55 (11.0%) |
| 20 to 24 Minutes | 76 (11.3%) | 38 (7.6%) |
| 25 to 29 Minutes | 28 (4.2%) | 0 (0.0%) |
| 30 to 34 Minutes | 26 (3.9%) | 49 (9.8%) |
| 35 to 39 Minutes | 17 (2.5%) | 0 (0.0%) |
| 40 to 44 Minutes | 0 (0.0%) | 14 (2.8%) |
| 45 to 59 Minutes | 219 (32.5%) | 66 (13.2%) |
| 60 to 89 Minutes | 48 (7.1%) | 0 (0.0%) |
| 90 or more Minutes | 12 (1.8%) | 0 (0.0%) |
Time of Departure to Work by Sex in Aberdeen
The most frequent times of departure to work in Aberdeen are 5:30 AM to 5:59 AM (187, 27.8%) for males and 8:00 AM to 8:29 AM (153, 30.7%) for females.
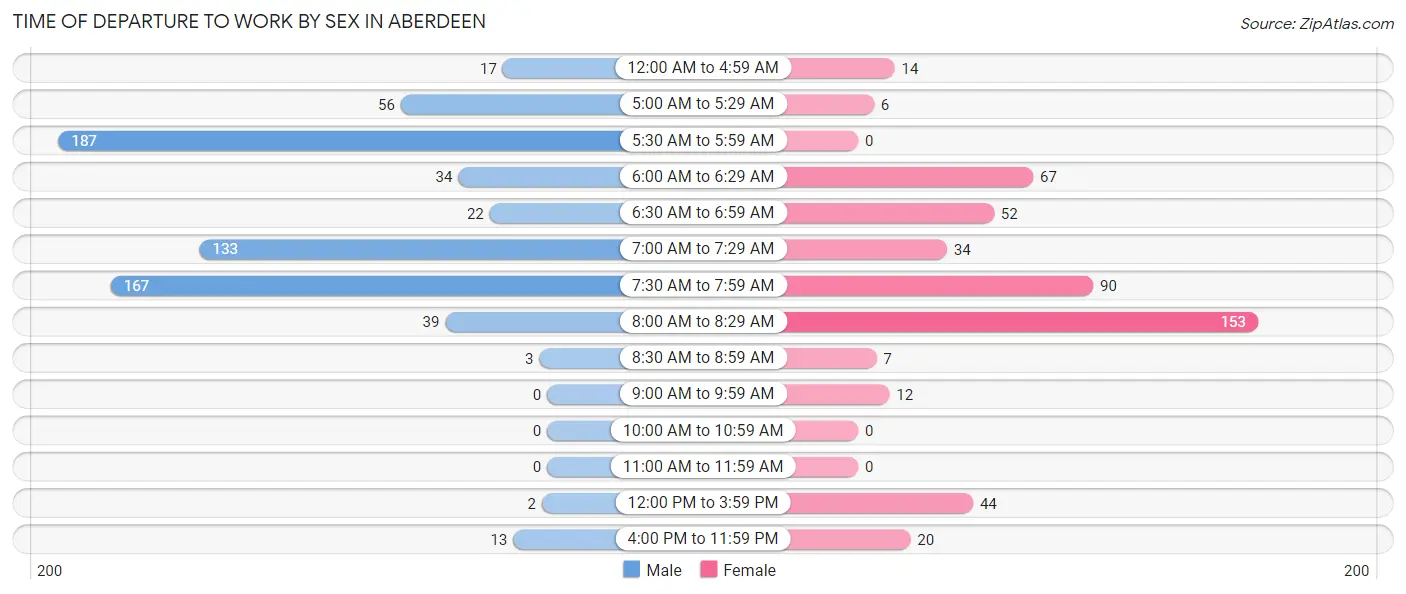
| Time of Departure | Male | Female |
| 12:00 AM to 4:59 AM | 17 (2.5%) | 14 (2.8%) |
| 5:00 AM to 5:29 AM | 56 (8.3%) | 6 (1.2%) |
| 5:30 AM to 5:59 AM | 187 (27.8%) | 0 (0.0%) |
| 6:00 AM to 6:29 AM | 34 (5.1%) | 67 (13.4%) |
| 6:30 AM to 6:59 AM | 22 (3.3%) | 52 (10.4%) |
| 7:00 AM to 7:29 AM | 133 (19.8%) | 34 (6.8%) |
| 7:30 AM to 7:59 AM | 167 (24.8%) | 90 (18.0%) |
| 8:00 AM to 8:29 AM | 39 (5.8%) | 153 (30.7%) |
| 8:30 AM to 8:59 AM | 3 (0.4%) | 7 (1.4%) |
| 9:00 AM to 9:59 AM | 0 (0.0%) | 12 (2.4%) |
| 10:00 AM to 10:59 AM | 0 (0.0%) | 0 (0.0%) |
| 11:00 AM to 11:59 AM | 0 (0.0%) | 0 (0.0%) |
| 12:00 PM to 3:59 PM | 2 (0.3%) | 44 (8.8%) |
| 4:00 PM to 11:59 PM | 13 (1.9%) | 20 (4.0%) |
| Total | 673 (100.0%) | 499 (100.0%) |
Housing Occupancy in Aberdeen
Occupancy by Ownership in Aberdeen
Of the total 741 dwellings in Aberdeen, owner-occupied units account for 610 (82.3%), while renter-occupied units make up 131 (17.7%).
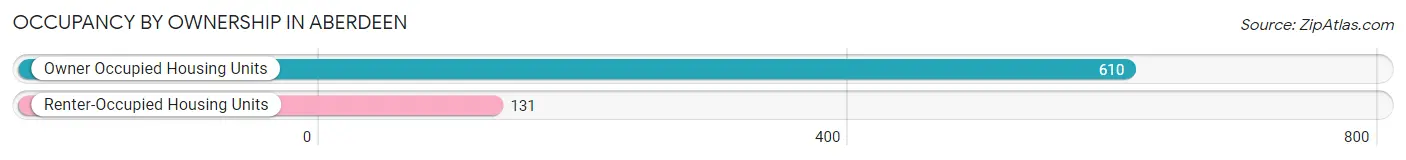
| Occupancy | # Housing Units | % Housing Units |
| Owner Occupied Housing Units | 610 | 82.3% |
| Renter-Occupied Housing Units | 131 | 17.7% |
| Total Occupied Housing Units | 741 | 100.0% |
Occupancy by Household Size in Aberdeen
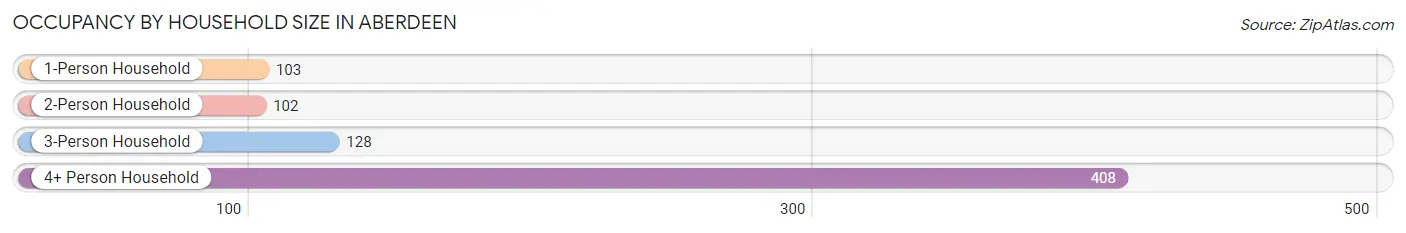
| Household Size | # Housing Units | % Housing Units |
| 1-Person Household | 103 | 13.9% |
| 2-Person Household | 102 | 13.8% |
| 3-Person Household | 128 | 17.3% |
| 4+ Person Household | 408 | 55.1% |
| Total Housing Units | 741 | 100.0% |
Occupancy by Ownership by Household Size in Aberdeen
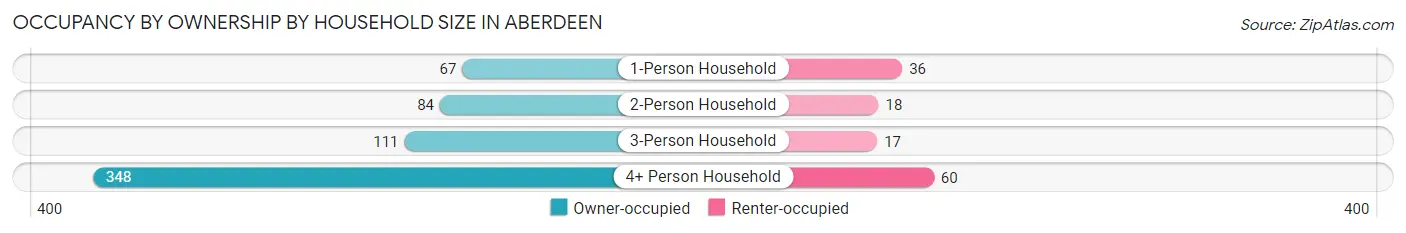
| Household Size | Owner-occupied | Renter-occupied |
| 1-Person Household | 67 (65.0%) | 36 (34.9%) |
| 2-Person Household | 84 (82.4%) | 18 (17.6%) |
| 3-Person Household | 111 (86.7%) | 17 (13.3%) |
| 4+ Person Household | 348 (85.3%) | 60 (14.7%) |
| Total Housing Units | 610 (82.3%) | 131 (17.7%) |
Occupancy by Educational Attainment in Aberdeen
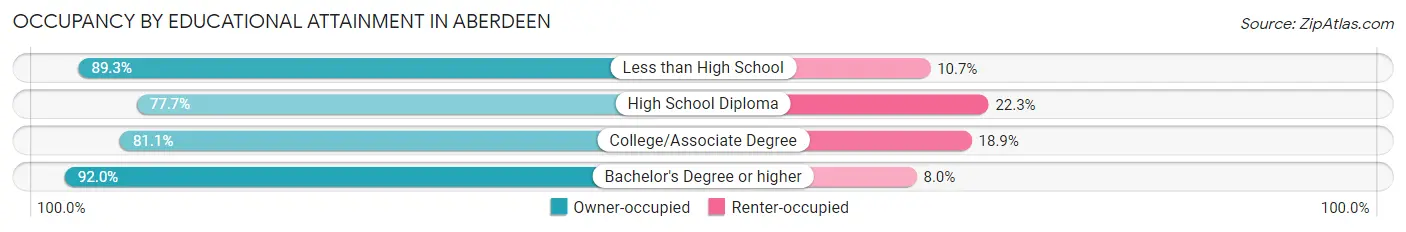
| Household Size | Owner-occupied | Renter-occupied |
| Less than High School | 150 (89.3%) | 18 (10.7%) |
| High School Diploma | 234 (77.7%) | 67 (22.3%) |
| College/Associate Degree | 180 (81.1%) | 42 (18.9%) |
| Bachelor's Degree or higher | 46 (92.0%) | 4 (8.0%) |
Occupancy by Age of Householder in Aberdeen
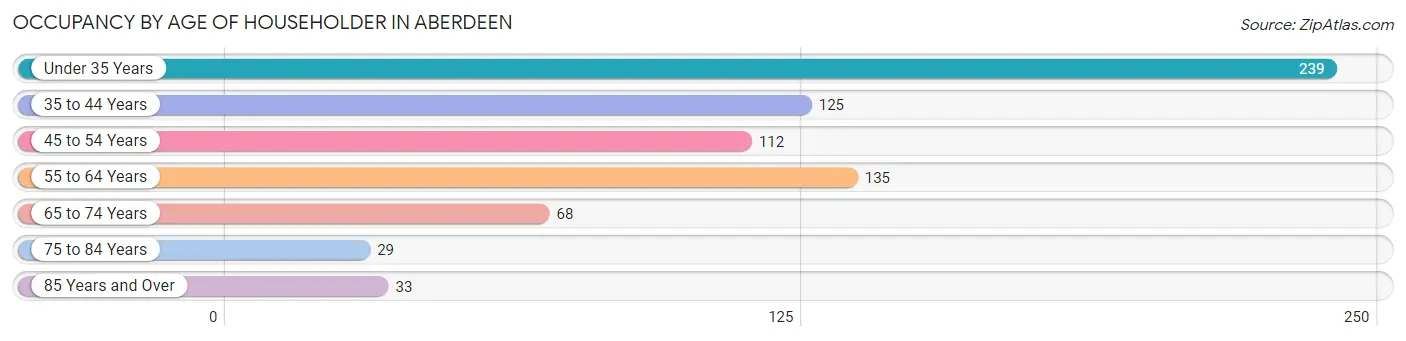
| Age Bracket | # Households | % Households |
| Under 35 Years | 239 | 32.3% |
| 35 to 44 Years | 125 | 16.9% |
| 45 to 54 Years | 112 | 15.1% |
| 55 to 64 Years | 135 | 18.2% |
| 65 to 74 Years | 68 | 9.2% |
| 75 to 84 Years | 29 | 3.9% |
| 85 Years and Over | 33 | 4.4% |
| Total | 741 | 100.0% |
Housing Finances in Aberdeen
Median Income by Occupancy in Aberdeen
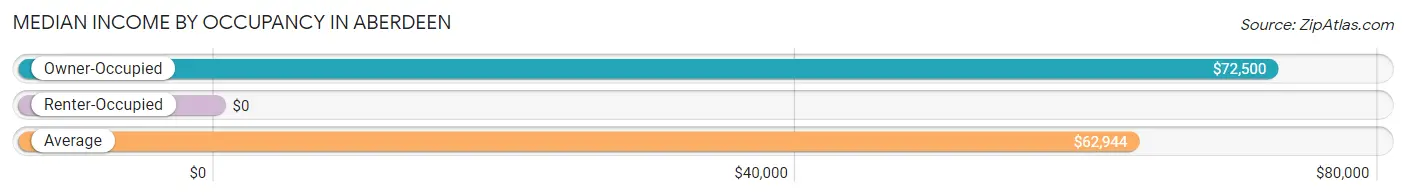
| Occupancy Type | # Households | Median Income |
| Owner-Occupied | 610 (82.3%) | $72,500 |
| Renter-Occupied | 131 (17.7%) | $0 |
| Average | 741 (100.0%) | $62,944 |
Occupancy by Householder Income Bracket in Aberdeen
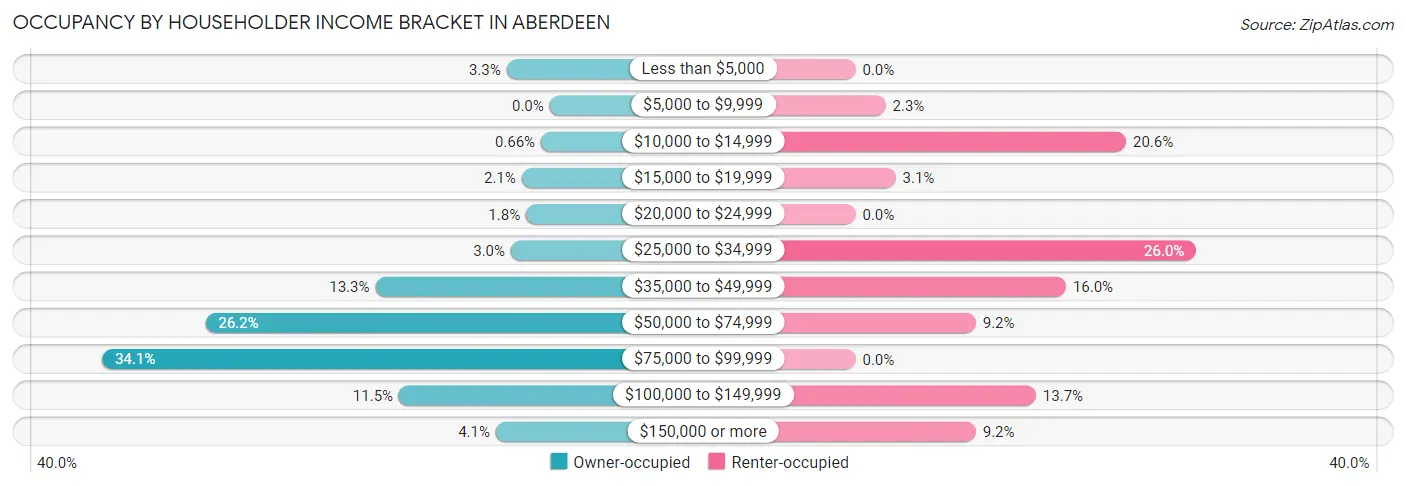
| Income Bracket | Owner-occupied | Renter-occupied |
| Less than $5,000 | 20 (3.3%) | 0 (0.0%) |
| $5,000 to $9,999 | 0 (0.0%) | 3 (2.3%) |
| $10,000 to $14,999 | 4 (0.7%) | 27 (20.6%) |
| $15,000 to $19,999 | 13 (2.1%) | 4 (3.0%) |
| $20,000 to $24,999 | 11 (1.8%) | 0 (0.0%) |
| $25,000 to $34,999 | 18 (2.9%) | 34 (26.0%) |
| $35,000 to $49,999 | 81 (13.3%) | 21 (16.0%) |
| $50,000 to $74,999 | 160 (26.2%) | 12 (9.2%) |
| $75,000 to $99,999 | 208 (34.1%) | 0 (0.0%) |
| $100,000 to $149,999 | 70 (11.5%) | 18 (13.7%) |
| $150,000 or more | 25 (4.1%) | 12 (9.2%) |
| Total | 610 (100.0%) | 131 (100.0%) |
Monthly Housing Cost Tiers in Aberdeen
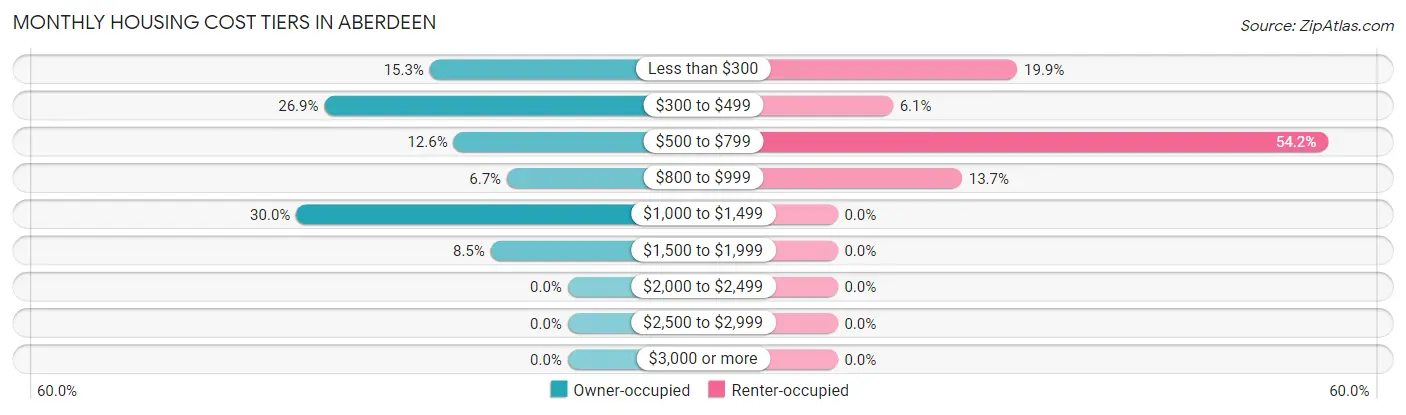
| Monthly Cost | Owner-occupied | Renter-occupied |
| Less than $300 | 93 (15.2%) | 26 (19.9%) |
| $300 to $499 | 164 (26.9%) | 8 (6.1%) |
| $500 to $799 | 77 (12.6%) | 71 (54.2%) |
| $800 to $999 | 41 (6.7%) | 18 (13.7%) |
| $1,000 to $1,499 | 183 (30.0%) | 0 (0.0%) |
| $1,500 to $1,999 | 52 (8.5%) | 0 (0.0%) |
| $2,000 to $2,499 | 0 (0.0%) | 0 (0.0%) |
| $2,500 to $2,999 | 0 (0.0%) | 0 (0.0%) |
| $3,000 or more | 0 (0.0%) | 0 (0.0%) |
| Total | 610 (100.0%) | 131 (100.0%) |
Physical Housing Characteristics in Aberdeen
Housing Structures in Aberdeen
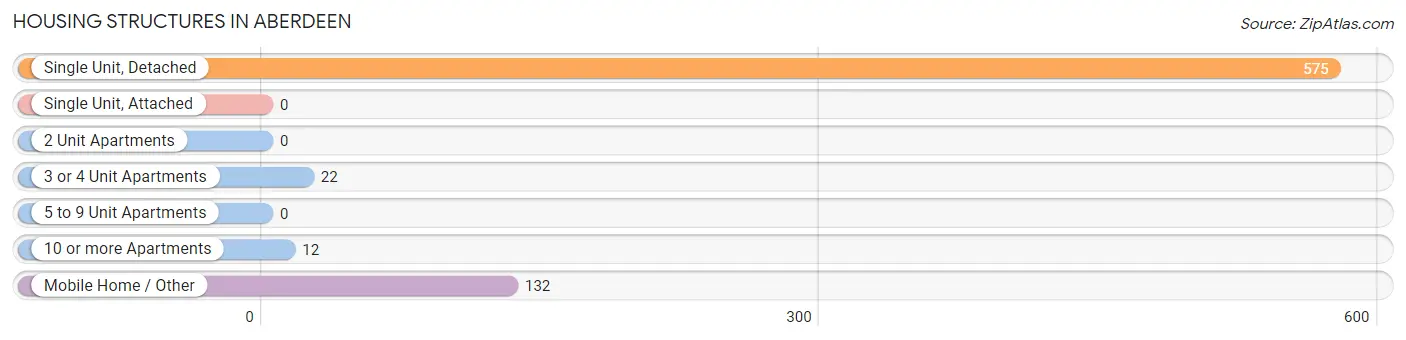
| Structure Type | # Housing Units | % Housing Units |
| Single Unit, Detached | 575 | 77.6% |
| Single Unit, Attached | 0 | 0.0% |
| 2 Unit Apartments | 0 | 0.0% |
| 3 or 4 Unit Apartments | 22 | 3.0% |
| 5 to 9 Unit Apartments | 0 | 0.0% |
| 10 or more Apartments | 12 | 1.6% |
| Mobile Home / Other | 132 | 17.8% |
| Total | 741 | 100.0% |
Housing Structures by Occupancy in Aberdeen
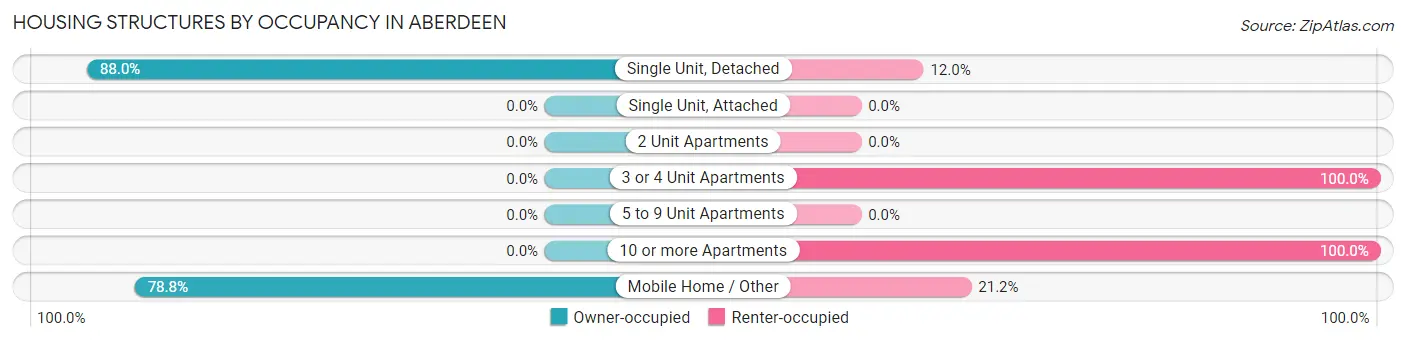
| Structure Type | Owner-occupied | Renter-occupied |
| Single Unit, Detached | 506 (88.0%) | 69 (12.0%) |
| Single Unit, Attached | 0 (0.0%) | 0 (0.0%) |
| 2 Unit Apartments | 0 (0.0%) | 0 (0.0%) |
| 3 or 4 Unit Apartments | 0 (0.0%) | 22 (100.0%) |
| 5 to 9 Unit Apartments | 0 (0.0%) | 0 (0.0%) |
| 10 or more Apartments | 0 (0.0%) | 12 (100.0%) |
| Mobile Home / Other | 104 (78.8%) | 28 (21.2%) |
| Total | 610 (82.3%) | 131 (17.7%) |
Housing Structures by Number of Rooms in Aberdeen
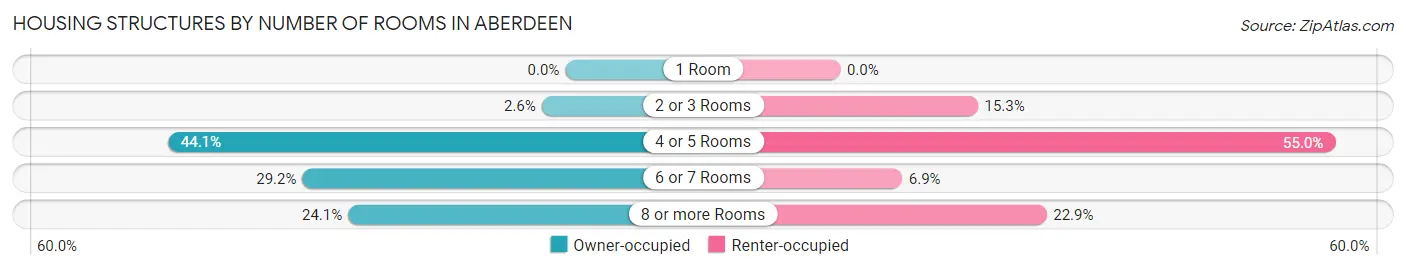
| Number of Rooms | Owner-occupied | Renter-occupied |
| 1 Room | 0 (0.0%) | 0 (0.0%) |
| 2 or 3 Rooms | 16 (2.6%) | 20 (15.3%) |
| 4 or 5 Rooms | 269 (44.1%) | 72 (55.0%) |
| 6 or 7 Rooms | 178 (29.2%) | 9 (6.9%) |
| 8 or more Rooms | 147 (24.1%) | 30 (22.9%) |
| Total | 610 (100.0%) | 131 (100.0%) |
Housing Structure by Heating Type in Aberdeen
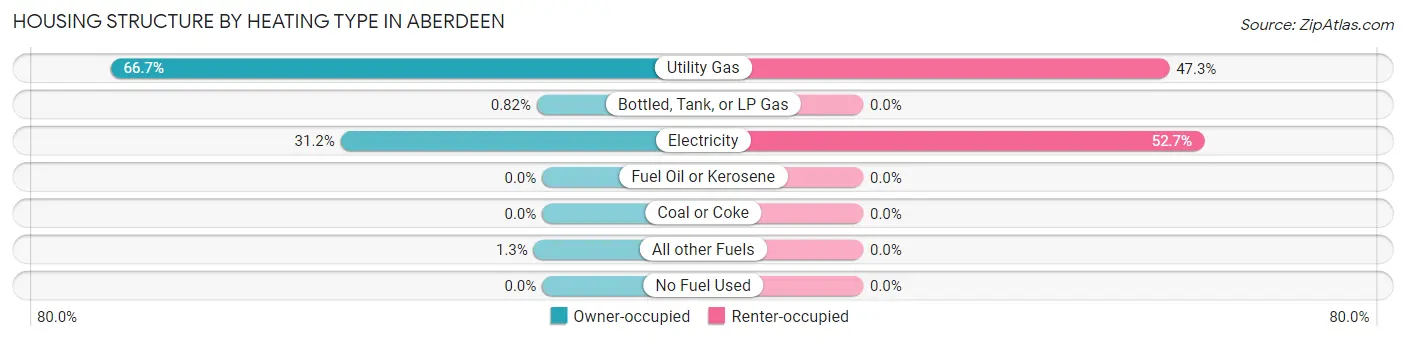
| Heating Type | Owner-occupied | Renter-occupied |
| Utility Gas | 407 (66.7%) | 62 (47.3%) |
| Bottled, Tank, or LP Gas | 5 (0.8%) | 0 (0.0%) |
| Electricity | 190 (31.1%) | 69 (52.7%) |
| Fuel Oil or Kerosene | 0 (0.0%) | 0 (0.0%) |
| Coal or Coke | 0 (0.0%) | 0 (0.0%) |
| All other Fuels | 8 (1.3%) | 0 (0.0%) |
| No Fuel Used | 0 (0.0%) | 0 (0.0%) |
| Total | 610 (100.0%) | 131 (100.0%) |
Household Vehicle Usage in Aberdeen
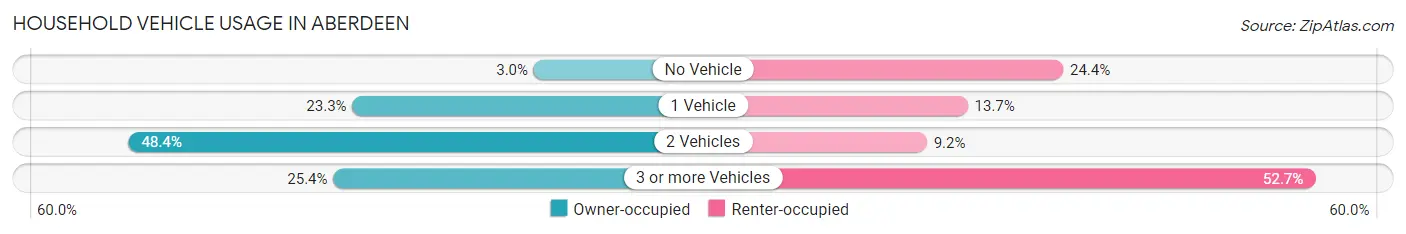
| Vehicles per Household | Owner-occupied | Renter-occupied |
| No Vehicle | 18 (2.9%) | 32 (24.4%) |
| 1 Vehicle | 142 (23.3%) | 18 (13.7%) |
| 2 Vehicles | 295 (48.4%) | 12 (9.2%) |
| 3 or more Vehicles | 155 (25.4%) | 69 (52.7%) |
| Total | 610 (100.0%) | 131 (100.0%) |
Real Estate & Mortgages in Aberdeen
Real Estate and Mortgage Overview in Aberdeen
| Characteristic | Without Mortgage | With Mortgage |
| Housing Units | 304 | 306 |
| Median Property Value | $137,300 | $141,200 |
| Median Household Income | $58,594 | $6 |
| Monthly Housing Costs | $375 | $0 |
| Real Estate Taxes | $1,018 | $8 |
Property Value by Mortgage Status in Aberdeen
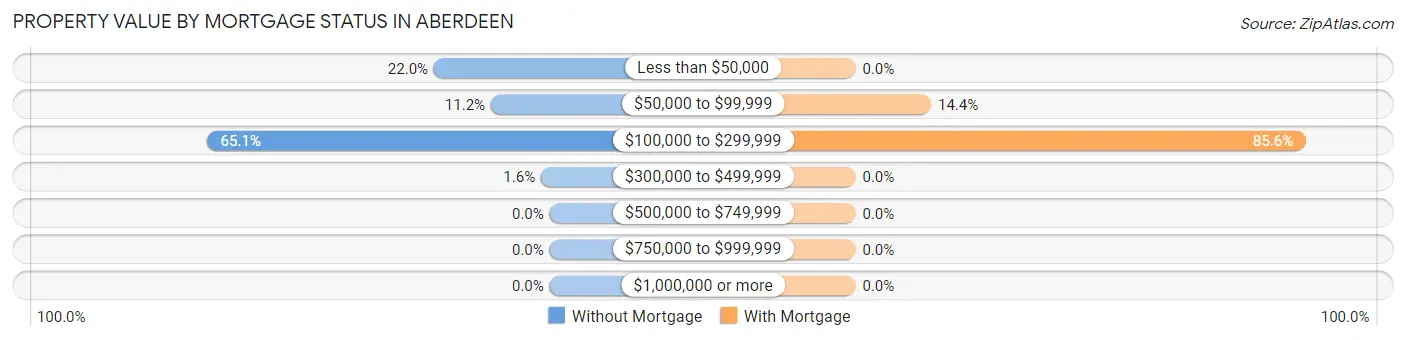
| Property Value | Without Mortgage | With Mortgage |
| Less than $50,000 | 67 (22.0%) | 0 (0.0%) |
| $50,000 to $99,999 | 34 (11.2%) | 44 (14.4%) |
| $100,000 to $299,999 | 198 (65.1%) | 262 (85.6%) |
| $300,000 to $499,999 | 5 (1.6%) | 0 (0.0%) |
| $500,000 to $749,999 | 0 (0.0%) | 0 (0.0%) |
| $750,000 to $999,999 | 0 (0.0%) | 0 (0.0%) |
| $1,000,000 or more | 0 (0.0%) | 0 (0.0%) |
| Total | 304 (100.0%) | 306 (100.0%) |
Household Income by Mortgage Status in Aberdeen
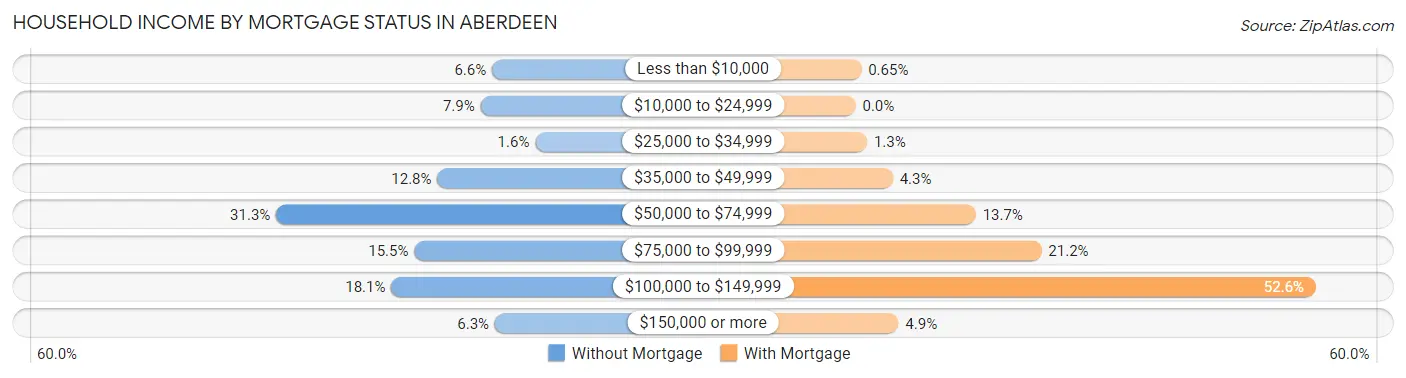
| Household Income | Without Mortgage | With Mortgage |
| Less than $10,000 | 20 (6.6%) | 2 (0.6%) |
| $10,000 to $24,999 | 24 (7.9%) | 0 (0.0%) |
| $25,000 to $34,999 | 5 (1.6%) | 4 (1.3%) |
| $35,000 to $49,999 | 39 (12.8%) | 13 (4.3%) |
| $50,000 to $74,999 | 95 (31.2%) | 42 (13.7%) |
| $75,000 to $99,999 | 47 (15.5%) | 65 (21.2%) |
| $100,000 to $149,999 | 55 (18.1%) | 161 (52.6%) |
| $150,000 or more | 19 (6.2%) | 15 (4.9%) |
| Total | 304 (100.0%) | 306 (100.0%) |
Property Value to Household Income Ratio in Aberdeen
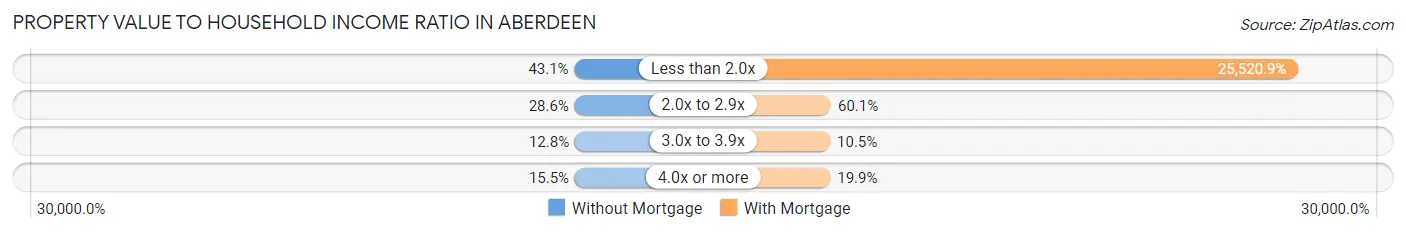
| Value-to-Income Ratio | Without Mortgage | With Mortgage |
| Less than 2.0x | 131 (43.1%) | 78,094 (25,520.9%) |
| 2.0x to 2.9x | 87 (28.6%) | 184 (60.1%) |
| 3.0x to 3.9x | 39 (12.8%) | 32 (10.5%) |
| 4.0x or more | 47 (15.5%) | 61 (19.9%) |
| Total | 304 (100.0%) | 306 (100.0%) |
Real Estate Taxes by Mortgage Status in Aberdeen
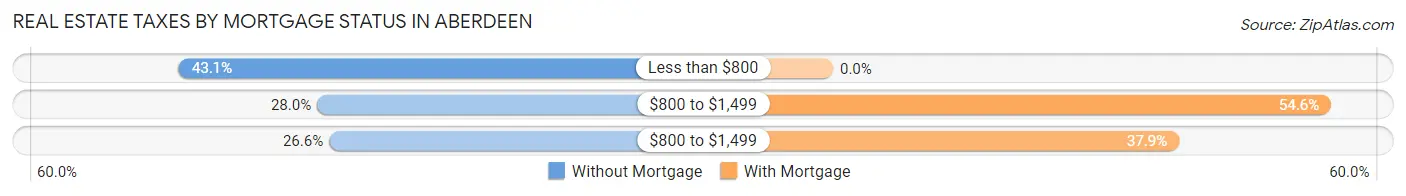
| Property Taxes | Without Mortgage | With Mortgage |
| Less than $800 | 131 (43.1%) | 0 (0.0%) |
| $800 to $1,499 | 85 (28.0%) | 167 (54.6%) |
| $800 to $1,499 | 81 (26.6%) | 116 (37.9%) |
| Total | 304 (100.0%) | 306 (100.0%) |
Health & Disability in Aberdeen
Health Insurance Coverage by Age in Aberdeen
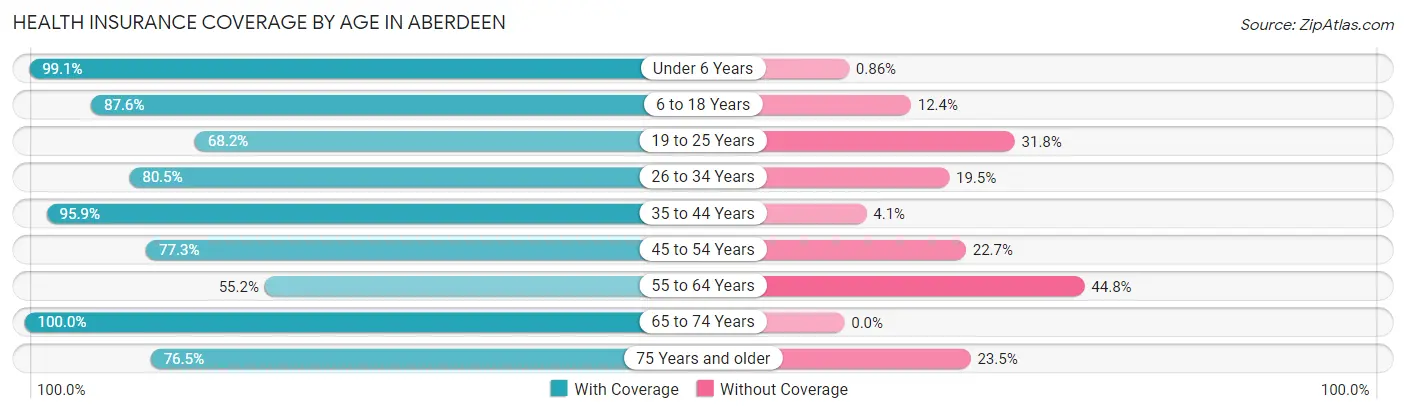
| Age Bracket | With Coverage | Without Coverage |
| Under 6 Years | 345 (99.1%) | 3 (0.9%) |
| 6 to 18 Years | 565 (87.6%) | 80 (12.4%) |
| 19 to 25 Years | 275 (68.2%) | 128 (31.8%) |
| 26 to 34 Years | 276 (80.5%) | 67 (19.5%) |
| 35 to 44 Years | 210 (95.9%) | 9 (4.1%) |
| 45 to 54 Years | 157 (77.3%) | 46 (22.7%) |
| 55 to 64 Years | 127 (55.2%) | 103 (44.8%) |
| 65 to 74 Years | 101 (100.0%) | 0 (0.0%) |
| 75 Years and older | 91 (76.5%) | 28 (23.5%) |
| Total | 2,147 (82.2%) | 464 (17.8%) |
Health Insurance Coverage by Citizenship Status in Aberdeen
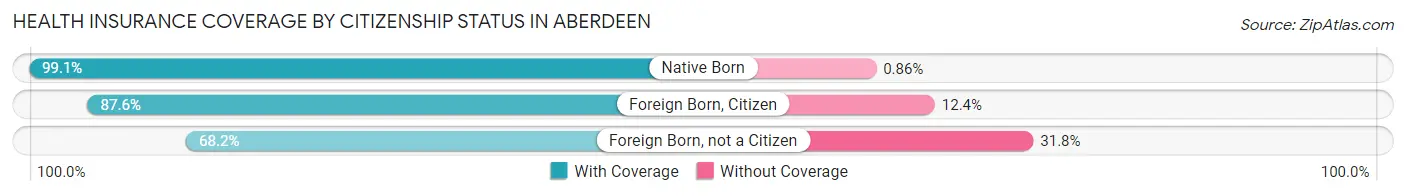
| Citizenship Status | With Coverage | Without Coverage |
| Native Born | 345 (99.1%) | 3 (0.9%) |
| Foreign Born, Citizen | 565 (87.6%) | 80 (12.4%) |
| Foreign Born, not a Citizen | 275 (68.2%) | 128 (31.8%) |
Health Insurance Coverage by Household Income in Aberdeen
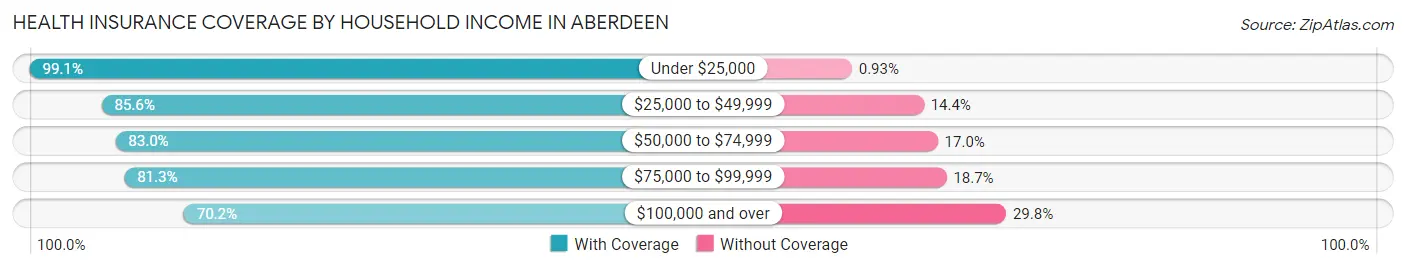
| Household Income | With Coverage | Without Coverage |
| Under $25,000 | 214 (99.1%) | 2 (0.9%) |
| $25,000 to $49,999 | 380 (85.6%) | 64 (14.4%) |
| $50,000 to $74,999 | 658 (83.0%) | 135 (17.0%) |
| $75,000 to $99,999 | 601 (81.3%) | 138 (18.7%) |
| $100,000 and over | 294 (70.2%) | 125 (29.8%) |
Public vs Private Health Insurance Coverage by Age in Aberdeen
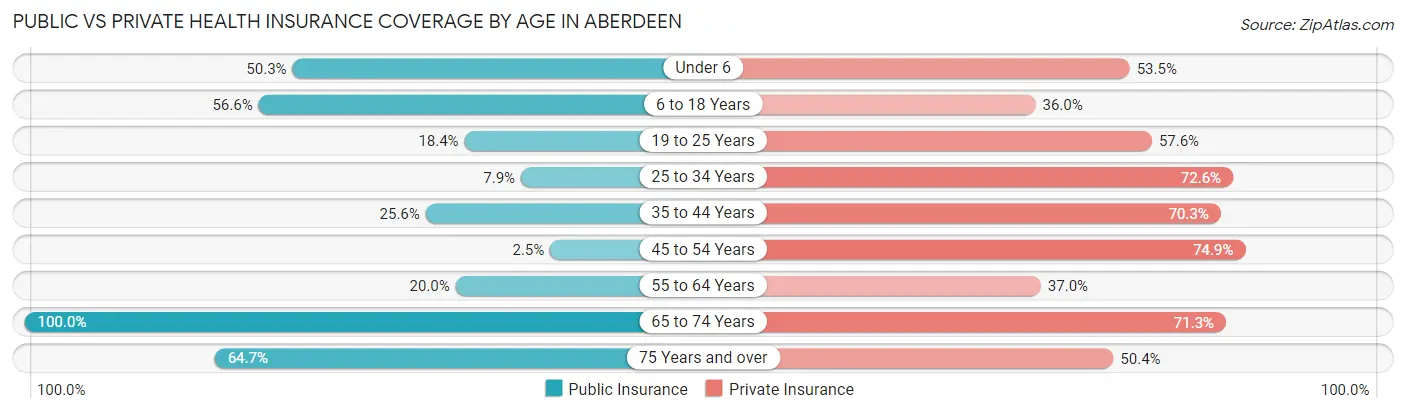
| Age Bracket | Public Insurance | Private Insurance |
| Under 6 | 175 (50.3%) | 186 (53.4%) |
| 6 to 18 Years | 365 (56.6%) | 232 (36.0%) |
| 19 to 25 Years | 74 (18.4%) | 232 (57.6%) |
| 25 to 34 Years | 27 (7.9%) | 249 (72.6%) |
| 35 to 44 Years | 56 (25.6%) | 154 (70.3%) |
| 45 to 54 Years | 5 (2.5%) | 152 (74.9%) |
| 55 to 64 Years | 46 (20.0%) | 85 (37.0%) |
| 65 to 74 Years | 101 (100.0%) | 72 (71.3%) |
| 75 Years and over | 77 (64.7%) | 60 (50.4%) |
| Total | 926 (35.5%) | 1,422 (54.5%) |
Disability Status by Sex by Age in Aberdeen
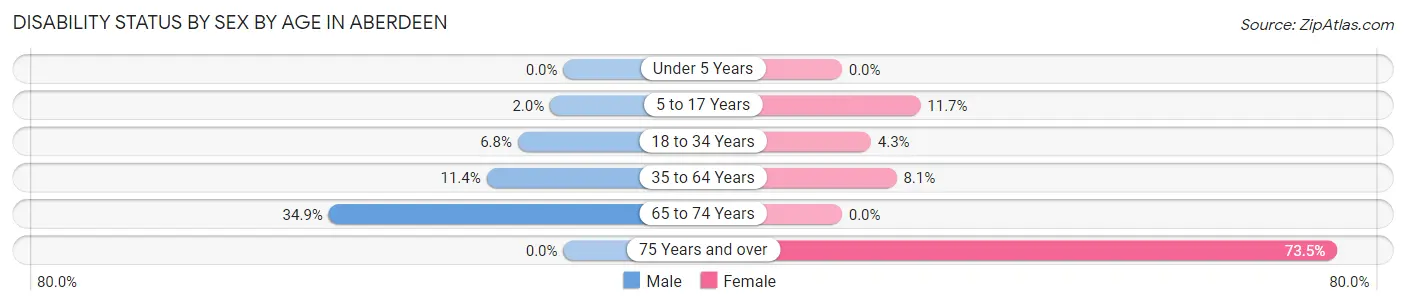
| Age Bracket | Male | Female |
| Under 5 Years | 0 (0.0%) | 0 (0.0%) |
| 5 to 17 Years | 6 (2.0%) | 37 (11.7%) |
| 18 to 34 Years | 28 (6.8%) | 17 (4.3%) |
| 35 to 64 Years | 35 (11.4%) | 28 (8.1%) |
| 65 to 74 Years | 23 (34.8%) | 0 (0.0%) |
| 75 Years and over | 0 (0.0%) | 75 (73.5%) |
Disability Class by Sex by Age in Aberdeen
Disability Class: Hearing Difficulty
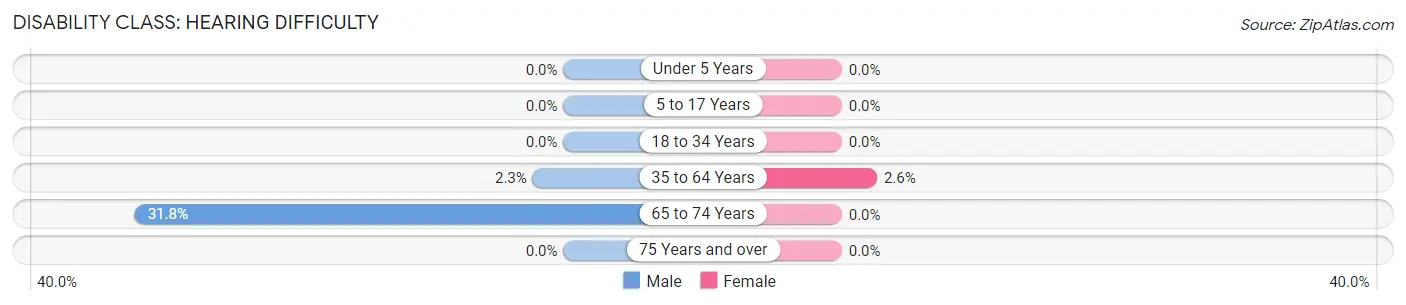
| Age Bracket | Male | Female |
| Under 5 Years | 0 (0.0%) | 0 (0.0%) |
| 5 to 17 Years | 0 (0.0%) | 0 (0.0%) |
| 18 to 34 Years | 0 (0.0%) | 0 (0.0%) |
| 35 to 64 Years | 7 (2.3%) | 9 (2.6%) |
| 65 to 74 Years | 21 (31.8%) | 0 (0.0%) |
| 75 Years and over | 0 (0.0%) | 0 (0.0%) |
Disability Class: Vision Difficulty
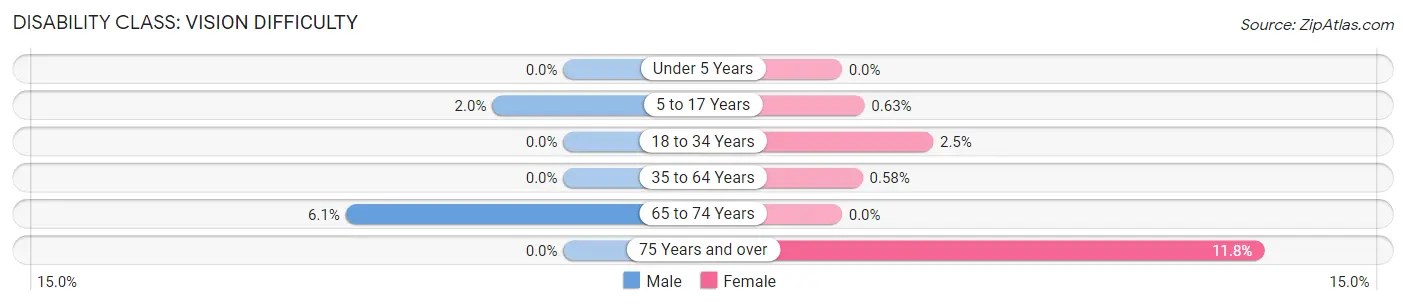
| Age Bracket | Male | Female |
| Under 5 Years | 0 (0.0%) | 0 (0.0%) |
| 5 to 17 Years | 6 (2.0%) | 2 (0.6%) |
| 18 to 34 Years | 0 (0.0%) | 10 (2.5%) |
| 35 to 64 Years | 0 (0.0%) | 2 (0.6%) |
| 65 to 74 Years | 4 (6.1%) | 0 (0.0%) |
| 75 Years and over | 0 (0.0%) | 12 (11.8%) |
Disability Class: Cognitive Difficulty
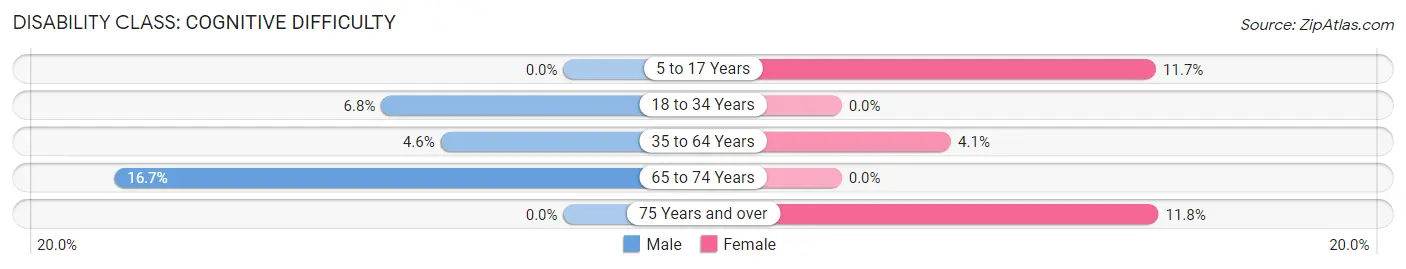
| Age Bracket | Male | Female |
| 5 to 17 Years | 0 (0.0%) | 37 (11.7%) |
| 18 to 34 Years | 28 (6.8%) | 0 (0.0%) |
| 35 to 64 Years | 14 (4.6%) | 14 (4.1%) |
| 65 to 74 Years | 11 (16.7%) | 0 (0.0%) |
| 75 Years and over | 0 (0.0%) | 12 (11.8%) |
Disability Class: Ambulatory Difficulty
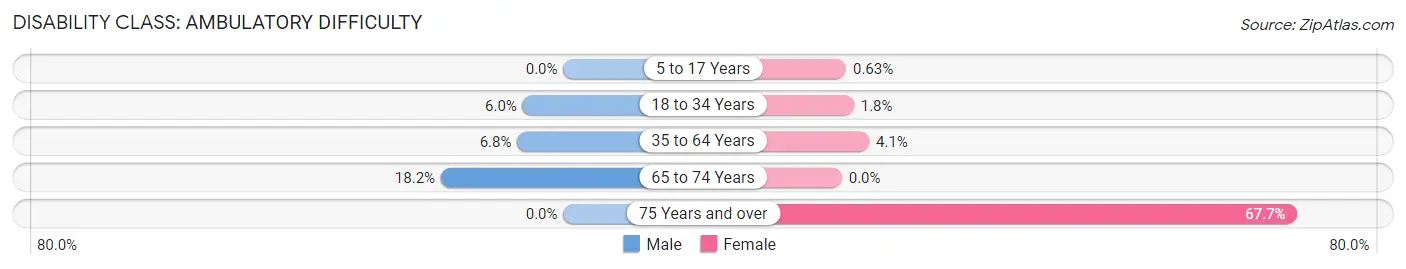
| Age Bracket | Male | Female |
| 5 to 17 Years | 0 (0.0%) | 2 (0.6%) |
| 18 to 34 Years | 25 (6.0%) | 7 (1.8%) |
| 35 to 64 Years | 21 (6.8%) | 14 (4.1%) |
| 65 to 74 Years | 12 (18.2%) | 0 (0.0%) |
| 75 Years and over | 0 (0.0%) | 69 (67.6%) |
Disability Class: Self-Care Difficulty
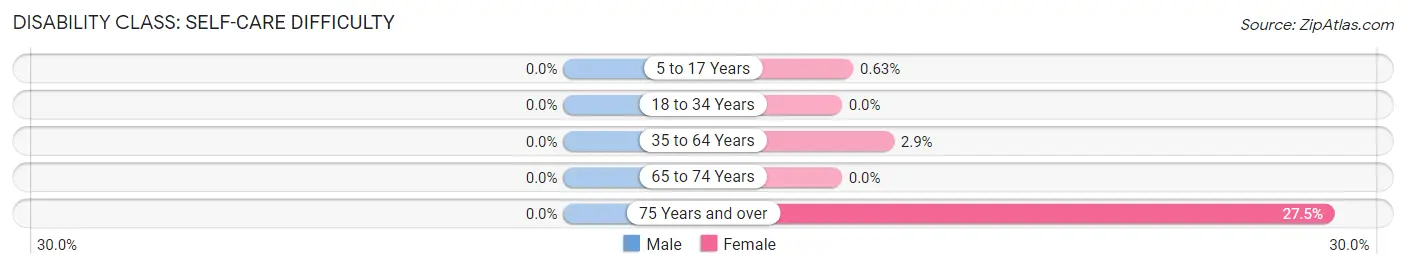
| Age Bracket | Male | Female |
| 5 to 17 Years | 0 (0.0%) | 2 (0.6%) |
| 18 to 34 Years | 0 (0.0%) | 0 (0.0%) |
| 35 to 64 Years | 0 (0.0%) | 10 (2.9%) |
| 65 to 74 Years | 0 (0.0%) | 0 (0.0%) |
| 75 Years and over | 0 (0.0%) | 28 (27.5%) |
Technology Access in Aberdeen
Computing Device Access in Aberdeen
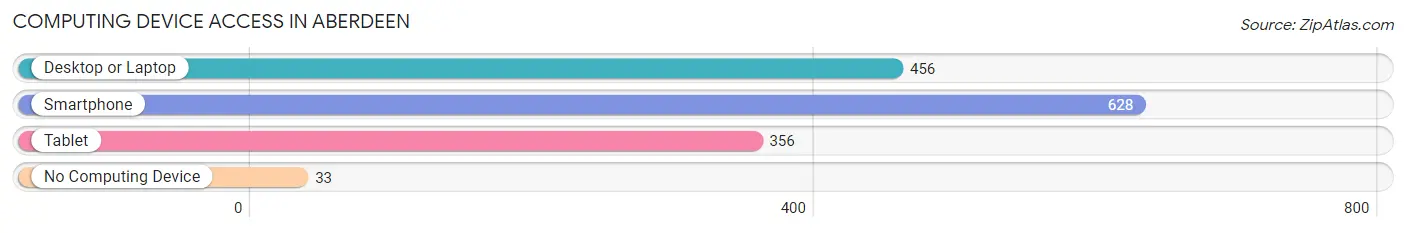
| Device Type | # Households | % Households |
| Desktop or Laptop | 456 | 61.5% |
| Smartphone | 628 | 84.8% |
| Tablet | 356 | 48.0% |
| No Computing Device | 33 | 4.4% |
| Total | 741 | 100.0% |
Internet Access in Aberdeen
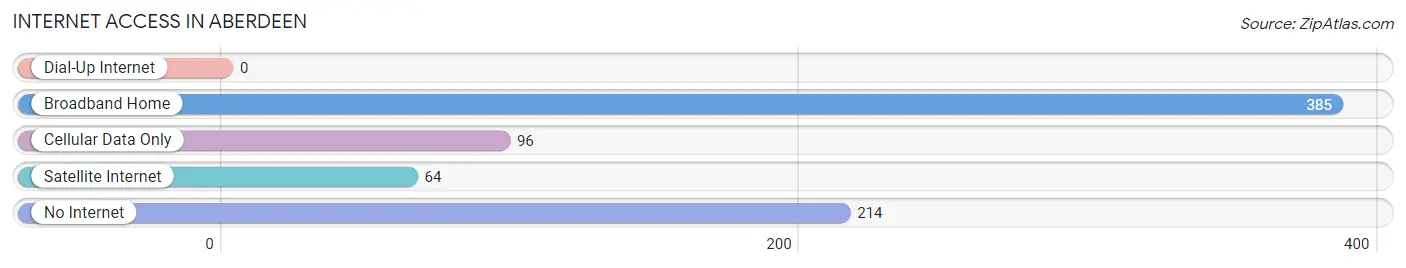
| Internet Type | # Households | % Households |
| Dial-Up Internet | 0 | 0.0% |
| Broadband Home | 385 | 52.0% |
| Cellular Data Only | 96 | 13.0% |
| Satellite Internet | 64 | 8.6% |
| No Internet | 214 | 28.9% |
| Total | 741 | 100.0% |
Aberdeen Summary
Aberdeen, Idaho is a small city located in Bingham County in the southeastern part of the state. It is situated on the Snake River, about 25 miles east of Idaho Falls. The city has a population of approximately 1,500 people and is the county seat of Bingham County.
History
Aberdeen was founded in 1883 by a group of Mormon settlers who were sent to the area by the Church of Jesus Christ of Latter-day Saints. The settlers were sent to the area to establish a new settlement and to help build a canal system to irrigate the surrounding farmland. The settlers named the town after Aberdeen, Scotland, which was the birthplace of one of the settlers.
The town quickly grew and by the early 1900s, it had become a thriving agricultural center. The town was also home to a number of businesses, including a flour mill, a creamery, a sawmill, and a brickyard.
In the 1920s, the town experienced a period of growth and prosperity. The population increased from 1,000 to 1,500 and the town was home to a number of businesses, including a bank, a hotel, a movie theater, and a number of stores.
Geography
Aberdeen is located in the southeastern part of Idaho, about 25 miles east of Idaho Falls. The city is situated on the Snake River and is surrounded by farmland. The city is located at an elevation of 4,400 feet and has a total area of 1.2 square miles.
The climate in Aberdeen is semi-arid, with hot summers and cold winters. The average annual temperature is around 50 degrees Fahrenheit and the average annual precipitation is around 12 inches.
Economy
Aberdeen’s economy is largely based on agriculture. The city is home to a number of farms and ranches that produce a variety of crops, including potatoes, corn, wheat, and hay. The city is also home to a number of businesses, including a flour mill, a creamery, a sawmill, and a brickyard.
The city is also home to a number of manufacturing companies, including a furniture factory, a plastics factory, and a metal fabrication plant. The city is also home to a number of retail stores, restaurants, and other businesses.
Demographics
As of the 2010 census, the population of Aberdeen was 1,500. The racial makeup of the city was 95.2% White, 0.7% Native American, 0.3% Asian, 0.2% African American, and 3.6% from other races. The median household income was $37,500 and the median family income was $45,000.
The city is home to a number of churches, including the Church of Jesus Christ of Latter-day Saints, the United Methodist Church, and the Church of the Nazarene. The city is also home to a number of schools, including Aberdeen High School, Aberdeen Middle School, and Aberdeen Elementary School.
Common Questions
What is Per Capita Income in Aberdeen?
Per Capita income in Aberdeen is $20,929.
What is the Median Family Income in Aberdeen?
Median Family Income in Aberdeen is $64,194.
What is the Median Household income in Aberdeen?
Median Household Income in Aberdeen is $62,944.
What is Income or Wage Gap in Aberdeen?
Income or Wage Gap in Aberdeen is 43.0%.
Women in Aberdeen earn 57.0 cents for every dollar earned by a man.
What is Inequality or Gini Index in Aberdeen?
Inequality or Gini Index in Aberdeen is 0.32.
What is the Total Population of Aberdeen?
Total Population of Aberdeen is 2,611.
What is the Total Male Population of Aberdeen?
Total Male Population of Aberdeen is 1,266.
What is the Total Female Population of Aberdeen?
Total Female Population of Aberdeen is 1,345.
What is the Ratio of Males per 100 Females in Aberdeen?
There are 94.13 Males per 100 Females in Aberdeen.
What is the Ratio of Females per 100 Males in Aberdeen?
There are 106.24 Females per 100 Males in Aberdeen.
What is the Median Population Age in Aberdeen?
Median Population Age in Aberdeen is 24.4 Years.
What is the Average Family Size in Aberdeen
Average Family Size in Aberdeen is 3.9 People.
What is the Average Household Size in Aberdeen
Average Household Size in Aberdeen is 3.5 People.
How Large is the Labor Force in Aberdeen?
There are 1,331 People in the Labor Forcein in Aberdeen.
What is the Percentage of People in the Labor Force in Aberdeen?
73.5% of People are in the Labor Force in Aberdeen.
What is the Unemployment Rate in Aberdeen?
Unemployment Rate in Aberdeen is 9.2%.