Parker, ID Map & Demographics
Parker Map
Parker Overview
$26,262
PER CAPITA INCOME
$83,698
AVG FAMILY INCOME
$72,000
AVG HOUSEHOLD INCOME
50.8%
WAGE / INCOME GAP [ % ]
49.2¢/ $1
WAGE / INCOME GAP [ $ ]
0.36
INEQUALITY / GINI INDEX
661
TOTAL POPULATION
329
MALE POPULATION
332
FEMALE POPULATION
99.10
MALES / 100 FEMALES
100.91
FEMALES / 100 MALES
31.7
MEDIAN AGE
3.9
AVG FAMILY SIZE
4.1
AVG HOUSEHOLD SIZE
326
LABOR FORCE [ PEOPLE ]
61.2%
PERCENT IN LABOR FORCE
10.7%
UNEMPLOYMENT RATE
Parker Zip Codes
Parker Area Codes
Income in Parker
Income Overview in Parker
Per Capita Income in Parker is $26,262, while median incomes of families and households are $83,698 and $72,000 respectively.
| Characteristic | Number | Measure |
| Per Capita Income | 661 | $26,262 |
| Median Family Income | 133 | $83,698 |
| Mean Family Income | 133 | $79,386 |
| Median Household Income | 162 | $72,000 |
| Mean Household Income | 162 | $92,154 |
| Income Deficit | 133 | $0 |
| Wage / Income Gap (%) | 661 | 50.78% |
| Wage / Income Gap ($) | 661 | 49.22¢ per $1 |
| Gini / Inequality Index | 661 | 0.36 |
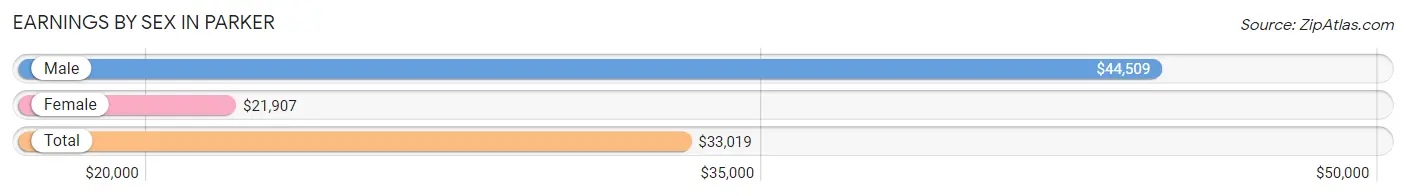
Earnings by Sex in Parker
Average Earnings in Parker are $33,019, $44,509 for men and $21,907 for women, a difference of 50.8%.
| Sex | Number | Average Earnings |
| Male | 223 (53.1%) | $44,509 |
| Female | 197 (46.9%) | $21,907 |
| Total | 420 (100.0%) | $33,019 |
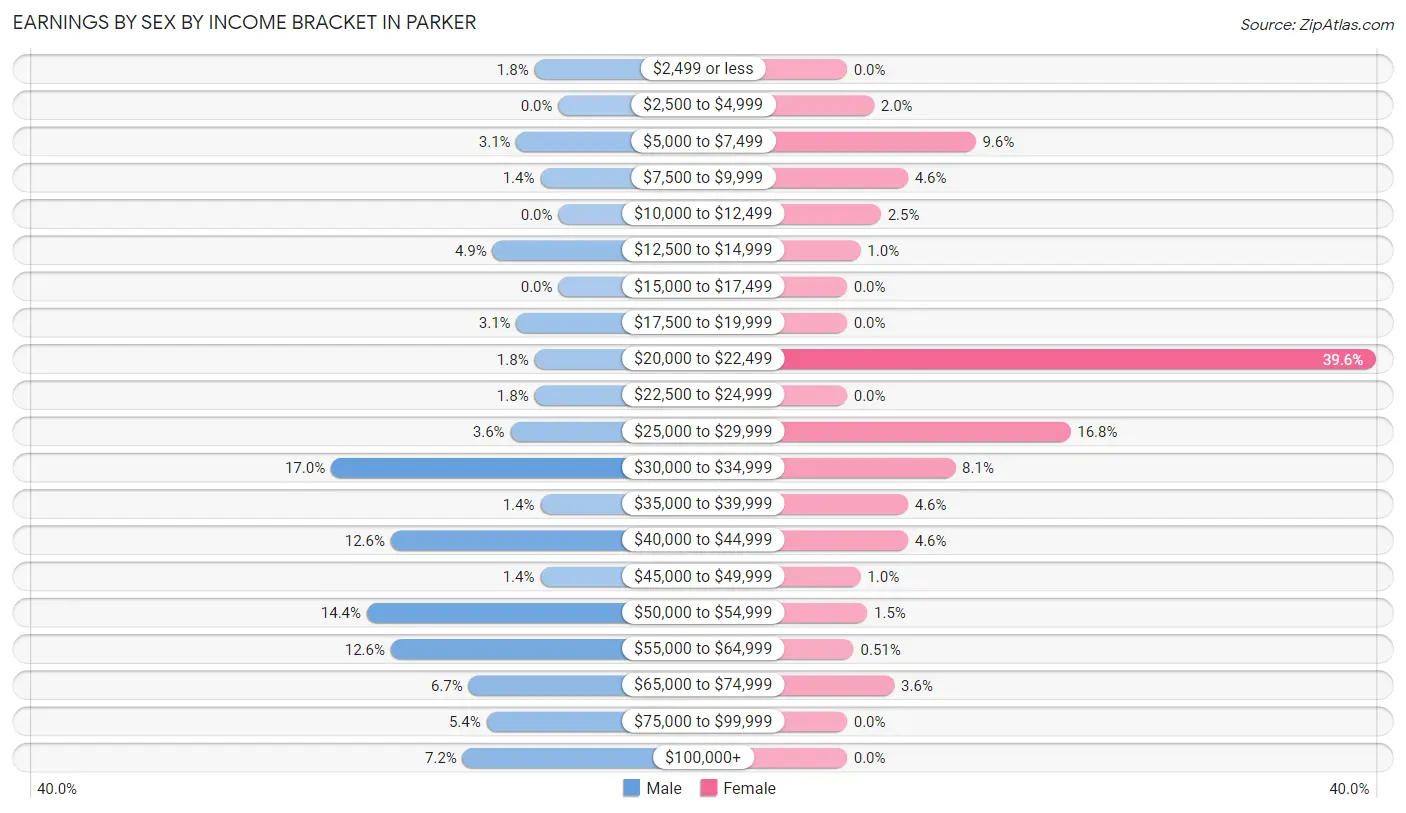
Earnings by Sex by Income Bracket in Parker
The most common earnings brackets in Parker are $30,000 to $34,999 for men (38 | 17.0%) and $20,000 to $22,499 for women (78 | 39.6%).
| Income | Male | Female |
| $2,499 or less | 4 (1.8%) | 0 (0.0%) |
| $2,500 to $4,999 | 0 (0.0%) | 4 (2.0%) |
| $5,000 to $7,499 | 7 (3.1%) | 19 (9.6%) |
| $7,500 to $9,999 | 3 (1.3%) | 9 (4.6%) |
| $10,000 to $12,499 | 0 (0.0%) | 5 (2.5%) |
| $12,500 to $14,999 | 11 (4.9%) | 2 (1.0%) |
| $15,000 to $17,499 | 0 (0.0%) | 0 (0.0%) |
| $17,500 to $19,999 | 7 (3.1%) | 0 (0.0%) |
| $20,000 to $22,499 | 4 (1.8%) | 78 (39.6%) |
| $22,500 to $24,999 | 4 (1.8%) | 0 (0.0%) |
| $25,000 to $29,999 | 8 (3.6%) | 33 (16.8%) |
| $30,000 to $34,999 | 38 (17.0%) | 16 (8.1%) |
| $35,000 to $39,999 | 3 (1.3%) | 9 (4.6%) |
| $40,000 to $44,999 | 28 (12.6%) | 9 (4.6%) |
| $45,000 to $49,999 | 3 (1.3%) | 2 (1.0%) |
| $50,000 to $54,999 | 32 (14.3%) | 3 (1.5%) |
| $55,000 to $64,999 | 28 (12.6%) | 1 (0.5%) |
| $65,000 to $74,999 | 15 (6.7%) | 7 (3.5%) |
| $75,000 to $99,999 | 12 (5.4%) | 0 (0.0%) |
| $100,000+ | 16 (7.2%) | 0 (0.0%) |
| Total | 223 (100.0%) | 197 (100.0%) |
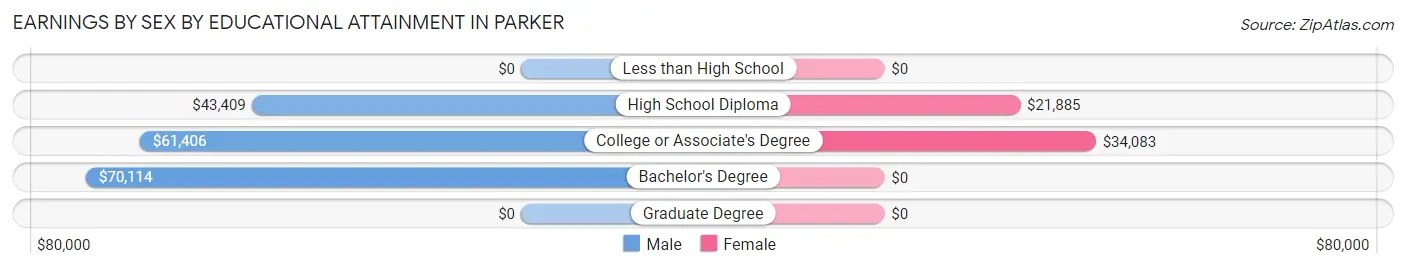
Earnings by Sex by Educational Attainment in Parker
Average earnings in Parker are $52,356 for men and $22,346 for women, a difference of 57.3%. Men with an educational attainment of bachelor's degree enjoy the highest average annual earnings of $70,114, while those with high school diploma education earn the least with $43,409. Women with an educational attainment of college or associate's degree earn the most with the average annual earnings of $34,083, while those with high school diploma education have the smallest earnings of $21,885.
| Educational Attainment | Male Income | Female Income |
| Less than High School | - | - |
| High School Diploma | $43,409 | $21,885 |
| College or Associate's Degree | $61,406 | $34,083 |
| Bachelor's Degree | $70,114 | $0 |
| Graduate Degree | - | - |
| Total | $52,356 | $22,346 |
Family Income in Parker
Family Income Brackets in Parker
According to the Parker family income data, there are 42 families falling into the $100,000 to $149,999 income range, which is the most common income bracket and makes up 31.6% of all families.
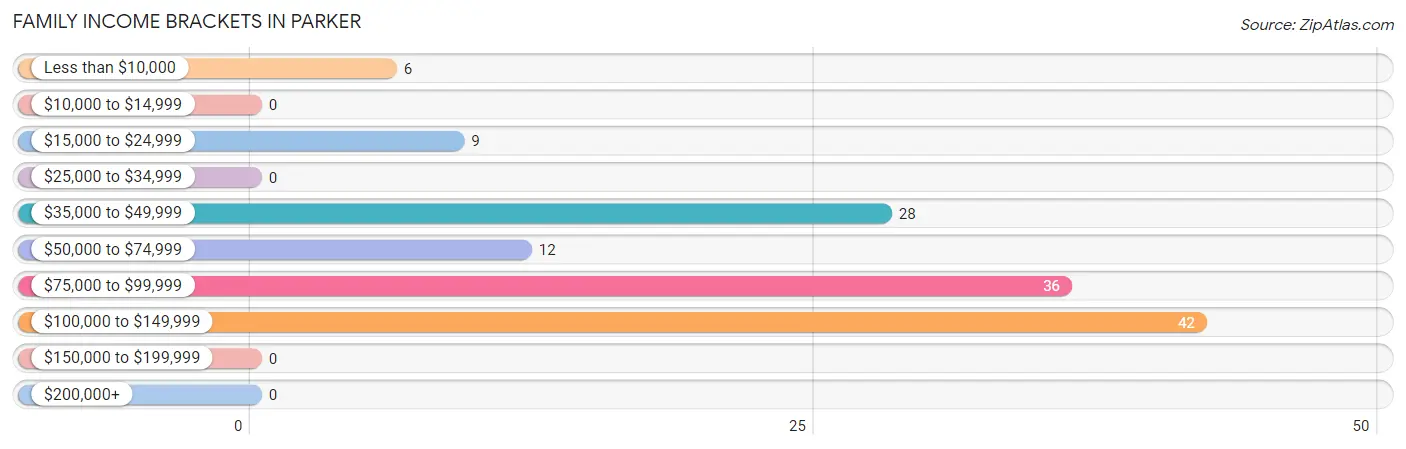
| Income Bracket | # Families | % Families |
| Less than $10,000 | 6 | 4.5% |
| $10,000 to $14,999 | 0 | 0.0% |
| $15,000 to $24,999 | 9 | 6.8% |
| $25,000 to $34,999 | 0 | 0.0% |
| $35,000 to $49,999 | 28 | 21.1% |
| $50,000 to $74,999 | 12 | 9.0% |
| $75,000 to $99,999 | 36 | 27.1% |
| $100,000 to $149,999 | 42 | 31.6% |
| $150,000 to $199,999 | 0 | 0.0% |
| $200,000+ | 0 | 0.0% |
Family Income by Famaliy Size in Parker
5-person families (21 | 15.8%) account for the highest median family income in Parker with $106,094 per family, while 3-person families (38 | 28.6%) have the highest median income of $27,917 per family member.
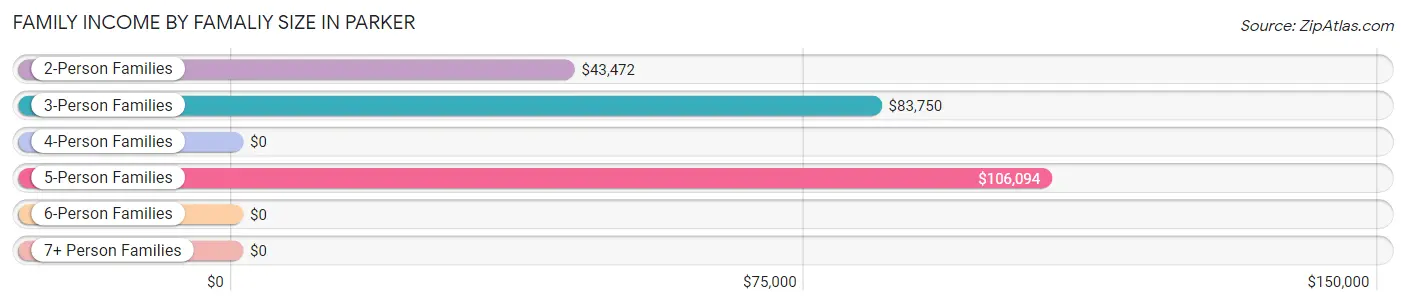
| Income Bracket | # Families | Median Income |
| 2-Person Families | 33 (24.8%) | $43,472 |
| 3-Person Families | 38 (28.6%) | $83,750 |
| 4-Person Families | 34 (25.6%) | $0 |
| 5-Person Families | 21 (15.8%) | $106,094 |
| 6-Person Families | 0 (0.0%) | $0 |
| 7+ Person Families | 7 (5.3%) | $0 |
| Total | 133 (100.0%) | $83,698 |
Family Income by Number of Earners in Parker
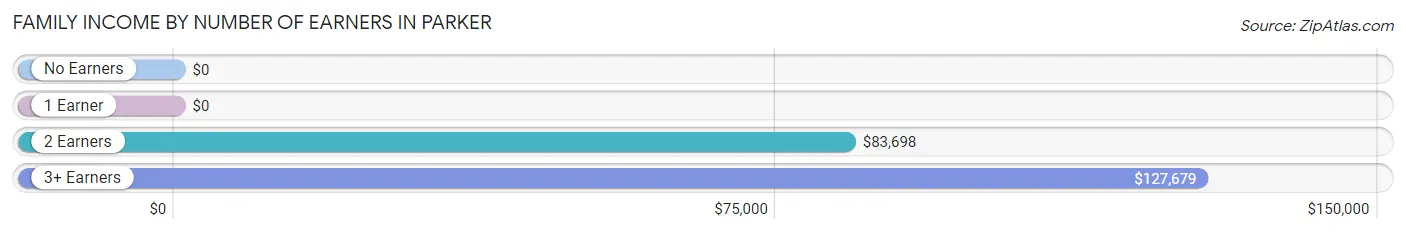
| Number of Earners | # Families | Median Income |
| No Earners | 15 (11.3%) | $0 |
| 1 Earner | 46 (34.6%) | $0 |
| 2 Earners | 45 (33.8%) | $83,698 |
| 3+ Earners | 27 (20.3%) | $127,679 |
| Total | 133 (100.0%) | $83,698 |
Household Income in Parker
Household Income Brackets in Parker
With 42 households falling in the category, the $100,000 to $149,999 income range is the most frequent in Parker, accounting for 25.9% of all households.
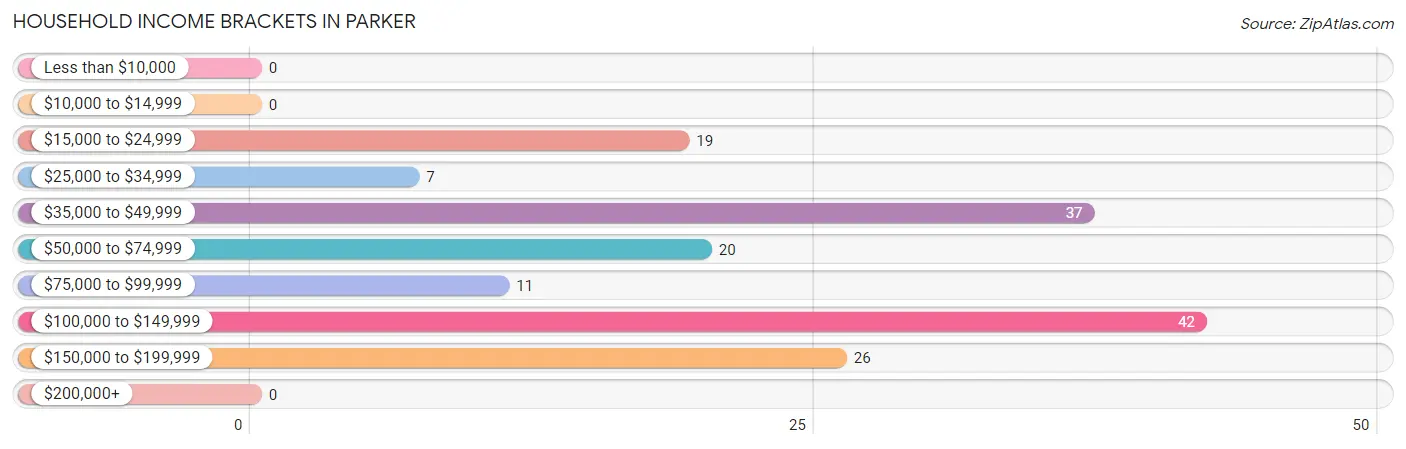
| Income Bracket | # Households | % Households |
| Less than $10,000 | 0 | 0.0% |
| $10,000 to $14,999 | 0 | 0.0% |
| $15,000 to $24,999 | 19 | 11.7% |
| $25,000 to $34,999 | 7 | 4.3% |
| $35,000 to $49,999 | 37 | 22.8% |
| $50,000 to $74,999 | 20 | 12.3% |
| $75,000 to $99,999 | 11 | 6.8% |
| $100,000 to $149,999 | 42 | 25.9% |
| $150,000 to $199,999 | 26 | 16.0% |
| $200,000+ | 0 | 0.0% |
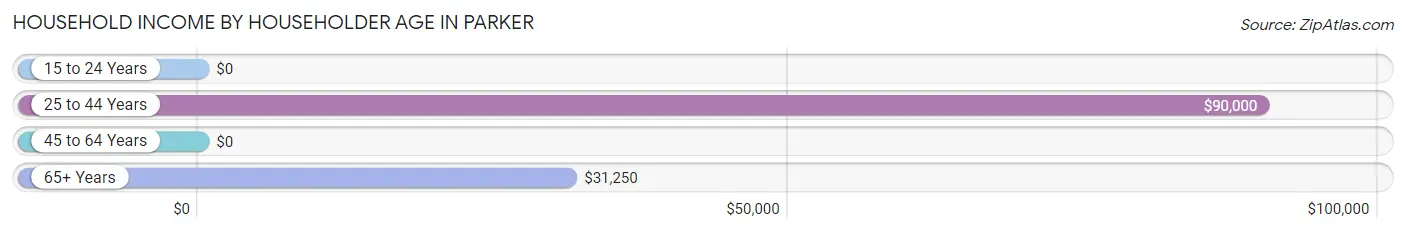
Household Income by Householder Age in Parker
The median household income in Parker is $72,000, with the highest median household income of $90,000 found in the 25 to 44 years age bracket for the primary householder. A total of 70 households (43.2%) fall into this category.
| Income Bracket | # Households | Median Income |
| 15 to 24 Years | 0 (0.0%) | $0 |
| 25 to 44 Years | 70 (43.2%) | $90,000 |
| 45 to 64 Years | 66 (40.7%) | $0 |
| 65+ Years | 26 (16.1%) | $31,250 |
| Total | 162 (100.0%) | $72,000 |
Poverty in Parker
Income Below Poverty by Sex and Age in Parker
With 4.9% poverty level for males and 9.3% for females among the residents of Parker, 65 to 74 year old males and 5 year old females are the most vulnerable to poverty, with 7 males (46.7%) and 2 females (100.0%) in their respective age groups living below the poverty level.
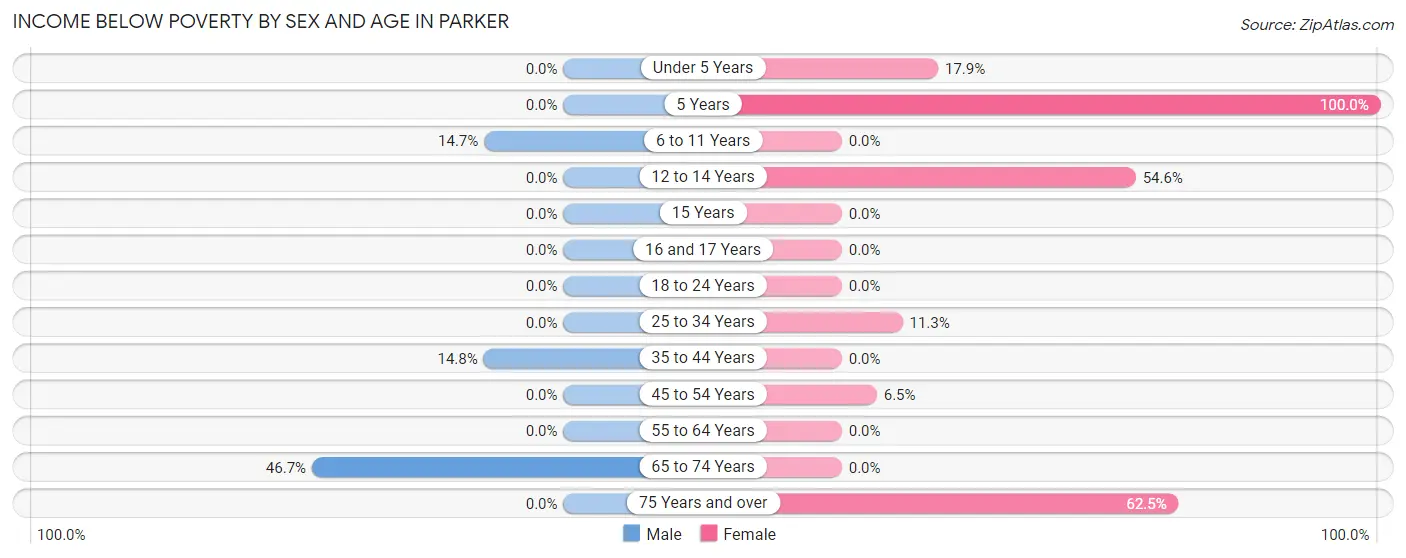
| Age Bracket | Male | Female |
| Under 5 Years | 0 (0.0%) | 5 (17.9%) |
| 5 Years | 0 (0.0%) | 2 (100.0%) |
| 6 to 11 Years | 5 (14.7%) | 0 (0.0%) |
| 12 to 14 Years | 0 (0.0%) | 6 (54.5%) |
| 15 Years | 0 (0.0%) | 0 (0.0%) |
| 16 and 17 Years | 0 (0.0%) | 0 (0.0%) |
| 18 to 24 Years | 0 (0.0%) | 0 (0.0%) |
| 25 to 34 Years | 0 (0.0%) | 8 (11.3%) |
| 35 to 44 Years | 4 (14.8%) | 0 (0.0%) |
| 45 to 54 Years | 0 (0.0%) | 5 (6.5%) |
| 55 to 64 Years | 0 (0.0%) | 0 (0.0%) |
| 65 to 74 Years | 7 (46.7%) | 0 (0.0%) |
| 75 Years and over | 0 (0.0%) | 5 (62.5%) |
| Total | 16 (4.9%) | 31 (9.3%) |
Income Above Poverty by Sex and Age in Parker
According to the poverty statistics in Parker, males aged under 5 years and females aged 6 to 11 years are the age groups that are most secure financially, with 100.0% of males and 100.0% of females in these age groups living above the poverty line.
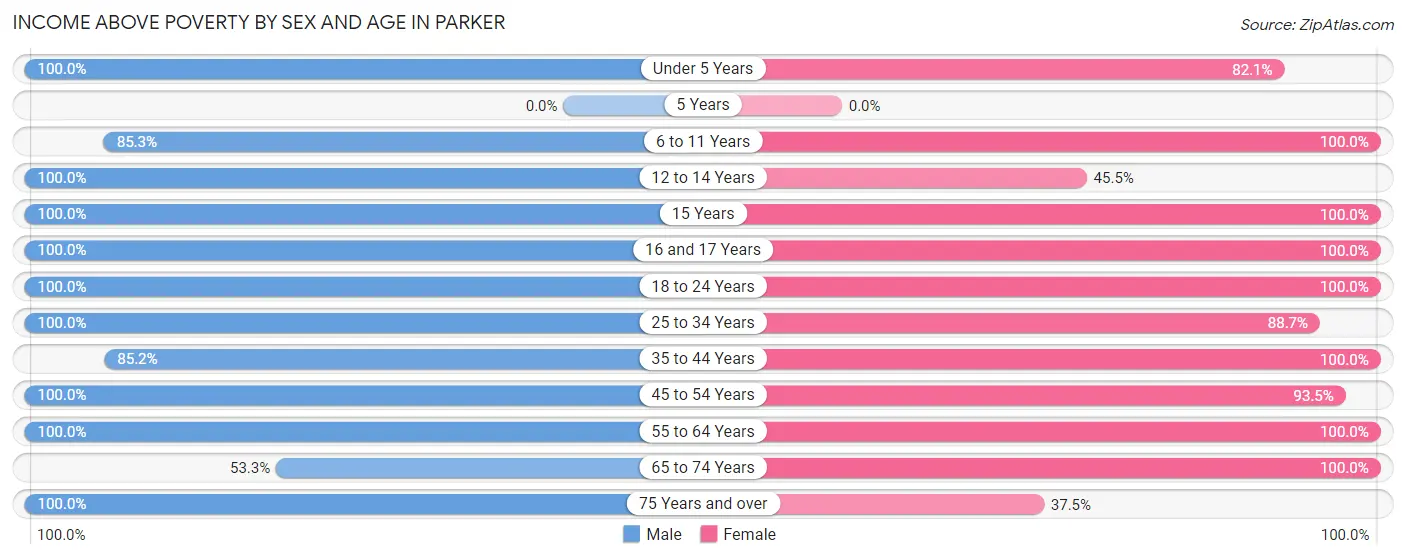
| Age Bracket | Male | Female |
| Under 5 Years | 18 (100.0%) | 23 (82.1%) |
| 5 Years | 0 (0.0%) | 0 (0.0%) |
| 6 to 11 Years | 29 (85.3%) | 7 (100.0%) |
| 12 to 14 Years | 13 (100.0%) | 5 (45.5%) |
| 15 Years | 7 (100.0%) | 6 (100.0%) |
| 16 and 17 Years | 5 (100.0%) | 4 (100.0%) |
| 18 to 24 Years | 70 (100.0%) | 44 (100.0%) |
| 25 to 34 Years | 66 (100.0%) | 63 (88.7%) |
| 35 to 44 Years | 23 (85.2%) | 30 (100.0%) |
| 45 to 54 Years | 17 (100.0%) | 72 (93.5%) |
| 55 to 64 Years | 47 (100.0%) | 28 (100.0%) |
| 65 to 74 Years | 8 (53.3%) | 16 (100.0%) |
| 75 Years and over | 8 (100.0%) | 3 (37.5%) |
| Total | 311 (95.1%) | 301 (90.7%) |
Income Below Poverty Among Married-Couple Families in Parker
The poverty statistics for married-couple families in Parker show that 6.1% or 7 of the total 115 families live below the poverty line. Families with 3 or 4 children have the highest poverty rate of 18.2%, comprising of 2 families. On the other hand, families with 1 or 2 children have the lowest poverty rate of 0.0%, which includes 0 families.
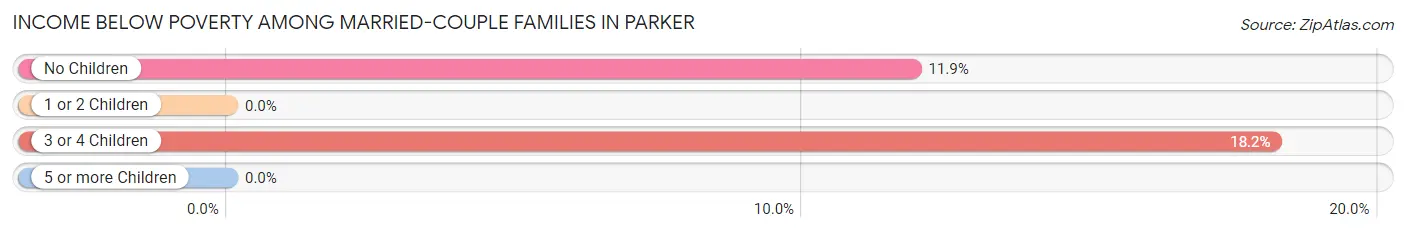
| Children | Above Poverty | Below Poverty |
| No Children | 37 (88.1%) | 5 (11.9%) |
| 1 or 2 Children | 62 (100.0%) | 0 (0.0%) |
| 3 or 4 Children | 9 (81.8%) | 2 (18.2%) |
| 5 or more Children | 0 (0.0%) | 0 (0.0%) |
| Total | 108 (93.9%) | 7 (6.1%) |
Income Below Poverty Among Single-Parent Households in Parker
According to the poverty data in Parker, 100.0% or 2 single-father households and 37.5% or 6 single-mother households are living below the poverty line. Among single-father households, those with no children have the highest poverty rate, with 2 households (100.0%) experiencing poverty. Likewise, among single-mother households, those with 3 or 4 children have the highest poverty rate, with 6 households (100.0%) falling below the poverty line.
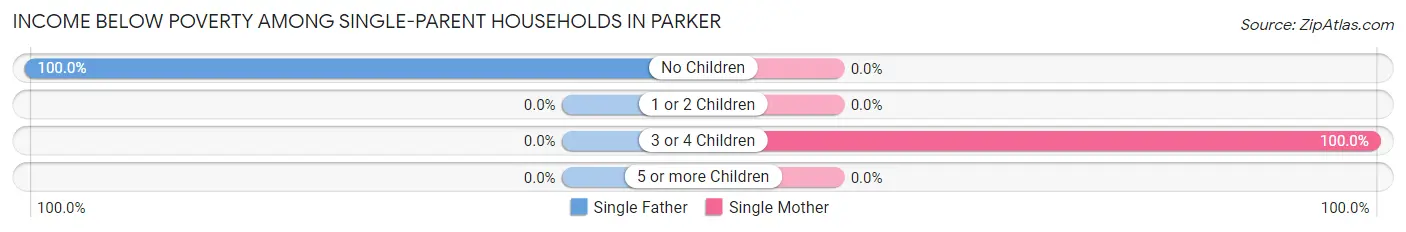
| Children | Single Father | Single Mother |
| No Children | 2 (100.0%) | 0 (0.0%) |
| 1 or 2 Children | 0 (0.0%) | 0 (0.0%) |
| 3 or 4 Children | 0 (0.0%) | 6 (100.0%) |
| 5 or more Children | 0 (0.0%) | 0 (0.0%) |
| Total | 2 (100.0%) | 6 (37.5%) |
Income Below Poverty Among Married-Couple vs Single-Parent Households in Parker
The poverty data for Parker shows that 7 of the married-couple family households (6.1%) and 8 of the single-parent households (44.4%) are living below the poverty level. Within the married-couple family households, those with 3 or 4 children have the highest poverty rate, with 2 households (18.2%) falling below the poverty line. Among the single-parent households, those with 3 or 4 children have the highest poverty rate, with 6 household (100.0%) living below poverty.
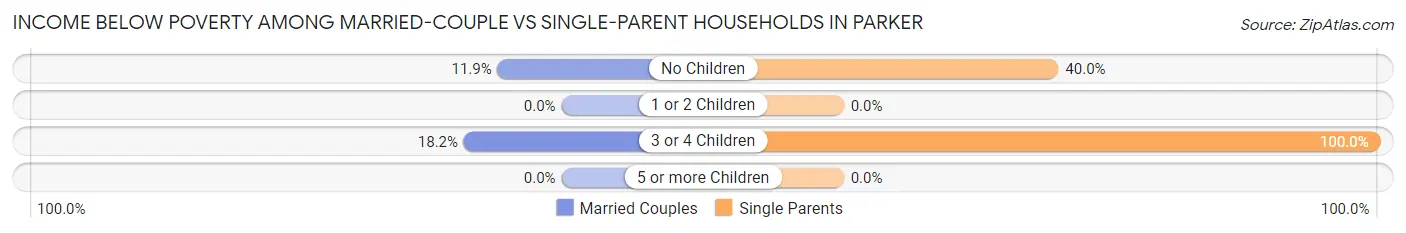
| Children | Married-Couple Families | Single-Parent Households |
| No Children | 5 (11.9%) | 2 (40.0%) |
| 1 or 2 Children | 0 (0.0%) | 0 (0.0%) |
| 3 or 4 Children | 2 (18.2%) | 6 (100.0%) |
| 5 or more Children | 0 (0.0%) | 0 (0.0%) |
| Total | 7 (6.1%) | 8 (44.4%) |
Race in Parker
The most populous races in Parker are White / Caucasian (627 | 94.9%), Hispanic or Latino (23 | 3.5%), and Some other Race (17 | 2.6%).
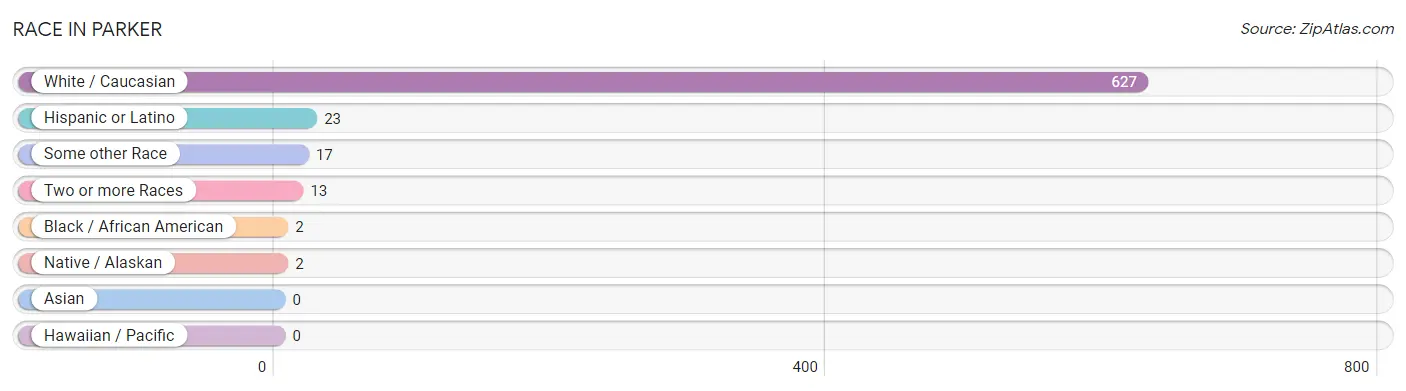
| Race | # Population | % Population |
| Asian | 0 | 0.0% |
| Black / African American | 2 | 0.3% |
| Hawaiian / Pacific | 0 | 0.0% |
| Hispanic or Latino | 23 | 3.5% |
| Native / Alaskan | 2 | 0.3% |
| White / Caucasian | 627 | 94.9% |
| Two or more Races | 13 | 2.0% |
| Some other Race | 17 | 2.6% |
| Total | 661 | 100.0% |
Ancestry in Parker
The most populous ancestries reported in Parker are English (358 | 54.2%), German (226 | 34.2%), Irish (153 | 23.2%), American (38 | 5.8%), and Scottish (30 | 4.5%), together accounting for 121.8% of all Parker residents.
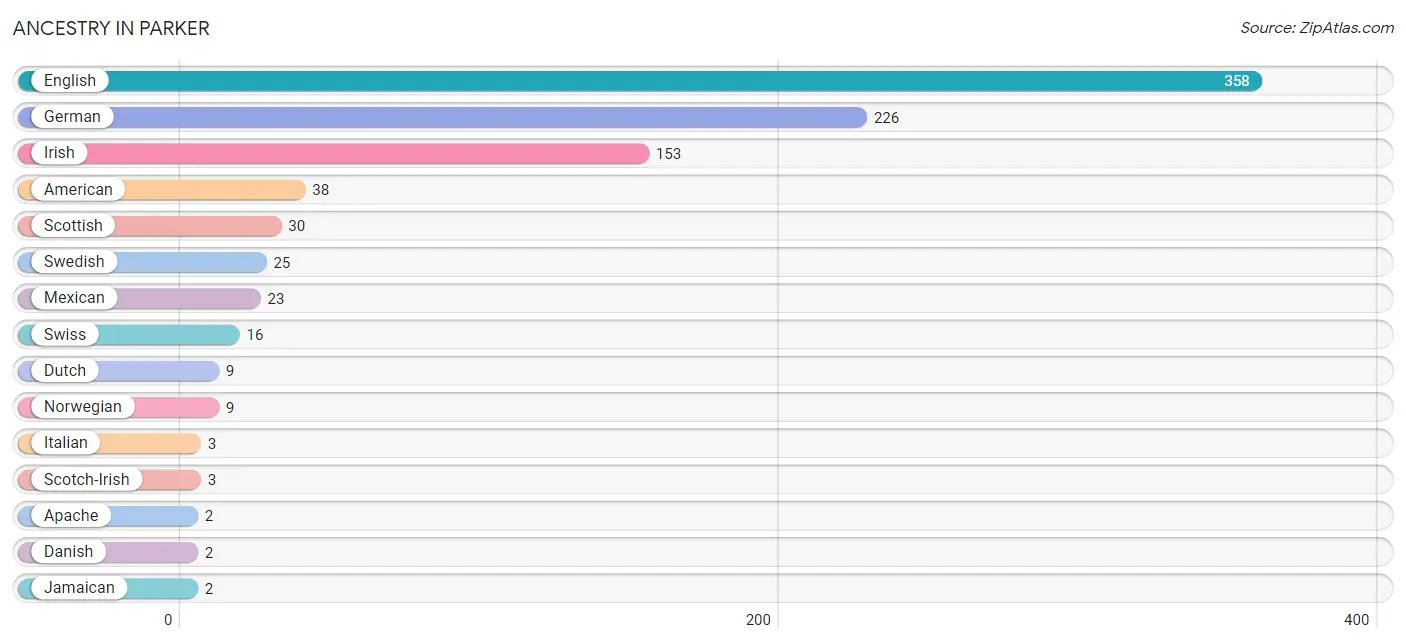
| Ancestry | # Population | % Population |
| American | 38 | 5.8% |
| Apache | 2 | 0.3% |
| Danish | 2 | 0.3% |
| Dutch | 9 | 1.4% |
| English | 358 | 54.2% |
| German | 226 | 34.2% |
| Irish | 153 | 23.2% |
| Italian | 3 | 0.4% |
| Jamaican | 2 | 0.3% |
| Mexican | 23 | 3.5% |
| Norwegian | 9 | 1.4% |
| Scotch-Irish | 3 | 0.4% |
| Scottish | 30 | 4.5% |
| Swedish | 25 | 3.8% |
| Swiss | 16 | 2.4% | View All 15 Rows |
Immigrants in Parker
The most numerous immigrant groups reported in Parker came from Latin America (18 | 2.7%), Central America (16 | 2.4%), Mexico (16 | 2.4%), Caribbean (2 | 0.3%), and Jamaica (2 | 0.3%), together accounting for 8.2% of all Parker residents.
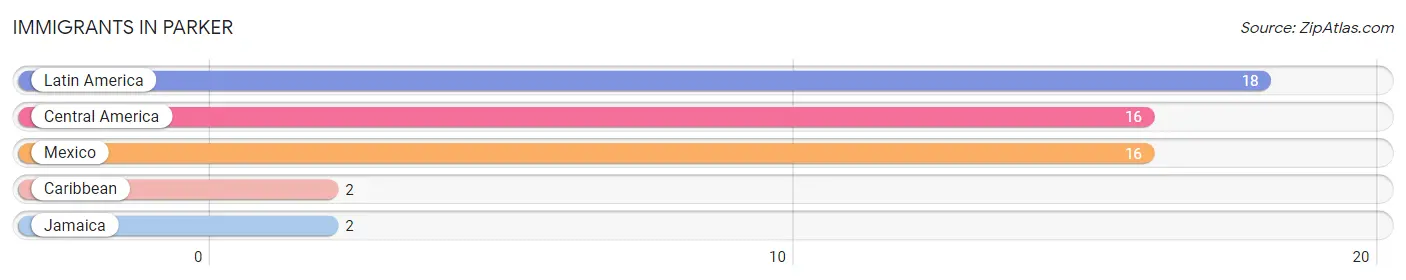
| Immigration Origin | # Population | % Population |
| Caribbean | 2 | 0.3% |
| Central America | 16 | 2.4% |
| Jamaica | 2 | 0.3% |
| Latin America | 18 | 2.7% |
| Mexico | 16 | 2.4% | View All 5 Rows |
Sex and Age in Parker
Sex and Age in Parker
The most populous age groups in Parker are 20 to 24 Years (54 | 16.4%) for men and 50 to 54 Years (66 | 19.9%) for women.
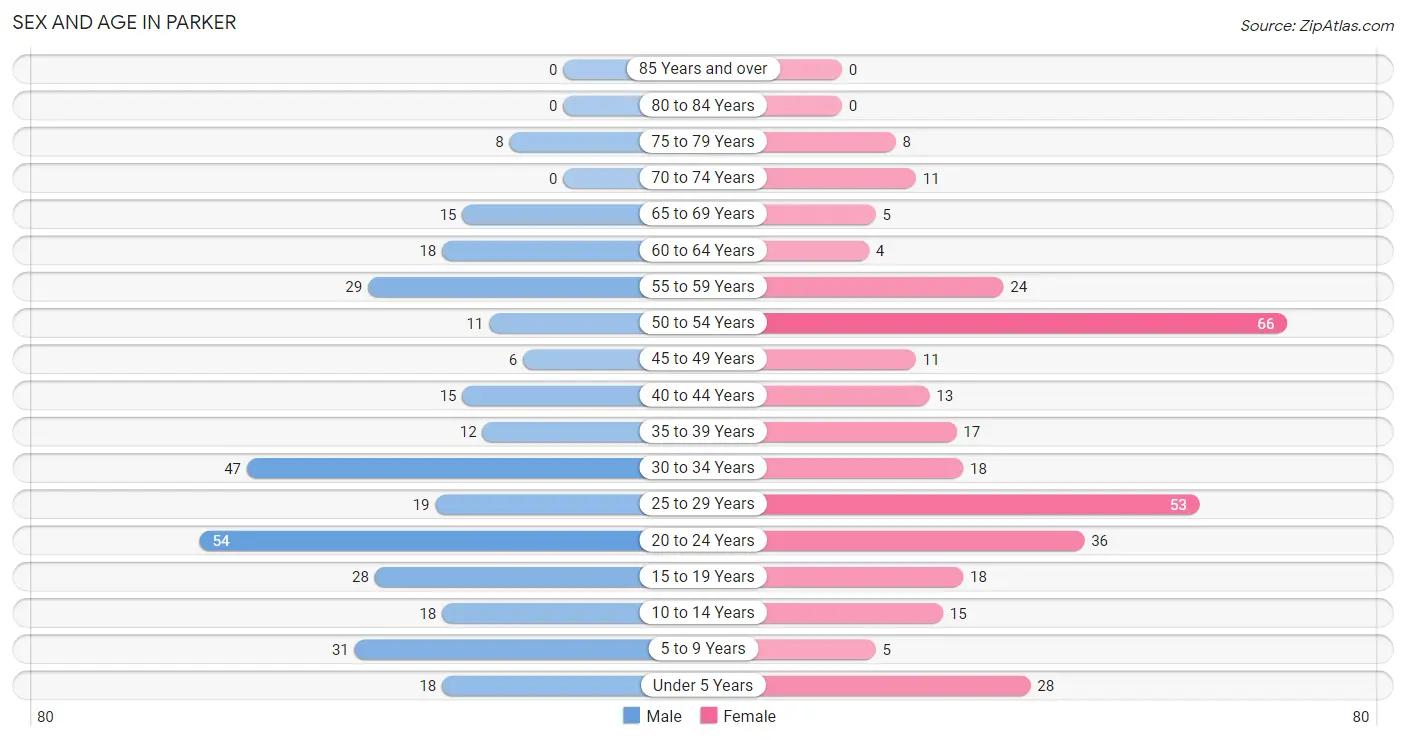
| Age Bracket | Male | Female |
| Under 5 Years | 18 (5.5%) | 28 (8.4%) |
| 5 to 9 Years | 31 (9.4%) | 5 (1.5%) |
| 10 to 14 Years | 18 (5.5%) | 15 (4.5%) |
| 15 to 19 Years | 28 (8.5%) | 18 (5.4%) |
| 20 to 24 Years | 54 (16.4%) | 36 (10.8%) |
| 25 to 29 Years | 19 (5.8%) | 53 (16.0%) |
| 30 to 34 Years | 47 (14.3%) | 18 (5.4%) |
| 35 to 39 Years | 12 (3.6%) | 17 (5.1%) |
| 40 to 44 Years | 15 (4.6%) | 13 (3.9%) |
| 45 to 49 Years | 6 (1.8%) | 11 (3.3%) |
| 50 to 54 Years | 11 (3.3%) | 66 (19.9%) |
| 55 to 59 Years | 29 (8.8%) | 24 (7.2%) |
| 60 to 64 Years | 18 (5.5%) | 4 (1.2%) |
| 65 to 69 Years | 15 (4.6%) | 5 (1.5%) |
| 70 to 74 Years | 0 (0.0%) | 11 (3.3%) |
| 75 to 79 Years | 8 (2.4%) | 8 (2.4%) |
| 80 to 84 Years | 0 (0.0%) | 0 (0.0%) |
| 85 Years and over | 0 (0.0%) | 0 (0.0%) |
| Total | 329 (100.0%) | 332 (100.0%) |
Families and Households in Parker
Median Family Size in Parker
The median family size in Parker is 3.86 persons per family, with married-couple families (115 | 86.5%) accounting for the largest median family size of 3.97 persons per family. On the other hand, single female/mother families (16 | 12.0%) represent the smallest median family size with 3.06 persons per family.
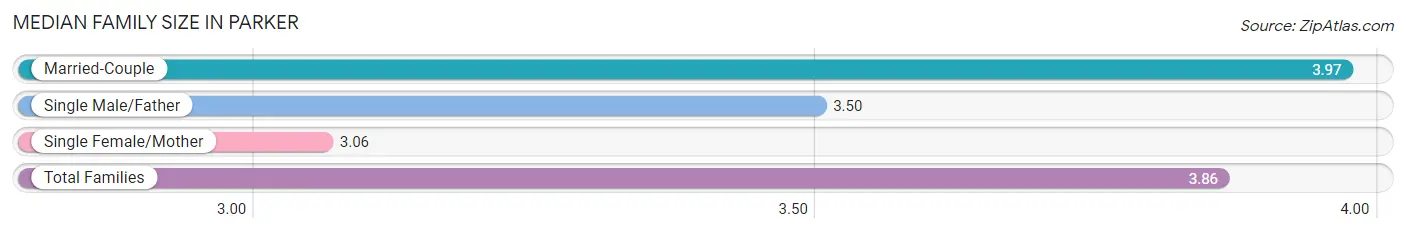
| Family Type | # Families | Family Size |
| Married-Couple | 115 (86.5%) | 3.97 |
| Single Male/Father | 2 (1.5%) | 3.50 |
| Single Female/Mother | 16 (12.0%) | 3.06 |
| Total Families | 133 (100.0%) | 3.86 |
Median Household Size in Parker
The median household size in Parker is 4.08 persons per household, with married-couple households (115 | 71.0%) accounting for the largest median household size of 4.9 persons per household. non-family households (29 | 17.9%) represent the smallest median household size with 1.38 persons per household.
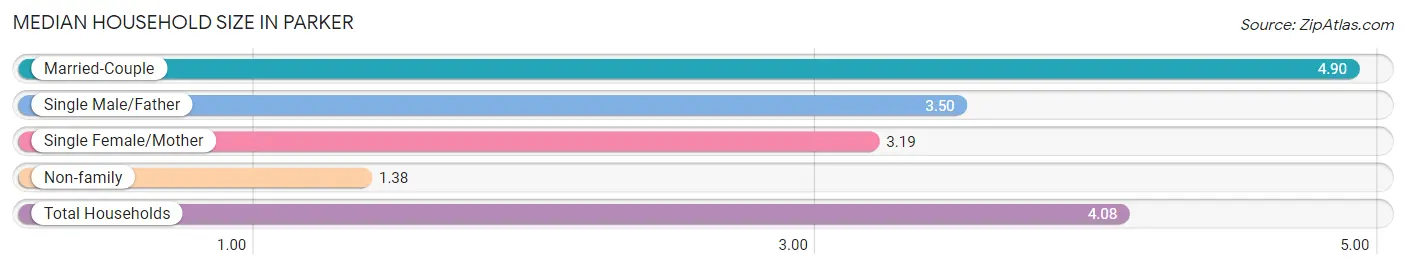
| Household Type | # Households | Household Size |
| Married-Couple | 115 (71.0%) | 4.90 |
| Single Male/Father | 2 (1.2%) | 3.50 |
| Single Female/Mother | 16 (9.9%) | 3.19 |
| Non-family | 29 (17.9%) | 1.38 |
| Total Households | 162 (100.0%) | 4.08 |
Household Size by Marriage Status in Parker
Out of a total of 162 households in Parker, 133 (82.1%) are family households, while 29 (17.9%) are nonfamily households. The most numerous type of family households are 2-person households, comprising 33, and the most common type of nonfamily households are 1-person households, comprising 23.
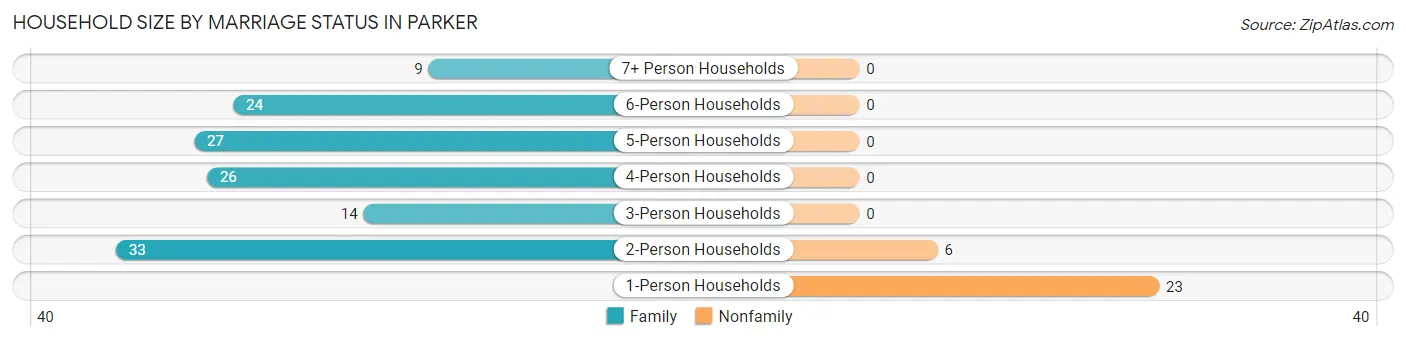
| Household Size | Family Households | Nonfamily Households |
| 1-Person Households | - | 23 (14.2%) |
| 2-Person Households | 33 (20.4%) | 6 (3.7%) |
| 3-Person Households | 14 (8.6%) | 0 (0.0%) |
| 4-Person Households | 26 (16.1%) | 0 (0.0%) |
| 5-Person Households | 27 (16.7%) | 0 (0.0%) |
| 6-Person Households | 24 (14.8%) | 0 (0.0%) |
| 7+ Person Households | 9 (5.6%) | 0 (0.0%) |
| Total | 133 (82.1%) | 29 (17.9%) |
Female Fertility in Parker
Fertility by Age in Parker
Average fertility rate in Parker is 48.0 births per 1,000 women. Women in the age bracket of 20 to 34 years have the highest fertility rate with 75.0 births per 1,000 women. Women in the age bracket of 20 to 34 years acount for 100.0% of all women with births.
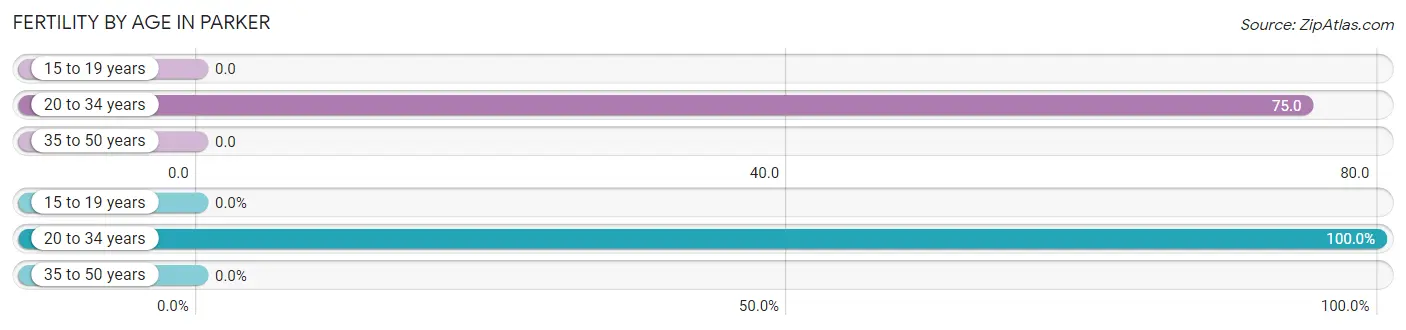
| Age Bracket | Women with Births | Births / 1,000 Women |
| 15 to 19 years | 0 (0.0%) | 0.0 |
| 20 to 34 years | 8 (100.0%) | 75.0 |
| 35 to 50 years | 0 (0.0%) | 0.0 |
| Total | 8 (100.0%) | 48.0 |
Fertility by Age by Marriage Status in Parker
25.0% of women with births (8) in Parker are married. The highest percentage of unmarried women with births falls into 20 to 34 years age bracket with 75.0% of them unmarried at the time of birth, while the lowest percentage of unmarried women with births belong to 20 to 34 years age bracket with 75.0% of them unmarried.
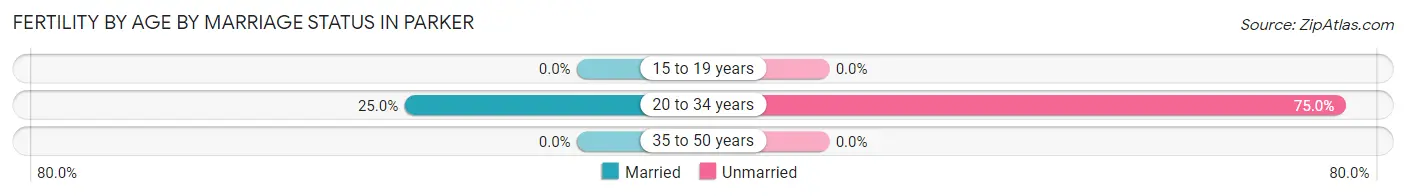
| Age Bracket | Married | Unmarried |
| 15 to 19 years | 0 (0.0%) | 0 (0.0%) |
| 20 to 34 years | 2 (25.0%) | 6 (75.0%) |
| 35 to 50 years | 0 (0.0%) | 0 (0.0%) |
| Total | 2 (25.0%) | 6 (75.0%) |
Fertility by Education in Parker
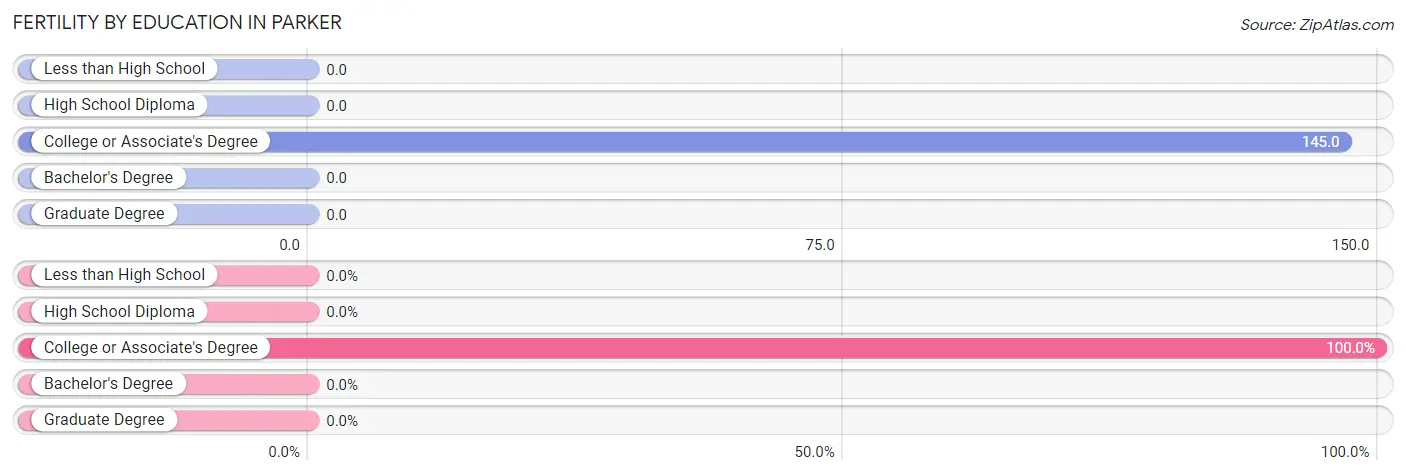
| Educational Attainment | Women with Births | Births / 1,000 Women |
| Less than High School | 0 (0.0%) | 0.0 |
| High School Diploma | 0 (0.0%) | 0.0 |
| College or Associate's Degree | 8 (100.0%) | 145.0 |
| Bachelor's Degree | 0 (0.0%) | 0.0 |
| Graduate Degree | 0 (0.0%) | 0.0 |
| Total | 8 (100.0%) | 48.0 |
Fertility by Education by Marriage Status in Parker
75.0% of women with births in Parker are unmarried. Women with the educational attainment of college or associate's degree are most likely to be married with 25.0% of them married at childbirth, while women with the educational attainment of college or associate's degree are least likely to be married with 75.0% of them unmarried at childbirth.
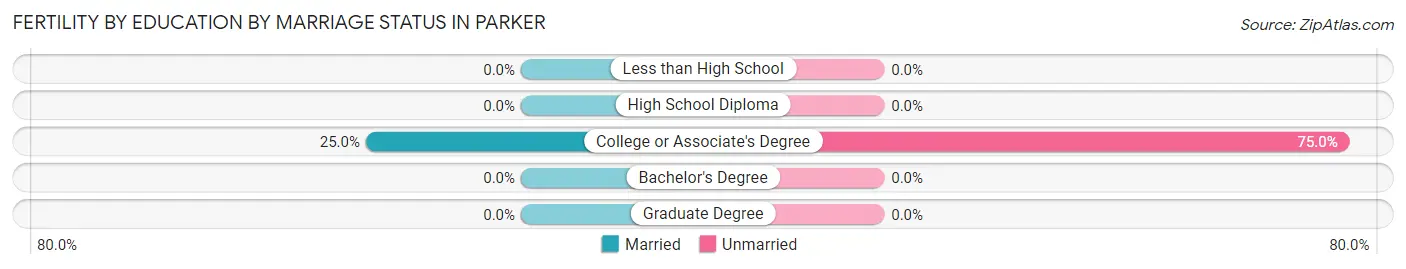
| Educational Attainment | Married | Unmarried |
| Less than High School | 0 (0.0%) | 0 (0.0%) |
| High School Diploma | 0 (0.0%) | 0 (0.0%) |
| College or Associate's Degree | 2 (25.0%) | 6 (75.0%) |
| Bachelor's Degree | 0 (0.0%) | 0 (0.0%) |
| Graduate Degree | 0 (0.0%) | 0 (0.0%) |
| Total | 2 (25.0%) | 6 (75.0%) |
Employment Characteristics in Parker
Employment by Class of Employer in Parker
Among the 289 employed individuals in Parker, private company employees (221 | 76.5%), not-for-profit organizations (22 | 7.6%), and self-employed (not incorporated) (18 | 6.2%) make up the most common classes of employment.
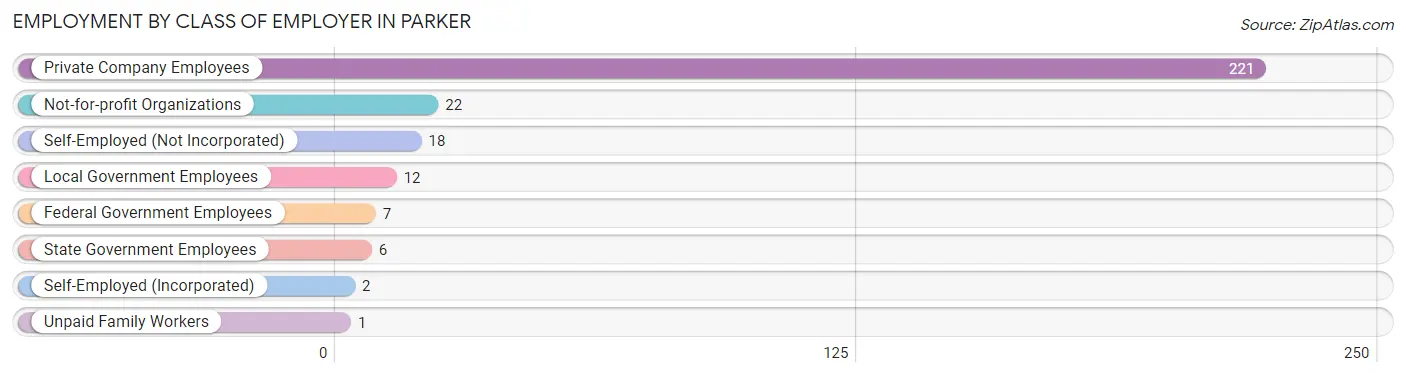
| Employer Class | # Employees | % Employees |
| Private Company Employees | 221 | 76.5% |
| Self-Employed (Incorporated) | 2 | 0.7% |
| Self-Employed (Not Incorporated) | 18 | 6.2% |
| Not-for-profit Organizations | 22 | 7.6% |
| Local Government Employees | 12 | 4.2% |
| State Government Employees | 6 | 2.1% |
| Federal Government Employees | 7 | 2.4% |
| Unpaid Family Workers | 1 | 0.4% |
| Total | 289 | 100.0% |
Employment Status by Age in Parker
According to the labor force statistics for Parker, out of the total population over 16 years of age (533), 61.2% or 326 individuals are in the labor force, with 10.7% or 35 of them unemployed. The age group with the highest labor force participation rate is 35 to 44 years, with 96.5% or 55 individuals in the labor force. Within the labor force, the 25 to 29 years age range has the highest percentage of unemployed individuals, with 56.6% or 30 of them being unemployed.
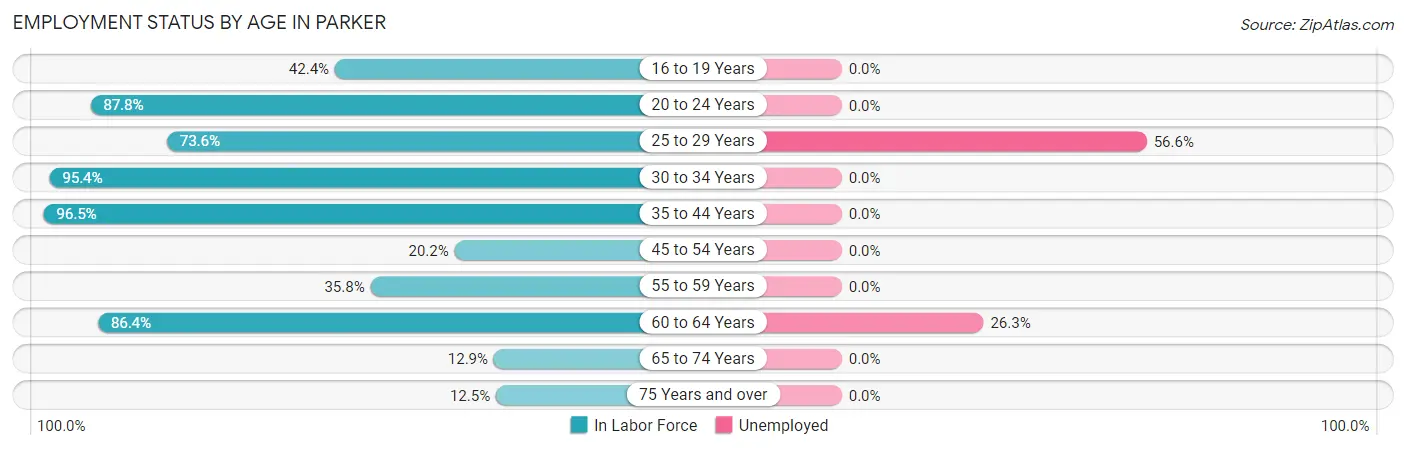
| Age Bracket | In Labor Force | Unemployed |
| 16 to 19 Years | 14 (42.4%) | 0 (0.0%) |
| 20 to 24 Years | 79 (87.8%) | 0 (0.0%) |
| 25 to 29 Years | 53 (73.6%) | 30 (56.6%) |
| 30 to 34 Years | 62 (95.4%) | 0 (0.0%) |
| 35 to 44 Years | 55 (96.5%) | 0 (0.0%) |
| 45 to 54 Years | 19 (20.2%) | 0 (0.0%) |
| 55 to 59 Years | 19 (35.8%) | 0 (0.0%) |
| 60 to 64 Years | 19 (86.4%) | 5 (26.3%) |
| 65 to 74 Years | 4 (12.9%) | 0 (0.0%) |
| 75 Years and over | 2 (12.5%) | 0 (0.0%) |
| Total | 326 (61.2%) | 35 (10.7%) |
Employment Status by Educational Attainment in Parker
According to labor force statistics for Parker, 62.5% of individuals (227) out of the total population between 25 and 64 years of age (363) are in the labor force, with 15.4% or 35 of them being unemployed. The group with the highest labor force participation rate are those with the educational attainment of less than high school, with 84.4% or 27 individuals in the labor force. Within the labor force, individuals with high school diploma education have the highest percentage of unemployment, with 45.7% or 32 of them being unemployed.
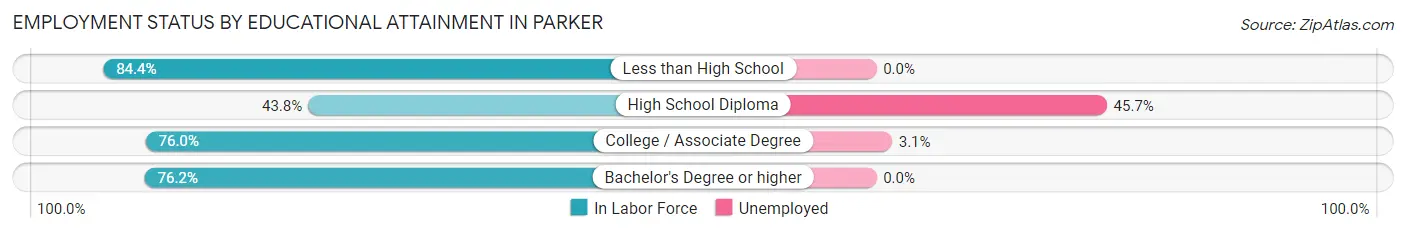
| Educational Attainment | In Labor Force | Unemployed |
| Less than High School | 27 (84.4%) | 0 (0.0%) |
| High School Diploma | 70 (43.8%) | 73 (45.7%) |
| College / Associate Degree | 98 (76.0%) | 4 (3.1%) |
| Bachelor's Degree or higher | 32 (76.2%) | 0 (0.0%) |
| Total | 227 (62.5%) | 56 (15.4%) |
Employment Occupations by Sex in Parker
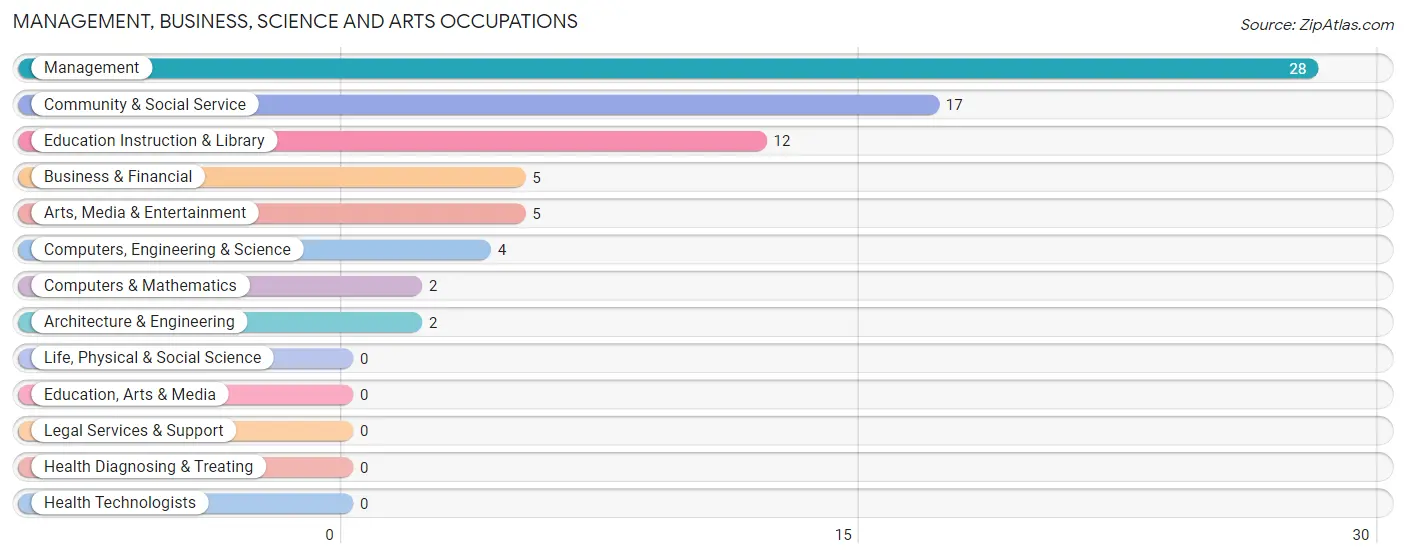
Management, Business, Science and Arts Occupations
The most common Management, Business, Science and Arts occupations in Parker are Management (28 | 9.6%), Community & Social Service (17 | 5.8%), Education Instruction & Library (12 | 4.1%), Business & Financial (5 | 1.7%), and Arts, Media & Entertainment (5 | 1.7%).
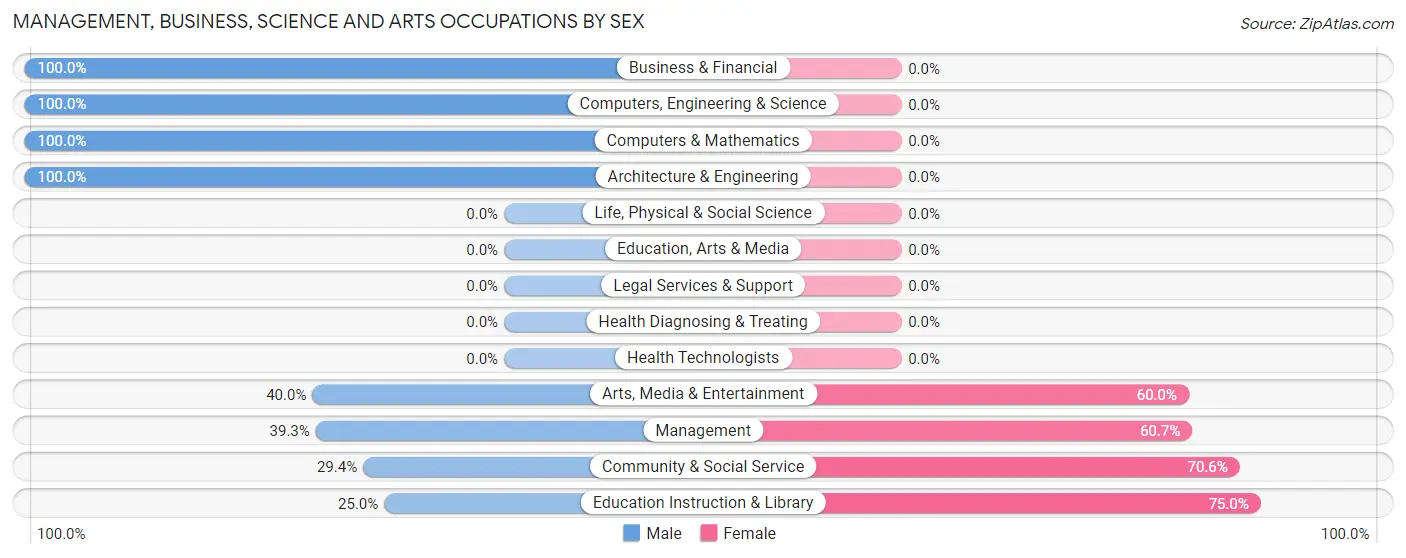
Management, Business, Science and Arts Occupations by Sex
Within the Management, Business, Science and Arts occupations in Parker, the most male-oriented occupations are Business & Financial (100.0%), Computers, Engineering & Science (100.0%), and Computers & Mathematics (100.0%), while the most female-oriented occupations are Education Instruction & Library (75.0%), Community & Social Service (70.6%), and Management (60.7%).
| Occupation | Male | Female |
| Management | 11 (39.3%) | 17 (60.7%) |
| Business & Financial | 5 (100.0%) | 0 (0.0%) |
| Computers, Engineering & Science | 4 (100.0%) | 0 (0.0%) |
| Computers & Mathematics | 2 (100.0%) | 0 (0.0%) |
| Architecture & Engineering | 2 (100.0%) | 0 (0.0%) |
| Life, Physical & Social Science | 0 (0.0%) | 0 (0.0%) |
| Community & Social Service | 5 (29.4%) | 12 (70.6%) |
| Education, Arts & Media | 0 (0.0%) | 0 (0.0%) |
| Legal Services & Support | 0 (0.0%) | 0 (0.0%) |
| Education Instruction & Library | 3 (25.0%) | 9 (75.0%) |
| Arts, Media & Entertainment | 2 (40.0%) | 3 (60.0%) |
| Health Diagnosing & Treating | 0 (0.0%) | 0 (0.0%) |
| Health Technologists | 0 (0.0%) | 0 (0.0%) |
| Total (Category) | 25 (46.3%) | 29 (53.7%) |
| Total (Overall) | 194 (66.7%) | 97 (33.3%) |
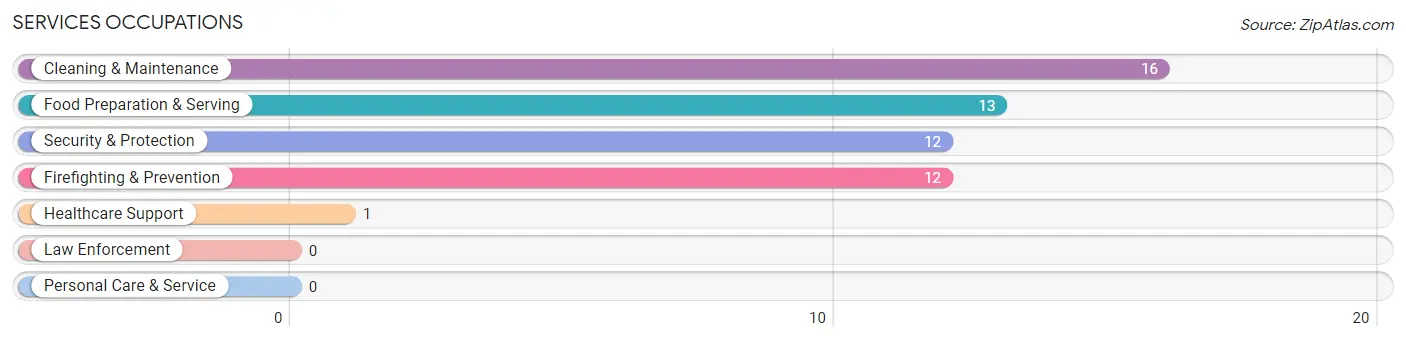
Services Occupations
The most common Services occupations in Parker are Cleaning & Maintenance (16 | 5.5%), Food Preparation & Serving (13 | 4.5%), Security & Protection (12 | 4.1%), Firefighting & Prevention (12 | 4.1%), and Healthcare Support (1 | 0.3%).
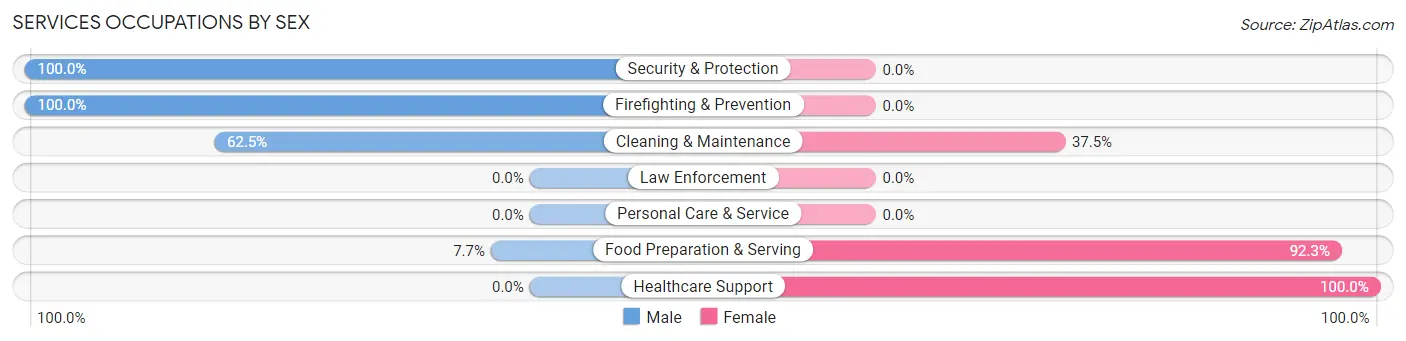
Services Occupations by Sex
Within the Services occupations in Parker, the most male-oriented occupations are Security & Protection (100.0%), Firefighting & Prevention (100.0%), and Cleaning & Maintenance (62.5%), while the most female-oriented occupations are Healthcare Support (100.0%), Food Preparation & Serving (92.3%), and Cleaning & Maintenance (37.5%).
| Occupation | Male | Female |
| Healthcare Support | 0 (0.0%) | 1 (100.0%) |
| Security & Protection | 12 (100.0%) | 0 (0.0%) |
| Firefighting & Prevention | 12 (100.0%) | 0 (0.0%) |
| Law Enforcement | 0 (0.0%) | 0 (0.0%) |
| Food Preparation & Serving | 1 (7.7%) | 12 (92.3%) |
| Cleaning & Maintenance | 10 (62.5%) | 6 (37.5%) |
| Personal Care & Service | 0 (0.0%) | 0 (0.0%) |
| Total (Category) | 23 (54.8%) | 19 (45.2%) |
| Total (Overall) | 194 (66.7%) | 97 (33.3%) |
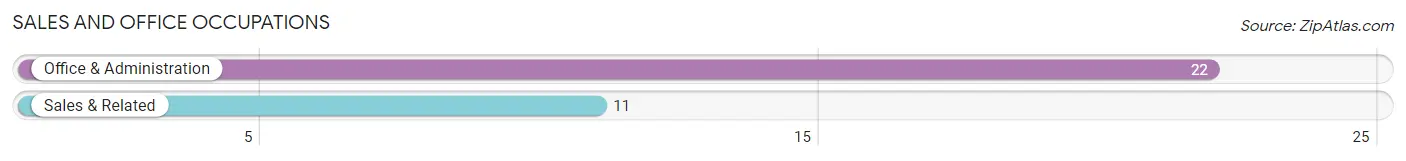
Sales and Office Occupations
The most common Sales and Office occupations in Parker are Office & Administration (22 | 7.6%), and Sales & Related (11 | 3.8%).
Sales and Office Occupations by Sex
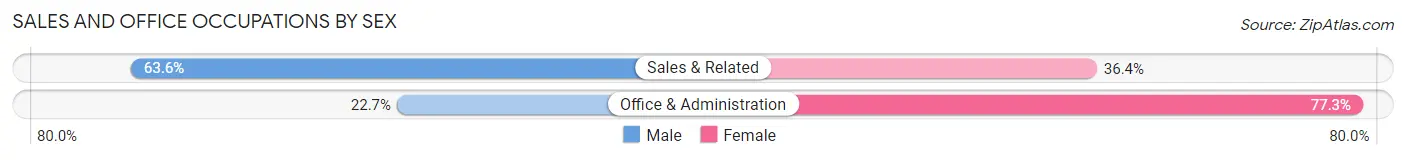
| Occupation | Male | Female |
| Sales & Related | 7 (63.6%) | 4 (36.4%) |
| Office & Administration | 5 (22.7%) | 17 (77.3%) |
| Total (Category) | 12 (36.4%) | 21 (63.6%) |
| Total (Overall) | 194 (66.7%) | 97 (33.3%) |
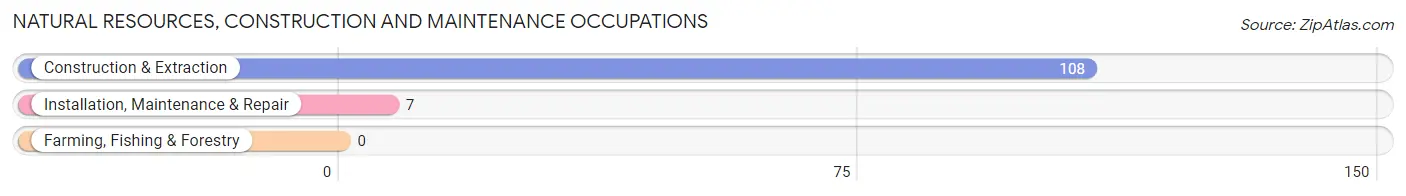
Natural Resources, Construction and Maintenance Occupations
The most common Natural Resources, Construction and Maintenance occupations in Parker are Construction & Extraction (108 | 37.1%), and Installation, Maintenance & Repair (7 | 2.4%).
Natural Resources, Construction and Maintenance Occupations by Sex
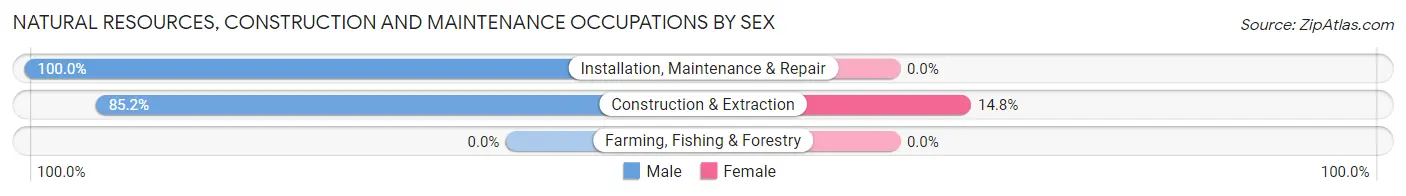
| Occupation | Male | Female |
| Farming, Fishing & Forestry | 0 (0.0%) | 0 (0.0%) |
| Construction & Extraction | 92 (85.2%) | 16 (14.8%) |
| Installation, Maintenance & Repair | 7 (100.0%) | 0 (0.0%) |
| Total (Category) | 99 (86.1%) | 16 (13.9%) |
| Total (Overall) | 194 (66.7%) | 97 (33.3%) |
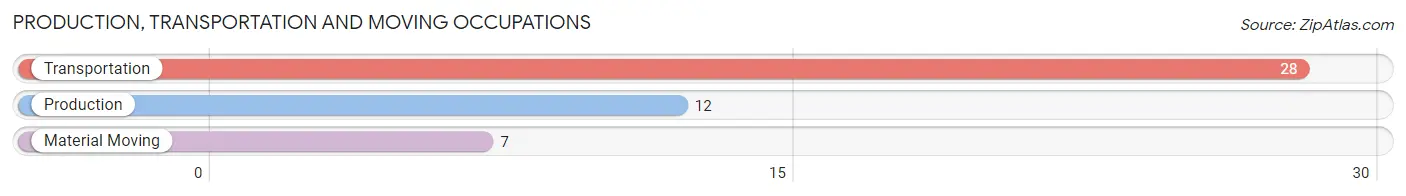
Production, Transportation and Moving Occupations
The most common Production, Transportation and Moving occupations in Parker are Transportation (28 | 9.6%), Production (12 | 4.1%), and Material Moving (7 | 2.4%).
Production, Transportation and Moving Occupations by Sex
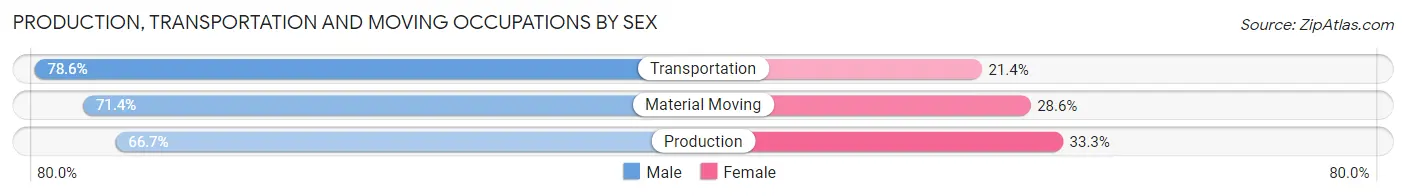
| Occupation | Male | Female |
| Production | 8 (66.7%) | 4 (33.3%) |
| Transportation | 22 (78.6%) | 6 (21.4%) |
| Material Moving | 5 (71.4%) | 2 (28.6%) |
| Total (Category) | 35 (74.5%) | 12 (25.5%) |
| Total (Overall) | 194 (66.7%) | 97 (33.3%) |
Employment Industries by Sex in Parker
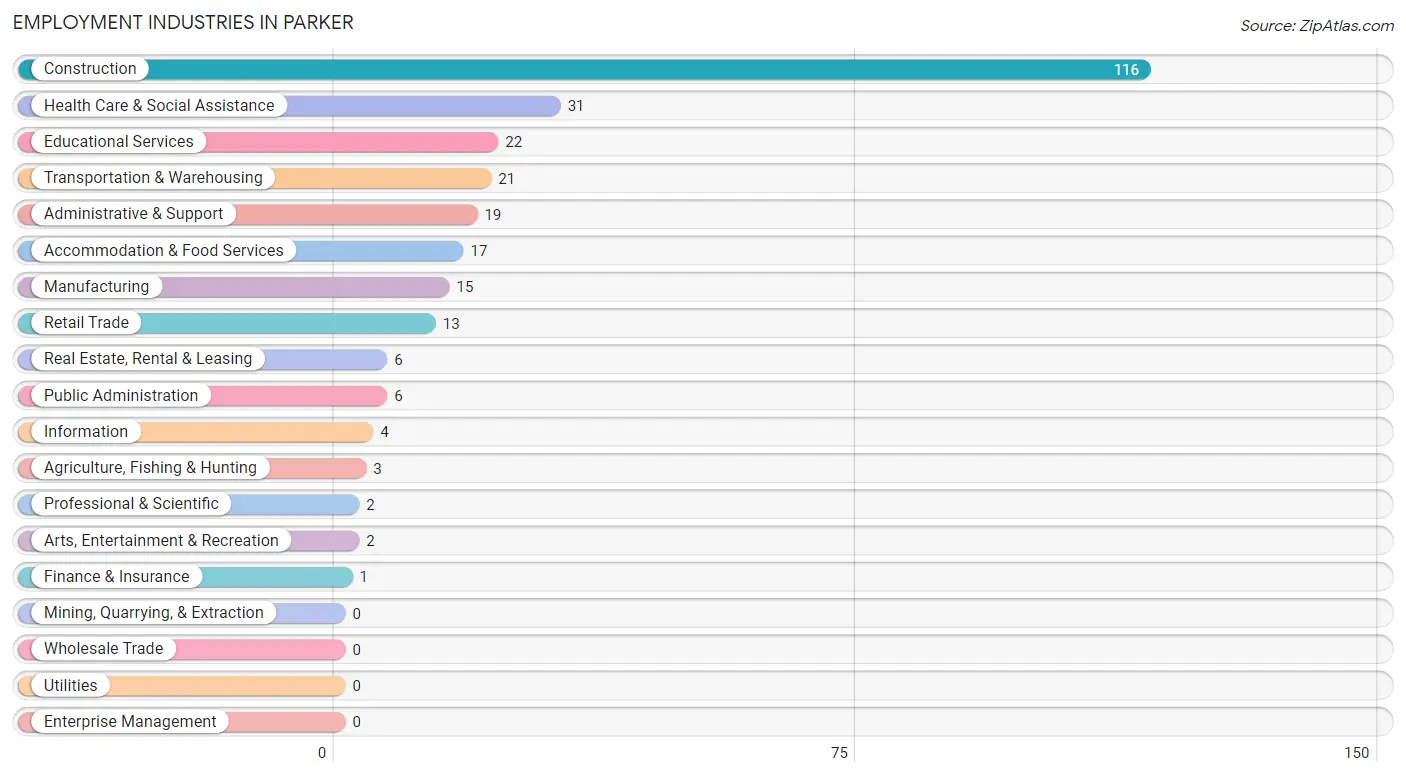
Employment Industries in Parker
The major employment industries in Parker include Construction (116 | 39.9%), Health Care & Social Assistance (31 | 10.6%), Educational Services (22 | 7.6%), Transportation & Warehousing (21 | 7.2%), and Administrative & Support (19 | 6.5%).
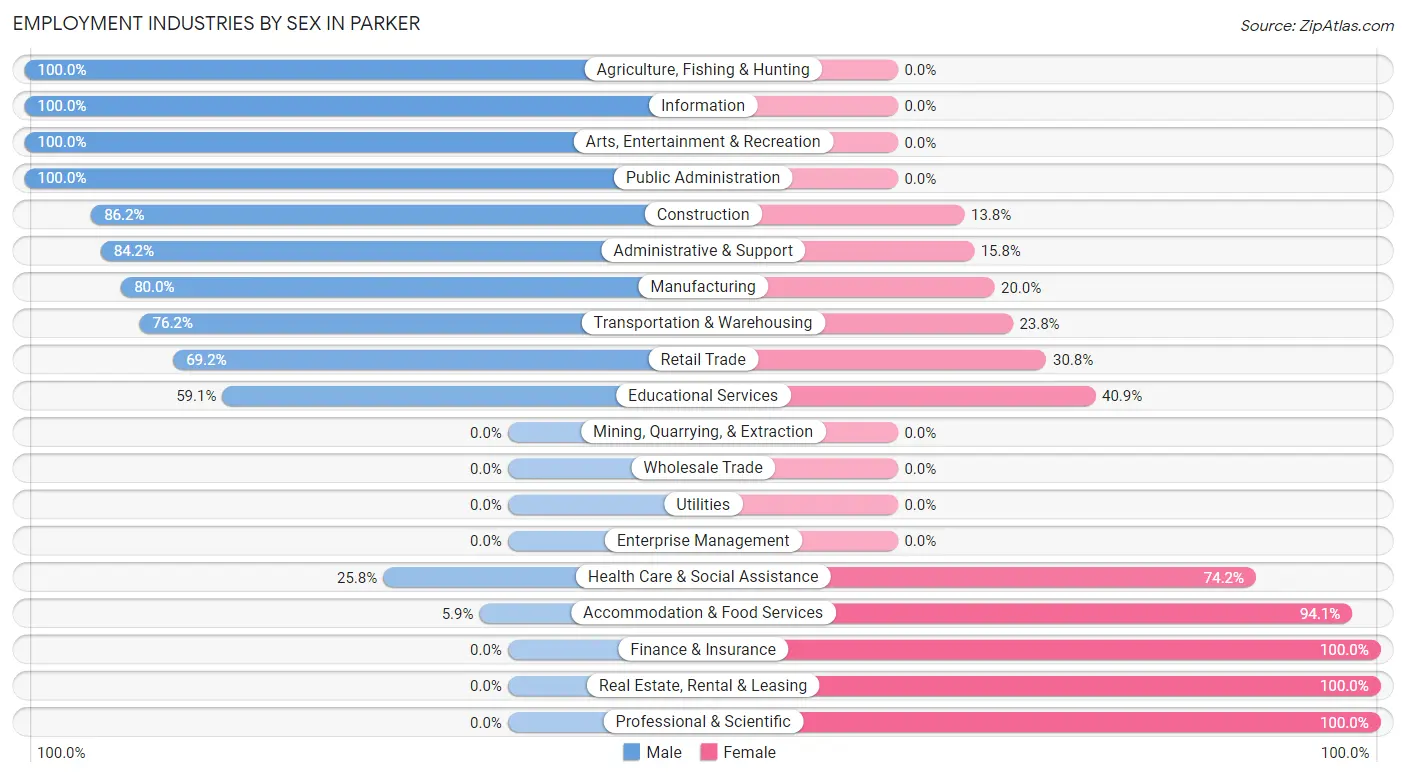
Employment Industries by Sex in Parker
The Parker industries that see more men than women are Agriculture, Fishing & Hunting (100.0%), Information (100.0%), and Arts, Entertainment & Recreation (100.0%), whereas the industries that tend to have a higher number of women are Finance & Insurance (100.0%), Real Estate, Rental & Leasing (100.0%), and Professional & Scientific (100.0%).
| Industry | Male | Female |
| Agriculture, Fishing & Hunting | 3 (100.0%) | 0 (0.0%) |
| Mining, Quarrying, & Extraction | 0 (0.0%) | 0 (0.0%) |
| Construction | 100 (86.2%) | 16 (13.8%) |
| Manufacturing | 12 (80.0%) | 3 (20.0%) |
| Wholesale Trade | 0 (0.0%) | 0 (0.0%) |
| Retail Trade | 9 (69.2%) | 4 (30.8%) |
| Transportation & Warehousing | 16 (76.2%) | 5 (23.8%) |
| Utilities | 0 (0.0%) | 0 (0.0%) |
| Information | 4 (100.0%) | 0 (0.0%) |
| Finance & Insurance | 0 (0.0%) | 1 (100.0%) |
| Real Estate, Rental & Leasing | 0 (0.0%) | 6 (100.0%) |
| Professional & Scientific | 0 (0.0%) | 2 (100.0%) |
| Enterprise Management | 0 (0.0%) | 0 (0.0%) |
| Administrative & Support | 16 (84.2%) | 3 (15.8%) |
| Educational Services | 13 (59.1%) | 9 (40.9%) |
| Health Care & Social Assistance | 8 (25.8%) | 23 (74.2%) |
| Arts, Entertainment & Recreation | 2 (100.0%) | 0 (0.0%) |
| Accommodation & Food Services | 1 (5.9%) | 16 (94.1%) |
| Public Administration | 6 (100.0%) | 0 (0.0%) |
| Total | 194 (66.7%) | 97 (33.3%) |
Education in Parker
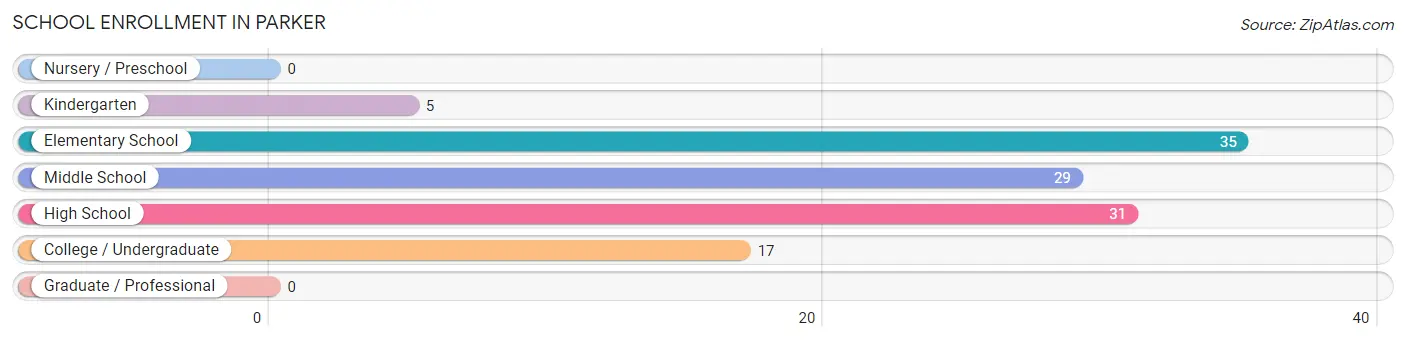
School Enrollment in Parker
The most common levels of schooling among the 117 students in Parker are elementary school (35 | 29.9%), high school (31 | 26.5%), and middle school (29 | 24.8%).
| School Level | # Students | % Students |
| Nursery / Preschool | 0 | 0.0% |
| Kindergarten | 5 | 4.3% |
| Elementary School | 35 | 29.9% |
| Middle School | 29 | 24.8% |
| High School | 31 | 26.5% |
| College / Undergraduate | 17 | 14.5% |
| Graduate / Professional | 0 | 0.0% |
| Total | 117 | 100.0% |
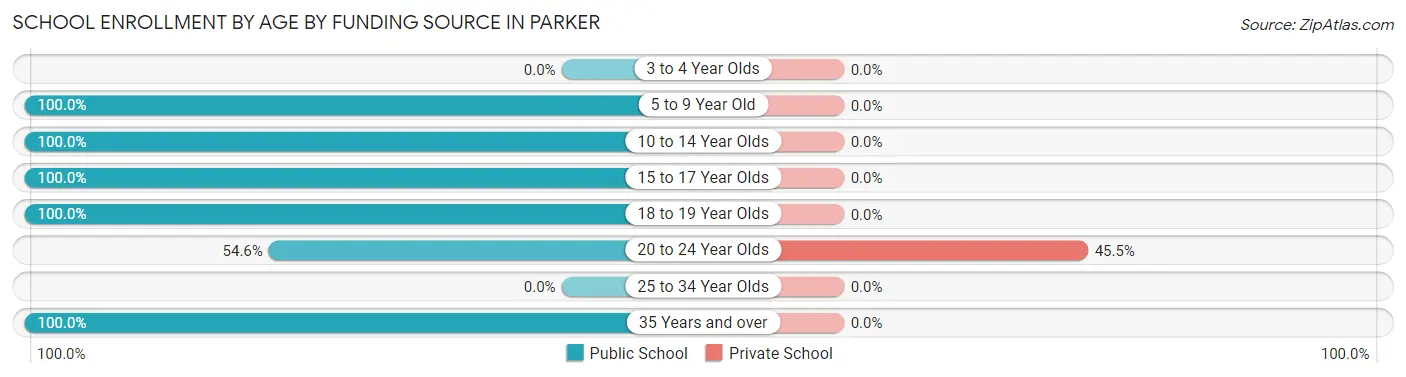
School Enrollment by Age by Funding Source in Parker
Out of a total of 117 students who are enrolled in schools in Parker, 5 (4.3%) attend a private institution, while the remaining 112 (95.7%) are enrolled in public schools. The age group of 20 to 24 year olds has the highest likelihood of being enrolled in private schools, with 5 (45.5% in the age bracket) enrolled. Conversely, the age group of 5 to 9 year old has the lowest likelihood of being enrolled in a private school, with 36 (100.0% in the age bracket) attending a public institution.
| Age Bracket | Public School | Private School |
| 3 to 4 Year Olds | 0 (0.0%) | 0 (0.0%) |
| 5 to 9 Year Old | 36 (100.0%) | 0 (0.0%) |
| 10 to 14 Year Olds | 33 (100.0%) | 0 (0.0%) |
| 15 to 17 Year Olds | 18 (100.0%) | 0 (0.0%) |
| 18 to 19 Year Olds | 13 (100.0%) | 0 (0.0%) |
| 20 to 24 Year Olds | 6 (54.5%) | 5 (45.5%) |
| 25 to 34 Year Olds | 0 (0.0%) | 0 (0.0%) |
| 35 Years and over | 6 (100.0%) | 0 (0.0%) |
| Total | 112 (95.7%) | 5 (4.3%) |
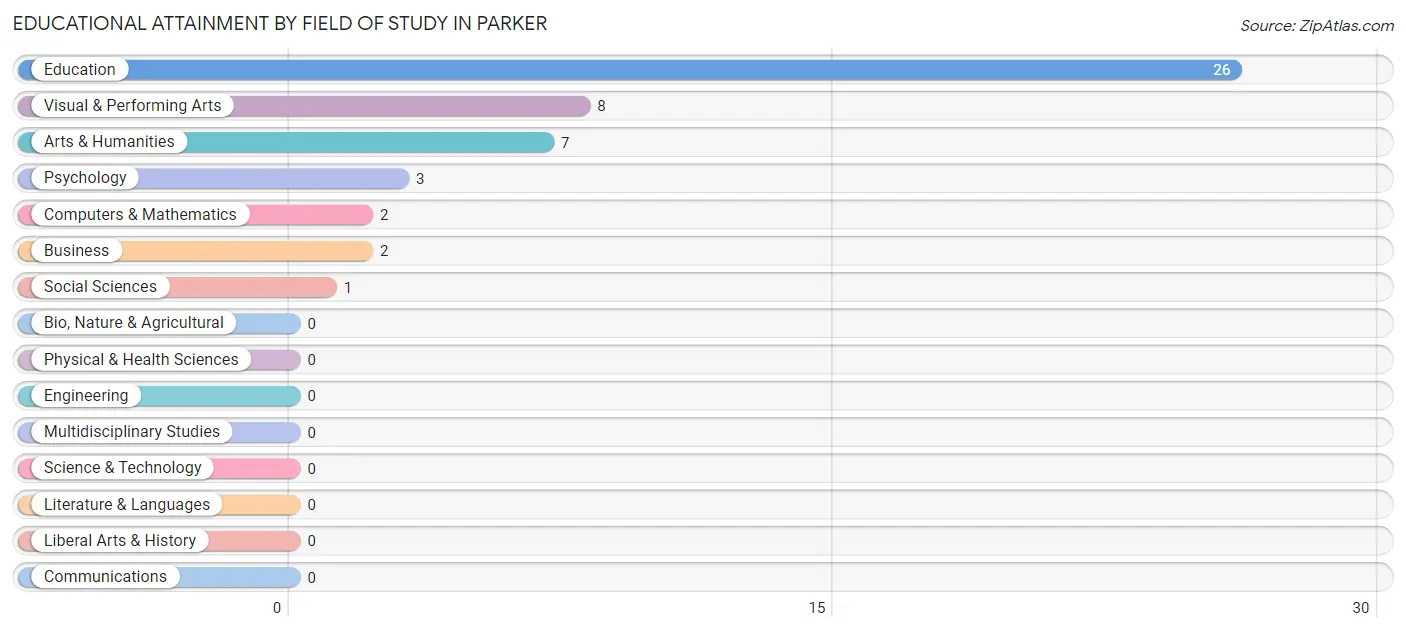
Educational Attainment by Field of Study in Parker
Education (26 | 53.1%), visual & performing arts (8 | 16.3%), arts & humanities (7 | 14.3%), psychology (3 | 6.1%), and computers & mathematics (2 | 4.1%) are the most common fields of study among 49 individuals in Parker who have obtained a bachelor's degree or higher.
| Field of Study | # Graduates | % Graduates |
| Computers & Mathematics | 2 | 4.1% |
| Bio, Nature & Agricultural | 0 | 0.0% |
| Physical & Health Sciences | 0 | 0.0% |
| Psychology | 3 | 6.1% |
| Social Sciences | 1 | 2.0% |
| Engineering | 0 | 0.0% |
| Multidisciplinary Studies | 0 | 0.0% |
| Science & Technology | 0 | 0.0% |
| Business | 2 | 4.1% |
| Education | 26 | 53.1% |
| Literature & Languages | 0 | 0.0% |
| Liberal Arts & History | 0 | 0.0% |
| Visual & Performing Arts | 8 | 16.3% |
| Communications | 0 | 0.0% |
| Arts & Humanities | 7 | 14.3% |
| Total | 49 | 100.0% |
Transportation & Commute in Parker
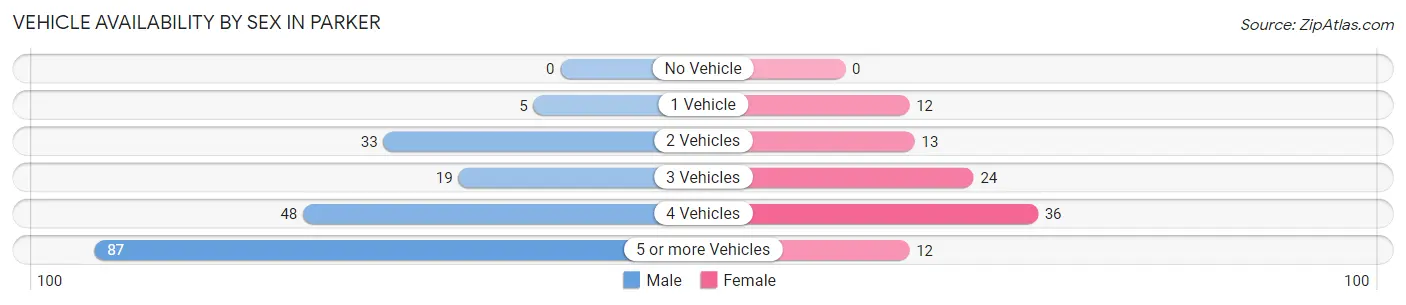
Vehicle Availability by Sex in Parker
The most prevalent vehicle ownership categories in Parker are males with 5 or more vehicles (87, accounting for 45.3%) and females with 5 or more vehicles (12, making up 89.7%).
| Vehicles Available | Male | Female |
| No Vehicle | 0 (0.0%) | 0 (0.0%) |
| 1 Vehicle | 5 (2.6%) | 12 (12.4%) |
| 2 Vehicles | 33 (17.2%) | 13 (13.4%) |
| 3 Vehicles | 19 (9.9%) | 24 (24.7%) |
| 4 Vehicles | 48 (25.0%) | 36 (37.1%) |
| 5 or more Vehicles | 87 (45.3%) | 12 (12.4%) |
| Total | 192 (100.0%) | 97 (100.0%) |
Commute Time in Parker
The most frequently occuring commute durations in Parker are 60 to 89 minutes (59 commuters, 21.1%), 45 to 59 minutes (57 commuters, 20.4%), and 20 to 24 minutes (46 commuters, 16.4%).
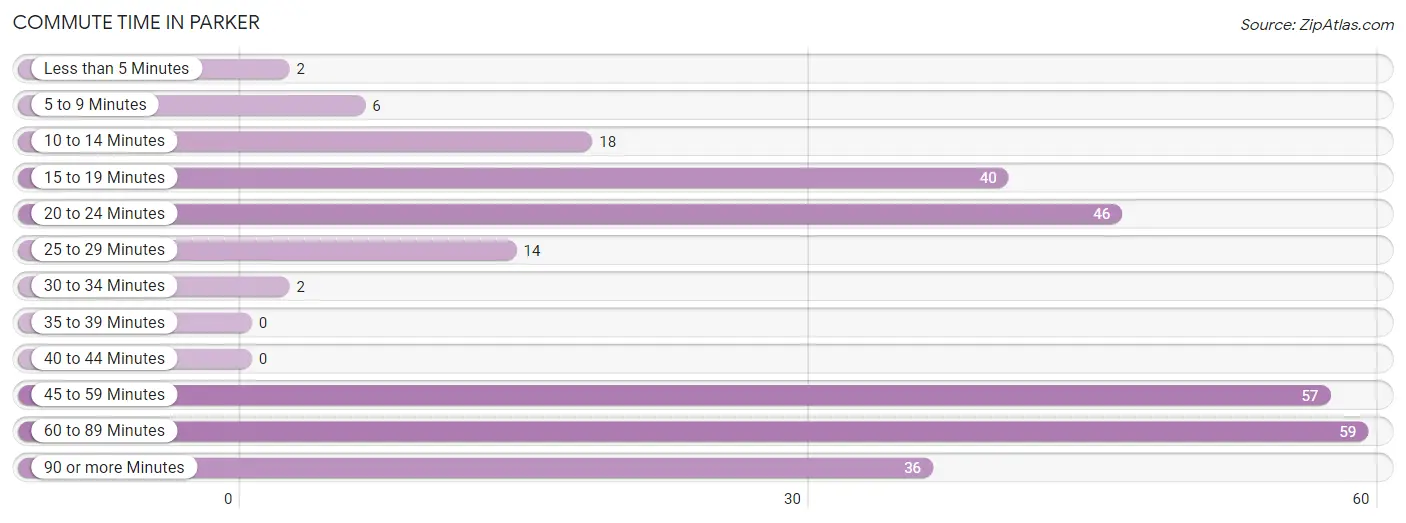
| Commute Time | # Commuters | % Commuters |
| Less than 5 Minutes | 2 | 0.7% |
| 5 to 9 Minutes | 6 | 2.1% |
| 10 to 14 Minutes | 18 | 6.4% |
| 15 to 19 Minutes | 40 | 14.3% |
| 20 to 24 Minutes | 46 | 16.4% |
| 25 to 29 Minutes | 14 | 5.0% |
| 30 to 34 Minutes | 2 | 0.7% |
| 35 to 39 Minutes | 0 | 0.0% |
| 40 to 44 Minutes | 0 | 0.0% |
| 45 to 59 Minutes | 57 | 20.4% |
| 60 to 89 Minutes | 59 | 21.1% |
| 90 or more Minutes | 36 | 12.9% |
Commute Time by Sex in Parker
The most common commute times in Parker are 60 to 89 minutes (52 commuters, 27.4%) for males and 45 to 59 minutes (19 commuters, 21.1%) for females.
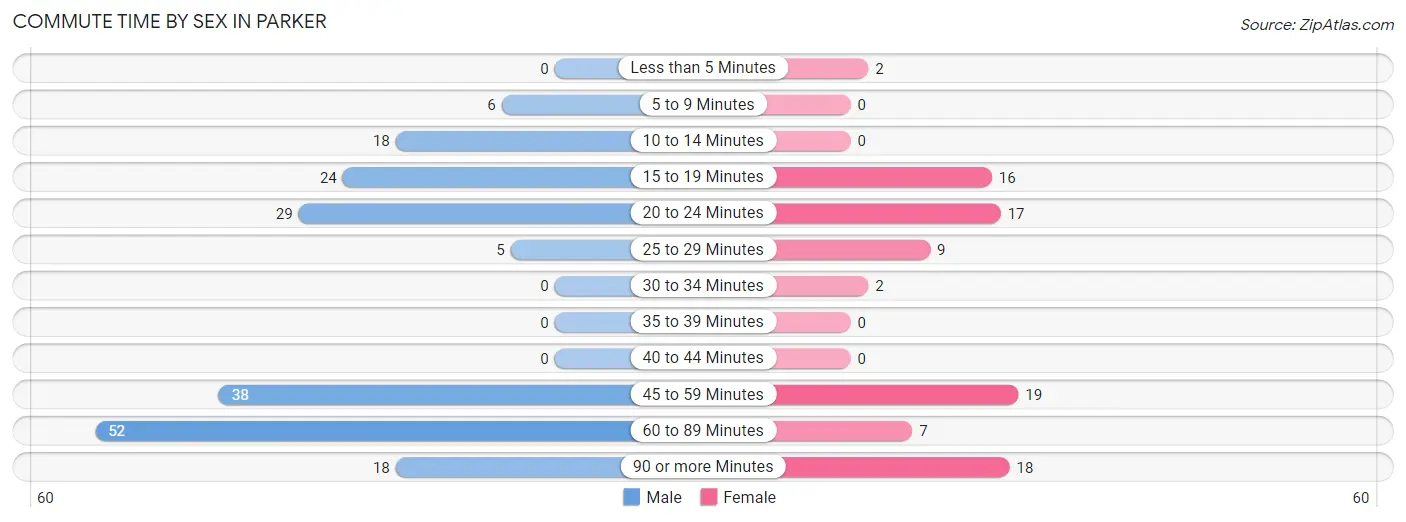
| Commute Time | Male | Female |
| Less than 5 Minutes | 0 (0.0%) | 2 (2.2%) |
| 5 to 9 Minutes | 6 (3.2%) | 0 (0.0%) |
| 10 to 14 Minutes | 18 (9.5%) | 0 (0.0%) |
| 15 to 19 Minutes | 24 (12.6%) | 16 (17.8%) |
| 20 to 24 Minutes | 29 (15.3%) | 17 (18.9%) |
| 25 to 29 Minutes | 5 (2.6%) | 9 (10.0%) |
| 30 to 34 Minutes | 0 (0.0%) | 2 (2.2%) |
| 35 to 39 Minutes | 0 (0.0%) | 0 (0.0%) |
| 40 to 44 Minutes | 0 (0.0%) | 0 (0.0%) |
| 45 to 59 Minutes | 38 (20.0%) | 19 (21.1%) |
| 60 to 89 Minutes | 52 (27.4%) | 7 (7.8%) |
| 90 or more Minutes | 18 (9.5%) | 18 (20.0%) |
Time of Departure to Work by Sex in Parker
The most frequent times of departure to work in Parker are 12:00 AM to 4:59 AM (54, 28.4%) for males and 7:30 AM to 7:59 AM (16, 17.8%) for females.
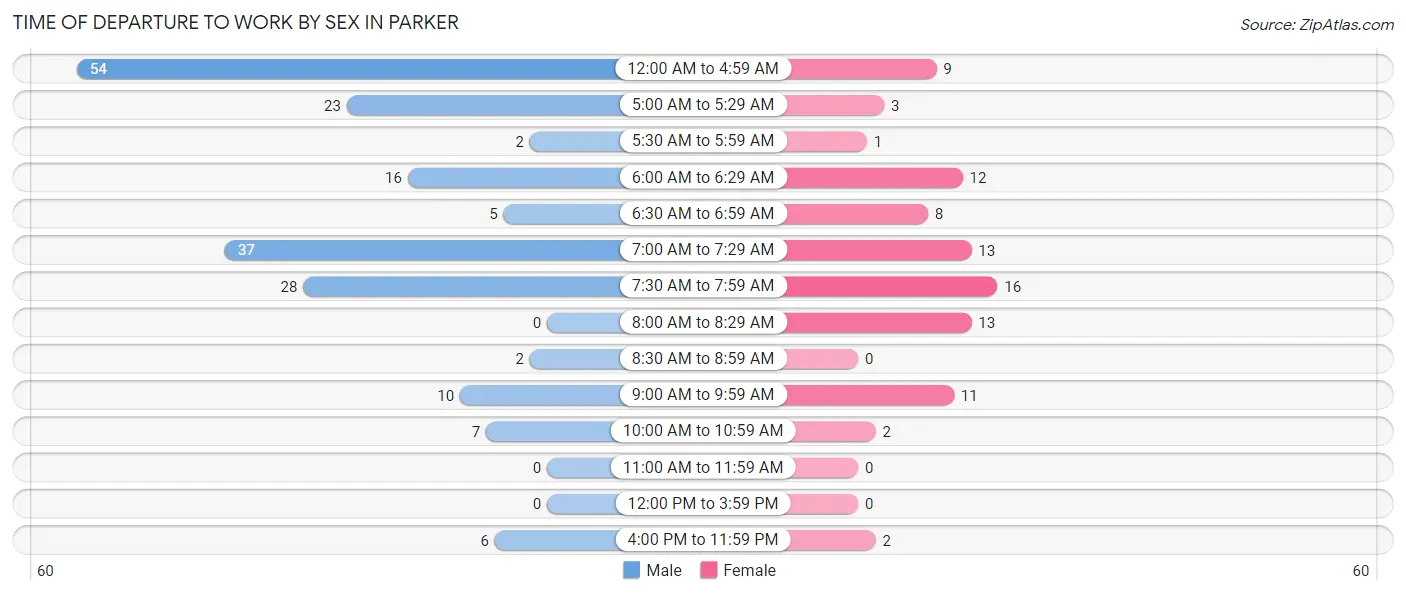
| Time of Departure | Male | Female |
| 12:00 AM to 4:59 AM | 54 (28.4%) | 9 (10.0%) |
| 5:00 AM to 5:29 AM | 23 (12.1%) | 3 (3.3%) |
| 5:30 AM to 5:59 AM | 2 (1.1%) | 1 (1.1%) |
| 6:00 AM to 6:29 AM | 16 (8.4%) | 12 (13.3%) |
| 6:30 AM to 6:59 AM | 5 (2.6%) | 8 (8.9%) |
| 7:00 AM to 7:29 AM | 37 (19.5%) | 13 (14.4%) |
| 7:30 AM to 7:59 AM | 28 (14.7%) | 16 (17.8%) |
| 8:00 AM to 8:29 AM | 0 (0.0%) | 13 (14.4%) |
| 8:30 AM to 8:59 AM | 2 (1.1%) | 0 (0.0%) |
| 9:00 AM to 9:59 AM | 10 (5.3%) | 11 (12.2%) |
| 10:00 AM to 10:59 AM | 7 (3.7%) | 2 (2.2%) |
| 11:00 AM to 11:59 AM | 0 (0.0%) | 0 (0.0%) |
| 12:00 PM to 3:59 PM | 0 (0.0%) | 0 (0.0%) |
| 4:00 PM to 11:59 PM | 6 (3.2%) | 2 (2.2%) |
| Total | 190 (100.0%) | 90 (100.0%) |
Housing Occupancy in Parker
Occupancy by Ownership in Parker
Of the total 162 dwellings in Parker, owner-occupied units account for 133 (82.1%), while renter-occupied units make up 29 (17.9%).
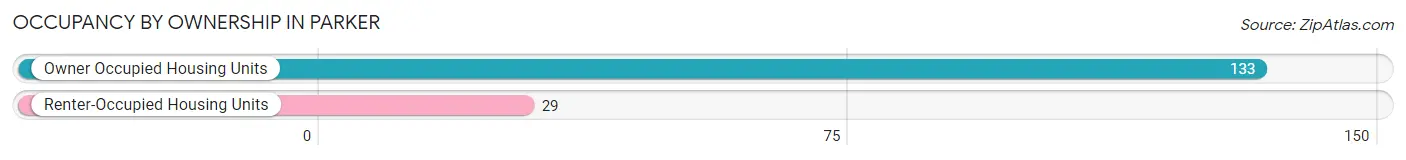
| Occupancy | # Housing Units | % Housing Units |
| Owner Occupied Housing Units | 133 | 82.1% |
| Renter-Occupied Housing Units | 29 | 17.9% |
| Total Occupied Housing Units | 162 | 100.0% |
Occupancy by Household Size in Parker
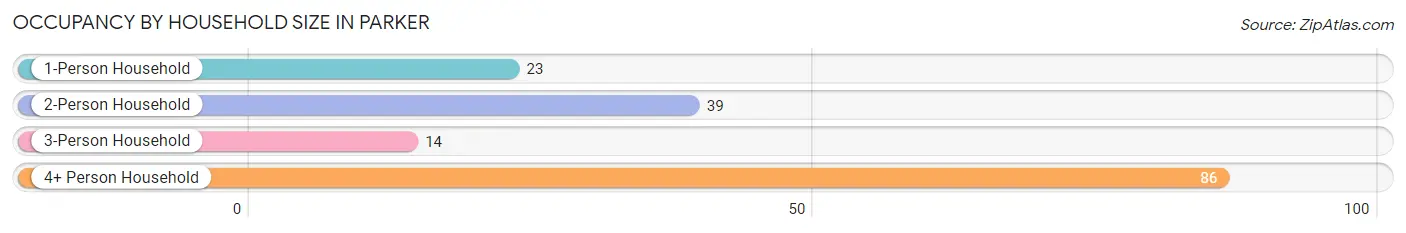
| Household Size | # Housing Units | % Housing Units |
| 1-Person Household | 23 | 14.2% |
| 2-Person Household | 39 | 24.1% |
| 3-Person Household | 14 | 8.6% |
| 4+ Person Household | 86 | 53.1% |
| Total Housing Units | 162 | 100.0% |
Occupancy by Ownership by Household Size in Parker
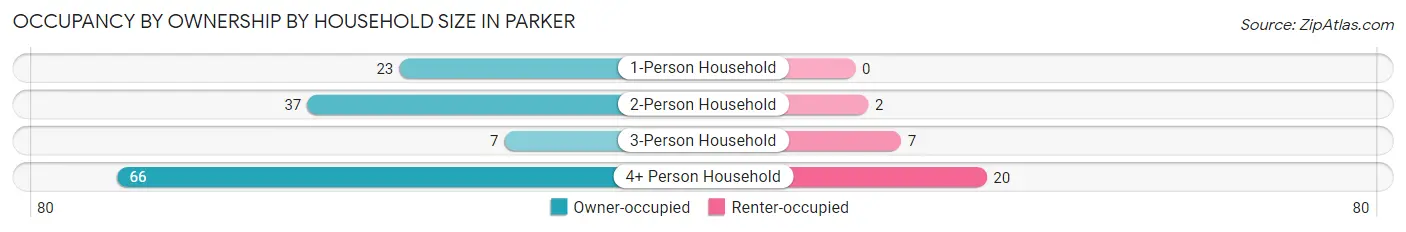
| Household Size | Owner-occupied | Renter-occupied |
| 1-Person Household | 23 (100.0%) | 0 (0.0%) |
| 2-Person Household | 37 (94.9%) | 2 (5.1%) |
| 3-Person Household | 7 (50.0%) | 7 (50.0%) |
| 4+ Person Household | 66 (76.7%) | 20 (23.3%) |
| Total Housing Units | 133 (82.1%) | 29 (17.9%) |
Occupancy by Educational Attainment in Parker
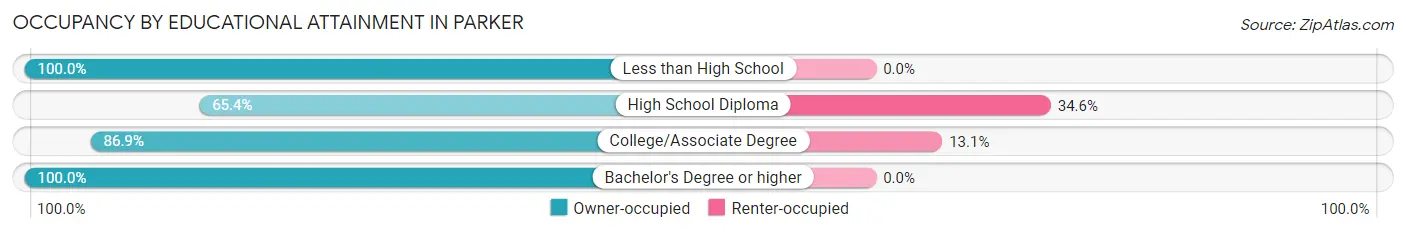
| Household Size | Owner-occupied | Renter-occupied |
| Less than High School | 6 (100.0%) | 0 (0.0%) |
| High School Diploma | 34 (65.4%) | 18 (34.6%) |
| College/Associate Degree | 73 (86.9%) | 11 (13.1%) |
| Bachelor's Degree or higher | 20 (100.0%) | 0 (0.0%) |
Occupancy by Age of Householder in Parker
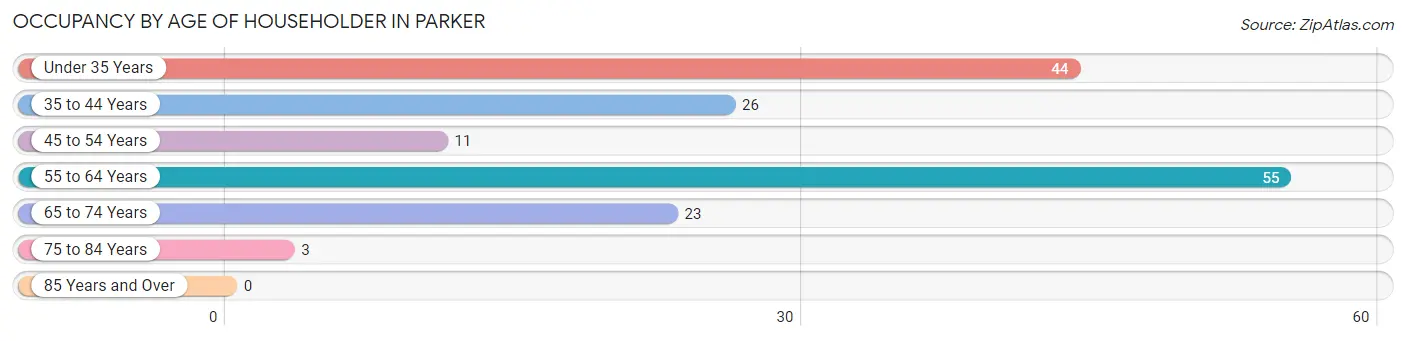
| Age Bracket | # Households | % Households |
| Under 35 Years | 44 | 27.2% |
| 35 to 44 Years | 26 | 16.1% |
| 45 to 54 Years | 11 | 6.8% |
| 55 to 64 Years | 55 | 34.0% |
| 65 to 74 Years | 23 | 14.2% |
| 75 to 84 Years | 3 | 1.8% |
| 85 Years and Over | 0 | 0.0% |
| Total | 162 | 100.0% |
Housing Finances in Parker
Median Income by Occupancy in Parker
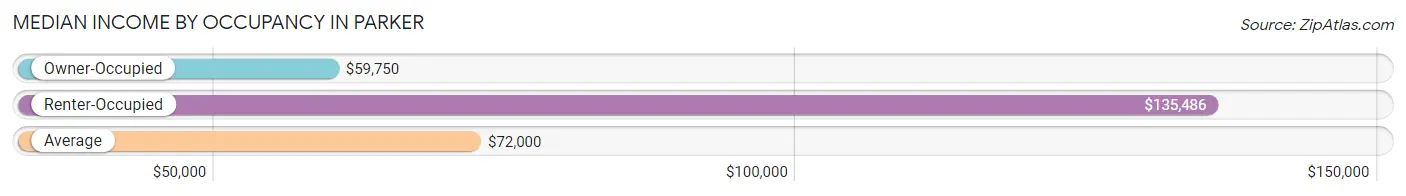
| Occupancy Type | # Households | Median Income |
| Owner-Occupied | 133 (82.1%) | $59,750 |
| Renter-Occupied | 29 (17.9%) | $135,486 |
| Average | 162 (100.0%) | $72,000 |
Occupancy by Householder Income Bracket in Parker
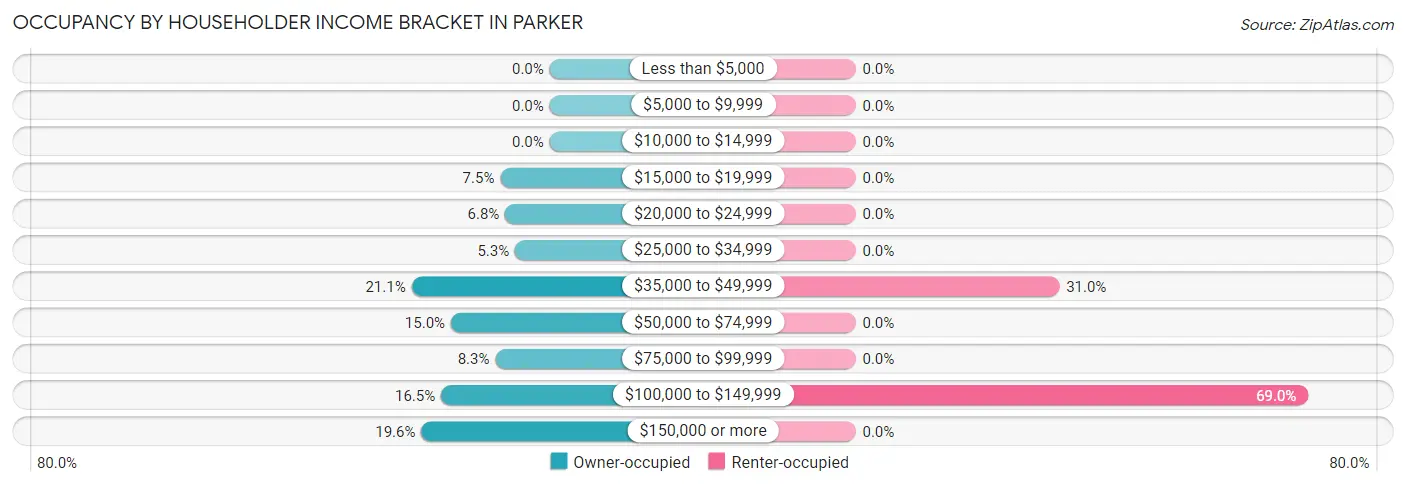
| Income Bracket | Owner-occupied | Renter-occupied |
| Less than $5,000 | 0 (0.0%) | 0 (0.0%) |
| $5,000 to $9,999 | 0 (0.0%) | 0 (0.0%) |
| $10,000 to $14,999 | 0 (0.0%) | 0 (0.0%) |
| $15,000 to $19,999 | 10 (7.5%) | 0 (0.0%) |
| $20,000 to $24,999 | 9 (6.8%) | 0 (0.0%) |
| $25,000 to $34,999 | 7 (5.3%) | 0 (0.0%) |
| $35,000 to $49,999 | 28 (21.0%) | 9 (31.0%) |
| $50,000 to $74,999 | 20 (15.0%) | 0 (0.0%) |
| $75,000 to $99,999 | 11 (8.3%) | 0 (0.0%) |
| $100,000 to $149,999 | 22 (16.5%) | 20 (69.0%) |
| $150,000 or more | 26 (19.6%) | 0 (0.0%) |
| Total | 133 (100.0%) | 29 (100.0%) |
Monthly Housing Cost Tiers in Parker
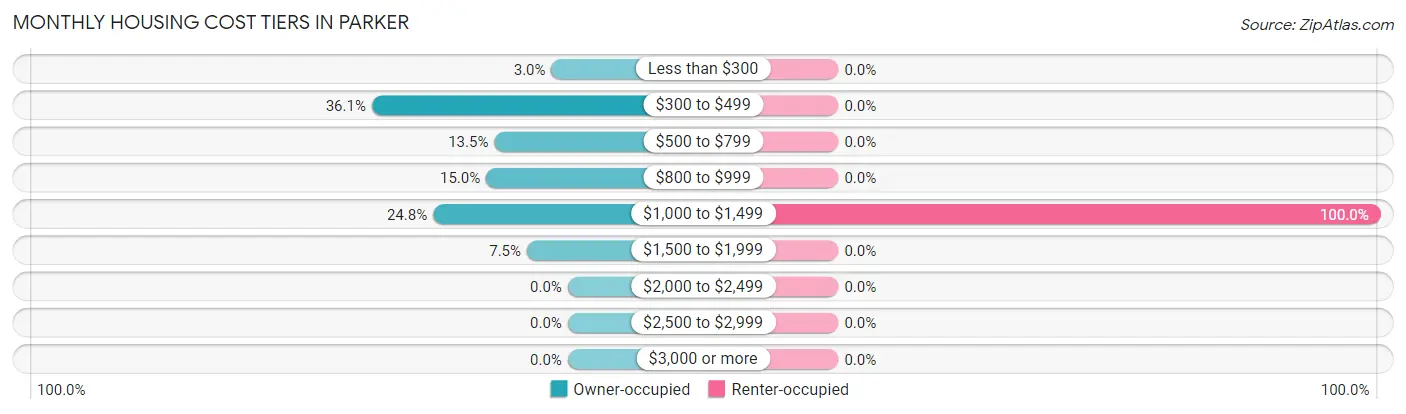
| Monthly Cost | Owner-occupied | Renter-occupied |
| Less than $300 | 4 (3.0%) | 0 (0.0%) |
| $300 to $499 | 48 (36.1%) | 0 (0.0%) |
| $500 to $799 | 18 (13.5%) | 0 (0.0%) |
| $800 to $999 | 20 (15.0%) | 0 (0.0%) |
| $1,000 to $1,499 | 33 (24.8%) | 29 (100.0%) |
| $1,500 to $1,999 | 10 (7.5%) | 0 (0.0%) |
| $2,000 to $2,499 | 0 (0.0%) | 0 (0.0%) |
| $2,500 to $2,999 | 0 (0.0%) | 0 (0.0%) |
| $3,000 or more | 0 (0.0%) | 0 (0.0%) |
| Total | 133 (100.0%) | 29 (100.0%) |
Physical Housing Characteristics in Parker
Housing Structures in Parker
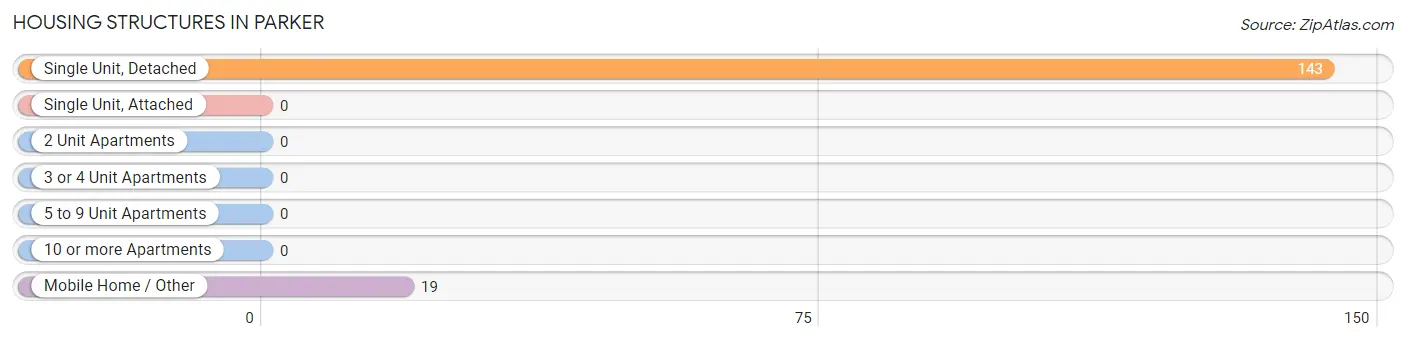
| Structure Type | # Housing Units | % Housing Units |
| Single Unit, Detached | 143 | 88.3% |
| Single Unit, Attached | 0 | 0.0% |
| 2 Unit Apartments | 0 | 0.0% |
| 3 or 4 Unit Apartments | 0 | 0.0% |
| 5 to 9 Unit Apartments | 0 | 0.0% |
| 10 or more Apartments | 0 | 0.0% |
| Mobile Home / Other | 19 | 11.7% |
| Total | 162 | 100.0% |
Housing Structures by Occupancy in Parker
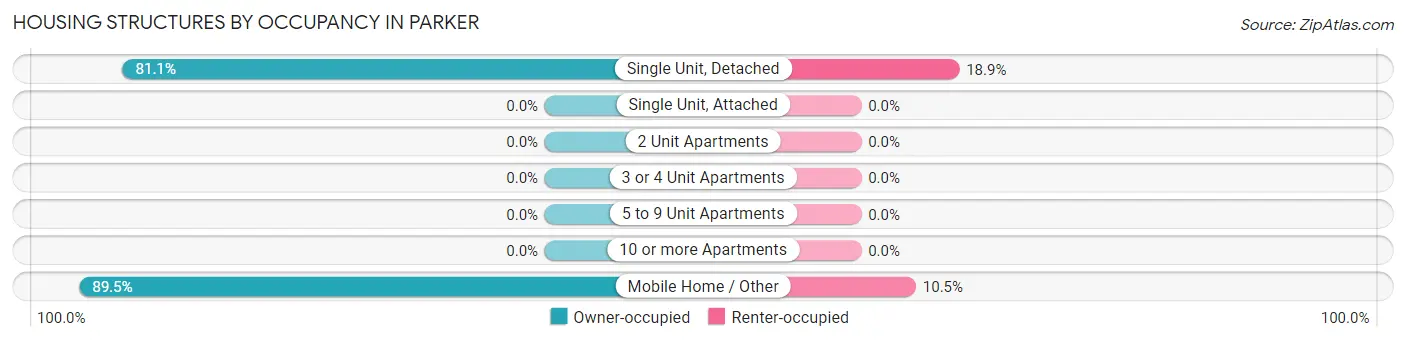
| Structure Type | Owner-occupied | Renter-occupied |
| Single Unit, Detached | 116 (81.1%) | 27 (18.9%) |
| Single Unit, Attached | 0 (0.0%) | 0 (0.0%) |
| 2 Unit Apartments | 0 (0.0%) | 0 (0.0%) |
| 3 or 4 Unit Apartments | 0 (0.0%) | 0 (0.0%) |
| 5 to 9 Unit Apartments | 0 (0.0%) | 0 (0.0%) |
| 10 or more Apartments | 0 (0.0%) | 0 (0.0%) |
| Mobile Home / Other | 17 (89.5%) | 2 (10.5%) |
| Total | 133 (82.1%) | 29 (17.9%) |
Housing Structures by Number of Rooms in Parker
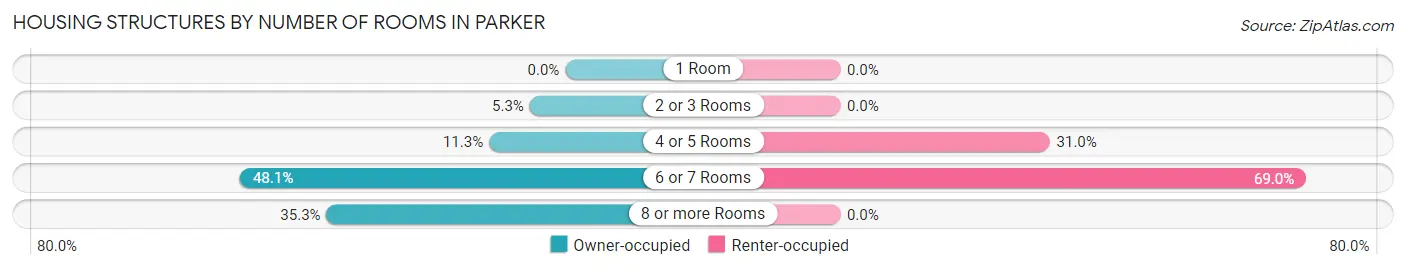
| Number of Rooms | Owner-occupied | Renter-occupied |
| 1 Room | 0 (0.0%) | 0 (0.0%) |
| 2 or 3 Rooms | 7 (5.3%) | 0 (0.0%) |
| 4 or 5 Rooms | 15 (11.3%) | 9 (31.0%) |
| 6 or 7 Rooms | 64 (48.1%) | 20 (69.0%) |
| 8 or more Rooms | 47 (35.3%) | 0 (0.0%) |
| Total | 133 (100.0%) | 29 (100.0%) |
Housing Structure by Heating Type in Parker
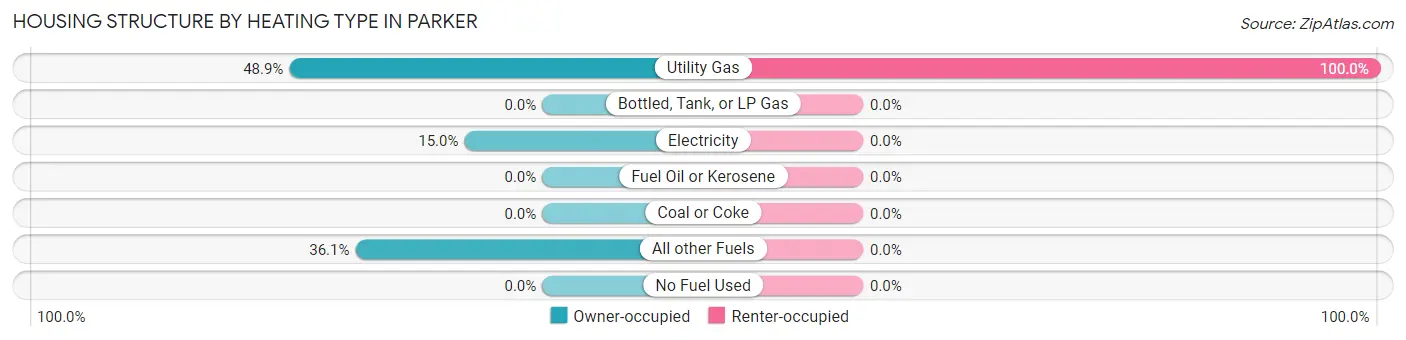
| Heating Type | Owner-occupied | Renter-occupied |
| Utility Gas | 65 (48.9%) | 29 (100.0%) |
| Bottled, Tank, or LP Gas | 0 (0.0%) | 0 (0.0%) |
| Electricity | 20 (15.0%) | 0 (0.0%) |
| Fuel Oil or Kerosene | 0 (0.0%) | 0 (0.0%) |
| Coal or Coke | 0 (0.0%) | 0 (0.0%) |
| All other Fuels | 48 (36.1%) | 0 (0.0%) |
| No Fuel Used | 0 (0.0%) | 0 (0.0%) |
| Total | 133 (100.0%) | 29 (100.0%) |
Household Vehicle Usage in Parker
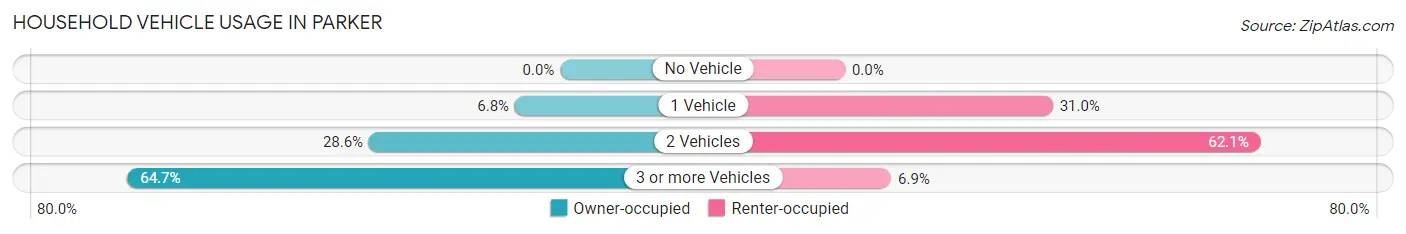
| Vehicles per Household | Owner-occupied | Renter-occupied |
| No Vehicle | 0 (0.0%) | 0 (0.0%) |
| 1 Vehicle | 9 (6.8%) | 9 (31.0%) |
| 2 Vehicles | 38 (28.6%) | 18 (62.1%) |
| 3 or more Vehicles | 86 (64.7%) | 2 (6.9%) |
| Total | 133 (100.0%) | 29 (100.0%) |
Real Estate & Mortgages in Parker
Real Estate and Mortgage Overview in Parker
| Characteristic | Without Mortgage | With Mortgage |
| Housing Units | 63 | 70 |
| Median Property Value | $226,500 | $242,900 |
| Median Household Income | - | - |
| Monthly Housing Costs | $429 | $0 |
| Real Estate Taxes | $1,893 | $7 |
Property Value by Mortgage Status in Parker
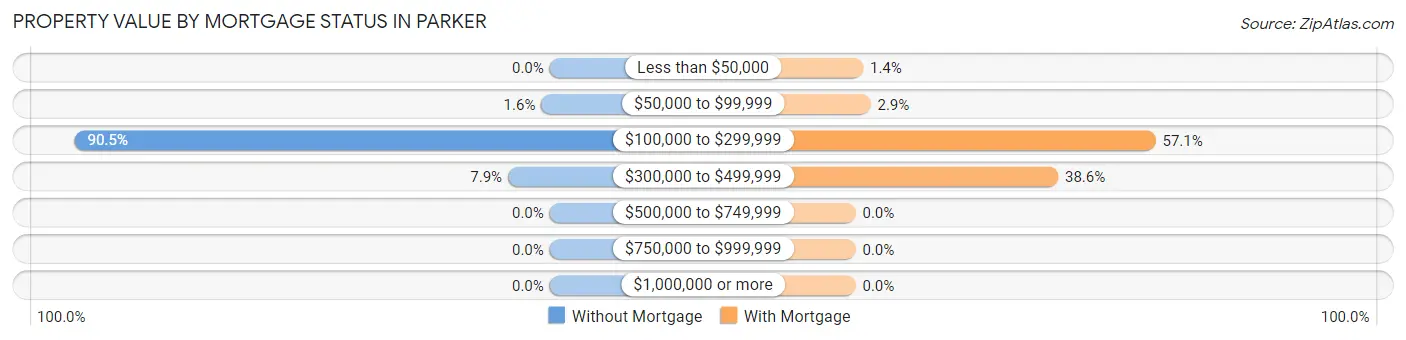
| Property Value | Without Mortgage | With Mortgage |
| Less than $50,000 | 0 (0.0%) | 1 (1.4%) |
| $50,000 to $99,999 | 1 (1.6%) | 2 (2.9%) |
| $100,000 to $299,999 | 57 (90.5%) | 40 (57.1%) |
| $300,000 to $499,999 | 5 (7.9%) | 27 (38.6%) |
| $500,000 to $749,999 | 0 (0.0%) | 0 (0.0%) |
| $750,000 to $999,999 | 0 (0.0%) | 0 (0.0%) |
| $1,000,000 or more | 0 (0.0%) | 0 (0.0%) |
| Total | 63 (100.0%) | 70 (100.0%) |
Household Income by Mortgage Status in Parker
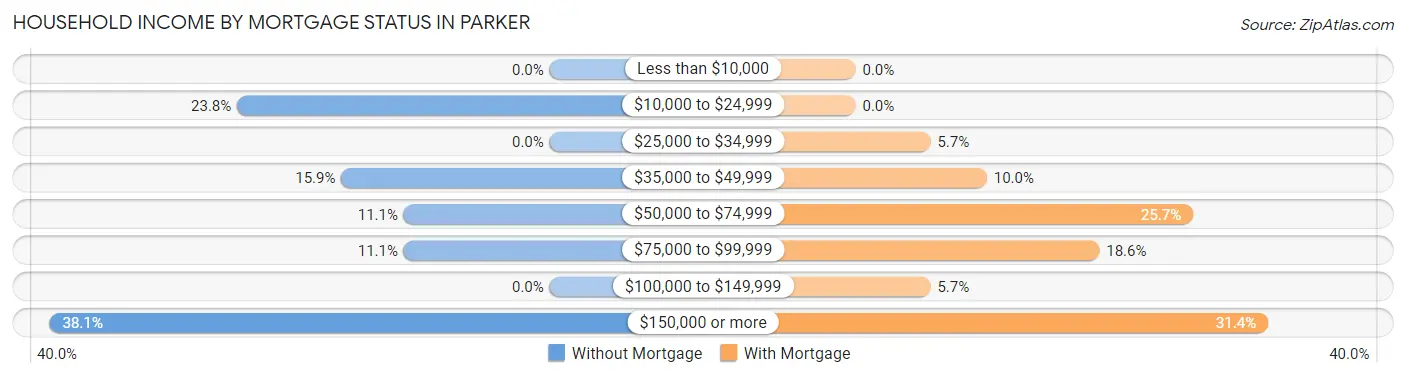
| Household Income | Without Mortgage | With Mortgage |
| Less than $10,000 | 0 (0.0%) | 0 (0.0%) |
| $10,000 to $24,999 | 15 (23.8%) | 0 (0.0%) |
| $25,000 to $34,999 | 0 (0.0%) | 4 (5.7%) |
| $35,000 to $49,999 | 10 (15.9%) | 7 (10.0%) |
| $50,000 to $74,999 | 7 (11.1%) | 18 (25.7%) |
| $75,000 to $99,999 | 7 (11.1%) | 13 (18.6%) |
| $100,000 to $149,999 | 0 (0.0%) | 4 (5.7%) |
| $150,000 or more | 24 (38.1%) | 22 (31.4%) |
| Total | 63 (100.0%) | 70 (100.0%) |
Property Value to Household Income Ratio in Parker
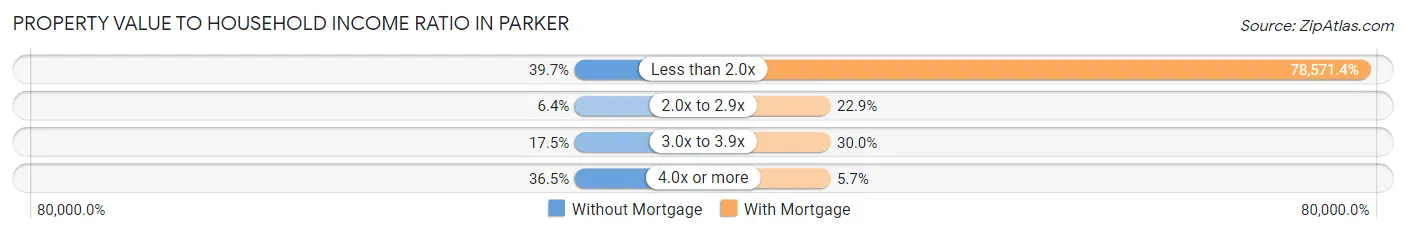
| Value-to-Income Ratio | Without Mortgage | With Mortgage |
| Less than 2.0x | 25 (39.7%) | 55,000 (78,571.4%) |
| 2.0x to 2.9x | 4 (6.4%) | 16 (22.9%) |
| 3.0x to 3.9x | 11 (17.5%) | 21 (30.0%) |
| 4.0x or more | 23 (36.5%) | 4 (5.7%) |
| Total | 63 (100.0%) | 70 (100.0%) |
Real Estate Taxes by Mortgage Status in Parker
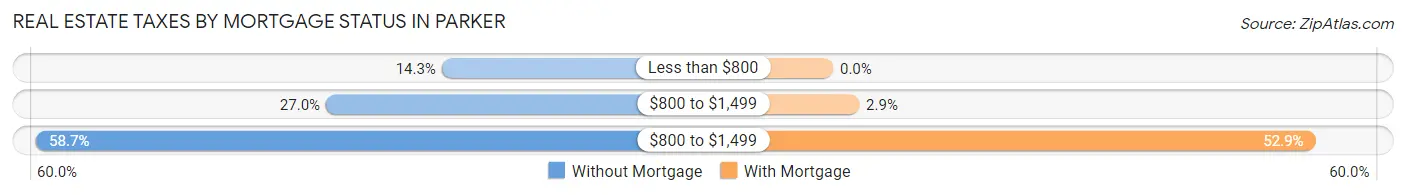
| Property Taxes | Without Mortgage | With Mortgage |
| Less than $800 | 9 (14.3%) | 0 (0.0%) |
| $800 to $1,499 | 17 (27.0%) | 2 (2.9%) |
| $800 to $1,499 | 37 (58.7%) | 37 (52.9%) |
| Total | 63 (100.0%) | 70 (100.0%) |
Health & Disability in Parker
Health Insurance Coverage by Age in Parker
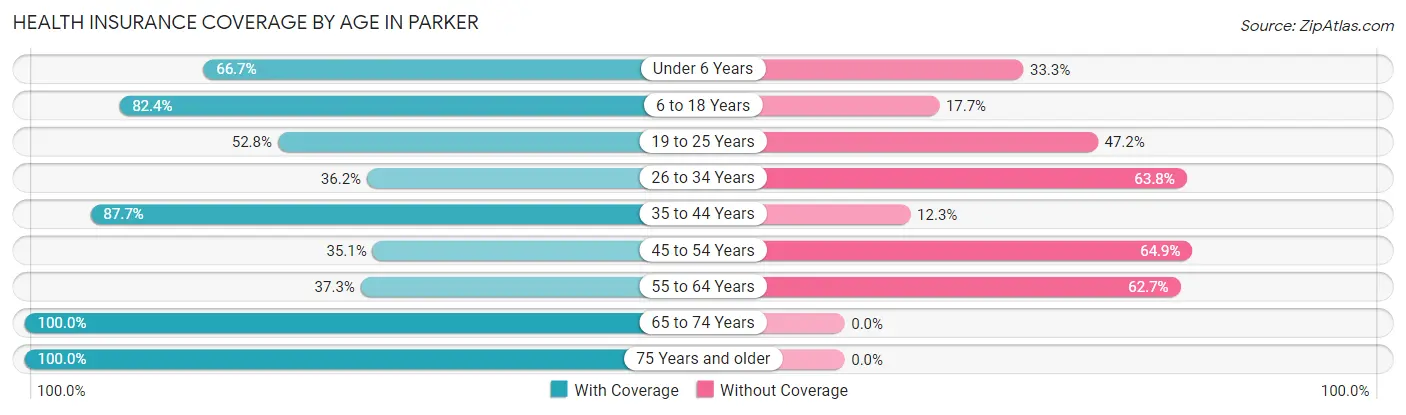
| Age Bracket | With Coverage | Without Coverage |
| Under 6 Years | 32 (66.7%) | 16 (33.3%) |
| 6 to 18 Years | 84 (82.4%) | 18 (17.6%) |
| 19 to 25 Years | 76 (52.8%) | 68 (47.2%) |
| 26 to 34 Years | 34 (36.2%) | 60 (63.8%) |
| 35 to 44 Years | 50 (87.7%) | 7 (12.3%) |
| 45 to 54 Years | 33 (35.1%) | 61 (64.9%) |
| 55 to 64 Years | 28 (37.3%) | 47 (62.7%) |
| 65 to 74 Years | 31 (100.0%) | 0 (0.0%) |
| 75 Years and older | 16 (100.0%) | 0 (0.0%) |
| Total | 384 (58.1%) | 277 (41.9%) |
Health Insurance Coverage by Citizenship Status in Parker
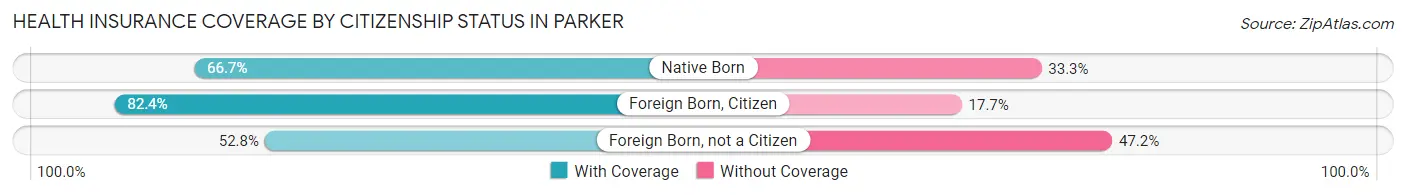
| Citizenship Status | With Coverage | Without Coverage |
| Native Born | 32 (66.7%) | 16 (33.3%) |
| Foreign Born, Citizen | 84 (82.4%) | 18 (17.6%) |
| Foreign Born, not a Citizen | 76 (52.8%) | 68 (47.2%) |
Health Insurance Coverage by Household Income in Parker
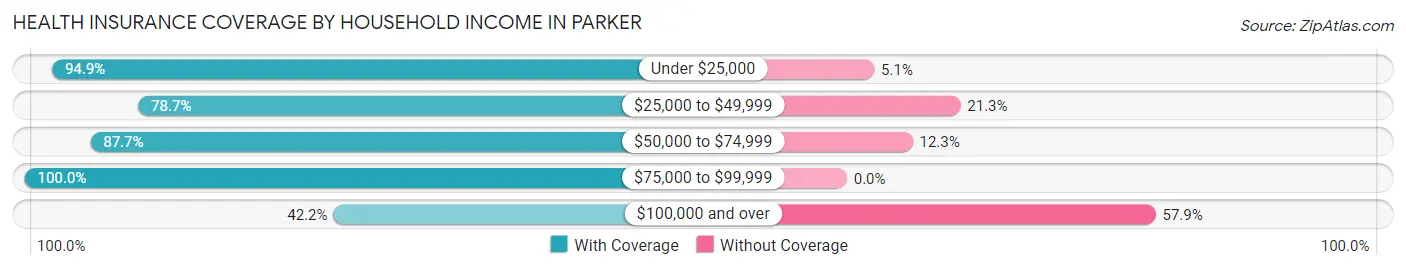
| Household Income | With Coverage | Without Coverage |
| Under $25,000 | 37 (94.9%) | 2 (5.1%) |
| $25,000 to $49,999 | 74 (78.7%) | 20 (21.3%) |
| $50,000 to $74,999 | 57 (87.7%) | 8 (12.3%) |
| $75,000 to $99,999 | 36 (100.0%) | 0 (0.0%) |
| $100,000 and over | 180 (42.1%) | 247 (57.9%) |
Public vs Private Health Insurance Coverage by Age in Parker
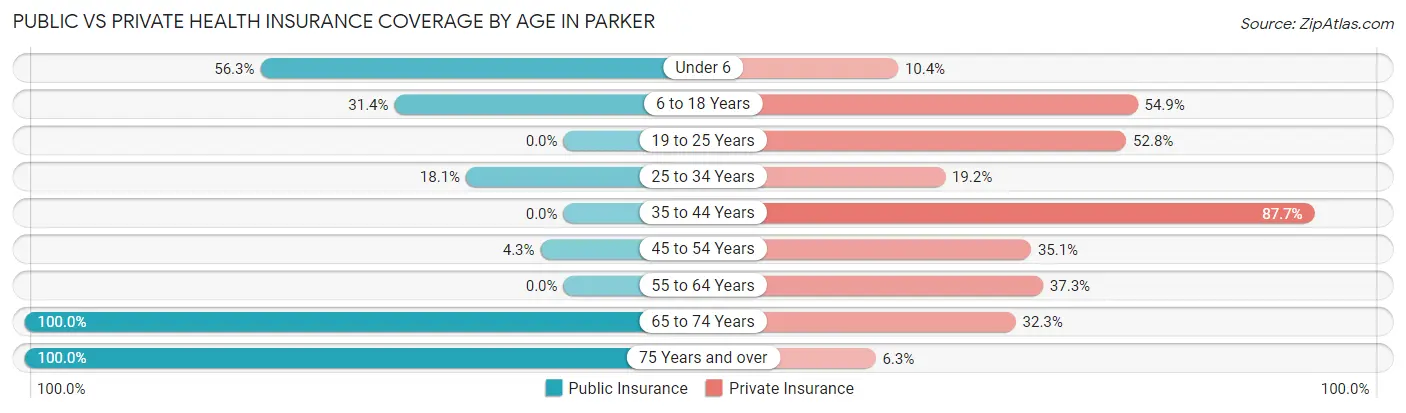
| Age Bracket | Public Insurance | Private Insurance |
| Under 6 | 27 (56.2%) | 5 (10.4%) |
| 6 to 18 Years | 32 (31.4%) | 56 (54.9%) |
| 19 to 25 Years | 0 (0.0%) | 76 (52.8%) |
| 25 to 34 Years | 17 (18.1%) | 18 (19.2%) |
| 35 to 44 Years | 0 (0.0%) | 50 (87.7%) |
| 45 to 54 Years | 4 (4.3%) | 33 (35.1%) |
| 55 to 64 Years | 0 (0.0%) | 28 (37.3%) |
| 65 to 74 Years | 31 (100.0%) | 10 (32.3%) |
| 75 Years and over | 16 (100.0%) | 1 (6.2%) |
| Total | 127 (19.2%) | 277 (41.9%) |
Disability Status by Sex by Age in Parker
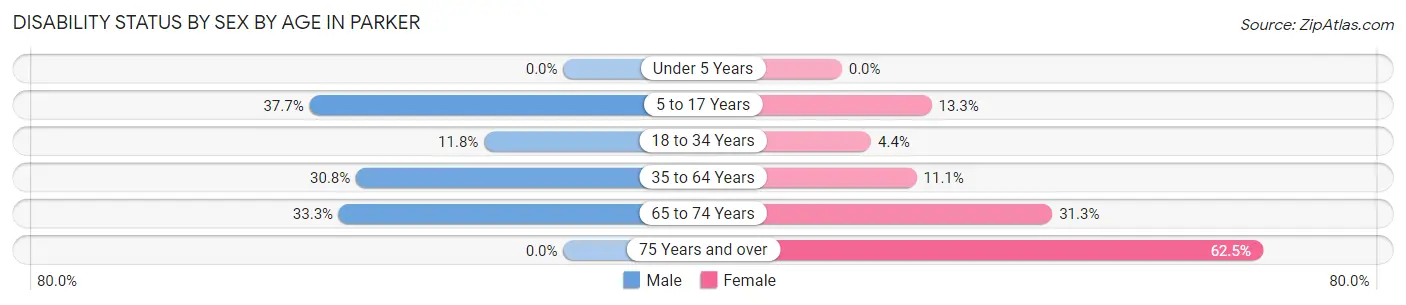
| Age Bracket | Male | Female |
| Under 5 Years | 0 (0.0%) | 0 (0.0%) |
| 5 to 17 Years | 23 (37.7%) | 4 (13.3%) |
| 18 to 34 Years | 16 (11.8%) | 5 (4.3%) |
| 35 to 64 Years | 28 (30.8%) | 15 (11.1%) |
| 65 to 74 Years | 5 (33.3%) | 5 (31.2%) |
| 75 Years and over | 0 (0.0%) | 5 (62.5%) |
Disability Class by Sex by Age in Parker
Disability Class: Hearing Difficulty
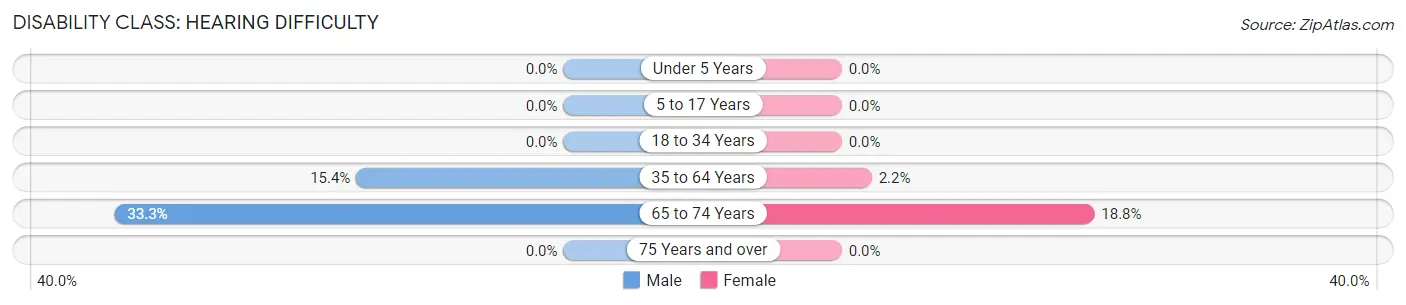
| Age Bracket | Male | Female |
| Under 5 Years | 0 (0.0%) | 0 (0.0%) |
| 5 to 17 Years | 0 (0.0%) | 0 (0.0%) |
| 18 to 34 Years | 0 (0.0%) | 0 (0.0%) |
| 35 to 64 Years | 14 (15.4%) | 3 (2.2%) |
| 65 to 74 Years | 5 (33.3%) | 3 (18.8%) |
| 75 Years and over | 0 (0.0%) | 0 (0.0%) |
Disability Class: Vision Difficulty
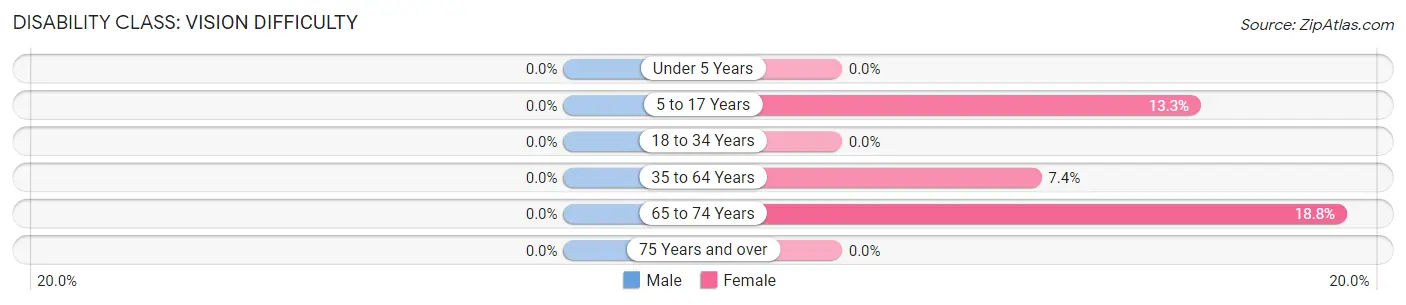
| Age Bracket | Male | Female |
| Under 5 Years | 0 (0.0%) | 0 (0.0%) |
| 5 to 17 Years | 0 (0.0%) | 4 (13.3%) |
| 18 to 34 Years | 0 (0.0%) | 0 (0.0%) |
| 35 to 64 Years | 0 (0.0%) | 10 (7.4%) |
| 65 to 74 Years | 0 (0.0%) | 3 (18.8%) |
| 75 Years and over | 0 (0.0%) | 0 (0.0%) |
Disability Class: Cognitive Difficulty
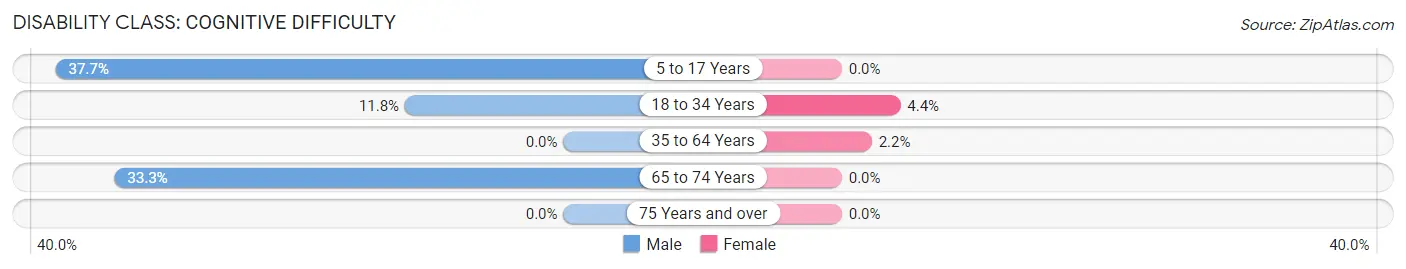
| Age Bracket | Male | Female |
| 5 to 17 Years | 23 (37.7%) | 0 (0.0%) |
| 18 to 34 Years | 16 (11.8%) | 5 (4.3%) |
| 35 to 64 Years | 0 (0.0%) | 3 (2.2%) |
| 65 to 74 Years | 5 (33.3%) | 0 (0.0%) |
| 75 Years and over | 0 (0.0%) | 0 (0.0%) |
Disability Class: Ambulatory Difficulty
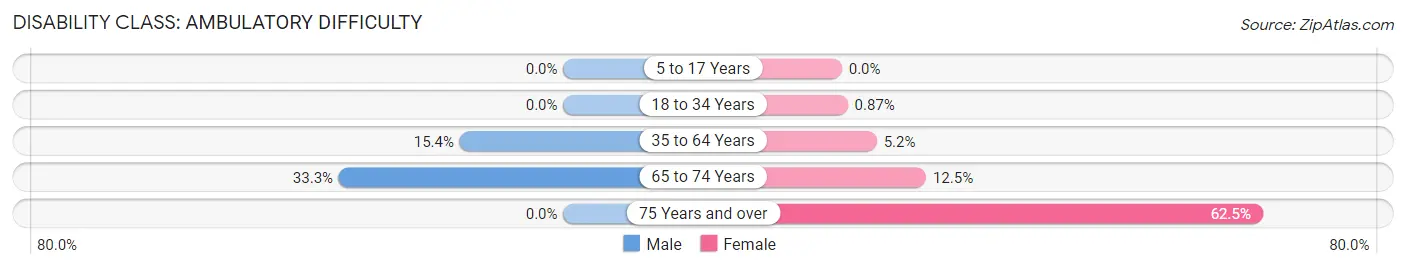
| Age Bracket | Male | Female |
| 5 to 17 Years | 0 (0.0%) | 0 (0.0%) |
| 18 to 34 Years | 0 (0.0%) | 1 (0.9%) |
| 35 to 64 Years | 14 (15.4%) | 7 (5.2%) |
| 65 to 74 Years | 5 (33.3%) | 2 (12.5%) |
| 75 Years and over | 0 (0.0%) | 5 (62.5%) |
Disability Class: Self-Care Difficulty
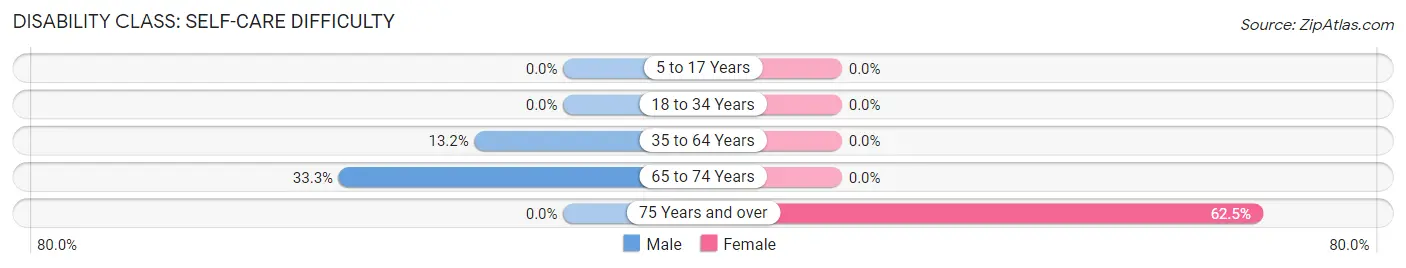
| Age Bracket | Male | Female |
| 5 to 17 Years | 0 (0.0%) | 0 (0.0%) |
| 18 to 34 Years | 0 (0.0%) | 0 (0.0%) |
| 35 to 64 Years | 12 (13.2%) | 0 (0.0%) |
| 65 to 74 Years | 5 (33.3%) | 0 (0.0%) |
| 75 Years and over | 0 (0.0%) | 5 (62.5%) |
Technology Access in Parker
Computing Device Access in Parker
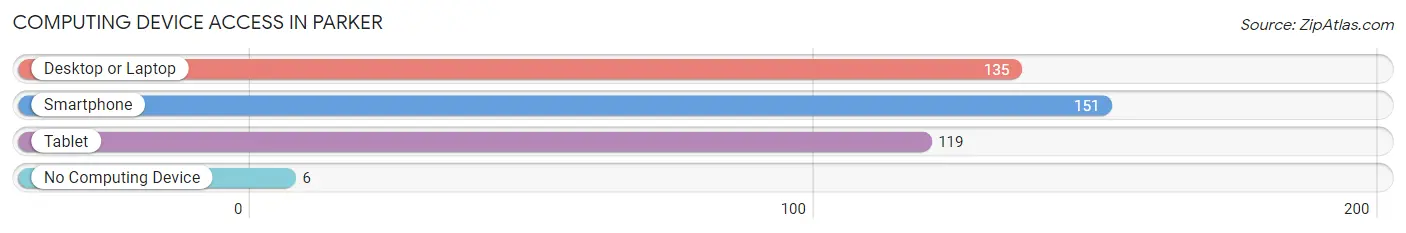
| Device Type | # Households | % Households |
| Desktop or Laptop | 135 | 83.3% |
| Smartphone | 151 | 93.2% |
| Tablet | 119 | 73.5% |
| No Computing Device | 6 | 3.7% |
| Total | 162 | 100.0% |
Internet Access in Parker
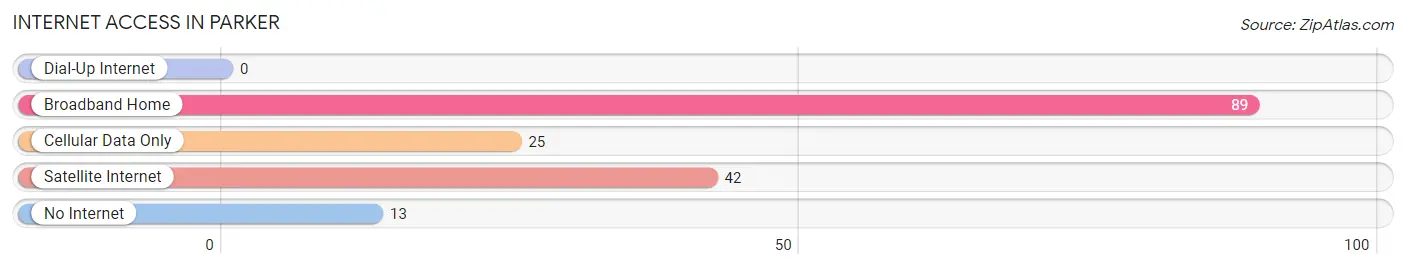
| Internet Type | # Households | % Households |
| Dial-Up Internet | 0 | 0.0% |
| Broadband Home | 89 | 54.9% |
| Cellular Data Only | 25 | 15.4% |
| Satellite Internet | 42 | 25.9% |
| No Internet | 13 | 8.0% |
| Total | 162 | 100.0% |
Parker Summary
Parker, Idaho is a small city located in the southeastern corner of the state, near the border of Utah. It is part of the larger region known as the Snake River Plain, which is a flat, arid region that stretches across the southern part of the state. The city is situated at an elevation of 4,890 feet and has a population of approximately 1,500 people.
The history of Parker, Idaho dates back to the late 1800s when the area was first settled by Mormon pioneers. The city was officially incorporated in 1907 and was named after the nearby Parker Creek. The city was originally a farming community, but in the early 1900s, the area began to develop into a small industrial center. The city was home to several factories, including a sugar beet processing plant, a woolen mill, and a flour mill.
The geography of Parker, Idaho is characterized by its flat terrain and arid climate. The city is located in the Snake River Plain, which is a large, flat region that stretches across the southern part of the state. The city is situated at an elevation of 4,890 feet and is surrounded by mountains and hills. The climate in the area is semi-arid, with hot summers and cold winters.
The economy of Parker, Idaho is largely based on agriculture and manufacturing. The city is home to several factories, including a sugar beet processing plant, a woolen mill, and a flour mill. The city also has a number of small businesses, including restaurants, retail stores, and service providers. The city is also home to a number of agricultural operations, including cattle ranches, dairy farms, and fruit orchards.
The demographics of Parker, Idaho are largely made up of white, non-Hispanic residents. The city has a population of approximately 1,500 people, with a median age of 37. The median household income in the city is $41,000, and the median home value is $150,000. The city is also home to a number of Native American tribes, including the Shoshone-Bannock, the Nez Perce, and the Coeur d'Alene.
Parker, Idaho is a small city with a rich history and a diverse economy. The city is home to a number of factories, small businesses, and agricultural operations, and is surrounded by mountains and hills. The city has a population of approximately 1,500 people, with a median age of 37 and a median household income of $41,000. The city is also home to a number of Native American tribes, including the Shoshone-Bannock, the Nez Perce, and the Coeur d'Alene.
Common Questions
What is Per Capita Income in Parker?
Per Capita income in Parker is $26,262.
What is the Median Family Income in Parker?
Median Family Income in Parker is $83,698.
What is the Median Household income in Parker?
Median Household Income in Parker is $72,000.
What is Income or Wage Gap in Parker?
Income or Wage Gap in Parker is 50.8%.
Women in Parker earn 49.2 cents for every dollar earned by a man.
What is Inequality or Gini Index in Parker?
Inequality or Gini Index in Parker is 0.36.
What is the Total Population of Parker?
Total Population of Parker is 661.
What is the Total Male Population of Parker?
Total Male Population of Parker is 329.
What is the Total Female Population of Parker?
Total Female Population of Parker is 332.
What is the Ratio of Males per 100 Females in Parker?
There are 99.10 Males per 100 Females in Parker.
What is the Ratio of Females per 100 Males in Parker?
There are 100.91 Females per 100 Males in Parker.
What is the Median Population Age in Parker?
Median Population Age in Parker is 31.7 Years.
What is the Average Family Size in Parker
Average Family Size in Parker is 3.9 People.
What is the Average Household Size in Parker
Average Household Size in Parker is 4.1 People.
How Large is the Labor Force in Parker?
There are 326 People in the Labor Forcein in Parker.
What is the Percentage of People in the Labor Force in Parker?
61.2% of People are in the Labor Force in Parker.
What is the Unemployment Rate in Parker?
Unemployment Rate in Parker is 10.7%.