Grangeville, ID Map & Demographics
Grangeville Map
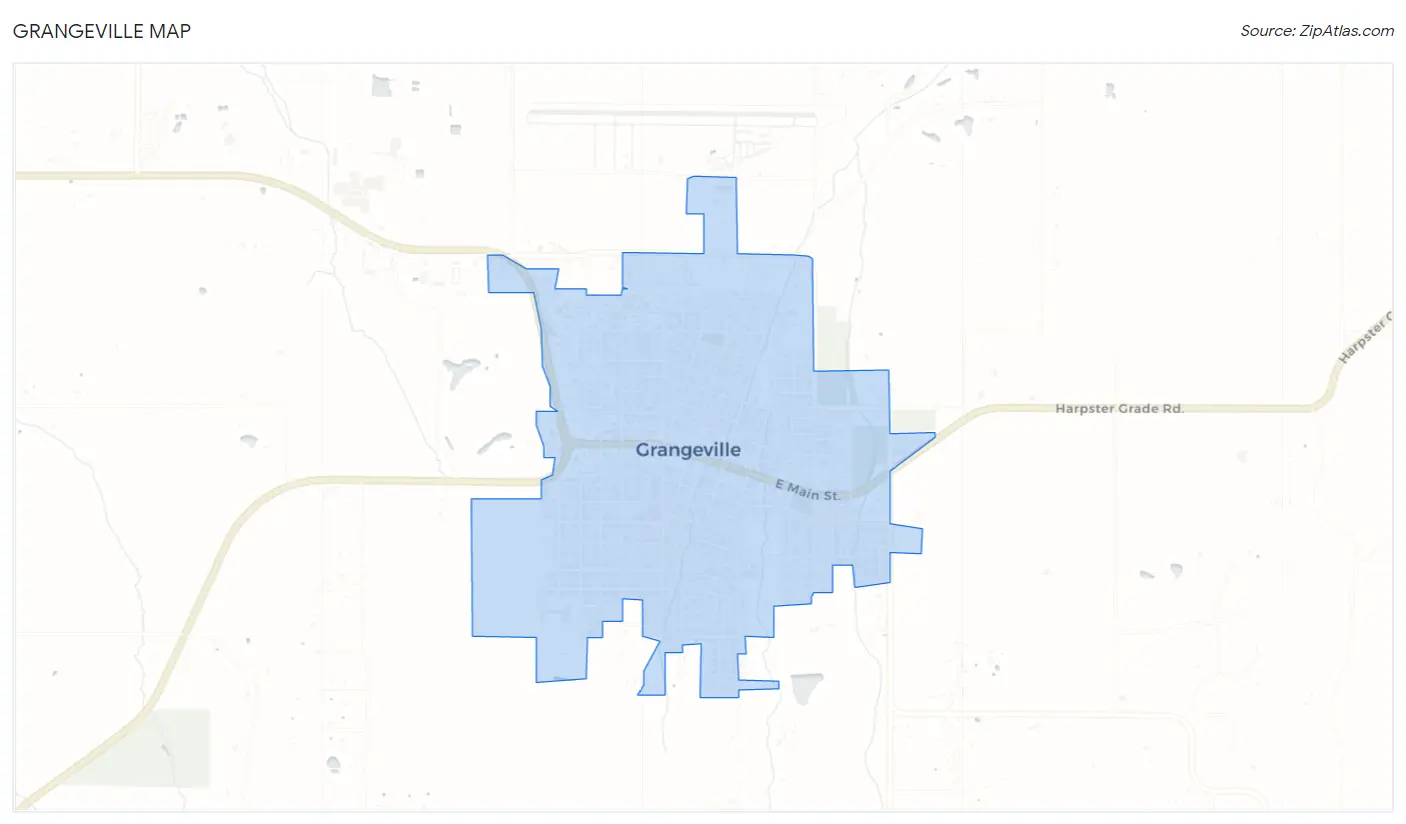
Grangeville Overview
$27,730
PER CAPITA INCOME
$56,766
AVG FAMILY INCOME
$47,572
AVG HOUSEHOLD INCOME
0.41
INEQUALITY / GINI INDEX
3,369
TOTAL POPULATION
1,629
MALE POPULATION
1,740
FEMALE POPULATION
93.62
MALES / 100 FEMALES
106.81
FEMALES / 100 MALES
46.3
MEDIAN AGE
2.7
AVG FAMILY SIZE
2.2
AVG HOUSEHOLD SIZE
1,762
LABOR FORCE [ PEOPLE ]
66.2%
PERCENT IN LABOR FORCE
3.5%
UNEMPLOYMENT RATE
Grangeville Zip Codes
Grangeville Area Codes
Income in Grangeville
Income Overview in Grangeville
Per Capita Income in Grangeville is $27,730, while median incomes of families and households are $56,766 and $47,572 respectively.
| Characteristic | Number | Measure |
| Per Capita Income | 3,369 | $27,730 |
| Median Family Income | 1,001 | $56,766 |
| Mean Family Income | 1,001 | $70,854 |
| Median Household Income | 1,465 | $47,572 |
| Mean Household Income | 1,465 | $61,659 |
| Income Deficit | 1,001 | $0 |
| Wage / Income Gap (%) | 3,369 | 0.00% |
| Wage / Income Gap ($) | 3,369 | 100.00¢ per $1 |
| Gini / Inequality Index | 3,369 | 0.41 |
Earnings by Sex in Grangeville
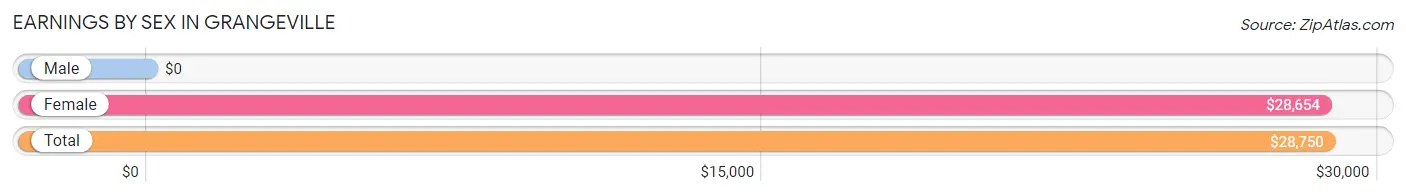
| Sex | Number | Average Earnings |
| Male | 855 (47.4%) | $0 |
| Female | 950 (52.6%) | $28,654 |
| Total | 1,805 (100.0%) | $28,750 |
Earnings by Sex by Income Bracket in Grangeville
The most common earnings brackets in Grangeville are $12,500 to $14,999 for men (203 | 23.7%) and $15,000 to $17,499 for women (126 | 13.3%).
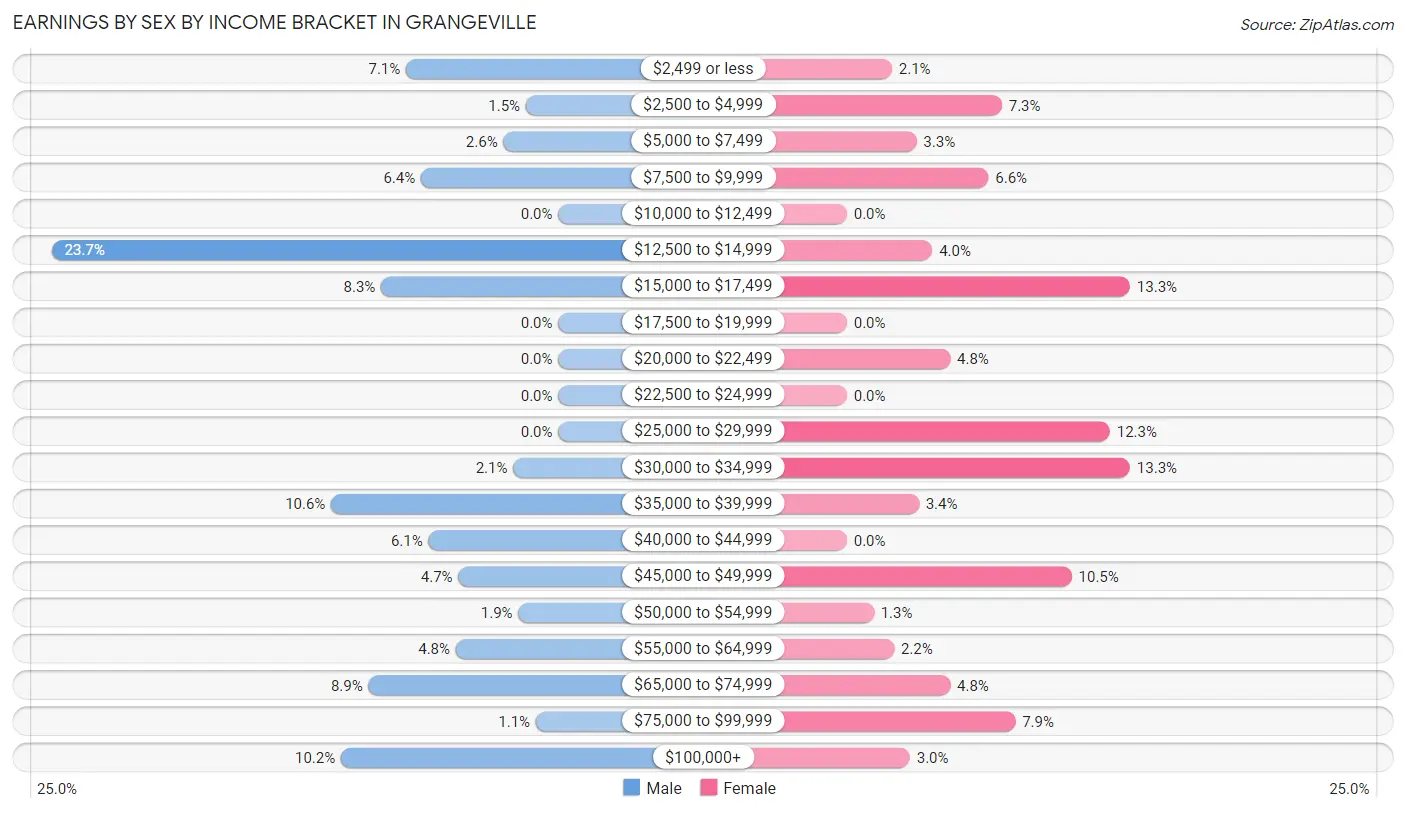
| Income | Male | Female |
| $2,499 or less | 61 (7.1%) | 20 (2.1%) |
| $2,500 to $4,999 | 13 (1.5%) | 69 (7.3%) |
| $5,000 to $7,499 | 22 (2.6%) | 31 (3.3%) |
| $7,500 to $9,999 | 55 (6.4%) | 63 (6.6%) |
| $10,000 to $12,499 | 0 (0.0%) | 0 (0.0%) |
| $12,500 to $14,999 | 203 (23.7%) | 38 (4.0%) |
| $15,000 to $17,499 | 71 (8.3%) | 126 (13.3%) |
| $17,500 to $19,999 | 0 (0.0%) | 0 (0.0%) |
| $20,000 to $22,499 | 0 (0.0%) | 46 (4.8%) |
| $22,500 to $24,999 | 0 (0.0%) | 0 (0.0%) |
| $25,000 to $29,999 | 0 (0.0%) | 117 (12.3%) |
| $30,000 to $34,999 | 18 (2.1%) | 126 (13.3%) |
| $35,000 to $39,999 | 91 (10.6%) | 32 (3.4%) |
| $40,000 to $44,999 | 52 (6.1%) | 0 (0.0%) |
| $45,000 to $49,999 | 40 (4.7%) | 100 (10.5%) |
| $50,000 to $54,999 | 16 (1.9%) | 12 (1.3%) |
| $55,000 to $64,999 | 41 (4.8%) | 21 (2.2%) |
| $65,000 to $74,999 | 76 (8.9%) | 46 (4.8%) |
| $75,000 to $99,999 | 9 (1.1%) | 75 (7.9%) |
| $100,000+ | 87 (10.2%) | 28 (2.9%) |
| Total | 855 (100.0%) | 950 (100.0%) |
Earnings by Sex by Educational Attainment in Grangeville
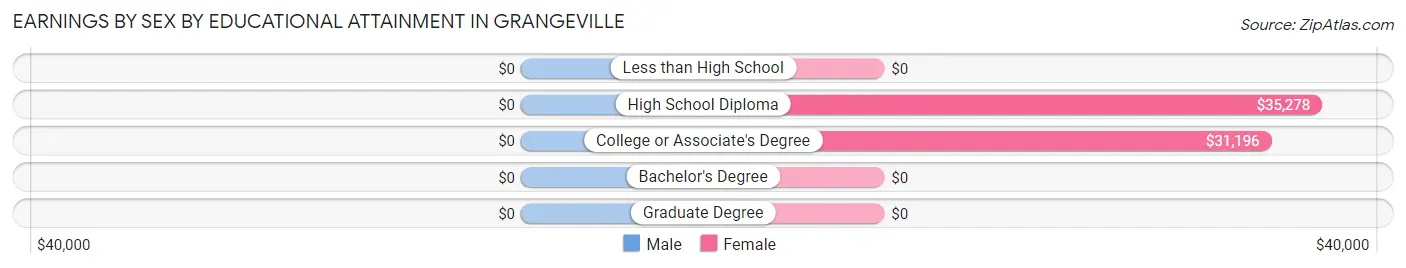
| Educational Attainment | Male Income | Female Income |
| Less than High School | - | - |
| High School Diploma | - | - |
| College or Associate's Degree | - | - |
| Bachelor's Degree | - | - |
| Graduate Degree | - | - |
| Total | $38,777 | $31,125 |
Family Income in Grangeville
Family Income Brackets in Grangeville
According to the Grangeville family income data, there are 242 families falling into the $35,000 to $49,999 income range, which is the most common income bracket and makes up 24.2% of all families.
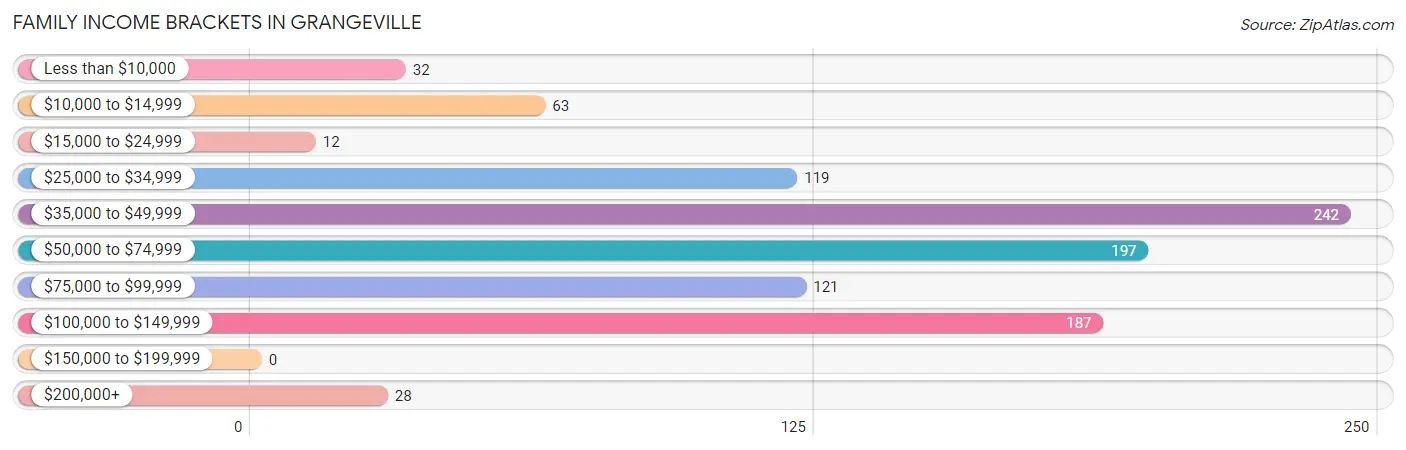
| Income Bracket | # Families | % Families |
| Less than $10,000 | 32 | 3.2% |
| $10,000 to $14,999 | 63 | 6.3% |
| $15,000 to $24,999 | 12 | 1.2% |
| $25,000 to $34,999 | 119 | 11.9% |
| $35,000 to $49,999 | 242 | 24.2% |
| $50,000 to $74,999 | 197 | 19.7% |
| $75,000 to $99,999 | 121 | 12.1% |
| $100,000 to $149,999 | 187 | 18.7% |
| $150,000 to $199,999 | 0 | 0.0% |
| $200,000+ | 28 | 2.8% |
Family Income by Famaliy Size in Grangeville
2-person families (592 | 59.1%) account for the highest median family income in Grangeville with $61,492 per family, while 2-person families (592 | 59.1%) have the highest median income of $30,746 per family member.
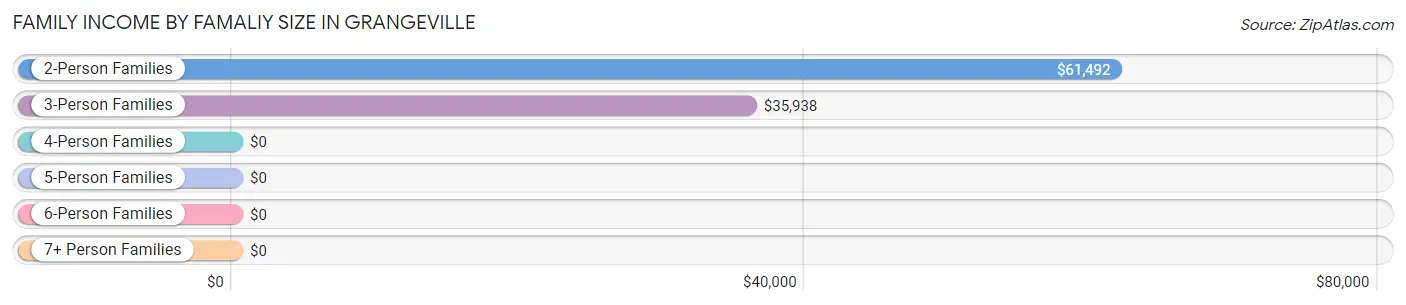
| Income Bracket | # Families | Median Income |
| 2-Person Families | 592 (59.1%) | $61,492 |
| 3-Person Families | 159 (15.9%) | $35,938 |
| 4-Person Families | 108 (10.8%) | $0 |
| 5-Person Families | 142 (14.2%) | $0 |
| 6-Person Families | 0 (0.0%) | $0 |
| 7+ Person Families | 0 (0.0%) | $0 |
| Total | 1,001 (100.0%) | $56,766 |
Family Income by Number of Earners in Grangeville
The median family income in Grangeville is $56,766, with families comprising 3+ earners (39) having the highest median family income of $104,306, while families with 1 earner (433) have the lowest median family income of $48,721, accounting for 3.9% and 43.3% of families, respectively.
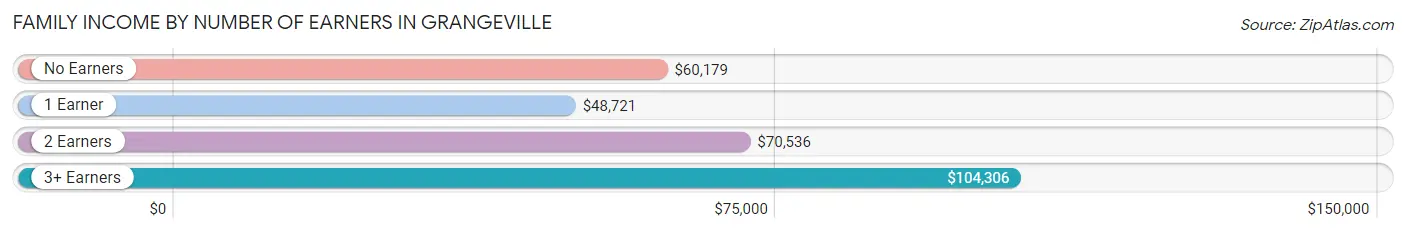
| Number of Earners | # Families | Median Income |
| No Earners | 93 (9.3%) | $60,179 |
| 1 Earner | 433 (43.3%) | $48,721 |
| 2 Earners | 436 (43.6%) | $70,536 |
| 3+ Earners | 39 (3.9%) | $104,306 |
| Total | 1,001 (100.0%) | $56,766 |
Household Income in Grangeville
Household Income Brackets in Grangeville
With 311 households falling in the category, the $35,000 to $49,999 income range is the most frequent in Grangeville, accounting for 21.2% of all households.
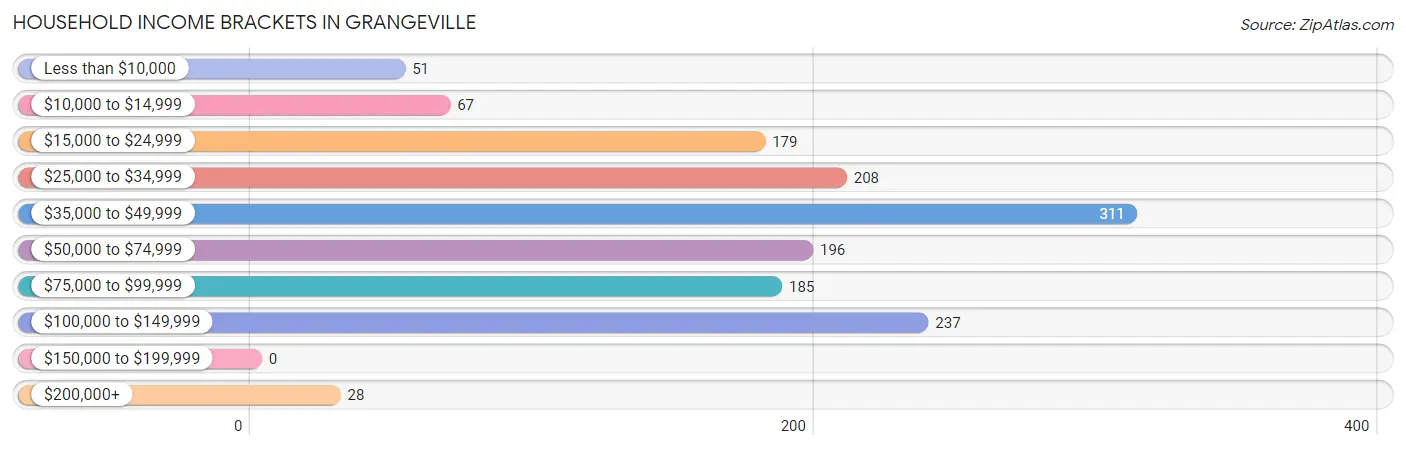
| Income Bracket | # Households | % Households |
| Less than $10,000 | 51 | 3.5% |
| $10,000 to $14,999 | 67 | 4.6% |
| $15,000 to $24,999 | 179 | 12.2% |
| $25,000 to $34,999 | 208 | 14.2% |
| $35,000 to $49,999 | 311 | 21.2% |
| $50,000 to $74,999 | 196 | 13.4% |
| $75,000 to $99,999 | 185 | 12.6% |
| $100,000 to $149,999 | 237 | 16.2% |
| $150,000 to $199,999 | 0 | 0.0% |
| $200,000+ | 28 | 1.9% |
Household Income by Householder Age in Grangeville
The median household income in Grangeville is $47,572, with the highest median household income of $71,143 found in the 45 to 64 years age bracket for the primary householder. A total of 542 households (37.0%) fall into this category. Meanwhile, the 15 to 24 years age bracket for the primary householder has the lowest median household income of $0, with 76 households (5.2%) in this group.
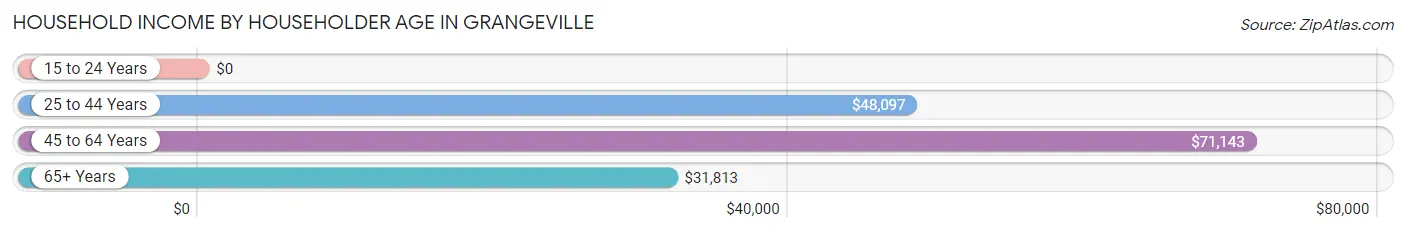
| Income Bracket | # Households | Median Income |
| 15 to 24 Years | 76 (5.2%) | $0 |
| 25 to 44 Years | 350 (23.9%) | $48,097 |
| 45 to 64 Years | 542 (37.0%) | $71,143 |
| 65+ Years | 497 (33.9%) | $31,813 |
| Total | 1,465 (100.0%) | $47,572 |
Poverty in Grangeville
Income Below Poverty by Sex and Age in Grangeville
With 11.6% poverty level for males and 8.6% for females among the residents of Grangeville, 25 to 34 year old males and 25 to 34 year old females are the most vulnerable to poverty, with 57 males (62.0%) and 44 females (29.7%) in their respective age groups living below the poverty level.
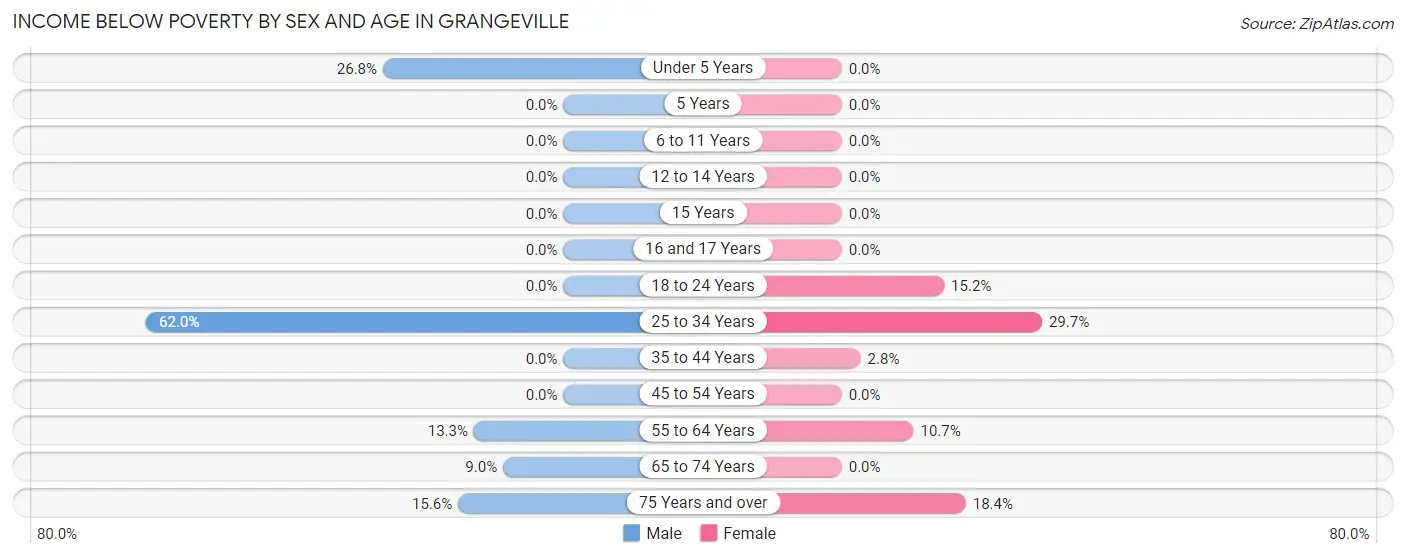
| Age Bracket | Male | Female |
| Under 5 Years | 52 (26.8%) | 0 (0.0%) |
| 5 Years | 0 (0.0%) | 0 (0.0%) |
| 6 to 11 Years | 0 (0.0%) | 0 (0.0%) |
| 12 to 14 Years | 0 (0.0%) | 0 (0.0%) |
| 15 Years | 0 (0.0%) | 0 (0.0%) |
| 16 and 17 Years | 0 (0.0%) | 0 (0.0%) |
| 18 to 24 Years | 0 (0.0%) | 19 (15.2%) |
| 25 to 34 Years | 57 (62.0%) | 44 (29.7%) |
| 35 to 44 Years | 0 (0.0%) | 6 (2.8%) |
| 45 to 54 Years | 0 (0.0%) | 0 (0.0%) |
| 55 to 64 Years | 29 (13.3%) | 39 (10.7%) |
| 65 to 74 Years | 19 (9.0%) | 0 (0.0%) |
| 75 Years and over | 28 (15.6%) | 37 (18.4%) |
| Total | 185 (11.6%) | 145 (8.6%) |
Income Above Poverty by Sex and Age in Grangeville
According to the poverty statistics in Grangeville, males aged 6 to 11 years and females aged under 5 years are the age groups that are most secure financially, with 100.0% of males and 100.0% of females in these age groups living above the poverty line.
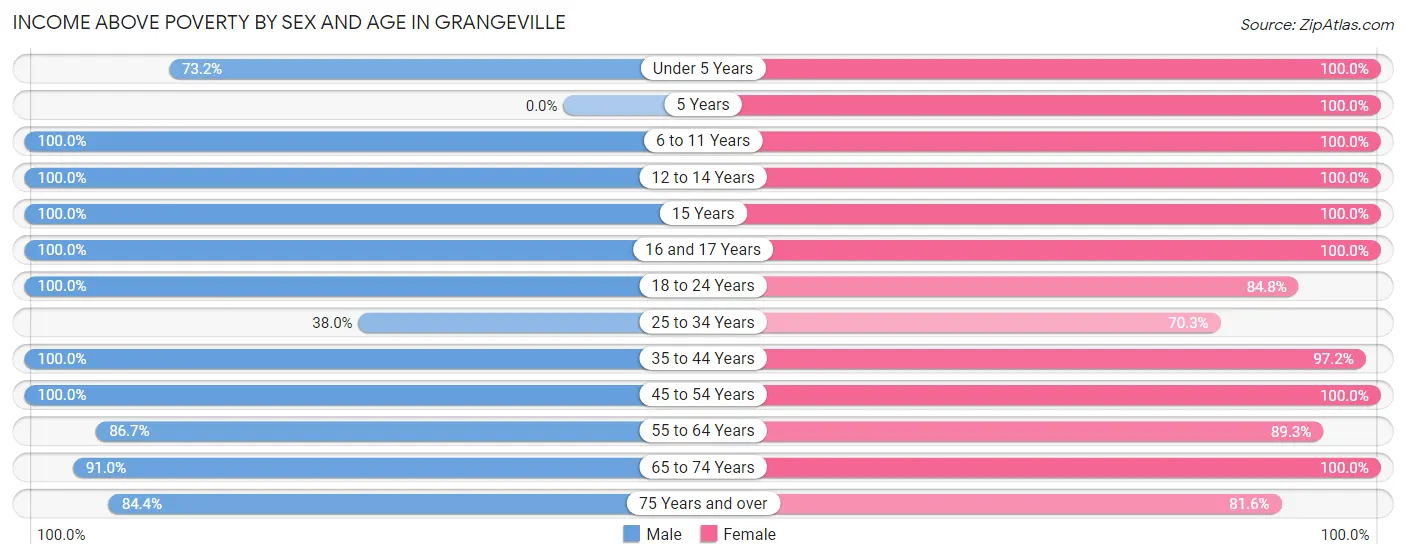
| Age Bracket | Male | Female |
| Under 5 Years | 142 (73.2%) | 27 (100.0%) |
| 5 Years | 0 (0.0%) | 77 (100.0%) |
| 6 to 11 Years | 84 (100.0%) | 88 (100.0%) |
| 12 to 14 Years | 39 (100.0%) | 101 (100.0%) |
| 15 Years | 42 (100.0%) | 55 (100.0%) |
| 16 and 17 Years | 26 (100.0%) | 8 (100.0%) |
| 18 to 24 Years | 177 (100.0%) | 106 (84.8%) |
| 25 to 34 Years | 35 (38.0%) | 104 (70.3%) |
| 35 to 44 Years | 115 (100.0%) | 208 (97.2%) |
| 45 to 54 Years | 223 (100.0%) | 150 (100.0%) |
| 55 to 64 Years | 189 (86.7%) | 327 (89.3%) |
| 65 to 74 Years | 193 (91.0%) | 132 (100.0%) |
| 75 Years and over | 151 (84.4%) | 164 (81.6%) |
| Total | 1,416 (88.4%) | 1,547 (91.4%) |
Income Below Poverty Among Married-Couple Families in Grangeville
The poverty statistics for married-couple families in Grangeville show that 9.2% or 76 of the total 828 families live below the poverty line. Families with 1 or 2 children have the highest poverty rate of 23.4%, comprising of 44 families. On the other hand, families with 3 or 4 children have the lowest poverty rate of 0.0%, which includes 0 families.
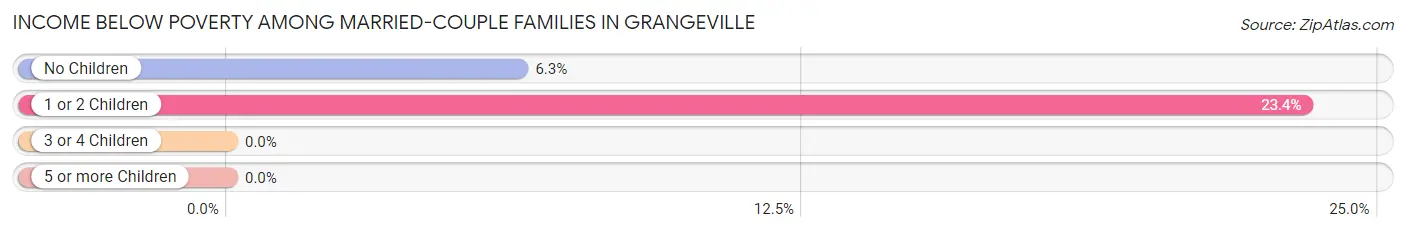
| Children | Above Poverty | Below Poverty |
| No Children | 474 (93.7%) | 32 (6.3%) |
| 1 or 2 Children | 144 (76.6%) | 44 (23.4%) |
| 3 or 4 Children | 134 (100.0%) | 0 (0.0%) |
| 5 or more Children | 0 (0.0%) | 0 (0.0%) |
| Total | 752 (90.8%) | 76 (9.2%) |
Income Below Poverty Among Single-Parent Households in Grangeville
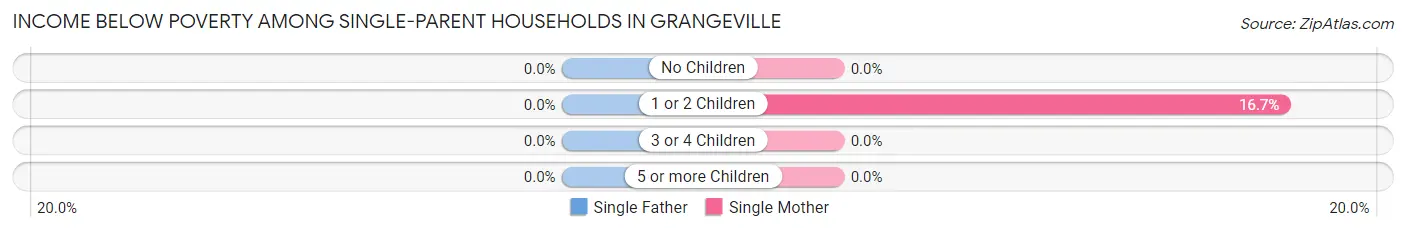
| Children | Single Father | Single Mother |
| No Children | 0 (0.0%) | 0 (0.0%) |
| 1 or 2 Children | 0 (0.0%) | 19 (16.7%) |
| 3 or 4 Children | 0 (0.0%) | 0 (0.0%) |
| 5 or more Children | 0 (0.0%) | 0 (0.0%) |
| Total | 0 (0.0%) | 19 (15.0%) |
Income Below Poverty Among Married-Couple vs Single-Parent Households in Grangeville
The poverty data for Grangeville shows that 76 of the married-couple family households (9.2%) and 19 of the single-parent households (11.0%) are living below the poverty level. Within the married-couple family households, those with 1 or 2 children have the highest poverty rate, with 44 households (23.4%) falling below the poverty line. Among the single-parent households, those with 1 or 2 children have the highest poverty rate, with 19 household (16.7%) living below poverty.
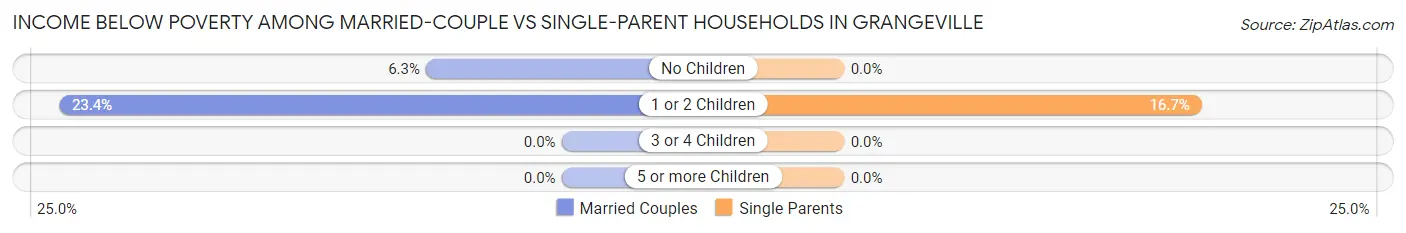
| Children | Married-Couple Families | Single-Parent Households |
| No Children | 32 (6.3%) | 0 (0.0%) |
| 1 or 2 Children | 44 (23.4%) | 19 (16.7%) |
| 3 or 4 Children | 0 (0.0%) | 0 (0.0%) |
| 5 or more Children | 0 (0.0%) | 0 (0.0%) |
| Total | 76 (9.2%) | 19 (11.0%) |
Race in Grangeville
The most populous races in Grangeville are White / Caucasian (2,939 | 87.2%), Hispanic or Latino (335 | 9.9%), and Native / Alaskan (247 | 7.3%).
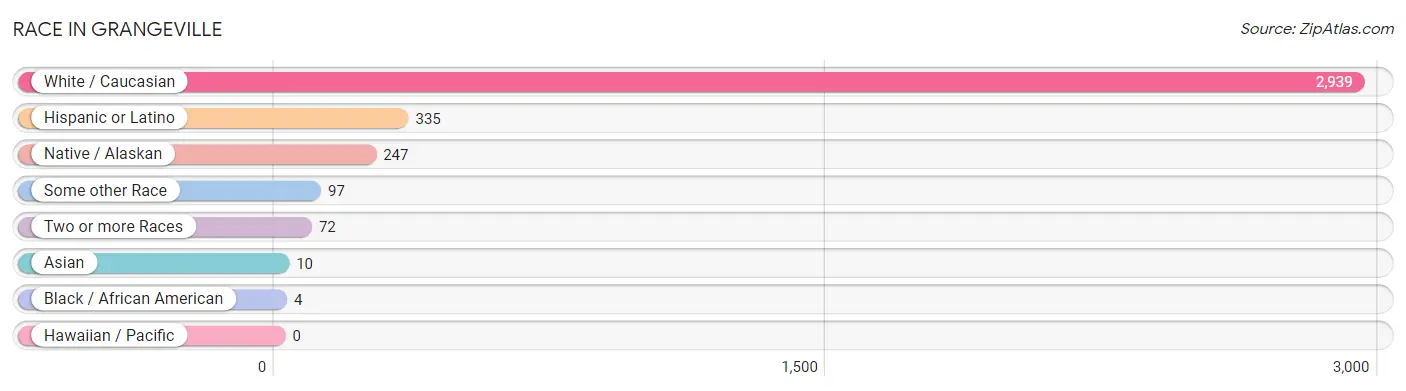
| Race | # Population | % Population |
| Asian | 10 | 0.3% |
| Black / African American | 4 | 0.1% |
| Hawaiian / Pacific | 0 | 0.0% |
| Hispanic or Latino | 335 | 9.9% |
| Native / Alaskan | 247 | 7.3% |
| White / Caucasian | 2,939 | 87.2% |
| Two or more Races | 72 | 2.1% |
| Some other Race | 97 | 2.9% |
| Total | 3,369 | 100.0% |
Ancestry in Grangeville
The most populous ancestries reported in Grangeville are German (719 | 21.3%), American (503 | 14.9%), Irish (503 | 14.9%), English (381 | 11.3%), and Mexican (218 | 6.5%), together accounting for 69.0% of all Grangeville residents.
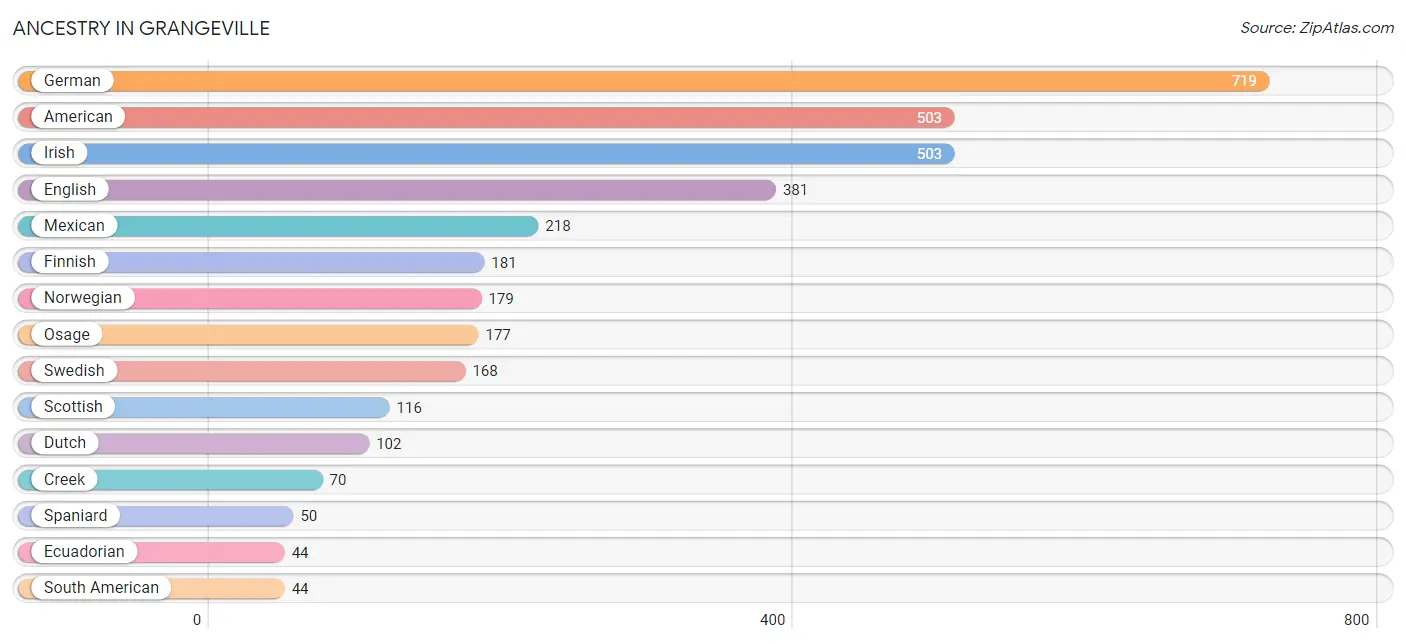
| Ancestry | # Population | % Population |
| American | 503 | 14.9% |
| Cherokee | 21 | 0.6% |
| Creek | 70 | 2.1% |
| Danish | 9 | 0.3% |
| Dutch | 102 | 3.0% |
| Ecuadorian | 44 | 1.3% |
| English | 381 | 11.3% |
| European | 21 | 0.6% |
| Finnish | 181 | 5.4% |
| French | 36 | 1.1% |
| French Canadian | 25 | 0.7% |
| German | 719 | 21.3% |
| Greek | 36 | 1.1% |
| Irish | 503 | 14.9% |
| Italian | 27 | 0.8% |
| Korean | 10 | 0.3% |
| Latvian | 13 | 0.4% |
| Mexican | 218 | 6.5% |
| Northern European | 19 | 0.6% |
| Norwegian | 179 | 5.3% |
| Osage | 177 | 5.2% |
| Polish | 16 | 0.5% |
| Scandinavian | 21 | 0.6% |
| Scotch-Irish | 30 | 0.9% |
| Scottish | 116 | 3.4% |
| South American | 44 | 1.3% |
| Spaniard | 50 | 1.5% |
| Swedish | 168 | 5.0% |
| Swiss | 8 | 0.2% |
| Thai | 13 | 0.4% | View All 30 Rows |
Immigrants in Grangeville
The most numerous immigrant groups reported in Grangeville came from Ecuador (44 | 1.3%), Latin America (44 | 1.3%), South America (44 | 1.3%), Asia (23 | 0.7%), and Eastern Asia (13 | 0.4%), together accounting for 5.0% of all Grangeville residents.
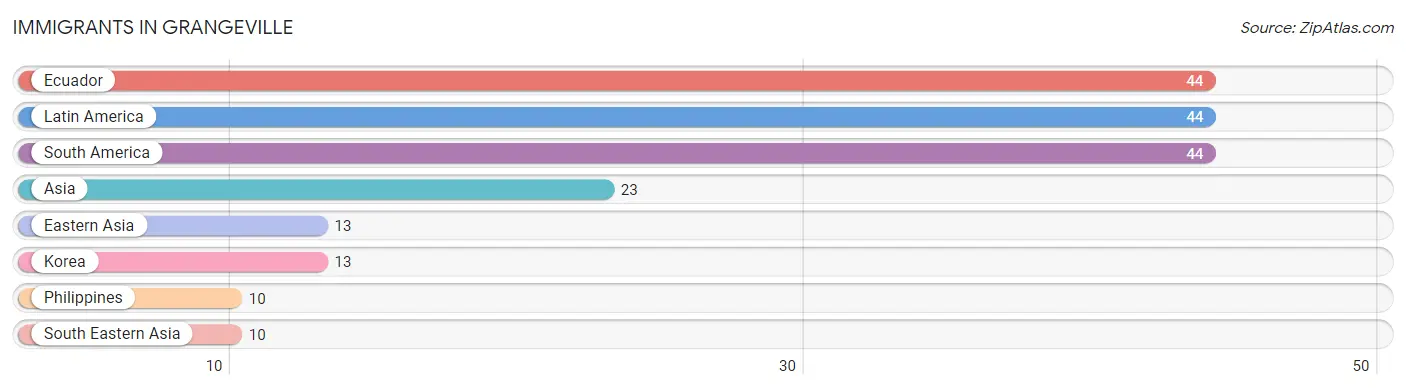
| Immigration Origin | # Population | % Population |
| Asia | 23 | 0.7% |
| Eastern Asia | 13 | 0.4% |
| Ecuador | 44 | 1.3% |
| Korea | 13 | 0.4% |
| Latin America | 44 | 1.3% |
| Philippines | 10 | 0.3% |
| South America | 44 | 1.3% |
| South Eastern Asia | 10 | 0.3% | View All 8 Rows |
Sex and Age in Grangeville
Sex and Age in Grangeville
The most populous age groups in Grangeville are Under 5 Years (194 | 11.9%) for men and 60 to 64 Years (193 | 11.1%) for women.
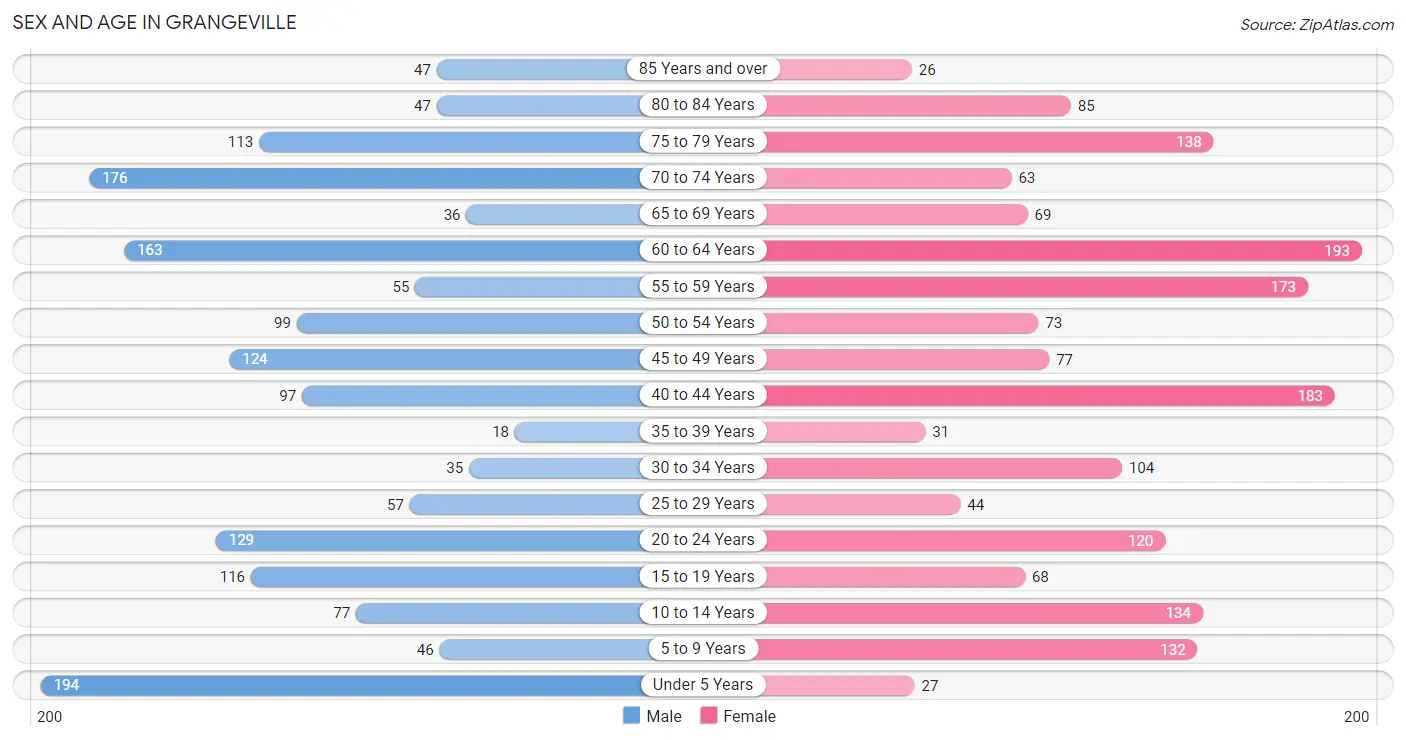
| Age Bracket | Male | Female |
| Under 5 Years | 194 (11.9%) | 27 (1.5%) |
| 5 to 9 Years | 46 (2.8%) | 132 (7.6%) |
| 10 to 14 Years | 77 (4.7%) | 134 (7.7%) |
| 15 to 19 Years | 116 (7.1%) | 68 (3.9%) |
| 20 to 24 Years | 129 (7.9%) | 120 (6.9%) |
| 25 to 29 Years | 57 (3.5%) | 44 (2.5%) |
| 30 to 34 Years | 35 (2.1%) | 104 (6.0%) |
| 35 to 39 Years | 18 (1.1%) | 31 (1.8%) |
| 40 to 44 Years | 97 (5.9%) | 183 (10.5%) |
| 45 to 49 Years | 124 (7.6%) | 77 (4.4%) |
| 50 to 54 Years | 99 (6.1%) | 73 (4.2%) |
| 55 to 59 Years | 55 (3.4%) | 173 (9.9%) |
| 60 to 64 Years | 163 (10.0%) | 193 (11.1%) |
| 65 to 69 Years | 36 (2.2%) | 69 (4.0%) |
| 70 to 74 Years | 176 (10.8%) | 63 (3.6%) |
| 75 to 79 Years | 113 (6.9%) | 138 (7.9%) |
| 80 to 84 Years | 47 (2.9%) | 85 (4.9%) |
| 85 Years and over | 47 (2.9%) | 26 (1.5%) |
| Total | 1,629 (100.0%) | 1,740 (100.0%) |
Families and Households in Grangeville
Median Family Size in Grangeville
The median family size in Grangeville is 2.73 persons per family, with single male/father families (46 | 4.6%) accounting for the largest median family size of 3.24 persons per family. On the other hand, single female/mother families (127 | 12.7%) represent the smallest median family size with 2.36 persons per family.
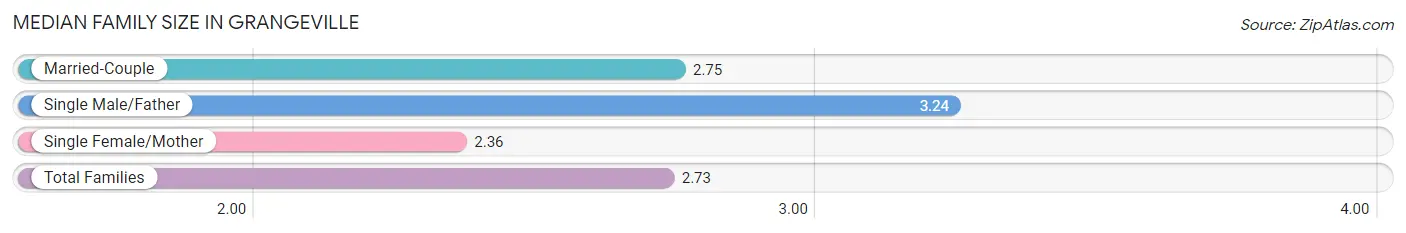
| Family Type | # Families | Family Size |
| Married-Couple | 828 (82.7%) | 2.75 |
| Single Male/Father | 46 (4.6%) | 3.24 |
| Single Female/Mother | 127 (12.7%) | 2.36 |
| Total Families | 1,001 (100.0%) | 2.73 |
Median Household Size in Grangeville
The median household size in Grangeville is 2.24 persons per household, with single male/father households (46 | 3.1%) accounting for the largest median household size of 3.24 persons per household. non-family households (464 | 31.7%) represent the smallest median household size with 1.14 persons per household.
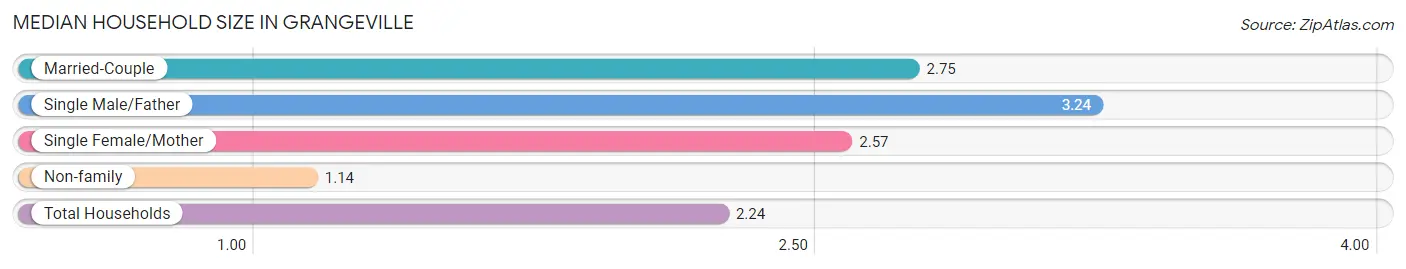
| Household Type | # Households | Household Size |
| Married-Couple | 828 (56.5%) | 2.75 |
| Single Male/Father | 46 (3.1%) | 3.24 |
| Single Female/Mother | 127 (8.7%) | 2.57 |
| Non-family | 464 (31.7%) | 1.14 |
| Total Households | 1,465 (100.0%) | 2.24 |
Household Size by Marriage Status in Grangeville
Out of a total of 1,465 households in Grangeville, 1,001 (68.3%) are family households, while 464 (31.7%) are nonfamily households. The most numerous type of family households are 2-person households, comprising 592, and the most common type of nonfamily households are 1-person households, comprising 396.
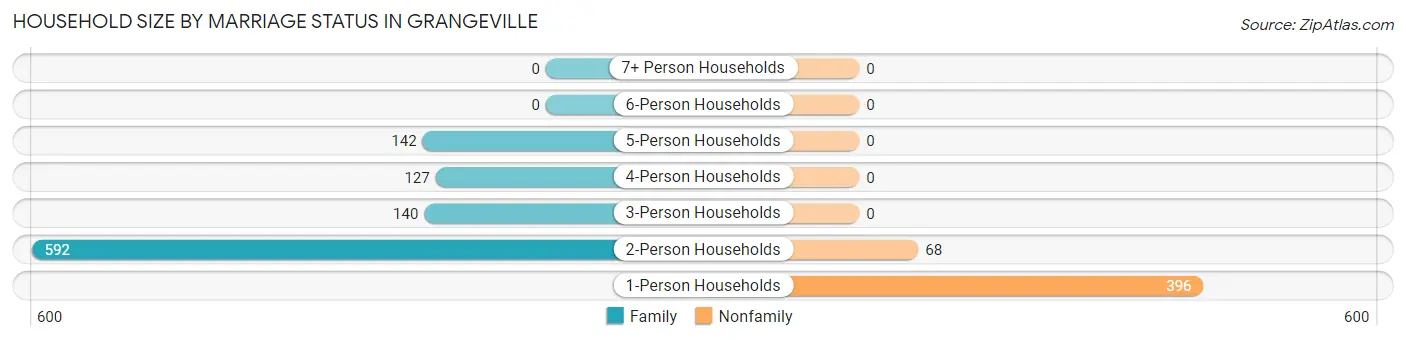
| Household Size | Family Households | Nonfamily Households |
| 1-Person Households | - | 396 (27.0%) |
| 2-Person Households | 592 (40.4%) | 68 (4.6%) |
| 3-Person Households | 140 (9.6%) | 0 (0.0%) |
| 4-Person Households | 127 (8.7%) | 0 (0.0%) |
| 5-Person Households | 142 (9.7%) | 0 (0.0%) |
| 6-Person Households | 0 (0.0%) | 0 (0.0%) |
| 7+ Person Households | 0 (0.0%) | 0 (0.0%) |
| Total | 1,001 (68.3%) | 464 (31.7%) |
Female Fertility in Grangeville
Fertility by Age in Grangeville
Average fertility rate in Grangeville is 158.0 births per 1,000 women. Women in the age bracket of 20 to 34 years have the highest fertility rate with 269.0 births per 1,000 women. Women in the age bracket of 20 to 34 years acount for 72.0% of all women with births.
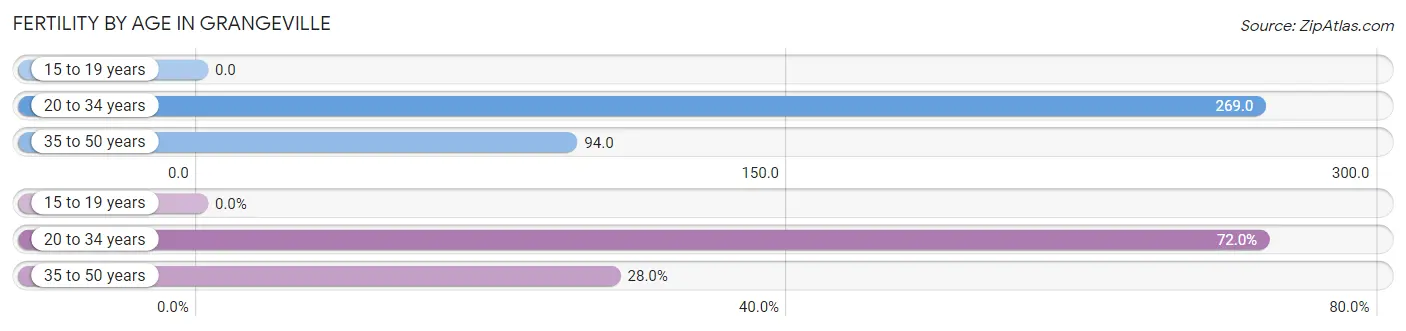
| Age Bracket | Women with Births | Births / 1,000 Women |
| 15 to 19 years | 0 (0.0%) | 0.0 |
| 20 to 34 years | 72 (72.0%) | 269.0 |
| 35 to 50 years | 28 (28.0%) | 94.0 |
| Total | 100 (100.0%) | 158.0 |
Fertility by Age by Marriage Status in Grangeville
94.0% of women with births (100) in Grangeville are married. The highest percentage of unmarried women with births falls into 35 to 50 years age bracket with 21.4% of them unmarried at the time of birth, while the lowest percentage of unmarried women with births belong to 20 to 34 years age bracket with 0.0% of them unmarried.
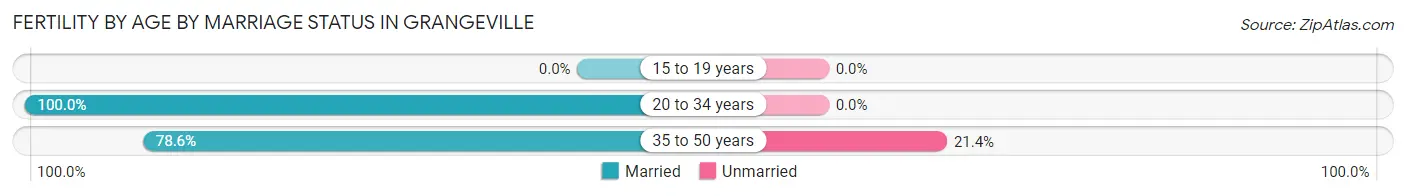
| Age Bracket | Married | Unmarried |
| 15 to 19 years | 0 (0.0%) | 0 (0.0%) |
| 20 to 34 years | 72 (100.0%) | 0 (0.0%) |
| 35 to 50 years | 22 (78.6%) | 6 (21.4%) |
| Total | 94 (94.0%) | 6 (6.0%) |
Fertility by Education in Grangeville
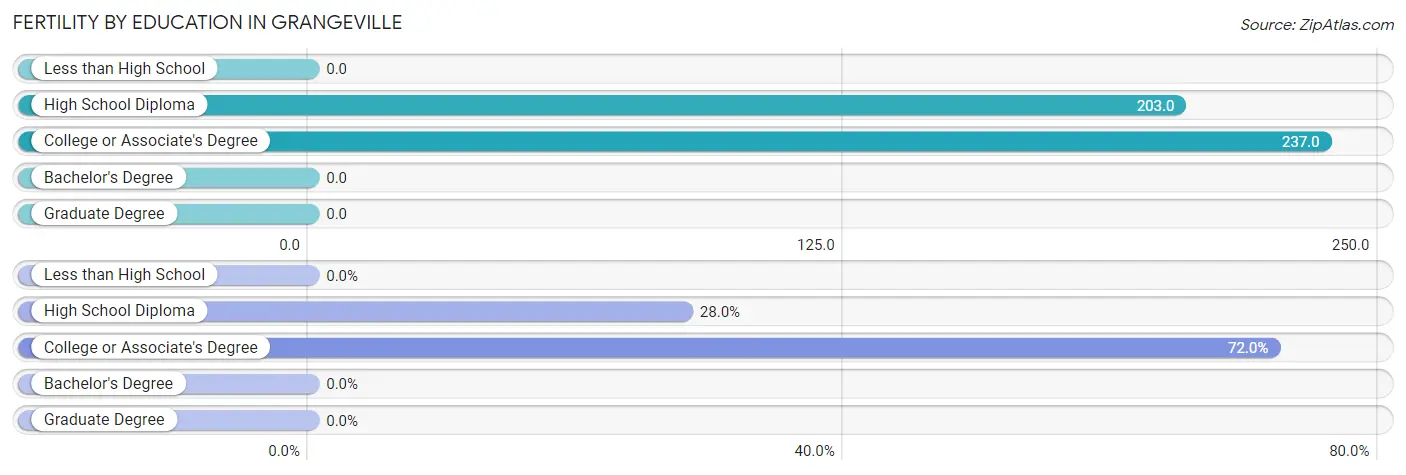
| Educational Attainment | Women with Births | Births / 1,000 Women |
| Less than High School | 0 (0.0%) | 0.0 |
| High School Diploma | 28 (28.0%) | 203.0 |
| College or Associate's Degree | 72 (72.0%) | 237.0 |
| Bachelor's Degree | 0 (0.0%) | 0.0 |
| Graduate Degree | 0 (0.0%) | 0.0 |
| Total | 100 (100.0%) | 158.0 |
Fertility by Education by Marriage Status in Grangeville
6.0% of women with births in Grangeville are unmarried. Women with the educational attainment of high school diploma are most likely to be married with 100.0% of them married at childbirth, while women with the educational attainment of college or associate's degree are least likely to be married with 8.3% of them unmarried at childbirth.
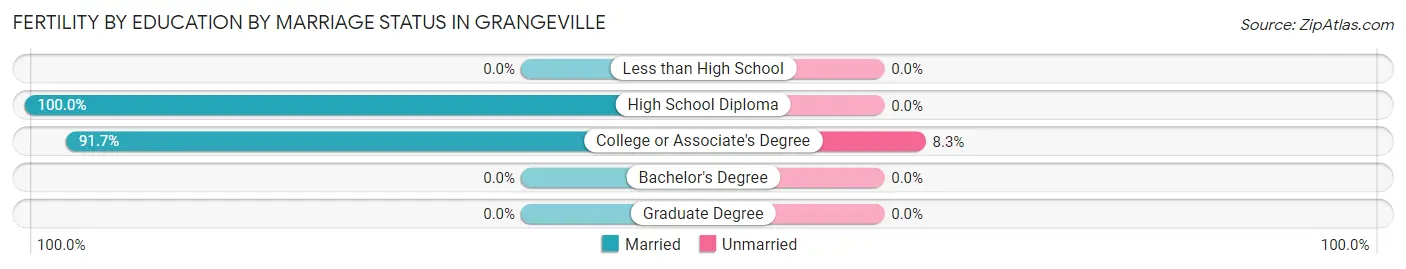
| Educational Attainment | Married | Unmarried |
| Less than High School | 0 (0.0%) | 0 (0.0%) |
| High School Diploma | 28 (100.0%) | 0 (0.0%) |
| College or Associate's Degree | 66 (91.7%) | 6 (8.3%) |
| Bachelor's Degree | 0 (0.0%) | 0 (0.0%) |
| Graduate Degree | 0 (0.0%) | 0 (0.0%) |
| Total | 94 (94.0%) | 6 (6.0%) |
Employment Characteristics in Grangeville
Employment by Class of Employer in Grangeville
Among the 1,631 employed individuals in Grangeville, private company employees (755 | 46.3%), state government employees (236 | 14.5%), and local government employees (183 | 11.2%) make up the most common classes of employment.
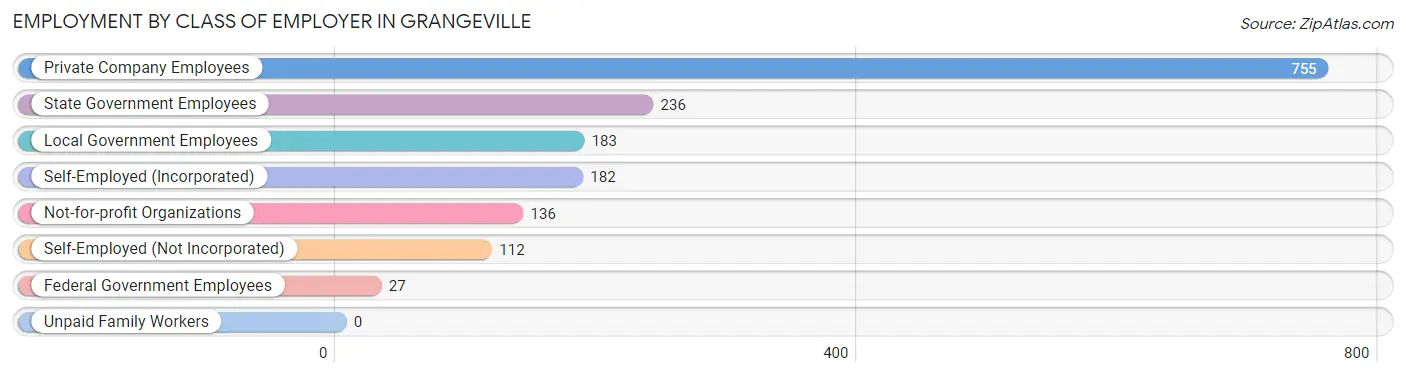
| Employer Class | # Employees | % Employees |
| Private Company Employees | 755 | 46.3% |
| Self-Employed (Incorporated) | 182 | 11.2% |
| Self-Employed (Not Incorporated) | 112 | 6.9% |
| Not-for-profit Organizations | 136 | 8.3% |
| Local Government Employees | 183 | 11.2% |
| State Government Employees | 236 | 14.5% |
| Federal Government Employees | 27 | 1.7% |
| Unpaid Family Workers | 0 | 0.0% |
| Total | 1,631 | 100.0% |
Employment Status by Age in Grangeville
According to the labor force statistics for Grangeville, out of the total population over 16 years of age (2,662), 66.2% or 1,762 individuals are in the labor force, with 3.5% or 62 of them unemployed. The age group with the highest labor force participation rate is 20 to 24 years, with 100.0% or 249 individuals in the labor force. Within the labor force, the 35 to 44 years age range has the highest percentage of unemployed individuals, with 18.9% or 61 of them being unemployed.
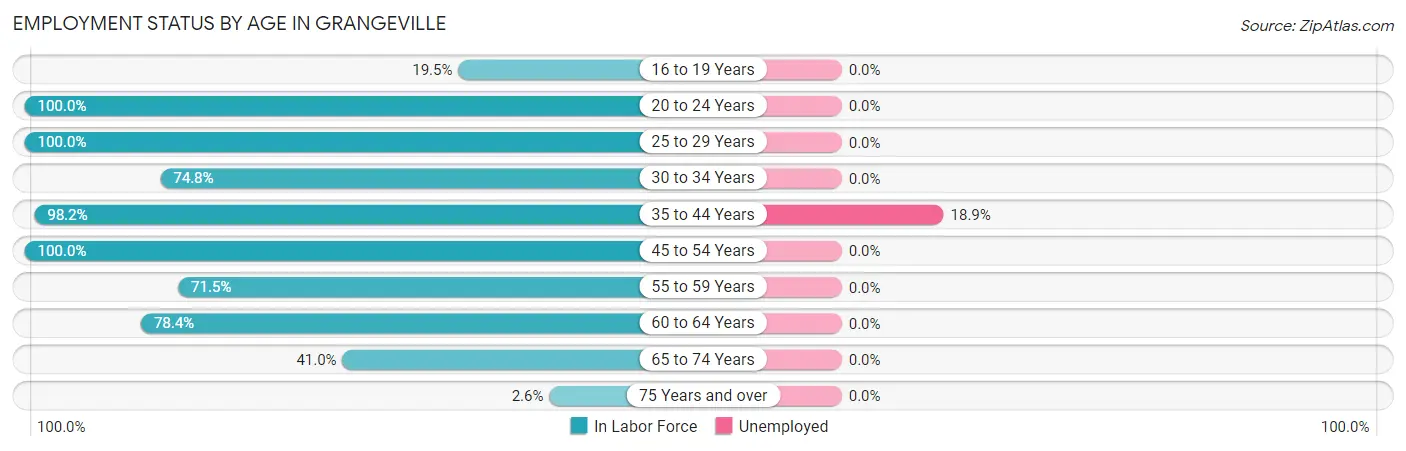
| Age Bracket | In Labor Force | Unemployed |
| 16 to 19 Years | 17 (19.5%) | 0 (0.0%) |
| 20 to 24 Years | 249 (100.0%) | 0 (0.0%) |
| 25 to 29 Years | 101 (100.0%) | 0 (0.0%) |
| 30 to 34 Years | 104 (74.8%) | 0 (0.0%) |
| 35 to 44 Years | 323 (98.2%) | 61 (18.9%) |
| 45 to 54 Years | 373 (100.0%) | 0 (0.0%) |
| 55 to 59 Years | 163 (71.5%) | 0 (0.0%) |
| 60 to 64 Years | 279 (78.4%) | 0 (0.0%) |
| 65 to 74 Years | 141 (41.0%) | 0 (0.0%) |
| 75 Years and over | 12 (2.6%) | 0 (0.0%) |
| Total | 1,762 (66.2%) | 62 (3.5%) |
Employment Status by Educational Attainment in Grangeville
According to labor force statistics for Grangeville, 88.0% of individuals (1,343) out of the total population between 25 and 64 years of age (1,526) are in the labor force, with 4.5% or 60 of them being unemployed. The group with the highest labor force participation rate are those with the educational attainment of less than high school, with 100.0% or 118 individuals in the labor force. Within the labor force, individuals with college / associate degree education have the highest percentage of unemployment, with 10.7% or 61 of them being unemployed.
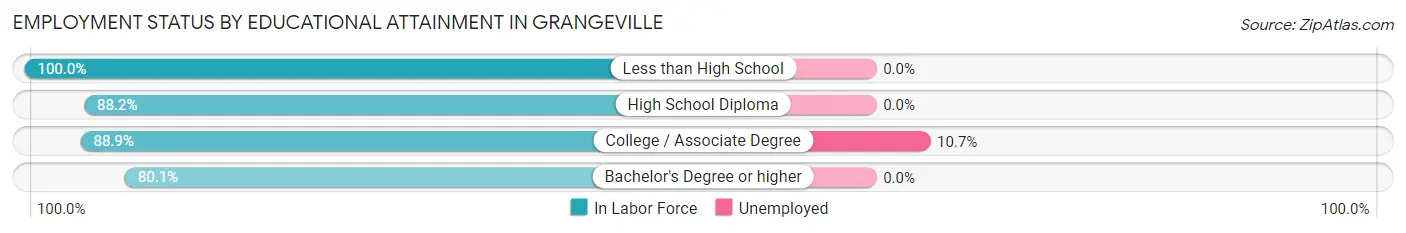
| Educational Attainment | In Labor Force | Unemployed |
| Less than High School | 118 (100.0%) | 0 (0.0%) |
| High School Diploma | 447 (88.2%) | 0 (0.0%) |
| College / Associate Degree | 569 (88.9%) | 68 (10.7%) |
| Bachelor's Degree or higher | 209 (80.1%) | 0 (0.0%) |
| Total | 1,343 (88.0%) | 69 (4.5%) |
Employment Occupations by Sex in Grangeville
Management, Business, Science and Arts Occupations
The most common Management, Business, Science and Arts occupations in Grangeville are Community & Social Service (131 | 7.7%), Education Instruction & Library (99 | 5.8%), Management (69 | 4.1%), Computers, Engineering & Science (61 | 3.6%), and Architecture & Engineering (61 | 3.6%).
Management, Business, Science and Arts Occupations by Sex
Within the Management, Business, Science and Arts occupations in Grangeville, the most male-oriented occupations are Legal Services & Support (100.0%), Computers, Engineering & Science (13.1%), and Architecture & Engineering (13.1%), while the most female-oriented occupations are Management (100.0%), Business & Financial (100.0%), and Education, Arts & Media (100.0%).
| Occupation | Male | Female |
| Management | 0 (0.0%) | 69 (100.0%) |
| Business & Financial | 0 (0.0%) | 21 (100.0%) |
| Computers, Engineering & Science | 8 (13.1%) | 53 (86.9%) |
| Computers & Mathematics | 0 (0.0%) | 0 (0.0%) |
| Architecture & Engineering | 8 (13.1%) | 53 (86.9%) |
| Life, Physical & Social Science | 0 (0.0%) | 0 (0.0%) |
| Community & Social Service | 14 (10.7%) | 117 (89.3%) |
| Education, Arts & Media | 0 (0.0%) | 9 (100.0%) |
| Legal Services & Support | 14 (100.0%) | 0 (0.0%) |
| Education Instruction & Library | 0 (0.0%) | 99 (100.0%) |
| Arts, Media & Entertainment | 0 (0.0%) | 9 (100.0%) |
| Health Diagnosing & Treating | 0 (0.0%) | 38 (100.0%) |
| Health Technologists | 0 (0.0%) | 25 (100.0%) |
| Total (Category) | 22 (6.9%) | 298 (93.1%) |
| Total (Overall) | 769 (45.2%) | 932 (54.8%) |
Services Occupations
The most common Services occupations in Grangeville are Security & Protection (244 | 14.3%), Healthcare Support (188 | 11.1%), Law Enforcement (126 | 7.4%), Firefighting & Prevention (118 | 6.9%), and Cleaning & Maintenance (83 | 4.9%).
Services Occupations by Sex
Within the Services occupations in Grangeville, the most male-oriented occupations are Law Enforcement (90.5%), Cleaning & Maintenance (85.5%), and Security & Protection (84.0%), while the most female-oriented occupations are Personal Care & Service (100.0%), Healthcare Support (86.7%), and Food Preparation & Serving (80.8%).
| Occupation | Male | Female |
| Healthcare Support | 25 (13.3%) | 163 (86.7%) |
| Security & Protection | 205 (84.0%) | 39 (16.0%) |
| Firefighting & Prevention | 91 (77.1%) | 27 (22.9%) |
| Law Enforcement | 114 (90.5%) | 12 (9.5%) |
| Food Preparation & Serving | 9 (19.2%) | 38 (80.8%) |
| Cleaning & Maintenance | 71 (85.5%) | 12 (14.5%) |
| Personal Care & Service | 0 (0.0%) | 72 (100.0%) |
| Total (Category) | 310 (48.9%) | 324 (51.1%) |
| Total (Overall) | 769 (45.2%) | 932 (54.8%) |
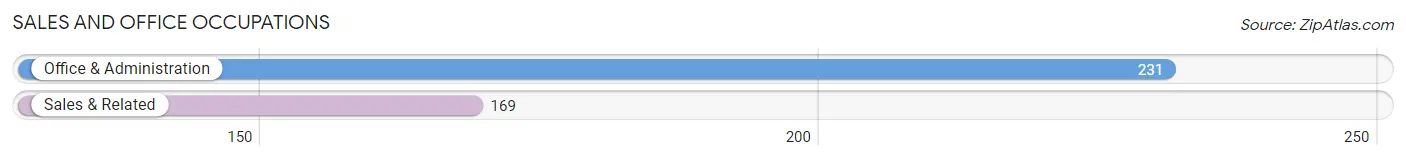
Sales and Office Occupations
The most common Sales and Office occupations in Grangeville are Office & Administration (231 | 13.6%), and Sales & Related (169 | 9.9%).
Sales and Office Occupations by Sex
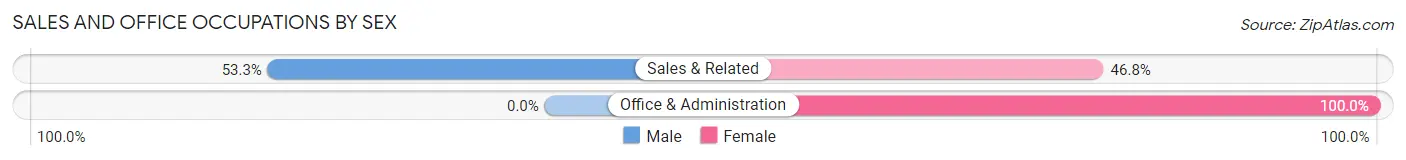
| Occupation | Male | Female |
| Sales & Related | 90 (53.2%) | 79 (46.8%) |
| Office & Administration | 0 (0.0%) | 231 (100.0%) |
| Total (Category) | 90 (22.5%) | 310 (77.5%) |
| Total (Overall) | 769 (45.2%) | 932 (54.8%) |
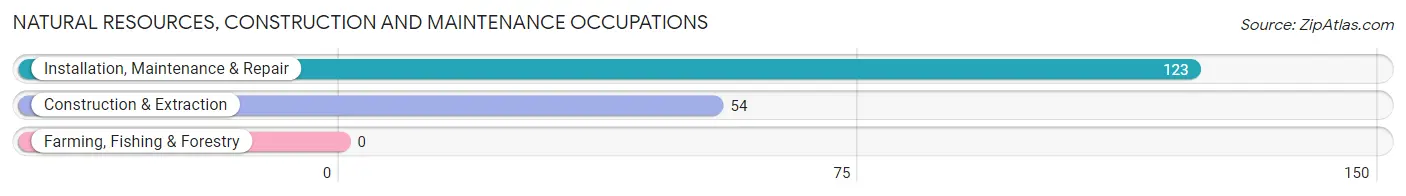
Natural Resources, Construction and Maintenance Occupations
The most common Natural Resources, Construction and Maintenance occupations in Grangeville are Installation, Maintenance & Repair (123 | 7.2%), and Construction & Extraction (54 | 3.2%).
Natural Resources, Construction and Maintenance Occupations by Sex
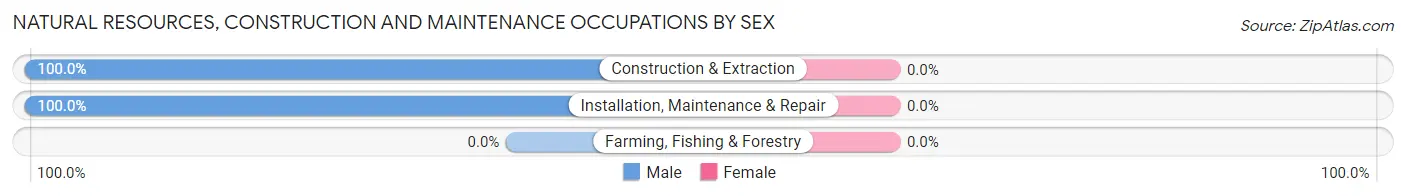
| Occupation | Male | Female |
| Farming, Fishing & Forestry | 0 (0.0%) | 0 (0.0%) |
| Construction & Extraction | 54 (100.0%) | 0 (0.0%) |
| Installation, Maintenance & Repair | 123 (100.0%) | 0 (0.0%) |
| Total (Category) | 177 (100.0%) | 0 (0.0%) |
| Total (Overall) | 769 (45.2%) | 932 (54.8%) |
Production, Transportation and Moving Occupations
The most common Production, Transportation and Moving occupations in Grangeville are Production (79 | 4.6%), Transportation (47 | 2.8%), and Material Moving (44 | 2.6%).
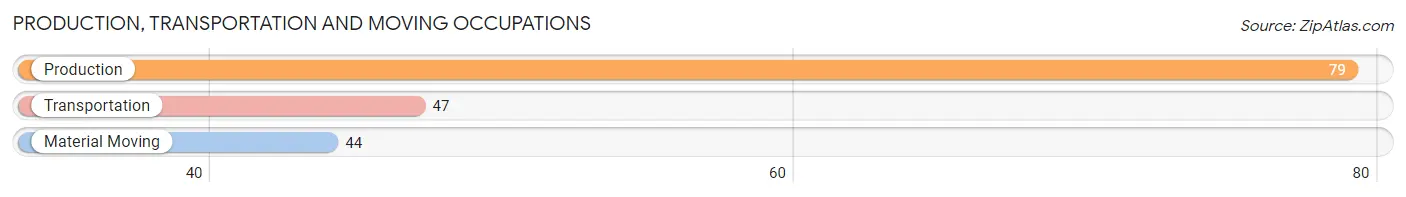
Production, Transportation and Moving Occupations by Sex
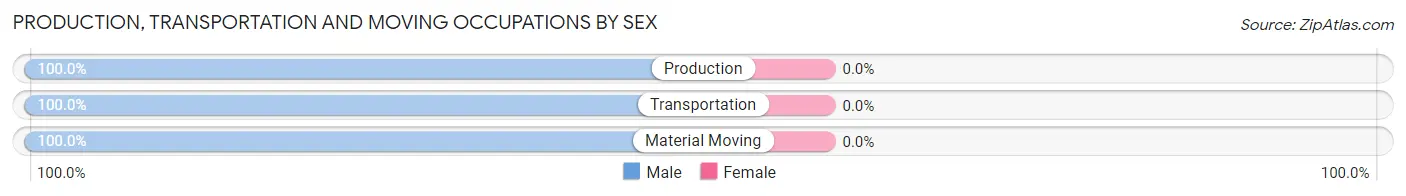
| Occupation | Male | Female |
| Production | 79 (100.0%) | 0 (0.0%) |
| Transportation | 47 (100.0%) | 0 (0.0%) |
| Material Moving | 44 (100.0%) | 0 (0.0%) |
| Total (Category) | 170 (100.0%) | 0 (0.0%) |
| Total (Overall) | 769 (45.2%) | 932 (54.8%) |
Employment Industries by Sex in Grangeville
Employment Industries in Grangeville
The major employment industries in Grangeville include Health Care & Social Assistance (302 | 17.7%), Public Administration (271 | 15.9%), Construction (174 | 10.2%), Manufacturing (174 | 10.2%), and Educational Services (95 | 5.6%).
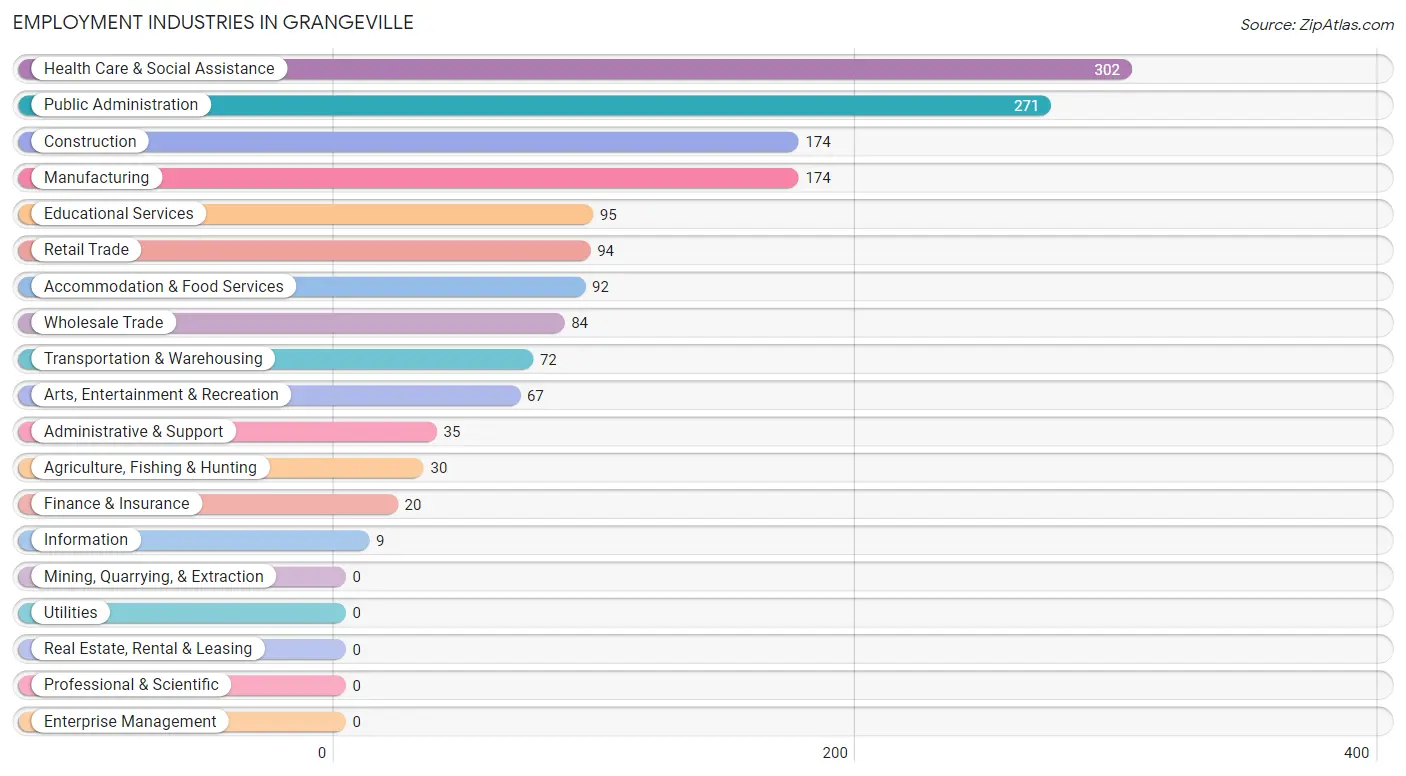
Employment Industries by Sex in Grangeville
The Grangeville industries that see more men than women are Agriculture, Fishing & Hunting (100.0%), Wholesale Trade (100.0%), and Transportation & Warehousing (100.0%), whereas the industries that tend to have a higher number of women are Information (100.0%), Finance & Insurance (100.0%), and Health Care & Social Assistance (100.0%).
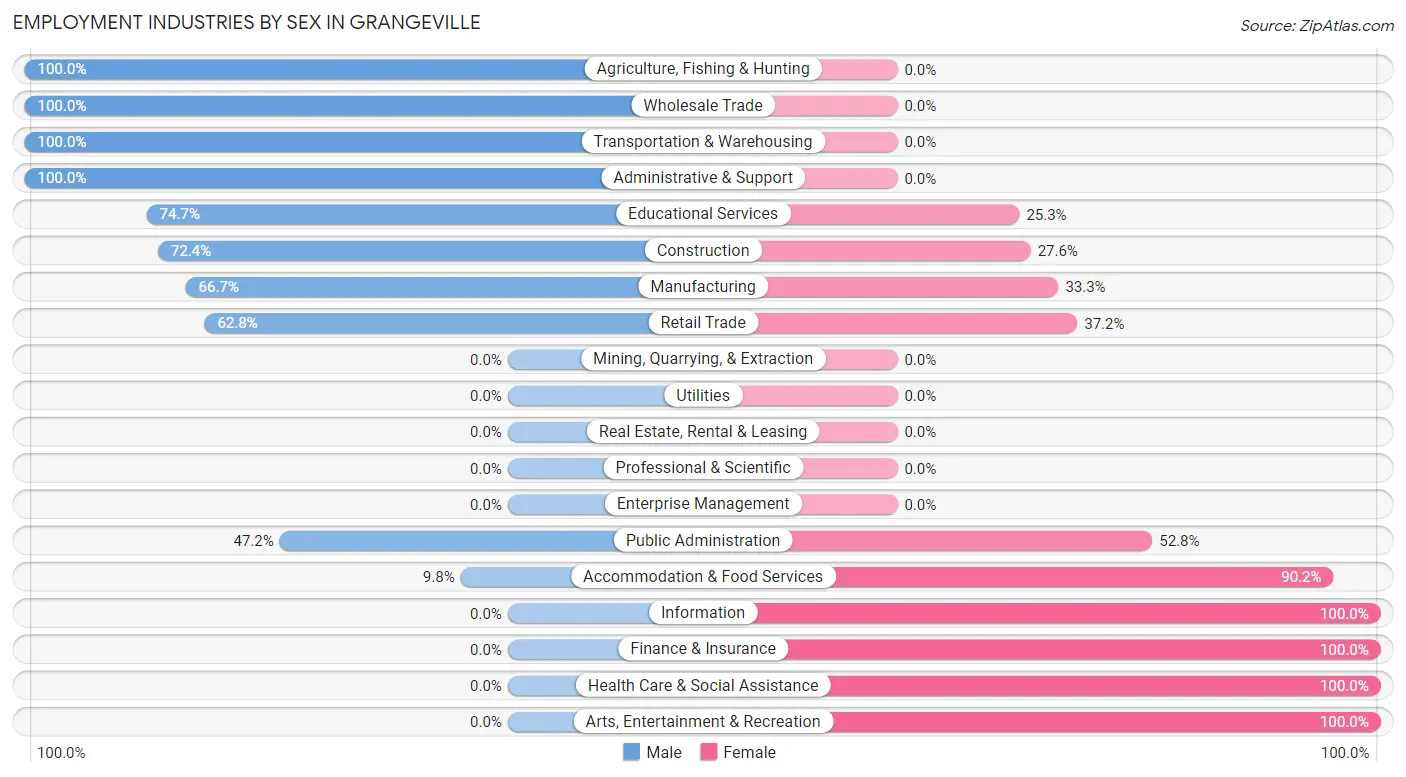
| Industry | Male | Female |
| Agriculture, Fishing & Hunting | 30 (100.0%) | 0 (0.0%) |
| Mining, Quarrying, & Extraction | 0 (0.0%) | 0 (0.0%) |
| Construction | 126 (72.4%) | 48 (27.6%) |
| Manufacturing | 116 (66.7%) | 58 (33.3%) |
| Wholesale Trade | 84 (100.0%) | 0 (0.0%) |
| Retail Trade | 59 (62.8%) | 35 (37.2%) |
| Transportation & Warehousing | 72 (100.0%) | 0 (0.0%) |
| Utilities | 0 (0.0%) | 0 (0.0%) |
| Information | 0 (0.0%) | 9 (100.0%) |
| Finance & Insurance | 0 (0.0%) | 20 (100.0%) |
| Real Estate, Rental & Leasing | 0 (0.0%) | 0 (0.0%) |
| Professional & Scientific | 0 (0.0%) | 0 (0.0%) |
| Enterprise Management | 0 (0.0%) | 0 (0.0%) |
| Administrative & Support | 35 (100.0%) | 0 (0.0%) |
| Educational Services | 71 (74.7%) | 24 (25.3%) |
| Health Care & Social Assistance | 0 (0.0%) | 302 (100.0%) |
| Arts, Entertainment & Recreation | 0 (0.0%) | 67 (100.0%) |
| Accommodation & Food Services | 9 (9.8%) | 83 (90.2%) |
| Public Administration | 128 (47.2%) | 143 (52.8%) |
| Total | 769 (45.2%) | 932 (54.8%) |
Education in Grangeville
School Enrollment in Grangeville
The most common levels of schooling among the 621 students in Grangeville are middle school (218 | 35.1%), high school (164 | 26.4%), and kindergarten (146 | 23.5%).
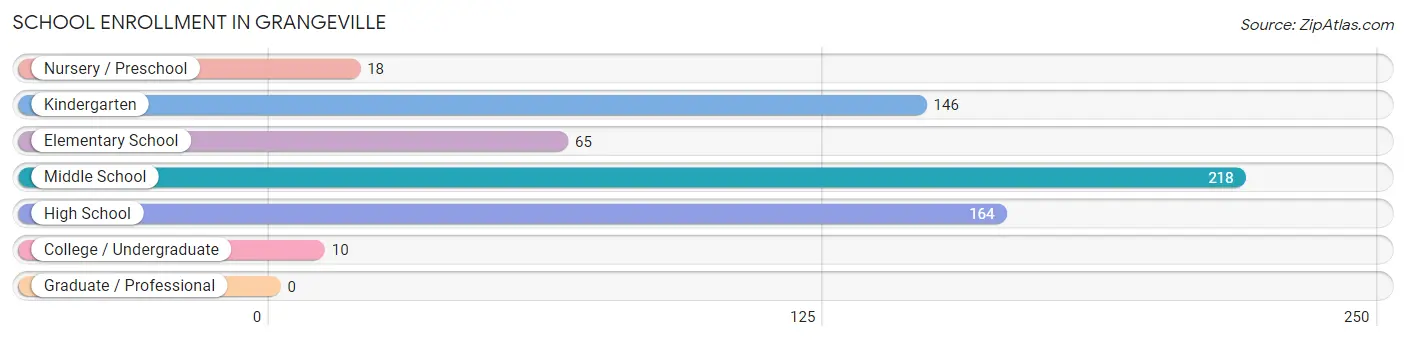
| School Level | # Students | % Students |
| Nursery / Preschool | 18 | 2.9% |
| Kindergarten | 146 | 23.5% |
| Elementary School | 65 | 10.5% |
| Middle School | 218 | 35.1% |
| High School | 164 | 26.4% |
| College / Undergraduate | 10 | 1.6% |
| Graduate / Professional | 0 | 0.0% |
| Total | 621 | 100.0% |
School Enrollment by Age by Funding Source in Grangeville
Out of a total of 621 students who are enrolled in schools in Grangeville, 56 (9.0%) attend a private institution, while the remaining 565 (91.0%) are enrolled in public schools. The age group of 10 to 14 year olds has the highest likelihood of being enrolled in private schools, with 48 (22.8% in the age bracket) enrolled. Conversely, the age group of 3 to 4 year olds has the lowest likelihood of being enrolled in a private school, with 18 (100.0% in the age bracket) attending a public institution.
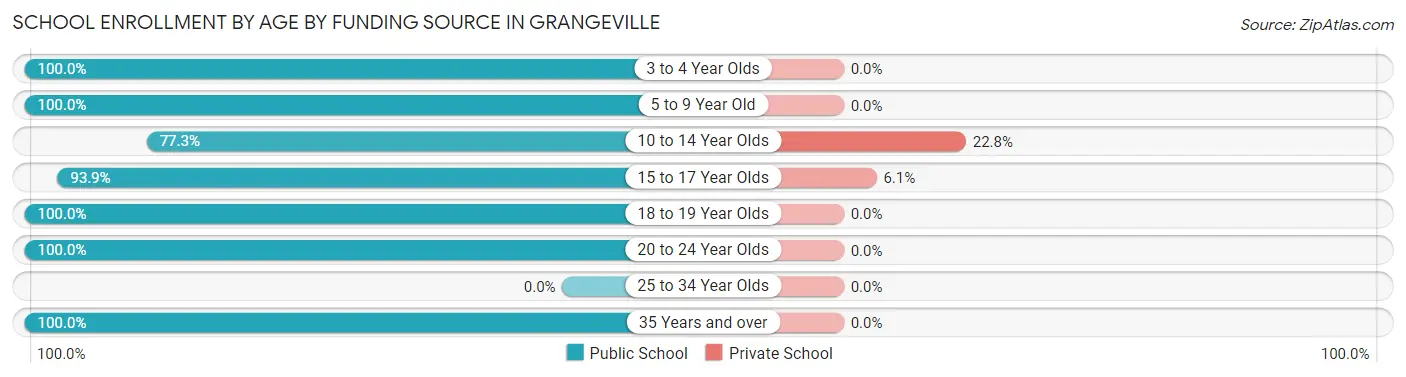
| Age Bracket | Public School | Private School |
| 3 to 4 Year Olds | 18 (100.0%) | 0 (0.0%) |
| 5 to 9 Year Old | 178 (100.0%) | 0 (0.0%) |
| 10 to 14 Year Olds | 163 (77.2%) | 48 (22.8%) |
| 15 to 17 Year Olds | 123 (93.9%) | 8 (6.1%) |
| 18 to 19 Year Olds | 53 (100.0%) | 0 (0.0%) |
| 20 to 24 Year Olds | 10 (100.0%) | 0 (0.0%) |
| 25 to 34 Year Olds | 0 (0.0%) | 0 (0.0%) |
| 35 Years and over | 20 (100.0%) | 0 (0.0%) |
| Total | 565 (91.0%) | 56 (9.0%) |
Educational Attainment by Field of Study in Grangeville
Education (116 | 27.0%), bio, nature & agricultural (70 | 16.3%), business (53 | 12.3%), science & technology (51 | 11.9%), and liberal arts & history (40 | 9.3%) are the most common fields of study among 429 individuals in Grangeville who have obtained a bachelor's degree or higher.
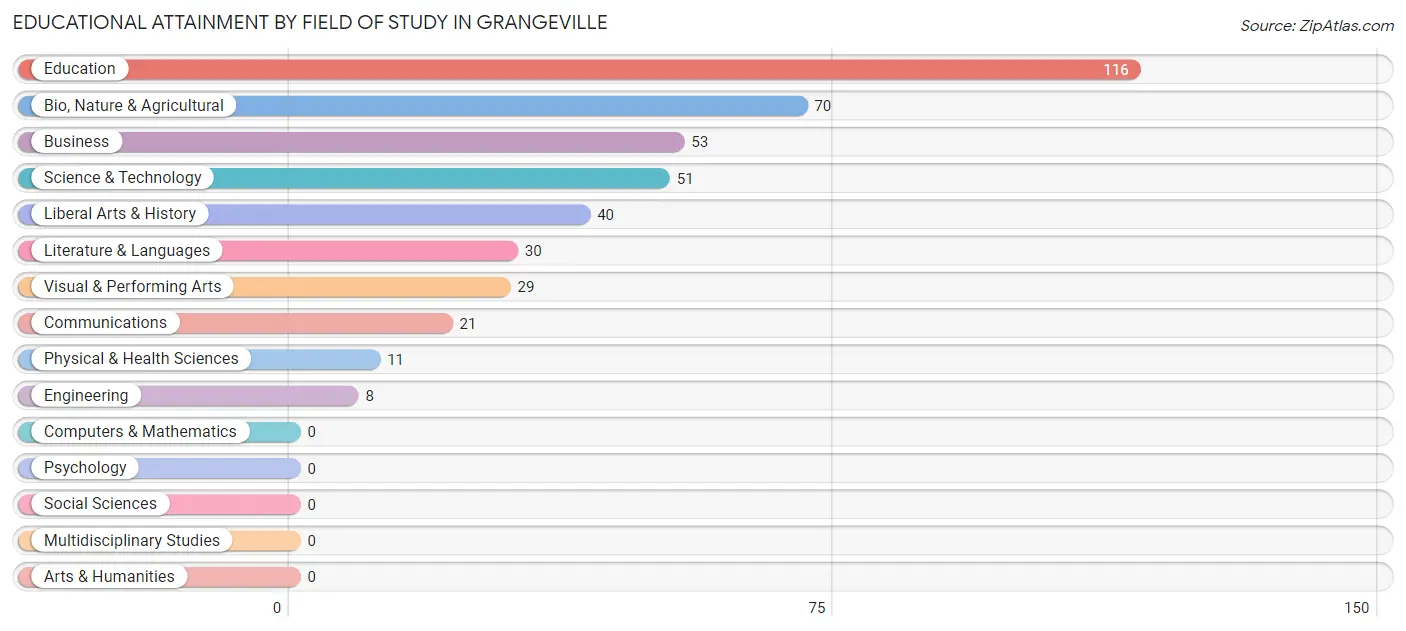
| Field of Study | # Graduates | % Graduates |
| Computers & Mathematics | 0 | 0.0% |
| Bio, Nature & Agricultural | 70 | 16.3% |
| Physical & Health Sciences | 11 | 2.6% |
| Psychology | 0 | 0.0% |
| Social Sciences | 0 | 0.0% |
| Engineering | 8 | 1.9% |
| Multidisciplinary Studies | 0 | 0.0% |
| Science & Technology | 51 | 11.9% |
| Business | 53 | 12.3% |
| Education | 116 | 27.0% |
| Literature & Languages | 30 | 7.0% |
| Liberal Arts & History | 40 | 9.3% |
| Visual & Performing Arts | 29 | 6.8% |
| Communications | 21 | 4.9% |
| Arts & Humanities | 0 | 0.0% |
| Total | 429 | 100.0% |
Transportation & Commute in Grangeville
Vehicle Availability by Sex in Grangeville
The most prevalent vehicle ownership categories in Grangeville are males with 3 vehicles (253, accounting for 32.9%) and females with 3 vehicles (205, making up 29.3%).
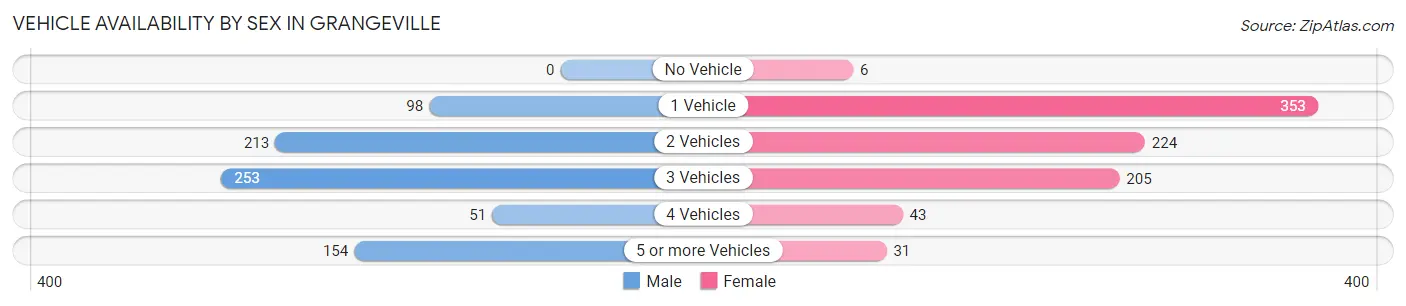
| Vehicles Available | Male | Female |
| No Vehicle | 0 (0.0%) | 6 (0.7%) |
| 1 Vehicle | 98 (12.7%) | 353 (40.9%) |
| 2 Vehicles | 213 (27.7%) | 224 (26.0%) |
| 3 Vehicles | 253 (32.9%) | 205 (23.8%) |
| 4 Vehicles | 51 (6.6%) | 43 (5.0%) |
| 5 or more Vehicles | 154 (20.0%) | 31 (3.6%) |
| Total | 769 (100.0%) | 862 (100.0%) |
Commute Time in Grangeville
The most frequently occuring commute durations in Grangeville are 5 to 9 minutes (695 commuters, 42.6%), less than 5 minutes (281 commuters, 17.2%), and 15 to 19 minutes (230 commuters, 14.1%).
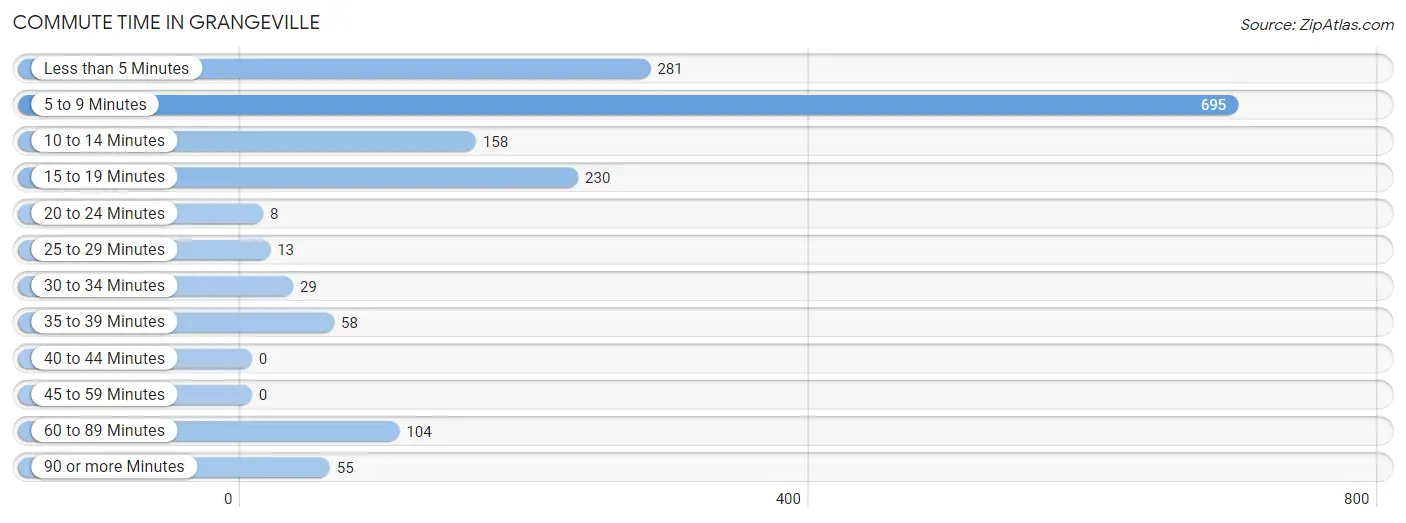
| Commute Time | # Commuters | % Commuters |
| Less than 5 Minutes | 281 | 17.2% |
| 5 to 9 Minutes | 695 | 42.6% |
| 10 to 14 Minutes | 158 | 9.7% |
| 15 to 19 Minutes | 230 | 14.1% |
| 20 to 24 Minutes | 8 | 0.5% |
| 25 to 29 Minutes | 13 | 0.8% |
| 30 to 34 Minutes | 29 | 1.8% |
| 35 to 39 Minutes | 58 | 3.6% |
| 40 to 44 Minutes | 0 | 0.0% |
| 45 to 59 Minutes | 0 | 0.0% |
| 60 to 89 Minutes | 104 | 6.4% |
| 90 or more Minutes | 55 | 3.4% |
Commute Time by Sex in Grangeville
The most common commute times in Grangeville are 5 to 9 minutes (294 commuters, 38.2%) for males and 5 to 9 minutes (401 commuters, 46.5%) for females.
| Commute Time | Male | Female |
| Less than 5 Minutes | 123 (16.0%) | 158 (18.3%) |
| 5 to 9 Minutes | 294 (38.2%) | 401 (46.5%) |
| 10 to 14 Minutes | 66 (8.6%) | 92 (10.7%) |
| 15 to 19 Minutes | 71 (9.2%) | 159 (18.4%) |
| 20 to 24 Minutes | 0 (0.0%) | 8 (0.9%) |
| 25 to 29 Minutes | 0 (0.0%) | 13 (1.5%) |
| 30 to 34 Minutes | 11 (1.4%) | 18 (2.1%) |
| 35 to 39 Minutes | 58 (7.5%) | 0 (0.0%) |
| 40 to 44 Minutes | 0 (0.0%) | 0 (0.0%) |
| 45 to 59 Minutes | 0 (0.0%) | 0 (0.0%) |
| 60 to 89 Minutes | 91 (11.8%) | 13 (1.5%) |
| 90 or more Minutes | 55 (7.1%) | 0 (0.0%) |
Time of Departure to Work by Sex in Grangeville
The most frequent times of departure to work in Grangeville are 12:00 AM to 4:59 AM (321, 41.7%) for males and 4:00 PM to 11:59 PM (196, 22.7%) for females.
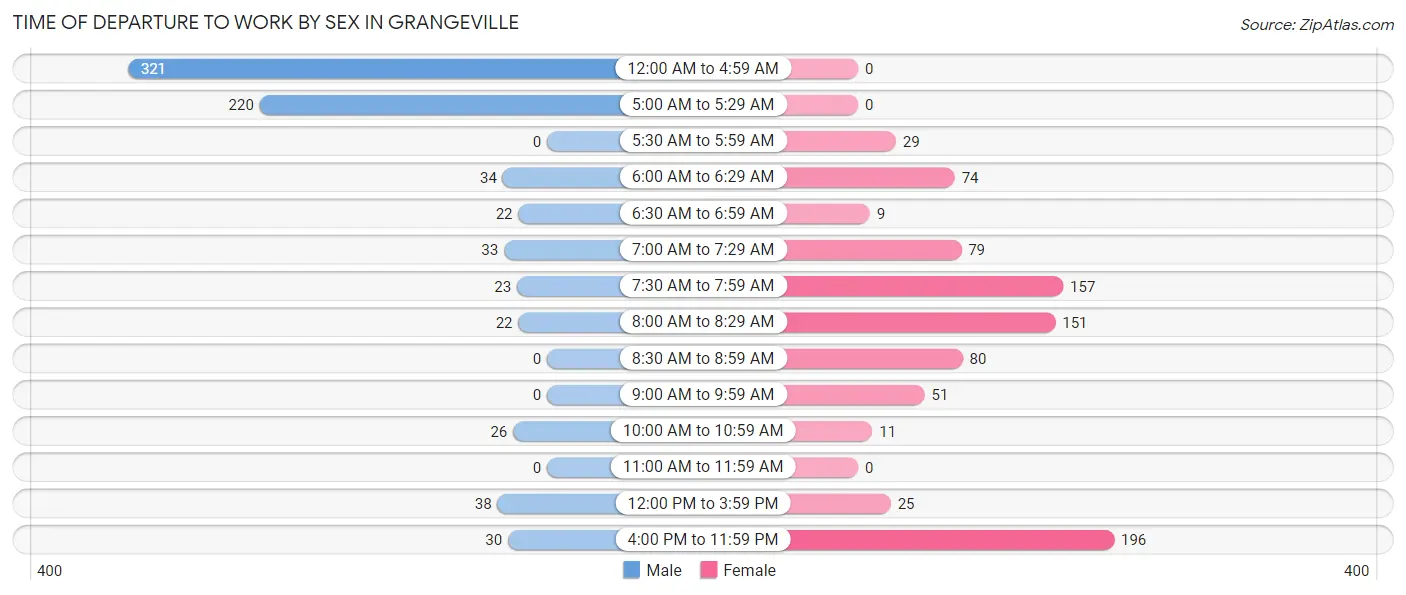
| Time of Departure | Male | Female |
| 12:00 AM to 4:59 AM | 321 (41.7%) | 0 (0.0%) |
| 5:00 AM to 5:29 AM | 220 (28.6%) | 0 (0.0%) |
| 5:30 AM to 5:59 AM | 0 (0.0%) | 29 (3.4%) |
| 6:00 AM to 6:29 AM | 34 (4.4%) | 74 (8.6%) |
| 6:30 AM to 6:59 AM | 22 (2.9%) | 9 (1.0%) |
| 7:00 AM to 7:29 AM | 33 (4.3%) | 79 (9.2%) |
| 7:30 AM to 7:59 AM | 23 (3.0%) | 157 (18.2%) |
| 8:00 AM to 8:29 AM | 22 (2.9%) | 151 (17.5%) |
| 8:30 AM to 8:59 AM | 0 (0.0%) | 80 (9.3%) |
| 9:00 AM to 9:59 AM | 0 (0.0%) | 51 (5.9%) |
| 10:00 AM to 10:59 AM | 26 (3.4%) | 11 (1.3%) |
| 11:00 AM to 11:59 AM | 0 (0.0%) | 0 (0.0%) |
| 12:00 PM to 3:59 PM | 38 (4.9%) | 25 (2.9%) |
| 4:00 PM to 11:59 PM | 30 (3.9%) | 196 (22.7%) |
| Total | 769 (100.0%) | 862 (100.0%) |
Housing Occupancy in Grangeville
Occupancy by Ownership in Grangeville
Of the total 1,465 dwellings in Grangeville, owner-occupied units account for 910 (62.1%), while renter-occupied units make up 555 (37.9%).
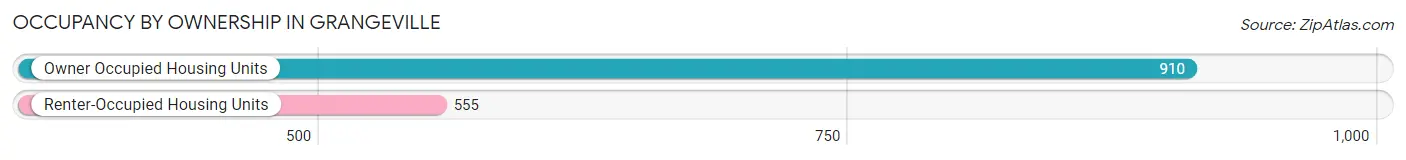
| Occupancy | # Housing Units | % Housing Units |
| Owner Occupied Housing Units | 910 | 62.1% |
| Renter-Occupied Housing Units | 555 | 37.9% |
| Total Occupied Housing Units | 1,465 | 100.0% |
Occupancy by Household Size in Grangeville
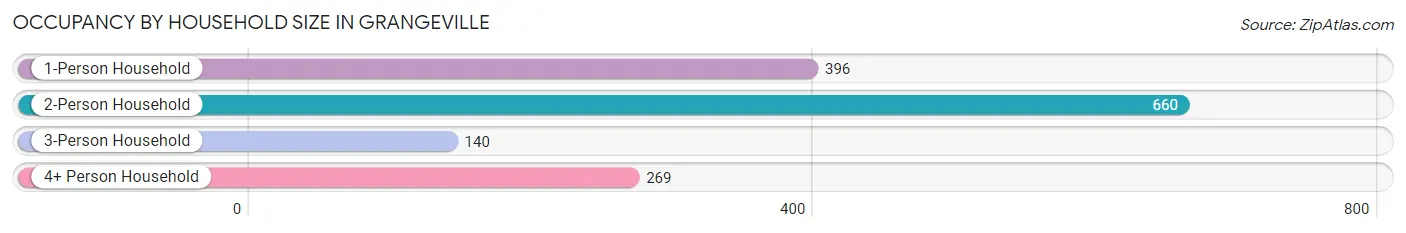
| Household Size | # Housing Units | % Housing Units |
| 1-Person Household | 396 | 27.0% |
| 2-Person Household | 660 | 45.1% |
| 3-Person Household | 140 | 9.6% |
| 4+ Person Household | 269 | 18.4% |
| Total Housing Units | 1,465 | 100.0% |
Occupancy by Ownership by Household Size in Grangeville
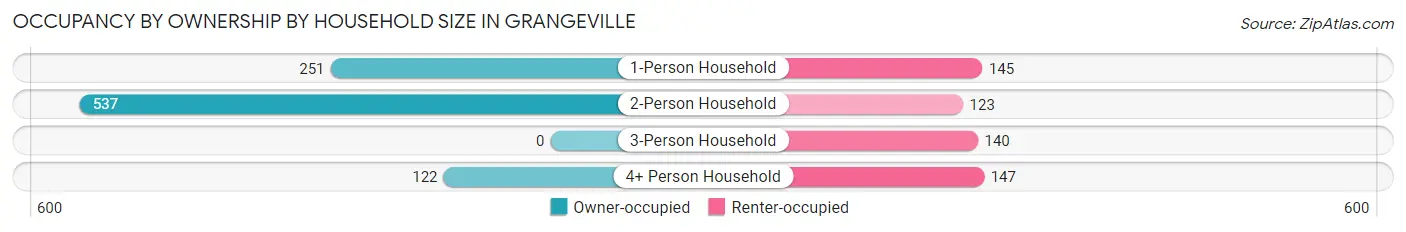
| Household Size | Owner-occupied | Renter-occupied |
| 1-Person Household | 251 (63.4%) | 145 (36.6%) |
| 2-Person Household | 537 (81.4%) | 123 (18.6%) |
| 3-Person Household | 0 (0.0%) | 140 (100.0%) |
| 4+ Person Household | 122 (45.4%) | 147 (54.6%) |
| Total Housing Units | 910 (62.1%) | 555 (37.9%) |
Occupancy by Educational Attainment in Grangeville
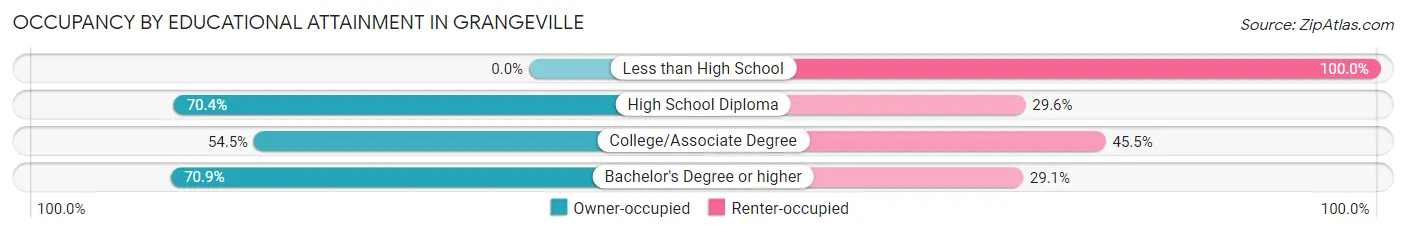
| Household Size | Owner-occupied | Renter-occupied |
| Less than High School | 0 (0.0%) | 45 (100.0%) |
| High School Diploma | 419 (70.4%) | 176 (29.6%) |
| College/Associate Degree | 313 (54.5%) | 261 (45.5%) |
| Bachelor's Degree or higher | 178 (70.9%) | 73 (29.1%) |
Occupancy by Age of Householder in Grangeville
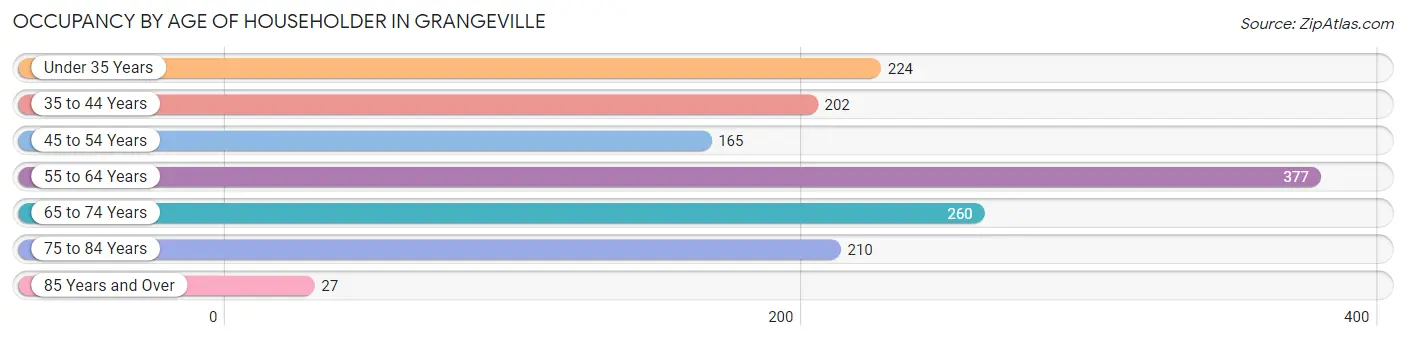
| Age Bracket | # Households | % Households |
| Under 35 Years | 224 | 15.3% |
| 35 to 44 Years | 202 | 13.8% |
| 45 to 54 Years | 165 | 11.3% |
| 55 to 64 Years | 377 | 25.7% |
| 65 to 74 Years | 260 | 17.7% |
| 75 to 84 Years | 210 | 14.3% |
| 85 Years and Over | 27 | 1.8% |
| Total | 1,465 | 100.0% |
Housing Finances in Grangeville
Median Income by Occupancy in Grangeville
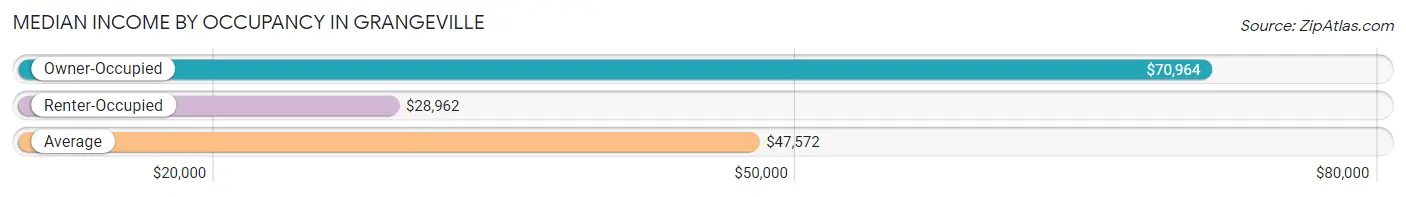
| Occupancy Type | # Households | Median Income |
| Owner-Occupied | 910 (62.1%) | $70,964 |
| Renter-Occupied | 555 (37.9%) | $28,962 |
| Average | 1,465 (100.0%) | $47,572 |
Occupancy by Householder Income Bracket in Grangeville
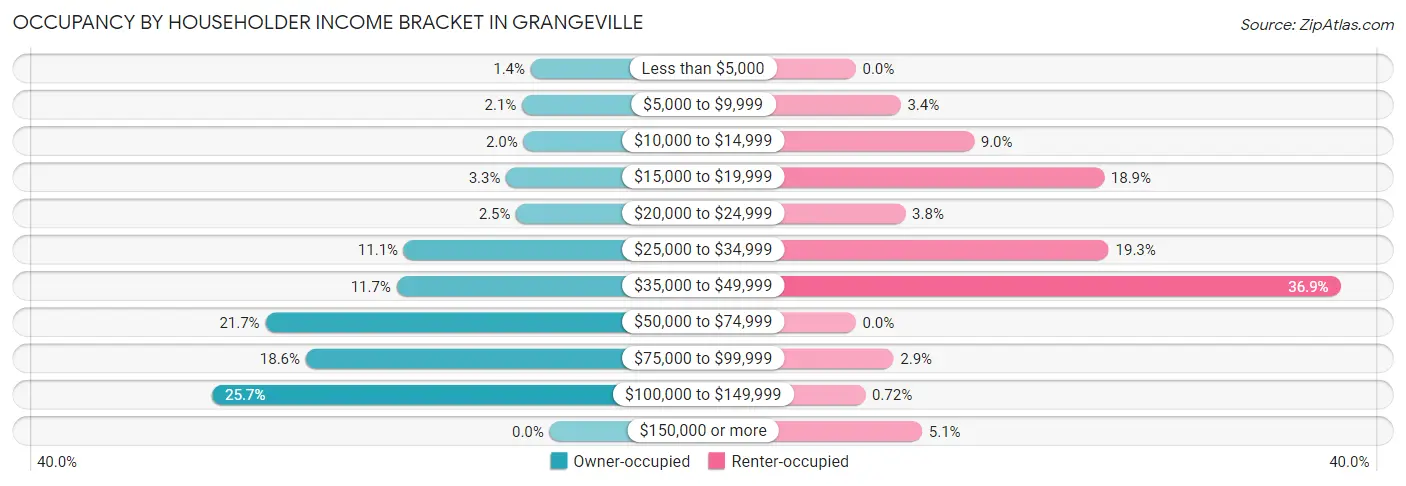
| Income Bracket | Owner-occupied | Renter-occupied |
| Less than $5,000 | 13 (1.4%) | 0 (0.0%) |
| $5,000 to $9,999 | 19 (2.1%) | 19 (3.4%) |
| $10,000 to $14,999 | 18 (2.0%) | 50 (9.0%) |
| $15,000 to $19,999 | 30 (3.3%) | 105 (18.9%) |
| $20,000 to $24,999 | 23 (2.5%) | 21 (3.8%) |
| $25,000 to $34,999 | 101 (11.1%) | 107 (19.3%) |
| $35,000 to $49,999 | 106 (11.7%) | 205 (36.9%) |
| $50,000 to $74,999 | 197 (21.6%) | 0 (0.0%) |
| $75,000 to $99,999 | 169 (18.6%) | 16 (2.9%) |
| $100,000 to $149,999 | 234 (25.7%) | 4 (0.7%) |
| $150,000 or more | 0 (0.0%) | 28 (5.1%) |
| Total | 910 (100.0%) | 555 (100.0%) |
Monthly Housing Cost Tiers in Grangeville
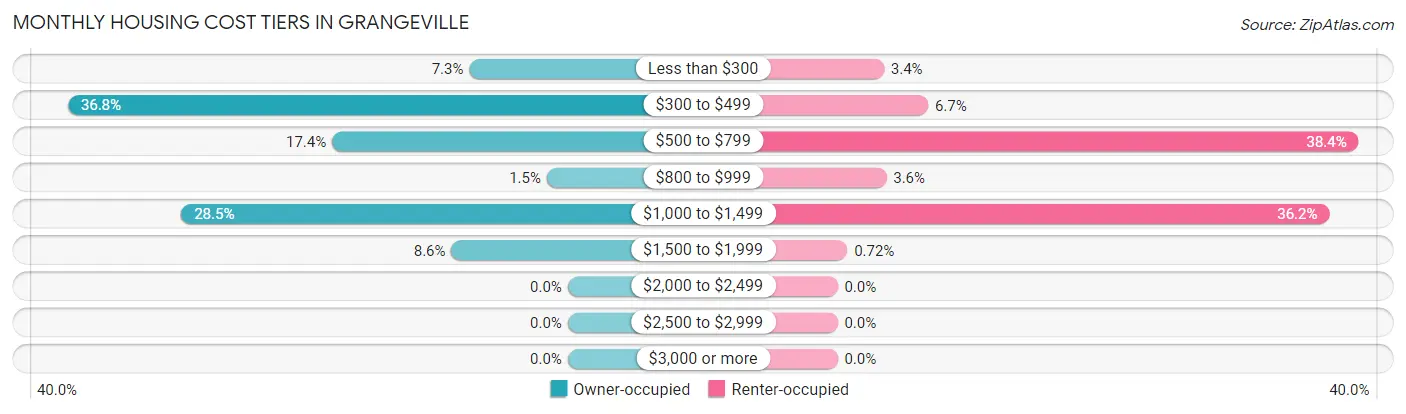
| Monthly Cost | Owner-occupied | Renter-occupied |
| Less than $300 | 66 (7.2%) | 19 (3.4%) |
| $300 to $499 | 335 (36.8%) | 37 (6.7%) |
| $500 to $799 | 158 (17.4%) | 213 (38.4%) |
| $800 to $999 | 14 (1.5%) | 20 (3.6%) |
| $1,000 to $1,499 | 259 (28.5%) | 201 (36.2%) |
| $1,500 to $1,999 | 78 (8.6%) | 4 (0.7%) |
| $2,000 to $2,499 | 0 (0.0%) | 0 (0.0%) |
| $2,500 to $2,999 | 0 (0.0%) | 0 (0.0%) |
| $3,000 or more | 0 (0.0%) | 0 (0.0%) |
| Total | 910 (100.0%) | 555 (100.0%) |
Physical Housing Characteristics in Grangeville
Housing Structures in Grangeville
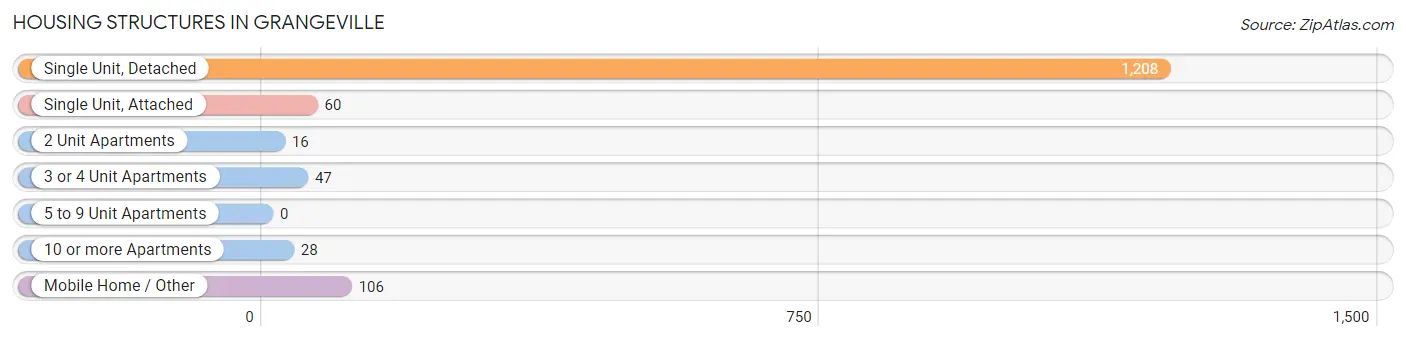
| Structure Type | # Housing Units | % Housing Units |
| Single Unit, Detached | 1,208 | 82.5% |
| Single Unit, Attached | 60 | 4.1% |
| 2 Unit Apartments | 16 | 1.1% |
| 3 or 4 Unit Apartments | 47 | 3.2% |
| 5 to 9 Unit Apartments | 0 | 0.0% |
| 10 or more Apartments | 28 | 1.9% |
| Mobile Home / Other | 106 | 7.2% |
| Total | 1,465 | 100.0% |
Housing Structures by Occupancy in Grangeville
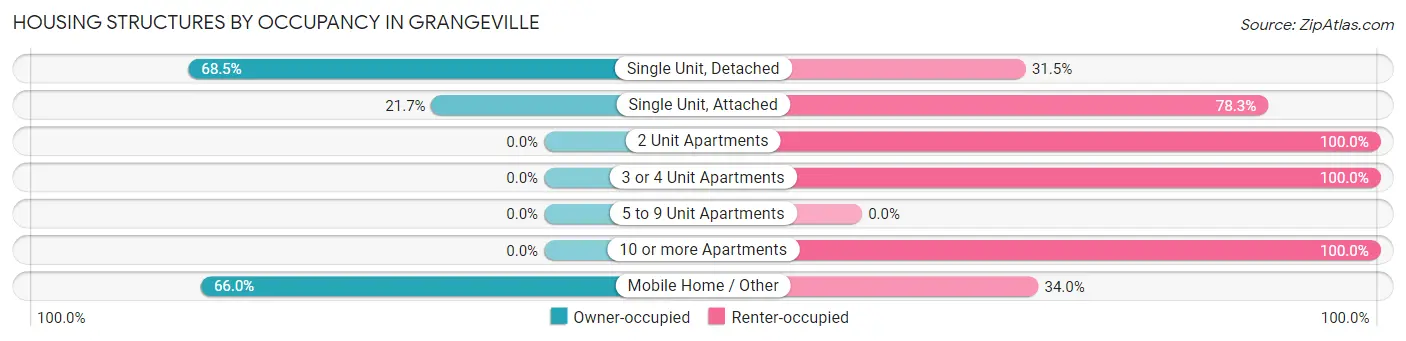
| Structure Type | Owner-occupied | Renter-occupied |
| Single Unit, Detached | 827 (68.5%) | 381 (31.5%) |
| Single Unit, Attached | 13 (21.7%) | 47 (78.3%) |
| 2 Unit Apartments | 0 (0.0%) | 16 (100.0%) |
| 3 or 4 Unit Apartments | 0 (0.0%) | 47 (100.0%) |
| 5 to 9 Unit Apartments | 0 (0.0%) | 0 (0.0%) |
| 10 or more Apartments | 0 (0.0%) | 28 (100.0%) |
| Mobile Home / Other | 70 (66.0%) | 36 (34.0%) |
| Total | 910 (62.1%) | 555 (37.9%) |
Housing Structures by Number of Rooms in Grangeville
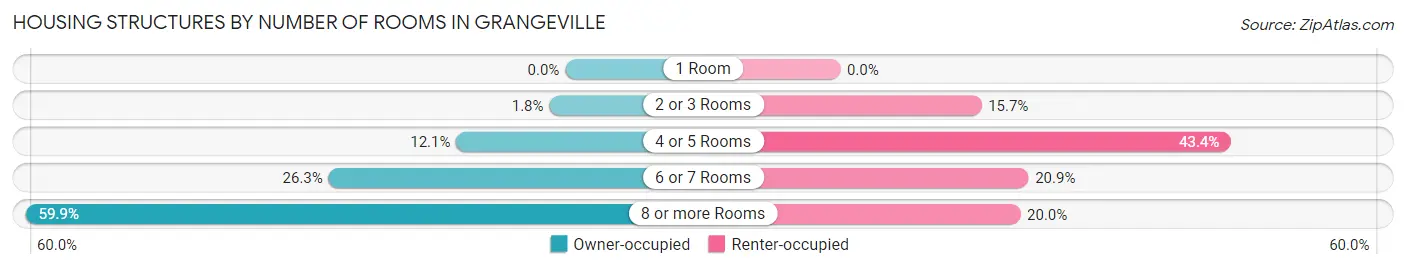
| Number of Rooms | Owner-occupied | Renter-occupied |
| 1 Room | 0 (0.0%) | 0 (0.0%) |
| 2 or 3 Rooms | 16 (1.8%) | 87 (15.7%) |
| 4 or 5 Rooms | 110 (12.1%) | 241 (43.4%) |
| 6 or 7 Rooms | 239 (26.3%) | 116 (20.9%) |
| 8 or more Rooms | 545 (59.9%) | 111 (20.0%) |
| Total | 910 (100.0%) | 555 (100.0%) |
Housing Structure by Heating Type in Grangeville
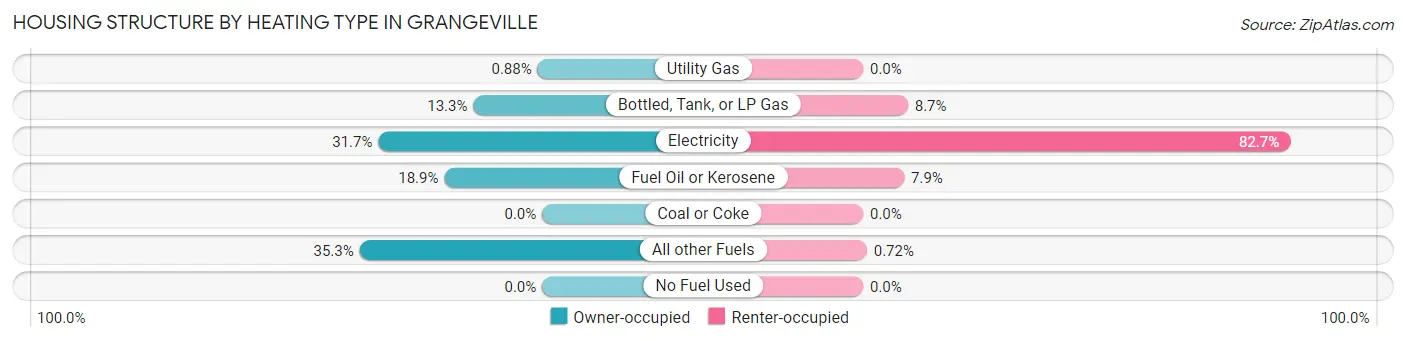
| Heating Type | Owner-occupied | Renter-occupied |
| Utility Gas | 8 (0.9%) | 0 (0.0%) |
| Bottled, Tank, or LP Gas | 121 (13.3%) | 48 (8.6%) |
| Electricity | 288 (31.7%) | 459 (82.7%) |
| Fuel Oil or Kerosene | 172 (18.9%) | 44 (7.9%) |
| Coal or Coke | 0 (0.0%) | 0 (0.0%) |
| All other Fuels | 321 (35.3%) | 4 (0.7%) |
| No Fuel Used | 0 (0.0%) | 0 (0.0%) |
| Total | 910 (100.0%) | 555 (100.0%) |
Household Vehicle Usage in Grangeville
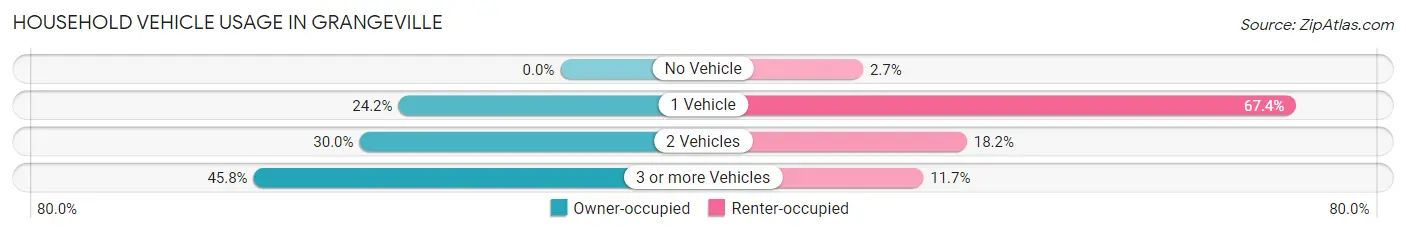
| Vehicles per Household | Owner-occupied | Renter-occupied |
| No Vehicle | 0 (0.0%) | 15 (2.7%) |
| 1 Vehicle | 220 (24.2%) | 374 (67.4%) |
| 2 Vehicles | 273 (30.0%) | 101 (18.2%) |
| 3 or more Vehicles | 417 (45.8%) | 65 (11.7%) |
| Total | 910 (100.0%) | 555 (100.0%) |
Real Estate & Mortgages in Grangeville
Real Estate and Mortgage Overview in Grangeville
| Characteristic | Without Mortgage | With Mortgage |
| Housing Units | 541 | 369 |
| Median Property Value | $218,800 | $220,500 |
| Median Household Income | $70,804 | $0 |
| Monthly Housing Costs | $412 | $0 |
| Real Estate Taxes | $969 | $33 |
Property Value by Mortgage Status in Grangeville
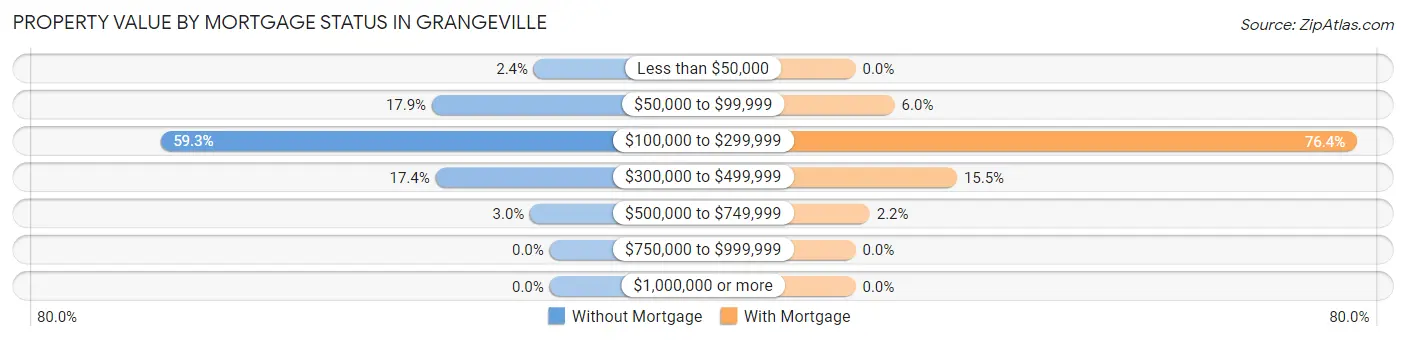
| Property Value | Without Mortgage | With Mortgage |
| Less than $50,000 | 13 (2.4%) | 0 (0.0%) |
| $50,000 to $99,999 | 97 (17.9%) | 22 (6.0%) |
| $100,000 to $299,999 | 321 (59.3%) | 282 (76.4%) |
| $300,000 to $499,999 | 94 (17.4%) | 57 (15.4%) |
| $500,000 to $749,999 | 16 (3.0%) | 8 (2.2%) |
| $750,000 to $999,999 | 0 (0.0%) | 0 (0.0%) |
| $1,000,000 or more | 0 (0.0%) | 0 (0.0%) |
| Total | 541 (100.0%) | 369 (100.0%) |
Household Income by Mortgage Status in Grangeville
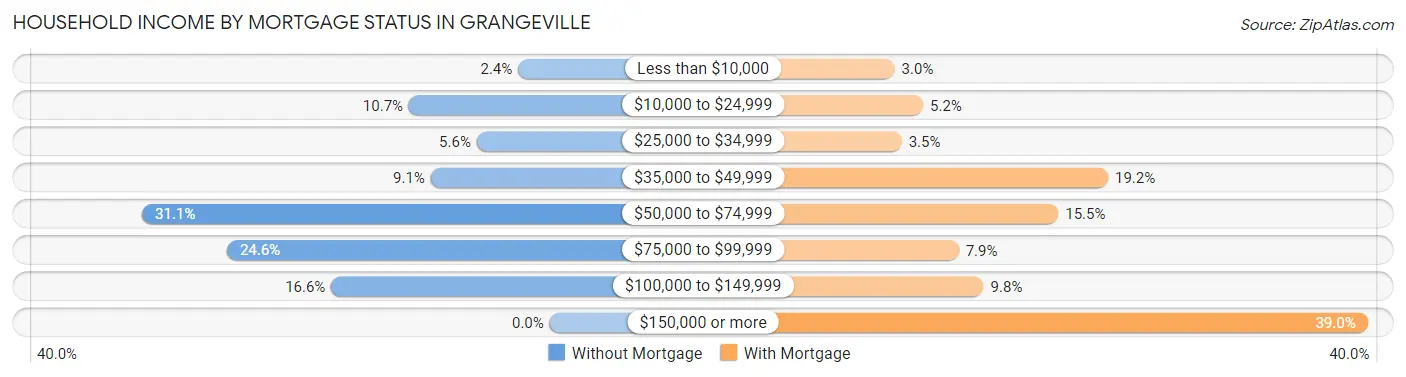
| Household Income | Without Mortgage | With Mortgage |
| Less than $10,000 | 13 (2.4%) | 11 (3.0%) |
| $10,000 to $24,999 | 58 (10.7%) | 19 (5.1%) |
| $25,000 to $34,999 | 30 (5.6%) | 13 (3.5%) |
| $35,000 to $49,999 | 49 (9.1%) | 71 (19.2%) |
| $50,000 to $74,999 | 168 (31.0%) | 57 (15.4%) |
| $75,000 to $99,999 | 133 (24.6%) | 29 (7.9%) |
| $100,000 to $149,999 | 90 (16.6%) | 36 (9.8%) |
| $150,000 or more | 0 (0.0%) | 144 (39.0%) |
| Total | 541 (100.0%) | 369 (100.0%) |
Property Value to Household Income Ratio in Grangeville
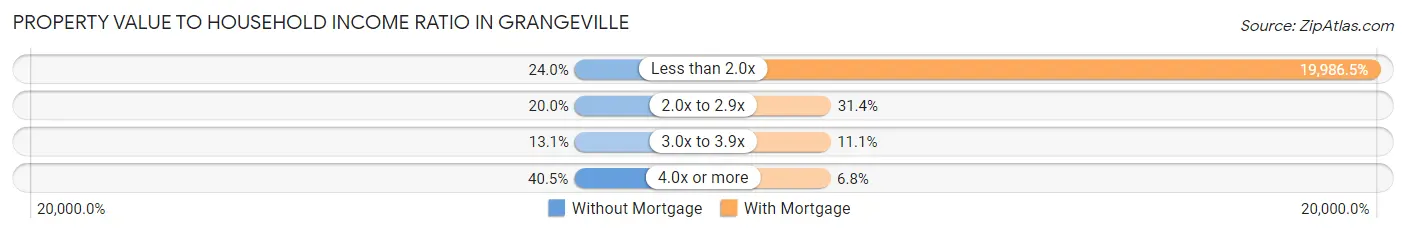
| Value-to-Income Ratio | Without Mortgage | With Mortgage |
| Less than 2.0x | 130 (24.0%) | 73,750 (19,986.4%) |
| 2.0x to 2.9x | 108 (20.0%) | 116 (31.4%) |
| 3.0x to 3.9x | 71 (13.1%) | 41 (11.1%) |
| 4.0x or more | 219 (40.5%) | 25 (6.8%) |
| Total | 541 (100.0%) | 369 (100.0%) |
Real Estate Taxes by Mortgage Status in Grangeville
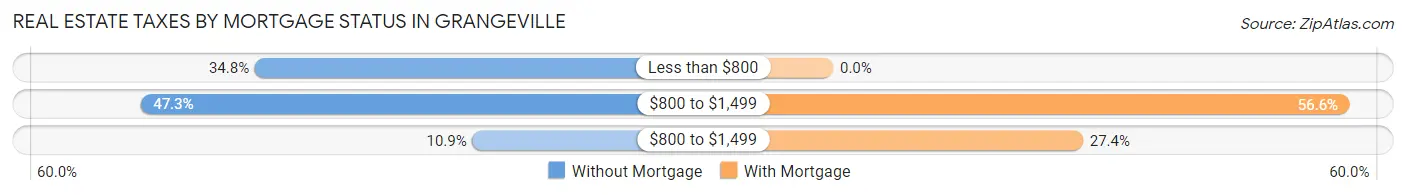
| Property Taxes | Without Mortgage | With Mortgage |
| Less than $800 | 188 (34.7%) | 0 (0.0%) |
| $800 to $1,499 | 256 (47.3%) | 209 (56.6%) |
| $800 to $1,499 | 59 (10.9%) | 101 (27.4%) |
| Total | 541 (100.0%) | 369 (100.0%) |
Health & Disability in Grangeville
Health Insurance Coverage by Age in Grangeville
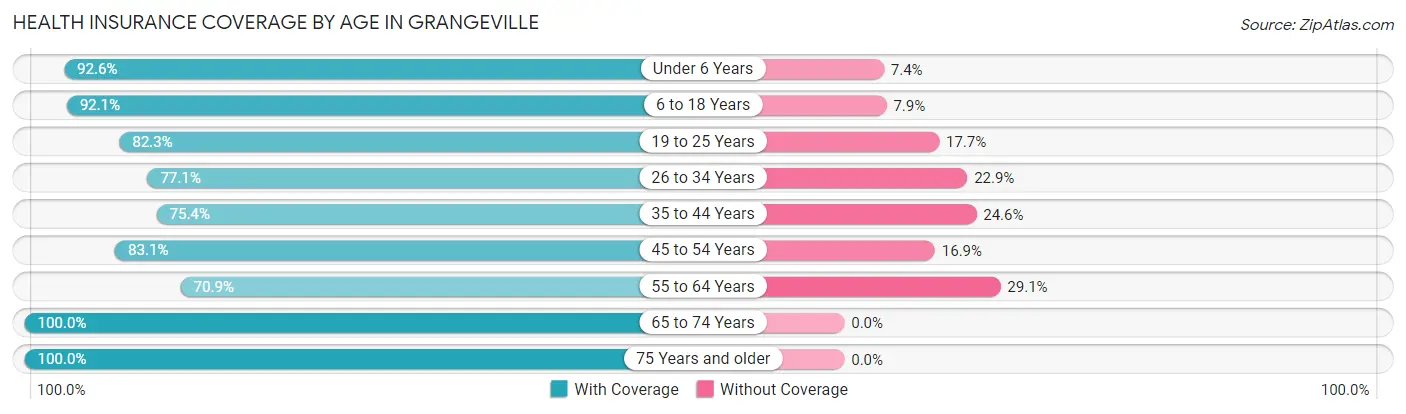
| Age Bracket | With Coverage | Without Coverage |
| Under 6 Years | 276 (92.6%) | 22 (7.4%) |
| 6 to 18 Years | 457 (92.1%) | 39 (7.9%) |
| 19 to 25 Years | 205 (82.3%) | 44 (17.7%) |
| 26 to 34 Years | 185 (77.1%) | 55 (22.9%) |
| 35 to 44 Years | 248 (75.4%) | 81 (24.6%) |
| 45 to 54 Years | 310 (83.1%) | 63 (16.9%) |
| 55 to 64 Years | 414 (70.9%) | 170 (29.1%) |
| 65 to 74 Years | 344 (100.0%) | 0 (0.0%) |
| 75 Years and older | 380 (100.0%) | 0 (0.0%) |
| Total | 2,819 (85.6%) | 474 (14.4%) |
Health Insurance Coverage by Citizenship Status in Grangeville
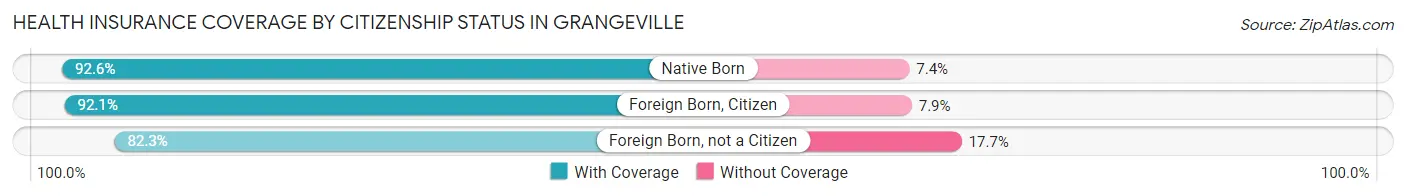
| Citizenship Status | With Coverage | Without Coverage |
| Native Born | 276 (92.6%) | 22 (7.4%) |
| Foreign Born, Citizen | 457 (92.1%) | 39 (7.9%) |
| Foreign Born, not a Citizen | 205 (82.3%) | 44 (17.7%) |
Health Insurance Coverage by Household Income in Grangeville
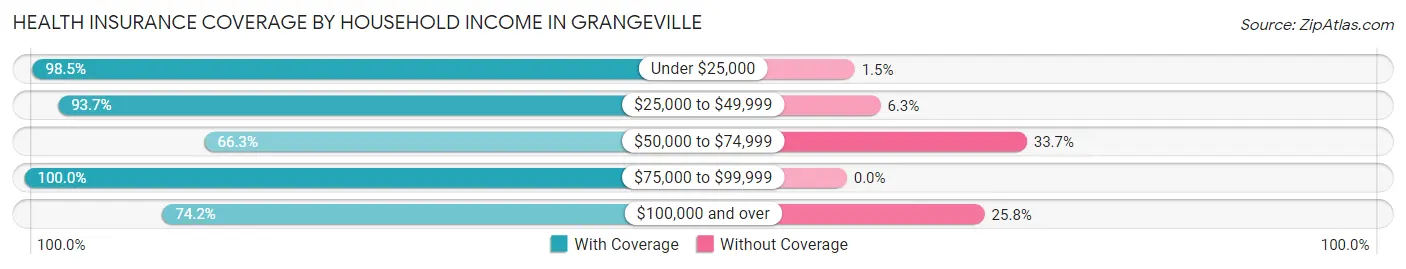
| Household Income | With Coverage | Without Coverage |
| Under $25,000 | 397 (98.5%) | 6 (1.5%) |
| $25,000 to $49,999 | 1,114 (93.7%) | 75 (6.3%) |
| $50,000 to $74,999 | 330 (66.3%) | 168 (33.7%) |
| $75,000 to $99,999 | 322 (100.0%) | 0 (0.0%) |
| $100,000 and over | 646 (74.2%) | 225 (25.8%) |
Public vs Private Health Insurance Coverage by Age in Grangeville
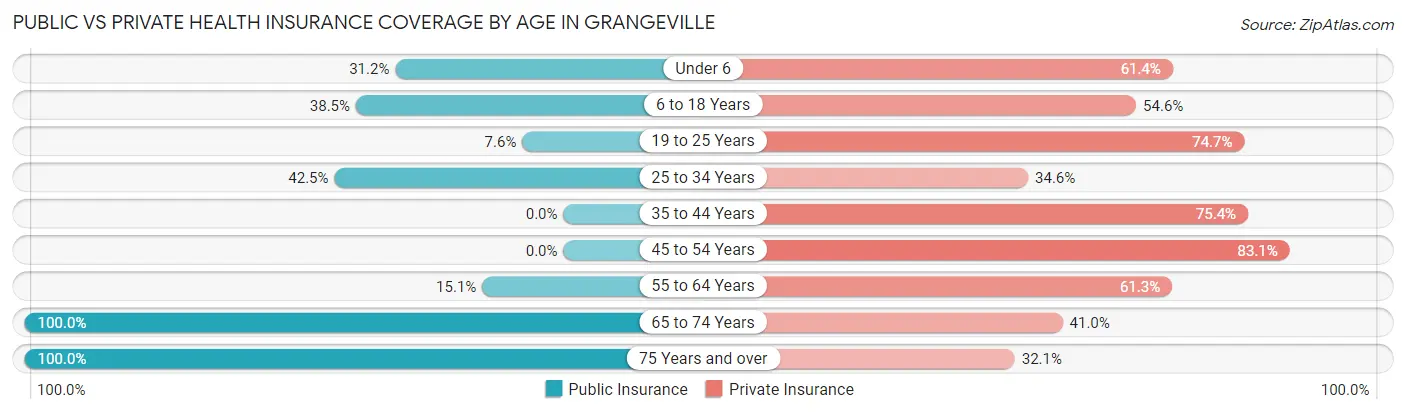
| Age Bracket | Public Insurance | Private Insurance |
| Under 6 | 93 (31.2%) | 183 (61.4%) |
| 6 to 18 Years | 191 (38.5%) | 271 (54.6%) |
| 19 to 25 Years | 19 (7.6%) | 186 (74.7%) |
| 25 to 34 Years | 102 (42.5%) | 83 (34.6%) |
| 35 to 44 Years | 0 (0.0%) | 248 (75.4%) |
| 45 to 54 Years | 0 (0.0%) | 310 (83.1%) |
| 55 to 64 Years | 88 (15.1%) | 358 (61.3%) |
| 65 to 74 Years | 344 (100.0%) | 141 (41.0%) |
| 75 Years and over | 380 (100.0%) | 122 (32.1%) |
| Total | 1,217 (37.0%) | 1,902 (57.8%) |
Disability Status by Sex by Age in Grangeville
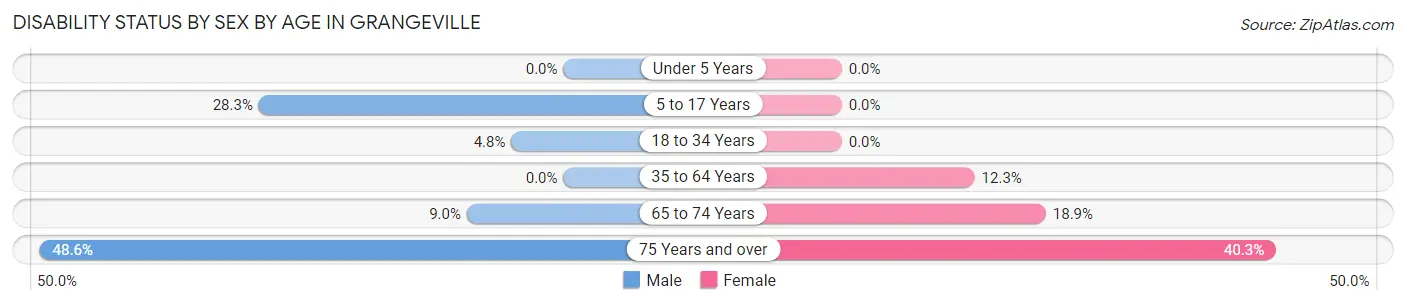
| Age Bracket | Male | Female |
| Under 5 Years | 0 (0.0%) | 0 (0.0%) |
| 5 to 17 Years | 54 (28.3%) | 0 (0.0%) |
| 18 to 34 Years | 13 (4.8%) | 0 (0.0%) |
| 35 to 64 Years | 0 (0.0%) | 90 (12.3%) |
| 65 to 74 Years | 19 (9.0%) | 25 (18.9%) |
| 75 Years and over | 87 (48.6%) | 81 (40.3%) |
Disability Class by Sex by Age in Grangeville
Disability Class: Hearing Difficulty
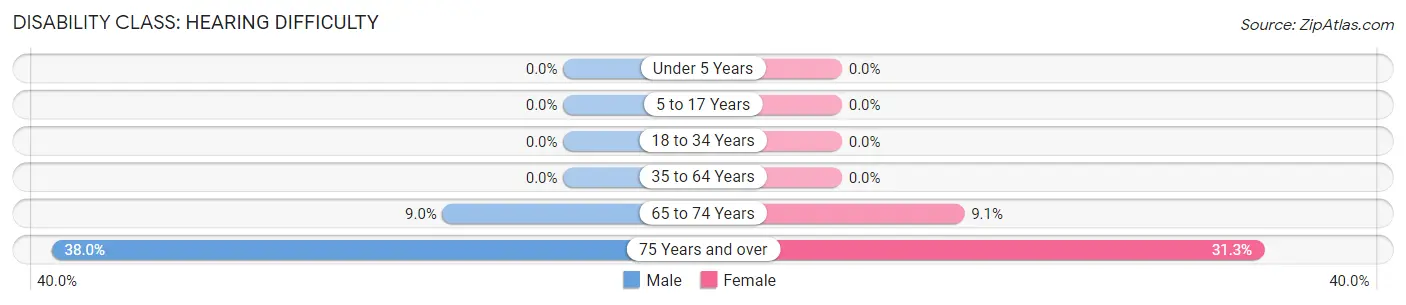
| Age Bracket | Male | Female |
| Under 5 Years | 0 (0.0%) | 0 (0.0%) |
| 5 to 17 Years | 0 (0.0%) | 0 (0.0%) |
| 18 to 34 Years | 0 (0.0%) | 0 (0.0%) |
| 35 to 64 Years | 0 (0.0%) | 0 (0.0%) |
| 65 to 74 Years | 19 (9.0%) | 12 (9.1%) |
| 75 Years and over | 68 (38.0%) | 63 (31.3%) |
Disability Class: Vision Difficulty
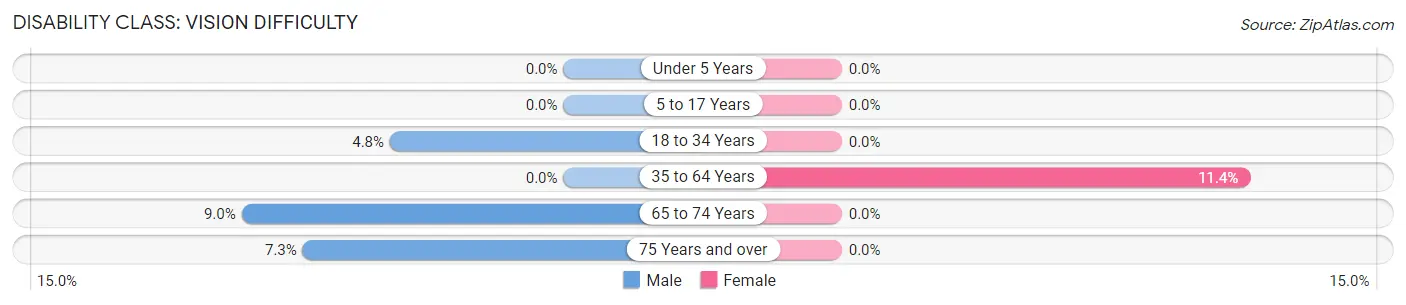
| Age Bracket | Male | Female |
| Under 5 Years | 0 (0.0%) | 0 (0.0%) |
| 5 to 17 Years | 0 (0.0%) | 0 (0.0%) |
| 18 to 34 Years | 13 (4.8%) | 0 (0.0%) |
| 35 to 64 Years | 0 (0.0%) | 83 (11.4%) |
| 65 to 74 Years | 19 (9.0%) | 0 (0.0%) |
| 75 Years and over | 13 (7.3%) | 0 (0.0%) |
Disability Class: Cognitive Difficulty
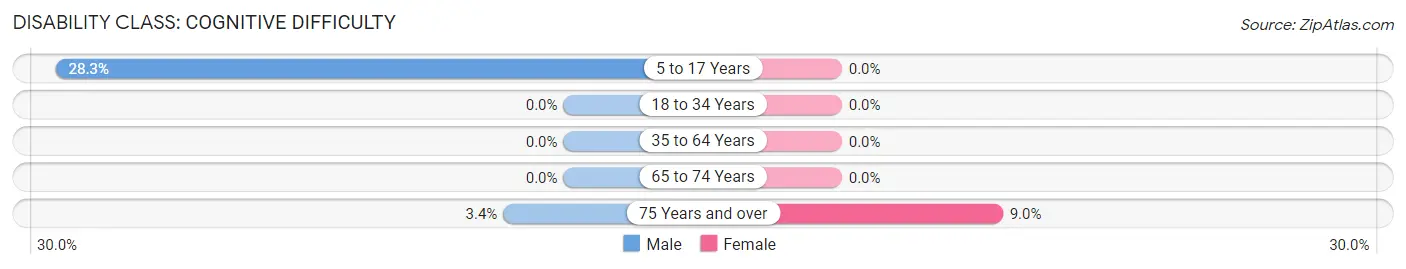
| Age Bracket | Male | Female |
| 5 to 17 Years | 54 (28.3%) | 0 (0.0%) |
| 18 to 34 Years | 0 (0.0%) | 0 (0.0%) |
| 35 to 64 Years | 0 (0.0%) | 0 (0.0%) |
| 65 to 74 Years | 0 (0.0%) | 0 (0.0%) |
| 75 Years and over | 6 (3.4%) | 18 (9.0%) |
Disability Class: Ambulatory Difficulty
| Age Bracket | Male | Female |
| 5 to 17 Years | 0 (0.0%) | 0 (0.0%) |
| 18 to 34 Years | 0 (0.0%) | 0 (0.0%) |
| 35 to 64 Years | 0 (0.0%) | 77 (10.5%) |
| 65 to 74 Years | 0 (0.0%) | 25 (18.9%) |
| 75 Years and over | 65 (36.3%) | 0 (0.0%) |
Disability Class: Self-Care Difficulty
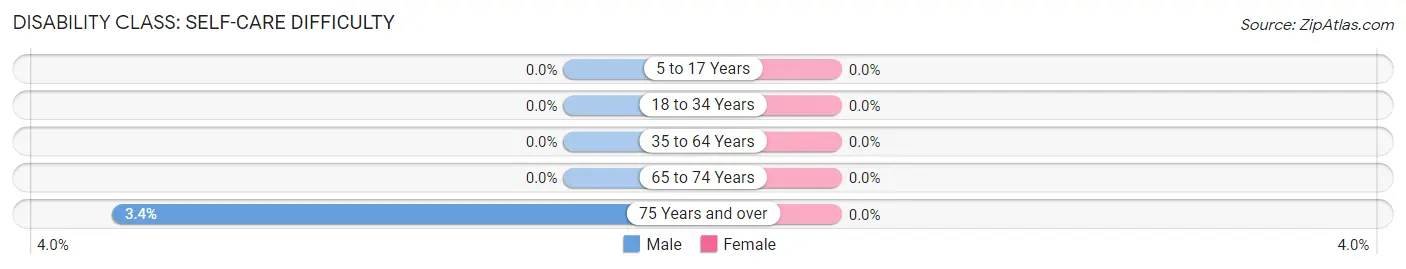
| Age Bracket | Male | Female |
| 5 to 17 Years | 0 (0.0%) | 0 (0.0%) |
| 18 to 34 Years | 0 (0.0%) | 0 (0.0%) |
| 35 to 64 Years | 0 (0.0%) | 0 (0.0%) |
| 65 to 74 Years | 0 (0.0%) | 0 (0.0%) |
| 75 Years and over | 6 (3.4%) | 0 (0.0%) |
Technology Access in Grangeville
Computing Device Access in Grangeville
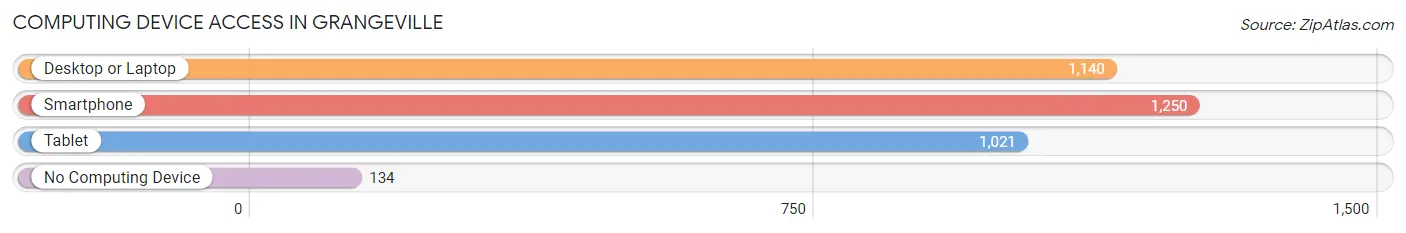
| Device Type | # Households | % Households |
| Desktop or Laptop | 1,140 | 77.8% |
| Smartphone | 1,250 | 85.3% |
| Tablet | 1,021 | 69.7% |
| No Computing Device | 134 | 9.1% |
| Total | 1,465 | 100.0% |
Internet Access in Grangeville
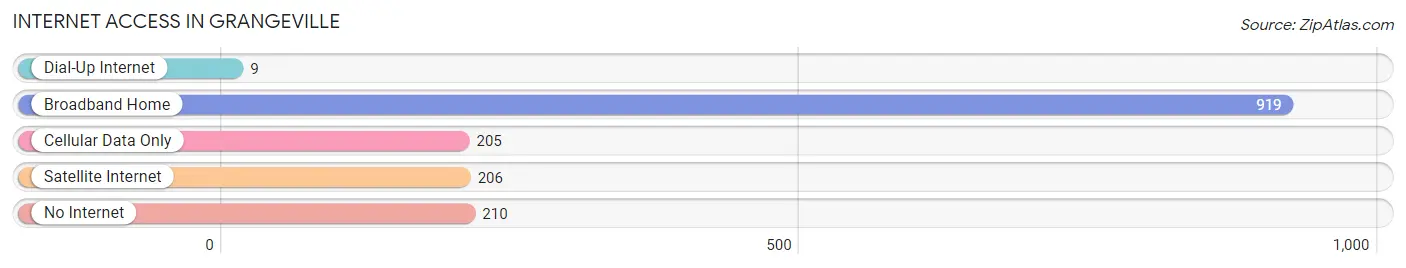
| Internet Type | # Households | % Households |
| Dial-Up Internet | 9 | 0.6% |
| Broadband Home | 919 | 62.7% |
| Cellular Data Only | 205 | 14.0% |
| Satellite Internet | 206 | 14.1% |
| No Internet | 210 | 14.3% |
| Total | 1,465 | 100.0% |
Grangeville Summary
Grangeville is a city located in the northern part of Idaho County, Idaho, United States. It is the county seat of Idaho County and the largest city in the county. The population was 2,189 at the 2010 census.
History
Grangeville was founded in 1881 by settlers from the Oregon Trail. The city was named after the Grangeville post office, which was established in 1879. The post office was named after the Grangeville Grange, a local agricultural organization.
The city was incorporated in 1883 and has since grown to become the largest city in Idaho County. The city was the site of the first Idaho County Fair in 1884.
Geography
Grangeville is located at an elevation of 2,845 feet (867 m) in the Camas Prairie region of northern Idaho. The city is situated on the south bank of the Clearwater River, which flows through the city. The city is surrounded by rolling hills and mountains, including the Bitterroot Mountains to the east and the Salmon River Mountains to the west.
Grangeville is located approximately 75 miles (121 km) north of Boise, the state capital, and approximately 200 miles (322 km) east of Spokane, Washington.
Economy
Grangeville’s economy is largely based on agriculture and timber. The city is home to several large agricultural operations, including a large potato farm and a large dairy farm. The city is also home to several timber mills and sawmills.
The city is also home to several small businesses, including restaurants, retail stores, and service providers.
Demographics
As of the 2010 census, there were 2,189 people, 890 households, and 590 families residing in the city. The population density was 1,092.3 people per square mile (422.2/km2). There were 990 housing units at an average density of 495.3 per square mile (191.3/km2). The racial makeup of the city was 95.2% White, 0.2% African American, 0.7% Native American, 0.3% Asian, 0.1% Pacific Islander, 1.2% from other races, and 2.4% from two or more races. Hispanic or Latino of any race were 3.2% of the population.
There were 890 households, out of which 28.2% had children under the age of 18 living with them, 51.2% were married couples living together, 10.3% had a female householder with no husband present, and 34.3% were non-families. 29.7% of all households were made up of individuals, and 14.2% had someone living alone who was 65 years of age or older. The average household size was 2.41 and the average family size was 2.97.
In the city, the population was spread out, with 25.2% under the age of 18, 7.2% from 18 to 24, 24.2% from 25 to 44, 24.2% from 45 to 64, and 19.2% who were 65 years of age or older. The median age was 40 years. For every 100 females, there were 93.2 males. For every 100 females age 18 and over, there were 88.7 males.
The median income for a household in the city was $30,938, and the median income for a family was $37,917. Males had a median income of $30,000 versus $20,000 for females. The per capita income for the city was $16,845. About 11.2% of families and 14.2% of the population were below the poverty line, including 19.2% of those under age 18 and 8.2% of those age 65 or over.
Common Questions
What is Per Capita Income in Grangeville?
Per Capita income in Grangeville is $27,730.
What is the Median Family Income in Grangeville?
Median Family Income in Grangeville is $56,766.
What is the Median Household income in Grangeville?
Median Household Income in Grangeville is $47,572.
What is Inequality or Gini Index in Grangeville?
Inequality or Gini Index in Grangeville is 0.41.
What is the Total Population of Grangeville?
Total Population of Grangeville is 3,369.
What is the Total Male Population of Grangeville?
Total Male Population of Grangeville is 1,629.
What is the Total Female Population of Grangeville?
Total Female Population of Grangeville is 1,740.
What is the Ratio of Males per 100 Females in Grangeville?
There are 93.62 Males per 100 Females in Grangeville.
What is the Ratio of Females per 100 Males in Grangeville?
There are 106.81 Females per 100 Males in Grangeville.
What is the Median Population Age in Grangeville?
Median Population Age in Grangeville is 46.3 Years.
What is the Average Family Size in Grangeville
Average Family Size in Grangeville is 2.7 People.
What is the Average Household Size in Grangeville
Average Household Size in Grangeville is 2.2 People.
How Large is the Labor Force in Grangeville?
There are 1,762 People in the Labor Forcein in Grangeville.
What is the Percentage of People in the Labor Force in Grangeville?
66.2% of People are in the Labor Force in Grangeville.
What is the Unemployment Rate in Grangeville?
Unemployment Rate in Grangeville is 3.5%.