Zip Codes with the Highest Percentage of Population Employed in Security & Protection in Idaho
RELATED REPORTS & OPTIONS
Security & Protection
Idaho
Compare Zip Codes
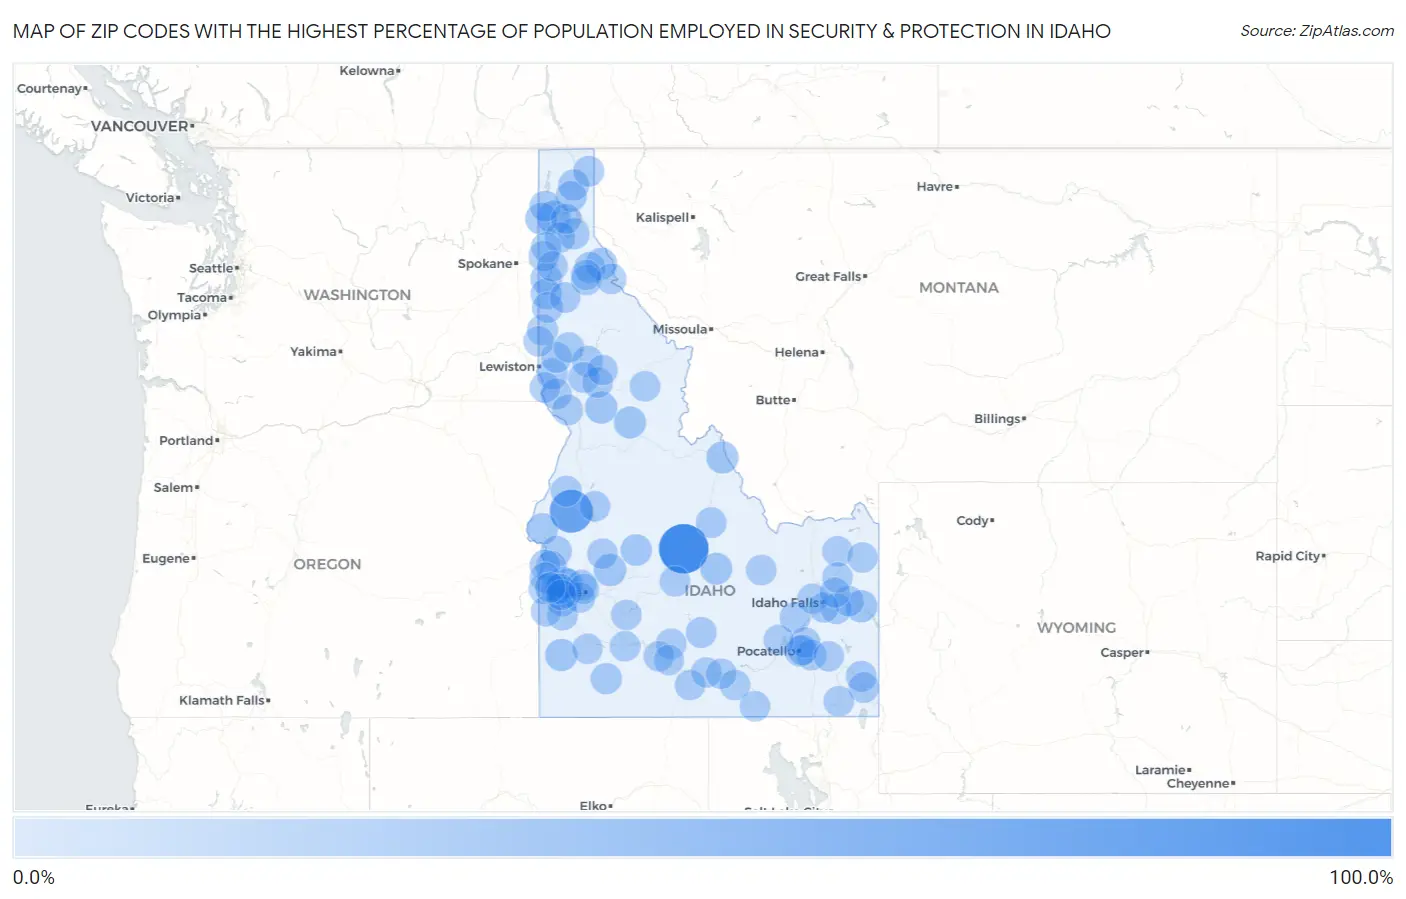
Map of Zip Codes with the Highest Percentage of Population Employed in Security & Protection in Idaho
0.0%
100.0%
Zip Codes with the Highest Percentage of Population Employed in Security & Protection in Idaho
| Zip Code | % Employed | vs State | vs National | |
| 1. | 83227 | 100.0% | 1.7%(+98.3)#1 | 2.1%(+97.9)#8 |
| 2. | 83643 | 65.5% | 1.7%(+63.8)#2 | 2.1%(+63.4)#23 |
| 3. | 83841 | 18.1% | 1.7%(+16.4)#3 | 2.1%(+15.9)#247 |
| 4. | 83631 | 11.5% | 1.7%(+9.83)#4 | 2.1%(+9.40)#594 |
| 5. | 83650 | 10.5% | 1.7%(+8.76)#5 | 2.1%(+8.33)#707 |
| 6. | 83530 | 10.4% | 1.7%(+8.68)#6 | 2.1%(+8.25)#723 |
| 7. | 83449 | 10.4% | 1.7%(+8.66)#7 | 2.1%(+8.23)#725 |
| 8. | 83462 | 10.3% | 1.7%(+8.54)#8 | 2.1%(+8.11)#737 |
| 9. | 83525 | 9.8% | 1.7%(+8.04)#9 | 2.1%(+7.61)#798 |
| 10. | 83822 | 9.0% | 1.7%(+7.32)#10 | 2.1%(+6.89)#907 |
| 11. | 83251 | 9.0% | 1.7%(+7.28)#11 | 2.1%(+6.85)#913 |
| 12. | 83873 | 7.9% | 1.7%(+6.20)#12 | 2.1%(+5.77)#1,194 |
| 13. | 83637 | 6.9% | 1.7%(+5.18)#13 | 2.1%(+4.75)#1,581 |
| 14. | 83876 | 6.6% | 1.7%(+4.87)#14 | 2.1%(+4.43)#1,743 |
| 15. | 83803 | 6.3% | 1.7%(+4.63)#15 | 2.1%(+4.19)#1,868 |
| 16. | 83604 | 5.5% | 1.7%(+3.76)#16 | 2.1%(+3.33)#2,468 |
| 17. | 83672 | 5.4% | 1.7%(+3.70)#17 | 2.1%(+3.27)#2,523 |
| 18. | 83839 | 5.3% | 1.7%(+3.54)#18 | 2.1%(+3.10)#2,674 |
| 19. | 83661 | 5.1% | 1.7%(+3.36)#19 | 2.1%(+2.93)#2,838 |
| 20. | 83851 | 4.8% | 1.7%(+3.10)#20 | 2.1%(+2.67)#3,163 |
| 21. | 83544 | 4.6% | 1.7%(+2.91)#21 | 2.1%(+2.47)#3,403 |
| 22. | 83847 | 4.5% | 1.7%(+2.83)#22 | 2.1%(+2.40)#3,528 |
| 23. | 83644 | 4.5% | 1.7%(+2.76)#23 | 2.1%(+2.33)#3,645 |
| 24. | 83864 | 4.5% | 1.7%(+2.74)#24 | 2.1%(+2.31)#3,674 |
| 25. | 83540 | 4.3% | 1.7%(+2.55)#25 | 2.1%(+2.12)#3,993 |
| 26. | 83872 | 4.2% | 1.7%(+2.53)#26 | 2.1%(+2.10)#4,037 |
| 27. | 83612 | 4.2% | 1.7%(+2.51)#27 | 2.1%(+2.08)#4,074 |
| 28. | 83845 | 4.0% | 1.7%(+2.32)#28 | 2.1%(+1.89)#4,423 |
| 29. | 83349 | 3.7% | 1.7%(+2.01)#29 | 2.1%(+1.58)#5,077 |
| 30. | 83870 | 3.7% | 1.7%(+1.99)#30 | 2.1%(+1.56)#5,140 |
| 31. | 83555 | 3.6% | 1.7%(+1.93)#31 | 2.1%(+1.50)#5,280 |
| 32. | 83522 | 3.6% | 1.7%(+1.85)#32 | 2.1%(+1.41)#5,505 |
| 33. | 83239 | 3.5% | 1.7%(+1.81)#33 | 2.1%(+1.37)#5,617 |
| 34. | 83655 | 3.4% | 1.7%(+1.73)#34 | 2.1%(+1.30)#5,821 |
| 35. | 83254 | 3.4% | 1.7%(+1.72)#35 | 2.1%(+1.29)#5,838 |
| 36. | 83543 | 3.4% | 1.7%(+1.67)#36 | 2.1%(+1.24)#5,968 |
| 37. | 83536 | 3.3% | 1.7%(+1.56)#37 | 2.1%(+1.13)#6,311 |
| 38. | 83641 | 3.3% | 1.7%(+1.55)#38 | 2.1%(+1.12)#6,357 |
| 39. | 83221 | 3.3% | 1.7%(+1.54)#39 | 2.1%(+1.10)#6,392 |
| 40. | 83535 | 3.2% | 1.7%(+1.51)#40 | 2.1%(+1.08)#6,476 |
| 41. | 83856 | 3.2% | 1.7%(+1.48)#41 | 2.1%(+1.05)#6,556 |
| 42. | 83226 | 3.1% | 1.7%(+1.37)#42 | 2.1%(+0.937)#6,935 |
| 43. | 83427 | 2.9% | 1.7%(+1.20)#43 | 2.1%(+0.762)#7,595 |
| 44. | 83801 | 2.9% | 1.7%(+1.19)#44 | 2.1%(+0.756)#7,620 |
| 45. | 83615 | 2.9% | 1.7%(+1.17)#45 | 2.1%(+0.736)#7,708 |
| 46. | 83209 | 2.9% | 1.7%(+1.15)#46 | 2.1%(+0.713)#7,816 |
| 47. | 83686 | 2.8% | 1.7%(+1.09)#47 | 2.1%(+0.661)#8,076 |
| 48. | 83687 | 2.7% | 1.7%(+0.967)#48 | 2.1%(+0.534)#8,616 |
| 49. | 83245 | 2.6% | 1.7%(+0.868)#49 | 2.1%(+0.435)#9,087 |
| 50. | 83619 | 2.6% | 1.7%(+0.861)#50 | 2.1%(+0.428)#9,121 |
| 51. | 83676 | 2.5% | 1.7%(+0.833)#51 | 2.1%(+0.400)#9,261 |
| 52. | 83861 | 2.5% | 1.7%(+0.828)#52 | 2.1%(+0.395)#9,288 |
| 53. | 83202 | 2.5% | 1.7%(+0.807)#53 | 2.1%(+0.374)#9,395 |
| 54. | 83501 | 2.5% | 1.7%(+0.783)#54 | 2.1%(+0.350)#9,516 |
| 55. | 83850 | 2.4% | 1.7%(+0.716)#55 | 2.1%(+0.283)#9,887 |
| 56. | 83244 | 2.4% | 1.7%(+0.712)#56 | 2.1%(+0.279)#9,917 |
| 57. | 83854 | 2.4% | 1.7%(+0.691)#57 | 2.1%(+0.258)#10,023 |
| 58. | 83342 | 2.4% | 1.7%(+0.652)#58 | 2.1%(+0.220)#10,236 |
| 59. | 83201 | 2.4% | 1.7%(+0.649)#59 | 2.1%(+0.216)#10,256 |
| 60. | 83340 | 2.3% | 1.7%(+0.605)#60 | 2.1%(+0.172)#10,517 |
| 61. | 83647 | 2.3% | 1.7%(+0.547)#61 | 2.1%(+0.114)#10,868 |
| 62. | 83330 | 2.3% | 1.7%(+0.546)#62 | 2.1%(+0.113)#10,880 |
| 63. | 83539 | 2.2% | 1.7%(+0.524)#63 | 2.1%(+0.091)#11,013 |
| 64. | 83846 | 2.2% | 1.7%(+0.515)#64 | 2.1%(+0.082)#11,075 |
| 65. | 83669 | 2.1% | 1.7%(+0.424)#65 | 2.1%(-0.009)#11,637 |
| 66. | 83714 | 2.1% | 1.7%(+0.389)#66 | 2.1%(-0.044)#11,873 |
| 67. | 83709 | 2.1% | 1.7%(+0.359)#67 | 2.1%(-0.074)#12,082 |
| 68. | 83844 | 2.0% | 1.7%(+0.317)#68 | 2.1%(-0.116)#12,353 |
| 69. | 83639 | 1.9% | 1.7%(+0.196)#69 | 2.1%(-0.237)#13,141 |
| 70. | 83622 | 1.9% | 1.7%(+0.179)#70 | 2.1%(-0.254)#13,263 |
| 71. | 83537 | 1.9% | 1.7%(+0.145)#71 | 2.1%(-0.288)#13,488 |
| 72. | 83210 | 1.8% | 1.7%(+0.121)#72 | 2.1%(-0.312)#13,671 |
| 73. | 83311 | 1.8% | 1.7%(+0.090)#73 | 2.1%(-0.343)#13,904 |
| 74. | 83553 | 1.8% | 1.7%(+0.079)#74 | 2.1%(-0.354)#13,985 |
| 75. | 83660 | 1.8% | 1.7%(+0.079)#75 | 2.1%(-0.354)#13,988 |
| 76. | 83217 | 1.8% | 1.7%(+0.074)#76 | 2.1%(-0.359)#14,037 |
| 77. | 83341 | 1.8% | 1.7%(+0.068)#77 | 2.1%(-0.364)#14,075 |
| 78. | 83445 | 1.8% | 1.7%(+0.056)#78 | 2.1%(-0.377)#14,151 |
| 79. | 83607 | 1.8% | 1.7%(+0.046)#79 | 2.1%(-0.387)#14,218 |
| 80. | 83263 | 1.8% | 1.7%(+0.039)#80 | 2.1%(-0.394)#14,265 |
| 81. | 83860 | 1.8% | 1.7%(+0.036)#81 | 2.1%(-0.396)#14,294 |
| 82. | 83335 | 1.7% | 1.7%(+0.027)#82 | 2.1%(-0.406)#14,371 |
| 83. | 83605 | 1.7% | 1.7%(+0.013)#83 | 2.1%(-0.420)#14,465 |
| 84. | 83858 | 1.7% | 1.7%(-0.002)#84 | 2.1%(-0.435)#14,578 |
| 85. | 83332 | 1.7% | 1.7%(-0.009)#85 | 2.1%(-0.442)#14,624 |
| 86. | 83336 | 1.7% | 1.7%(-0.027)#86 | 2.1%(-0.460)#14,770 |
| 87. | 83703 | 1.7% | 1.7%(-0.034)#87 | 2.1%(-0.466)#14,812 |
| 88. | 83402 | 1.7% | 1.7%(-0.049)#88 | 2.1%(-0.482)#14,933 |
| 89. | 83443 | 1.6% | 1.7%(-0.076)#89 | 2.1%(-0.509)#15,119 |
| 90. | 83814 | 1.6% | 1.7%(-0.081)#90 | 2.1%(-0.514)#15,155 |
| 91. | 83420 | 1.6% | 1.7%(-0.085)#91 | 2.1%(-0.518)#15,175 |
| 92. | 83627 | 1.6% | 1.7%(-0.085)#92 | 2.1%(-0.518)#15,178 |
| 93. | 83355 | 1.6% | 1.7%(-0.103)#93 | 2.1%(-0.536)#15,313 |
| 94. | 83651 | 1.6% | 1.7%(-0.105)#94 | 2.1%(-0.538)#15,335 |
| 95. | 83440 | 1.6% | 1.7%(-0.147)#95 | 2.1%(-0.580)#15,661 |
| 96. | 83868 | 1.6% | 1.7%(-0.162)#96 | 2.1%(-0.595)#15,780 |
| 97. | 83624 | 1.5% | 1.7%(-0.175)#97 | 2.1%(-0.608)#15,875 |
| 98. | 83404 | 1.5% | 1.7%(-0.190)#98 | 2.1%(-0.623)#15,980 |
| 99. | 83442 | 1.5% | 1.7%(-0.215)#99 | 2.1%(-0.648)#16,197 |
| 100. | 83626 | 1.5% | 1.7%(-0.233)#100 | 2.1%(-0.666)#16,337 |
Common Questions
What are the Top 10 Zip Codes with the Highest Percentage of Population Employed in Security & Protection in Idaho?
Top 10 Zip Codes with the Highest Percentage of Population Employed in Security & Protection in Idaho are:
What zip code has the Highest Percentage of Population Employed in Security & Protection in Idaho?
83227 has the Highest Percentage of Population Employed in Security & Protection in Idaho with 100.0%.
What is the Percentage of Population Employed in Security & Protection in the State of Idaho?
Percentage of Population Employed in Security & Protection in Idaho is 1.7%.
What is the Percentage of Population Employed in Security & Protection in the United States?
Percentage of Population Employed in Security & Protection in the United States is 2.1%.